2014 Long Term Care - Risk - Retirement - Health | Aon term care provider, a jury awarded $91 .5...
54
Risk. Reinsurance. Human Resources. 2014 Long Term Care General Liability and Professional Liability Actuarial Analysis, November 2014 Aon Risk Solutions
Transcript of 2014 Long Term Care - Risk - Retirement - Health | Aon term care provider, a jury awarded $91 .5...

Risk. Reinsurance. Human Resources.
2014 Long Term CareGeneral Liability and Professional Liability Actuarial Analysis, November 2014
Aon Risk Solutions

Introduction . . . . . . . . . . . . . . . . . . . . . . . . . . . . 1
Purpose . . . . . . . . . . . . . . . . . . . . . . . . . . . . . . . . . . . . 1
Scope . . . . . . . . . . . . . . . . . . . . . . . . . . . . . . . . . . . . . . 1
Executive Summary . . . . . . . . . . . . . . . . . . . . . . . 2
Key Findings . . . . . . . . . . . . . . . . . . . . . . . . . . . . . . . . 2
Liability and the Long Term Care Profession . . . . . . . 2
Advisory Estimates . . . . . . . . . . . . . . . . . . . . . . . 3
State Findings . . . . . . . . . . . . . . . . . . . . . . . . . . . . . . . 4
Indemnity and Expense Statistics . . . . . . . . . . . . 5
Claim Lag Statistics . . . . . . . . . . . . . . . . . . . . . . . 7
Reporting Lag . . . . . . . . . . . . . . . . . . . . . . . . . . . . . . . 7
Closing Lag . . . . . . . . . . . . . . . . . . . . . . . . . . . . . . . . . 7
Countrywide Estimates . . . . . . . . . . . . . . . . . . . 8
California . . . . . . . . . . . . . . . . . . . . . . . . . . . . . . 10
Florida . . . . . . . . . . . . . . . . . . . . . . . . . . . . . . . . 12
Georgia . . . . . . . . . . . . . . . . . . . . . . . . . . . . . . . 14
Illinois . . . . . . . . . . . . . . . . . . . . . . . . . . . . . . . . 16
Indiana . . . . . . . . . . . . . . . . . . . . . . . . . . . . . . . 18
Kentucky . . . . . . . . . . . . . . . . . . . . . . . . . . . . . . 20
Maryland . . . . . . . . . . . . . . . . . . . . . . . . . . . . . . 22
Table of Contents
Massachusetts . . . . . . . . . . . . . . . . . . . . . . . . . . 24
Michigan . . . . . . . . . . . . . . . . . . . . . . . . . . . . . . 26
Minnesota . . . . . . . . . . . . . . . . . . . . . . . . . . . . . 28
North Carolina . . . . . . . . . . . . . . . . . . . . . . . . . 30
Ohio . . . . . . . . . . . . . . . . . . . . . . . . . . . . . . . . . 32
Pennsylvania . . . . . . . . . . . . . . . . . . . . . . . . . . . 34
Tennessee . . . . . . . . . . . . . . . . . . . . . . . . . . . . . 36
Texas . . . . . . . . . . . . . . . . . . . . . . . . . . . . . . . . . 38
West Virginia . . . . . . . . . . . . . . . . . . . . . . . . . . . 40
Wisconsin . . . . . . . . . . . . . . . . . . . . . . . . . . . . . 42
All Other States . . . . . . . . . . . . . . . . . . . . . . . . . 44
Database . . . . . . . . . . . . . . . . . . . . . . . . . . . . . 46
Actuarial Analysis . . . . . . . . . . . . . . . . . . . . . . . 47
Conditions and Limitations . . . . . . . . . . . . . . . 47
Definitions . . . . . . . . . . . . . . . . . . . . . . . . . . . . 48
About Aon . . . . . . . . . . . . . . . . . . . . . . . . . . . . 52

Aon Risk Solutions 2014 Long Term Care General Liability and Professional Liability Actuarial Analysis 1
Purpose
The Actuarial and Analytics Practice of Aon Global Risk Consulting (Aon)
conducted an actuarial analysis of general liability and professional liability (GL/
PL) claim costs for the long term care profession in the United States .
Scope
The specific objectives of this study are to:
• Identify the overall trends in the cost of GL/PL claims for long term care
• Identify state specific trends in the cost of GL/PL claims for long term care
• Identify trends in frequency and severity overall and on a state by state basis
• Present closed claim statistics related to report lag, closing lag and
expense versus indemnity
An overview of the findings can be found in the Executive Summary section of this report .
Please contact us if you have any questions regarding this report .
Respectfully submitted,
Christian Coleianne, FCAS, MAAA Associate Director and Actuary +1 .410 .309 .0741 christian .coleianne@aon .com
Konstantin Sakherzon Senior Actuarial Analyst +1 .215 .255 .1806 konstantin .sakherzon@aon .com
Donald Riggins, FCAS, MAAA, CPCU Associate Director and Actuary+1 .410 .309 .4539 donald .riggins@aon .com
Molly Rozran Actuarial Analyst+1 .410 .381 .2439 molly .rozran@aon .com
Introduction

Aon Risk Solutions 2014 Long Term Care General Liability and Professional Liability Actuarial Analysis 2
Executive Summary
Key Findings Based on the actuarial analysis of GL/PL claims data
from long term care providers on a national level:
• Long term care loss rates are increasing by
5 .0% annually .
• The overall forecasted 2015 accident year long term
care GL/PL loss rate limited to $1 million per occurrence
is $2,030 per bed .
• Long term care frequency is increasing by
3 .0% annually .
• The forecasted 2015 accident year long term care GL/PL
frequency is 0 .93 claims per 100 occupied beds .
• Long term care claim severity is increasing by 2 .0%
annually on an overall basis .
• The forecasted 2015 accident year long term care
GL/PL severity is $218,000 per claim limited to $1
million per occurrence .
Liability and the Long Term Care Profession The cost of liability continues to increase for
the Long Term Care profession . At the national
level, the overall loss rate is expected to grow by
5% annually, with claim frequency driving the
increase at an expected 3% growth rate .
For the states profiled in this report, the projected
2015 loss rates vary tremendously, with Kentucky
at $9,220 per occupied bed and Texas at $320 per
occupied bed . For a provider with 100 occupied
beds, this implies an annual liability cost of
$922,000 in Kentucky and $32,000 in Texas .
Kentucky’s high cost of liability at $9,220 may be
related to its lack of restrictions on tort actions . The
state constitution prohibits limits on non-economic
damages and there are no statutes concerning
qualification of expert witnesses, certificates of
merit, pre-trial alternative dispute resolution or
limits on attorney’s fees . Kentucky has the highest
average claim severity among the profiled states .
West Virginia has the second highest loss rate in
this report at $6,950 per occupied bed . While West
Virginia has a limit on non-economic damages of
$250,000 per claimant (West Virginia Code §55-7B),
it has not been clear whether this limit applied to
long term care providers . In a 2011 trial involving a
long term care provider, a jury awarded $91 .5 million
of which $80 million were non-economic damages .
The state legislature extended the protections of
the cap to long term care providers in 2013, and
this appears to be reducing claims frequency .
In contrast, with a loss rate of just $320 per occupied
bed, Texas amended its state constitution to protect
the tort reforms enacted in 2003 . Texas has a $250,000
limit on non-economic damages per claimant (Civil
Practice & Remedies §74 .301) and rules concerning
expert witnesses (Civil Practice & Remedies §74 .401-
403) . Attorney’s fees are not limited and there
are requirements to provide special wording in
arbitration agreements (Civil Practice & Remedies
§74 .451) in order for the agreements to be valid .

Aon Risk Solutions 2014 Long Term Care General Liability and Professional Liability Actuarial Analysis 3
Advisory Estimates
Claim FrequencyOverall claim frequency is the number of claims per 100 occupied beds . Indemnity
claim frequency is the number of claims that resolve with a payment to the claimant
per 100 occupied beds .
Claim SeverityClaim severity is the average size of claims, with claims limited to $1 million
per occurrence .
Loss RateThe loss rate is the annual amount per occupied bed required to defend, settle or
litigate claims in a given year .
The projected 2015 loss rate is $2,030 and is projected to grow by 5 .0% annually .
Projected 2015 Estimate Annual Trend
Overall Claim Frequency* 0 .93 3 .0%
Indemnity Claim Frequency* 0 .73 3 .0%
Severity $218,000 2 .0%
Loss Rate** $2,030 5 .0%
LTC Estimates and Annual Trends for Losses Limited to $1 Million per Occurrence
* Number of claims per 100 occupied beds
** Liability cost per occupied bed

Aon Risk Solutions 2014 Long Term Care General Liability and Professional Liability Actuarial Analysis 4
$0
$1,000
$2,000
$3,000
$4,000
$5,000
$6,000
$7,000
$8,000
$9,000
$10,000
All OtherWVWITXTNPAOHNCMNMIMDMAKYINILGAFLCA
Country-wide
$9,220$960$2,720$2,390$5,730$3,070$2,030 $430
4.2%2.7%4.6%5.0%4.0%2.5%4.4%100.0%
Loss Rate
% of Database
$2,030
$3,070
$5,730
$2,390$2,720
$960
$9,220
$430
$1,310$940
$440$1,110 $1,040
$1,910
$3,240
$320$1,000
$6,950
$1,610
$1,310 $940 $440 $1,110 $1,040 $1,910 $3,240 $320 $1,000 $6,950 $1,610
2.7%2.8%3.1% 11.3%5.4%5.9% 2.6%5.3%3.6% 27.8%2.4%
State FindingsThe following chart shows projected 2015 loss rate levels for the states that are profiled in this study .
The 2015 projected loss rates are determined by applying trend to our 2013 estimates by state . The
states were profiled based on the volume of data received, the stability of the results compared to
prior years, and the number of providers represented in the data .
Comparison of Projected 2015 Loss Rates Limited to $1 Million per Occurrence
Loss Rates are relative to 2015 occupied beds .
The % of Database is measured by occupied beds .

Aon Risk Solutions 2014 Long Term Care General Liability and Professional Liability Actuarial Analysis 5
0
200
400
600
800
1,000
1,200
1,400
1,600
1,800
2,000
341319
425
327
425 517
980 849 1,199 974 1,337 1,232
201320122011201020092008
Closed Year
Cla
im C
ount
Indemnity and Expense Statistics
Indemnity and Expense Only Claim Counts
Indemnity Claims Expense Only Claims
Closed claims are presented to show the relationship between indemnity and expense . The claims
were limited to those aged seven years or less from the occurrence date . This represents 97% of the
claims in each closing year .
The following chart shows the distribution of claims closed with expense only versus claims closed
with indemnity . The percent of claims closed with indemnity is about 74% over the experience
period and stable .

Aon Risk Solutions 2014 Long Term Care General Liability and Professional Liability Actuarial Analysis 6
$0
$5,000
$10,000
$15,000
$20,000
$25,000
$30,000
$35,000
Closed Year
201320122011201020092008
$33,000 $15,200 $15,800 $21,300 $17,400 $14,100
$0
$50,000
$100,000
$150,000
$200,000
$250,000
$300,000
$58,900
$61,400 $64,700 $53,800
$57,400
$56,100
$159,000 $177,000
201320122011201020092008
Closed Year
Ave
rage
Cla
im S
ize
on C
laim
s C
lose
d w
ith
Inde
mni
ty
$181,000 $183,000 $216,000 $186,000
The following chart shows the average paid indemnity and expense for claims closed with
an indemnity payment . Indemnity costs are about 73% of total costs on claims closed with
indemnity . The average indemnity is growing over time, while the average expense is
relatively flat .
Claims Closed with Indemnity: Average Size—Unlimited
The following chart shows the average paid expense for claims closed without an
indemnity payment . The average expense on claims closed without indemnity is
generally at or below $20,000 .
Claims Closed without Indemnity: Average Expense—Unlimited
Average Paid Indemnity Average Paid Expense

Aon Risk Solutions 2014 Long Term Care General Liability and Professional Liability Actuarial Analysis 7
0%
20%
40%
60%
80%
100%
Number of Months from Report to Close
60-7248-6036-4824-3612-240-12
41.2% 69.4% 85.4% 93.2% 97.0% 98.6%
Claim Lag Statistics
Reporting Lag
The reporting lag is time between the occurrence date of an event and the time it is reported to the provider . 72% of incidents are reported within 12 months of the occurrence, and 92% are reported within 24 months .
Report Lag: Cumulative Percent of Claims Reported
Closing Lag
The closing lag is the number of months between the report date of the incident and the final settlement . 41% of claims close within 12 months of being reported and 69% of claims close within the first 24 months after being reported .
Close Lag: Cumulative Percent of Claims Closed
0%
20%
40%
60%
80%
100%
Number of Months from Incident to Report
60-7248-6036-4824-3612-240-12
71.8% 92.4% 98.2% 99.5% 99.8% 99.9%

Aon Risk Solutions 2014 Long Term Care General Liability and Professional Liability Actuarial Analysis 8
0.0
0.1
0.2
0.3
0.4
0.5
0.6
0.7
0.8
0.9
1.0
201420132012201120102009200820072006
0.53 0.52 0.57 0.68 0.70
Accident Year
0.54 0.65 0.69 0.71
0.18 0.180.17
0.19 0.20
0.16
0.190.19 0.20
0.71 0.700.74
0.87 0.90
0.70
0.840.88 0.91
Countrywide EstimatesThe participants in the study represent approximately 230,000 occupied beds countrywide. This is approximately 17% of the countrywide total beds.
Loss RateThe following chart shows the
loss rate per occupied bed .
Loss rates are increasing
since 2009 .
The current annual loss rate
trend is projected at 5 .0% .
Loss Rate per Occupied Bed Limited to $1M per Occurrence
Claim FrequencyThe following graph shows the
frequency per 100 occupied
beds . The stacked bar chart
provides frequency estimates
for claims with indemnity
(indemnity claims) and
claims without indemnity
(expense only claims) .
Claim frequency has increased
from 0 .71 per 100 occupied beds
to 0 .90 per 100 occupied beds .
Between 2009 and 2010,
frequency increased
significantly and has remained
at this higher level .
Claim Frequency per 100 Occupied Beds
$0
$500
$1,000
$1,500
$2,000
$2,500
Accident Year
201420132012201120102009200820072006
$1,200 $1,190 $1,210$1,370
$1,670
$1,940$1,780
$1,860 $1,850
Indemnity Claims Expense Only Claims

Aon Risk Solutions 2014 Long Term Care General Liability and Professional Liability Actuarial Analysis 9
0.0%
0.5%
1.%0
1.5%
2.0%
2.5%
3.0%
3.5%
2.26%2.12% 2.05%
2.26%
2.68%2.81%
2.89% 2.82%
20132012201120102009200820072006
$170.59$166.08$161.11$153.59$145.51 $173.56
$5.07$5.09$4.87$4.57$3.75$3.31$3.26$3.29
Average Medicaid per Diem Reimbursement
Per Diem Loss Rate per Bed
$175.84 $179.75
$0
$50,000
$100,000
$150,000
$200,000
$250,000
$170,000 $169,000 $172,000$184,000
$199,000 $206,000 $207,000 $210,000
Accident Year
201420132012201120102009200820072006
$214,000
Liability Costs and Medicaid Reimbursement TrendsMedicaid is a significant
source of revenue for long
term care providers .
The following graph shows
the per diem loss rate per
bed as a percentage of the
Overall Medicaid per diem
reimbursement rate . The Overall
Medicaid reimbursement
rate shown here is a state rate
weighted by the exposure
distribution underlying
the per diem loss rate .
Concurrent with the recent
loss rate growth, liability costs
as a percent of the Medicaid
Reimbursement rate has
increased in recent years .
Loss Rate per OBE Limited to $2M per Occurrence
SeverityThe following graph shows
the average size per claim,
also called claim severity .
Claim severity has grown
over the experience period
from $170,000 in 2006 to a
projected $214,000 in 2014 .
Claim Severity Limited to $1M per Occurrence

Aon Risk Solutions 2014 Long Term Care General Liability and Professional Liability Actuarial Analysis 10
CaliforniaThe participants in this study represent approximately 10,000 occupied beds in the state. This is approximately 10% of the state total beds.
Loss Rate
Loss rates have increased to a level above $2,220 since 2010 .
Frequency
Claims frequency has grown slightly over the experience period .
Loss Rate per Occupied Bed Limited to $1M per Occurrence
Claim Frequency per 100 Occupied Beds
Indemnity Claims Expense Only Claims
$0
$500
$1,000
$1,500
$2,000
$2,500
$3,000
$3,500
201420132012201120102009200820072006
$1,630$1,810
$1,660
$1,900
$2,480
$2,220
$3,170
$2,790$2,930
Accident Year
0.00
0.20
0.40
0.60
0.80
1.00
1.20
1.40
201420132012201120102009200820072006
Accident Year
0.74
0.26 0.37 0.24
0.19
0.18 0.22 0.22 0.23
1.091.00
1.071.01
0.88
1.04 1.03
1.26
1.060.27
0.70 0.77 0.69 0.86 0.81 0.99 0.84 0.86

Aon Risk Solutions 2014 Long Term Care General Liability and Professional Liability Actuarial Analysis 11
Severity
Claim severity has been above $215,000 since 2009 .
Liability Costs and Medicaid Reimbursement Trends
The loss rate as a percentage of the Medicaid Reimbursement Rate has increased to 4 .28% .
Severity per Claim Limited to $1M per Occurrence
Loss Rate as a Percentage of Medicaid Reimbursement Limited to $1M per Occurrence
$0
$50,000
$100,000
$150,000
$200,000
$250,000
$300,000
201420132012201120102009200820072006
$164,000 $168,000 $164,000
$216,000
$239,000
$215,000
$251,000$264,000 $269,000
Accident Year
0.00%
1.00%
2.00%
3.00%
4.00%
5.00%
6.00%
20132012201120102009200820072006Accident Year
$178.11$175.24$168.05$163.40$156.56$150.69 $142.14 $178.61
$7.64$8.68$6.08$6.79$5.20$4.54$4.96$4.46
Avg Medicaid perDiem Reimbursement
Per Diem Loss Rateper Bed
3.14%3.29%
2.90%3.18%
4.04%
3.47%
4.87%
4.28%

Aon Risk Solutions 2014 Long Term Care General Liability and Professional Liability Actuarial Analysis 12
FloridaThe participants in this study represent approximately 5,900 occupied beds in the state. This is approximately 8% of the state total beds.
Loss Rate
Florida loss rates are increasing since 2007, with a projected 2014 loss rate at $5,450 per occupied bed .
Florida’s loss rate is the third highest among the profiled states and is noteworthy because of the elevated frequency of claims .
Frequency
Florida’s frequency is the highest of the profiled states at 2 .36 claims per 100 occupied beds .
Frequency has been increasing moderately over the experience period .
Loss Rate per Occupied Bed Limited to $1M per Occurrence
Claim Frequency per 100 Occupied Beds
Indemnity Claims Expense Only Claims
$0
$1,000
$2,000
$3,000
$4,000
$5,000
$6,000
201420132012201120102009200820072006
$3,400
$2,840
$3,570
$4,210$4,570
$4,940$5,230 $5,180
$5,450
Accident Year
0.00
0.50
1.00
1.50
2.00
2.50
201420132012201120102009200820072006
Accident Year
1.39
0.29
0.19
0.23
0.280.16
0.29 0.300.31
2.36
1.68
1.39
1.85
2.09
1.90
2.22 2.24 2.29
0.29
1.20 1.62 1.81 1.74 1.93 1.95 1.99 2.05

Aon Risk Solutions 2014 Long Term Care General Liability and Professional Liability Actuarial Analysis 13
Severity
Florida’s claim severity has been over $220,000 since 2010 .
Liability Costs and Medicaid Reimbursement Trends
The liability costs as a percent of the Medicaid Reimbursement Rate is 6 .69%, and is the third highest among the profiled states .
Severity per Claim Limited to $1M per Occurrence
Loss Rate as a Percentage of Medicaid Reimbursement Limited to $1M per Occurrence
$0
$50,000
$100,000
$150,000
$200,000
$250,000
$300,000
201420132012201120102009200820072006
$202,000 $204,000$193,000
$202,000
$241,000
$222,000$233,000 $226,000 $231,000
Accident Year
0.00%
1.00%
2.00%
3.00%
4.00%
5.00%
6.00%
7.00%
8.00%
20132012201120102009200820072006Accident Year
$205.61$205.61$206.47$202.66$180.05$175.00 $160.43 $211.98
$14.18$14.32$13.52$12.51$11.53$9.77$7.78$9.31
Avg Medicaid perDiem Reimbursement
Per Diem Loss Rateper Bed
5.80%
4.45%
5.43%5.69%
6.06%6.58%
6.96%6.69%

Aon Risk Solutions 2014 Long Term Care General Liability and Professional Liability Actuarial Analysis 14
GeorgiaThe participants in this study represent approximately 9,100 occupied beds in the state. This is approximately 27% of the state total beds.
Loss Rate
Georgia’s loss rate has been increasing over time .
The sharp increase in 2010 may be related to the removal of the $350,000 cap on non-economic damages .
Frequency
Claim frequency in Georgia spiked in 2010 coincident with the Georgia Supreme Court’s ruling striking down the $350,000 cap on non-economic damages . While frequency has decreased since, it is still much higher than pre-ruling levels .
Loss Rate per Occupied Bed Limited to $1M per Occurrence
Claim Frequency per 100 Occupied Beds
Indemnity Claims Expense Only Claims
$0
$500
$1,000
$1,500
$2,000
$2,500
$3,000
201420132012201120102009200820072006
$2,110
$790$980 $950
$2,730
$2,050
$2,250$2,160
$2,260
Accident Year
0.00
0.20
0.40
0.60
0.80
1.00
1.20
1.40
1.60
201420132012201120102009200820072006
Accident Year
1.00
0.34
0.080.11
0.24
0.31
0.22 0.23 0.23
1.01
1.34
0.50
0.61
0.75
1.23
0.94
1.070.98
0.25
0.42 0.50 0.51 0.92 0.72 0.82 0.75 0.78

Aon Risk Solutions 2014 Long Term Care General Liability and Professional Liability Actuarial Analysis 15
Severity
Claim severity in Georgia also increased in 2010, around the time of the Georgia Supreme Court ruling, and has remained elevated .
Liability Costs and Medicaid Reimbursement Trends
Georgia’s loss rates relative to the Medicaid Per Diem Reimbursement rate is substantially higher than levels pre-2010 .
Severity per Claim Limited to $1M per Occurrence
Loss Rate as a Percentage of Medicaid Reimbursement Limited to $1M per Occurrence
$0
$50,000
$100,000
$150,000
$200,000
$250,000
201420132012201120102009200820072006
$157,000 $157,000 $161,000
$126,000
$222,000 $218,000$211,000
$221,000 $225,000
Accident Year
0.00%
1.00%
2.00%
3.00%
4.00%
5.00%
6.00%
20132012201120102009200820072006Accident Year
$146.38$141.59$141.78$135.22$133.48$127.43 $126.61 $156.10
$5.91$6.16$5.61$7.47$2.60$2.68$2.16$5.78
Avg Medicaid perDiem Reimbursement
Per Diem Loss Rateper Bed
4.57%
1.70%2.01% 1.92%
5.27%
3.96%4.21%
3.79%

Aon Risk Solutions 2014 Long Term Care General Liability and Professional Liability Actuarial Analysis 16
IllinoisThe participants in this study represent approximately 11,200 occupied beds in the state. This is approximately 15% of the state total beds.
Loss Rate
The loss rate in Illinois relatively stable since 2009 .
Frequency
Claim frequency in Illinois is the fourth highest among the states profiled in this report .
Loss Rate per Occupied Bed Limited to $1M per Occurrence
Claim Frequency per 100 Occupied Beds
Indemnity Claims Expense Only Claims
$0
$500
$1,000
$1,500
$2,000
$2,500
$3,000
201420132012201120102009200820072006
$1,550
$2,560
$2,140
$2,440 $2,360
$2,560 $2,490 $2,460$2,590
Accident Year
0.00
0.20
0.40
0.60
0.80
1.00
1.20
1.40
1.60
1.80
201420132012201120102009200820072006
Accident Year
0.80
0.09
0.21
0.18
0.28 0.210.24 0.24 0.25
1.67
0.89
1.29
1.16
1.571.51
1.63 1.63 1.62
0.24
1.08 0.98 1.29 1.30 1.39 1.39 1.38 1.42

Aon Risk Solutions 2014 Long Term Care General Liability and Professional Liability Actuarial Analysis 17
Severity
Severity has been stable since 2009 around $155,000 .
Liability Costs and Medicaid Reimbursement Trends
Illinois’ loss rate relative to the Medicaid Per Diem Reimbursement rate is above 5% .
Severity per Claim Limited to $1M per Occurrence
Loss Rate as a Percentage of Medicaid Reimbursement Limited to $1M per Occurrence
$0
$50,000
$100,000
$150,000
$200,000
$250,000
201420132012201120102009200820072006
$173,000
$198,000$185,000
$155,000 $156,000 $157,000 $153,000 $152,000 $155,000
Accident Year
0.00%
1.00%
2.00%
3.00%
4.00%
5.00%
6.00%
7.00%
8.00%
20132012201120102009200820072006Accident Year
$132.49$130.47$117.88$117.29$112.20$103.89 $96.94 $129.30
$6.74$6.82$7.01$6.46$6.68$5.86$7.01$4.24
Avg Medicaid perDiem Reimbursement
Per Diem Loss Rateper Bed
4.37%
6.75%
5.22%5.70% 5.48% 5.37% 5.15% 5.21%

Aon Risk Solutions 2014 Long Term Care General Liability and Professional Liability Actuarial Analysis 18
IndianaThe participants in this study represent approximately 10,700 occupied beds in the state. This is approximately 28% of the state total beds.
Loss Rate
Indiana’s loss rates have increased beginning in 2010 due to increasing severity .
Frequency
Generally, claim frequency has been stable since 2010 near the current level of 0 .70 claims per 100 occupied beds .
Loss Rate per Occupied Bed Limited to $1M per Occurrence
Claim Frequency per 100 Occupied Beds
Indemnity Claims Expense Only Claims
$0
$100
$200
$300
$400
$500
$600
$700
$800
$900
$1,000
201420132012201120102009200820072006
$420 $410 $410$450
$600
$720
$830$860
$910
Accident Year
0.00
0.10
0.20
0.30
0.40
0.50
0.60
0.70
0.80
201420132012201120102009200820072006
Accident Year
0.45
0.14
0.17
0.19
0.09
0.090.13
0.14 0.15
0.70
0.59
0.45
0.63
0.44
0.660.63
0.69 0.68
0.14
0.28 0.44 0.35 0.57 0.50 0.55 0.54 0.55
Aon Risk Solutions 2014 Long Term Care General Liability and Professional Liability Actuarial Analysis 19
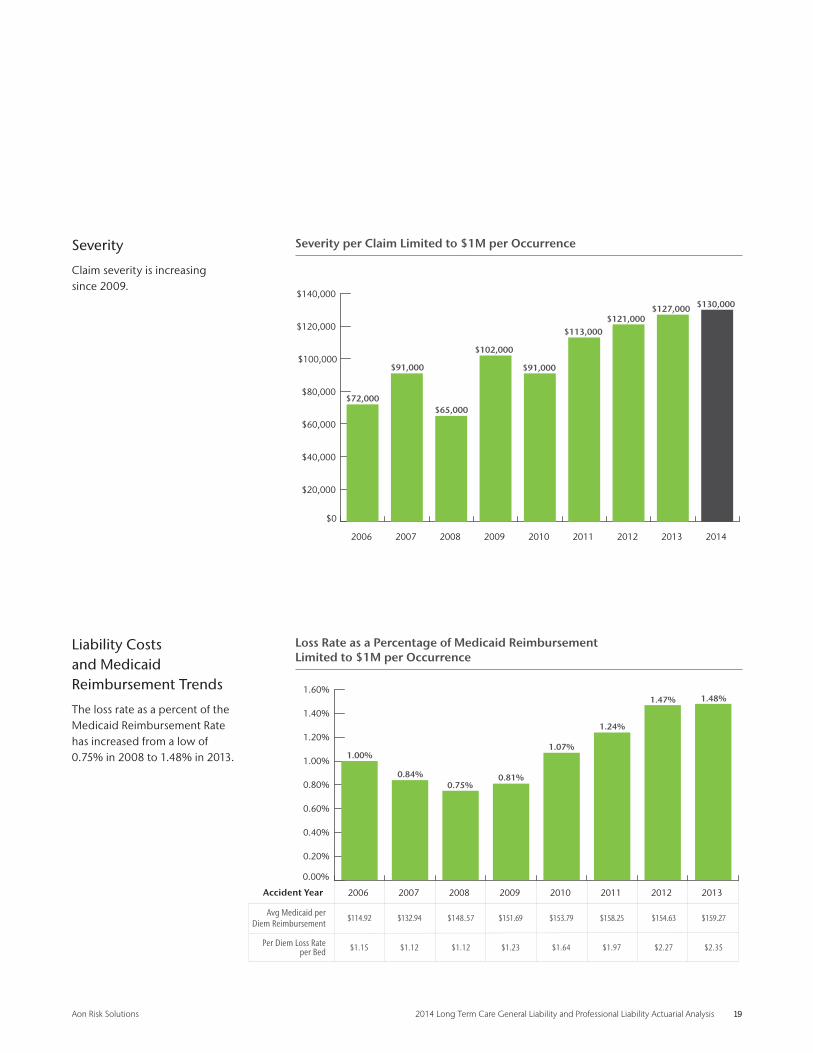
Severity
Claim severity is increasing since 2009 .
Liability Costs and Medicaid Reimbursement Trends
The loss rate as a percent of the Medicaid Reimbursement Rate has increased from a low of 0 .75% in 2008 to 1 .48% in 2013 .
Severity per Claim Limited to $1M per Occurrence
Loss Rate as a Percentage of Medicaid Reimbursement Limited to $1M per Occurrence
$0
$20,000
$40,000
$60,000
$80,000
$100,000
$120,000
$140,000
201420132012201120102009200820072006
$72,000
$91,000
$65,000
$102,000
$91,000
$113,000$121,000
$127,000 $130,000
Accident Year
0.00%
0.20%
0.40%
0.60%
0.80%
1.00%
1.20%
1.40%
1.60%
20132012201120102009200820072006Accident Year
$154.63$158.25$153.79$151.69$148.57$132.94 $114.92 $159.27
$2.35$2.27$1.97$1.64$1.23$1.12$1.12$1.15
Avg Medicaid perDiem Reimbursement
Per Diem Loss Rateper Bed
1.00%
0.84%0.75%
0.81%
1.07%
1.24%
1.47% 1.48%

Aon Risk Solutions 2014 Long Term Care General Liability and Professional Liability Actuarial Analysis 20
KentuckyThe participants in this study represent approximately 7,100 occupied beds in the state. This is approximately 31% of the state total beds.
Loss Rate
Kentucky has the highest loss rate of the profiled states in this study .
The loss rate has increased from $2,100 in 2007 to a projected $8,790 in 2014 .
Frequency
Claim frequency in Kentucky is the second highest among the profiled states .
Frequency has increased from a low 0f 0 .87 claims per occupied bed in 2006 to a projected high of 1 .94 claims per occupied bed in 2014 .
Loss Rate per Occupied Bed Limited to $1M per Occurrence
Claim Frequency per 100 Occupied Beds
Indemnity Claims Expense Only Claims
$0
$1,000
$2,000
$3,000
$4,000
$5,000
$6,000
$7,000
$8,000
$9,000
$10,000
201420132012201120102009200820072006
$2,670$2,100
$4,740$4,450
$6,350
$8,090 $8,020$8,360
$8,790
Accident Year
0.00
0.50
1.00
1.50
2.00
2.50
201420132012201120102009200820072006
Accident Year
0.73
0.14 0.28
0.250.24
0.41 0.39 0.39 0.40
1.94
0.870.99
1.361.24
1.88 1.87 1.91 1.89
0.40
0.71 1.11 1.00 1.47 1.48 1.51 1.50 1.54

Aon Risk Solutions 2014 Long Term Care General Liability and Professional Liability Actuarial Analysis 21
Severity
Claim severity in Kentucky is the highest of the states profiled in this study and has been above $330,000 per claim since 2008 .
Liability Costs and Medicaid Reimbursement Trends
The loss rate as a percentage of the per diem Medicaid Reimbursement rate is 14 .17% in 2013 .
This is the highest level among the profiled states .
Severity per Claim Limited to $1M per Occurrence
Loss Rate as a Percentage of Medicaid Reimbursement Limited to $1M per Occurrence
$0
$50,000
$100,000
$150,000
$200,000
$250,000
$300,000
$350,000
$400,000
$450,000
$500,000
201420132012201120102009200820072006
$308,000
$212,000
$347,000 $358,000$338,000
$432,000$420,000
$443,000 $452,000
Accident Year
0.00%
2.00%
4.00%
6.00%
8.00%
10.00%
12.00%
14.00%
16.00%
20132012201120102009200820072006Accident Year
$156.86$151.41$147.14$142.72$137.49$132.72 $125.56 $161.57
$22.89$21.96$22.15$17.39$12.18$12.98$5.75$7.31
Avg Medicaid perDiem Reimbursement
Per Diem Loss Rateper Bed
5.82%
4.33%
9.44%8.53%
11.82%
14.63%14.00% 14.17%

Aon Risk Solutions 2014 Long Term Care General Liability and Professional Liability Actuarial Analysis 22
MarylandThe participants in this study represent approximately 7,700 occupied beds in the state. This is approximately 32% of the state total beds.
Loss Rate
The loss rates in Maryland have been stable since 2009 .
Frequency
Claim frequency in Maryland is stable around 0 .65 claims per 100 occupied beds .
Loss Rate per Occupied Bed Limited to $1M per Occurrence
Claim Frequency per 100 Occupied Beds
Indemnity Claims Expense Only Claims
$0
$200
$400
$600
$800
$1,000
$1,200
$1,400
$1,600
201420132012201120102009200820072006
$1,360
$980 $940
$1,200$1,150 $1,180
$1,050
$1,190$1,250
Accident Year
0.00
0.10
0.20
0.30
0.40
0.50
0.60
0.70
0.80
0.90
201420132012201120102009200820072006
Accident Year
0.70
0.14
0.19
0.05
0.08 0.080.07 0.07 0.07
0.65
0.84
0.74
0.57
0.65 0.63 0.65
0.57
0.63
0.06
0.55 0.52 0.57 0.55 0.58 0.51 0.56 0.58

Aon Risk Solutions 2014 Long Term Care General Liability and Professional Liability Actuarial Analysis 23
Severity
Claim severity in Maryland has been stable at about $185,000 .
Liability Costs and Medicaid Reimbursement Trends
The loss rate as a percent of the Medicaid Reimbursement Rate is stable since 2007 .
Severity per Claim Limited to $1M per Occurrence
Loss Rate as a Percentage of Medicaid Reimbursement Limited to $1M per Occurrence
$0
$50,000
$100,000
$150,000
$200,000
$250,000
201420132012201120102009200820072006
$163,000
$132,000
$166,000
$185,000 $183,000 $182,000 $185,000 $187,000 $191,000
Accident Year
0.00%
0.50%
1.00%
1.50%
2.00%
2.50%
20132012201120102009200820072006Accident Year
$230.84$231.81$222.47$212.29$213.27$194.10 $186.41 $237.86
$3.26$2.87$3.23$3.15$3.29$2.57$2.68$3.72
Avg Medicaid perDiem Reimbursement
Per Diem Loss Rateper Bed
2.00%
1.38%1.21%
1.55%1.42% 1.39%
1.24%1.37%

Aon Risk Solutions 2014 Long Term Care General Liability and Professional Liability Actuarial Analysis 24
MassachusettsThe participants in this study represent approximately 10,200 occupied beds in the state. This is approximately 25% of the state total beds.
Loss Rate
The loss rate in Massachusetts has been just above $400 per occupied bed since 2009, with a surge to $550 in 2001 driven by claim severity .
Frequency
Claim frequency in Massachusetts has been stable over the experience and is currently at 0 .36 per 100 occupied beds, the lowest frequency among the profiled states .
Loss Rate per Occupied Bed Limited to $1M per Occurrence
Claim Frequency per 100 Occupied Beds
Indemnity Claims Expense Only Claims
$0
$100
$200
$300
$400
$500
$600
201420132012201120102009200820072006
$510$530
$490
$410
$450
$550
$410 $400$420
Accident Year
0.00
0.05
0.10
0.15
0.20
0.25
0.30
0.35
0.40
0.45
0.50
201420132012201120102009200820072006
Accident Year
0.25
0.11
0.15
0.08
0.04
0.08 0.070.06 0.07
0.360.36
0.46
0.37
0.30
0.38 0.38 0.380.35
0.07
0.31 0.29 0.26 0.30 0.31 0.31 0.29 0.29

Aon Risk Solutions 2014 Long Term Care General Liability and Professional Liability Actuarial Analysis 25
Severity
Claim severity in Massachusetts has been under $150,000 for the entire experience period .
The projected severity in 2014 is $115,000, the third lowest among the profiled states .
Liability Costs and Medicaid Reimbursement Trends
The loss rate as a percent of the Medicaid Reimbursement Rate has been declining over the experience period and, at 0 .56%, is the lowest of the profiled states .
Severity per Claim Limited to $1M per Occurrence
Loss Rate as a Percentage of Medicaid Reimbursement Limited to $1M per Occurrence
$0
$20,000
$40,000
$60,000
$80,000
$100,000
$120,000
$140,000
$160,000
201420132012201120102009200820072006
$141,000
$115,000
$133,000$138,000
$119,000
$147,000
$107,000$113,000 $115,000
Accident Year
0.00%
0.10%
0.20%
0.30%
0.40%
0.50%
0.60%
0.70%
0.80%
0.90%
20132012201120102009200820072006Accident Year
$199.35$197.40
$196.84$192.84$191.30$191.30 $177.16 $197.91
$1.10$1.12$1.51$1.23$1.12$1.34$1.45$1.40
Avg Medicaid perDiem Reimbursement
Per Diem Loss Rateper Bed
0.79%0.76%
0.70%
0.58%0.62%
0.76%
0.56% 0.56%

Aon Risk Solutions 2014 Long Term Care General Liability and Professional Liability Actuarial Analysis 26
MichiganThe participants in this study represent approximately 6,500 occupied beds in the state. This is approximately 17% of the state total beds.
Loss Rate
The loss rate in Michigan is growing since 2007 .
Frequency
Claim frequency is at or below 0 .70 claims per 100 occupied beds with the exception of 2006 .
Loss Rate per Occupied Bed Limited to $1M per Occurrence
Claim Frequency per 100 Occupied Beds
Indemnity Claims Expense Only Claims
$0
$200
$400
$600
$800
$1,000
$1,200
$1,400
201420132012201120102009200820072006
$1,290
$600$670
$760
$570
$830$790
$850$890
Accident Year
0.00
0.20
0.40
0.60
0.80
1.00
1.20
201420132012201120102009200820072006
Accident Year
0.87
0.21
0.220.09
0.120.19 0.17
0.16 0.17
0.68
1.08
0.60
0.51
0.68 0.68 0.700.63
0.66
0.16
0.38 0.42 0.56 0.49 0.53 0.47 0.50 0.51

Aon Risk Solutions 2014 Long Term Care General Liability and Professional Liability Actuarial Analysis 27
Severity
Severity has been under $135,000 for the entire experience period .
Liability Costs and Medicaid Reimbursement Trends
The loss rate as a percent of the Medicaid reimbursement rate is at 1 .04% .
Severity per Claim Limited to $1M per Occurrence
Loss Rate as a Percentage of Medicaid Reimbursement Limited to $1M per Occurrence
$0
$20,000
$40,000
$60,000
$80,000
$100,000
$120,000
$140,000
201420132012201120102009200820072006
$119,000
$100,000
$132,000
$111,000
$84,000
$119,000$126,000 $128,000 $131,000
Accident Year
0.00%
0.50%
1.00%
1.50%
2.00%
2.50%
20132012201120102009200820072006Accident Year
$215.39$211.44$207.40$195.18$187.31$180.92 $163.84 $223.76
$2.33$2.16$2.27$1.56$2.08$1.83$1.64$3.53
Avg Medicaid perDiem Reimbursement
Per Diem Loss Rateper Bed
2.15%
0.91%0.98%
1.07%
0.75%
1.07%1.00% 1.04%
Aon Risk Solutions 2014 Long Term Care General Liability and Professional Liability Actuarial Analysis 28
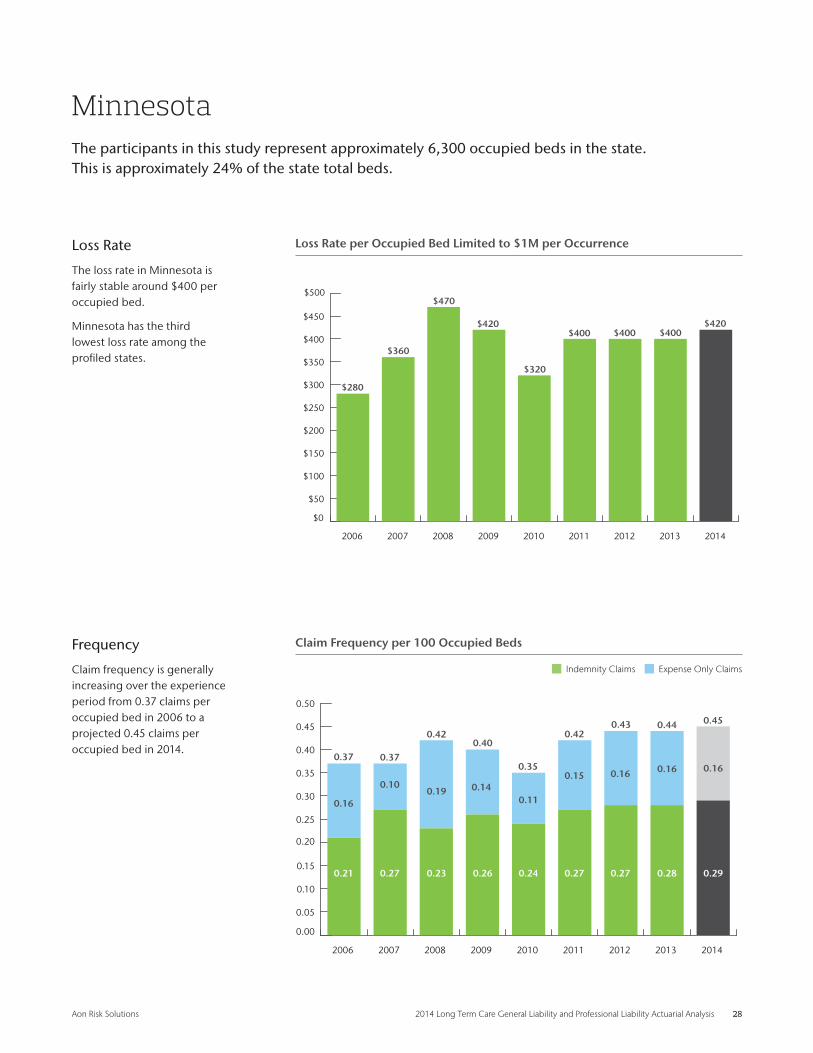
MinnesotaThe participants in this study represent approximately 6,300 occupied beds in the state. This is approximately 24% of the state total beds.
Loss Rate
The loss rate in Minnesota is fairly stable around $400 per occupied bed .
Minnesota has the third lowest loss rate among the profiled states .
Frequency
Claim frequency is generally increasing over the experience period from 0 .37 claims per occupied bed in 2006 to a projected 0 .45 claims per occupied bed in 2014 .
Loss Rate per Occupied Bed Limited to $1M per Occurrence
Claim Frequency per 100 Occupied Beds
Indemnity Claims Expense Only Claims
$0
$50
$100
$150
$200
$250
$300
$350
$400
$450
$500
201420132012201120102009200820072006
$280
$360
$470
$420
$320
$400 $400 $400
$890
Accident Year
$420
0.00
0.05
0.10
0.15
0.20
0.25
0.30
0.35
0.40
0.45
0.50
201420132012201120102009200820072006
Accident Year
0.21
0.16
0.100.19 0.14
0.11
0.150.16
0.17
0.16
0.45
0.37 0.37
0.420.40
0.35
0.420.43 0.44
0.16
0.27 0.23 0.26 0.24 0.27 0.27 0.28 0.29

Aon Risk Solutions 2014 Long Term Care General Liability and Professional Liability Actuarial Analysis 29
Severity
Severity has decreased from a high of $114,000 per occurrence in 2008 to a projected $92,000 per occurrence in 2014 .
This is the second lowest severity among the profiled states .
Liability Costs and Medicaid Reimbursement Trends
The loss rate as a percent of the Medicaid reimbursement rate is 0 .65% .
Severity per Claim Limited to $1M per Occurrence
Loss Rate as a Percentage of Medicaid Reimbursement Limited to $1M per Occurrence
$0
$20,000
$40,000
$60,000
$80,000
$100,000
$120,000
201420132012201120102009200820072006
$75,000
$99,000
$114,000
$106,000
$91,000$96,000
$92,000 $90,000 $92,000
Accident Year
0.00%
0.10%
0.20%
0.30%
0.40%
0.50%
0.60%
0.70%
0.80%
0.90%
20132012201120102009200820072006Accident Year
$168.97$165.82$164.34$164.34$154.24$147.68 $142.02 $169.63
$1.10$1.10$1.10$0.88$1.15$1.29$0.99$0.77
Avg Medicaid perDiem Reimbursement
Per Diem Loss Rateper Bed
0.54%
0.67%
0.84%
0.70%
0.54%
0.66% 0.65% 0.65%

Aon Risk Solutions 2014 Long Term Care General Liability and Professional Liability Actuarial Analysis 30
North CarolinaThe participants in this study represent approximately 13,800 occupied beds in the state. This is approximately 37% of the state total beds.
Loss Rate
The loss rate in North Carolina increased in 2010 and is now over $1,000 per bed . The increase is due to higher claim frequency . A $500,000 non-economic damages cap became effective October 1, 2011 .
Frequency
The frequency increase in 2010 may be related to claimants presenting before the implementation of tort reform effective October 1, 2011 . Claim frequency has not subsided since the legislation became effective .
Loss Rate per Occupied Bed Limited to $1M per Occurrence
Claim Frequency per 100 Occupied Beds
Indemnity Claims Expense Only Claims
$0
$200
$400
$600
$800
$1,000
$1,200
201420132012201120102009200820072006
$470
$1,140
$590$530
$980
$750
$1,010 $1,000
$890
Accident Year
$1,050
0.00
0.10
0.20
0.30
0.40
0.50
0.60
201420132012201120102009200820072006
Accident Year
0.23
0.08
0.07
0.09 0.05
0.07
0.09 0.09
0.17
0.09
0.50
0.31
0.48
0.440.41
0.55
0.49 0.50 0.49
0.09
0.41 0.35 0.36 0.48 0.40 0.41 0.40 0.41

Aon Risk Solutions 2014 Long Term Care General Liability and Professional Liability Actuarial Analysis 31
Severity
Claim severity has increased since 2008 and is now over $200,000
The claim severity spike in 2007 reflects several claims that exceed $1 million .
Liability Costs and Medicaid Reimbursement Trends
The loss rate as a percent of the Medicaid reimbursement rate is at 1 .55% .
Severity per Claim Limited to $1M per Occurrence
Loss Rate as a Percentage of Medicaid Reimbursement Limited to $1M per Occurrence
$0
$50,000
$100,000
$150,000
$200,000
$250,000
201420132012201120102009200820072006
$150,000
$236,000
$134,000 $130,000
$179,000
$155,000
$203,000 $205,000 $209,000
Accident Year
0.00%
0.50%
1.00%
1.50%
2.00%
2.50%
20132012201120102009200820072006Accident Year
$171.12$165.17$160.52$155.69$150.33$136.54 $134.18 $176.25
$2.74$2.77$2.05$2.68$1.45$1.62$3.12$1.29
Avg Medicaid perDiem Reimbursement
Per Diem Loss Rateper Bed
0.96%
2.29%
1.08%0.93%
1.67%
1.24%
1.62%1.55%

Aon Risk Solutions 2014 Long Term Care General Liability and Professional Liability Actuarial Analysis 32
OhioThe participants in this study represent approximately 12,200 occupied beds in the state. This is approximately 16% of the state total beds.
Loss Rate
Loss rates in Ohio have grown after reaching a low point of $370 per occupied bed in 2007 . The growth is related to increases in claim severity .
Frequency
Claim frequency in Ohio has been stable since 2009 between 0 .55 and 0 .60 claims per 100 occupied beds .
Loss Rate per Occupied Bed Limited to $1M per Occurrence
Claim Frequency per 100 Occupied Beds
Indemnity Claims Expense Only Claims
$0
$200
$400
$600
$800
$1,000
$1,200
201420132012201120102009200820072006
$470
$370
$710
$530
$780 $760
$890$940
$990
Accident Year
0.00
0.10
0.20
0.30
0.40
0.50
0.60
0.70
0.80
0.90
201420132012201120102009200820072006
Accident Year
0.37
0.42
0.21
0.20
0.230.19 0.20 0.21
0.22
0.60
0.79
0.55
0.65
0.56 0.57 0.56 0.58 0.58
0.21
0.34 0.45 0.33 0.38 0.36 0.37 0.37 0.38

Aon Risk Solutions 2014 Long Term Care General Liability and Professional Liability Actuarial Analysis 33
Severity
Claim severity has grown strongly over the experience period and is projected to be $164,000 in 2014 .
Liability Costs and Medicaid Reimbursement Trends
The loss rate as a percent of the Medicaid reimbursement rate is around 1 .50% .
Severity per Claim Limited to $1M per Occurrence
Loss Rate as a Percentage of Medicaid Reimbursement Limited to $1M per Occurrence
$0
$20,000
$40,000
$60,000
$80,000
$100,000
$120,000
$140,000
$160,000
$180,000
201420132012201120102009200820072006
$60,000$67,000
$110,000
$95,000
$137,000 $137,000
$153,000$161,000 $164,000
Accident Year
0.00%
0.20%
0.40%
0.60%
0.80%
1.00%
1.20%
1.40%
1.60%
20132012201120102009200820072006Accident Year
$168.43$172.33$177.77$172.16$166.07$163.96 $158.71 $174.64
$2.57$2.44$2.08$2.14$1.45$1.94$1.01$1.29
Avg Medicaid perDiem Reimbursement
Per Diem Loss Rateper Bed
0.81%
0.62%
1.17%
0.84%
1.20% 1.21%
1.45% 1.47%

Aon Risk Solutions 2014 Long Term Care General Liability and Professional Liability Actuarial Analysis 34
PennsylvaniaThe participants in this study represent approximately 26,300 occupied beds in the state. This is approximately 33% of the state total beds.
Loss Rate
The 2014 projected loss rate in Pennsylvania is $1,810 per occupied bed .
Frequency
The frequency of losses has increased from a low of 0 .56 in 2007 to a projected high of 1 .00 in 2014 .
Claim frequency appears to have reached a plateau in 2010 and is stable since .
Loss Rate per Occupied Bed Limited to $1M per Occurrence
Claim Frequency per 100 Occupied Beds
Indemnity Claims Expense Only Claims
$0
$500
$1,000
$1,500
$2,000
$2,500
201420132012201120102009200820072006
$1,080
$810$900
$1,250
$1,660
$2,000
$1,620$1,720
$1,810
Accident Year
0.00
0.20
0.40
0.60
0.80
1.00
1.20
201420132012201120102009200820072006
Accident Year
0.45
0.170.15
0.200.17
0.280.27 0.26 0.27
1.00
0.620.56
0.670.74
0.960.99
0.940.97
0.25
0.41 0.47 0.57 0.68 0.72 0.69 0.71 0.73

Aon Risk Solutions 2014 Long Term Care General Liability and Professional Liability Actuarial Analysis 35
Severity
Since 2009, claim severity has been around $170,000 to $180,000 with the exception of 2011 .
Liability Costs and Medicaid Reimbursement Trends
The liability cost as a percent of Medicaid per diem rate has grown over the experience period and is currently at 2 .25%
Severity per Claim Limited to $1M per Occurrence
Loss Rate as a Percentage of Medicaid Reimbursement Limited to $1M per Occurrence
$0
$50,000
$100,000
$150,000
$200,000
$250,000
201420132012201120102009200820072006
$173,000
$144,000$133,000
$168,000 $173,000
$203,000
$172,000 $177,000 $181,000
Accident Year
0.00%
0.50%
1.00%
1.50%
2.00%
2.50%
3.00%
20132012201120102009200820072006Accident Year
$208.14$204.63$203.54$199.42$197.61$190.83 $179.17 $209.65
$4.71$4.44$5.48$4.54$3.42$2.46$2.22$2.96
Avg Medicaid perDiem Reimbursement
Per Diem Loss Rateper Bed
1.65%
1.16%1.24%
1.71%
2.23%
2.68%
2.13%2.25%

Aon Risk Solutions 2014 Long Term Care General Liability and Professional Liability Actuarial Analysis 36
TennesseeThe participants in this study represent approximately 8,800 occupied beds in the state. This is approximately 30% of the state total beds.
Loss Rate
The loss rate in Tennessee has grown from a low in 2008 of $1,310 per occupied bed to a projected $3,090 per occupied bed in 2014 .
The growth is primarily due to growth in frequency .
Tennessee enacted limits on non-economic damages effective October 1, 2011 .
Frequency
Claim frequency has increased since 2008 .
The continued growth in claim frequency after the implementation of tort limits in 2011 is surprising .
Loss Rate per Occupied Bed Limited to $1M per Occurrence
Claim Frequency per 100 Occupied Beds
Indemnity Claims Expense Only Claims
$0
$500
$1,000
$1,500
$2,000
$2,500
$3,000
$3,500
201420132012201120102009200820072006
$2,160
$1,890
$1,310$1,440
$1,690
$2,730$2,910 $2,950
$3,090
$890
Accident Year
$990
0.00
0.20
0.40
0.60
0.80
1.00
1.20
201420132012201120102009200820072006
Accident Year
0.72
0.180.16
0.16
0.16
0.22
0.23
0.27
0.17
0.28
1.11
0.900.85
0.61
0.72
0.83
0.93
1.041.08
0.26
0.69 0.45 0.56 0.61 0.70 0.78 0.81 0.83

Aon Risk Solutions 2014 Long Term Care General Liability and Professional Liability Actuarial Analysis 37
Severity
Claim severity has increased over the experience period and is the third highest severity of the profiled states .
Claim severity increased sharply in 2011 and is still elevated .
Liability Costs and Medicaid Reimbursement Trends
The loss rate as a percent of the Medicaid per diem reimbursement has increased from a low of 2 .54% in 2008 to 4 .95% in 2013 .
Severity per Claim Limited to $1M per Occurrence
Loss Rate as a Percentage of Medicaid Reimbursement Limited to $1M per Occurrence
$0
$50,000
$100,000
$150,000
$200,000
$250,000
$300,000
$350,000
201420132012201120102009200820072006
$241,000$224,000
$214,000$201,000 $204,000
$292,000$279,000 $273,000 $278,000
Accident Year
0.00%
1.00%
2.00%
3.00%
4.00%
5.00%
6.00%
20132012201120102009200820072006Accident Year
$158.60$153.09$148.77$144.30$141.56$136.12 $131.05 $163.36
$8.08$7.97$7.47$4.63$3.94$3.59$5.17$5.91
Avg Medicaid perDiem Reimbursement
Per Diem Loss Rateper Bed
4.51%
3.80%
2.54%2.73%
3.11%
4.88% 5.03% 4.95%

Aon Risk Solutions 2014 Long Term Care General Liability and Professional Liability Actuarial Analysis 38
TexasThe participants in this study represent approximately 12,300 occupied beds in the state. This is approximately 13% of the state total beds.
Loss Rate
The loss rate in Texas has been stable since 2009 .
Substantial decreases from 2006 through 2008 are the result of decreases in claim frequency .
Frequency
The claim frequency in Texas has decreased to under 0 .45 per 100 occupied beds .
Texas has the second lowest frequency rate among the profiled states .
Loss Rate per Occupied Bed Limited to $1M per Occurrence
Claim Frequency per 100 Occupied Beds
Indemnity Claims Expense Only Claims
$0
$100
$200
$300
$400
$500
$600
201420132012201120102009200820072006
$510
$450
$320$300
$260
$310$290 $290
$310
Accident Year
0.00
0.10
0.20
0.30
0.40
0.50
0.60
0.70
0.80
201420132012201120102009200820072006
Accident Year
0.42
0.26
0.30
0.170.26 0.29
0.18 0.17 0.18
0.44
0.680.66
0.44
0.54 0.54
0.44 0.44 0.43
0.18
0.36 0.27 0.28 0.25 0.26 0.26 0.26 0.26
Aon Risk Solutions 2014 Long Term Care General Liability and Professional Liability Actuarial Analysis 39
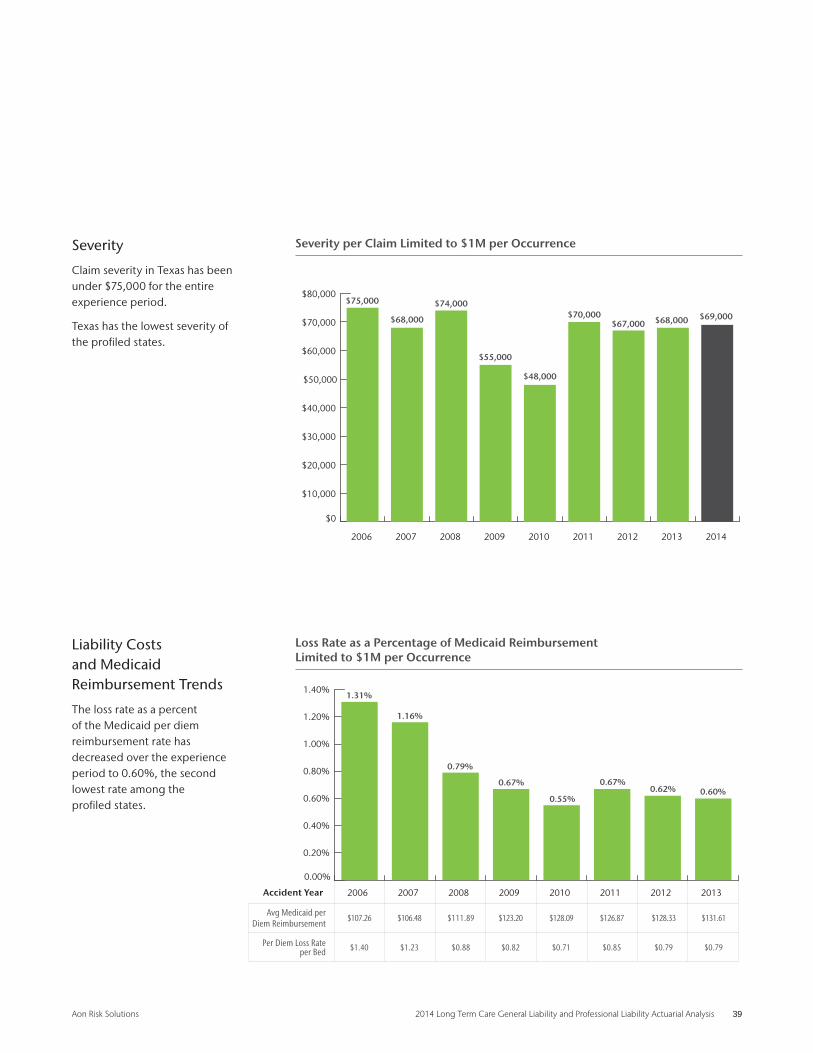
Severity
Claim severity in Texas has been under $75,000 for the entire experience period .
Texas has the lowest severity of the profiled states .
Liability Costs and Medicaid Reimbursement Trends
The loss rate as a percent of the Medicaid per diem reimbursement rate has decreased over the experience period to 0 .60%, the second lowest rate among the profiled states .
Severity per Claim Limited to $1M per Occurrence
Loss Rate as a Percentage of Medicaid Reimbursement Limited to $1M per Occurrence
$0
$10,000
$20,000
$30,000
$40,000
$50,000
$60,000
$70,000
$80,000
201420132012201120102009200820072006
$75,000
$68,000
$74,000
$55,000
$48,000
$70,000$67,000 $68,000 $69,000
Accident Year
0.00%
0.20%
0.40%
0.60%
0.80%
1.00%
1.20%
1.40%
20132012201120102009200820072006Accident Year
$128.33$126.87$128.09$123.20$111.89$106.48 $107.26 $131.61
$0.79$0.79$0.85$0.71$0.82$0.88$1.23$1.40
Avg Medicaid perDiem Reimbursement
Per Diem Loss Rateper Bed
1.16%
1.31%
0.79%
0.67%
0.55%
0.67%0.62% 0.60%

Aon Risk Solutions 2014 Long Term Care General Liability and Professional Liability Actuarial Analysis 40
0.0
0.5
1.0
1.5
2.0
2.5
201420132012201120102009200820072006
Accident Year
0.87 0.96 1.32 1.50 1.941.05 1.75 1.44 1.48
0.21 0.10
0.24
0.28
0.36
0.12
0.39
0.26
0.20
1.08 1.06
1.56
1.78
2.30
1.17
2.14
1.700.27
1.75
Accident Year
$0
$1,000
$2,000
$3,000
$4,000
$5,000
$6,000
$7,000
$8,000
$9,000
201420132012201120102009200820072006
$2,730 $2,530
$3,440
$5,590
$8,220
$6,620
$5,960
$7,910
$6,310
West VirginiaThe participants in this study represent approximately 5,400 occupied beds in the state. This is approximately 56% of the state total beds.
Loss Rate
The loss rate in West Virginia has grown from a low in 2007 of $2,530 to a projected $6,620 in 2014 .
West Virginia has the second highest loss rate among the profiled states .
Frequency
Frequency has increased from 1 .08 claims per 100 occupied beds in 2005 to a projected 1 .75 claims per 100 occupied beds in 2014 . West Virginia has the third highest frequency among the profiled states .
The bulge in claims for occurrence years 2010 and subsequent may be related to the large jury award in 2011 .
The state legislature explicitly applied statutory caps to long term care providers in 2013 and this may have reduced claims frequency from its peak in 2012 .
Loss Rate per Occupied Bed Limited to $1M per Occurrence
Claim Frequency per 100 Occupied Beds
Indemnity Claims Expense Only Claims

Aon Risk Solutions 2014 Long Term Care General Liability and Professional Liability Actuarial Analysis 41
0.00%
2.00%
4.00%
6.00%
8.00%
10.00%
12.00%
14.00%
20132012201120102009200820072006
4.44%3.97%
$193.31$187.50$180.64$174.36$168.11 $198.92
$17.28$21.66$16.32$22.51$15.30$9.42$6.93$7.47
Average Medicaid per Diem Reimbursement
Per Diem Loss Rate per Bed
$206.08 $212.26
5.21%
8.16%
11.64%
8.20%
10.51%
8.14%
Accident Year
$0
$50,000
$100,000
$150,000
$200,000
$250,000
$300,000
$350,000
$400,000
$450,000
201420132012201120102009200820072006
$253,000$239,000
$294,000
$358,000$384,000
$335,000 $344,000$371,000 $378,000
Severity
Severity in West Virginia has been between $335,000 and $385,000 since 2009 .
This is more than twice the countrywide average severity over the same time period .
Liability Costs and Medicaid Reimbursement Trends
The loss rate as a percent of the Medicaid reimbursement rate has increased from a low of 3 .97% in 2007 to 8 .14% in 2013 .
Severity per Claim Limited to $1M per Occurrence
Loss Rate as a Percentage of Medicaid Reimbursement Limited to $1M per Occurrence

Aon Risk Solutions 2014 Long Term Care General Liability and Professional Liability Actuarial Analysis 42
WisconsinThe participants in this study represent approximately 6,200 occupied beds in the state. This is approximately 22% of the state total beds.
Loss Rate
Loss rates in Wisconsin have been volatile, ranging between $530 and a projected $950 in 2014 .
Frequency
Claim frequency in Wisconsin is projected to be 0 .56 claims per 100 occupied beds in 2013 . Claim frequency has been relatively stable over the experience period .
Loss Rate per Occupied Bed Limited to $1M per Occurrence
Claim Frequency per 100 Occupied Beds
Indemnity Claims Expense Only Claims
$0
$100
$200
$300
$400
$500
$600
$700
$800
$900
$1,000
201420132012201120102009200820072006
$530
$780
$850
$560
$750 $730
$880 $900$950
Accident Year
0.00
0.10
0.20
0.30
0.40
0.50
0.60
0.70
201420132012201120102009200820072006
Accident Year
0.41
0.160.19
0.13
0.14
0.140.13
0.140.15
0.560.57 0.56
0.63
0.45
0.52 0.510.54 0.55
0.14
0.37 0.50 0.31 0.38 0.38 0.40 0.41 0.41

Aon Risk Solutions 2014 Long Term Care General Liability and Professional Liability Actuarial Analysis 43
Severity
Claim severity is increasing in Wisconsin, with a projected average claim size of $169,000 in 2014 .
Liability Costs and Medicaid Reimbursement Trends
The loss rate as a percent of the Medicaid per diem Reimbursement rate varies over the experience period .
Severity per Claim Limited to $1M per Occurrence
Loss Rate as a Percentage of Medicaid Reimbursement Limited to $1M per Occurrence
$0
$20,000
$40,000
$60,000
$80,000
$100,000
$120,000
$140,000
$160,000
$180,000
201420132012201120102009200820072006
$93,000
$141,000$134,000
$126,000
$143,000 $143,000
$163,000 $166,000 $169,000
Accident Year
0.00%
0.20%
0.40%
0.60%
0.80%
1.00%
1.20%
1.40%
1.60%
1.80%
20132012201120102009200820072006Accident Year
$156.23$154.54$153.71$146.87$140.87$136.13 $133.21 $160.24
$2.46$2.41$2.00$2.05$1.53$2.33$2.14$1.45
Avg Medicaid perDiem Reimbursement
Per Diem Loss Rateper Bed
1.09%
1.57%1.65%
1.04%
1.33% 1.29%
1.54% 1.54%

Aon Risk Solutions 2014 Long Term Care General Liability and Professional Liability Actuarial Analysis 44
All Other StatesThe participants in this study represent approximately 64,200 occupied beds in the remaining states. This is approximately 12% of the remaining state total beds.
Loss Rate
The All Other States loss rate is slightly increasing over the experience period .
Frequency
The All Other States frequency has increased from a low of 0 .62 claims per 100 occupied beds in 2006 to a projected 0 .73 claims per 100 occupied beds in 2014 .
Loss Rate per Occupied Bed Limited to $1M per Occurrence
Claim Frequency per 100 Occupied Beds
Indemnity Claims Expense Only Claims
$0
$200
$400
$600
$800
$1,000
$1,200
$1,400
$1,600
$1,800
201420132012201120102009200820072006
$1,250
$1,440
$1,210$1,300
$1,350$1,460
$1,410$1,460
$1,530
Accident Year
0.00
0.10
0.20
0.30
0.40
0.50
0.60
0.70
0.80
201420132012201120102009200820072006
Accident Year
0.48
0.14
0.15
0.170.17 0.15
0.170.16
0.17
0.73
0.62
0.72
0.660.69 0.68
0.74 0.740.71
0.17
0.57 0.49 0.52 0.53 0.57 0.57 0.55 0.56

Aon Risk Solutions 2014 Long Term Care General Liability and Professional Liability Actuarial Analysis 45
Severity
All Other States claim severity is relatively flat over the experience period at just over $200,000 .
Liability Costs and Medicaid Reimbursement Trends
The All Other States liability cost as a percent of the Medicaid Reimbursement rate has increased from 2 .03% in 2008 to 2 .21% in 2013 .
Severity per Claim Limited to $1M per Occurrence
Loss Rate as a Percentage of Medicaid Reimbursement Limited to $1M per Occurrence
$0
$50,000
$100,000
$150,000
$200,000
$250,000
201420132012201120102009200820072006
$203,000 $200,000
$182,000$189,000
$199,000 $198,000$190,000
$204,000 $208,000
Accident Year
0.00%
0.50%
1.00%
1.50%
2.00%
2.50%
3.00%
20132012201120102009200820072006Accident Year
$176.51$174.35$171.04$167.11$163.04$154.97 $146.41 $181.33
$4.00$3.86$4.00$3.70$3.31 $3.56$3.94$3.42
Avg Medicaid perDiem Reimbursement
Per Diem Loss Rateper Bed
2.34%
2.54%
2.03%2.13% 2.16%
2.29%2.19% 2.21%

Aon Risk Solutions 2014 Long Term Care General Liability and Professional Liability Actuarial Analysis 46
DatabaseIn an effort to present a comprehensive analysis from the perspective of all long term care systems,
Aon disseminated a request for data to for-profit and not-for-profit providers including independent
providers, regional multi-facility providers and national multi-facility providers .
The results presented in this study are based on the ensuing database of long term care GL/PL losses
and allocated loss adjustment expenses (ALAE) as reported to us by 34 long term care providers .
Data from the participants was aggregated, resulting in 13,700 non-zero claims and $2 .3 billion
in incurred losses . The facilities represented in the national study operate approximately 230,000
long term care beds, consisting primarily of skilled nursing facility beds but also including a number
of independent living, assisted living, home health care and rehabilitation beds . They represent
approximately 17% of the beds in the United States, and include six of the ten largest providers in
the country .
The results found in this study are representative of the participants . Providers that did not
participate may have different results, either higher or lower . This may be due to any number of
reasons, including levels of effectiveness in quality of care initiatives and the attractiveness of the
provider for tort actions . Based on standard actuarial techniques, the number of claims, number of
participants and bed representation ensure significant credibility of the results at the national level .
The proportion of statewide bed representation assures significant credibility of the results at the
state level . To increase credibility, a higher response rate among providers would be required .
All long term care results published in this report are based on losses (indemnity plus allocated
adjustment expense) limited to $1 million per occurrence unless otherwise noted . The $1 million
per occurrence limitation was selected to limit the impact of large claims on the results .
Statutory limitations were based on National Conference of State Legislatures research updated
August 2011, accessed September 26, 2014 from http://www .ncsl .org/issues-research/banking/
medical-liability-medical-malpractice-laws .aspx . Referenced statutory limitations were confirmed by
retrieving the individual state codes online .
The loss rates are presented relative to the Medicaid per diem reimbursement rate . The Medicaid
per diem reimbursement rate is based on data from “A Report on Shortfalls in Medicaid Funding for
Nursing Home Care” produced by Eljay LLC for the American Health Care Association and dated
January 2014 .The Overall Medicaid per diem reimbursement rate is based on the state exposure
distribution inherent in this study .

Aon Risk Solutions 2014 Long Term Care General Liability and Professional Liability Actuarial Analysis 47
Actuarial AnalysisThe statistics presented in this report are based on an actuarial analysis of the
aggregated long term care GL/PL claim database and related exposure data .
The analysis applies standard actuarial methods to the claim data to develop
ultimate losses and claim counts by accident year . These projections are used
to calculate the following statistics presented in this report:
• Loss Rate—ultimate loss projection per occupied bed equivalent
• Overall Frequency—annual number of non-zero claims per 100 occupied
bed equivalents
• Indemnity Frequency—annual number of claims with indemnity payments
per 100 occupied bed equivalents
• Severity—average ultimate size of each claim, where each claim is limited
to $1 million per occurrence
Conditions and LimitationsInherent UncertaintyActuarial calculations produce estimates of inherently uncertain future
contingent events . We believe that the estimates provided represent
reasonable provisions based on the appropriate application of actuarial
techniques to the available data . However, there is no guarantee that
actual future payments will not differ from estimates included herein .
Extraordinary Future EmergenceOur projections make no provision for the extraordinary future emergence of
losses or types of losses not sufficiently represented in the historical data or
which are not yet quantifiable .
Data RelianceIn conducting this analysis, we relied upon the provided data without audit
or independent verification; however, we reviewed it for reasonableness
and consistency . Any inaccuracies in quantitative data or qualitative
representations could have a significant effect on the results of our review
and analysis .
Use and DistributionUse of this report is limited for the specific purpose described in the
Introduction section . Other uses are prohibited without an executed
release with Aon .
Distribution is unrestricted . We request that Aon be notified of further
distribution of this report . This report should only be distributed in its
entirety, including all supporting exhibits .

Aon Risk Solutions 2014 Long Term Care General Liability and Professional Liability Actuarial Analysis 48
DefinitionsThe following definitions are provided to help the users of this report fully understand the analyses presented and the resulting conclusions.
ALAE ALAE is an abbreviation for allocated loss adjustment expense . ALAE refers to costs, in addition to indemnity payments and reserves, which are incurred in handling claims . Typically, these costs are comprised of legal fees paid by the insured entity in investigating and defending claims . In the context of this study ALAE represents defense costs . The majority of claim data used in this study contained a separate field to identify ALAE costs separately from indemnity costs . Whether separately identified or not, allocated loss adjustment expenses are included in the reported loss information, loss reserving methodologies and loss projections contained in this report . All references to losses throughout the report and exhibits include ALAE except where noted otherwise .
Accident Year An accident year is the year in which an incident giving rise to a claim occurred . All of the loss rate, frequency and severity analyses use grouped data by accident year, unless specifically noted otherwise .
Claim A claim is a demand by an individual or other entity to recover for a loss . It may involve a formal lawsuit but not necessarily, especially in the case of a general liability claim .
Exposure Actuaries select an exposure base such that the incidence of claims will tend to vary directly with the exposure of the entity at risk . The actuary must consider both the historical loss level and the corresponding exposures in evaluating historical claim liabilities and expected future costs . It is important to choose an exposure measure that is relevant to the unique situation of each risk group .
In this study the exposure base is occupied beds . Occupied beds are calculated by multiplying the number of licensed beds by the average annual occupancy rate . There is a strong correlation between the number of occupied beds and the total amount of losses incurred by a long term care facility . Not all beds are equal in terms of their risk exposure, however . An assisted living bed generates fewer dollars of GL/PL claim activity than a skilled care bed . All beds in this study have been adjusted to the equivalent of a skilled nursing care bed .
By dividing losses by exposures, comparative estimates of the long term care industry GL/PL loss rates are developed .
Frequency Frequency is the ratio of the number of claims divided by exposures . In this report, frequency is measured on an annual basis as the number of claims projected for the given time period divided by the number of occupied beds during that same period . In the summary exhibits, frequency is the annual number of claims per 100 occupied beds .
General Liability (GL) General liability exposure relates to those sums an entity becomes legally obligated to pay as damages because of a bodily injury (typically including personal and advertising injury) or property damage .
Indemnity Indemnity refers to the component of claim costs actually paid or reserved to be paid to the plaintiff . Indemnity costs include both the amount provided for the plaintiff, either as a jury award or a settlement, and the amount retained by the plaintiff’s attorney . However, in most claim files, including those used to do this study, the split between plaintiff award and plaintiff attorney is not provided . Indemnity may also include punitive damages, although this is not consistently treated among companies .
Indemnification Rate This is the ratio of claims that result in indemnity to all claims (claims with indemnity and claims with expense only) . This reflects the likelihood that a claimant will receive indemnification .
Limit of Liability A limit of liability is a maximum amount of coverage provided by an insurance transaction . Above the limit of liability, the insured is responsible for all losses . Limits of liability may be expressed on a per occurrence basis or an aggregate basis, similar to deductibles . The losses included in this study are limited to $1,000,000 per occurrence .
Loss Rate Loss rate is the cost per exposure of settling and defending claims . Loss rate is calculated as the ratio of total dollars of losses (indemnity and ALAE) to total exposures for a given period of time . In this report exposures are selected to be occupied beds and the time period is one year . Consequently, a loss rate represents the annual amount per occupied bed expected to be paid to defend, settle and/or litigate GL/PL claims arising from incidents occurring during the respective year .
Aon Risk Solutions 2014 Long Term Care General Liability and Professional Liability Actuarial Analysis 49
Loss Development Loss development refers to the change in the estimated value of losses attributable to a body of claims or to a time period until all the claims are closed .
Generally, the reported losses will increase over time for several reasons . First, it is impossible to estimate precisely the ultimate losses and legal expenses for claims when they are initially reported . The estimated unpaid loss for a claim, called a case reserve, is adjusted up or down as more information is obtained . In the aggregate, the upward adjustments tend to be greater than the downward ones . Second, it takes a period of time for some claims to be discovered, reported, and recorded . Claims that have been incurred but have not been reported are called “pure” IBNR claims . Third, closed claims are sometimes reopened . This may be due to legislation, which applies retroactively to claims that have closed . In this report, except where specifically noted, projected loss rates, frequencies and severities by state and by year are all inclusive of actuarially indicated expected loss development .
Loss development also refers to the increase in paid losses as claims are reported, paid to their ultimate values, and closed .
Loss Trend Loss trend is the change in claim frequency and/or severity from one time period to the next . Factors that affect the frequency and severity of claims are constantly changing over time . Examples of causes include inflation, societal attitudes toward legal action, and changes in laws . Actuaries use trend factors to adjust historical loss experience to comparable levels .
Professional Liability (PL) Professional liability exposure relates to those sums an entity becomes legally obligated to pay as damages and associated claims and defense expenses because of a negligent act, error or omission in the rendering or failure to render professional services .
Severity Severity refers to the total dollar amount of a claim including indemnity and ALAE . In this report, the average severity for a given year is measured by dividing the total dollars of losses for all claims incurred in the year by the total number of claims .

Aon Risk Solutions 2014 Long Term Care General Liability and Professional Liability Actuarial Analysis 50
About Aon’s Actuarial & Analytics PracticeAon’s Actuarial & Analytics Practice is the third largest North American property and
casualty consulting firm, providing actuarial services to clients for more than 20 years . Our
international capabilities are matched by our strong local presence that positions us to
deliver timely results and meaningful communication to every level of your organization .
Our practice is comprised of highly skilled and experienced professionals in the risk
quantification and analysis field . We have more than 100 consultants and 50+ Fellows and
Associates of the Casualty Actuarial Society . As part of Aon Global Risk Consulting, we
are dedicated to expanding our solutions to help our clients effectively and proactively
manage their risk in the current dynamic and challenging global economic market .

3 2014 Long Term Care General Liability and Professional Liability Actuarial Analysis
ContactsChristian Coleianne, FCAS, MAAA+1 .410 .309 .0741christian .coleianne@aon .com
Donald Riggins, FCAS, MAAA, CPCU+1 .410 .309 .4539donald .riggins@aon .com
Konstantin Sakherzon+1 .215 .255 .1806konstantin .sakherzon@aon .com
Molly Rozran+1 .410 .381 .2439molly .rozran@aon .com
The Aon Risk Maturity Index is an innovative tool that
enables risk and financial leaders to self-assess their
organizations’ risk management practices and receive
Aon feedback in the form of a Risk Maturity Rating Report
and commentary for improvement . The Index combines
the experience and knowledge of Aon Risk Solutions, Aon
Global Risk Consulting and Aon Hewitt into an easy-to-
understand questionnaire on risk management processes,
corporate governance and risk understanding .
Since launching in mid-2011, nearly 900 organizations
from all industry sectors around the world have
participated in the Index . The Aon Centre for Innovation
and Analytics in Dublin, the Wharton School of the
University of Pennsylvania and experts from Aon’s
Enterprise Risk Management are analyzing the aggregate
data to provide industry benchmarking information and
key insights into the risk management community .
About Aon Risk Maturity Index

About Aon Aon plc (NYSE:AON) is the leading global provider of risk management, insurance and reinsurance brokerage, and human resources solutions and outsourcing services. Through its more than 66,000 colleagues worldwide, Aon unites to empower results for clients in over 120 countries via innovative and effective risk and people solutions and through industry-leading global resources and technical expertise. Aon has been named repeatedly as the world’s best broker, best insurance intermediary, best reinsurance intermediary, best captives manager, and best employee benefits consulting firm by multiple industry sources. Visit aon.com for more information on Aon and aon.com/manchesterunited to learn about Aon’s global partnership with Manchester United.
© Aon plc 2014. All rights reserved.The information contained herein and the statements expressed are of a general nature and are not intended to address the circumstances of any particular individual or entity. Although we endeavor to provide accurate and timely information and use sources we consider reliable, there can be no guarantee that such information is accurate as of the date it is received or that it will continue to be accurate in the future. No one should act on such information without appropriate profes-sional advice after a thorough examination of the particular situation.
Risk. Reinsurance. Human Resources.