2014 iSentia Social Media Survey Australia
21
Social Media Influencer Survey 2014
-
Upload
belinda-armstrong -
Category
Documents
-
view
15 -
download
0
Transcript of 2014 iSentia Social Media Survey Australia

Social Media Influencer
Survey 2014
25% of all the time we spend online in Australia and New Zealand, we spend on social media.
That’s 15 in every 60 minutes
What lessons can we learn from one another?
How can we change the way we communicate through social media?
How do we as communicators interact with social media channels?
As individuals, we are using social media more and more.
So do we as communicators value the channel?
iSentia Social Media Influencer Survey 2014

1.4 x x 2.8
MON SUN
Instagram users post an average of 1.4 videos and 2.8 photos each week
Source: The Works and University of Technology Sydney, 2014
SOCIAL MEDIA USE
Internet Users Who are they?
Age demographic % breakdown % of online Australian
Source: Neilsen Online Landscape Review, 2013
8.9%
15.6%
17.9%
17.9%
30.6%
8,164,800
50.4% 49.6%
8,035,200
YouTube is the second largest search engine in the world processing 3 billion searches a month
2-17
18-24
25-34
35-49
50+
Sources: AdvocateDigitalMedia, 2014 and Internet Live Stats, 2014
25% of all online time is spent on Social Media. That’s 15 in every 60 minutes.
Source: The Works and University of Technology Sydney, 2014
3BN searches
Use of social Media and social networks across Australia is increasing exponentially as more and more Australians turn to social channels to connect to friends and family, to engage with products, service and brand and crucially, more and more, to get their news.
iSentia Social Media Influencer Survey 2014
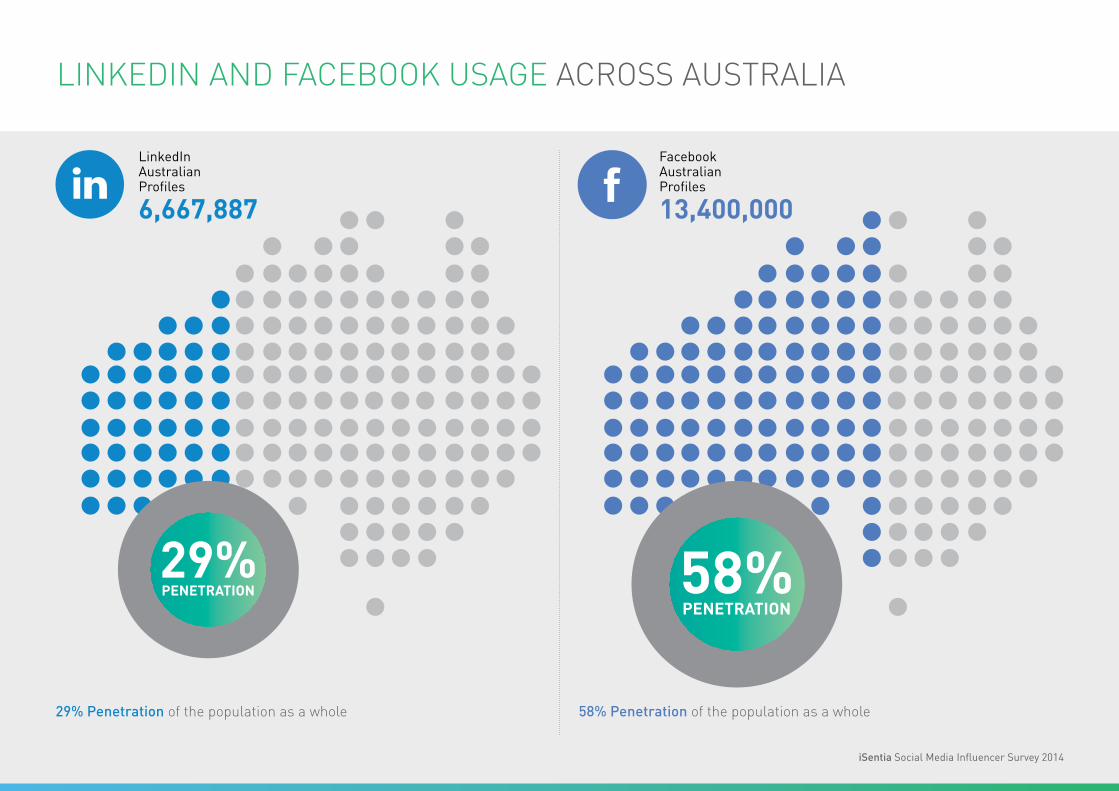
LINKEDIN AND FACEBOOK USAGE ACROSS AUSTRALIA
LinkedIn Australian Profiles
6,667,887
Facebook Australian Profiles
13,400,000
29%PENETRATION 58%
PENETRATION
29% Penetration of the population as a whole 58% Penetration of the population as a whole
iSentia Social Media Influencer Survey 2014

ISENTIA SOCIAL MEDIA REPORT 2014
Social media has rapidly become less of a place to share photos and more of an essential business tool for communicating to your target audience. With this in mind iSentia conducted a survey amongst a wide range of our clients across Australia and New Zealand, to get a pulse check on where and how you are using social media.
This report explores the use of social media across a wide range of the region’s businesses from the ASX 100 players to the small PR/Comms team to give you an idea of what everyone is doing and how they feel about social media now.
This is what you told us…
Social Media sites used
Primary social networks actively used by responding marketing and communications teams in organisations across Australia.
95%
20%16% 15% 15%
7%
20
40
60
80
100
iSentia Social Media Influencer Survey 2014

MEDIA INFLUENCERS AND SOCIAL MEDIA
How important is it to monitor traditional media influencers through social channels?
40% of journalists said social media is very important to their work
1/3 said they spend up to 60 minutes each day on social networks.
Not at all important 7.9%
Somewhat important 27.8%
Very important 35.6%
Extremely important 28.7% Source: Indiana University School of Journalism, 2014
60MIN
iSentia Social Media Influencer Survey 2014
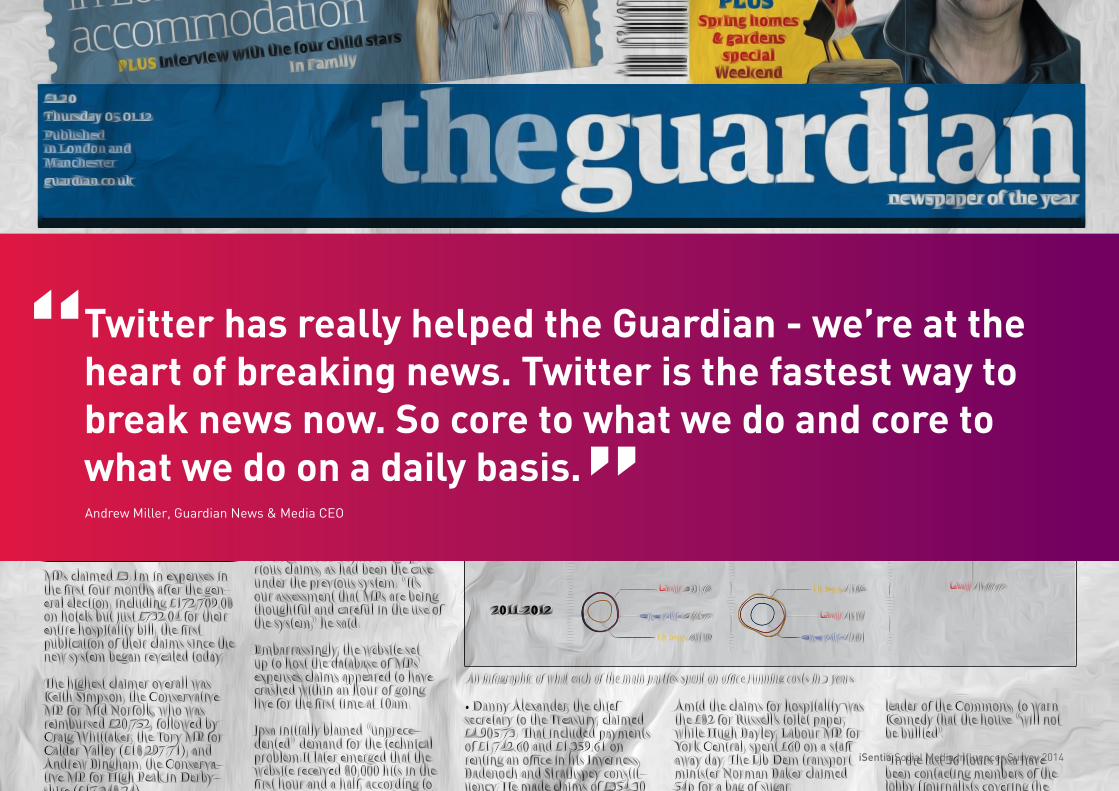
Twitter has really helped the Guardian - we’re at the heart of breaking news. Twitter is the fastest way to break news now. So core to what we do and core to what we do on a daily basis. Andrew Miller, Guardian News & Media CEO
iSentia Social Media Influencer Survey 2014

ONLINE AND SOCIAL MEDIA USE 2014
YouTube
Source: www.socialbakers.com
Source: www.socialbakers.com
Source: www.socialbakers.com
Page Local Fans Fans
Skittles 994,266 26,433,137
McDonald’s Australia 990,525 1,081,297
Pringles 984,588 27,594,939
Pringles 983,697 1,112,115
Domino’s Pizza - Australia 953,914 1,037,781
Channel Subscribers Uploaded video views
Samsung Australia 9,943 18,383,925
Telstra 12,417 18,368,634
Gumtree Australia 1,028 12,480,998
Kia Australia 3,552 10,686,903
Toyota Australia 10,292 10,336,782
Profile Following Followers
Qantas (@Qantas) 3,983 214,577
Virgin Australia (@VirginAustralia) 8,953 152,279
popcherryfashion (@popcherryfasion) 71 117,545
Sportsbet.com.au (@sportsbet.com.au) 3,092 91,892
jetstar Airways (@JetstarAirways) 22,958 80,816
0 5
YouTube
Blogs
Google+
Snapchat
3.99
3.87
3.38
3.21
2.97
2.65
2.05
2.03
1.51
1.45
We asked marketing and communications managers which social network they considered to be the most useful:
iSentia Social Media Influencer Survey 2014

LIKELY TO BE A HIGH PRIORITY FOR FY2015
Social channel
YouTube
Source: www.socialbakers.com
81.2%
43.7%
Instagram 19.1%
29.7%
Linkedin 16.7%
Google+ 14.1%
Pinterest 7.4%
Tumblr 3.5%
Relative importance of channel
Google+
YouTube
Tumblr
3.99
3.87
2.65
3.38
2.97
2.05
2.03
3.21
We asked marketing and communications managers which social network they considered to be the most useful and they responded that Facebook, Twitter and YouTube were their big three. Globally, marketing managers agreed with those three channels likely to attract the most marketing investment during FY2014.
iSentia Social Media Influencer Survey 2014

HOW AND WHY ARE JOURNALISTS USING SOCIAL MEDIA?
Blogs by other journalists
Microblogs (Twitter, etc.)
Blogs by citizens
Crowd-sourcing
(Wikipedia, etc.)
Audio-Visual SNS
(YouTube, etc.)
Professional SNS
(LinkedIn, etc.)
23.6%
53.8%
22.2%20.2%
10.6%7.1%
Source: Indiana University School of Journalism, 2014
Types of Social Media usedWhy are you using it?
To share and promote information
To raise brand awareness
To enhance/ lead industry discussion amongst our
stakeholders
To obtain information about our organisation/ industry
To keep on top of and manage potential issues
To recruit better people
For fundraising
To enhance SEO
To generate leads/ sales
88.8%
80.8%
49.4%
57.1%
69.9%
36.2%
20.2%
30.8%
31.7%
The increasing use of social media channels by marketing and communications professionals is matched by journalists who are also significantly increasing their use of the channel. 89 percent of Australian journalists believe that social channels spreads news faster and they are also actively using those channels to promote stories, research articles and editorial and drive brand awareness – both personal and masthead
iSentia Social Media Influencer Survey 2014

89% of Australian journalists believe that social media spreads stories more quickly than ever before. Newsmaker Australian Media Survey, December 2013
iSentia Social Media Influencer Survey 2014

WHO OWNS SOCIAL MEDIA AS A CHANNEL?
Who currently operates your social media presence?
Who should operate your social media presence?
Surveyed job titles
Undefined/ no one 8.5%
Shared between Marketing and Comms/PR 36.0%
Communications/ PR 38.5%
Marketing 17.0%
No one (it’s not important) 1.9%
It should be a shared responsibilty 49.2%
Communications/ PR 40.7%
Marketing 8.2%
Other 10%
SocialMedia 4%
Digital 5%
Marketing 7%
Communicationsandmedia 74%
With regard the now familiar debate on who should own the social media channel inside an organisation, almost half of those surveyed believe that responsibility for the channel should be shared between marketing and communications despite the fact that nearly three quarters of all respondents were drawn from the communications or media departments of the organisation. There was wide acceptance within communications professionals that social media channels are not owned by the organisation and are in fact a direct conduit to a range of stakeholders which requires input from a wide range of departments to manage effectively. In addition to marketing and communications teams, key functions within organisations that respondents felt should have an input into social media management include, senior management, human resource and customer service.
iSentia Social Media Influencer Survey 2014

IS CONTENT KING?
Average posts per day by Australian brandsHow often does your organisation post content to social media channels?
How do you think that will change over the next 12 months?
Every Business day 57.4%
Once or twice a week 23.0%
Once or twice a month 9.1%
Never or hardly ever 10.4%
I don’t know 5.7%
We’ll be cutting back 0.6%
Increase substantially 17.4%
increase a little 46.1%
It won’t change that much 30.3%
1.68 posts per day to Facebook
6.29 posts per day to Twitter
6.29 posts per day to YouTube
Source: www.socialbakers.com, September 2014
iSentia Social Media Influencer Survey 2014

What is the most important form of content for social media channels
Original audio content 2%
Curation of other peoples content 10%
Original videos 12%
Original visual assets 19%
Original written content 58%
WHAT TYPE OF CONTENT IS KING?
Nearly 60 percent of respondents considered original written content to be the most important form of content for social media channels, which is at odds with the rise of posted imagery and video content across the medium as a whole. Original visual assets and original video receiving less them 50 percent of the support shown to the written word.
Photos on social media
Smartphone users are avid video watchers
and 5 millionimages are
pinned on
every day14
llllliiooonges aed oe
72% watch video
19% watch video at least once a day
Source: Our mobile Planet, Google
10 Digital Media Ramblings (Feb 2013), 11 Tech Crunch (June 2013), 12 Buffer (Oct 2013), 13 Flickr (Y/E 2012), 14 Digital Media Ramblings (Sep 2013)
350m uploaded daily on Facebook10
200m uploaded daily on Snapchat11
55m uploaded daily on Instagram12
43m uploaded daily on Flickr13
93% of the most engaged posts on Facebook are images
Source: Social Bakers 2013
iSentia Social Media Influencer Survey 2014

HOW IMPORTANT IS SOCIAL MEDIA IN YOUR JOB?
Social Media is important in my role
On a scale of 1 to 10 how important is it to your role that you stay up to date with Social media developments?
How important is social media to the role of US based communicators?
Source: Social Media Marketing Industry Report, 2014
Source: Social Media Examiner
Not at all 4.7%
Somewhat 28.4%
Very highly 66.9%
Not at all 1%
Somewhat 7%
Very highly 92%
7.83
Strongly disagree 6%
Disagree 22%
Uncertain 35%
Agree 30%
Strongly agree 7%
Are you able to measure ROI on your Social Media acivity?
Nearly two thirds of respondents believe that social media is important to their role and 78 percent try to stay up to date with current developments in the medium. However, 63 percent of all respondents still find it hard to measure ROI and/or a tangible result through social media.
iSentia Social Media Influencer Survey 2014

THE COMPARISON OF PERCEIVED IMPORTANCE TO FUTURE INVESTMENT
Please rate the importance of each social media channel
Do you plan to increase your use of this channel?
YouTube
Blogs
Google+
Snapchat
3.99
3.87
3.38
3.21
2.97
2.65
2.05
2.03
1.45
YouTube
Blogs
Google+
Snapchat
64%
67%
67%
68%
64%
42%
61%
50%
7%
iSentia Social Media Influencer Survey 2014

HOW MUCH BUDGET DO AUSTRALIAN ORGANISATIONS ALLOCATE TO SOCIAL MEDIA?
Where does your budget go?
How do you expect your organisation’s budget to change in FY15?
What is your organisation’s budget for social media?
Zero to $10,000
$10,000 to $50,000
$50,000 to $100,000
$100,000+
34.5%
13.1%
2.4%
2.4%
I dont know 34.9%
We are cutting back 2.3%
Increase substatially 4.6%
Increase a little 23.9%
It won’t change that much 35.3%
Of the respondents who were able to determine an exact figure for their social media budget for FY2014, the vast majority expect to spend less than $50,000 but around 29% of Australian respondents expect that amount to increase next financial year. In comparison to international marketing and communications teams, Australian organisations appear to allocate around the same percentage of their budgets to this channel.
Percentage of Digital Marketing Budget
Digital or online advertising
Develop/maintain corporate website
Digital commerce
Social marketing
Mobile marketing
Content creation management
Search marketing
Email marketing
Analytics
Video production
Company blog
12.2
10.3
9.6
9.5
9.5
9.3
9.2
8.8
8.1
7.4
6.0
0 2 4 6 8 10 12 14
iSentia Social Media Influencer Survey 2014
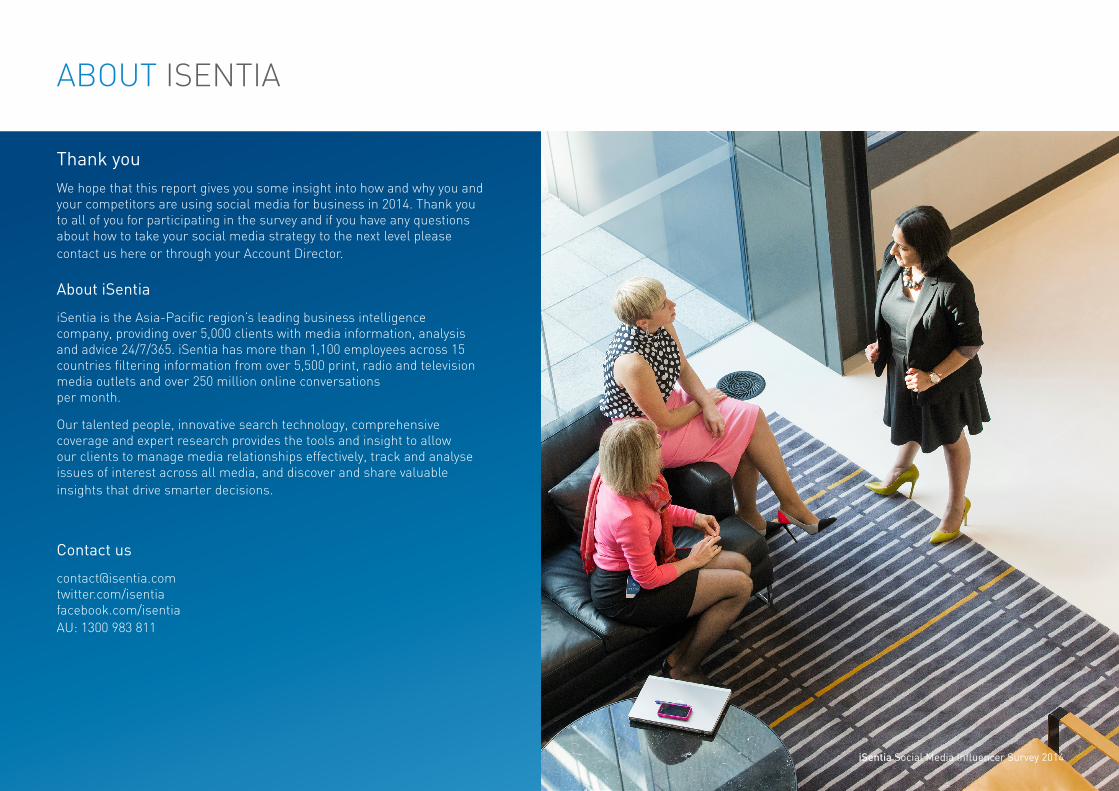
Thank you We hope that this report gives you some insight into how and why you and your competitors are using social media for business in 2014. Thank you to all of you for participating in the survey and if you have any questions about how to take your social media strategy to the next level please contact us here or through your Account Director.
About iSentia
iSentia is the Asia-Pacific region’s leading business intelligence company, providing over 5,000 clients with media information, analysis and advice 24/7/365. iSentia has more than 1,100 employees across 15 countries filtering information from over 5,500 print, radio and television media outlets and over 250 million online conversations per month.
Our talented people, innovative search technology, comprehensive coverage and expert research provides the tools and insight to allow our clients to manage media relationships effectively, track and analyse issues of interest across all media, and discover and share valuable insights that drive smarter decisions.
Contact us
[email protected]/isentiafacebook.com/isentiaAU: 1300 983 811
ABOUT ISENTIA
iSentia Social Media Influencer Survey 2014
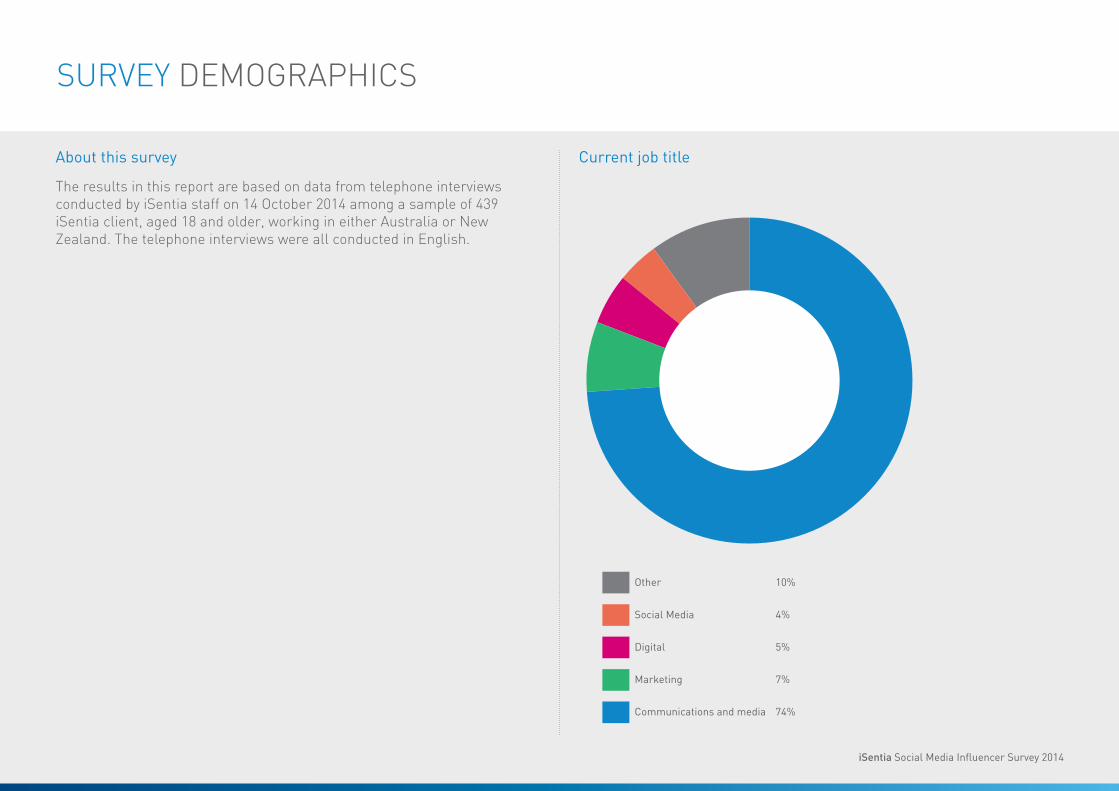
SURVEY DEMOGRAPHICS
Current job titleAbout this survey
The results in this report are based on data from telephone interviews conducted by iSentia staff on 14 October 2014 among a sample of 439 iSentia client, aged 18 and older, working in either Australia or New Zealand. The telephone interviews were all conducted in English.
Other 10%
SocialMedia 4%
Digital 5%
Marketing 7%
Communicationsandmedia 74%
iSentia Social Media Influencer Survey 2014

SURVEY DEMOGRAPHICS
Current location Current industry sector
Agriculture, forestry, fishing and hunting 5.7%
Mining 6.2%
Manufacturing 4.8%
Electricity, gas and water supply 4.6%
Construction 1.1%
Wholesale trade 1.1%
Retail trade 4.8%
Accommodation, Food Services 2.5%
Transport and storage 2.7%
Information Media and Telecommunications 4.6%
Finance and Insurance 5.2%
Rental, Hiring and Real Estate Services 1.1%
Professional, Scientific and Technical Services 2.1%
Administrative and Support Services 3.0%
Public Administration and Safety 5.7%
Education and Training 5.7%
Health Care and Social Assistance 6.8%
Arts and Recreation Services 3.6%
71.5%
28.5%
iSentia Social Media Influencer Survey 2014

[email protected]/isentia.comfacebook.com/isentiaAU: 1300 983 811