Nu Skin Investor Day Dec 2014 Slide Deck PPT PDF Investor Presentation
Upload
cnoservicesCategory
view
536download
3
2014 CNO Investor Day2014 CNO Investor DayJune 26, 2014
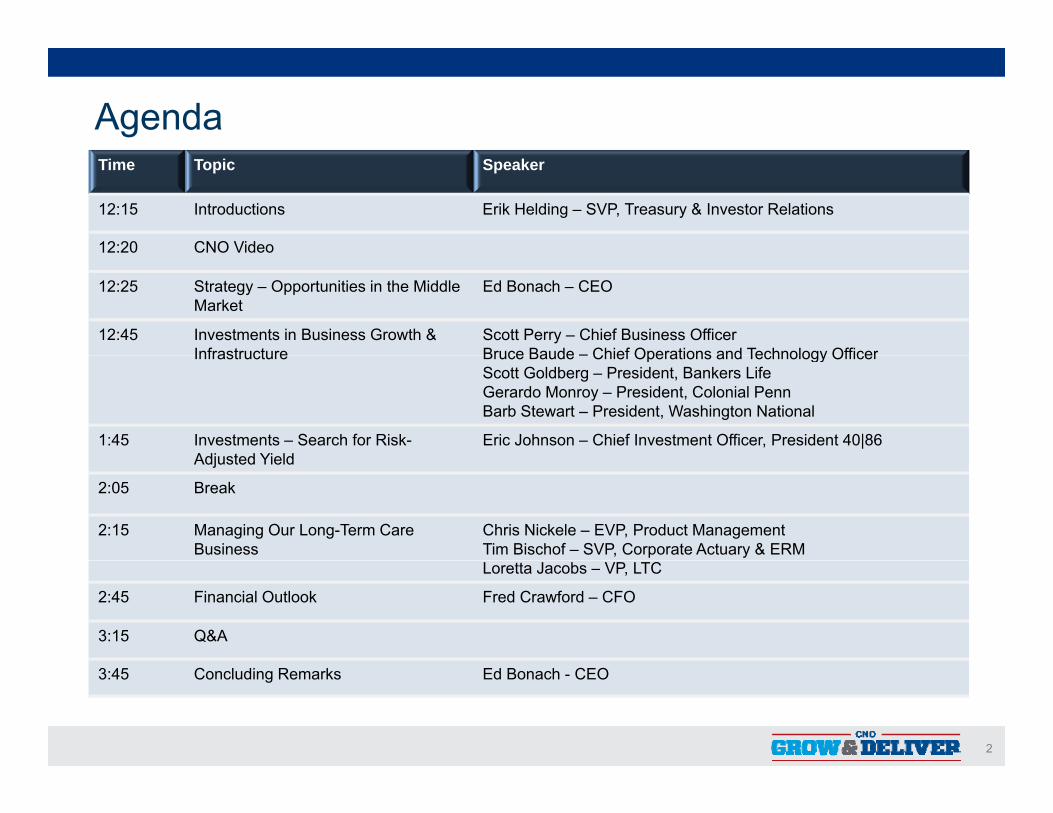
AgendaTime Topic Speaker
12:15 Introductions Erik Helding – SVP, Treasury & Investor Relations
12:20 CNO Video
12:25 Strategy – Opportunities in the Middle Market
Ed Bonach – CEO
12:45 Investments in Business Growth & Infrastructure
Scott Perry – Chief Business OfficerBruce Baude – Chief Operations and Technology OfficerInfrastructure Bruce Baude – Chief Operations and Technology OfficerScott Goldberg – President, Bankers LifeGerardo Monroy – President, Colonial PennBarb Stewart – President, Washington National
1:45 Investments – Search for Risk-Adjusted Yield
Eric Johnson – Chief Investment Officer, President 40|86Adjusted Yield
2:05 Break
2:15 Managing Our Long-Term Care Business
Chris Nickele – EVP, Product ManagementTim Bischof – SVP, Corporate Actuary & ERMLoretta Jacobs – VP, LTC
2:45 Financial Outlook Fred Crawford – CFO
3:15 Q&A
2
3:45 Concluding Remarks Ed Bonach - CEO
Forward-Looking StatementsCertain statements made in this presentation should be considered forward-looking statements as defined in the Private Securities Litigation Reform Act of 1995. These include statements about future results of operations and capital plans. We caution investors that these forward-looking statements are not guarantees of future performance, and actual results may differ materially. Investors should consider the important risks and uncertainties that may cause actual results to differ, including those included in our press releases, our Quarterly Reports on Form 10-Q, our Annual Report on Form 10-K and other filings we make with the S iti d E h C i i W bli ti tSecurities and Exchange Commission. We assume no obligation to update this presentation, which speaks as of today’s date.
3
Non-GAAP MeasuresThis presentation contains the following financial measures that differ from the comparable measures under Generally Accepted Accounting Principles (GAAP): operating earnings measures; operating return measures; earnings before the earnings ofoperating earnings measures; operating return measures; earnings before the earnings of CLIC being sold, loss on reinsurance transaction, net realized investment gains (losses), fair value changes in embedded derivative liabilities, equity in earnings of certain non-strategic investments and earnings attributable to VIEs, corporate interest expense, loss on extinguishment of debt and taxes; and debt to capital ratios, excluding accumulatedon extinguishment of debt and taxes; and debt to capital ratios, excluding accumulated other comprehensive income (loss). Reconciliations between those non-GAAP measures and the comparable GAAP measures are included in the Appendix, or on the page such measure is presented.
Whil t b li th f l t h d t di dWhile management believes these measures are useful to enhance understanding and comparability of our financial results, these non-GAAP measures should not be considered substitutes for the most directly comparable GAAP measures.
Additional information concerning non-GAAP measures is included in our periodic filingsAdditional information concerning non GAAP measures is included in our periodic filings with the Securities and Exchange Commission that are available in the “Investors – SEC Filings” section of CNO’s website, www.CNOinc.com.
4
5
Strategy: Opportunities in the Middle MarketStrategy: Opportunities in the Middle MarketEd Bonach - CEO
6
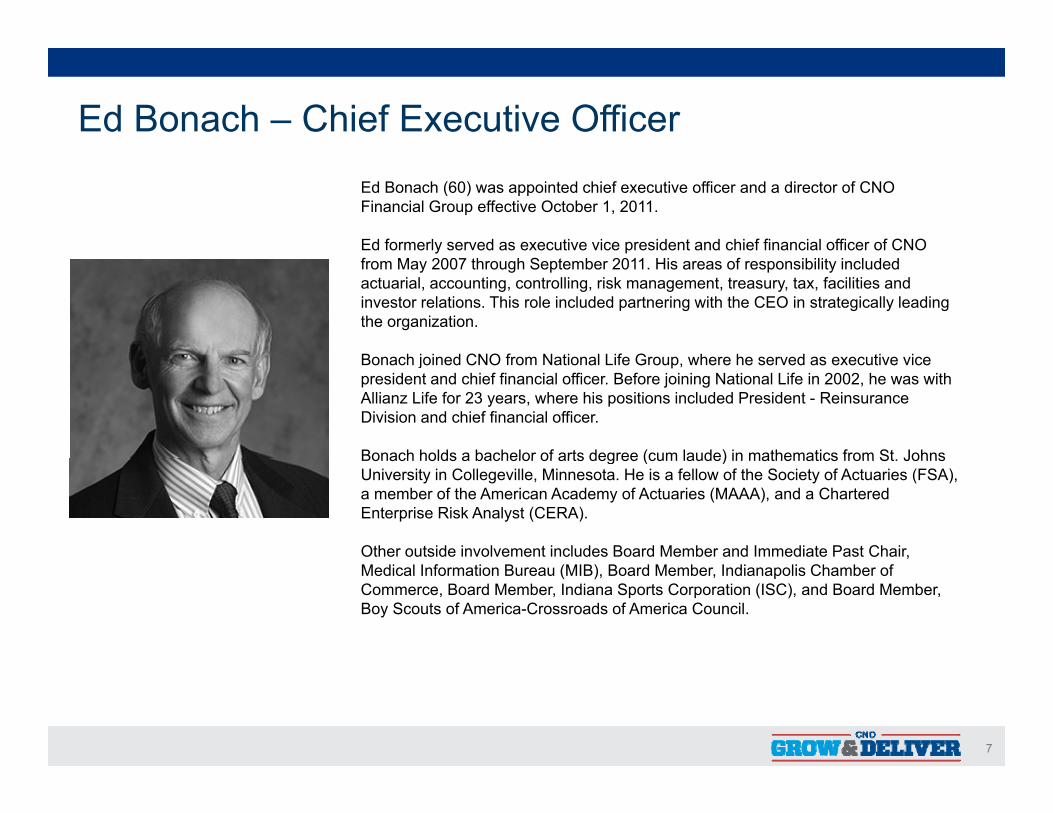
Ed Bonach – Chief Executive OfficerEd Bonach (60) was appointed chief executive officer and a director of CNO Financial Group effective October 1, 2011.
Ed formerly served as executive vice president and chief financial officer of CNO y pfrom May 2007 through September 2011. His areas of responsibility included actuarial, accounting, controlling, risk management, treasury, tax, facilities and investor relations. This role included partnering with the CEO in strategically leading the organization.
B h j i d CNO f N ti l Lif G h h d ti iBonach joined CNO from National Life Group, where he served as executive vice president and chief financial officer. Before joining National Life in 2002, he was with Allianz Life for 23 years, where his positions included President - Reinsurance Division and chief financial officer.
Bonach holds a bachelor of arts degree (cum laude) in mathematics from St JohnsBonach holds a bachelor of arts degree (cum laude) in mathematics from St. Johns University in Collegeville, Minnesota. He is a fellow of the Society of Actuaries (FSA), a member of the American Academy of Actuaries (MAAA), and a Chartered Enterprise Risk Analyst (CERA).
Other outside involvement includes Board Member and Immediate Past Chair, Medical Information Bureau (MIB), Board Member, Indianapolis Chamber of Commerce, Board Member, Indiana Sports Corporation (ISC), and Board Member, Boy Scouts of America-Crossroads of America Council.
7
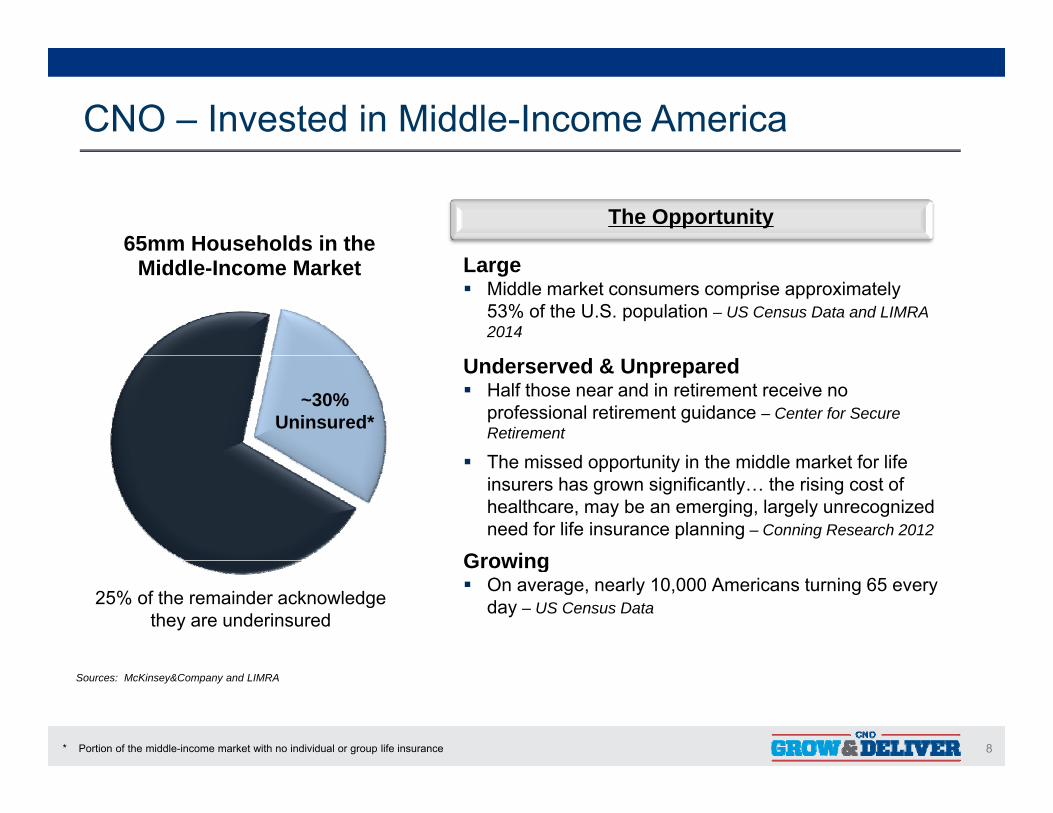
CNO – Invested in Middle-Income America
65mm Households in the The Opportunity
Middle-Income Market Large Middle market consumers comprise approximately
53% of the U.S. population – US Census Data and LIMRA 2014
~30% Uninsured*
Underserved & Unprepared Half those near and in retirement receive no
professional retirement guidance – Center for Secure Retirement
Th i d t it i th iddl k t f lif The missed opportunity in the middle market for life insurers has grown significantly… the rising cost of healthcare, may be an emerging, largely unrecognized need for life insurance planning – Conning Research 2012
GrowingGrowing On average, nearly 10,000 Americans turning 65 every
day – US Census Data25% of the remainder acknowledge they are underinsured
8* Portion of the middle-income market with no individual or group life insurance
Sources: McKinsey&Company and LIMRA
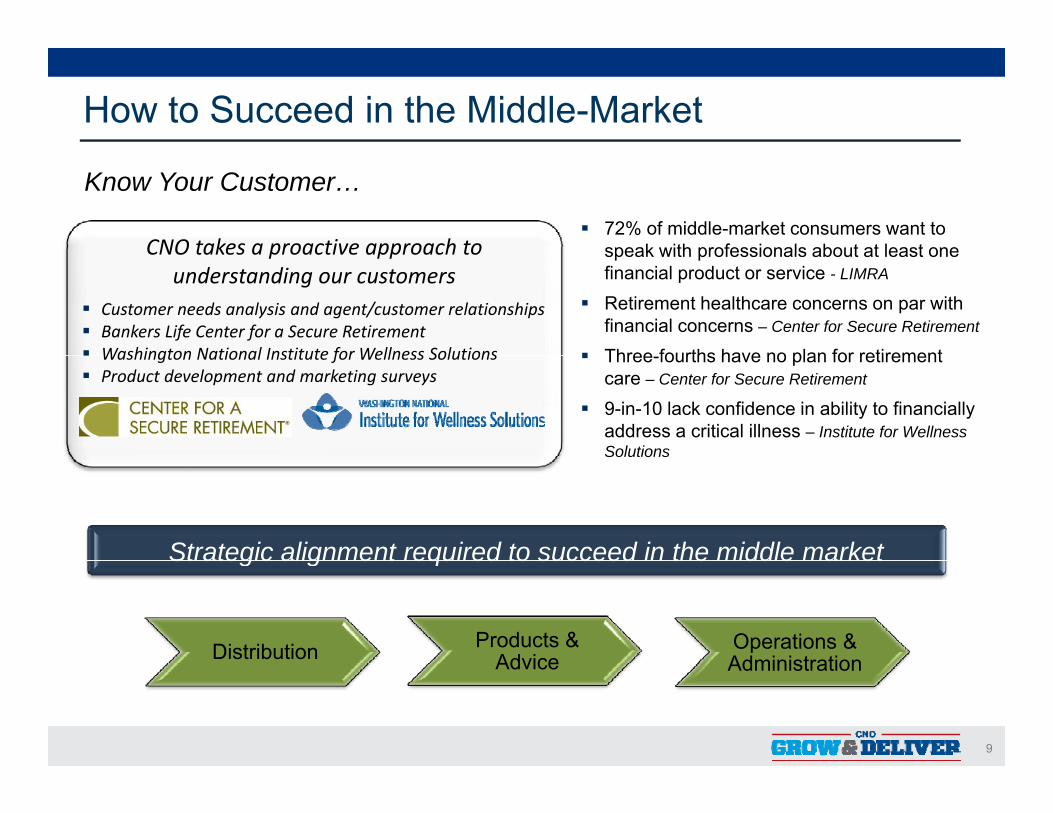
How to Succeed in the Middle-Market
72% of middle-market consumers want to speak with professionals about at least oneCNO takes a proactive approach to
Know Your Customer…
speak with professionals about at least one financial product or service - LIMRA
Retirement healthcare concerns on par with financial concerns – Center for Secure Retirement
Three fourths have no plan for retirement
CNO takes a proactive approach to understanding our customers
Customer needs analysis and agent/customer relationships Bankers Life Center for a Secure Retirement Washington National Institute for Wellness Solutions Three-fourths have no plan for retirement
care – Center for Secure Retirement
9-in-10 lack confidence in ability to financially address a critical illness – Institute for Wellness Solutions
Washington National Institute for Wellness Solutions Product development and marketing surveys
Strategic alignment required to succeed in the middle marketStrategic alignment required to succeed in the middle market
Distribution Products & Advice
Operations & Administration
9
Advice Administration
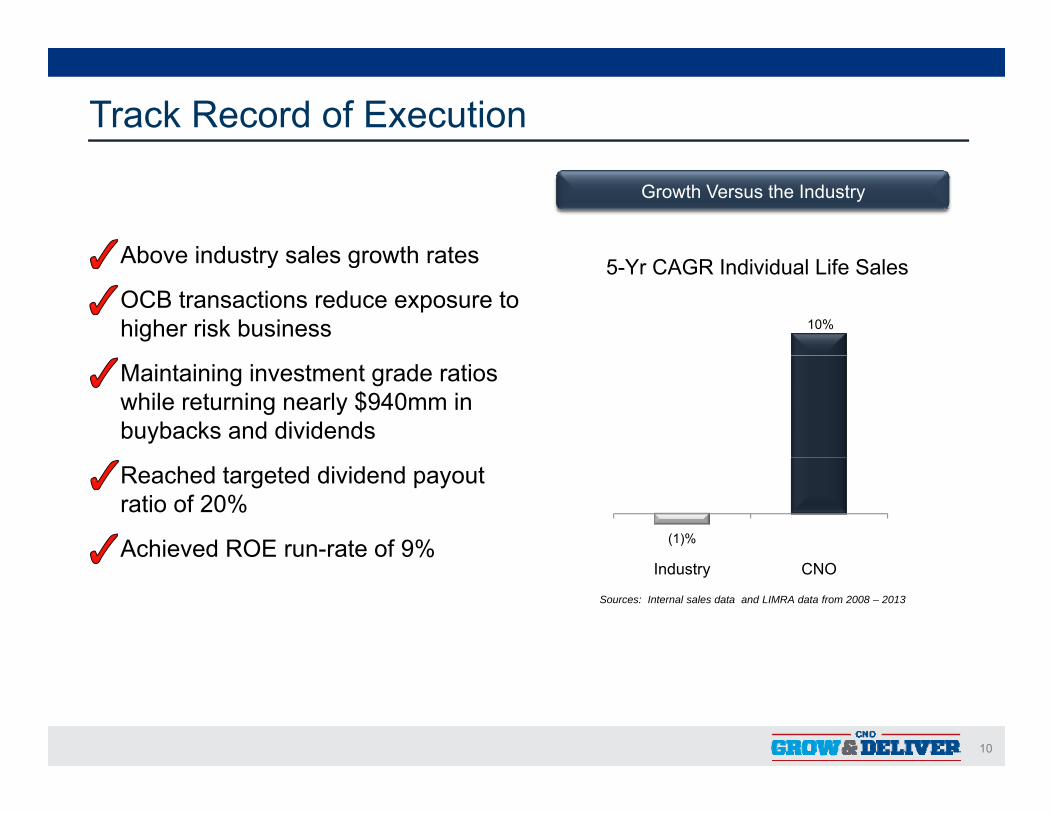
Track Record of Execution
Above industry sales growth rates
Growth Versus the Industry
Above industry sales growth rates
OCB transactions reduce exposure to higher risk business
5-Yr CAGR Individual Life Sales
10%
Maintaining investment grade ratios while returning nearly $940mm in buybacks and dividends
Reached targeted dividend payout ratio of 20%
Achieved ROE run-rate of 9% (1)%
Sources: Internal sales data and LIMRA data from 2008 – 2013
Industry CNO
10
Capital Allocation Priorities
Maintain capital ratios that advance ratings and defend our franchisep g
Investing in the business model driving growth and efficiencies
Continue securities repurchase when compelling compared to other alternatives Continue securities repurchase when compelling compared to other alternatives
Common stock dividends in line with earnings
Disciplined M&A to strengthen business model and/or leverage tax assets
Proven track record of tactical deployment
11

Building on Momentum to Grow and Deliver
Build on investment in the business Build on investment in the business
Focus on sustainable profitable growth
Accelerate operating effectivenessg
Tactically deploy excess capital
Enhance the customer experience
Invest in and develop talent
Grow quality ROE
CNO positioned as a strong growth and stable company allowing us to focus on
12
CNO positioned as a strong growth and stable company allowing us to focus on GROWING the Business and DELIVERING value to Shareholders
Investments in Business Growth & InfrastructureScott Perry – Chief Business Officer
Bruce Baude – Chief Operations and Technology OfficerScott Goldberg – President, Bankers Life
Gerardo Monroy – President, Colonial PennBarb Stewart – President, Washington National
13
Scott Perry – Chief Business OfficerScott Perry (51) is chief business officer of CNO Financial Group, Inc.
Perry joined CNO's subsidiary Bankers Life and Casualty Company as a field vice president and went on to hold the titles of senior vice president of distribution, chief operating officer and president of Bankers Life.
During his tenure, Perry helped transform Bankers into a performance-driven, values-based organization with high accountability at all levels. He developed a unique business model focused on serving America’s middle market pre-and post-retirees through a unique career distribution system. Under Perry’s leadership, Bankers developed best in class practices in lead generation performance management agentdeveloped best-in-class practices in lead generation, performance management, agent recruitment, training, and field leadership development. Perry spearheaded a seven-year strategy that involved aggressive expansion into new locations, doubling the size of the agent force and producing consistent sales and earnings growth.
As president of Bankers, Perry delivered improved bottom-line financial results whileAs president of Bankers, Perry delivered improved bottom line financial results while establishing consistent top line growth. Through pricing discipline, expense rigor and operational efficiencies, the company achieved financial improvements in both inforceblocks and new business. These achievements resulted in a strengthened balanced sheet and steady improvements in return on equity.
Before joining Bankers, Perry spent 17 years in sales, marketing and management roles at Presideo, Premera Blue Cross, Anthem Blue Cross Blue Shield and Golden Rule. He is on the Board of Trustees of the American College and is a Board Member of the Greater Illinois Chapter of the Alzheimer’s Association, Illinois Life Insurance Council and LL Global, Inc., the parent organization of LIMRA and LOMA. He holds a bachelor of arts degree in political science from Ripon College
14
bachelor of arts degree in political science from Ripon College.
Bruce Baude – Chief Operations and Technology Officer
Bruce Baude (49) was appointed EVP, Chief Operations and Technology Officer on July 23, 2012. In this role he provides strategic leadership over both CNO’s Operations and IT functions.
Baude was previously chief operating officer at Univita Health. He joined Long Term Care Group in 2005 and served as chief executive officer through 2008, until its acquisition by Univita.
F 2001 th h id 2005 h id t d hi f ti ffi fFrom 2001 through mid-2005, he was president and chief executive officer of ProCard, Inc., a subsidiary of global payments processor, TSYS.
Before joining ProCard, Baude was with Bank One Corporation, where he held various roles including that of chief executive of Banc One Financial Card Services, a third-party payments processing company He began his career with IBM serving inthird party payments processing company. He began his career with IBM, serving in both technical and sales roles supporting the automotive and financial services industries.
Baude graduated with a B.S. in Electrical Engineering/Computer Science from the University of Colorado.
15
Scott Goldberg – President, Bankers Life
Scott Goldberg (43) is President of Bankers Life and Casualty Company.
Goldberg began his career with CNO in 2004 as vice president of strategic planning. In 2007 he joined Bankers as vice president of strategy and marketing In 2011In 2007, he joined Bankers as vice president of strategy and marketing. In 2011, he was named vice president of sales and earned the company's top territory award.
Before joining CNO, Goldberg worked in strategy, consulting and business development roles for CNA Financial, Lante Corporation, Accenture and Arthur Andersen.
Goldberg earned a B.S. in Finance from the University of Illinois and holds an MBA from the Ross School of Business at the University of Michigan.
16
Barb Stewart – President, Washington National
Barb Stewart (56) was named president of Washington National in March 2013.
She joined the company in 2006 as vice president of strategy and business, j y gyresponsible for strategic planning and business development, marketing, products, agent recruiting and sales support, and business unit reporting.
Prior to Washington National, Stewart served as vice president, strategic development for H&R Block Financial Advisors and, earlier, as president of W hi t S S iti b k d l ffili t f ING H iWashington Square Securities, a broker dealer affiliate of ING. Her experience as a financial services executive also includes 16 years with American Express Financial Advisors (now Ameriprise), where she held leadership roles in sales and marketing, third-party distribution, client service and underwriting support, and corporate re-engineering.
Stewart, a Certified Financial Planner (CFP), holds an MBA from Cornell University and a bachelor’s degree from the University of Delaware. She is a member of the Indianapolis Financial Planning Association and serves as president and board member of HOPE, an Ohio non-profit corporation. She also is a board member of the Indiana Pacers Foundation
17
Gerardo Monroy – President, Colonial Penn
Gerardo Monroy (47) was named president of CNO’s Colonial Penn business segment in August 2012, after serving as the vice president of long-term care for CNO’s Bankers Life business segment since 2008.g
Monroy began his career with CNO in 2001 as a vice president in the corporate marketing group and, in 2002, joined Bankers Life as vice president, distribution strategy and field support. In 2004, he was named vice president, career distribution and operations strategy and chief of staff to the company’s chief operating officer. He b i id t f fi ld d i i t ti d l i ith B k i 2006 dbecame vice president of field administration and analysis with Bankers in 2006 and was then named vice president of Bankers’ long-term care business in 2008.
Before joining CNO, Monroy worked for international corporations in Mexico and Italy, including Procter & Gamble, and Carrier Corporation (part of United Technologies).
He holds an MBA from Harvard University and a bachelor's degree in public accounting from the Universidad Iberoamericana in Mexico City.
Monroy served as board chairman of the Latino Education Alliance (LEA), a Chicago-based nonprofit organization from 2008-10 and was recently elected to the Peirce College Board of Trustees in May 2014.
18
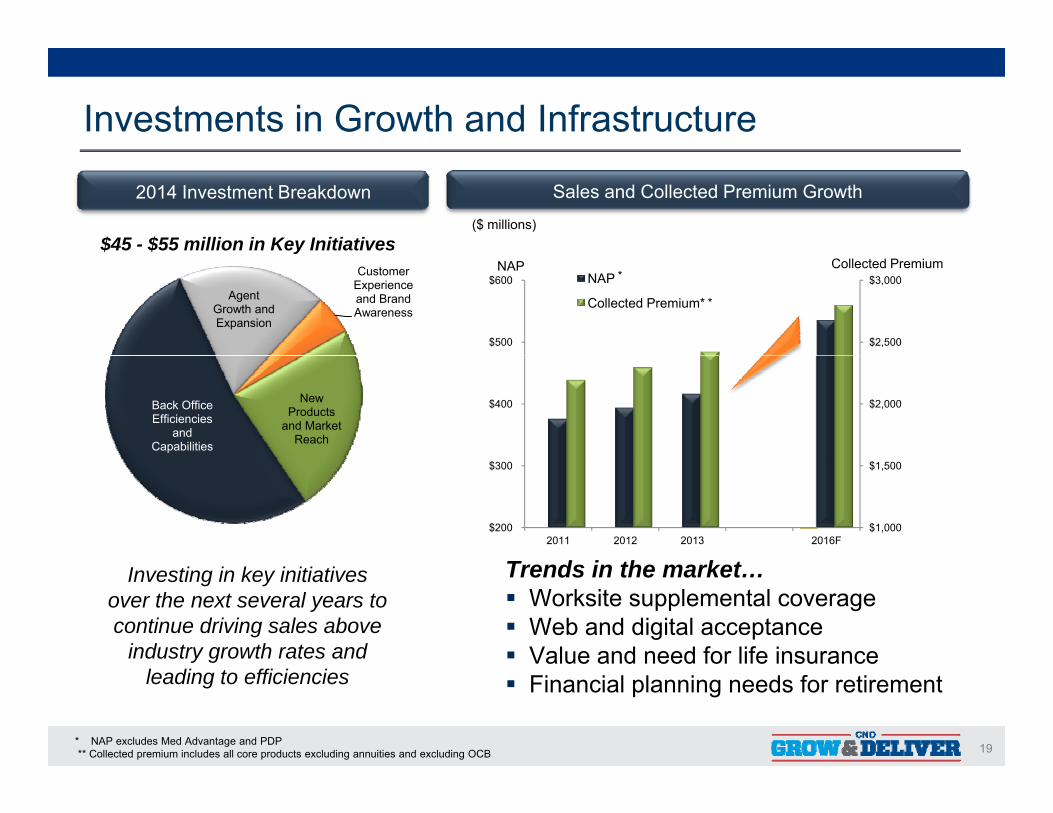
Investments in Growth and Infrastructure
2014 Investment Breakdown Sales and Collected Premium Growth
$45 - $55 million in Key Initiatives($ millions)
$2,500
$3,000
$500
$600 NAP
Collected Premium*Agent Growth and Expansion
Customer Experience and Brand Awareness
yNAP Collected Premium
*
*
$2,000 $400 Back Office Efficiencies
and Capabilities
New Products
and Market Reach
$1,000
$1,500
$200
$300
2011 2012 2013 2016F
T d i h kInvesting in key initiatives over the next several years to continue driving sales above
industry growth rates and
Trends in the market… Worksite supplemental coverage Web and digital acceptance Value and need for life insurance
19
leading to efficiencies Value and need for life insurance
Financial planning needs for retirement
* NAP excludes Med Advantage and PDP** Collected premium includes all core products excluding annuities and excluding OCB
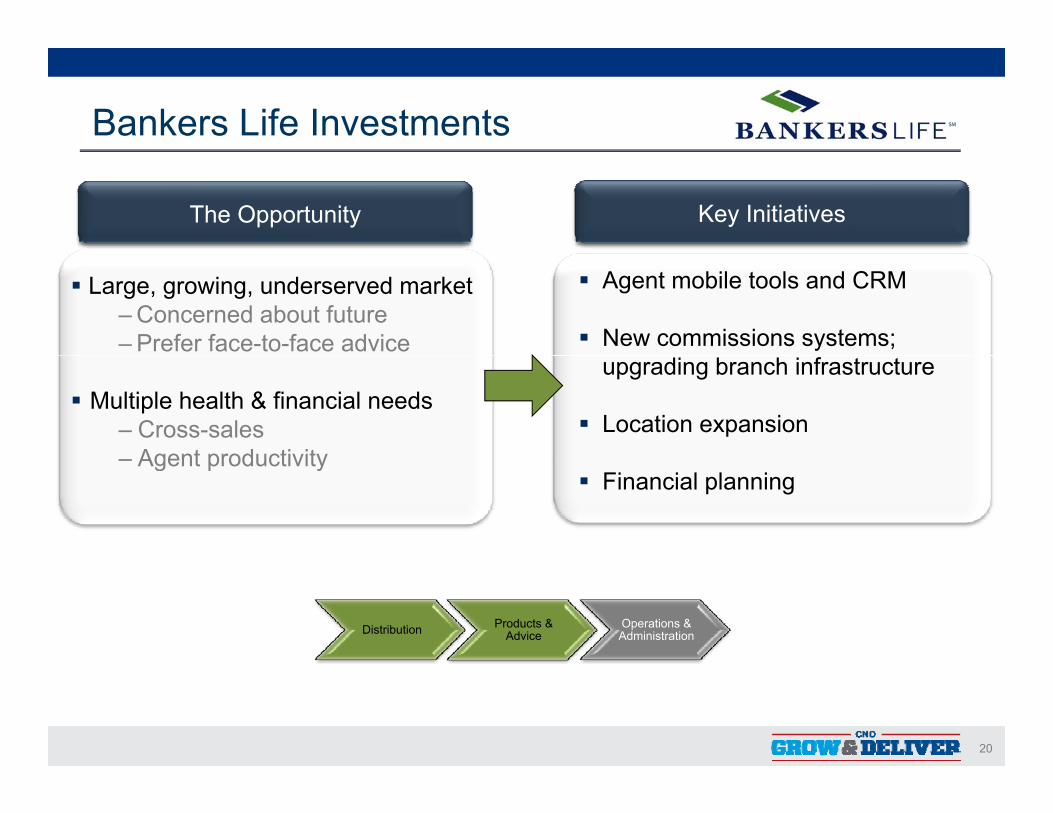
Bankers Life Investments
The Opportunity Key Initiatives
Agent mobile tools and CRM
New commissions systems;
Large, growing, underserved market‒Concerned about future‒Prefer face-to-face advice
upgrading branch infrastructure
Location expansion Multiple health & financial needs
‒ Cross-salesAgent productivity
Financial planning ‒ Agent productivity
Distribution Products & Advice
Operations & Administration
20
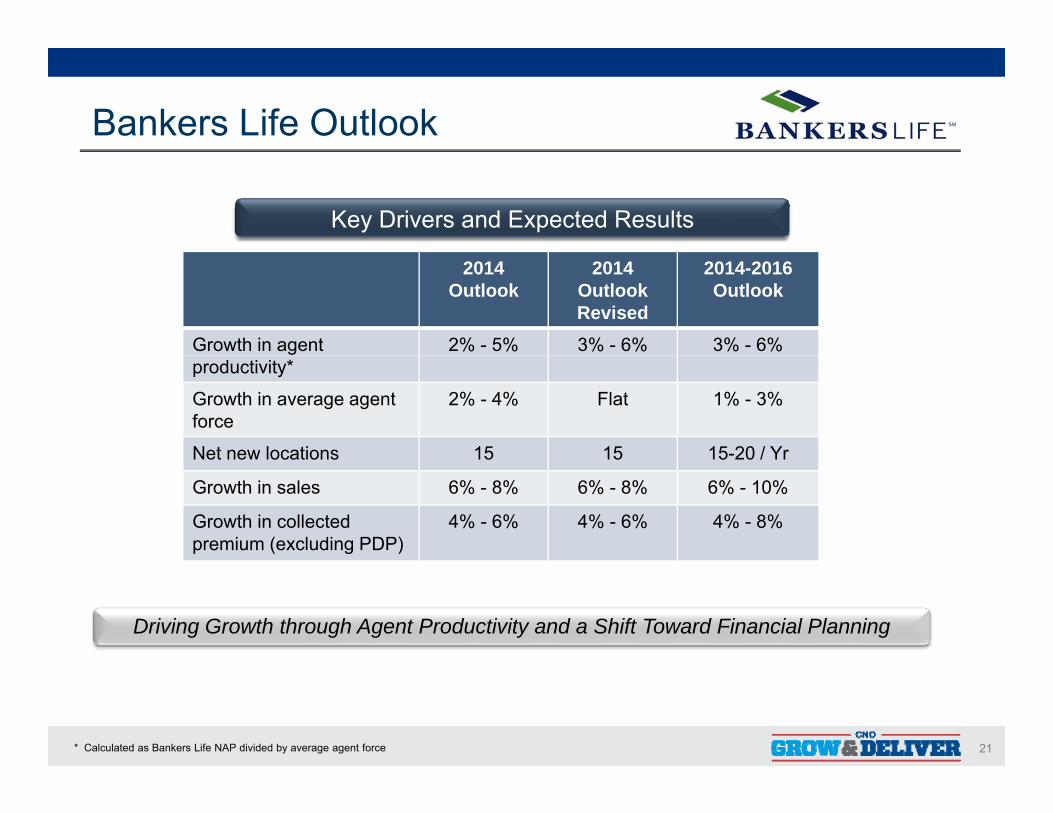
Bankers Life Outlook
Key Drivers and Expected Results
2014 Outlook
2014 OutlookRevised
2014-2016Outlook
Growth in agent 2% - 5% 3% - 6% 3% - 6% productivity*
Growth in average agent force
2% - 4% Flat 1% - 3%
Net new locations 15 15 15-20 / YrNet new locations 15 15 15 20 / Yr
Growth in sales 6% - 8% 6% - 8% 6% - 10%
Growth in collectedpremium (excluding PDP)
4% - 6% 4% - 6% 4% - 8%
Driving Growth through Agent Productivity and a Shift Toward Financial Planning
21* Calculated as Bankers Life NAP divided by average agent force
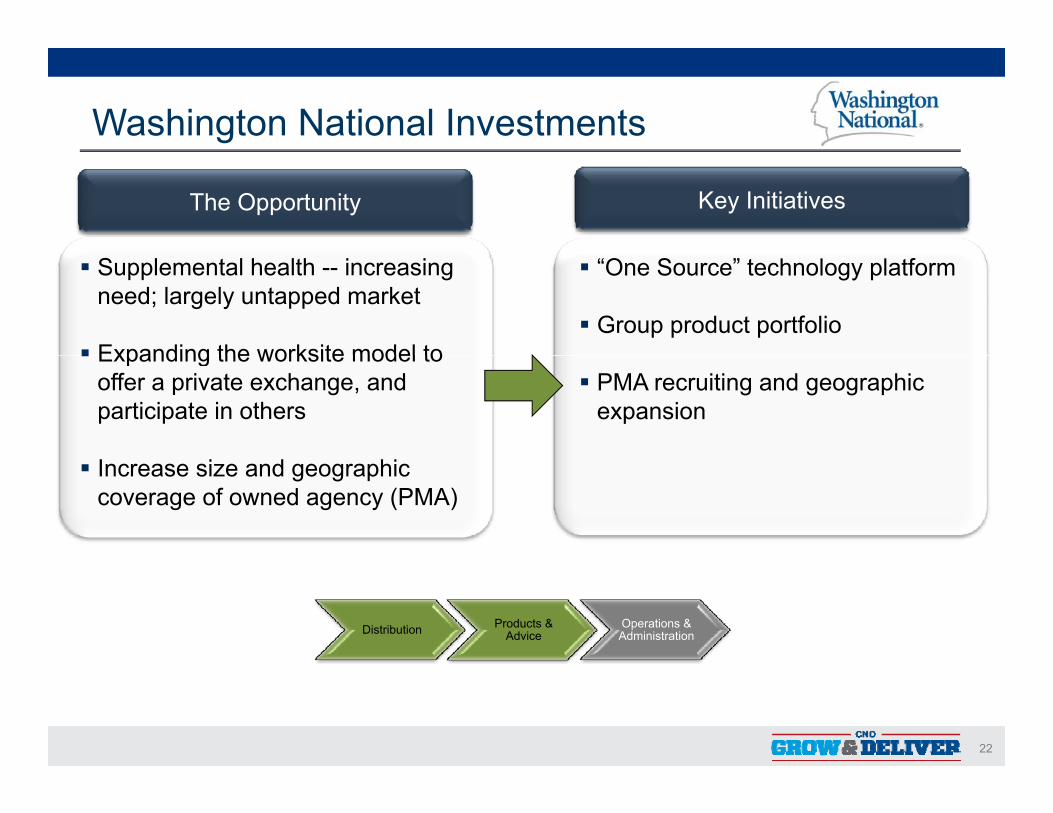
Washington National Investments
The Opportunity Key Initiatives
Supplemental health -- increasing need; largely untapped market
Expanding the worksite model to
“One Source” technology platform
Group product portfolio Expanding the worksite model to
offer a private exchange, and participate in others
PMA recruiting and geographic expansion
Increase size and geographic coverage of owned agency (PMA)
Distribution Products & Advice
Operations & Administration
22
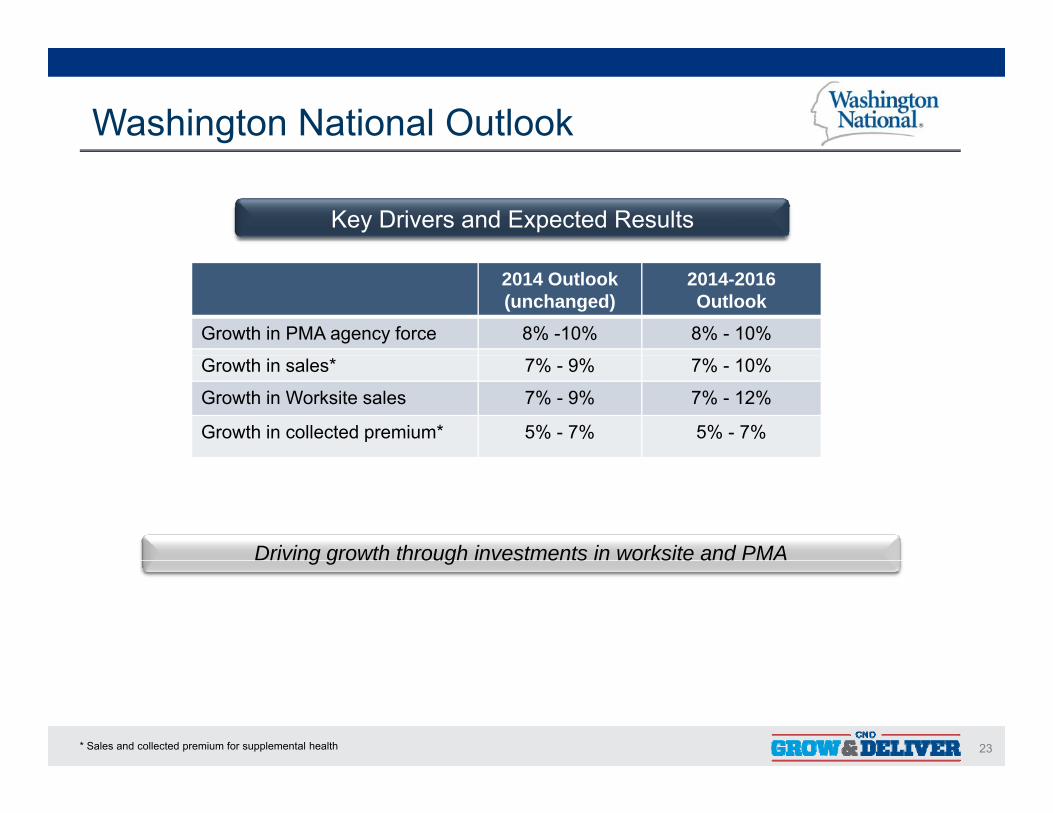
Washington National Outlook
Key Drivers and Expected Results
2014 Outlook(unchanged)
2014-2016Outlook
Growth in PMA agency force 8% -10% 8% - 10%
Growth in sales* 7% - 9% 7% - 10%
Growth in Worksite sales 7% - 9% 7% - 12%
Growth in collected premium* 5% - 7% 5% - 7%
Driving growth through investments in worksite and PMAg g o oug es e s o s e a d
23* Sales and collected premium for supplemental health
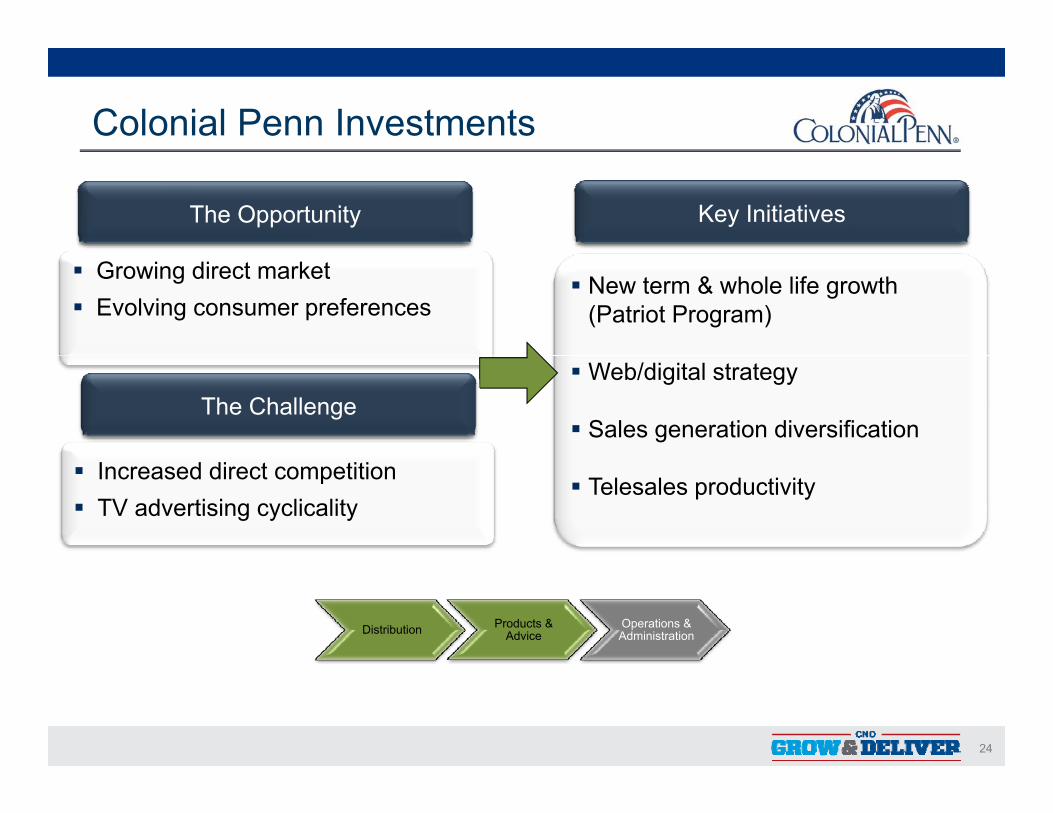
Colonial Penn Investments
The Opportunity Key Initiatives
Growing direct market Evolving consumer preferences
New term & whole life growth (Patriot Program)
The Challenge Web/digital strategy
Sales generation diversification
Increased direct competition TV advertising cyclicality
Telesales productivity
Distribution Products & Advice
Operations & Administration
24
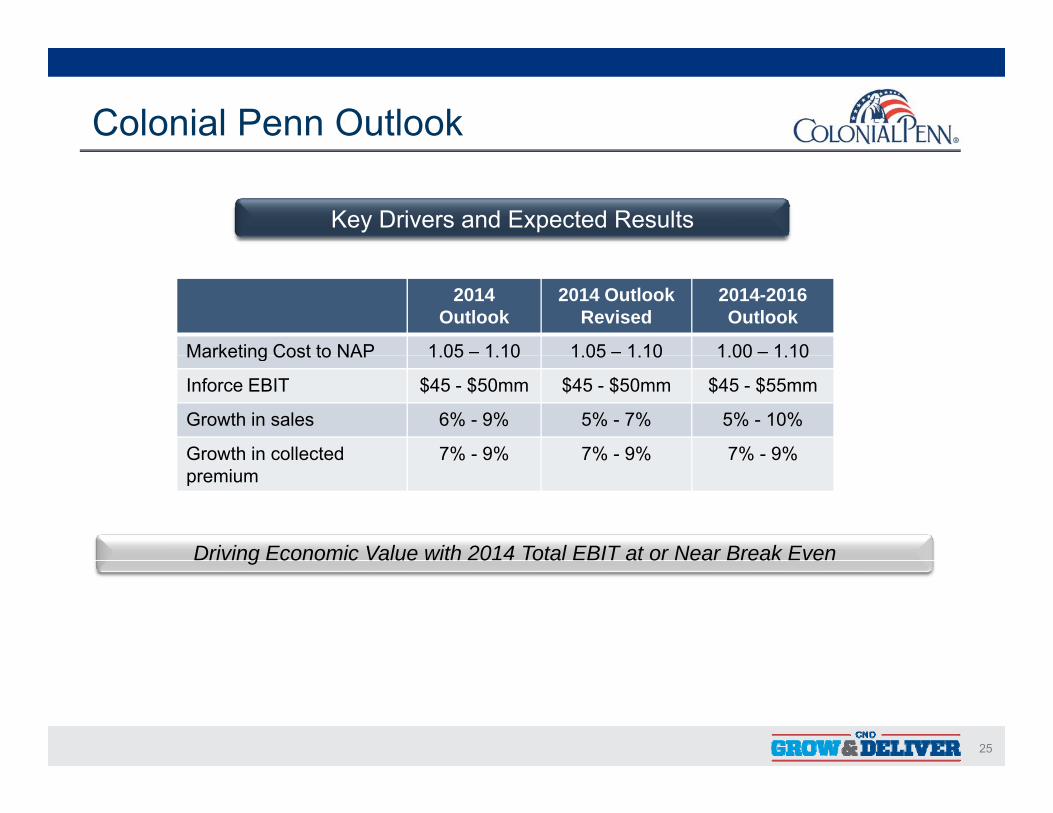
Colonial Penn Outlook
Key Drivers and Expected Results
2014 Outlook
2014 Outlook Revised
2014-2016Outlook
Marketing Cost to NAP 1 05 – 1 10 1 05 – 1 10 1 00 – 1 10Marketing Cost to NAP 1.05 1.10 1.05 1.10 1.00 1.10
Inforce EBIT $45 - $50mm $45 - $50mm $45 - $55mm
Growth in sales 6% - 9% 5% - 7% 5% - 10%
Growth in collected 7% - 9% 7% - 9% 7% - 9%Growth in collectedpremium
7% 9% 7% 9% 7% 9%
Driving Economic Value with 2014 Total EBIT at or Near Break Eveng co o c a ue 0 o a a o ea ea e
25
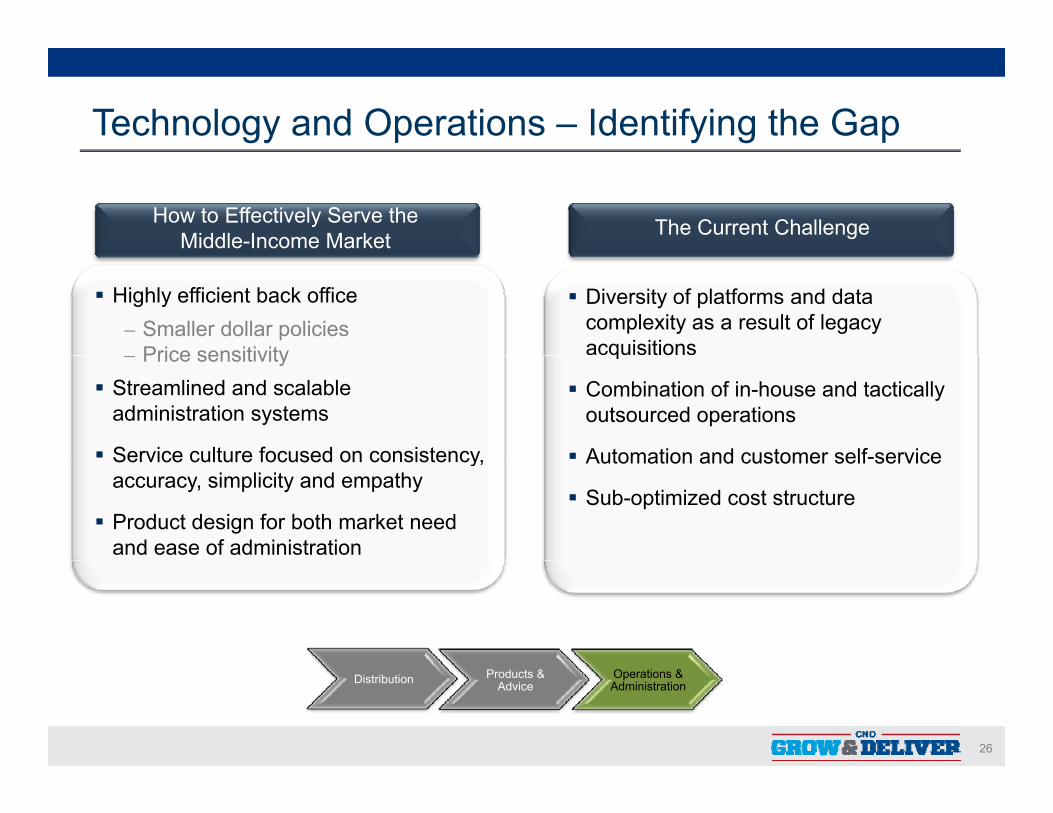
Technology and Operations – Identifying the Gap
The Current ChallengeHow to Effectively Serve the Middle-Income Market
Highly efficient back office– Smaller dollar policies
Price sensitivity
Diversity of platforms and data complexity as a result of legacy acquisitions– Price sensitivity
Streamlined and scalable administration systems
Service culture focused on consistency
q
Combination of in-house and tactically outsourced operations
Automation and customer self-serviceService culture focused on consistency, accuracy, simplicity and empathy
Product design for both market need and ease of administration
Automation and customer self-service
Sub-optimized cost structure
26
Distribution Products & Advice
Operations & Administration
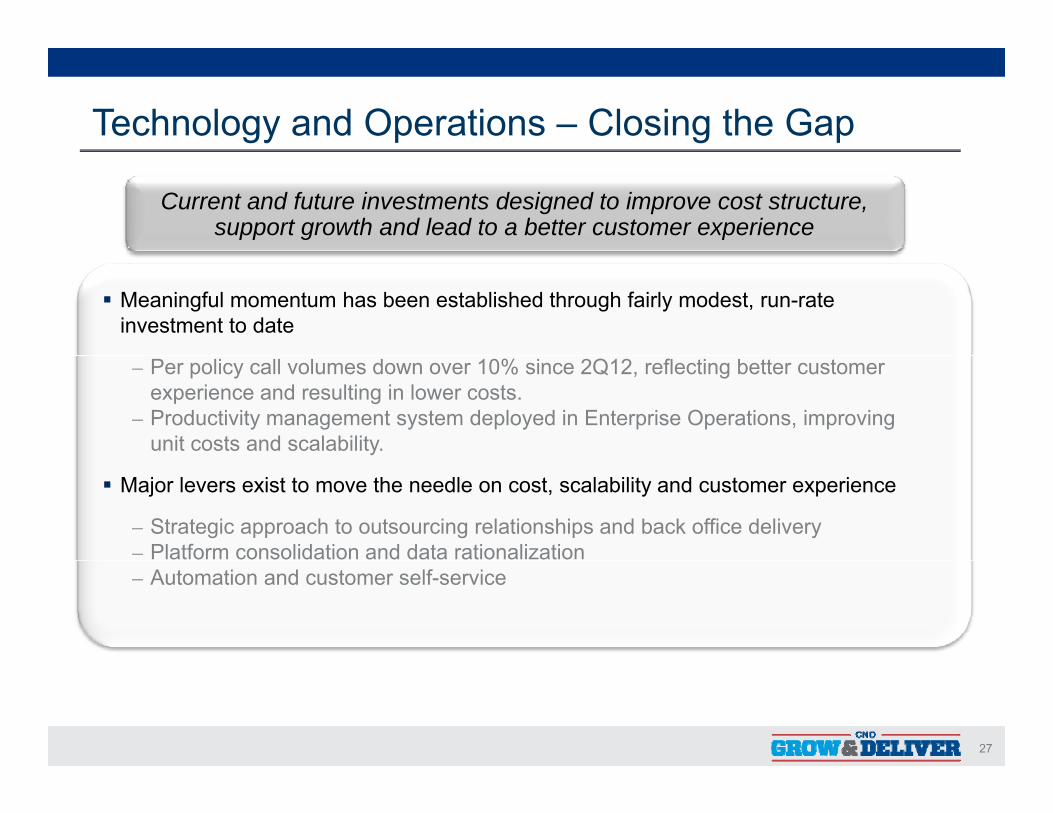
Technology and Operations – Closing the Gap
Current and future investments designed to improve cost structure, support growth and lead to a better customer experience
Meaningful momentum has been established through fairly modest, run-rate investment to date
– Per policy call volumes down over 10% since 2Q12, reflecting better customer experience and resulting in lower costs.
– Productivity management system deployed in Enterprise Operations, improving unit costs and scalability.
Major levers exist to move the needle on cost, scalability and customer experience
– Strategic approach to outsourcing relationships and back office delivery– Platform consolidation and data rationalization– Automation and customer self-service
27
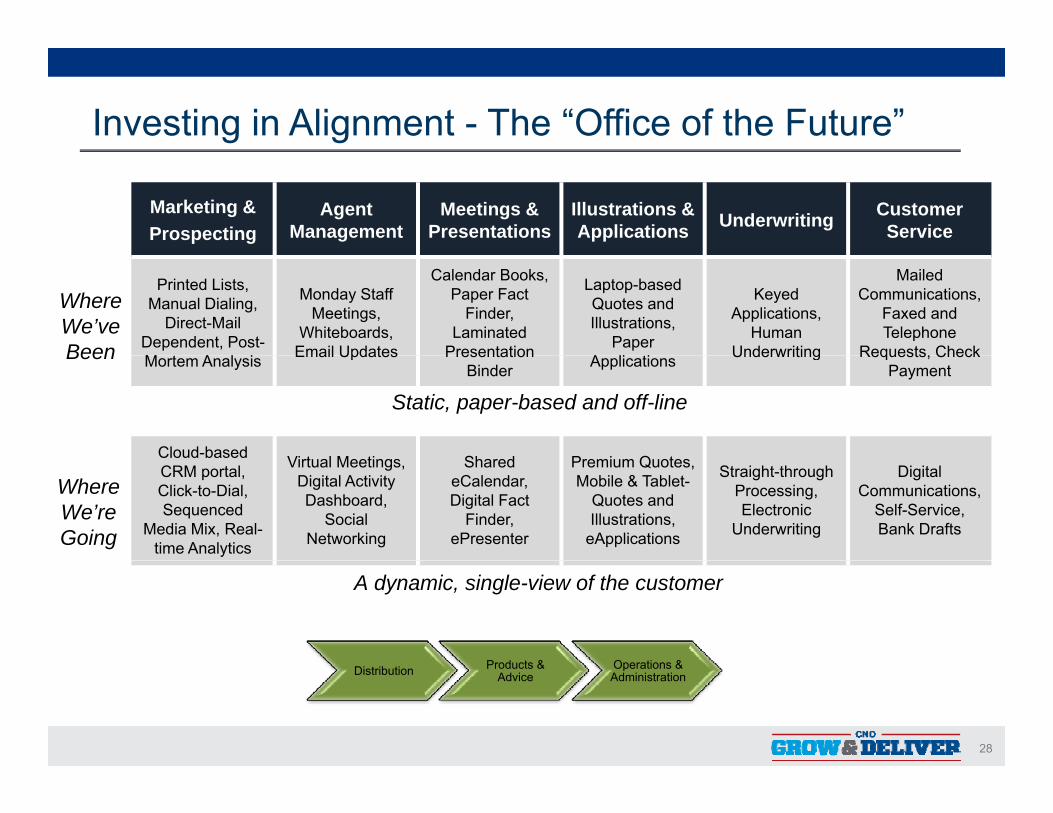
Investing in Alignment - The “Office of the Future”
Marketing &Prospecting
Agent Management
Meetings & Presentations
Illustrations & Applications Underwriting Customer
Service
Printed Lists, Manual Dialing,
Direct-Mail Dependent, Post-M t A l i
Monday Staff Meetings,
Whiteboards, Email Updates
Calendar Books, Paper Fact
Finder, Laminated
Presentation
Laptop-based Quotes and Illustrations,
Paper A li ti
Keyed Applications,
Human Underwriting
Mailed Communications,
Faxed and Telephone
Requests, Check
Where We’ve Been Mortem Analysis Email Updates Presentation
Binder Applications Underwriting Requests, Check Payment
Cloud-based Vi t l M ti Sh d P i Q t
Static, paper-based and off-line
Been
CRM portal, Click-to-Dial, Sequenced
Media Mix, Real-time Analytics
Virtual Meetings, Digital Activity Dashboard,
Social Networking
Shared eCalendar, Digital Fact
Finder, ePresenter
Premium Quotes, Mobile & Tablet-
Quotes and Illustrations,
eApplications
Straight-through Processing, Electronic
Underwriting
Digital Communications,
Self-Service, Bank Drafts
WhereWe’reGoing
A dynamic, single-view of the customer
Products & Operations &
28
Distribution Products & Advice
Operations & Administration
Business Investments
Investments expected to yield annual sales growth of 8% - 10% by the end of 2016
29

Q&A
30
Investments: Search for Risk-Adjusted YieldsEric Johnson – Chief Investment Officer and President 40|86
31
Eric Johnson – Chief Investment Officer and President, 0|8640|86 Advisors
Eric Johnson (53) has been the President of 40|86 Advisors (CNO’s registered investment adviser subsidiary) for 9 years. He has more than 20 years of financial markets and investment experience, beginning with a predecessor bank of J.P. Morgan and Co.
He holds a B.A. with honors in American history from Harvard University, where he graduated cum laude. He is a board member of The Julian Center, and a board member and the Treasurer of the Harvard Club of Indiana.
32
Investment Strategy Tied to Enterprise Needs
Internal core competencies for mainstream asset classes, supplemented with third party talent for more specialized allocations
Active strategic asset allocation process
Post crisis allocation shifts have focused on income and book yield but not excluding relative value
Our approach has produced solid investment performance tested across market cycles
We have been effective at protecting portfolio yields while not compromising portfolio quality
33
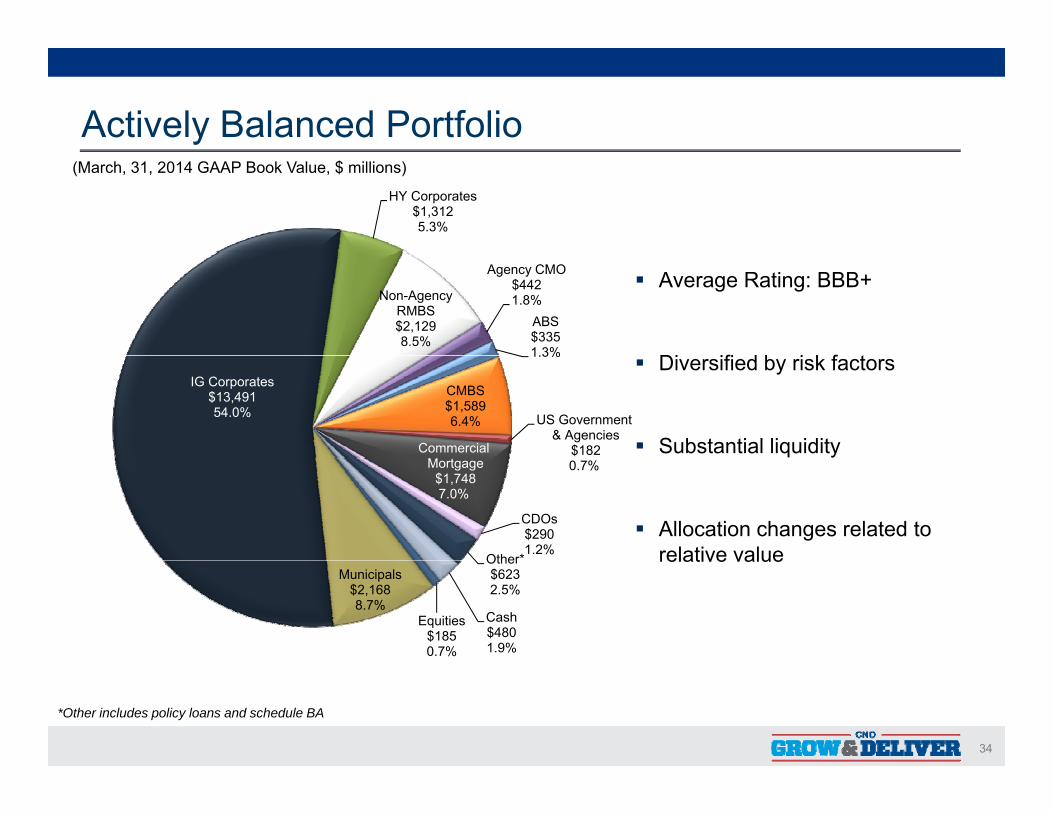
Actively Balanced Portfolio(March, 31, 2014 GAAP Book Value, $ millions)
HY Corporates$1,312 5.3%
Average Rating: BBB+
Di ifi d b i k f t
Non-Agency RMBS$2,129 8.5%
Agency CMO$442 1.8%
ABS$335 1.3%
Diversified by risk factors
Substantial liquidity
IG Corporates$13,491 54.0%
1.3%
CMBS$1,589 6.4% US Government
& Agencies$182 Commercial
Allocation changes related to relative value
0.7%Mortgage$1,748 7.0%
CDOs$290 1.2%
Other* relative value
Equities$185 0.7%
Municipals$2,168 8.7%
Other$623 2.5%
Cash$480 1.9%
34
*Other includes policy loans and schedule BA
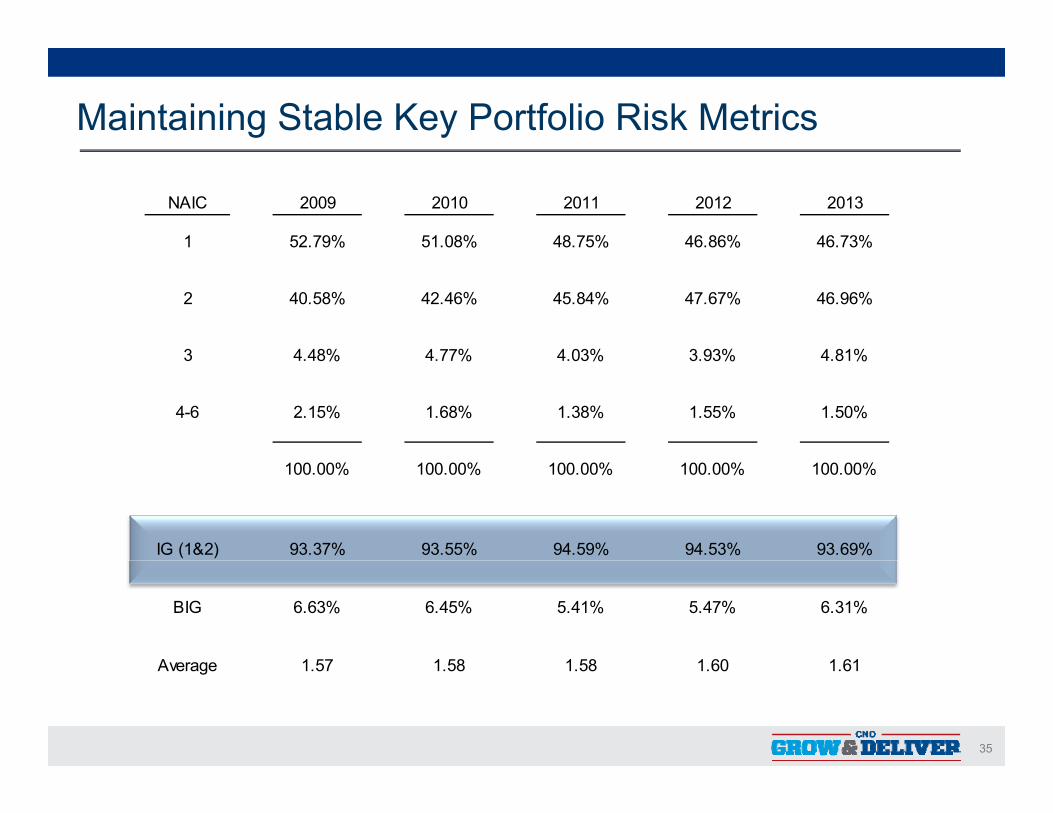
Maintaining Stable Key Portfolio Risk Metrics
NAIC 2009 2010 2011 2012 2013
1 52.79% 51.08% 48.75% 46.86% 46.73%
2 40.58% 42.46% 45.84% 47.67% 46.96%
3 4 48% 4 77% 4 03% 3 93% 4 81%3 4.48% 4.77% 4.03% 3.93% 4.81%
4-6 2.15% 1.68% 1.38% 1.55% 1.50%
100.00% 100.00% 100.00% 100.00% 100.00%
IG (1&2) 93.37% 93.55% 94.59% 94.53% 93.69%
BIG 6.63% 6.45% 5.41% 5.47% 6.31%
Average 1 57 1 58 1 58 1 60 1 61
35
Average 1.57 1.58 1.58 1.60 1.61
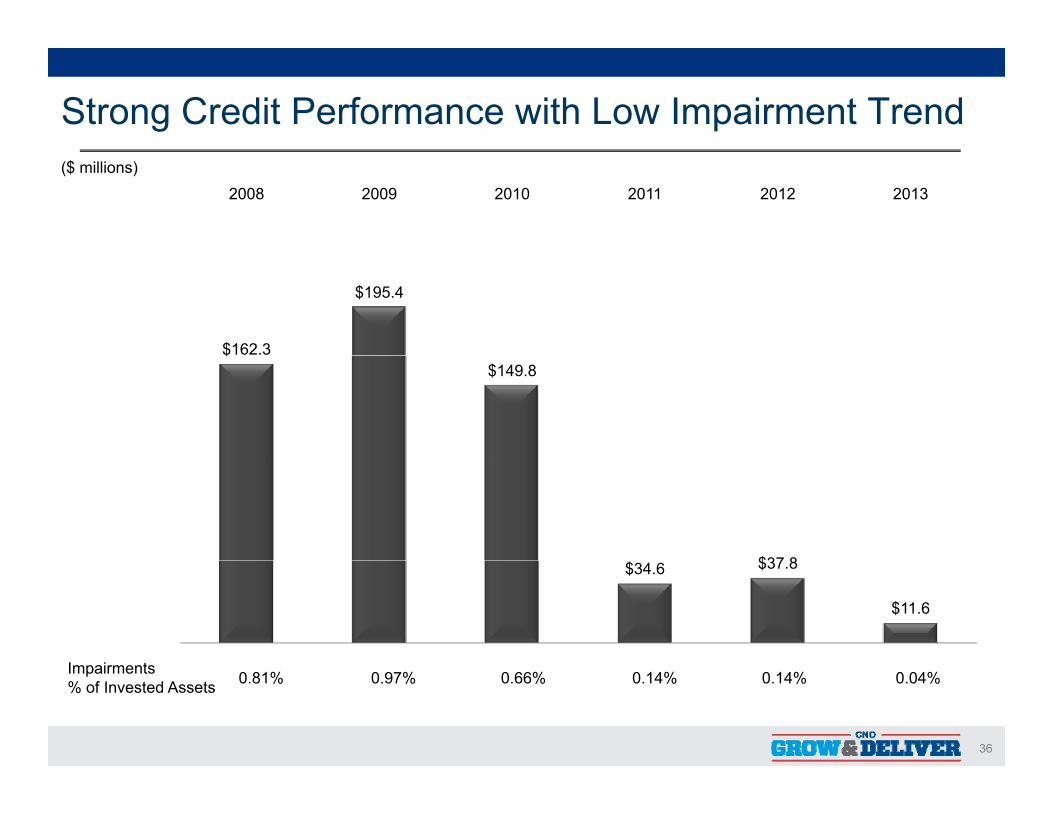
Strong Credit Performance with Low Impairment Trend($ millions)
2008 2009 2010 2011 2012 2013
$162.3
$195.4
$$149.8
$37 8
I i t
$34.6 $37.8
$11.6
36
Impairments% of Invested Assets 0.81% 0.97% 0.66% 0.14% 0.14% 0.04%
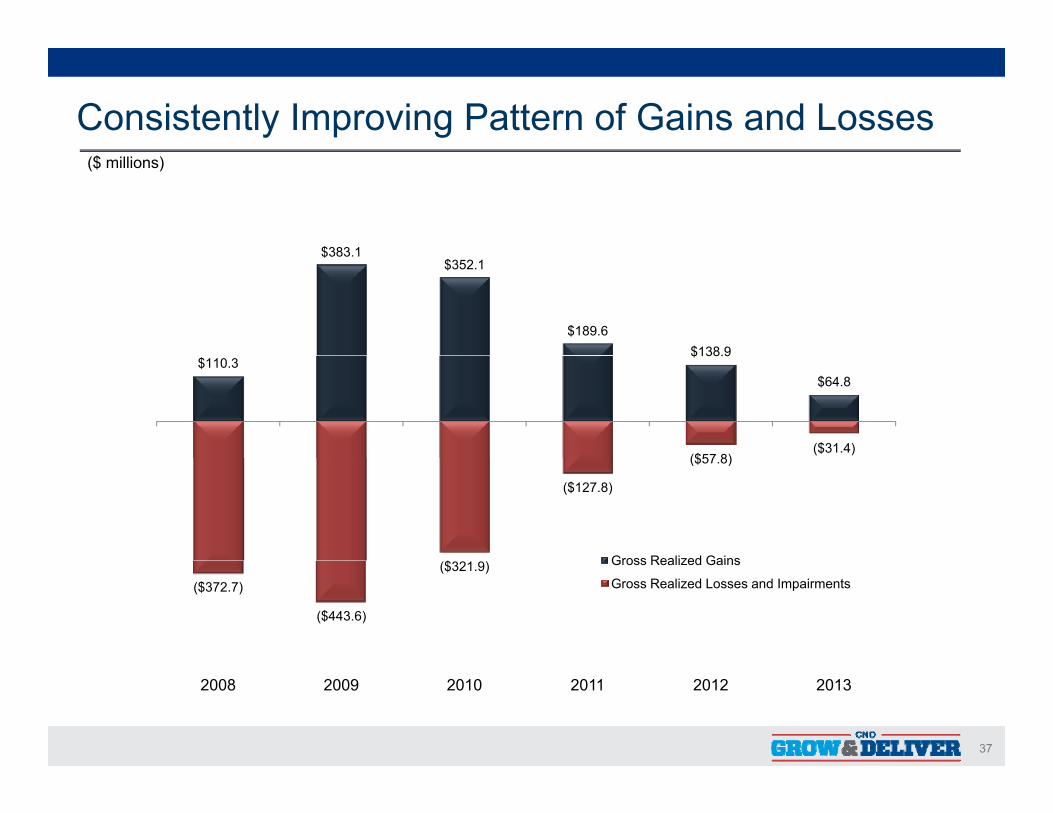
Consistently Improving Pattern of Gains and Losses($ millions)
$383 1$383.1$352.1
$189.6$138.9
$110.3$138.9
$64.8
($57 8)($31.4)
$
($127.8)
($57.8)
Gross Realized Gains
($372.7)
($443.6)
($321.9) Gross Realized Gains
Gross Realized Losses and Impairments
37
2008 2009 2010 2011 2012 2013
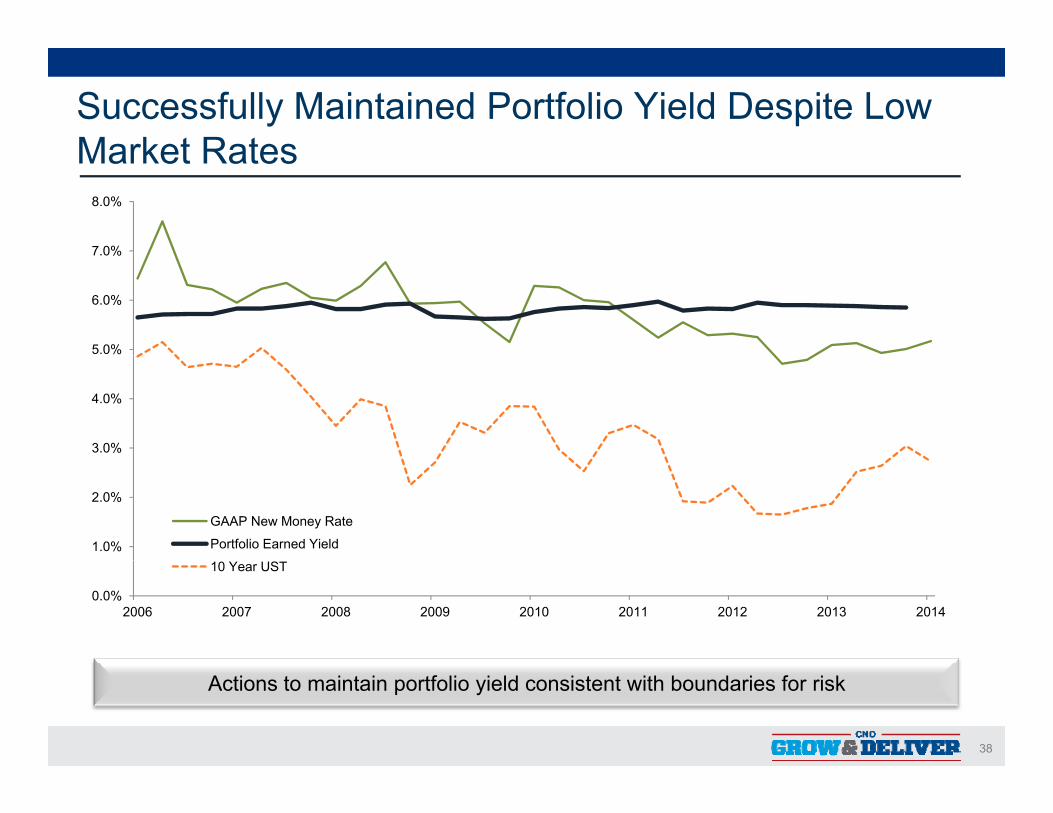
Successfully Maintained Portfolio Yield Despite Low Market RatesMarket Rates
7 0%
8.0%
5.0%
6.0%
7.0%
3.0%
4.0%
1.0%
2.0%
GAAP New Money Rate
Portfolio Earned Yield
0.0%2006 2007 2008 2009 2010 2011 2012 2013 2014
10 Year UST
38
Actions to maintain portfolio yield consistent with boundaries for risk
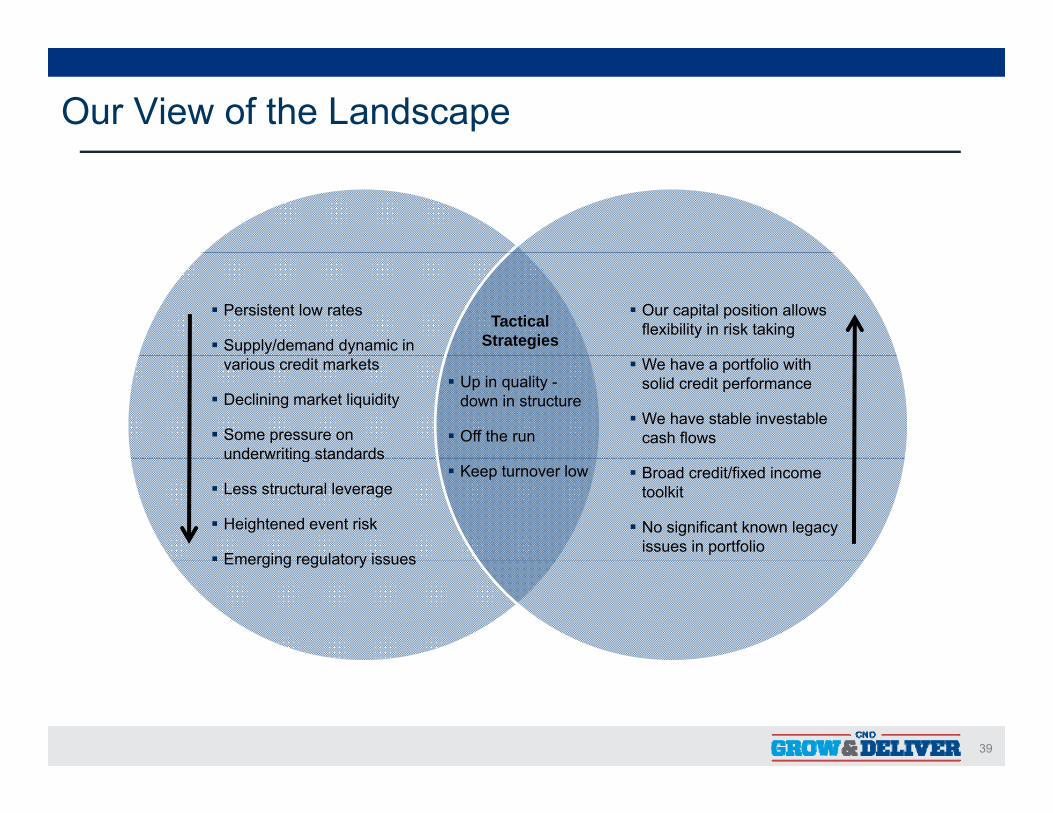
Our View of the Landscape
Our capital position allows flexibility in risk taking
Persistent low rates
Supply/demand dynamic in Tactical
Strategies We have a portfolio with
solid credit performance
We have stable investable cash flows
various credit markets
Declining market liquidity
Some pressure on underwriting standards
Up in quality -down in structure
Off the run
Broad credit/fixed income toolkit
No significant known legacy issues in portfolio
underwriting standards
Less structural leverage
Heightened event risk
Emerging regulatory issues
Keep turnover low
Emerging regulatory issues
39
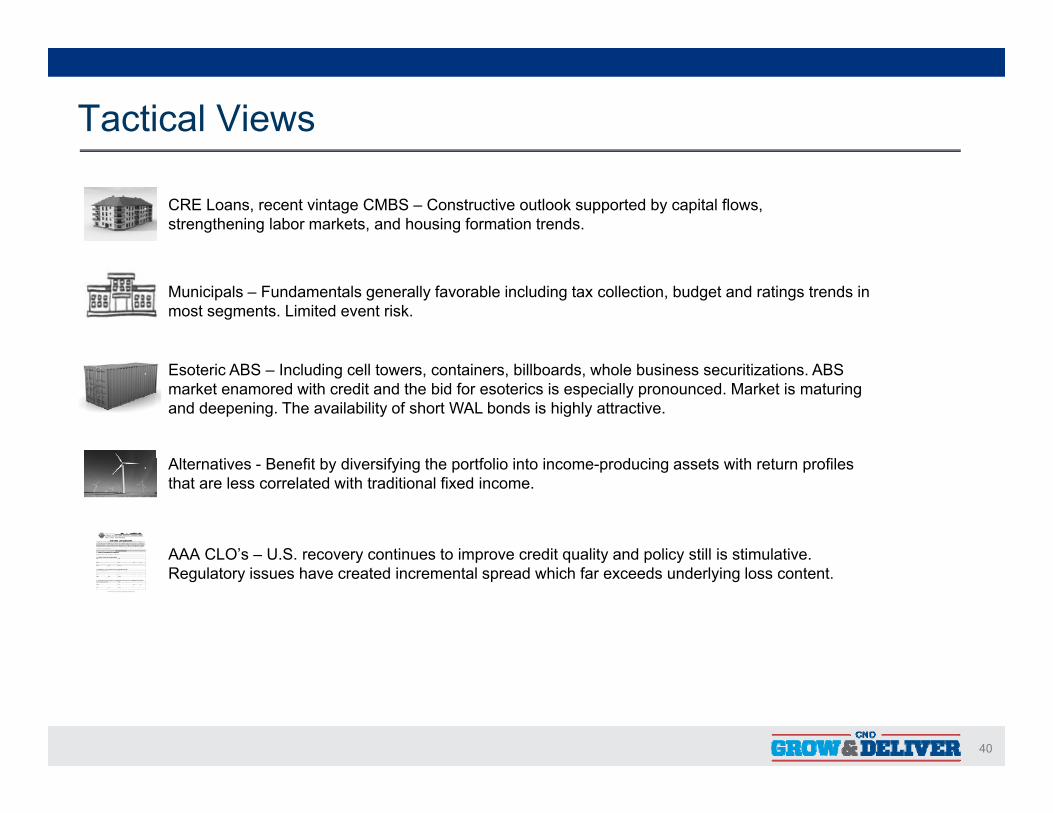
Tactical Views
CRE Loans, recent vintage CMBS – Constructive outlook supported by capital flows, strengthening labor markets, and housing formation trends.
Municipals – Fundamentals generally favorable including tax collection, budget and ratings trends in most segments. Limited event risk.
Esoteric ABS – Including cell towers, containers, billboards, whole business securitizations. ABS market enamored with credit and the bid for esoterics is especially pronounced. Market is maturing and deepening. The availability of short WAL bonds is highly attractive.
Al i B fi b di if i h f li i i d i i h fil
AAA CLO’s – U.S. recovery continues to improve credit quality and policy still is stimulative.
Alternatives - Benefit by diversifying the portfolio into income-producing assets with return profiles that are less correlated with traditional fixed income.
y p q y p yRegulatory issues have created incremental spread which far exceeds underlying loss content.
40
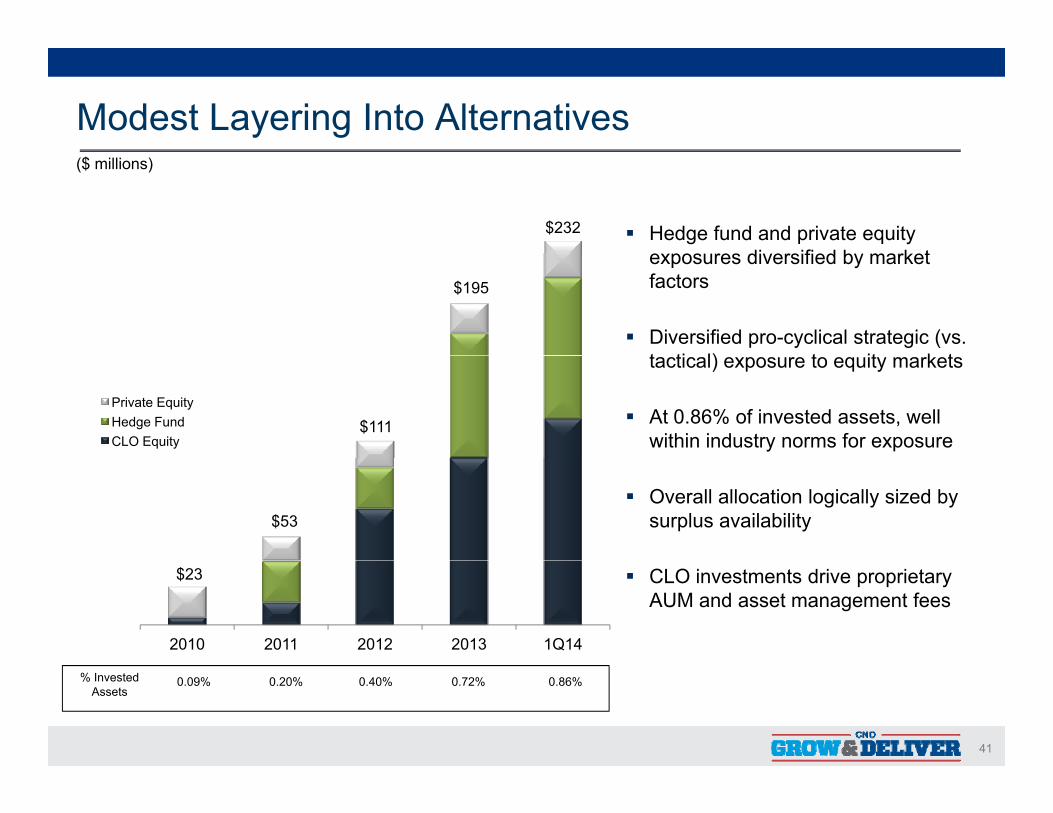
Modest Layering Into Alternatives($ millions)
Hedge fund and private equity di ifi d b k t
$232
exposures diversified by market factors
Diversified pro-cyclical strategic (vs. t ti l) t it k t
$195
tactical) exposure to equity markets
At 0.86% of invested assets, well within industry norms for exposure
$111 Private EquityHedge FundCLO Equity
Overall allocation logically sized by surplus availability$53
CLO investments drive proprietary AUM and asset management fees
$23
2010 2011 2012 2013 1Q14
41
% InvestedAssets
0.09% 0.20% 0.40% 0.72% 0.86%
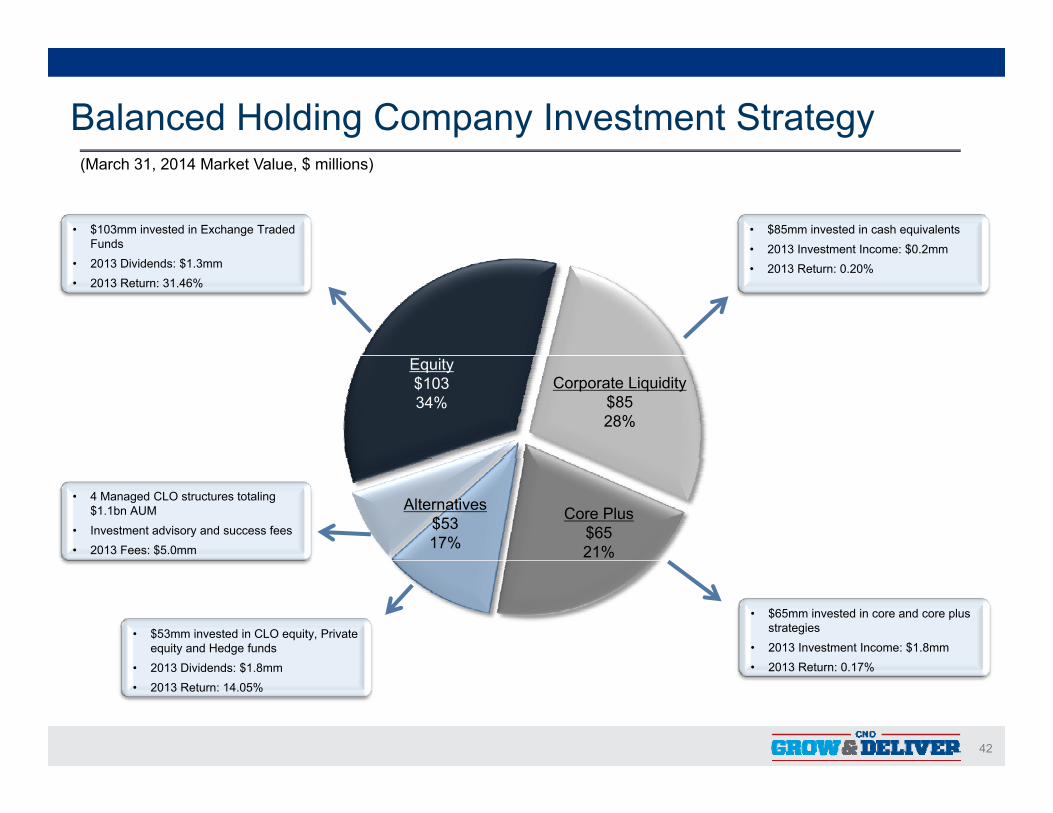
Balanced Holding Company Investment Strategy
• $85mm invested in cash equivalents• 2013 Investment Income: $0.2mm
• $103mm invested in Exchange Traded Funds
(March 31, 2014 Market Value, $ millions)
2013 Investment Income: $0.2mm• 2013 Return: 0.20%• 2013 Dividends: $1.3mm
• 2013 Return: 31.46%
Corporate Liquidity$8528%
Equity$10334%
Core Plus$6521%
Alternatives$5317%
• 4 Managed CLO structures totaling $1.1bn AUM
• Investment advisory and success fees• 2013 Fees: $5.0mm
• $65mm invested in core and core plus strategies
• 2013 Investment Income: $1.8mm2013 R t 0 17%
• $53mm invested in CLO equity, Private equity and Hedge funds
$
42
• 2013 Return: 0.17%• 2013 Dividends: $1.8mm• 2013 Return: 14.05%
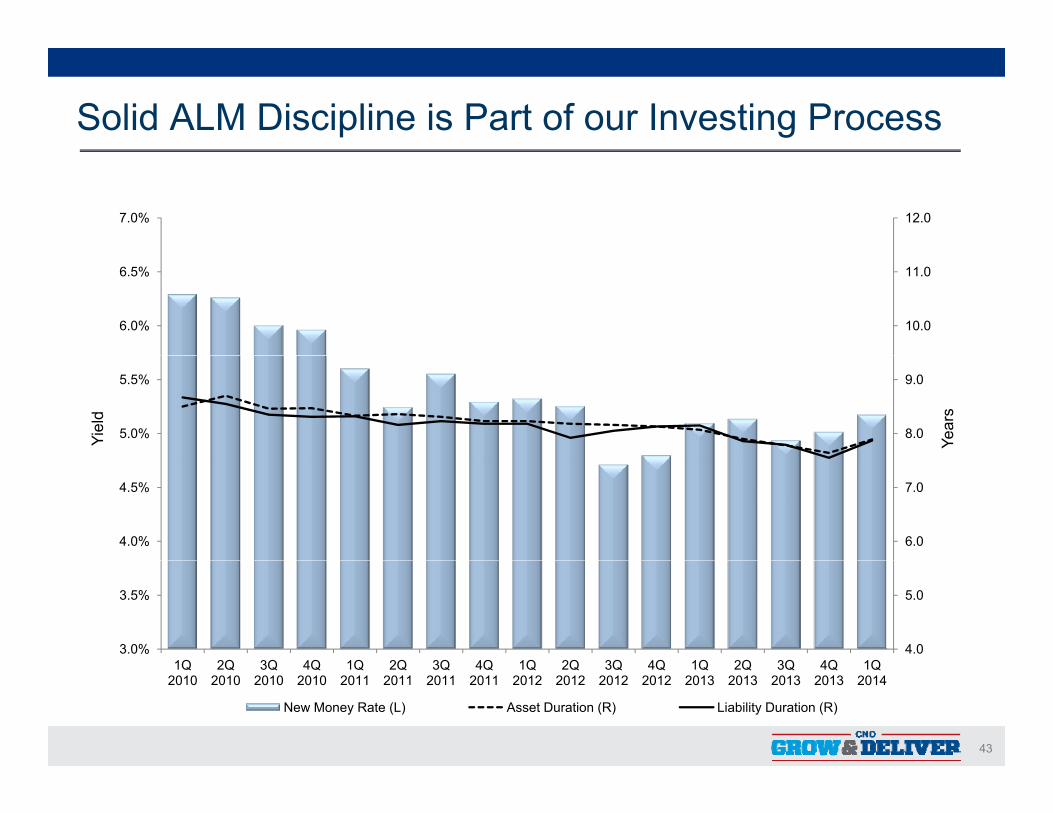
Solid ALM Discipline is Part of our Investing Process
12.07.0%
10.0
11.0
6.0%
6.5%
Yiel
d
Year
s
8.0
9.0
5.0%
5.5%
6.0
7.0
4.0%
4.5%
4.0
5.0
3.0%
3.5%
1Q 2Q 3Q 4Q 1Q 2Q 3Q 4Q 1Q 2Q 3Q 4Q 1Q 2Q 3Q 4Q 1Q
43
1Q 2010
2Q 2010
3Q 2010
4Q 2010
1Q 2011
2Q 2011
3Q 2011
4Q 2011
1Q 2012
2Q 2012
3Q 2012
4Q 2012
1Q 2013
2Q 2013
3Q 2013
4Q 2013
1Q 2014
New Money Rate (L) Asset Duration (R) Liability Duration (R)
Key Takeaways on Investments
We have a clear and transparent approach
We are maintaining our portfolio yield
Credit performance has been strong
Stringent asset liability standards
44
Q&A
45
Managing Our Long-Term Care BusinessChris Nickele – EVP Product ManagementChris Nickele EVP, Product Management
Tim Bischof – SVP, Corporate Actuary & ERMLoretta Jacobs – VP, LTC
46
Chris Nickele – EVP, Product Management
Chris Nickele (57) joined CNO in October 2005 as executive vice president, product ( ) j p , pmanagement, and was named additionally to head a new business segment - Other CNO Business - in April 2010. Nickele is responsible for the development, pricing and management of product on an enterprise-wide basis, overseeing activities at the Washington National, Bankers Life and Colonial Penn segments, as well as managing the profitability of blocks of business that are no longer being sold or
k t d b CNOmarketed by CNO.
Nickele has more than 35 years of experience in the insurance industry, specializing in the area of product development. Nickele joined CNO from Lincoln Financial Group, where he served as vice president and general manager of its First Penn-Pacific subsidiary Previously he held key actuarial positions at Zurich Kemper LifePacific subsidiary. Previously, he held key actuarial positions at Zurich Kemper Life, and Bankers Life and Casualty.
Nickele holds a bachelor's degree in mathematics from the University of Notre Dame. He is a Fellow of the Society of Actuaries, a member of the American Academy of Actuaries, and a participant of the Ad Hoc Committee on Regulation XXX.p p g
47
Tim Bischof – SVP, Corporate Actuary & ERM
Tim Bischof (42) was named Senior Vice President, Corporate Actuary & Enterprise Risk Management for CNO Financial Group Inc on January 7 2013Risk Management for CNO Financial Group, Inc., on January 7, 2013.
Bischof joined CNO in 2001, and has steadily progressed through a wide variety of actuarial and finance roles. In his current role, Bischof is responsible for overseeing and coordinating the enterprise risk management process in conjunction with CNO’s Enterprise Risk Management Committee. His Corporate Actuarial responsibilities p g p pinclude oversight of experience analysis, actuarial controls, assumption and model governance, reinsurance, actuarial analysis for mergers and acquisitons, and coordinated support for asset liability management, .
Prior to CNO, he spent six years as an actuary with Indianapolis Life Insurance Co. and CIGNA Corp.
Bischof is a frequent presenter at Society of Actuaries and enterprise risk management forums. Bischof, earned a Bachelor of Science degree in mathematics and education from Rockhurst College, and a Master of Science in statistics from the University of Iowa He is a Fellow of the Society of Actuaries (FSA) and a Member of the AmericanIowa. He is a Fellow of the Society of Actuaries (FSA) and a Member of the American Academy of Actuaries (MAAA).
48
Loretta Jacobs – VP, LTC
Loretta Jacobs (49) joined Bankers Life in May 2013 as Vice-President of the company’s Long Term Care (LTC) business. In this role, she directly oversees the LTC claims and policyholder service departments and partners with product and valuation actuaries.
J b j i d B k f E t & Y h h l d it LTC t i l dit dJacobs joined Bankers from Ernst & Young, where she led its LTC actuarial audit and advisory services practice, and she has over 20 years of insurance industry experience, including LTC actuarial and operational leadership roles at CNA, John Hancock Mutual Life Insurance and Milliman. She is a Fellow of the Society of Actuaries (FSA) and a member of the American Academy of Actuaries (MAAA). She completed a three-year term on the SOA LTC Section Council in October 2009 is acompleted a three year term on the SOA LTC Section Council in October 2009, is a frequent speaker at industry conferences and has served as Assistant Editor of the SOA's monthly newsletter, The Actuary. Jacobs graduated with high honors from the University of Notre Dame with a Bachelor of Science in Mathematics.
49
Panel Session - LTC Working Group
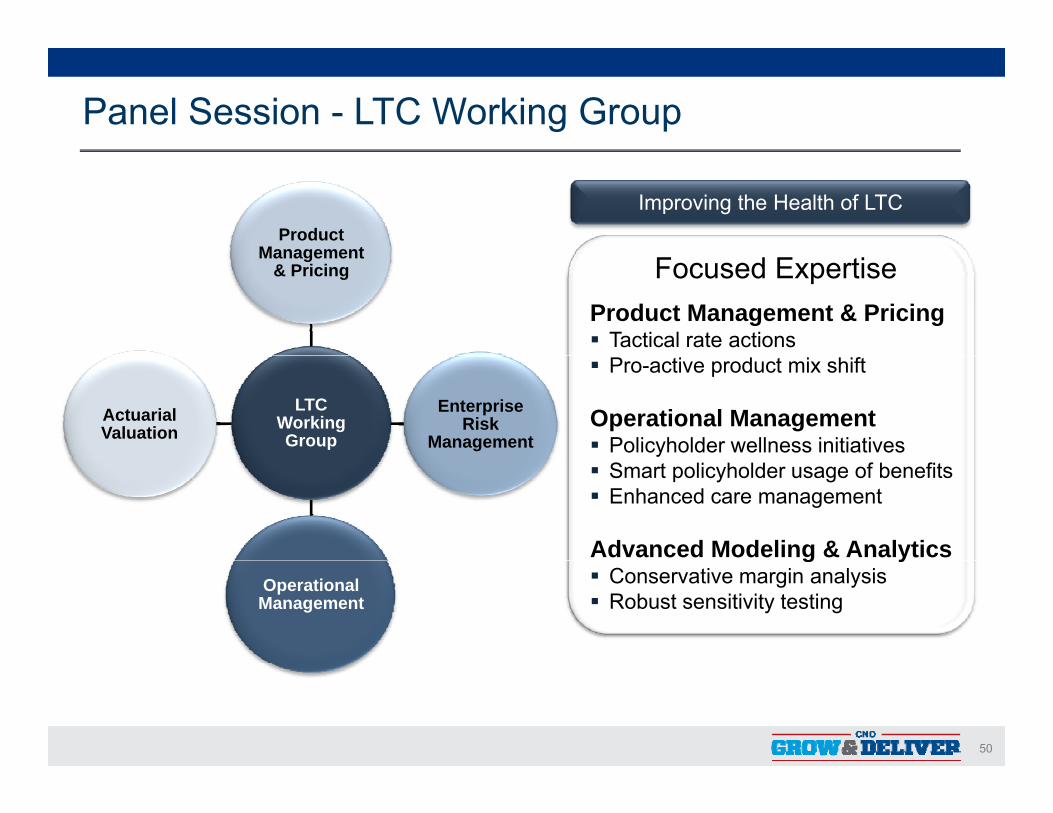
Product Management
Improving the Health of LTC
Management & Pricing Focused Expertise
Product Management & Pricing Tactical rate actions
LTC Working Group
Enterprise Risk
ManagementActuarial Valuation
Pro-active product mix shift
Operational Management Policyholder wellness initiatives Smart policyholder usage of benefits Enhanced care management
Advanced Modeling & AnalyticsOperational Management
g y Conservative margin analysis Robust sensitivity testing
50
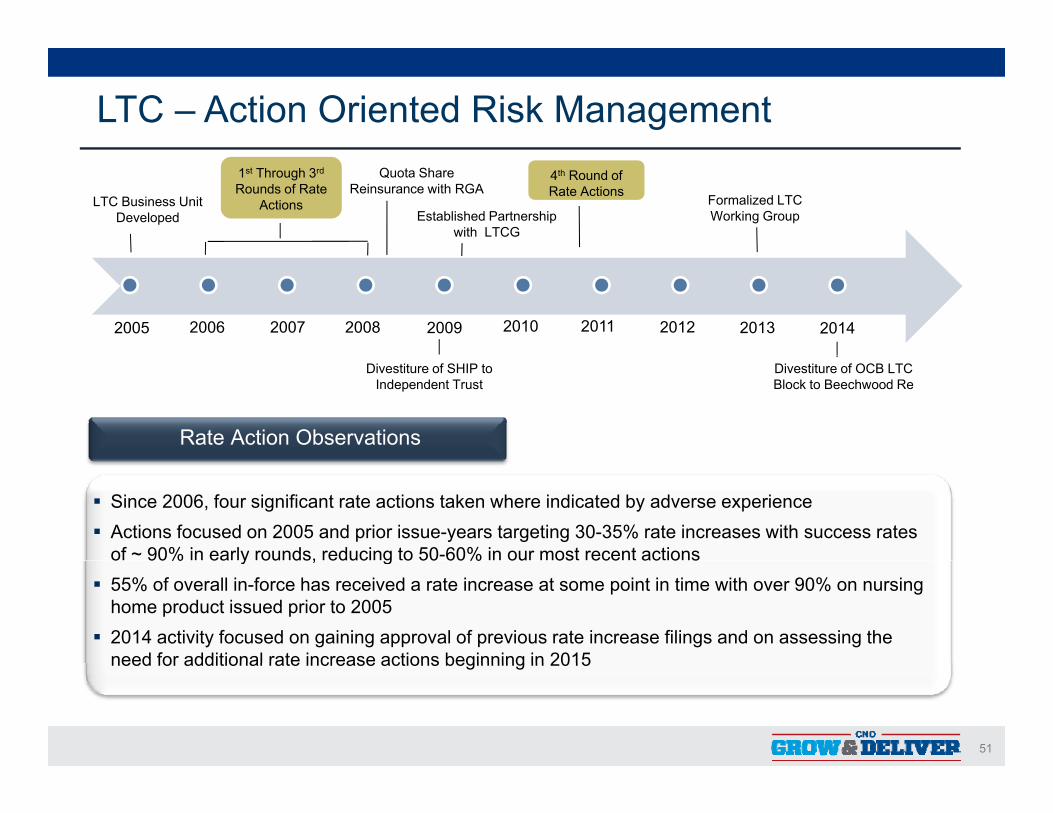
LTC – Action Oriented Risk Management
LTC Business Unit Developed
1st Through 3rd
Rounds of Rate Actions
Quota Share Reinsurance with RGA
4th Round of Rate Actions Formalized LTC
Working GroupEstablished Partnership with LTCG
2006 20142008 2010 20122005 2007 2009 2011 2013
Divestiture of SHIP to Independent Trust
Divestiture of OCB LTC Block to Beechwood Re
Rate Action Observations
Since 2006, four significant rate actions taken where indicated by adverse experience Actions focused on 2005 and prior issue-years targeting 30-35% rate increases with success rates
of ~ 90% in early rounds, reducing to 50-60% in our most recent actions o 90% ea y ou ds, educ g o 50 60% ou os ece ac o s 55% of overall in-force has received a rate increase at some point in time with over 90% on nursing
home product issued prior to 2005 2014 activity focused on gaining approval of previous rate increase filings and on assessing the
need for additional rate increase actions beginning in 2015
51
need for additional rate increase actions beginning in 2015
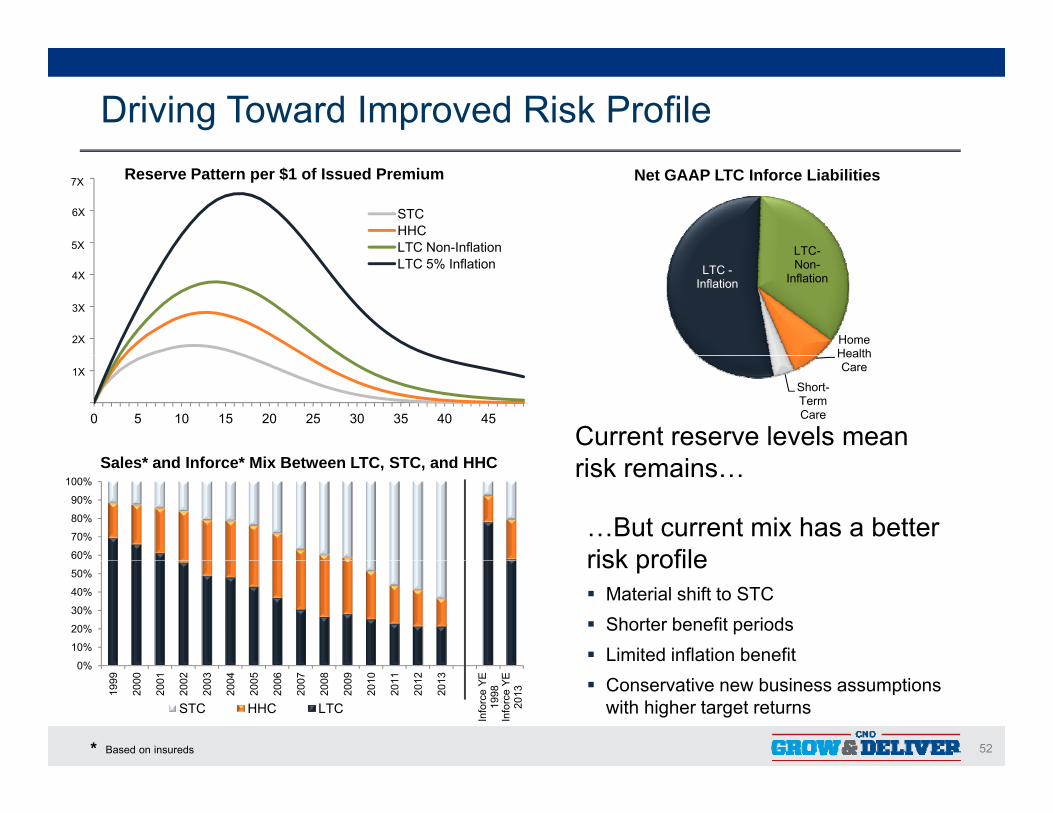
Driving Toward Improved Risk ProfileReserve Pattern per $1 of Issued Premium Net GAAP LTC Inforce Liabilities7X
LTC-
6X
5X
STCHHCLTC Non-Inflation
LTC -Inflation
LTCNon-
Inflation
Home Health
4X
3X
2X
LTC 5% Inflation
S l * d I f * Mi B t LTC STC d HHCCurrent reserve levels mean i k i
Health Care
Short-Term Care
1X
0 5 10 15 20 25 30 35 40 45
60%
70%
80%
90%
100%
…But current mix has a better risk profile
Sales* and Inforce* Mix Between LTC, STC, and HHC risk remains…
0%
10%
20%
30%
40%
50%risk profile Material shift to STC Shorter benefit periods Limited inflation benefit
52
0%
1999
2000
2001
2002
2003
2004
2005
2006
2007
2008
2009
2010
2011
2012
2013
Info
rce
YE
1998
Info
rce
YE
2013
STC HHC LTC Conservative new business assumptions
with higher target returns
* Based on insureds
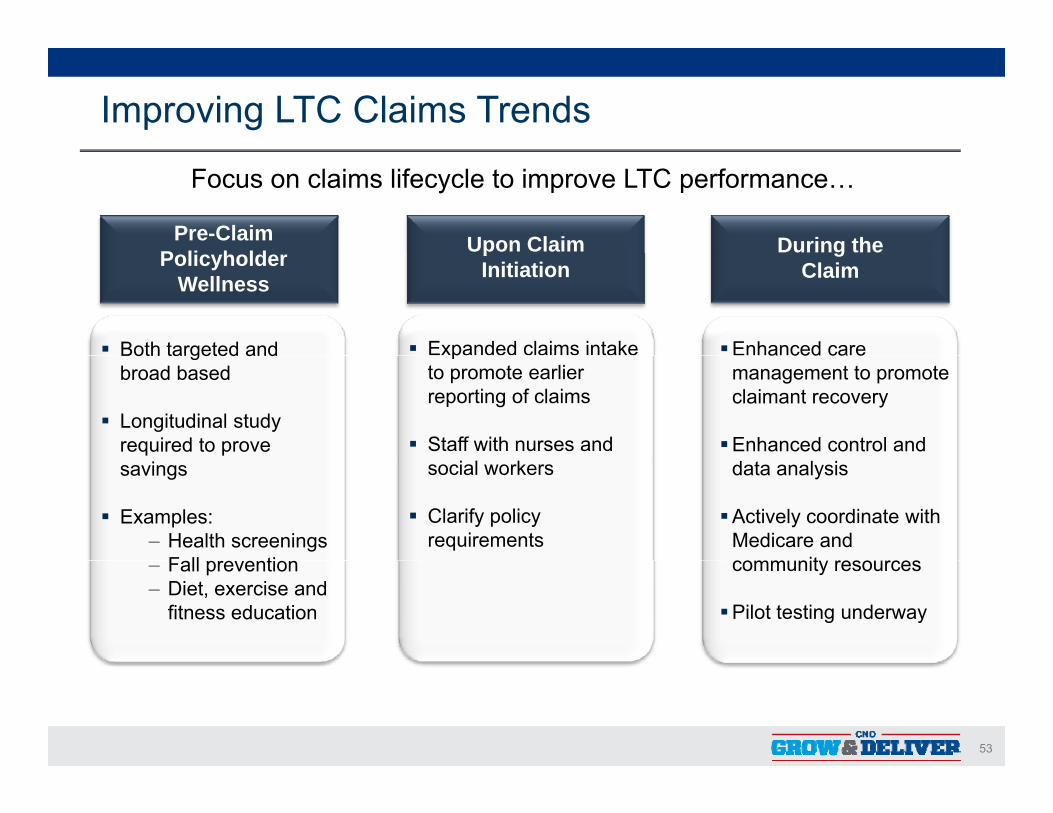
Improving LTC Claims Trends
Focus on claims lifecycle to improve LTC performance…
Upon Claim During the Pre-Claim P li h ld p
Initiationg
Claim
Both targeted and Expanded claims intake Enhanced care
Policyholder Wellness
Both targeted and broad based
Longitudinal study required to prove
pto promote earlier reporting of claims
Staff with nurses and
a ced ca emanagement to promote claimant recovery
Enhanced control and savings
Examples:‒ Health screenings
F ll ti
social workers
Clarify policy requirements
data analysis
Actively coordinate with Medicare and comm nit reso rces‒ Fall prevention
‒ Diet, exercise and fitness education
community resources
Pilot testing underway
53
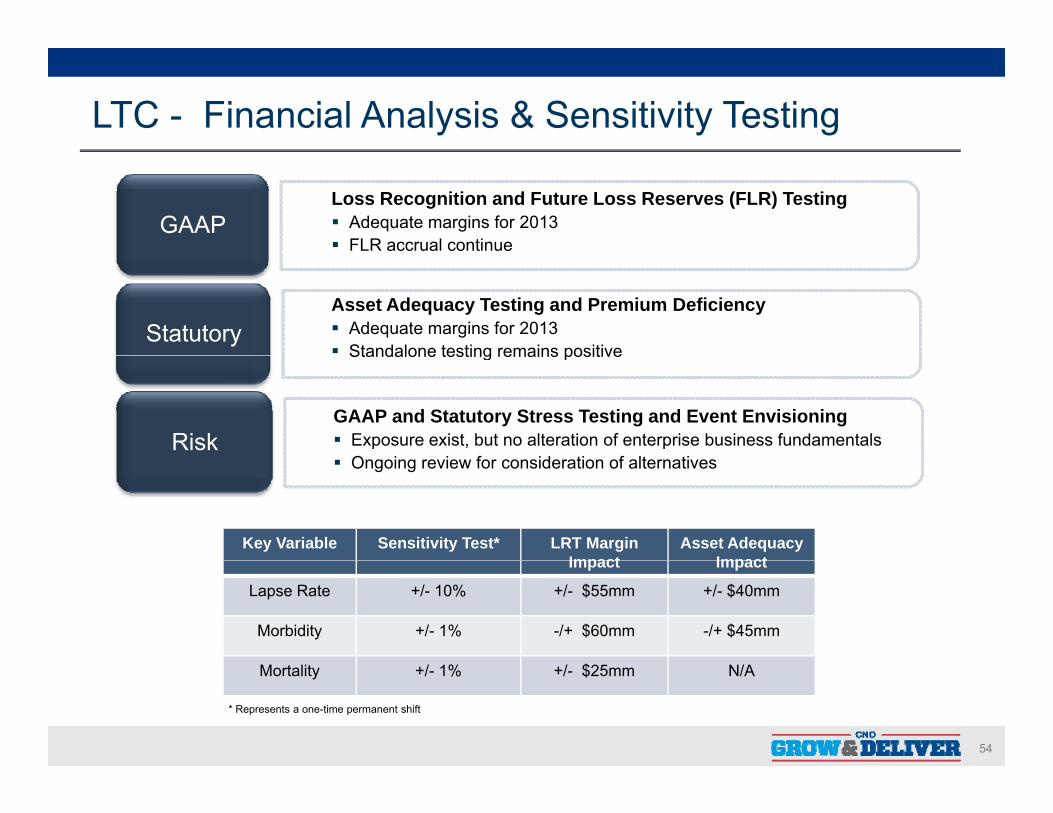
LTC - Financial Analysis & Sensitivity Testing
GAAPLoss Recognition and Future Loss Reserves (FLR) Testing Adequate margins for 2013 FLR accrual continue
StatutoryAsset Adequacy Testing and Premium Deficiency Adequate margins for 2013 Standalone testing remains positive
Risk
Standalone testing remains positive
GAAP and Statutory Stress Testing and Event Envisioning Exposure exist, but no alteration of enterprise business fundamentals
O i i f id ti f lt ti
Key Variable Sensitivity Test* LRT Margin Impact
Asset AdequacyImpact
Ongoing review for consideration of alternatives
Impact Impact
Lapse Rate +/- 10% +/- $55mm +/- $40mm
Morbidity +/- 1% -/+ $60mm -/+ $45mm
54
Mortality +/- 1% +/- $25mm N/A
* Represents a one-time permanent shift
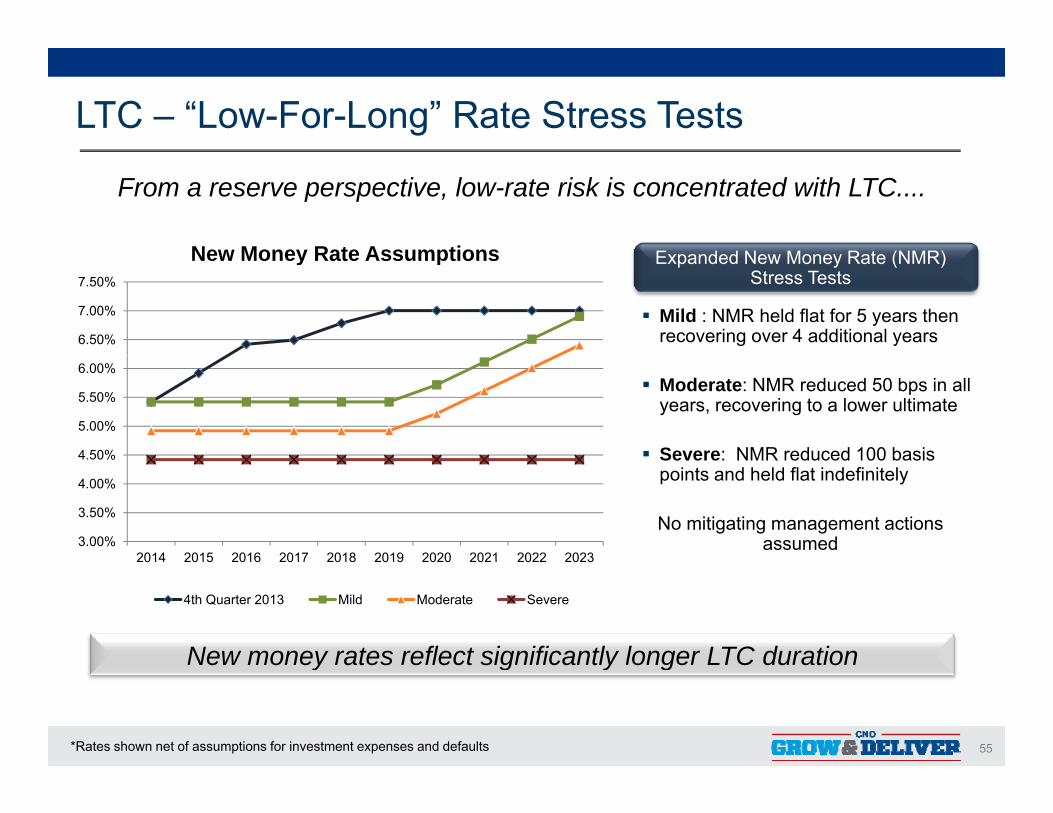
LTC – “Low-For-Long” Rate Stress Tests
E d d N M R t (NMR)
From a reserve perspective, low-rate risk is concentrated with LTC....
New Money Rate Assumptions
Mild : NMR held flat for 5 years then recovering over 4 additional years
Expanded New Money Rate (NMR) Stress Tests
6.50%
7.00%
7.50%
New Money Rate Assumptions
Moderate: NMR reduced 50 bps in all years, recovering to a lower ultimate
Severe: NMR reduced 100 basis4 50%
5.00%
5.50%
6.00%
Severe: NMR reduced 100 basis points and held flat indefinitely
No mitigating management actions assumed 3.00%
3.50%
4.00%
4.50%
2014 2015 2016 2017 2018 2019 2020 2021 2022 20232014 2015 2016 2017 2018 2019 2020 2021 2022 2023
4th Quarter 2013 Mild Moderate Severe
New money rates reflect significantly longer LTC duration
55*Rates shown net of assumptions for investment expenses and defaults
New money rates reflect significantly longer LTC duration
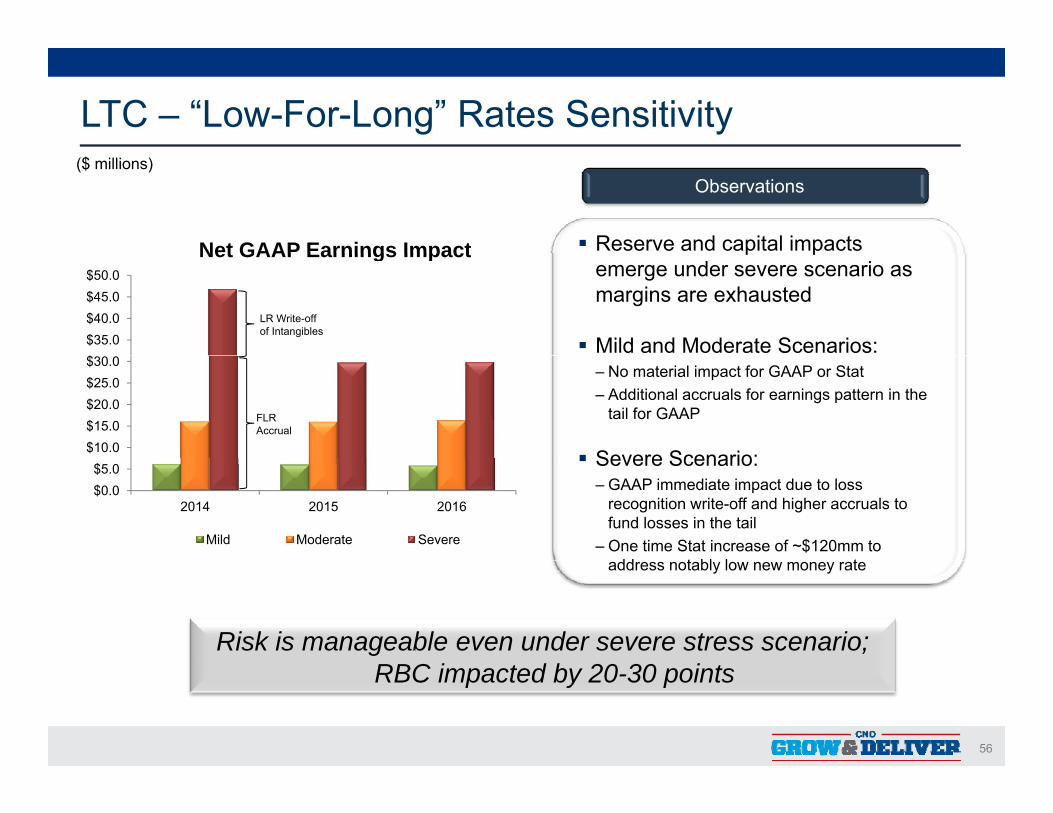
LTC – “Low-For-Long” Rates Sensitivity
Observations
Reserve and capital impacts Net GAAP Earnings Impact
($ millions)
p pemerge under severe scenario as margins are exhausted
Mild and Moderate Scenarios: $$35.0$40.0$45.0$50.0
Net GAAP Earnings Impact
LR Write-offof Intangibles
‒ No material impact for GAAP or Stat‒ Additional accruals for earnings pattern in the
tail for GAAP
Severe Scenario:$10.0$15.0$20.0$25.0$30.0
FLR Accrual
Severe Scenario: ‒ GAAP immediate impact due to loss
recognition write-off and higher accruals to fund losses in the tail
‒ One time Stat increase of ~$120mm to dd t bl l t
$0.0$5.0
2014 2015 2016
Mild Moderate Severe
address notably low new money rate
Risk is manageable even under severe stress scenario; C
56
RBC impacted by 20-30 points
LTC - Important Takeaways
A Comprehensive Strategy
Rate actions when supported by adverse experience
Actively engaged with the reinsurance community
Mix of new business drives a better risk profile in time
Several initiatives to improve care and “bend the claims curve”
Capital ratios dialed-in to withstand LTC stress scenarios
Working with industry groups, legislators and regulators to create a sustainable environmentsustainable environment
We have a comprehensive strategy for managing risk on protection products that are critical to the middle market.
57
p

Q&A
58
A Look Inside Our Financial Plan“B ildi th M t ”“Building on the Momentum”
Fred Crawford - CFO
59
Fred Crawford – Chief Financial Officer
Fred Crawford (50) was named executive vice president and chief financial officer for CNO Financial Group, Inc., effective January 2012.
Crawford formerly served as executive vice president and head of Corporate Development and Investments for Lincoln Financial Group. He joined Lincoln Financial Group in 2001 as vice president and corporate treasurer and went on to serve as senior vice president and chief financial officer in 2005 and executive vice president and chief financial officer in 2008.
Prior to joining Lincoln Financial, Crawford was with Bank One Corporation where his roles included President Bank One Cincinnati and Northern Kentuckyroles included President, Bank One Cincinnati and Northern Kentucky.
Other outside involvement includes Board Member of United Way of Central Indiana.
Crawford earned a Bachelor of Arts degree in marketing from Indiana State University and an MBA from the University of Iowa.University and an MBA from the University of Iowa.
60
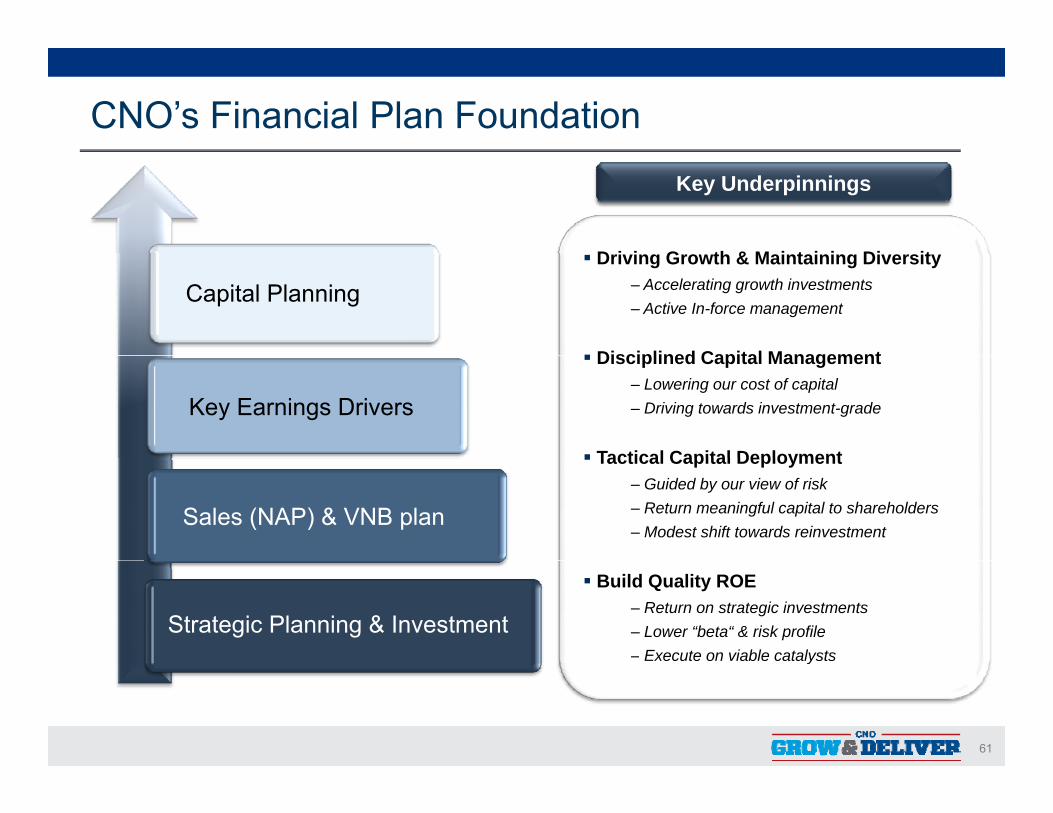
CNO’s Financial Plan Foundation
Key Underpinnings
D i i G th & M i t i i Di it
Capital Planning Driving Growth & Maintaining Diversity
‒ Accelerating growth investments ‒ Active In-force management
Disciplined Capital Management
Key Earnings Drivers
Disciplined Capital Management‒ Lowering our cost of capital ‒ Driving towards investment-grade
Tactical Capital Deployment
Sales (NAP) & VNB plan
Tactical Capital Deployment‒ Guided by our view of risk‒ Return meaningful capital to shareholders‒ Modest shift towards reinvestment
Strategic Planning & Investment
Build Quality ROE ‒ Return on strategic investments‒ Lower “beta“ & risk profile‒ Execute on viable catalysts
61
y
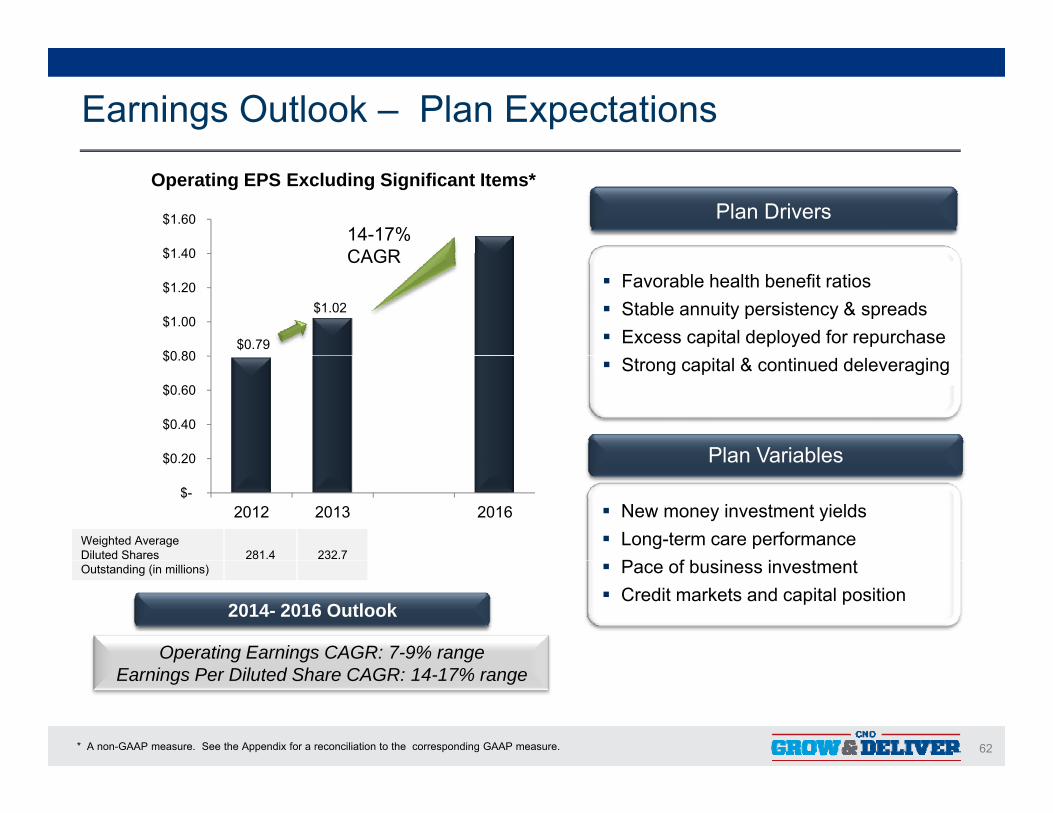
Earnings Outlook – Plan Expectations
$1 40
$1.60 Plan DriversOperating EPS Excluding Significant Items*
14-17% CAGR
$0.79
$1.02
$0 80
$1.00
$1.20
$1.40
Favorable health benefit ratios Stable annuity persistency & spreads Excess capital deployed for repurchase
CAGR
$0 20
$0.40
$0.60
$0.80 Strong capital & continued deleveraging
Plan Variables$-
$0.20
2012 2013 2016
Plan Variables
New money investment yields Long-term care performance
P f b i i t tWeighted Average Diluted Shares 281.4 232.7
Pace of business investment Credit markets and capital position
2014- 2016 Outlook
Operating Earnings CAGR: 7-9% range
Outstanding (in millions)
62
Earnings Per Diluted Share CAGR: 14-17% range
* A non-GAAP measure. See the Appendix for a reconciliation to the corresponding GAAP measure.
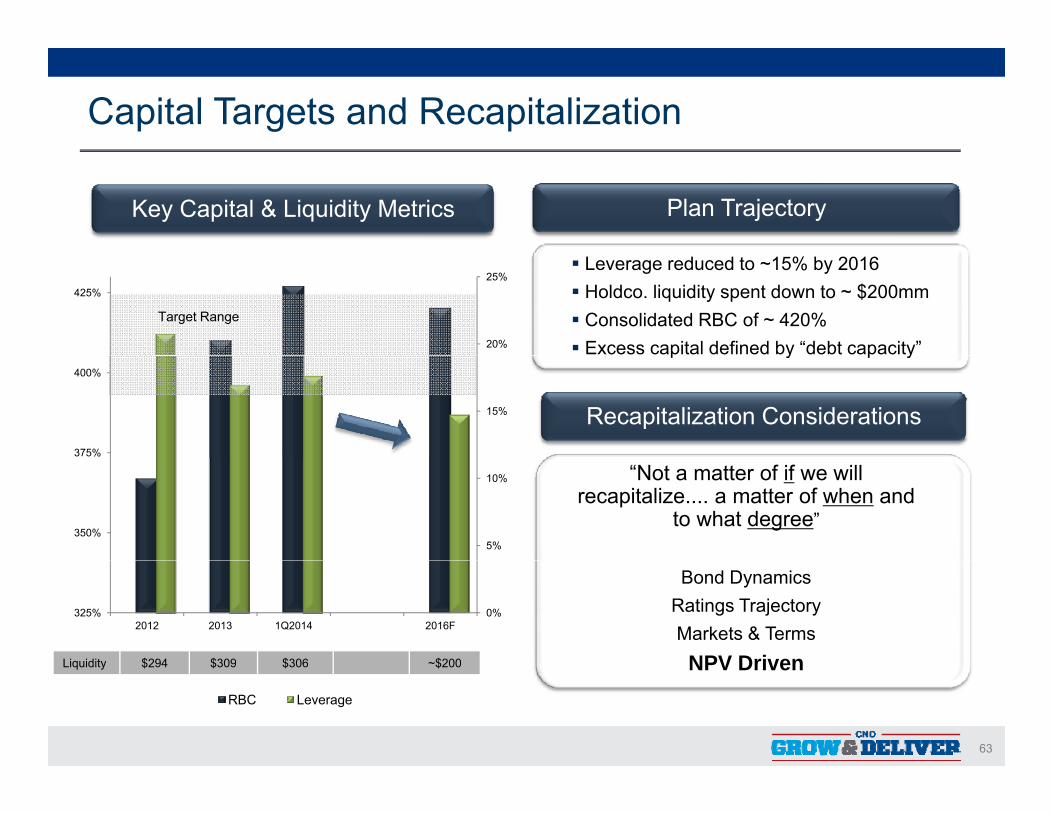
Capital Targets and Recapitalization
Key Capital & Liquidity Metrics Plan Trajectory
20%
25%425%
Leverage reduced to ~15% by 2016 Holdco. liquidity spent down to ~ $200mm Consolidated RBC of ~ 420% Excess capital defined by “debt capacity”
Target Range
15%
375%
400%
Recapitalization Considerations
p y p y
5%
10%
350%
“Not a matter of if we will recapitalize.... a matter of when and
to what degree”
0%325%2012 2013 1Q2014 2016F
Bond DynamicsRatings TrajectoryMarkets & TermsNPV DrivenLiquidity $294 $309 $306 ~$200
63
RBC Leverage
NPV DrivenLiquidity $294 $309 $306 ~$200
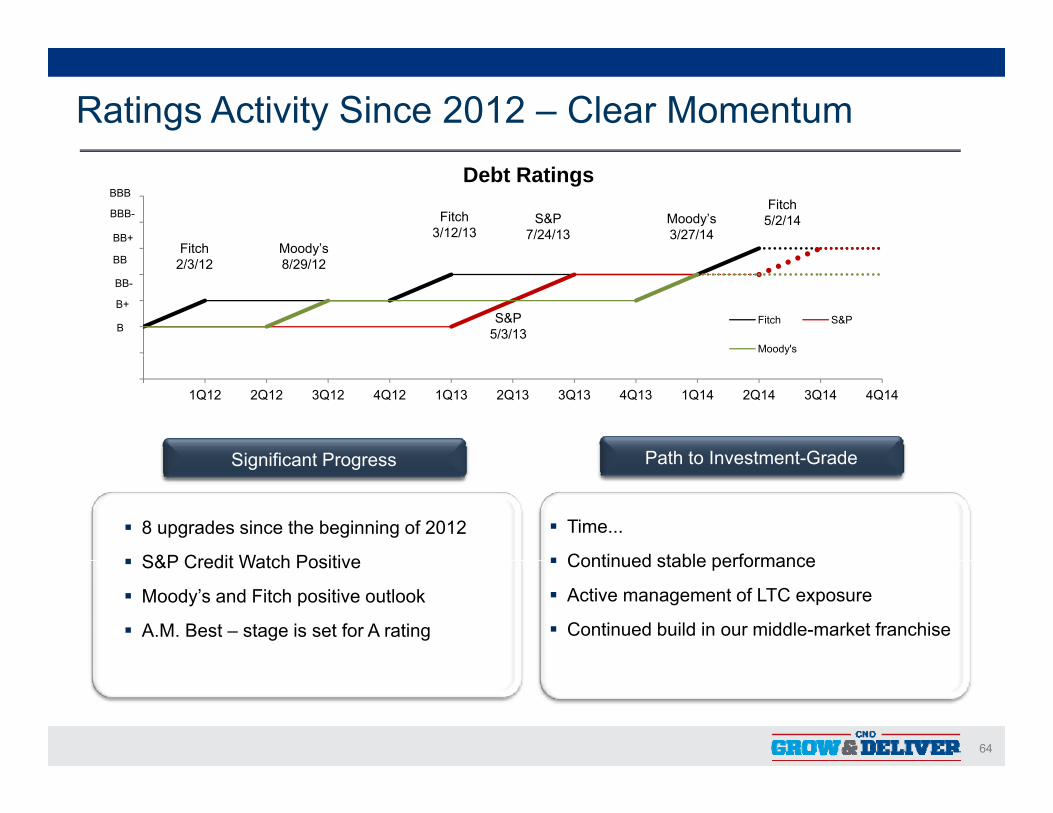
Ratings Activity Since 2012 – Clear Momentum
BB+
BBB-
BBB
Moody’s
Fitch 3/12/13
S&P 7/24/13
Moody’s 3/27/14
Fitch
Fitch 5/2/14
Debt Ratings
Fitch S&P
Moody's
BB
BB-
B+
B
oody s8/29/12
S&P 5/3/13
tc2/3/12
1Q12 2Q12 3Q12 4Q12 1Q13 2Q13 3Q13 4Q13 1Q14 2Q14 3Q14 4Q14
Path to Investment GradeSignificant Progress
8 upgrades since the beginning of 2012
S&P Credit Watch Positive
Path to Investment-Grade
Time...
Continued stable performance
Significant Progress
S&P Credit Watch Positive
Moody’s and Fitch positive outlook
A.M. Best – stage is set for A rating
Continued stable performance
Active management of LTC exposure
Continued build in our middle-market franchise
64
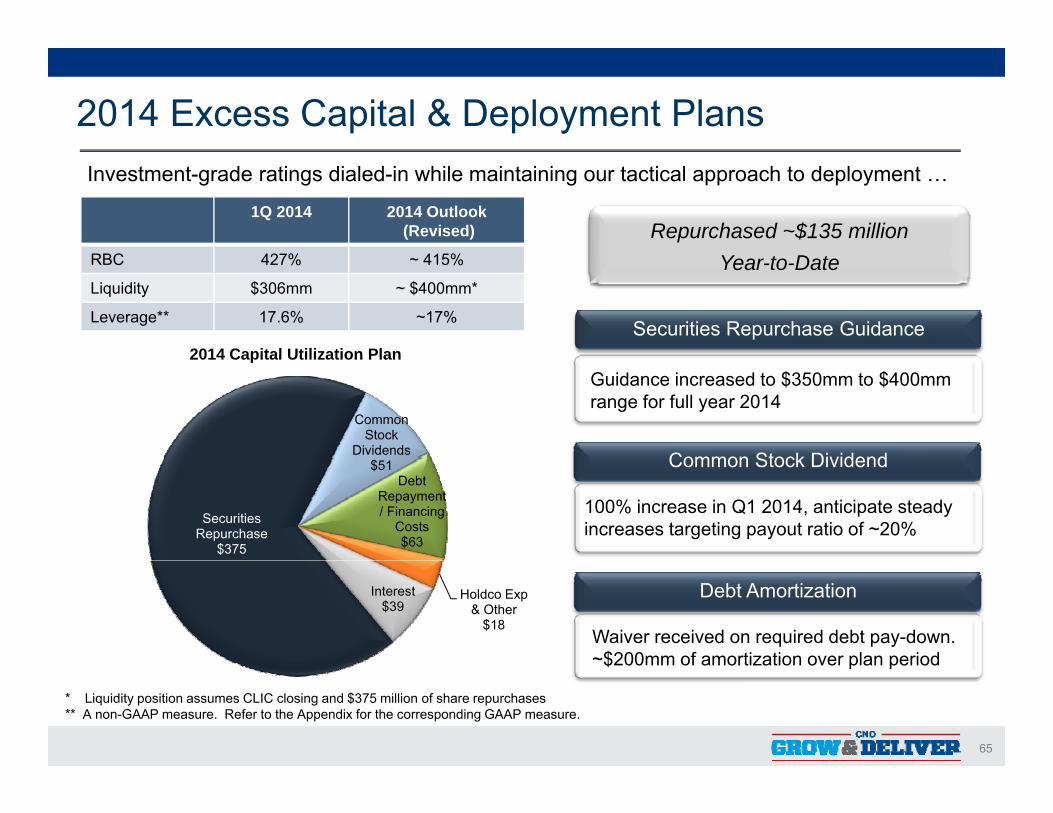
2014 Excess Capital & Deployment Plans
1Q 2014 2014 Outlook(Revised)
Investment-grade ratings dialed-in while maintaining our tactical approach to deployment …
Repurchased ~$135 million RBC 427% ~ 415%
Liquidity $306mm ~ $400mm*
Leverage** 17.6% ~17%
Year-to-Date
Securities Repurchase Guidance 2014 Capital Utilization Plan
vGuidance increased to $350mm to $400mm range for full year 2014
Common Stock Dividend
Common Stock
Dividends
2014 Capital Utilization Plan
Common Stock Dividend
v100% increase in Q1 2014, anticipate steady increases targeting payout ratio of ~20%Securities
Repurchase$375
$51 Debt
Repayment / Financing
Costs$63
Debt Amortization
vWaiver received on required debt pay-down. ~$200mm of amortization over plan period
Holdco Exp & Other
$18
Interest$39
65
$200mm of amortization over plan period
* Liquidity position assumes CLIC closing and $375 million of share repurchases** A non-GAAP measure. Refer to the Appendix for the corresponding GAAP measure.
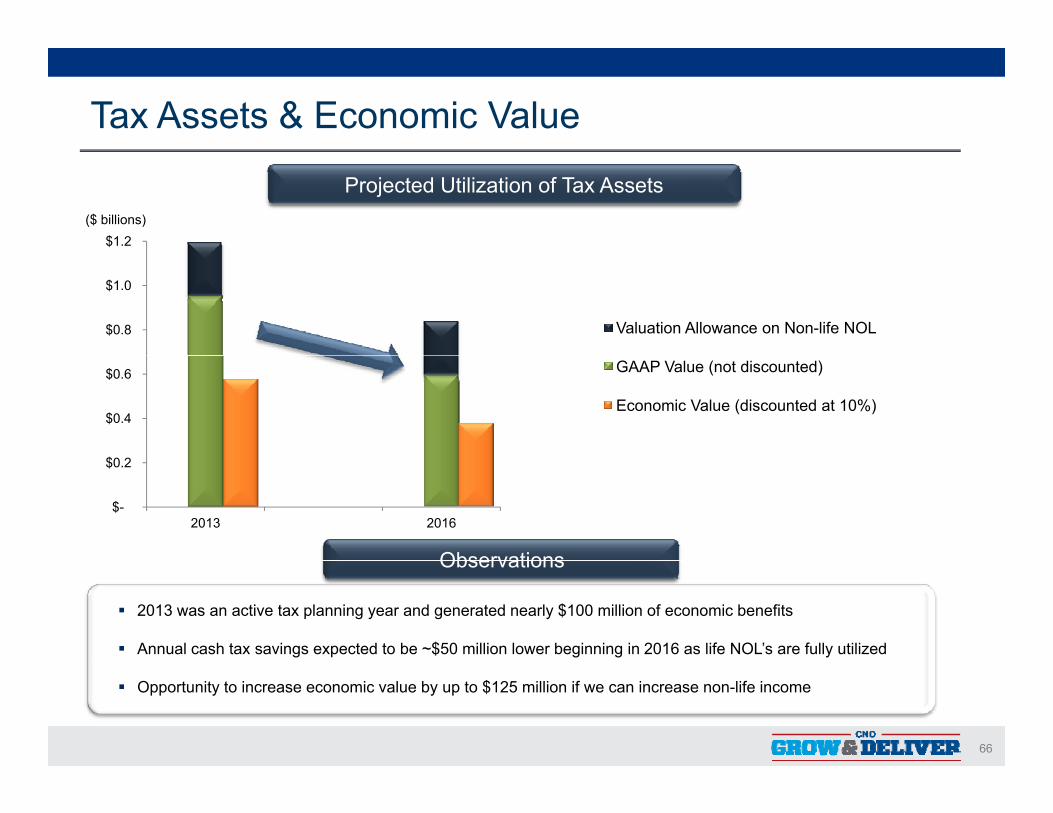
Tax Assets & Economic Value
Projected Utilization of Tax Assets($ billions)
$1.2
$0.8
$1.0
Valuation Allowance on Non-life NOL
$0 2
$0.4
$0.6 GAAP Value (not discounted)
Economic Value (discounted at 10%)
Observations
$-
$0.2
2013 2016
Observations
2013 was an active tax planning year and generated nearly $100 million of economic benefits
Annual cash tax savings expected to be ~$50 million lower beginning in 2016 as life NOL’s are fully utilized
66
Opportunity to increase economic value by up to $125 million if we can increase non-life income
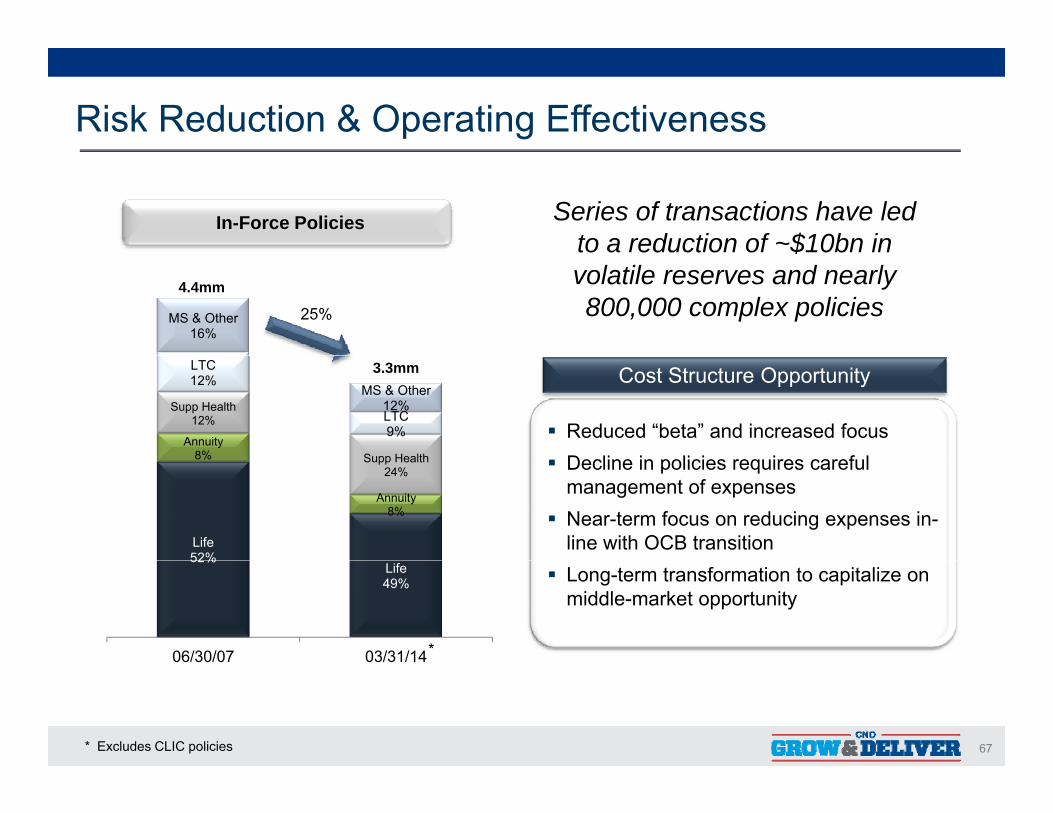
Risk Reduction & Operating Effectiveness
In-Force Policies Series of transactions have led to a reduction of ~$10bn in
MS & Other 16%
4.4mm
$volatile reserves and nearly 800,000 complex policies25%
Annuity 8%
Supp Health 12%
Supp Health
LTC 12%
LTC 9%
MS & Other 12%
v
Cost Structure Opportunity
Reduced “beta” and increased focusD li i li i i f l
3.3mm
Life 52%
8%
Annuity 8%
Supp Health 24% Decline in policies requires careful
management of expenses Near-term focus on reducing expenses in-
line with OCB transition52%
Life 49%
06/30/07 03/31/14
Long-term transformation to capitalize on middle-market opportunity
*
67* Excludes CLIC policies
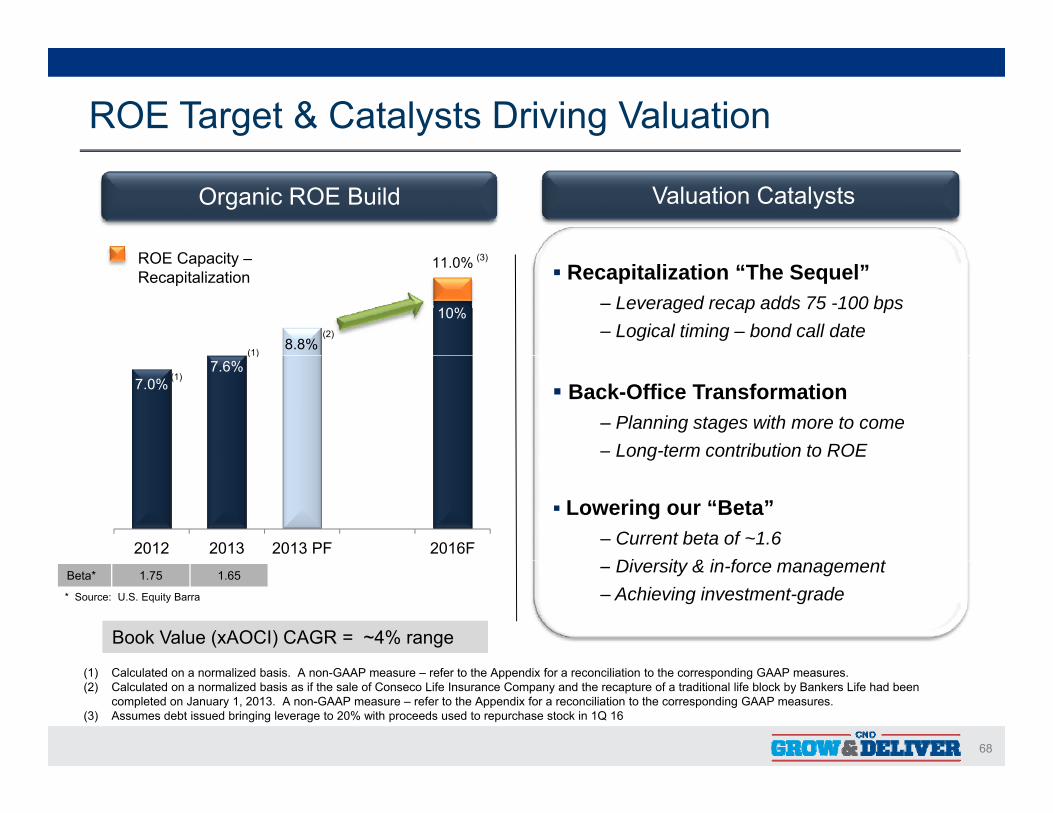
ROE Target & Catalysts Driving Valuation
Valuation CatalystsOrganic ROE Build
ROE C it
8.8%
11.0% Recapitalization “The Sequel”
‒ Leveraged recap adds 75 -100 bps‒ Logical timing – bond call date
ROE Capacity –Recapitalization
(1)
(2)
(3)
10%
7.0%7.6%
Back-Office Transformation‒ Planning stages with more to come ‒ Long-term contribution to ROE
(1)
(1)
2012 2013 2013 PF 2016F
g
Lowering our “Beta”‒ Current beta of ~1.6
Di it & i f t‒ Diversity & in-force management‒ Achieving investment-grade
Book Value (xAOCI) CAGR = ~4% range
Beta* 1.75 1.65
* Source: U.S. Equity Barra
68
(1) Calculated on a normalized basis. A non-GAAP measure – refer to the Appendix for a reconciliation to the corresponding GAAP measures.(2) Calculated on a normalized basis as if the sale of Conseco Life Insurance Company and the recapture of a traditional life block by Bankers Life had been
completed on January 1, 2013. A non-GAAP measure – refer to the Appendix for a reconciliation to the corresponding GAAP measures.(3) Assumes debt issued bringing leverage to 20% with proceeds used to repurchase stock in 1Q 16

Q&A
69
Cl i St t tClosing StatementsEd Bonach - CEO
70
Building on Momentum to Grow and Deliver
Build on investment in the business Build on investment in the business
Focus on sustainable profitable growth
Accelerate operating effectivenessg
Tactically deploy excess capital
Enhance the customer experience
Invest in and develop talent
Grow quality ROE
CNO positioned as a strong growth and stable company allowing us to focus on
71
CNO positioned as a strong growth and stable company allowing us to focus on GROWING the Business and DELIVERING value to Shareholders
Why CNO?
Significant opportunity in the middle marketSignificant opportunity in the middle market
Well positioned to capitalize on the opportunity with our unique business modelunique business model
Investing in the business model to continue to drive above industry sales growth and improved efficienciesabove industry sales growth and improved efficiencies
Catalysts driving future valuation are compelling
Strong track record of execution
72
Appendix
73
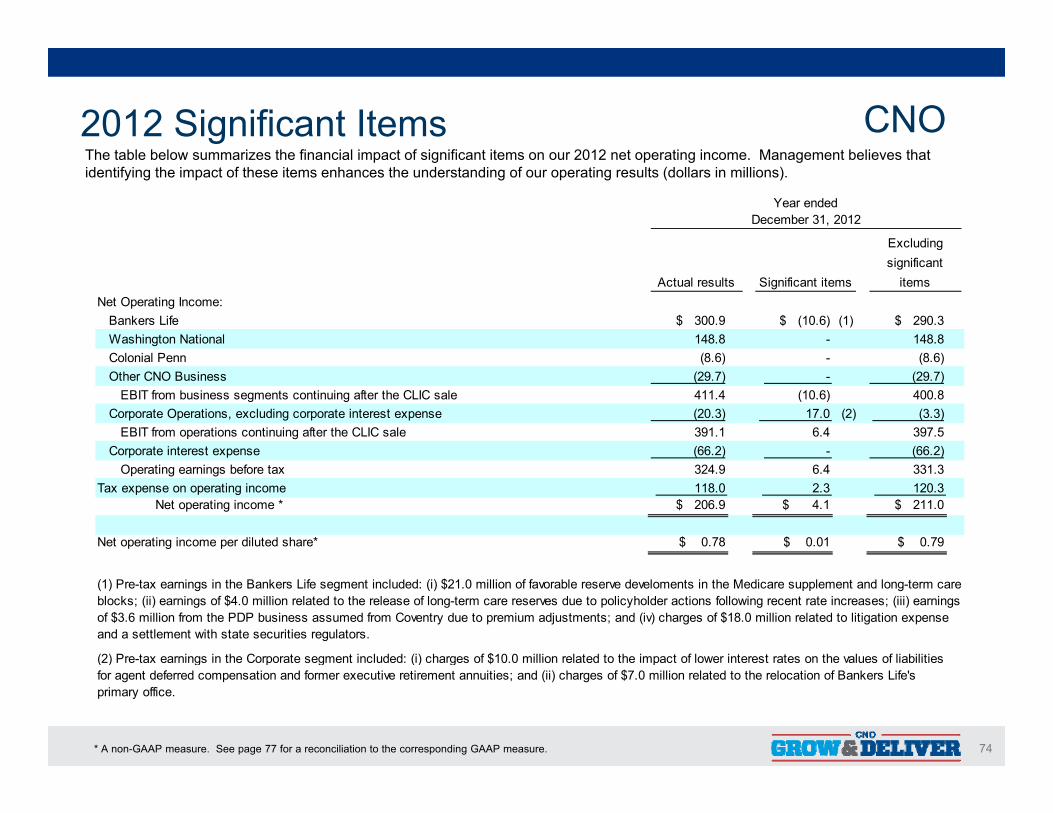
Th t bl b l i th fi i l i t f i ifi t it 2012 t ti i M t b li th t2012 Significant Items CNOThe table below summarizes the financial impact of significant items on our 2012 net operating income. Management believes that identifying the impact of these items enhances the understanding of our operating results (dollars in millions).
Year endedDecember 31, 2012
Excluding
Net Operating Income:Bankers Life $ 300.9 $ (10.6) (1) $ 290.3 Washington NationalColonial Penn
Actual results Significant itemssignificant
items
148.8 - 148.8 (8 6) (8 6)Colonial Penn
Other CNO BusinessEBIT from business segments continuing after the CLIC sale
Corporate Operations, excluding corporate interest expense (2) EBIT from operations continuing after the CLIC sale
Corporate interest expense
(8.6) - (8.6) (29.7) - (29.7)
411.4 (10.6) 400.8 (20.3) 17.0 (3.3)
391.1 6.4 397.5 (66.2) - (66.2)
Operating earnings before taxTax expense on operating income
Net operating income * $ 206.9 $ 4.1 $ 211.0
Net operating income per diluted share* $ 0.78 $ 0.01 $ 0.79
324.9 6.4 331.3 118.0 2.3 120.3
(2) Pre-tax earnings in the Corporate segment included: (i) charges of $10.0 million related to the impact of lower interest rates on the values of liabilities
(1) Pre-tax earnings in the Bankers Life segment included: (i) $21.0 million of favorable reserve develoments in the Medicare supplement and long-term care blocks; (ii) earnings of $4.0 million related to the release of long-term care reserves due to policyholder actions following recent rate increases; (iii) earnings of $3.6 million from the PDP business assumed from Coventry due to premium adjustments; and (iv) charges of $18.0 million related to litigation expense and a settlement with state securities regulators.
74
( ) g p g ( ) g $ pfor agent deferred compensation and former executive retirement annuities; and (ii) charges of $7.0 million related to the relocation of Bankers Life's primary office.
* A non-GAAP measure. See page 77 for a reconciliation to the corresponding GAAP measure.
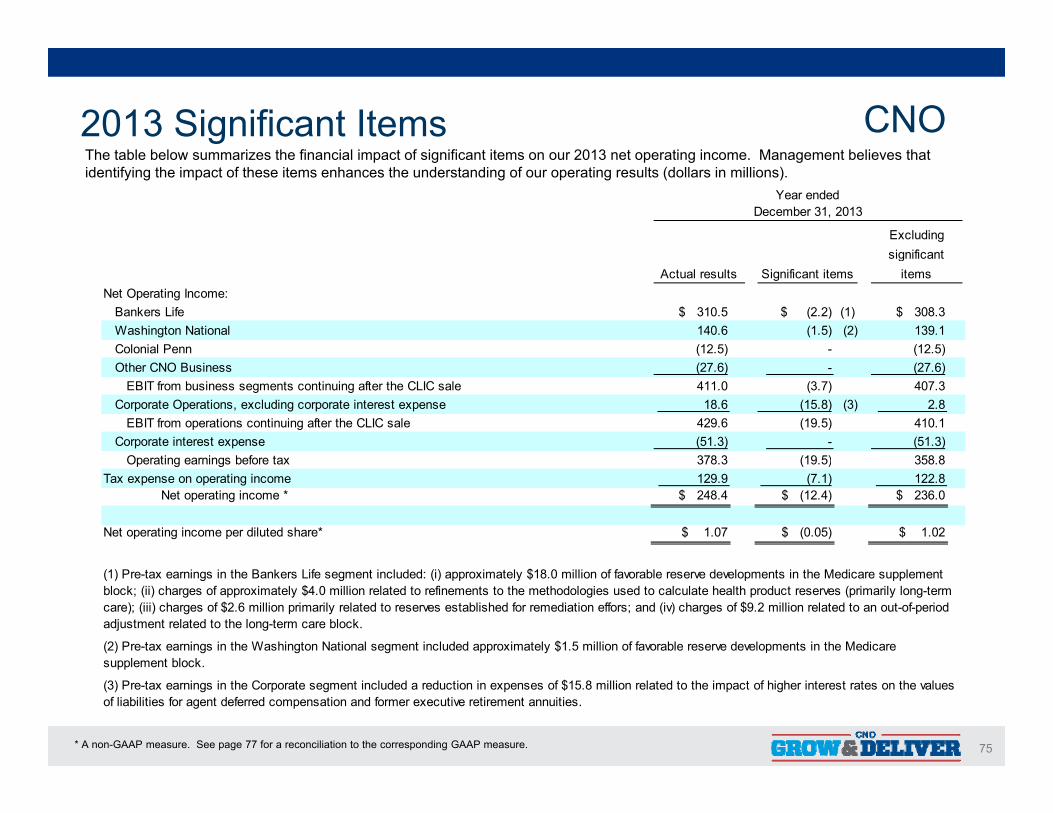
Th t bl b l i th fi i l i t f i ifi t it 2013 t ti i M t b li th t2013 Significant Items CNOThe table below summarizes the financial impact of significant items on our 2013 net operating income. Management believes that identifying the impact of these items enhances the understanding of our operating results (dollars in millions).
Year endedDecember 31, 2013
Excluding significant
Net Operating Income:Bankers Life $ 310.5 $ (2.2) (1) $ 308.3 Washington National (2) Colonial Penn
Actual results Significant itemssignificant
items
140.6 (1.5) 139.1 (12.5) - (12.5)
Other CNO BusinessEBIT from business segments continuing after the CLIC sale
Corporate Operations, excluding corporate interest expense (3) EBIT from operations continuing after the CLIC sale
Corporate interest expenseOperating earnings before tax
( ) ( ) (27.6) - (27.6)
411.0 (3.7) 407.3 18.6 (15.8) 2.8 429.6 (19.5) 410.1
(51.3) - (51.3)378 3 (19 5) 358 8Operating earnings before tax
Tax expense on operating incomeNet operating income * $ 248.4 $ (12.4) $ 236.0
Net operating income per diluted share* $ 1.07 $ (0.05) $ 1.02
378.3 (19.5) 358.8 129.9 (7.1) 122.8
(2) Pre-tax earnings in the Washington National segment included approximately $1.5 million of favorable reserve developments in the Medicare supplement block
(1) Pre-tax earnings in the Bankers Life segment included: (i) approximately $18.0 million of favorable reserve developments in the Medicare supplement block; (ii) charges of approximately $4.0 million related to refinements to the methodologies used to calculate health product reserves (primarily long-term care); (iii) charges of $2.6 million primarily related to reserves established for remediation effors; and (iv) charges of $9.2 million related to an out-of-period adjustment related to the long-term care block.
75
supplement block.
(3) Pre-tax earnings in the Corporate segment included a reduction in expenses of $15.8 million related to the impact of higher interest rates on the values of liabilities for agent deferred compensation and former executive retirement annuities.
* A non-GAAP measure. See page 77 for a reconciliation to the corresponding GAAP measure.
Information Related to Certain Non-GAAP Financial Measures
The following provides additional information regarding certain non-GAAP measures used in this presentation. A non-GAAP measure is a numerical measure of a company’s performance, financial position, or cash flows that excludes or includes amounts that are normally excluded or included in the most directly comparable measure calculated and presented in accordance with GAAP. While management believes these measures are useful to enhance understanding and comparability of our financial results these non-GAAP measuresare useful to enhance understanding and comparability of our financial results, these non-GAAP measures should not be considered as substitutes for the most directly comparable GAAP measures. Additional information concerning non-GAAP measures is included in our periodic filings with the Securities and Exchange Commission that are available in the “Investors – SEC Filings” section of CNO’s website, www.CNOinc.com.
Operating earnings measuresManagement believes that an analysis of net income applicable to common stock before the earnings of CLIC being sold, loss on reinsurance transaction, net realized gains or losses, fair value changes due to fluctuations in the interest rates used to discount embedded derivative liabilities related to our fixed index annuities, equity in earnings of certain non-strategic investments and earnings attributable to VIEs, loss on extinguishment of debt and changes in our valuation allowance for deferred tax assets (“net operating income ” a non-GAAPdebt and changes in our valuation allowance for deferred tax assets ( net operating income, a non-GAAP financial measure) is important to evaluate the performance of the Company and is a key measure commonly used in the life insurance industry. Management uses this measure to evaluate performance because these items are unrelated to the Company’s continuing operations.
76
Information Related to Certain Non-GAAP Financial Measures
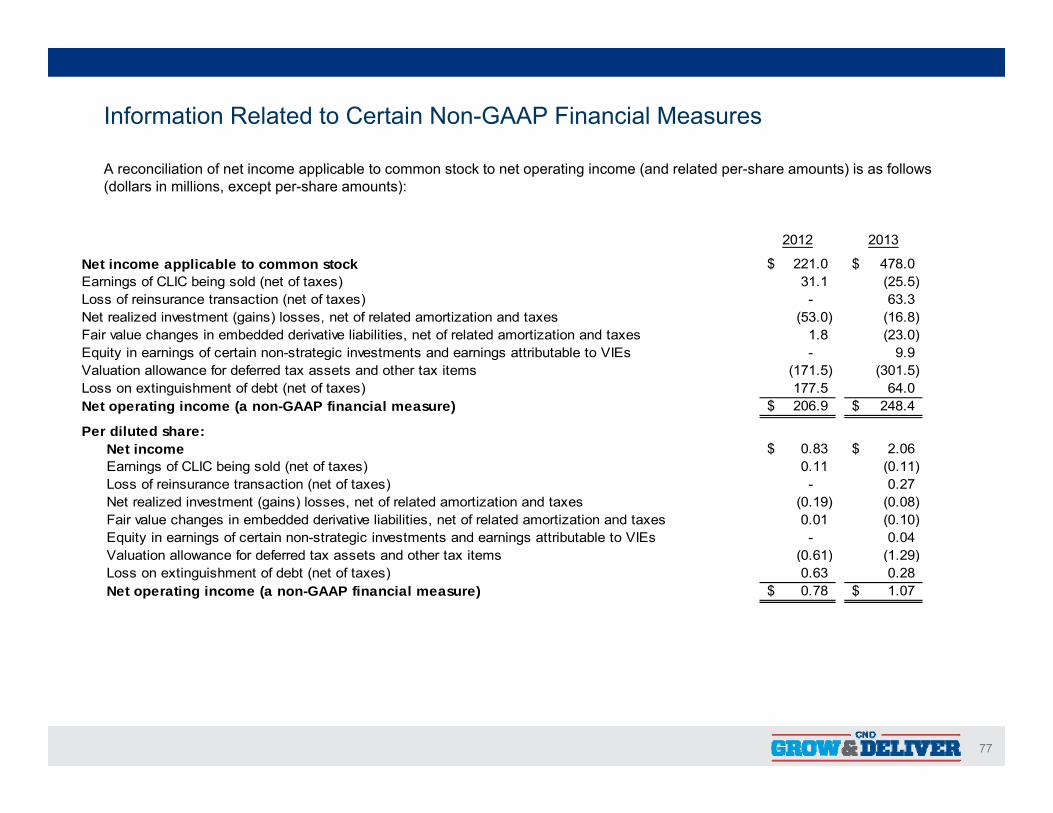
A reconciliation of net income applicable to common stock to net operating income (and related per-share amounts) is as follows (dollars in millions, except per-share amounts):
2012 2013
Net income applicable to common stock 221.0$ 478.0$ Earnings of CLIC being sold (net of taxes) 31.1 (25.5) Loss of reinsurance transaction (net of taxes) - 63.3 Net realized investment (gains) losses, net of related amortization and taxes (53.0) (16.8) Fair value changes in embedded derivative liabilities, net of related amortization and taxes 1.8 (23.0) Equity in earnings of certain non-strategic investments and earnings attributable to VIEs - 9 9Equity in earnings of certain non strategic investments and earnings attributable to VIEs 9.9 Valuation allowance for deferred tax assets and other tax items (171.5) (301.5) Loss on extinguishment of debt (net of taxes) 177.5 64.0 Net operating income (a non-GAAP financial measure) 206.9$ 248.4$
Per diluted share:Net income 0.83$ 2.06$ Earnings of CLIC being sold (net of taxes) 0.11 (0.11) Loss of reinsurance transaction (net of taxes) - 0.27 Net realized investment (gains) losses, net of related amortization and taxes (0.19) (0.08) Fair value changes in embedded derivative liabilities, net of related amortization and taxes 0.01 (0.10) Equity in earnings of certain non-strategic investments and earnings attributable to VIEs - 0.04 Valuation allowance for deferred tax assets and other tax items (0.61) (1.29) ( ) ( )Loss on extinguishment of debt (net of taxes) 0.63 0.28 Net operating income (a non-GAAP financial measure) 0.78$ 1.07$
77
Information Related to Certain Non-GAAP Financial Measures
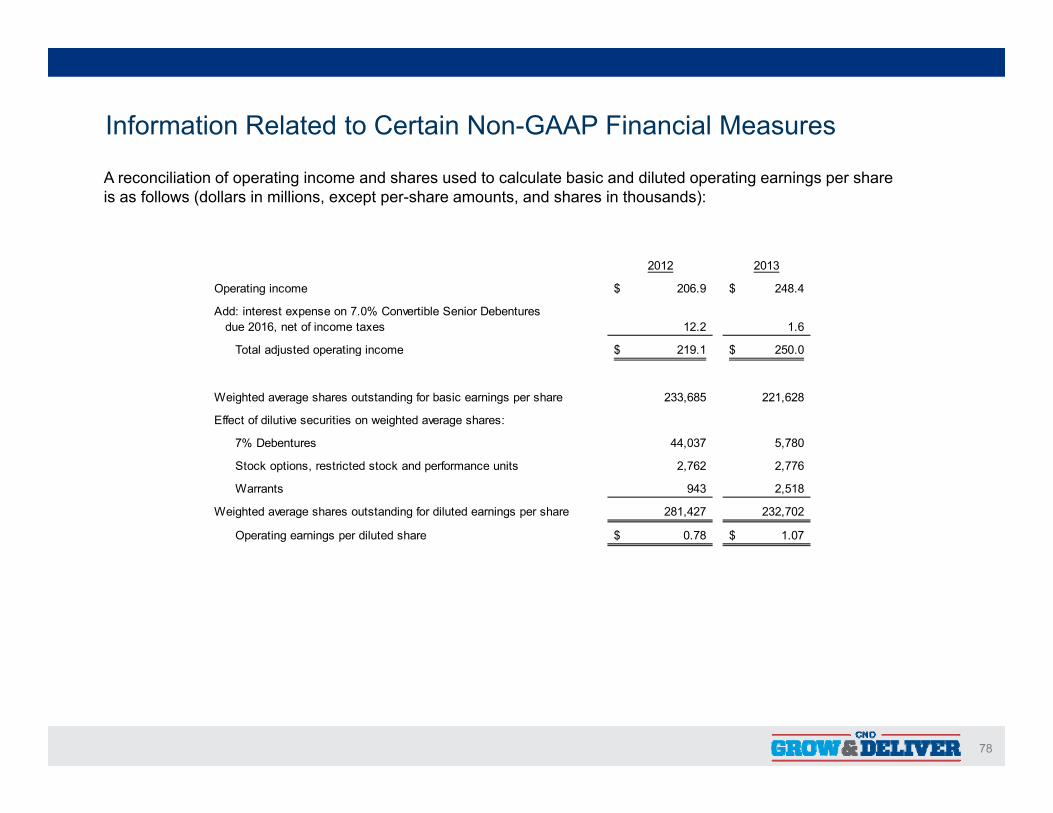
A reconciliation of operating income and shares used to calculate basic and diluted operating earnings per share is as follows (dollars in millions, except per-share amounts, and shares in thousands):
2012 2013
Operating income 206.9$ 248.4$
Add: interest expense on 7.0% Convertible Senior Debentures due 2016, net of income taxes 12.2 1.6
Total adjusted operating income 219.1$ 250.0$ j p g
Weighted average shares outstanding for basic earnings per share 233,685 221,628
Effect of dilutive securities on weighted average shares:
7% Debentures 44,037 5,780
Stock options, restricted stock and performance units 2,762 2,776
Warrants 943 2,518
Weighted average shares outstanding for diluted earnings per share 281,427 232,702
Operating earnings per diluted share 0.78$ 1.07$
78
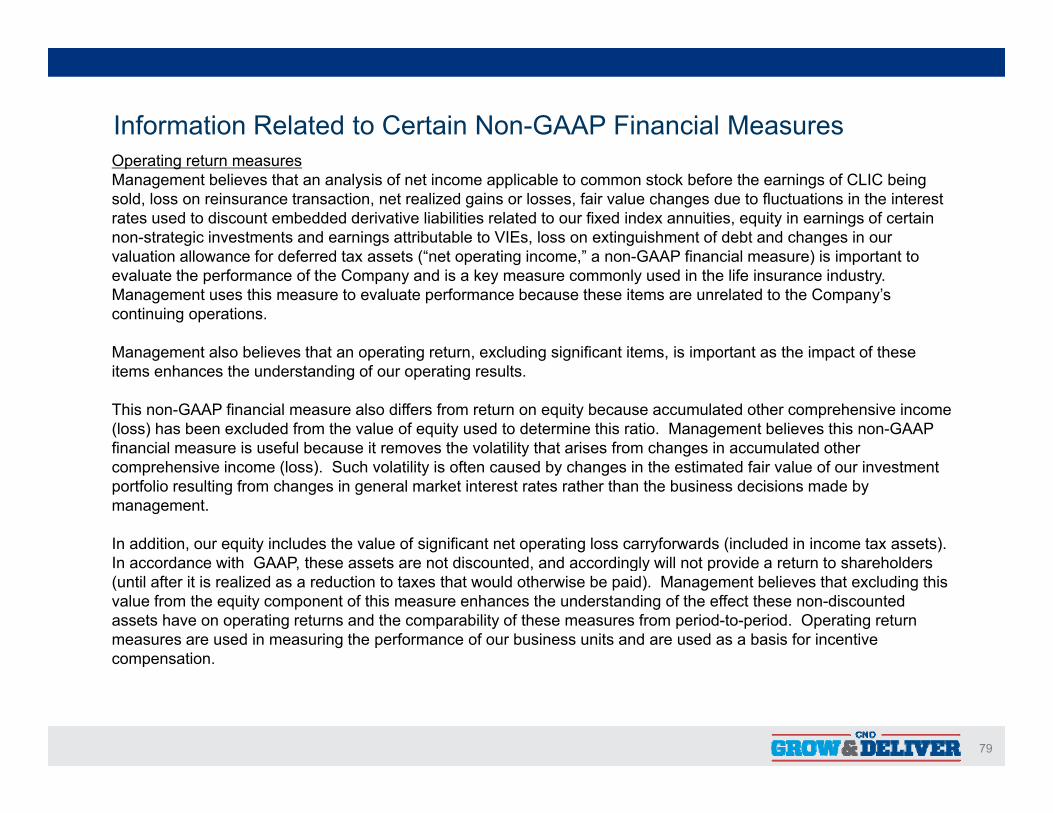
Information Related to Certain Non-GAAP Financial MeasuresOperating return measuresManagement believes that an analysis of net income applicable to common stock before the earnings of CLIC being sold, loss on reinsurance transaction, net realized gains or losses, fair value changes due to fluctuations in the interest rates used to discount embedded derivative liabilities related to our fixed index annuities, equity in earnings of certain non-strategic investments and earnings attributable to VIEs, loss on extinguishment of debt and changes in our
l ti ll f d f d t t (“ t ti i ” GAAP fi i l ) i i t t tvaluation allowance for deferred tax assets (“net operating income,” a non-GAAP financial measure) is important to evaluate the performance of the Company and is a key measure commonly used in the life insurance industry. Management uses this measure to evaluate performance because these items are unrelated to the Company’s continuing operations.
Management also believes that an operating return excluding significant items is important as the impact of theseManagement also believes that an operating return, excluding significant items, is important as the impact of these items enhances the understanding of our operating results.
This non-GAAP financial measure also differs from return on equity because accumulated other comprehensive income (loss) has been excluded from the value of equity used to determine this ratio. Management believes this non-GAAP financial measure is useful because it removes the volatility that arises from changes in accumulated other comprehensive income (loss). Such volatility is often caused by changes in the estimated fair value of our investment portfolio resulting from changes in general market interest rates rather than the business decisions made by management.
In addition, our equity includes the value of significant net operating loss carryforwards (included in income tax assets). In accordance with GAAP these assets are not discounted and accordingly will not provide a return to shareholdersIn accordance with GAAP, these assets are not discounted, and accordingly will not provide a return to shareholders (until after it is realized as a reduction to taxes that would otherwise be paid). Management believes that excluding this value from the equity component of this measure enhances the understanding of the effect these non-discounted assets have on operating returns and the comparability of these measures from period-to-period. Operating return measures are used in measuring the performance of our business units and are used as a basis for incentive compensation.
79
compensation.
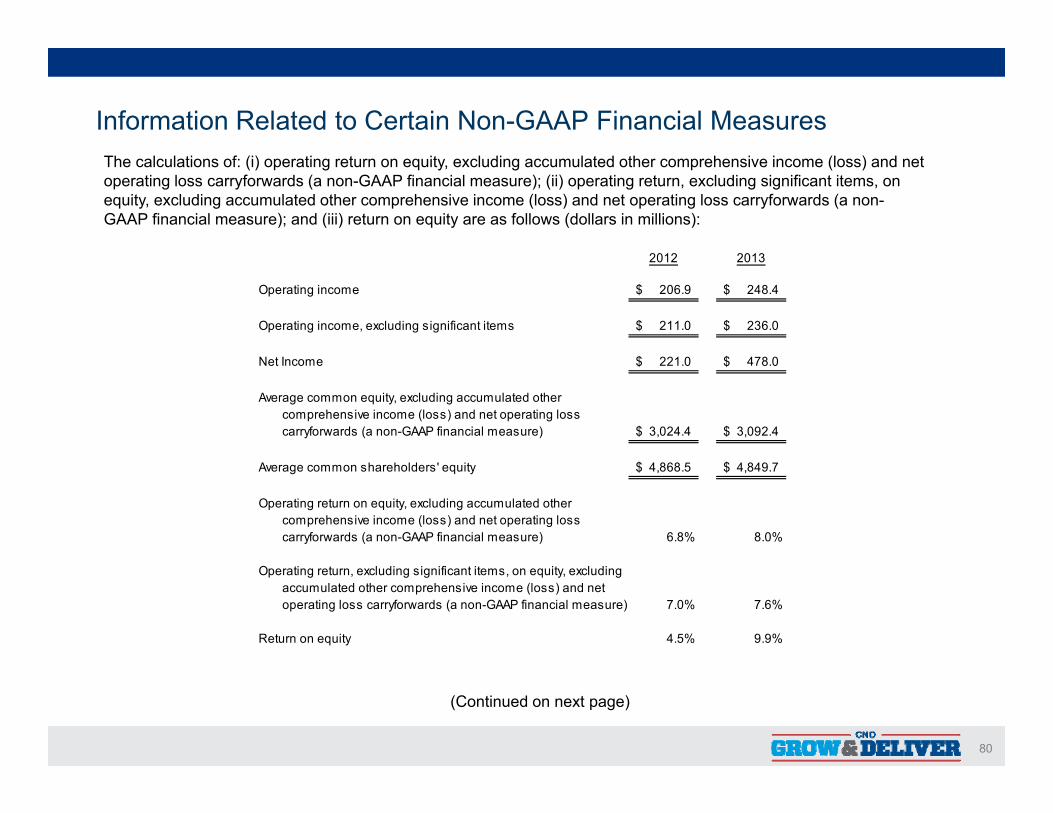
Information Related to Certain Non-GAAP Financial MeasuresThe calculations of: (i) operating return on equity, excluding accumulated other comprehensive income (loss) and net operating loss carryforwards (a non-GAAP financial measure); (ii) operating return, excluding significant items, on equity, excluding accumulated other comprehensive income (loss) and net operating loss carryforwards (a non-GAAP financial measure); and (iii) return on equity are as follows (dollars in millions):
2012 2013
Operating income 206.9$ 248.4$
Operating income, excluding significant items 211.0$ 236.0$
Net Income 221.0$ 478.0$
Average common equity, excluding accumulated othercomprehensive income (loss) and net operating losscarryforwards (a non-GAAP financial measure) 3,024.4$ 3,092.4$
Average common shareholders' equity 4,868.5$ 4,849.7$
Operating return on equity, excluding accumulated othercomprehensive income (loss) and net operating losscarryforwards (a non-GAAP financial measure) 6.8% 8.0%
Operating return, excluding significant items, on equity, excludingaccumulated other comprehensive income (loss) and netoperating loss carryforwards (a non-GAAP financial measure) 7.0% 7.6%
Return on equity 4.5% 9.9%
80
(Continued on next page)
Information Related to Certain Non-GAAP Financial Measures
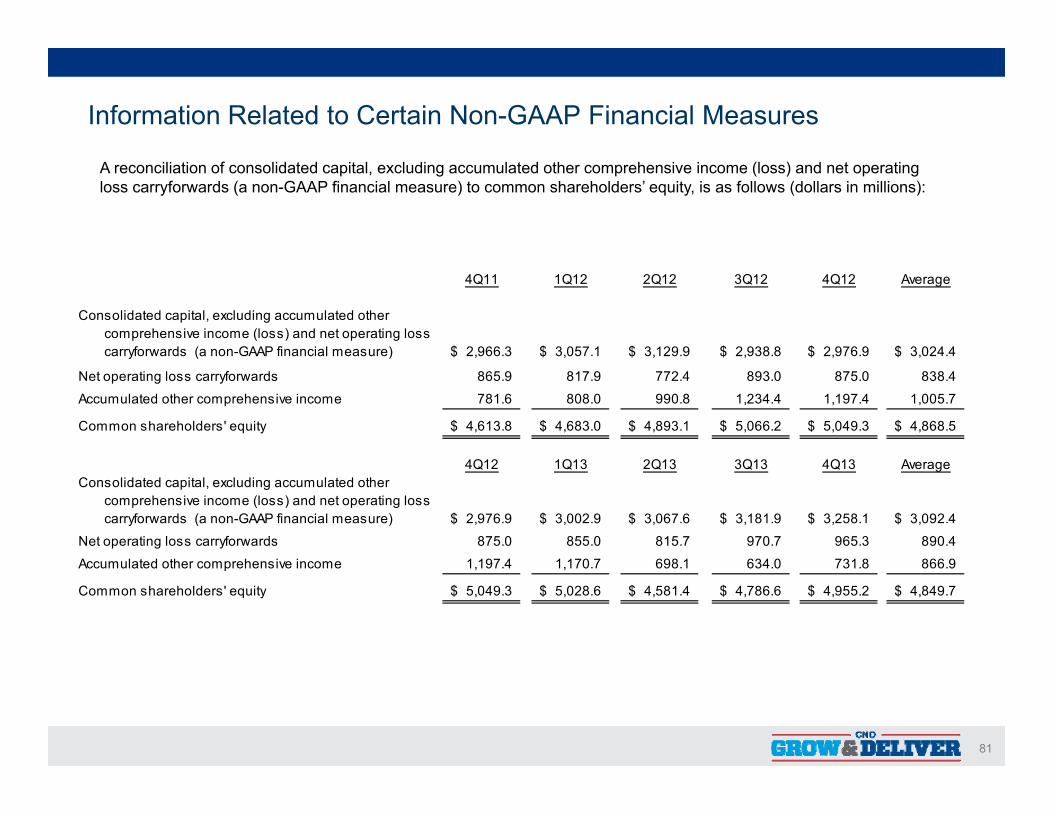
A reconciliation of consolidated capital, excluding accumulated other comprehensive income (loss) and net operating loss carryforwards (a non-GAAP financial measure) to common shareholders’ equity, is as follows (dollars in millions):
4Q11 1Q12 2Q12 3Q12 4Q12 Average
Consolidated capital, excluding accumulated other comprehensive income (loss) and net operating loss carryforwards (a non-GAAP financial measure) 2,966.3$ 3,057.1$ 3,129.9$ 2,938.8$ 2,976.9$ 3,024.4$carryforwards (a non GAAP financial measure) 2,966.3$ 3,057.1$ 3,129.9$ 2,938.8$ 2,976.9$ 3,024.4$
Net operating loss carryforwards 865.9 817.9 772.4 893.0 875.0 838.4
Accumulated other comprehensive income 781.6 808.0 990.8 1,234.4 1,197.4 1,005.7
Common shareholders' equity 4,613.8$ 4,683.0$ 4,893.1$ 5,066.2$ 5,049.3$ 4,868.5$
4Q12 1Q13 2Q13 3Q13 4Q13 AverageConsolidated capital, excluding accumulated other
comprehensive income (loss) and net operating loss carryforwards (a non-GAAP financial measure) 2,976.9$ 3,002.9$ 3,067.6$ 3,181.9$ 3,258.1$ 3,092.4$
Net operating loss carryforwards 875.0 855.0 815.7 970.7 965.3 890.4
A l t d th h i i 1 197 4 1 170 7 698 1 634 0 731 8 866 9Accumulated other comprehensive income 1,197.4 1,170.7 698.1 634.0 731.8 866.9
Common shareholders' equity 5,049.3$ 5,028.6$ 4,581.4$ 4,786.6$ 4,955.2$ 4,849.7$
81
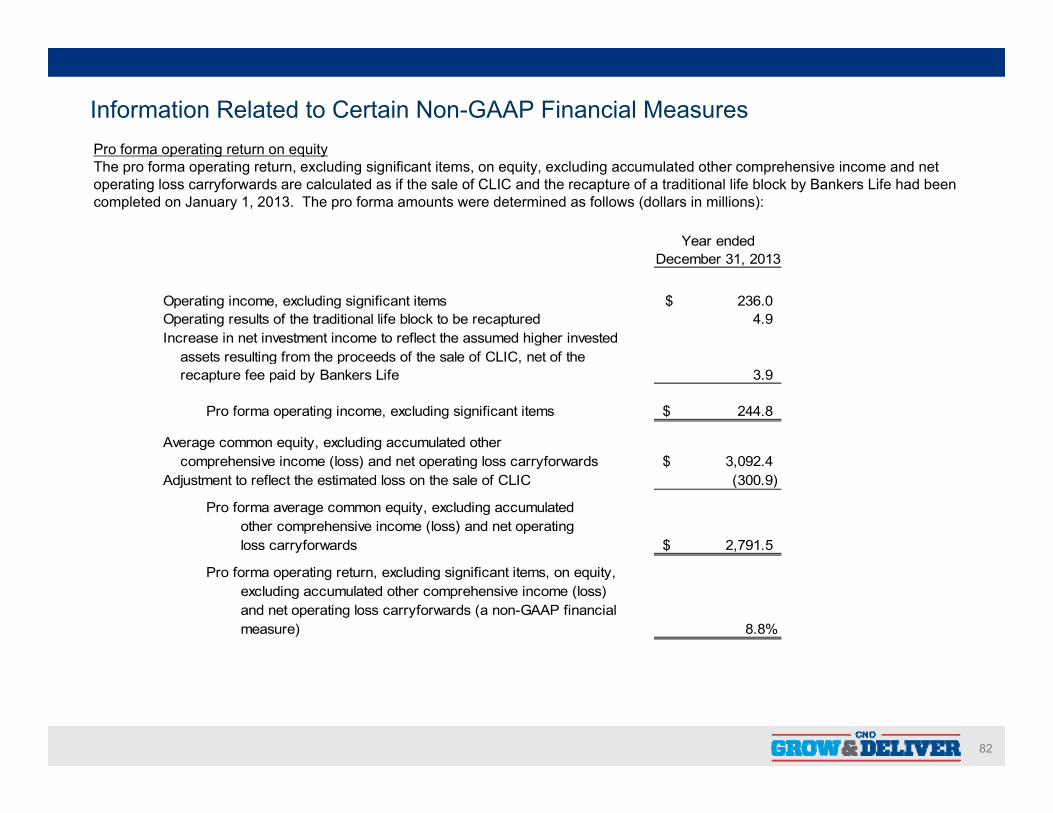
Pro forma operating return on equity
Information Related to Certain Non-GAAP Financial Measures
Year ended
Pro forma operating return on equityThe pro forma operating return, excluding significant items, on equity, excluding accumulated other comprehensive income and netoperating loss carryforwards are calculated as if the sale of CLIC and the recapture of a traditional life block by Bankers Life had been completed on January 1, 2013. The pro forma amounts were determined as follows (dollars in millions):
December 31, 2013
Operating income, excluding significant items 236.0$ Operating results of the traditional life block to be recaptured 4.9 Increase in net investment income to reflect the assumed higher invested
assets resulting from the proceeds of the sale of CLIC net of the assets resulting from the proceeds of the sale of CLIC, net of the recapture fee paid by Bankers Life 3.9
Pro forma operating income, excluding significant items 244.8$
Average common equity, excluding accumulated otherh i i (l ) d t ti l f d 3 092 4$ comprehensive income (loss) and net operating loss carryforwards 3,092.4$
Adjustment to reflect the estimated loss on the sale of CLIC (300.9)
Pro forma average common equity, excluding accumulated other comprehensive income (loss) and net operating loss carryforwards 2,791.5$
Pro forma operating return, excluding significant items, on equity, excluding accumulated other comprehensive income (loss) and net operating loss carryforwards (a non-GAAP financial measure) 8.8%
82
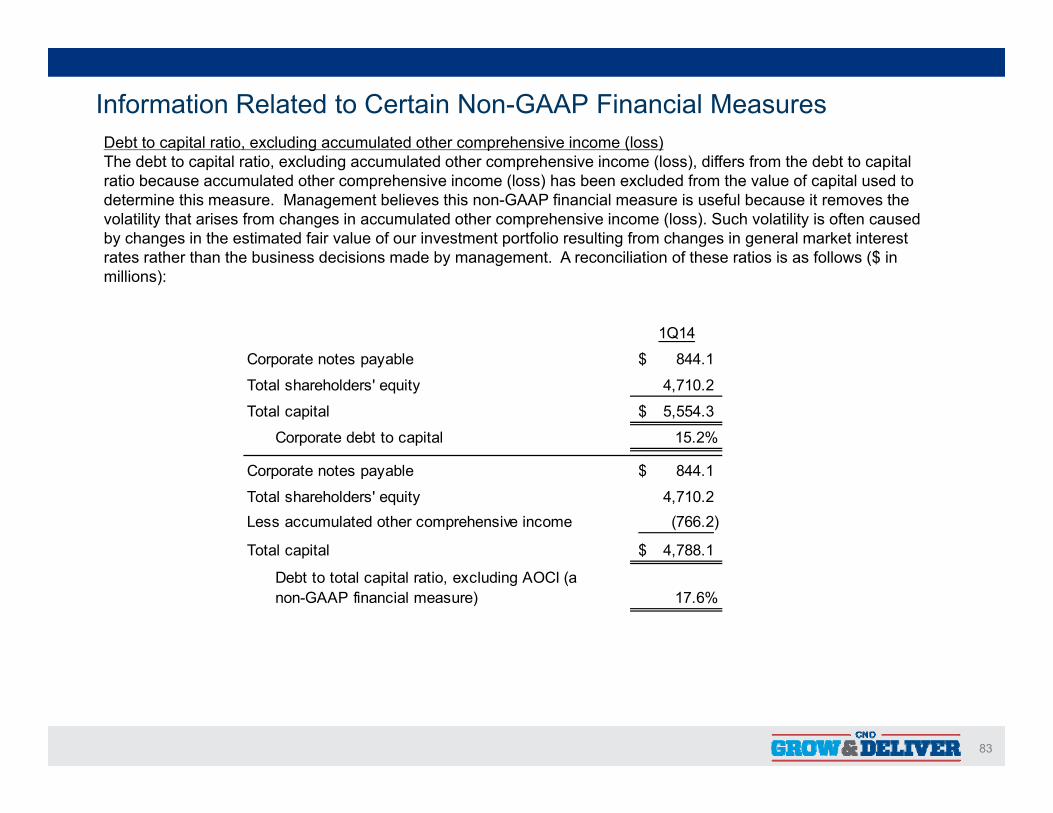
Information Related to Certain Non-GAAP Financial MeasuresDebt to capital ratio, excluding accumulated other comprehensive income (loss)p g p ( )The debt to capital ratio, excluding accumulated other comprehensive income (loss), differs from the debt to capital ratio because accumulated other comprehensive income (loss) has been excluded from the value of capital used to determine this measure. Management believes this non-GAAP financial measure is useful because it removes the volatility that arises from changes in accumulated other comprehensive income (loss). Such volatility is often caused by changes in the estimated fair value of our investment portfolio resulting from changes in general market interest
t th th th b i d i i d b t A ili ti f th ti i f ll ($ i
1Q14
C t t bl 844 1$
rates rather than the business decisions made by management. A reconciliation of these ratios is as follows ($ in millions):
Corporate notes payable 844.1$
Total shareholders' equity 4,710.2
Total capital 5,554.3$
Corporate debt to capital 15.2%
Corporate notes payable 844.1$
Total shareholders' equity 4,710.2 Less accumulated other comprehensive income (766.2)
Total capital 4,788.1$
Debt to total capital ratio, excluding AOCI (anon-GAAP financial measure) 17.6%
83
![PM 2014 investor day 2014-06-26-Da-eu Region Investor Day Slides [Website Final]](https://static.fdocuments.in/doc/165x107/577cbc651a28aba7118da315/pm-2014-investor-day-2014-06-26-da-eu-region-investor-day-slides-website-final.jpg)


![PM 2014 investor day 2014-06-26-LAC Region Investor Day Slides [WEBSITE FINAL]](https://static.fdocuments.in/doc/165x107/577cbc651a28aba7118da312/pm-2014-investor-day-2014-06-26-lac-region-investor-day-slides-website-final.jpg)

![PM 2014 investor day 2014-06-26-CEO Investor Day Slides [FINAL]](https://static.fdocuments.in/doc/165x107/577cbc651a28aba7118da313/pm-2014-investor-day-2014-06-26-ceo-investor-day-slides-final.jpg)