2014 Elements Baseline Update Year 5 Sustainability ... Year 5 Sustainability Categories Update:...
66
MADE IN HAWAIʻI • 2016 2014 Elements Baseline Update Year 5 Sustainability Categories Update: Energy, Carbon, Water, & Waste sustainableHNL
Transcript of 2014 Elements Baseline Update Year 5 Sustainability ... Year 5 Sustainability Categories Update:...

MADE IN HAWAIʻI • 2016
2014 Elements Baseline Update Year 5 Sustainability Categories Update: Energy, Carbon, Water, & Waste
sustainableHNL

Created in partnership between the Department of Transportation-Airports Division and the KYA Sustainability Studio.
STATE OF HAWAI‘I
2015
Disclaimer: KYA Sustainability Studio obtained data from a variety of sources to produce this sustainability report. The reporting team did not have access to all source data directly from the airport, and thus was not able to verify all data sets fully against the source documents. Due to these constraints, it is possible that performance metrics may not be accurate. Performance metrics cited within this 2014 Elements
Baseline Update report should not over-ride or replace information in any previously published reports or findings.

DOCUMENT CONTENTS
1 Executive Summary 2 Element Performance Summaries 6 Sustainability Performance Metrics HNL Introduction 8 Introduction 15 Reporting Boundary 19 HNL Operations & Facilities 21 Methodology HNL Energy Element 22 2009 & 2014 Energy Performance Summary 24 Energy at HNL 26 Sustainability Categories 29 Opportunities HNL Carbon Element 30 2009 & 2014 Carbon Performance Summary 32 Carbon at HNL 35 Sustainability Categories 37 Opportunities HNL Water Element 38 2009 & 2014 Water Performance Summary 40 Water at HNL 42 Sustainability Categories 43 Opportunities HNL Waste Element 44 2009 & 2014 Waste Performance Summary 46 Waste at HNL 49 Sustainability Categories 52 Opportunities 54 Recommended Reading / Resources 56 Acknowledgements 58 Acronyms and Abbreviations 60 Sustainability Categories Matrix Analysis


Honolulu International Airport | 2014 Elements Baseline Update
1
EXECUTIVE SUMMARY The State of Hawai'i Department of Transportation – Airports Division (DOT-A) manages Honolulu International Airport (HNL), the busiest airport in the state, and has taken a proactive role in integrating sustainability into every aspect of the airport. DOT-A commissioned this 2014 Elements Baseline Update report to support management efforts to monitor and report on sustainability at HNL as part of the larger division-wide sustainability effort, Sustainable DOT-A (sDOT-A), which benefits community, economy and environment. With direction from key stakeholders, this report ultimately assesses HNL’s performance in four sustainability focus areas: energy consumption, greenhouse gas (carbon) emissions, water consumption, and waste generation. The original Sustainable HNL (sHNL) Committee was created to identify sustainability measures and was a group of interdisciplinary DOT-A division and district stakeholders. They identified four major sustainability categories, or Elements: Energy, Carbon, Water and Waste. Building on the data collected from the latest HNL sustainability report, 2009 Elements Baseline, this report gathers performance data for the same metrics over the last five years and analyzes the changes made by the DOT-A as they relate to each Element. Between 2009 and 2014, the DOT-A made great strides in reducing the impact of HNL operations on the focus areas by normalizing the data against total passengers arriving, departing, overseas, and interisland. Using the normalized numbers, from 2009 to 2014, the airport shows improvement through decreased per passenger energy consumption and carbon emissions. On the negative side, Water consumption increased and Waste diversion for reuse, recycling and composting decreased – while noting a change for both categories in data collection and evaluation methodology. The table below displays the performance metrics, however the numbers have been rounded for display purposes:
Metrics: Energy in kilowatt hours (kWh), Carbon in pounds (lbs.), Water in gallons (gal.), Waste diverted divided by total waste generated (rate of diversion). The DOT-A continues to meet the challenges inherent in identifying and implementing sustainable best practices that align with the sDOT-A mission. Starting with the bigger picture, the 2009 Elements Baseline cast a wide net around all airport operational impacts, including tenants. As a next step, the 2014 Elements Baseline Update report takes a more focused approach on the DOT-A operations. By doing so, the report methodology has expanded to provide a more accurate analysis and framework for DOT-A to evaluate the areas where airport management has direct control and can make the largest impact with targeted sustainability planning. As a next step in the management and reporting of sustainability at the airport, sHNL will work on creating a sustainability management plan. The process will set goals, identify actions, develop an implementation plan, complete initiatives, and report on progress.

Honolulu International Airport | 2014 Elements Baseline Update
2
Findings: • DOT-A managed electricity consumption has been reduced by 4% and 11% per passenger since 2009.
o Energy conservation measures reduced electricity consumption. Differences: • 2009 kWh data presented herein differs from 2009 kWh data presented in the 2009 Elements Baseline. This change is
the result of newly discovered electricity billing data. The methodology and 2009 data in this report have been updated to reflect these new findings.
• Renewable energy generation data for the wind turbines is no longer available, as DOT-A no longer tracks this pilot project’s electricity generation.
• Lack of consistent sub-meter data for energy and accurate tenant and DOT-A building space sq. ft., resulted in unquantifiable tenant data.
Scope and Boundary: • Electricity vaults and meters serve both terminal and non-terminal buildings, which are occupied by a mixture of
tenants and DOT-A users. • For this report, tenant energy use is not quantified because sub-meter data was unavailable.
Methodology: • The energy data included in this report is inclusive only of what the DOT-A is able to quantify using their utility billing
records. • Data statistics and management practices for energy come from electricity billing analysis in addition to discussions
with key HNL stakeholders.

Honolulu International Airport | 2014 Elements Baseline Update
3
Findings: • DOT-A 2014 direct and indirect (see below for definition) greenhouse gas emissions (carbon) have been reduced by 4%
and 11% per passenger since 2009. o Energy conservation measures reduced carbon emissions related to electricity consumption by 4%. o Changes in operations, combined with unexpected vehicle maintenance and repair, reduced fuel purchased for
ground support resulting in a 4% mobile carbon emissions reduction. Differences: • Comparing total carbon data from 2009 and 2014, the tenant and public emissions are no longer quantified due to
changes in the scope of this report as well as the exclusion of tenant electricity consumption, the availability of jet fuel consumption data, and challenges with electrical data at HNL.
o The 2009 Elements Baseline reported DOT-A, tenant, and public emissions (Scope 1, 2 and 3 emissions). o The 2014 Elements Baseline Update targets only DOT-A controllable emissions (Scope 1 and 2 emissions).
• Lack of consistent sub-meter data for energy and accurate tenant and DOT-A building space sq. ft., resulted in unquantifiable tenant data.
Scope and Boundary: • This report focuses on identifying sources that are directly and indirectly DOT-A’s responsibility at HNL and on
quantifying key carbon emissions. o Direct: DOT-A owned and operated ground support vehicles, emergency generators, and HVAC refrigerant
emissions (Scope 1). o Indirect: electricity purchased emissions (Scope 2).
Methodology: • The carbon emissions inventory is generated using industry agreed upon best practices of airport carbon emissions
reporting from the World Resources Institute “Greenhouse Gas Protocol”. • Excluded from the Carbon Element per scope, boundary, or industry recommendations:
o Tenant emissions: Operations of aircraft, ground equipment, and other business operations. o Public emissions: Driving employee and passenger vehicles, shuttles, buses, taxis, etc. o Other: Direct emissions from airport firefighting and training exercises, indirect emissions from waste generation,
and indirect emissions from contractor construction equipment.

Honolulu International Airport | 2014 Elements Baseline Update
4
Findings: • DOT-A 2014 managed water consumption increased overall by 12% and by 4% per passenger. The overall increase is
mainly reflective of the change in report methodology – tenant water consumption is no longer quantified. There is also evidence attributed to a rise in demand for water due to increased passengers and aircraft operations since 2009.
• Water management at HNL continues to face some of the challenges as mentioned in the 2009 Elements Baseline. o Lack of an automated management and control system to remotely track detailed performance. o Metering and management of tenant spaces. o Unknown condition and location of all potable water infrastructures. o Unknown volume of wastewater generated and the quantity of storm water. o The distinction of actual water consumption versus leaks is unknown without an effective leak detection program.
Differences: • 2009 water data presented herein differs from 2009 water data presented in the 2009 Elements Baseline. This
difference is the result of a change in methodology as mentioned below. • Comparing total water data from 2009 and 2014, tenant water consumption is no longer quantified.
o This is due to challenges with obtaining actual tenant water use data from those tenants who have utility contracts directly with the Board of Water Supply.
• The 2014 Elements Baseline Update added sewer water discharge performance. • Lack of consistent sub-meter data for water and accurate tenant and DOT-A building space sq. ft., resulted in
unquantifiable tenant data.
Scope and Boundary: • This report focuses on quantifying water consumption under DOT-A’s responsibility within the boundary of HNL’s DOT-
A operations. o Due to the challenges related to metering the DOT-A water data at this time includes tenants use.
Methodology: • The water data included in this report is inclusive only of what the DOT-A is able to quantify using their utility billing
records. • Data for the Water Element was obtained through document analysis and discussions with key HNL stakeholders.

Honolulu International Airport | 2014 Elements Baseline Update
5
Findings: • DOT-A 2014 managed airport-wide waste generation increased overall by 67% and by 55% per passenger. This is
mainly attributed to the changes in methodology of calculating waste generation at HNL.
Differences: • In 2014, a new waste contractor began waste management operations at HNL for all DOT-A operations and facilities. • 2014 MSW data is based on the current hauler’s best estimates as opposed to disposal manifests. • There were changes in waste management operations from 2009 to 2014.
o 2014 green waste is commingled with MSW removed from HNL; therefore the MSW weight reflects green waste and MSW data combined.
o 2014 newspaper and cardboard recycling data was not available and therefore calculated using the frequency of pick-up, estimated volume when removed, and EPA standard weight conversions.
• New waste categories in this report include: hazardous, electronic, and construction and demolition. Scope and Boundary: • The scope excluded a tonnage survey and comprehensive waste audit of both DOT-A and public collection bins, as well
as tenant MSW surveys. • Tenant waste is excluded in the scope of the 2014 Elements Baseline Update report. • The 2014 data in the Waste Element includes DOT-A MSW and recycling contracts throughout HNL facilities. Methodology: • All waste calculations are best estimates and from discussions with key HNL Stakeholders.

Honolulu International Airport | 2014 Elements Baseline Update
6
SUSTAINABILITY PERFORMANCE METRICS The performance of the four focus areas is illustrated graphically below.
5.6 5.4
5.6
5.3 5.1
5.0
4.4
4.8
5.2
5.6
6.0
2009 2010 2011 2012 2013 2014
Con
sum
ptio
n pe
r Pas
seng
er
(kW
h)
Energy Consumption per Passenger (2009-2014)
10.6 10.2
10.6
10.0 9.7
9.4
8
9
10
11
2009 2010 2011 2012 2013 2014
Emiss
ions
per
Pas
seng
er
(lbs.
CO
2e)
Carbon Emissions per Passenger (2009-2014)
22.0 23.3
25.8 28.1
23.2 22.0
15
20
25
30
2009 2010 2011 2012 2013 2014
Wat
er p
er P
asse
nger
(g
allo
ns)
Potable Water Consumed per Passenger (2009-2014)
83.0
16.9 25.0 20.3 25.9
46.3
0
20
40
60
80
100
2009 2010 2011 2012 2013 2014
Was
te D
iver
ted
(ton
s) Waste Diverted from Landfill (2009-2014)

Honolulu International Airport | 2014 Elements Baseline Update
7
QUANTITATIVE PERFORMANCE SUMMARY The performance summary below is a snapshot view of quantitative data currently being measured and recorded for the four focus areas. The fiver year baseline trend is presented both as a percentage and in a red-yellow-green performance visualization. Performance is either Green (improving) or Red (in decline). Yellow symbolizes data collection issues.
Indicator 2009 2014 Baseline Trend
Electricity Consumption kWh 101,650,852 97,330,250 -4%Renewable Energy Generation kWh 8,474 - -
kWh 101,650,852 97,330,250 -4%kWh / passenger 5.6 5.0 -11%
CARBONMobile Sources Emissions mtCO2e 2,569 2,475 -4%
Stationary Sources Emissions mtCO2e 84,539 80,969 -4%mtCO2e 87,108 83,444 -4%
lbs. CO2e / passenger 10.6 9.4 -11%
WATERPotable Water Use kgal. 399,969 431,060 8%
Greywater Use kgal. 61,967 86,214 39%Sewer Water Discharge kgal. 399,969 344,846 -14%
kgal. 461,936 517,274 12%gal. / passenger 25.4 26.4 4%
WASTETotal Waste tons 3,126 5,231 67%
MSW tons 2,795 5,000 79%Scrap Metal tons 14 20 42%
Pallet tons 68 174 156%Hazardous Waste tons - 10 -
Office Paper tons 20 5 -76%Newspaper tons 2 6 228%
Cardboard tons 8 16 100%Green Waste tons 39 - -
Waste Diversion Rate (DOT-A) percent diverted 2.7% 0.9% -67%tons 83 46 -44%
lbs. / passenger 0.01 0.01 -48%tons 2,576 4,657 81%
lbs. / passenger 0.31 0.52 68%tons 279 500 79%
lbs. / passenger 0.03 0.06 66%Landfilled (DOT-A)
Total Emissions (DOT-A)
Total Water Use (DOT-A)
Total Energy Use (DOT-A)
ENERGY
Diverted from Landfill and Incineration (DOT-A)
Incinerated off-site (DOT-A)

Honolulu International Airport | 2014 Elements Baseline Update
8
HNL Introduction

Honolulu International Airport | 2014 Elements Baseline Update
9
INTRODUCTION
PURPOSE The 2014 Elements Baseline Update report is designed to assess performance at HNL and support the Department of Transportation – Airports Division (DOT-A) management efforts to align with industry-wide sustainability reporting, specifically focusing on operational impacts to natural resources and the environment. The original Sustainable HNL (sHNL) Committee identified four major focus areas, or Elements as Energy, Carbon, Water and Waste. Building on the 2009 Elements Baseline, this report gathers performance metrics over the last five years and analyzes changes made by the DOT-A as they relate to each Element. The DOT-A continues to meet the challenges inherent in identifying sustainable practices with this report to align with their mission to…
" …develop, manage and maintain a safe and efficient global air transportation organization." This 2014 Elements Baseline Update report analyzes current conditions in 2014 to compare and identify gaps against the 2009 Elements Baseline report. In comparison between 2009 and 2014, the report methodology has been adjusted and updated to accommodate gaps in data collection and changes in management practices, and is further discussed in the methodology section. This change considers an effective reporting framework, which can be easily applied to future sustainability reporting frameworks. The Elements, as identified in the prior 2009 Elements Baseline report, provide a lens by which airport stakeholders can measure and monitor progress in Energy, Carbon, Water, and Waste. Falling within each Element are several sustainability categories or indicators that are specific areas of management, included in the table below.
Sustainability Categories Organized by Reporting Element
ELEMENTS ENERGY CARBON WATER WASTE
Sust
aina
bilit
y Ca
tego
ries
(Indi
cato
rs)
Electricity Renewable
Electricity (Solar & Wind)
Mobile Carbon Sources
Stationary Carbon Sources
Potable Water Grey Water Sewer Storm Water
Municipal Solid Waste (MSW)
Scrap Metal Pallets Hazardous Waste Office Paper Newspaper Cardboard Green Waste Electronic Waste Construction &
Demolition

Honolulu International Airport | 2014 Elements Baseline Update
10
BACKGROUND Efforts towards sustainability at the DOT-A began as part of the airport’s Terminal Modernization Program in 2006, to aggregate data and information to meet reporting demands around sustainability issues. A designated sustainability committee (sHNL) was organized and established around a dynamic, interdisciplinary, and consensus-based team of DOT-A stakeholders from Division and O‘ahu District. Amongst Hawai‘i’s fifteen airports managed by DOT-A, HNL has the highest impact as it serves the majority of all air traffic and operations in Hawai‘i. For this reason, the original DOT-A sustainability committee (sDOT-A) helped develop a strategy to focus on the HNL, as a way to develop replicable programs, policies and procedures which could then be applied to Hawai‘i’s smaller airports. Over the past years and since the development of sDOT-A, several guiding documents were created to support the DOT-A’s sustainability mission, “to promote sustainability across Hawai‘i’s airport’s by empowering projects, fostering collaboration, and communicating progress through education and outreach.” Those guiding documents include:
• Program Profile, the platform for sustainability at DOT-A, explaining the history, resources, and vision of sDOT-A; • Cultural Appropriateness Guidelines, a document which addresses how Hawai‘i’s cultural heritage is portrayed
throughout the airport system; • Hawai‘i Sense-of-Place Primer, a document that introduces place sensitive considerations as it pertains to airport
design and construction; and • Sustainable High Performance Guidelines, a comprehensive performance standard and rating system guide that
addresses best practices and green building criteria considerations unique to airport facilities in Hawai‘i.
The Sustainable High Performance Guidelines document was also one of the earliest green building design guidelines developed to directly respond to the 2006 Act 96, “Lead by Example” initiative that directs State agencies to integrate and document best practices in energy, water, and other resources across facilities and operations. DOT-A was the first agency with significant participation in Leadership in Energy & Environmental Design (LEED), generating eight certified LEED accredited professionals (LEED AP’s) and was recognized as a progressive leader in the industry at the time. As the sustainability committee focused on HNL specific projects, the development of the 2009 Elements Baseline report established the foundation of important sustainability metrics at DOT-A. After identifying four major areas of focus, or Elements, the team began tracking and analyzing metrics in Energy, Carbon, Water and Waste. State Leadership Since the development of this document, the State of Hawai‘i Governor signed, Act 181 in 2011. This established sustainability as a priority in the Hawai‘i State Plan, thereby incorporating the definition, goals and principles of sustainability from the Hawai‘i 2050 Sustainability Plan into Chapter 226. Following Act 181, the leaders of the State & Counties drafted and committed to the Hawai‘i made Aloha+ Challenge:

Honolulu International Airport | 2014 Elements Baseline Update
11
The six targets of the Aloha+ Challenge by 2030: 1. Clean Energy: 70 percent clean energy - 40 percent from renewables and 30 percent from efficiency. 2. Local Food: At least double local food production - 20 to 30 percent of food consumed is grown locally. 3. Natural Resource Management: Reverse the trend of natural resource loss mauka to makai by increasing freshwater
security, watershed protection, community-based marine management, invasive species control and native species restoration.
4. Waste Reduction: Reduce the solid waste stream prior to disposal by 70 percent through source reduction, recycling, bioconversion, and landfill diversion methods.
5. Smart Sustainable Communities: Increase livability and resilience in the built environment through planning and implementation at state and county levels.
6. Green Workforce & Education: Increase local green jobs and education to implement these targets.
Guiding Models The fundamental guiding model for sustainability is the “Triple Bottom Line", which is used by organizations as they create sustainability management plans. The aviation industry customized their model to recognize Operational efficiency, as it is the main component to a successful and sustainable airport. Thus spawned the creation of the Airports Council International of North America (ACI-NA) sustainability model “EONS”, which stands for Economic viability, Operational efficiency, Natural resource conservation, and Social responsibility.
Triple Bottom Line Model EONS Model

Honolulu International Airport | 2014 Elements Baseline Update
12
The EONS model will be recognized as a guiding principle for future planning and decision-making as HNL makes progress towards a sustainable future with the creation of a Sustainable Management Plan (SMP). HNL’s current model is an Elements based approach to sustainability with part of EONS inserted where data is available:
Sustainable HNL Sustainable Management Planning Process Model

Honolulu International Airport | 2014 Elements Baseline Update
13
AVIATION INDUSTRY Energy at Airports Airports around the world are, by their very nature, energy intensive facilities because of the equipment needed to keep operations running smoothly and passengers comfortable. However, the airport industry is familiar with energy efficiency and has best practices in place through the Sustainable Aviation Guidance Alliance (SAGA), Airport Council International-North America (ACI-NA), Airport Association for Benchmarking, and other airport organizations. ACI-NA has an energy conservation goal to reduce non-renewable energy consumption at member airports by 2014. As the airport industry looks to reduce carbon emissions, airports around the world are guided by EONS to set their own internal energy policies aiming to reduce the use of fossil fuels, conserve energy resources, and generate onsite renewable energy. Carbon at Airports Recently, the airport community developed an ACI carbon emissions program designed to encourage and enable airports to implement best practice carbon and energy management processes, while gaining public recognition of their achievements. The Airport Carbon Accreditation (ACA) is an independent, voluntary program developed by ACI Europe that mandates independent 3rd party review to ensure the calculation of carbon emissions is as accurate as possible. Airports that pass the review are eligible to receive the various accreditation levels. With growing participation each year, the ACA now covers 26% of world passenger traffic with 23 airports having reached carbon neutrality status since 2009 for the emissions within their direct control. In North America, leading airports are starting to receive recognition for their efforts through ACA. Water at Airports Across the aviation industry there has been a realization that large amounts of water are consumed at airports during the course of daily terminal operations. Most concerning to airport managers are forecasts predicting water consumption at airports to increase with growing air travel. The current 2014 FAA forecasts indicate U.S. carrier passenger growth over the next 20 years should average two percent per year. Realizing the need for effective water management, the Cadmus Group has been contracted to develop a water efficiency management guidebook for airport practitioners in the U.S. as part of a research project for the Transportation Research Board's (TRB's) Airport Cooperative Research Program (ACRP). This guidebook, including tools, will enable airport operators to understand water uses and demand at airports, determine the appropriate levels of water use for their airports, and develop water efficient strategies. Waste at Airports In the aviation industry, waste generation occurs in flights as well as on the ground. Waste disposal falls upon the airport manager, making solid waste management a dynamic and complex operation. Solid waste generated at airports includes waste from passenger terminals, ancillary operations such as cargo and maintenance hangars, rental facilities, administrative offices, grounds keeping, cleaning, maintenance, aircraft operations, airlines, and other smaller sources. Waste generated in each of these airport areas has the potential to be reduced, reused, recycled, and composted. According to the ACI-NA 2010 and 2012 Benchmark Surveys, various small, medium, and large airport hubs have committed to achieve ACI-NA’s goal for member airports to establish recycling programs. Moving forward, there is a need for guidance on how to establish successful and cost effective airport waste management programs through best practices and lessons learned.

Honolulu International Airport | 2014 Elements Baseline Update
14
KEY STAKEHOLDERS HNL is unique among its peers on the US Mainland, as it is a state owned and operated airport. The diagram below illustrates the Department’s structure and outlines the stakeholders involved. The State of Hawai‘i, Department of Transportation (DOT) oversees and manages the Airports, Highways, and Harbors Divisions. The DOT-A manages 15 airports in 4 Districts throughout the State. Representing the O‘ahu district are Kalaeloa Airport, Honolulu International Airport (HNL) and Dillingham Airfield. Metrics shared in this report are focused on impacts of the O‘ahu District. Key stakeholders who impact the airport are illustrated on the left side of the diagram below. The dark blue colored boxes indicate the main focus of this report. The O‘ahu District administration runs day-to-day management of airport operations. Although tenants, passengers and the public are major stakeholders impacting airport operations and facilities, they are excluded from reporting at this time. Airport tenants range in size and operations and consist of airline carriers, air cargo, retail and restaurant concessionaires, ground service handlers, in-flight catering companies, airline cabin cleaners, contractors and consultants, and federal and state government agencies.
Airport Organizational Chart

Honolulu International Airport | 2014 Elements Baseline Update
15
REPORTING BOUNDARY
The Honolulu International Airport (HNL) is located on O‘ahu, in the ahupua‘a, or Hawaiian land division, of Moanalua as shown in the map below. The area observed in this report includes all facilities and operations located on the Department of Transportation – Airports Division (DOT-A) property and runways east of Elliott Street, south of Aolele Street, south of Kamakahi Street, and along Lagoon Drive. Excluded from the report boundary are the Federal government properties, Joint Base Pearl Harbor Hickam (JBPHH) and the Federal Detention Center, water bodies, Mamala Bay Golf Course, Federal Aviation Administration (FAA) and tenants operating north of Aolele Street and along Koapaka Street. HNL Ahupua‘a Boundary Map

Honolulu International Airport | 2014 Elements Baseline Update
16

Honolulu International Airport | 2014 Elements Baseline Update
17

Honolulu International Airport | 2014 Elements Baseline Update
18

Honolulu International Airport | 2014 Elements Baseline Update
19
HNL AIRPORT OPERATIONS AND FACILITIES
The HNL boundary covers a total of 4,520 acres of land, distinguished by the relation to runways and sealanes. HNL has both dry and submerged lands within its boundary. Distinguished by its North and South Ramp facilities, HNL offers various airline and airport support facilities along with a variety of passenger services. As the gateway into Hawai‘i, HNL has serviced 19.5 million passengers in 2014, conducted 311 thousand aircraft operations, moved 413 thousand tons of cargo and processed 87 thousand tons of mail. The table below shows the airport passenger count and aircraft operations statistics from 2010 to 2014. Statistics come from DOT-A’s Planning Department. DOT-A owns and controls the main terminal spaces (terminals and concourses), non-terminal spaces (parking structures, maintenance base yard, and chillers), and airfields. See reporting boundary map for specific DOT-A owned and controlled spaces.
Honolulu International Airport Passenger Count, Cargo Volume, Mail Volume, and Aircraft Operations
Calendar Year
Total Passengers including Transits
(Arriving + Departing + Overseas + Interisland)
Cargo (U.S. tons) Mail (U.S. tons) Aircraft Operations
2009 18,168,746 338,080 89,212 274,434
2010 18,443,873 369,360 116,029 263,440 2011 18,043,203 346,783 75,631 263,354 2012 19,293,941 383,003 71,396 278,145 2013 19,706,718 390,725 70,434 290,237 2014 19,575,195 413,397 87,663 311,138
UTILITIES AND MANAGED SYSTEMS Airport utilities and managed systems include electricity, sewer, water, drainage, and fuels. Utilities relevant to this report are mentioned below. Electricity Hawaiian Electric Company (HECO) supplies all electric power to HNL via two 12.4 kV feeders from its substations at Ke‘ehi and Makalapa. There is also a switching station near the Navy-Marine Golf Course and two substations at the airport. One substation is located in the Kalewa subdivision and the other is on Rodgers Boulevard. HNL has 75 individual electric utility meters for which it is responsible. Tenants who have their own utility accounts still utilize the airport
200k
250k
300k
350k
17m
18m
19m
20m
2009 2010 2011 2012 2013 2014
Num
ber o
f Flig
hts
Num
ber o
f Pas
seng
ers
Passengers and Flight Operations at HNL (2009-2014)
Passengers(Enplaned +Deplaned)
FlightOperations

Honolulu International Airport | 2014 Elements Baseline Update
20
electrical infrastructure to receive power. Though sub-meters are installed they are not utilized. For backup power that serves the terminals and airfield, there is a 1.5 MW emergency generator facility and three portable emergency generators at the airport with one rated at 500 kW/4,160V 3 Phase, another rated at 750kW/4,160V 3 Phase, and a third rated at 1,250 kW/4,160V 3 Phase. These generators provide power for critical operating functions such as airfield lighting during HECO power outages. A 10 MW Emergency Power Facility (EPF) is currently under construction set to be operational by the end of 2015. Sewer HNL is connected to the City and County of Honolulu’s (C&CH) sewage system by a 36-inch gravity flow line that runs beneath Aolele Street. All airport-generated sewage is treated at the Sand Island Sewage Treatment Plant. The two HNL sewage collection systems – northern and southern – connect with the C&CH trunk system at the Lagoon Drive and Aolele Street intersection. Water The HIA potable water system is served by the Board of Water Supply (BWS) Metropolitan 180 water system. Potable water service to the 2,497 acre site is fed by 16-inch water mains at three (3) service connections located on Aolele Street, Paiea Street and Lagoon Drive. Water consumption is monitored by flow meters at each service connection. The main waterline within the airport is a looped system consisting of 12-inch and 16-inch mains. Within the major loop there are smaller loops with 6, 8 and 12-inch lines and dead-end extensions. Water service to fire hydrants and building domestic and sprinkler systems are served from the potable water system. There is also a non-potable water system used for irrigation of HNL landscaping. The non-potable system, or greywater system, is connected to the Department of Transportation – Highways Division (DOT-H) line that runs along Nimitz Highway, which sources its water directly from Sumida Watercress Farm. Drainage A system of drain lines, catch basins, inlets, culverts, and ditches make up the drainage system at HNL. Areas to the west of the Central and Ewa Concourses drain into the ocean through the Manuwai Canal. All other areas at HNL drain either directly into Ke‘ehi Lagoon (South Ramp) or into the Ke‘ehi Lagoon through the Kaloaloa Canal and a system of other man-made ditches. Fuels Gas: Synthetic Natural and Liquid Propane Gas The Hawai‘i Gas Company supplies synthetic natural gas (SNG) to HNL from feeder mains located on Rodgers Boulevard and Paiea Street. HNL itself does not use the gas, but instead maintains the lines that serve its tenants such as restaurants and airlines. Hawai‘i Gas’ Barbers Point storage facility is the source of HNL’s SNG, which is a byproduct made from the refining of crude oil into gasoline, diesel and jet fuels. Hawai‘i Gas also supplies HNL tenants with liquid propane gas (LPG), is stored in small tanks around HNL. Gasoline and Diesel Fuels are trucked into HNL by tanker through an independent contractor, and transferred into storage tanks. The fuels are then distributed to vehicles via a fleet fueling station. For emergency generators, an independent contractor fills the individual fuel tanks for each generator and then bills HNL for the amount it provided, usually every 6-8 months. Jet Fuel and Aviation Gasoline Pipelines and tanker trucks from the Hawai‘i Independent Energy and Chevron Energy refineries feed terminals at HNL. From there, the fuel is transferred into storage tanks where it is both distributed through pipelines to hydrants at the airline gates and also transferred into tanker trucks for mobile fueling operations throughout HNL. Biodiesel The airport receives its biodiesel from Pacific Biodiesel, the only producer on the island, through a contract for the soon to be finished EPF. The contractor fills the generator fuel tanks and bills HNL for the amount it provided.

Honolulu International Airport | 2014 Elements Baseline Update
21
METHODOLOGY
To identify HNL’s impacts on the following four Elements, Energy, Carbon, Water, and Waste, the authors have followed the methodology used in the 2009 Elements Baseline, drawing from industry-accepted protocols for performance and sustainability reporting, such as:
• Global Reporting Initiatives (GRI), • Greenhouse Gas Protocol developed by the World Resources Institute (WRI) and World Business Council for
Sustainable Development (WBCSD), • Natural Resource Defense Council (NRDC), • Environmental Protection Agency (EPA), • Transportation Research Board’s (TRB) Airport Cooperative Research Program (ACRP), • Airport’s Council International – North America (ACI-NA), and • Federal Aviation Administration (FAA).
Data for each sustainability category falls under its respective Element and are best estimates based on the available annual data provided by DOT-A. When available, each Element contains a collection of data from 2010 through 2014. Quantitative and qualitative data was collected through discussions, HNL reports and plans, contracts, manifests, Hawaiian Electric (HECO) billing, and Board of Water Supply (BWS) billing. This report focuses primarily on DOT-A managed operations where airport management has direct control over impacts. This excludes areas of operations managed by tenants at the airport. The following process was used to gather the necessary information on HNL to create this report.
To begin the reporting process, a stakeholder kick-off meeting was conducted to introduce the Sustainable Management Plan (SMP) project and to identify the key stakeholders for each Element. Once the stakeholders for each of the Elements were identified, discussions helped surface key management information and performance metrics and indicators that are presented here in this report. Performance metrics and indicators were collected from key stakeholders at the Division and District levels and from airport contractors. Process mapping created an elemental understanding of management and flow; however they are not included in this report. Data Constraints The 2009 Elements Baseline report is still the foundation of this reporting document, however due to constraints with data availability, the methodology has been adjusted accordingly. Tenant data has been excluded from this report, as the airport does not have direct control over their operations. Any tenant performance data that is managed by DOT-A Division and/or District have been grouped together with DOT-A data into DOT-A performance. Data sources for each Element are presented as best estimates and normalized by the 2009 Elements Baseline floor area and 2014 passenger and flight operations statistics.

Honolulu International Airport | 2014 Elements Baseline Update
22
HNL Energy Element

Honolulu International Airport | 2014 Elements Baseline Update
23
Findings: • DOT-A 2014 managed electricity consumption has been reduced by 4% and 11% per passenger since 2009.
o Energy conservation measures reduced electricity consumption.
Differences: • 2009 kWh data presented herein differs from 2009 kWh data presented in the 2009 Elements Baseline. This change is
the result of newly discovered electricity billing data. The methodology and 2009 data in this report have been updated to reflect these new findings.
• Renewable energy generation data for the wind turbines is no longer available, as DOT-A no longer tracks this pilot project’s electricity generation.
• Lack of consistent sub-meter data for energy and accurate tenant and DOT-A building space sq. ft., resulted in unquantifiable tenant data.
Scope and Boundary: • Electricity vaults and meters serve both terminal and non-terminal buildings, which are occupied by a mixture of
tenants and DOT-A users. • For this report, tenant energy use is not quantified because sub-meter data was unavailable.
Methodology: • The energy data included in this report is inclusive only of what the DOT-A is able to quantify using their utility billing
records. • Data statistics and management practices for energy come from electricity billing analysis in addition to discussions
with key HNL stakeholders.

Honolulu International Airport | 2014 Elements Baseline Update
24
ENERGY AT HNL
While Hawai‘i’s current energy situation is one of great instability, it is also matched with tremendous opportunity as the local market for clean, sustainable energy grows. DOT-A is one of the highest consumers of electricity amongst Hawai‘i State agencies at a rate of almost 1 billion kWh annually. Given HNL’s consumption of electricity, the DOT-A recognizes its responsibility to address Hawai‘i’s dangerous reliance on fossil fuels, beginning with reducing electricity consumption in existing buildings and facilities. In 2013 the DOT-A began strategizing and in early 2014, Johnson Controls, Inc. (JCI) began an Energy Savings Performance Contract (ESPC) with DOT-A by implementing energy conservation measures at HNL. ENERGY MANAGEMENT & MONITORING At the time of the 2009 Elements Baseline, an Energy Management and Control System (EMCS) and sub-metering infrastructure existed to track individual electricity consumption of DOT-A and tenant spaces, as well as, to monitor and control lighting and cooling equipment. Unfortunately, the EMCS was not managed or monitored effectively. Moving forward, as part of the ESPC, JCI will be implementing various controls to collect electricity consumption data and manage it optimally. Airport management and staff will be trained to utilize the new EMCS to implement best practices into their daily operations. The EMCS allows airport operators to sub-meter the energy consumption of individual spaces and facilities throughout the airport property—an important process for understanding the dynamics of overall electricity consumption, conservation, and efficiency practices. Although the DOT-A “owns” all of the land within the HNL program boundary, the DOT-A does not directly control the operations of the various buildings and facilities within this boundary. As such, some tenants privately manage their individual electricity bills directly with Hawaiian Electric Company (HECO), while other tenants pay for electricity through the DOT-A by paying a standard flat rate per occupied square foot. A sub-metering strategy is currently being determined and should be finalized in 2015. ENERGY METHODOLOGY Energy consumption quantification methods vary from airport to airport depending on data available to airport managers. At HNL the DOT-A has quantified the amount of energy consumed by aggregating the sum billing data from electricity accounts. Electricity vaults and meters serve both terminal and non-terminal buildings, which are occupied by a mixture of tenants and DOT-A users. There are also facilities and users throughout HNL consuming energy through private contracts with the electrical utilities, which the DOT-A is unable to identify at this time. The table on the following page illustrates this reporting strategy. All energy data presented in this report is inclusive of only DOT-A owned and controlled spaces. Following the same methodology as the 2009 Elements Baseline, the Energy Element is only inclusive of electricity, and not fuel. While fuel is an important metric to discuss, electricity eclipses fuel in total energy used at HNL. Fuel is discussed in the Carbon Element section of the report.

Honolulu International Airport | 2014 Elements Baseline Update
25
Responsibility for Energy Consumption at HNL Airport
Airport Sources Reported
Purchased Electric Power for Airport Managed Electric Meters Included
Renewable Electricity Generation for Airport Managed Meters Included
Tenant Sources
Purchased Electricity for Airport Managed Electric Meters Included
Purchased Electricity for Tenant Managed Electric Meters Excluded
Renewable Electricity Generation for Tenant Managed Meters Excluded Changes and New Data Available Since 2009 Elements Baseline Data statistics and management practices for energy come from electricity documentation in addition to discussions with key HNL stakeholders. In the 2009 Elements Baseline, tenant and DOT-A energy consumption data was quantified and separated based on floor area, however this report does not separate tenant and DOT-A energy as reliable square-footage data and methodologies is unavailable. Tenant energy consumption remains an estimation and is therefore excluded. In 2009, electricity consumption was measured by 27 master meters and vaults at HNL and totaled 97,390,841 kWh. This report pulled HECO data from the current 75 HECO accounts the DOT-A holds within the program boundary. A discrepancy was then discovered between 2009 Elements Baseline totals and 2009 to 2014 utility billing totals. HECO’s restructuring of its billing and data management system in 2012 may be a contributing factor to the discrepancy. This report uses the most up to date HECO billing data and adjusted the 2009 electricity baseline to 101,650,852 kWh. This decision was made in order to be consistent with future reporting periods, by making all future calculations based on HECO's billing data. This also allows for continuity of data management at HNL where customized calculations are not required and it increases the reliability of comparison data over time.

Honolulu International Airport | 2014 Elements Baseline Update
26
ENERGY SUSTAINABILITY CATEGORIES Energy Conservation Measures Prior to JCI’s involvement in 2014, the DOT-A was already heavily involved in energy efficiency efforts which included lighting and mechanical equipment initiatives, such as retrofits to taxiway lighting, energy efficient transformers, CFL guidance signs, and T-12 to T-8 fluorescent lighting changes, a new chilled water loop, and chiller replacements.
JCI now leads and manages all energy conservation measures (ECMs) backed by an energy savings performance guarantee. The projected annual savings is $10.8 million dollars from the estimated 38.5 million kWh saved. As shown in the chart to the above; lighting, cooling, fans and pumps account for 67% of the energy consumed at HNL. JCI addressed these top energy users in their ECM project scope in the second chart to the left:
• Lighting – Interior and exterior • Air conditioning system upgrades • Chilled water cooling system upgrades • Air-cooled equipment upgrades • Transformer replacements • Retro-commissioning of air conditioning and ventilation systems • Solar photovoltaic energy generation systems
Airport energy conservation measures (ECMs) included upgrading lighting to energy efficient LEDs throughout the airport. Above, the
old lighting on left had the airport heavily over lit. In 2014, the lighting was replaced by new LED fixtures.
33%
24%
21% 13%
8% 1%
Annual Electricity Usage (2011)
Misc. Equipment Area Lights
Space Cooling Ventilation Fans
Pumps and Aux. Heat Rejection

Honolulu International Airport | 2014 Elements Baseline Update
27
Electricity Source Hawaiian Electric Company (HECO) provides all electricity consumed at HNL. HECO’s energy portfolio is primarily derived from fossil fuels, though it has some distributed renewable energy sources and a small amount of refuse-derived fuel from H-POWER. Electricity is distributed to HNL via several electric vaults throughout the airport property that are directed to both the DOT-A and tenant controlled spaces. JCI is now responsible for leading ECMs at HNL, with oversight from DOT-A and airport management. HNL Annual Electricity Consumption This section provides an overview of the electricity consumption in from 2009 to 2014. The scope of this section includes all electricity consumed within the sHNL program boundary that is served by DOT-A owned HECO meters and accounts. The DOT-A has 70+ individual electric utility meters provided by HECO. These meters read both peak demand (kW) and total consumption (kWh). HECO personnel manually read these meters each month and bill the DOT-A. Depending on the size of the load connected, HECO uses a multiplier to estimate larger energy flows. HECO personnel manually read these meters each month and bill the DOT-A. Both HECO and the DOT-A have an internal energy bill audit process in place to identify high usage and investigate the cause. HNL reduced its electricity consumption overall by 4%, and by 11% per passenger, based on the provided utility data. Consumption gradually increased from 2010 to when it spiked in 2011, then began to decrease from 2012 through 2014. Accurately determining the cause of the annual energy variations is not possible since sub-metering data is unavailable and the EMCS is not yet active. However, the aforementioned ECMs may account for the decrease in consumption. The following graph illustrates annual consumption and cost of energy per passenger from 2009 to 2014. As you can see, the cost of energy has gone up despite reductions in energy use per passenger. This is due to the variable nature of energy rates in Hawaii, which follow the price of oil, since most of HECO’s energy is sourced from oil fired power plants.
$-
$0.5
$1.0
$1.5
$2.0
4.5
5.0
5.5
6.0
2009 2010 2011 2012 2013 2014
Cost
(dol
lars
)
Con
sum
ptio
n pe
r Pas
seng
er (k
Wh)
Energy Consumption and Cost per Passenger (2009-2014)
kWh per Passenger Cost per Passenger

Honolulu International Airport | 2014 Elements Baseline Update
28
RENEWABLE ENERGY GENERATION At HNL, the DOT-A has piloted small-scale renewable energy projects to determine renewable energy feasibility and impact at the airport. Part of JCI’s contract is to develop solar photovoltaic (PV) power generation and energize, or connect, the systems to the HECO grid through a power purchase agreement. This section includes an overview of renewable energy at HNL. Solar Energy Generation Initiatives JCI has installed and now monitors 1,278 kW of DC photovoltaic power (PV) throughout HNL as part of the ESPC contract. A system on the Central Concourse was installed and energized in the 2nd quarter of 2015. The total system wattage is 720 kW by utilizing 2,400 panels rated at 300 watts. Another PV system on the Interisland Terminal has been installed and energized as of June 2015. The total system wattage is 558 kW achieved using 1,836 panels with a mixture of 300-watt and 305-watt rated modules. There are no plans for solar hot water systems at HNL due to low demand. Now that Phase 1 PV systems are installed, energized, and connected, it is planned for HNL to have access to a dashboard system to monitor projected versus actual PV kWh output. The dashboard system is still in development, but will track parameters such as solar and weather data. Annual energy saving reports will be generated for DOT-A as part of JCI’s contractual obligation.
Above: Over 2,000 solar PV panels were installed in the 2nd quarter of 2015, greatly reducing the energy purchased.
Wind Energy Generation Initiatives Boss Communication Technologies (Boss Enertech) installed 16 1-kW building-mounted wind turbines at the airfield’s electrical vault in June 2009. DOT-A purchased and installed the wind turbines in order to supplement the electrical needs of the new airfield in addition to supplying power to the building for smaller loads, such as lights, fans, computers, and other non-critical equipment. DOT-A owns the wind energy system, but does not monitor or collect data since the renewable energy generated is insignificant.

Honolulu International Airport | 2014 Elements Baseline Update
29
Above: A pilot wind energy project generates energy from the prevailing trade winds on an airport-owned building.
OPPORTUNITIES • Ongoing increases in energy efficiency and conservation through lighting, HVAC scheduling & set points, plug
loads, and behavioral change. • Integrate sub-metering into new energy management and control systems (EMCS). • Incentivize tenants to be energy efficient. • Implement a voluntary energy reporting program for all tenants. • Continue to install and generate clean and renewable sourced electricity for facilities.

Honolulu International Airport | 2014 Elements Baseline Update
30
HNL Carbon Element

Honolulu International Airport | 2014 Elements Baseline Update
31
Findings: • DOT-A 2014 direct and indirect (see below for definition) greenhouse gas emissions (carbon) have been reduced by 4%
and 11% per passenger since 2009. o Energy conservation measures reduced stationary carbon emissions related to electricity consumption by 4%. o Changes in operations, combined with unexpected vehicle maintenance and repair, reduced fuel purchased for
ground support resulting in a 4% carbon emissions reduction.
Differences: • Comparing total carbon data from 2009 and 2014, the tenant and public emissions are no longer quantified due to
changes in the scope of this report as well as the exclusion of tenant electricity consumption, the availability of jet fuel consumption data, and challenges with electrical data at HNL.
o The 2009 Elements Baseline reported DOT-A, tenant, and public emissions (Scope 1, 2 and 3 emissions). o The 2014 Elements Baseline Update targets only DOT-A controllable emissions (Scope 1 and 2 emissions).
• Lack of consistent sub-meter data for energy and accurate tenant and DOT-A building space sq. ft., resulted in unquantifiable tenant data.
• This report included the emissions from the Wiki Wiki contracted shuttle operations.
Scope and Boundary: • This report focuses on identifying sources that are directly and indirectly DOT-A’s responsibility at HNL and on
quantifying key carbon emissions. o Direct: DOT-A owned and operated ground support vehicles, contracted shuttle busses, emergency generators,
and HVAC refrigerant emissions (Scope 1). o Indirect: electricity purchased emissions (Scope 2).
Methodology: • The carbon emissions inventory is generated using industry agreed upon best practices of airport carbon emissions
reporting from the World Resources Institute “Greenhouse Gas Protocol”. • Excluded from the Carbon Element per scope, boundary, or industry recommendations:
o Tenant emissions: Operations of aircraft, ground equipment, and other business operations. o Public emissions: Driving employee and passenger vehicles, shuttles, buses, taxis, etc. o Other: Direct emissions from airport firefighting and training exercises, indirect emissions from waste generation,
and indirect emissions from contractor construction equipment.

Honolulu International Airport | 2014 Elements Baseline Update
32
CARBON AT HNL
HNL plans to be the first airport in the State to register their carbon emissions footprint with the Airports Council International (ACI) via the Airport Carbon Accreditation (ACA) program. The ACA was created as an independent, voluntary program by ACI Europe, to encourage and enable airports like HNL to implement best practice carbon and energy management processes, while gaining public recognition of their achievements. With growing participation each year, the ACA now covers 26% of world passenger traffic with 23 airports having reached carbon neutrality status since 2009 for the emissions within their direct control. ACA requires independent third party review to ensure that the data collected and analyzed is as accurate as possible. Once emissions are registered with the ACA program, HNL will develop their carbon management program using the best practices identified by the international airport operator community. CARBON MANAGEMENT & MONITORING Under direction from the Governor in 2006, a Statewide Sustainability Policy was created, committing to cut Greenhouse Gas (GHG) emissions at or below 1990 levels, and be 75% powered by renewable energy by 2050. The state airports division has created the Sustainable DOT-A Program to support the Statewide Sustainability Policy goals by implementing them at the airport level. Since carbon management is a fairly new topic to Hawai‘i, there is currently no management and monitoring system for carbon emissions at HNL. Energy use is managed by the airport engineering staff. Recommendations from the 2009 Elements Baseline were taken into consideration and an energy management plan was put into place. See the Energy Element section in this report for specific details on the energy management plan. Fuel use is managed and monitored via billing information through the airport district office. The office switched to a new invoicing and reporting system in 2012, allowing for automated report generation, increasing operational efficiency. HNL management is aware of the opportunities to exercise fuel efficiency within airport operations as suggested in the 2009 Elements Baseline recommendations. Airport management has purchased more fuel-efficient vehicles and designed an emergency power facility to operate on 100% biodiesel, beginning in late 2015. The Wiki Wiki shuttle bus is a contracted service that provides inter-terminal transportation for passengers. Newly included in the 2014 report, the fuel data comes from the airport ground transportation manager. Opportunities for retrofitting the shuttle with alternative fuels or powered by renewables have been considered but not pursued. CARBON METHODOLOGY The 2014 Elements Baseline Update focuses on identifying sources that are directly and indirectly DOT-A’s responsibility at HNL and on quantifying key carbon emissions. The 2009 Elements Baseline report quantified carbon emissions using the Greenhouse Gas Protocol by identifying the direct, indirect, tenant, and public carbon emissions. Data from 2009 and 2014 is not exactly comparable due to changes in methodology, changes in data, gaps in data, and new data available since the 2009 Elements Baseline. This section of the report follows the principles of the World Business Council for Sustainable Development (WBCSD) and the World Resources Institute (WRI) “Greenhouse Gas Protocol” Corporate Accounting and Reporting Standard. The information presented for the Carbon Element highlights the main components of the DOT-A carbon system pertaining to existing facilities, ground transportation, and data reporting. The Green House Gas (GHG) Protocol categorizes these direct and indirect emissions into three broad scopes:
Scope 1: All direct GHG emissions. Scope 2: Indirect GHG emissions from consumption of purchased electricity. Scope 3: Other indirect emissions.

Honolulu International Airport | 2014 Elements Baseline Update
33
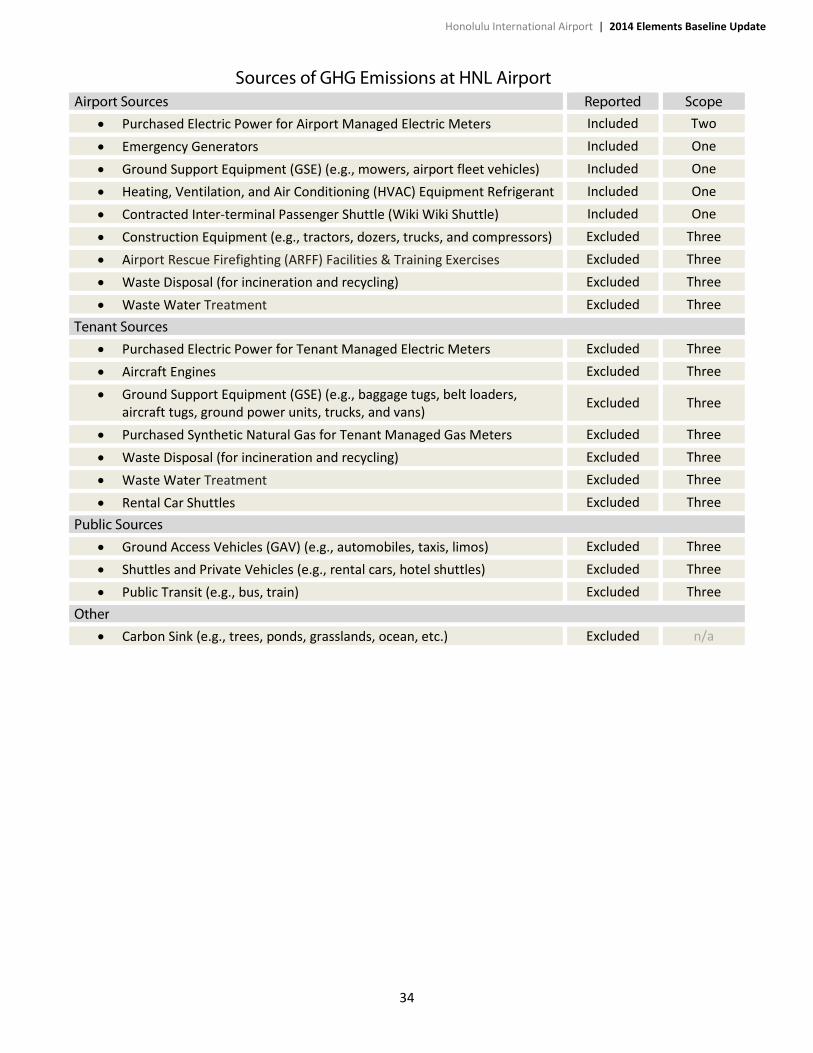
Changes and New Data Available Since 2009 Elements Baseline Data statistics and management practices for carbon come from electricity and fuel documentation in addition to discussions with key HNL stakeholders. In the 2009 Elements Baseline, tenant and DOT-A carbon emissions were quantified and separated based on floor area. However this report does not separate tenant and DOT-A carbon emissions since reliable square-footage data and methodology is unavailable. In addition, the 2009 carbon emissions from purchased electricity changed because new data became available. See Energy Element in this report for explanation. Therefore, carbon emissions from electricity purchased in 2009 increased in this 2014 Elements Baseline Update. Metrics GHG emissions are expressed in mtCO2e (metric tons of carbon equivalent). Emissions are reported in metric tons (2,200 lbs.) per year, which is the international convention used in carbon inventories. The CO2e is the universally accepted metric for measuring carbon equivalent emissions. It consists of carbon, CO2; methane, CH4; and nitrous oxide N2O. Carbon Sources Sources of carbon emissions at Hawai‘i airports include a variety of sources. The major sources are summarized in the table above. DOT-A carbon emissions reflect estimated GHGs emitted by DOT-A owned and/or controlled emission sources (e.g., vehicles and generators). Emissions stemming from electricity purchased from the Hawaiian Electric Company (HECO) for DOT-A consumption are reflected in the DOT-A baseline. Carbon emission sources excluded from this report include all scope three emissions: general construction equipment, airport rescue firefighting (ARFF) and training exercises, waste disposal (for incineration and recycling), offsite wastewater treatment, electricity purchased by tenant managed electrical meters, tenant aircraft operations, tenant ground operations, solid waste disposal and recycling, tenant managed natural gas consumption, employee and passenger vehicles, private shuttles and taxis, and public transit. Fire training exercises are conducted within the HNL boundary, however emissions were not significant enough to include; solid waste disposal and recycling are done offsite and are excluded per Airport Cooperative Research Program (ACRP) recommendations. There is insufficient data to calculate carbon emissions from construction, tenant, and public sources and would require a deeper analysis. HNL has a fair amount of trees, cultural gardens, and fishponds. These so called “carbon sinks” consume carbon dioxide, but this is unlikely to be significant relative to the size of the total emissions captured and these are not accounted for in this inventory.
Honolulu International Airport | 2014 Elements Baseline Update
34
Sources of GHG Emissions at HNL Airport Airport Sources Reported Scope
• Purchased Electric Power for Airport Managed Electric Meters Included Two • Emergency Generators Included One • Ground Support Equipment (GSE) (e.g., mowers, airport fleet vehicles) Included One • Heating, Ventilation, and Air Conditioning (HVAC) Equipment Refrigerant Included One • Contracted Inter-terminal Passenger Shuttle (Wiki Wiki Shuttle) Included One • Construction Equipment (e.g., tractors, dozers, trucks, and compressors) Excluded Three • Airport Rescue Firefighting (ARFF) Facilities & Training Exercises Excluded Three • Waste Disposal (for incineration and recycling) Excluded Three • Waste Water Treatment Excluded Three
Tenant Sources • Purchased Electric Power for Tenant Managed Electric Meters Excluded Three • Aircraft Engines Excluded Three • Ground Support Equipment (GSE) (e.g., baggage tugs, belt loaders,
aircraft tugs, ground power units, trucks, and vans) Excluded Three
• Purchased Synthetic Natural Gas for Tenant Managed Gas Meters Excluded Three • Waste Disposal (for incineration and recycling) Excluded Three • Waste Water Treatment Excluded Three • Rental Car Shuttles Excluded Three
Public Sources • Ground Access Vehicles (GAV) (e.g., automobiles, taxis, limos) Excluded Three • Shuttles and Private Vehicles (e.g., rental cars, hotel shuttles) Excluded Three • Public Transit (e.g., bus, train) Excluded Three
Other • Carbon Sink (e.g., trees, ponds, grasslands, ocean, etc.) Excluded n/a

Honolulu International Airport | 2014 Elements Baseline Update
35
CARBON SUSTAINABILITY CATEGORIES At HNL, Carbon is analyzed for scope one which involves emissions from vehicles, generators, and refrigerants; and scope two which is emissions from purchased electricity generation.
Annual Tons of Direct and Indirect Carbon per Emission Source in mtCO2e at HNL
Emissions Source - DOT-A
2009 2010 2011 2012 2013 2014 Tons
Change 2009 - 2014
Percent Change 2009 - 2014
1. Airport Facility Electricity
83,997 82,244 83,682 84,316 83,417 80,427 - 3,570 - 4%
2. Fugitive Refrigerant Emissions
528 528 528 528 528 528 0 0%
3. Emergency Generators
14 14 14 14 14 14 0 0%
4. Ground Support Equipment (GSE)
621 478 459 577 553 490 - 131 - 21%
5. Mobile Emissions from Shuttles
1,948 1,948 1,948 1,948 1,948 1,985 37 2%
Total 87,108 85,212 86,631 887,363 86,460 83,444 - 3,664 - 4%
STATIONARY CARBON EMISSION SOURCES At HNL, the DOT-A’s main source of carbon emissions comes from stationary sources. Electricity consumption is the largest stationary source followed by fugitive refrigerant emissions and emergency generator use. Airport Facility Electricity Electricity purchased is the largest source of carbon emissions that the DOT-A is indirectly responsible for. This is due to the DOT-A purchasing their power from the Hawaiian Electric Company (HECO), which uses fossil fuels as their primary source of electricity generation. HNL reduced carbon emissions by 3,084 metric tons of CO2e, down by approximately 4% from the 2009 Elements Baseline data. This can be attributed to the progress made by the DOT-A in contracting Johnson Controls, Inc. (JCI) to do an energy savings performance contract (ESPC) across all state owned airports in January 2014. With electricity consumption being the largest source of carbon emissions, any energy reductions will constitute the bulk of carbon emissions reduction. For more discussion on energy management at the airport, see the Energy Element section in this report. Fugitive Refrigerant Emissions The 2014 carbon emissions from fugitive refrigerants are the same as reported in the 2009 Elements Baseline, totaling 528 mtCO2e due to continued use of R-134 refrigerant. As a background, refrigerants are rated by Global Warming Potential (GWP), a measure of how much a given mass of a gas contributes to global warming. Carbon dioxide has a GWP of 1 and is the benchmark for GHG emissions per the Green House Gas Protocol. Refrigerants that leak out of mechanical systems are called fugitive emissions, the largest being air conditioning systems utilizing chillers. Vehicles also have air conditioning systems, but the amounts are fairly insignificant when compared to chillers. This inventory only accounts for chillers.
Honolulu International Airport | 2014 Elements Baseline Update
36
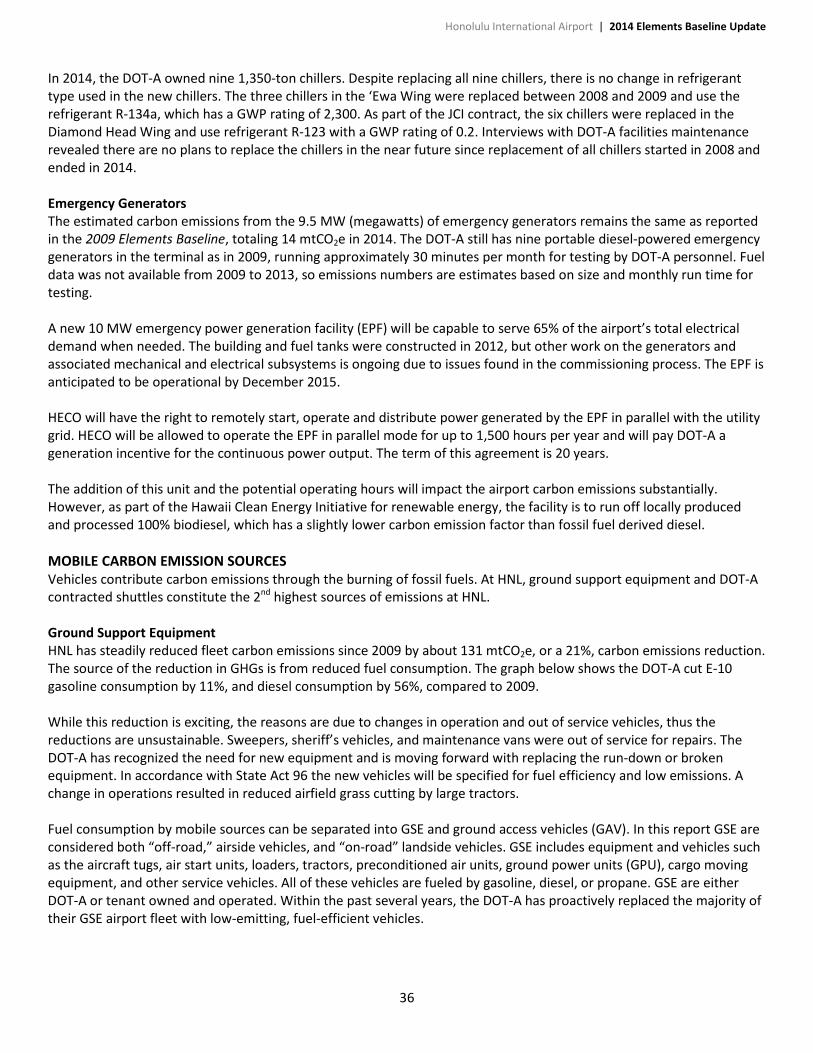
In 2014, the DOT-A owned nine 1,350-ton chillers. Despite replacing all nine chillers, there is no change in refrigerant type used in the new chillers. The three chillers in the ‘Ewa Wing were replaced between 2008 and 2009 and use the refrigerant R-134a, which has a GWP rating of 2,300. As part of the JCI contract, the six chillers were replaced in the Diamond Head Wing and use refrigerant R-123 with a GWP rating of 0.2. Interviews with DOT-A facilities maintenance revealed there are no plans to replace the chillers in the near future since replacement of all chillers started in 2008 and ended in 2014. Emergency Generators The estimated carbon emissions from the 9.5 MW (megawatts) of emergency generators remains the same as reported in the 2009 Elements Baseline, totaling 14 mtCO2e in 2014. The DOT-A still has nine portable diesel-powered emergency generators in the terminal as in 2009, running approximately 30 minutes per month for testing by DOT-A personnel. Fuel data was not available from 2009 to 2013, so emissions numbers are estimates based on size and monthly run time for testing. A new 10 MW emergency power generation facility (EPF) will be capable to serve 65% of the airport’s total electrical demand when needed. The building and fuel tanks were constructed in 2012, but other work on the generators and associated mechanical and electrical subsystems is ongoing due to issues found in the commissioning process. The EPF is anticipated to be operational by December 2015. HECO will have the right to remotely start, operate and distribute power generated by the EPF in parallel with the utility grid. HECO will be allowed to operate the EPF in parallel mode for up to 1,500 hours per year and will pay DOT-A a generation incentive for the continuous power output. The term of this agreement is 20 years. The addition of this unit and the potential operating hours will impact the airport carbon emissions substantially. However, as part of the Hawaii Clean Energy Initiative for renewable energy, the facility is to run off locally produced and processed 100% biodiesel, which has a slightly lower carbon emission factor than fossil fuel derived diesel. MOBILE CARBON EMISSION SOURCES Vehicles contribute carbon emissions through the burning of fossil fuels. At HNL, ground support equipment and DOT-A contracted shuttles constitute the 2nd highest sources of emissions at HNL. Ground Support Equipment HNL has steadily reduced fleet carbon emissions since 2009 by about 131 mtCO2e, or a 21%, carbon emissions reduction. The source of the reduction in GHGs is from reduced fuel consumption. The graph below shows the DOT-A cut E-10 gasoline consumption by 11%, and diesel consumption by 56%, compared to 2009. While this reduction is exciting, the reasons are due to changes in operation and out of service vehicles, thus the reductions are unsustainable. Sweepers, sheriff’s vehicles, and maintenance vans were out of service for repairs. The DOT-A has recognized the need for new equipment and is moving forward with replacing the run-down or broken equipment. In accordance with State Act 96 the new vehicles will be specified for fuel efficiency and low emissions. A change in operations resulted in reduced airfield grass cutting by large tractors. Fuel consumption by mobile sources can be separated into GSE and ground access vehicles (GAV). In this report GSE are considered both “off-road,” airside vehicles, and “on-road” landside vehicles. GSE includes equipment and vehicles such as the aircraft tugs, air start units, loaders, tractors, preconditioned air units, ground power units (GPU), cargo moving equipment, and other service vehicles. All of these vehicles are fueled by gasoline, diesel, or propane. GSE are either DOT-A or tenant owned and operated. Within the past several years, the DOT-A has proactively replaced the majority of their GSE airport fleet with low-emitting, fuel-efficient vehicles.

Honolulu International Airport | 2014 Elements Baseline Update
37
The graph above illustrates the annual fuel consumption by airport controlled ground support equipment (GSE) from 2009 to 2014. Contracted Inter Terminal Passenger Shuttle (Wiki Wiki Shuttle) The contracted shuttle that transports passengers from flights in the overseas terminal to the baggage claim is run by a third party contractor. The fuel data available is only for 2013 and 2014, however it is consistent enough to estimate that each year they use generally the same amount of fuel. Ground Access Vehicles GAV typically includes DOT-A employee vehicles and public passenger vehicles on the landside portion of the airport. It is generally assumed that either gasoline or diesel powers the majority of GAV passing through HNL.
AIRPORT INFLUENCE ON TENANT OPERATIONS EMISSIONS DOT-A’s efforts to increase operational efficiency have indirectly resulted in DOT-A and tenant emission reductions. HNL continues to offer hydrant fueling operations on the ramp, resulting in reduced emissions from tenant fuel tanker trucks. Additionally, the DOT-A supplies 400Hz ground power to medium and large body aircrafts, thus eliminating the need for diesel powered GPU, and minimizing the use of the aircrafts onboard Auxiliary Power Units (APU) run by jet fuel. The airport is currently constructing the consolidated rental car facility (CONRAC) to reduce shuttle service vehicles on airport property. The airport is also constructing a new Mauka Concourse as part of the new Terminal Modernization Program (TMP). The new concourse is guided by the DOT-A’s 2011 Sustainable High Performance Guidelines, a design and construction guideline which specifies energy efficiency throughout the various building systems.
OPPORTUNITIES • Continue to convert ground support equipment to low-emitting and fuel-efficient vehicles. • Develop a vehicle reduced idling plan & campaign. • Continue to increase energy efficiency of airport operations. • Install additional photovoltaic and renewable energy systems. • Submeter tenant electricity usage to get a more accurate representation of DOT-A controlled energy
consumption related emissions.
60,062
42,614 38,188
54,079 53,131 53,347
0k
10k
20k
30k
40k
50k
60k
70k
2009 2010 2011 2012 2013 2014
Cons
umpt
ion
(gal
lons
)
Ground Support Equipment Fuel Consumption (2009-2014)
E-10 (gal.)
Diesel (gal.)

Honolulu International Airport | 2014 Elements Baseline Update
38
HNL Water Element

Honolulu International Airport | 2014 Elements Baseline Update
39
Findings: • DOT-A 2014 managed water consumption increased overall by 12% and by 4% per passenger. The overall increase is
mainly reflective of the change in report methodology – tenant water consumption is no longer quantified. There is also evidence attributed to a rise in demand for water due to increased passengers and aircraft operations since 2009.
• Water management at HNL continues to face some of the challenges as mentioned in the 2009 Elements Baseline. o Lack of an automated management and control system to remotely track detailed performance. o Metering and management of tenant spaces. o Unknown condition and location of all potable water infrastructures. o Unknown volume of wastewater generated and the quantity of storm water. o The distinction of actual water consumption versus leaks is unknown without an effective leak detection program.
Differences: • 2009 water data presented herein differs from 2009 water data presented in the 2009 Elements Baseline. This
difference is the result of a change in methodology as mentioned below. • Comparing total water data from 2009 and 2014, tenant water consumption is no longer quantified.
o This is due to challenges with obtaining actual tenant water use data from those tenants who have utility contracts directly with the Board of Water Supply.
o Lack of consistent sub-meter data for water and accurate tenant and DOT-A building space sq. ft., resulted in unquantifiable tenant data.
• The 2014 Elements Baseline Update added sewer water discharge performance.
Scope and Boundary: • This report focuses on quantifying water consumption under DOT-A’s responsibility within the boundary of HNL’s DOT-
A operations. o The DOT-A water data includes tenants and DOT-A use for those who aren’t on their own BWS meter.
Methodology: • The water data included in this report is inclusive only of what the DOT-A is able to quantify using their utility billing
records. • Data for the Water Element was obtained through document analysis and discussions with key HNL stakeholders.
Honolulu International Airport | 2014 Elements Baseline Update
40
WATER AT HNL
This section provides a comparative overview of water management and consumption at HNL, using similar performance metrics and indicators as in the 2009 Elements Baseline. The City and County of Honolulu Board of Water Supply (BWS) continues to provide water infrastructure for all potable water consumption at HNL, while the Department of Transportation Highways Division (DOT-H) provides non-potable water that is the primary source for HNL landscaping and irrigation. The overall status of the HNL water system is updated in this report. Information includes the metering, management, and demand for potable water and non-potable water; and the management of sewer and storm water. However, sources of water consumption not fully disclosed in the scope of this report include any tenants that have direct contracts with the water and sewer utilities (i.e. larger tenants with land leases). Other items not included in this analysis are: the actual volume of sewage generated, the quality and quantity of storm water, and the distinction between actual water consumption versus leaks. Therefore, the scope of this section represents only water consumed by DOT-A and/or DOT-A controlled water consumption sources within the aforementioned reporting boundary. Although, due to metering limitations in the current water management system, DOT-A water statistics at this time may also include water consumption by tenant owned and/or controlled spaces, facilities and operations. WATER MANAGEMENT & MONITORING A variety of BWS meters and HNL internal master meters are generally used to monitor overall consumption. As reported in the 2007 Honolulu International Airport Water Utilities Master Plan, there are 146 sub-meters within the airport. At the time of meter reading, there was a reported demand difference between master and sub-meter readings, likely attributable to:
• Irrigation • Unmetered Users- Water users connected to the system where there are no sub-meters to monitor the
consumption. There are two (2) known major unmetered demands on the water system; the fishpond at the ground level of the Overseas Terminal and the usage within the Overseas Terminal.
• Leakage- Leaks within the system. Water monitoring at HNL remains a manual process, requiring HNL staff to walk through the facility and record meter readings. HNL remains without a system-wide automated management and control system that is compliant and improves operational efficiency.
Not all tenant spaces at HNL are sub-metered, nor has this been addressed in tenant lease agreements. Currently, DOT-A tenants without sub-meters are charged a standardized fixed rate based on occupied floor area. The fixed rate contributes to a behavioral choice where tenants are not accountable for their water consumption and the burden falls upon DOT-A. The airport meters are unable to track actual water performance at a detailed level because of the lack of sub-metering and an automated management and control system. This level of information is essential for proper and efficient water management. Currently, the overall water infrastructure at HNL is a combination of old and new systems, and in its entirety, unknown. Therefore, HNL has contracted a comprehensive water infrastructure assessment, identifying the location, age, condition, and constructability of water distribution lines, along with meter, valve, and control locations. This comprehensive water assessment will provide DOT-A an inventory, and an indication of leaks and potential leaks. Such an assessment would allow DOT-A to take preventative actions in replacing necessary water lines before leaks occur. Currently, BWS acoustical leak detection tests have been ineffective at HNL, due to noise within the surrounding environment.

Honolulu International Airport | 2014 Elements Baseline Update
41
Water Quality Water quality auditing includes the inspection of water samples for bacteria, and the presence of various chemical substances and microorganisms. The Environmental Protection Agency (EPA) regulates public drinking water at HNL, requiring detailed testing. HNL is currently in compliance with all required testing. Under the HNL Water Maintenance Plan, HNL’s District Maintenance Engineer facilitates the regular collection of bacteria samples from potable water distributed through airport hoses. These hoses connect tenant aircraft to HNL’s water source. Changes in bacteria levels are monitored by DOT-A, however, not intended to test water quality at HNL. The quality of all water sources at HNL remains unknown. DOT-A has put forth a water quality disclaimer to all tenants. Therefore, all tenants are encouraged to have their own Water Quality Management and Monitoring Plan, as well as a water quality trained station manager. Storm Water Management DOT-A owns and operates the Small Municipal Separate Storm Sewer System (Small MS4) to drain storm water from structures, runways, taxiways, and roadways at HNL into Ke‘ehi Lagoon, Mamala Bay, and Manuwai Canal. The HNL Storm water Management Program Plan (SWMPP) was designed to minimize the discharge of storm water and pollutants from HNL and ensure compliance with state and federal regulations. The DOT-A Environmental Section manages the HNL SWMPP and tests the quality of storm water at HNL when weather conditions permit. As of 2014 and under the SWMPP, all airport tenants must create their own Storm water Management Plan and are responsible for coordinating separate MS4 permits with the Hawaii Department of Health (DOH). All HNL MS4 discharges are regulated by the Clean Water Act and specifically a National Pollutant Discharge Elimination System (NPDES) permit from DOH. In 2013, SWMPP training materials and information were published on DOT-A's website. Sections include:
• Storm water Management Plan Overview, • Illicit Discharge/Illegal Connections Best Management Practices Program, • Construction Site Runoff Control Program, • Post Construction Storm water Management, DOT-A Retrofit Feasibility Studies, • Pollution Prevention and Good House Keeping Program, • Industrial and Commercial Activities Discharge Management Program, • Hydrocarbon Removal and Remediation Program, and • Annual Monitoring Plan.
WATER METHODOLOGY The 2014 water data was obtained through document analysis and discussions with key HNL stakeholders. DOT-A Oahu District Maintenance Section provided BWS internal data to quantify potable water delivery to HNL. DOT-A Oahu District Maintenance Engineering Section provided data for total potable and non-potable water consumed at HNL. Tenant space and rental agreement information was obtained from DOT-A Property Management.
2.7 2.4
1.9
1.1 0.8
0.4 0.5 0.5 0.7
2.2 2.3
2.9
0.0
0.5
1.0
1.5
2.0
2.5
3.0
Jan Feb Mar Apr May Jun Jul Aug Sep Oct Nov Dec
Rain
fall
(inch
es)
Average Monthly Rainfall Totals (1971-2000)

Honolulu International Airport | 2014 Elements Baseline Update
42
Data sources are presented as best estimates and presented in gallons (gal.) and thousand gallons (kGal.). 2014 data are normalized according to 2014 gross building floor area, total passengers, and flight operations to allow for cross comparison against 2009 Elements Baseline and across other airports.
WATER SUSTAINABILITY CATEGORIES Water consumption at HNL is characterized as potable or non-potable water. Potable water is sourced from the Honolulu Board of Water Supply, while the non-potable is sourced from Sumida Watercress Farm. As shown in the chart to the right, 83% of water used at HNL in 2014 is potable. In general potable water is used for all airport water demands except for landscape irrigation outside of the terminals which is connected to the non-potable water line. POTABLE WATER Analysis of potable water bills shows an 8% increase from 2009 to 2014, however, per passenger consumption is the same. The graph below is for airport-wide consumption (DOT-A + tenants) normalized by passenger. The water is shown by passenger counts as an industry accepted sustainability metric for water.
NON-POTABLE WATER AND IRRIGATION / LANDSCAPING DOT-A has been using non-potable water for irrigation purposes for quite some time, but data is unavailable from 2010 to 2013. Non-potable water accounted for approximately 17% (86,214 kGal.) of DOT-A 2014 water consumption and there appears to be a growing demand (39% increase) for irrigation water as evidenced in the comparison table below. While using the Sumida Watercress Farm reclaimed water reduces DOT-A consumption of potable water, a problem with using this type of water for irrigation is saltwater infiltration. For non-potable water meter locations and consumption see table below.
Non-potable Water Meter Location and Consumption
Meter Location 2009 (kGal) 2013 (kGal) 2014 (kGal) Percent Change 2009-2014
Aolele 45,704 49,609 52,554 15% Lagoon 1,259 7,034 5,351 325%
Paiea 15,004 27,467 28,309 89% Total 61,967 84,110 86,214 39%
22.0 23.3
25.8
28.1
23.2 22.0
15
17
19
21
23
25
27
29
2009 2010 2011 2012 2013 2014
Wat
er p
er P
asse
nger
(gal
lons
)
Potable Water Consumed per Passenger (2009-2014)
Non-potable
17%
Potable 83%
Water Source Type (2014)

Honolulu International Airport | 2014 Elements Baseline Update
43
DOT-A estimates that 80% of the non-potable water consumed goes towards irrigation and 20% into HNL's koi pond in the iconic Japanese Garden. According to the National Oceanic Atmospheric Administration (NOAA) HNL weather station, HNL receives an average of 20 inches of rainfall annually, which helps to offset the water needed for irrigation. The majority of that rainfall is received between October and March. Despite the seasonal changes in precipitation, non-potable water used remains fairly consistent month-to-month as evidenced in the graph below. This may be due to the fact that HNL does not utilize weather based sensors for landscape irrigation and uses timers instead, and the landscaping choices require more watering than plants native to the area.
SEWER Currently at HNL, water inflow provided by BWS is metered and the outflow of sewage water is not metered. Instead, outflow is estimated by the City & County of Honolulu (C&CH). The actual amount of sewer water that is discharged into the wastewater management system is charged according to the volume of potable water consumed. HNL is forced to adjust tenant sewer fees annually to stay in line with the increasing sewer rates. As of 2014, tenant water and sewer fees were restructured to make up for increasing sewer rates. Up until February 2013, DOT-A was being billed for 100% of the potable water consumed at HNL, as going into the sewer. This was unfortunate for HNL as some potable water is used for irrigation, cooling towers, and consumption by passengers. In 2013, BWS started calculating the sewer bill using an irrigation adjustment of 20% of total potable water used. Data in the table below shows billed sewer volume before and after restructuring.
Annual Sewer Charge Volume and Percent Change
Year 2009 2010 2011 2012 2013 2014 Percent Change 2009-2014
Volume (kGal) 399,969 428,842 466,386 541,312 336,366 344,846 - 14%
OPPORTUNITIES • Comprehensive water audit. • Water management plan and policy. • Identify and repair water leaks. • Drip irrigation equipment. • Low water landscaping and xeriscaping to reduce water and fertilizer use. • Evaluate the water use of cooling tower and explore alternative sources for water. • Evaluate the feasibility of using reclaimed water for landscaping and flushing toilets.
7.8k 8.2k 7.2k
8.7k
6.0k 6.8k 6.8k 7.1k 7.6k
6.9k 7.1k 6.1k
0k
5k
10k
Wat
er C
onsu
mpt
ion
(kGa
l.)
Non-potable Water Monthly Consumption at HNL in (2014)

Honolulu International Airport | 2014 Elements Baseline Update
44
HNL Waste Element

Honolulu International Airport | 2014 Elements Baseline Update
45
Findings: • DOT-A 2014 managed airport-wide waste generation increased overall by 67% and by 55% per passenger. This is
mainly attributed to the changes in methodology of calculating waste generation at HNL.
Differences: • In 2014, a new waste contractor began waste management operations at HNL for all DOT-A operations and facilities. • 2014 MSW data is based on the current hauler’s best estimates as opposed to disposal manifests. • There were changes in waste management operations from 2009 to 2014.
o 2014 green waste is commingled with MSW removed from HNL; therefore the MSW weight reflects green waste and MSW data combined.
o 2014 newspaper and cardboard recycling data was not available and therefore calculated using the frequency of pick-up, estimated volume when removed, and EPA standard weight conversions.
• New waste categories in this report include: hazardous, electronic, and construction and demolition.
Scope and Boundary: • The scope excluded a tonnage survey and comprehensive waste audit of both DOT-A and public collection bins, as well
as tenant MSW surveys. • Tenant waste is excluded in the scope of the 2014 Elements Baseline Update report. • The 2014 data in the Waste Element includes DOT-A MSW and recycling contracts throughout HNL facilities. Methodology: • All waste calculations are best estimates and from discussions with key HNL Stakeholders.
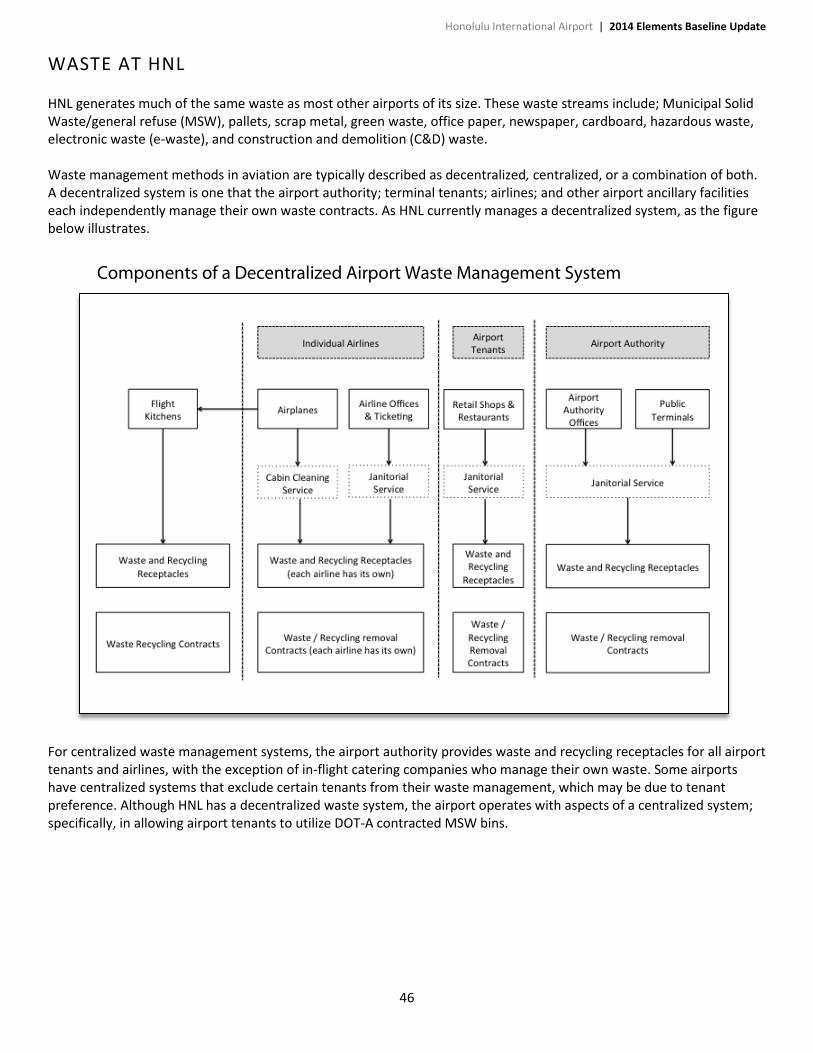
Honolulu International Airport | 2014 Elements Baseline Update
46
WASTE AT HNL
HNL generates much of the same waste as most other airports of its size. These waste streams include; Municipal Solid Waste/general refuse (MSW), pallets, scrap metal, green waste, office paper, newspaper, cardboard, hazardous waste, electronic waste (e-waste), and construction and demolition (C&D) waste. Waste management methods in aviation are typically described as decentralized, centralized, or a combination of both. A decentralized system is one that the airport authority; terminal tenants; airlines; and other airport ancillary facilities each independently manage their own waste contracts. As HNL currently manages a decentralized system, as the figure below illustrates.
Components of a Decentralized Airport Waste Management System
For centralized waste management systems, the airport authority provides waste and recycling receptacles for all airport tenants and airlines, with the exception of in-flight catering companies who manage their own waste. Some airports have centralized systems that exclude certain tenants from their waste management, which may be due to tenant preference. Although HNL has a decentralized waste system, the airport operates with aspects of a centralized system; specifically, in allowing airport tenants to utilize DOT-A contracted MSW bins.

Honolulu International Airport | 2014 Elements Baseline Update
47
Deplaned Waste Another waste stream categorized by airports is one that is generated onboard aircrafts during in-flight service; this is also known as, deplaned waste. Due to the complexity of separating recyclables from MSW during in-flight operations, many airports, regardless of their waste management system, have found it difficult to manage and track waste generated from deplaned waste streams. The same can be said for airline carriers that have implemented in-flight recycling programs. Some air carriers look for ways to reduce their impacts on the landfill by purchasing biodegradable or compostable products for in-flight services and recycling cans and bottles. However, most airline carriers find it difficult to implement a proper in-flight waste-recycling program without support from airport authorities. Airline carriers at HNL are finding that much of the waste they separate in-flight is collected and commingled back into the airport owned MSW receptacles. Therefore, to support airlines’ efforts to reduce waste destined for landfills, HNL has an opportunity to implement an airport-wide deplaned waste diversion program. WASTE MANAGEMENT & MONITORING The decentralized waste management system at HNL is managed and monitored by the Airport Duty Managers. Since the 2009 Elements Baseline, the airport has expanded on the types of materials they recycle, while consolidating others into the MSW. All DOT-A contracted MSW bins are collected and sent to the Honolulu waste-to-energy facility, H-POWER, for incineration. Current recycling and waste treatment contracts are available for the following materials:
• Scrap metal, • Office paper, • Newspaper, • Cardboard,
• Pallets, • Electronic waste (E-waste), and • Hazardous waste
In 2014, the airport has added a contract to manage and recycle e-waste generated by all DOT-A Division and HNL District operations. Due to changes in operations, green waste collection is now commingled into the MSW waste stream and transported to Honolulu’s H-POWER. Key stakeholders that manage the different waste streams at HNL are the Division’s Environmental Section, and District’s Maintenance Base Yard, Maintenance Engineering, and Landside Operation Section – Custodial Unit. HNL currently does not have a designated data tracking system for all waste categories. There are, however, certain categories where metrics can be tracked and calculated via waste manifests and recycling tickets provided by the waste contractors. WASTE METHODOLOGY The Waste Element’s performance metrics and indicators are presented by the following categories:
• Municipal Solid Waste (MSW) • Scrap Metal Recycling • Pallets Disposal • Hazardous Waste Treatment • Office Paper Recycling • Newspaper Recycling • Cardboard Recycling • Electronic Waste (E-waste) Recycling • Construction & Demolition (C&D) Waste
Disposal

Honolulu International Airport | 2014 Elements Baseline Update
48
The data will be presented in the following sections as pounds (lbs.) and short tons (tons). 2014 MSW data represents general refuse generated from Division and District operations and the general public. The 2014 waste data and information came from discussions with key waste stakeholders; DOT-A reporting documents, such as, HNL’s 2009 Elements Baseline and HNL’s 2009 Waste Assessment; and waste manifests and recycling tickets. To calculate the diverted waste from HNL, a diversion rate calculation was used; this is the total recycled waste divided by the total waste generated, multiplied by one hundred. The diversion rate quantifies an organization’s efforts of waste reduction, recycling, reuse and/or composting. The Waste Element has a variety of sources that support the 2014 data; however, gaps in data reflect best estimates by Division and District-managed waste and recycling contracts. The table below identifies whether materials are analyzed in this report and where data tracking is currently available, not available, or where best estimates were used. Due to the change in scope from 2009, the public area waste study and DOT-A contracted dumpster tonnage study was excluded from the 2014 Elements Baseline Update.
Waste Tracking and Reporting at HNL
DOT-A Sources Reported Metrics Tracking
• Municipal Solid Waste (MSW) Included Estimated
• Scrap Metal Recycling Included Available
• Office Paper Recycling Included Available
• Newspaper Recycling Included Estimated
• Cardboard Recycling Included Estimated
• Green Waste Composting Not Included n/a
• Pallets Disposal Included Available
• Hazardous Waste Treatment Included Available
• Electronic Waste (E-waste) Recycling Included *n/a
• Construction & Demolition (C&D) Disposal Included n/a
Airport Tenant Sources • Municipal Solid Waste (MSW) Excluded n/a
• Recycling Excluded n/a
* An e-waste recycling collection has yet to be implemented

Honolulu International Airport | 2014 Elements Baseline Update
49
WASTE SUSTAINABILITY CATEGORIES Recycling and re-use of materials is the first priority for the airport, then incineration or landfill disposal. The DOT-A’s Municipal Solid Waste (MSW) is transported to the city and county of Honolulu waste-to-energy facility, H-POWER. The airport is diverting 4,500 tons of their waste from the landfill, assuming 90% of the MSW is incinerated with 10% going to the landfill as ash.
However the diversion rate due to recycling, reuse and composting is very different, with less than 1% going to reuse, excluding public area waste recycling. These numbers are best estimates based on contractor data and interviews. A full airport wide waste audit would provide a more complete picture.
10%
89%
1% 0.2%
Waste Weight by Method of Disposal (2014)
Landfill
Incineration
Recycle
Hazardous WasteDisposal
83.0
16.9 25.0 20.3 25.9
46.3
0
20
40
60
80
100
2009 2010 2011 2012 2013 2014
Was
te D
iver
ted
(ton
s)
Waste Diverted to Reuse, Recycling, and Composting (2009-2014)
14.1
20.4
1.8
7.8
20.0
4.8 5.9
15.6
0
5
10
15
20
25
Scrap Metal Recycling Office Paper Recycling Newspaper Recycling Cardboard Recycling
Was
te D
iver
ted
(ton
s)
Waste Diversion by Stream (2009 and 2014)
2009 2014

Honolulu International Airport | 2014 Elements Baseline Update
50
MUNICIPAL SOLID WASTE (MSW) MSW collection at HNL includes all state contracted front load and open top, large waste dumpsters surrounding the airport property. All MSW at HNL is currently managed by the District’s Airport Duty Managers. With MSW having a direct impact to aircraft safety, the Airport Duty Managers ensure that any issues pertaining to waste collection or accessibility will be immediately addressed. According to the airport’s new waste management contractor, approximately 5,000 tons of waste was collected from HNL in 2014. This is almost an 80% increase in DOT-A MSW generation as shown in the table below. The significant increase in waste can be attributed to the green waste being commingled into the MSW waste stream.
Total DOT-A MSW Generation
Year 2009 2014 Percent Change 2009 - 2014
MSW Weight (tons) 2,794.8 5,000.0 79% SCRAP METAL RECYCLING The DOT-A Environmental Department is responsible for managing the airport’s scrap metal recycling program. Corroded metal has a negative impact on storm water quality at HNL. In previous years, the department has hosted annual airport-wide scrap metal recycling drives, which includes tenant and DOT-A. However, due to a decrease in participation and difficulties with monitoring proper disposal, the airport no longer hosts these events. Although annual scrap metal recycling drives have stopped, DOT-A continues to recycle scrap metal for Division and District operations only. The staging area for DOT-A contracted scrap metal recycling is at the airport’s Maintenance Base Yard facility. Metrics for scrap metal was collected from recycling tickets received by the contracted recycler. Data shows that although there has been a 42% increase in scrap metal recycling, trends show a significant drop from 2013 to 2014. This change may have been attributed to the various construction projects that have occurred throughout the airport during the period between 2009 and 2014.
Total Scrap Metal Recycled from 2009 through 2014
Year 2009 2010 2011 2012 2013 2014 Percent Change 2009-2014
Scrap Metal Weight (tons) 14.1 16.9 25.0 20.3 25.9 20.0 42%
PALLETS DISPOSAL Similar to the MSW contract, the Airport Duty Managers are responsible for managing pallet disposal. Pallets at HNL are typically placed between the airport’s Maintenance Base Yard and Aolewa Street at the Pallet Yard, a staging area for all pallets from both airport tenants and Division and District operations. Although HNL has designated a site for pallets, there are no formal protocols or established operational procedures for reuse of pallets. If in good enough condition, some are reused onsite or made available for community reuse. Those that are not, accumulate until the Maintenance Base Yard staff is notified to crush the pallets and transfer the shredded materials into several, 40 cubic yard, open top bins. According to the airport’s waste hauler, each bin averages a total of 3 tons per haul. Such practices have raised issues and concerns facing pallet management, which include:
• Miscellaneous bulky items, other than pallets, tend to get disposed at the pallet yard. • Continuous relocation of the Pallet Yard due to various construction projects on airport property. • Disposal practices reduce the opportunity for the airport and public community to reuse pallets.

Honolulu International Airport | 2014 Elements Baseline Update
51
Between May 2014 and February 2015, the airport disposed of 174 tons (348,000 lbs.) of pallets, all of which were sent to the PVT Land Company or for disposal. The table below shows the increase in pallets disposed between 2009 and 2014.
Pallets Collected and Disposed in 2009 and 2014
Year 2009 2014 Percent Change 2009 - 2014
Pallets (tons) 67.9 174.0 156%
HAZARDOUS WASTE TREATMENT All hazardous waste are monitored and managed by Division’s Environmental Section. The staging areas for all hazardous materials are located at the Maintenance Base Yard facility. EPA requires that all treated hazardous materials be tracked using the EPA’s hazardous materials waste manifests. As hazardous waste was not included in the 2009 Elements Baseline, the following table shows the data from 2010 through 2014.
Treated Hazardous Materials from Hazardous Waste Manifest
Year 2010 2011 2012 2013 2014 Percent Change 2010 - 2014
Hazardous Waste Weight (tons) 5.7 9.9 12.4 8.0 10.4 46%
OFFICE PAPER, NEWSPAPER, and CARDBOARD RECYCLING According to the City Ordinance No. 95-64, all office buildings with 20,000 square feet or more are required to provide separate collection and recycling of office paper, newspaper and corrugated cardboard. Both Airport Division and District administrative offices currently recycle office paper, newspaper, and cardboard. The program is managed by Division’s Environmental Section and operated by the staff at the Maintenance Base Yard. According to the airport’s recycling contractor of office paper, newspaper, and cardboard, HNL has recycled a total of 4.8 tons (or 9,600 lbs.) of office paper in 2014. However, as data was not available from the recycler, best estimates were used to calculate newspaper and cardboard recycling data. This totaled approximately 5.9 tons (or 11,700 lbs.) of newspaper and 15.6 tons (or 31,200 lbs.) of cardboard recycled in 2014. The breakout by materials in the table below. The decrease in office paper recycling is from changes in operations by the recycling hauler, who excludes color printed and colored paper from their recycling. The significant increase with Newspaper and Cardboard is due to the changes in operations by the recycling hauler. 2014 newspaper and cardboard recycling data was not available and therefore calculated using the frequency of pick-up, estimated volume when removed, and EPA standard weight conversions.
Total Office Paper, Newspaper, and Cardboard Recycling
Year 2009 2014 Percent Change 2009 - 2014
Office Paper (tons) 20.4 4.8 - 76%
Newspaper (tons) 1.8 5.9 228%
Cardboard (tons) 7.8 15.6 100%

Honolulu International Airport | 2014 Elements Baseline Update
52
GREEN WASTE COMPOSTING Currently green waste is collected and managed separately on airport property by both Maintenance Base Yard personnel and HNL’s landscaping contract service providers. This presents an opportunity to compost; however, green waste is collected and commingled with the MSW. HNL’s landscaping contractors maintain the landscape along Lagoon Drive, Rodgers Boulevard and Elliott Street. HNL Maintenance Base Yard landscape personnel maintain the rest of the landscaping on HNL property, which includes two airport gardens, one at the Overseas Terminal and one at the Interisland Terminal, and the landscape along Aolele Street. All green waste disposed of by District landscaping is collected into two open top 30 cubic yard bins located at the airport’s Maintenance Base Yard. As previously mentioned, the 2014 green waste data is unavailable as all materials are commingled with the MSW data and transported to H-POWER for incineration. ELECTRONIC WASTE (E-WASTE) RECYCLING Since the banning of e-waste disposal by businesses and government agencies on O‘ahu in 2008, the airport has taken steps towards responsibly managing their e-waste collection and disposal. In 2014 the DOT-A acquired a contract to recycle 5,000 pounds of Division and District level e-waste equipment. This contract, however, excludes all tenant e-waste equipment. The Division’s Environmental Section manages the new contract which has yet to be executed. Even with the e-waste recycling contract, the airport still faces several issues when it comes to e-waste recycling and management. Without an airport-wide e-waste recycling program, tenants and DOT-A continue to store e-waste equipment within their leased or unoccupied spaces on airport property, such as the waste chute rooms. The abandoned equipment is both a liability and a burden for DOT-A personnel to dispose of. As these items accumulate, Maintenance Base Yard personnel are responsible for collecting and properly disposing the materials, thus making forecasting for annual e-waste disposal costs difficult. DOT-A has recently been exploring and piloting options to reduce the amount of DOT-A and tenant e-waste accumulating on airport property. CONSTRUCTION & DEMOLITION (C&D) WASTE DISPOSAL HNL currently does not monitor construction & demolition (C&D) waste generated by projects on airport property. However, there are efforts to encourage contractors to consider proper C&D disposal best practices, as written under the Best Practices section of the DOT-A Storm Water Management Program Plan (SWMPP).
OPPORTUNITIES • Develop a comprehensive Waste Management Plan and policy. • Implement airport-wide programs for deplaned waste diversion, paper reduction, e-waste collection and
recycling and green waste. • Paper use reduction program • Donate surplus food, equipment & goods to charity. • Utilize sealed compactors instead of open-top front loading dumpsters. • Expand scope to C&D Waste.

Honolulu International Airport | 2014 Elements Baseline Update
53

Honolulu International Airport | 2014 Elements Baseline Update
54
R E C O M M E N D E D R E A D I N G / R E S O U R C E S
Airport Cooperative Research Program. ACRP Synthesis 10: Airport Sustainability Practices. Rep. 2008. Print Airport Cooperative Research Program. ACRP Report 100: Recycling Best Practices – A Guidebook for Advancing Recycling from Aircraft Cabins. 2014. Print Airports Council International. Airport Carbon Accreditation: Guidance Document – Issue 8 v2. 2014. Print. Airport Council International – North America. 2014 Environmental Affairs Committee Work Plan. 2014. Web. < http://www.aci-na.org/sites/default/files/2014_envt_committee_work_plan.pdf>. Energy Information Administration. Hawaii Energy Profile. 2014. Web. <http://www.eia.gov/state/?sid=HI> Federal Aviation Administration. Recycling, Reuse, and Reduction Waste at Airports: A Synthesis Document. 2013. Print Global Reporting Initiative. G3.1 Airport Operators Quick Reference Sheet. Print. Global Reporting Initiative. G4 Guidelines. 2013. Web. <https://www.globalreporting.org/reporting/g4/Pages/default.aspx>. Giambelluca, T.W., X. Shuai, M.L. Barnes, R.J. Alliss, R.J. Longman, T. Miura, Q. Chen, A.G. Frazier, R.G. Mudd, L. Cuo, and A.D. Businger. Evapotranspiration of Hawai‘i. Final report submitted to the U.S. Army Corps of Engineers—Honolulu District, and the Commission on Water Resource Management, State of Hawai‘i. 2014. Web. < http://evapotranspiration.geography.hawaii.edu/>. Hawai‘i Bar Journal. Act 234: Hawaii’s Climate Change Law. 2008. Web. <http://www.honolulu-lawyers.com/files/hi_bar_journal_may_2008.climate_change.pdf> Hawai‘i Community Foundation. Environment and Sustainability. 2014. Web. <http://www.hawaiicommunityfoundation.org/community-impact/areas-interest/environment-and-sustainability>. Hawai‘i Department of Business, Economic Development & Tourism, Research and Economic Analysis Division. The State of Hawaii Data Book. 2013. Web. Hawaii Department of Environmental Services City and County of Honolulu. 2013 Interim Status Report on the Integrated Solid Waste Management Plan (2008). 2013. Print Hawaii Department of Transportation-Airport’s Division. 2009 Waste Assessment Report. 2009. Print Hawaii Department of Transportation-Airport’s Division. 2009 Elements Baseline. 2011. Print Hawaii Department of Transportation-Airport’s Division. Final Environmental Impact Assessment-Honolulu Airport Emergency Power Facility. 2008. Print Hawaii Department of Transportation-Airport’s Division. Honolulu International Airport Master Plan. 2010. Print Hawai‘i Green Growth. Aloha+ Challenge: A Culture of Sustainability, He Nohona ‘Ae‘Oia- Press Release. 2014. Web. <http://hawaiigreengrowth.org/hgg-blog/104-press-release-aloha-challenge-a-culture-of-sustainability-he-nohona-ae-oia>.

Honolulu International Airport | 2014 Elements Baseline Update
55
Natural Resource Defense Council. Trash Landings – How Airlines and Airports Can Clean Up Their Recycling Programs. 2006. Web. <www.nrdc.org/cities/recycling/airline/airline.pdf>. State of Hawaii and United States Department of Energy. 2014 Memorandum of Understanding Hawaii Clean Energy Initiative. Print. Sustainable Energy for All. 2014 Annual Report. 2014. Web. <http://www.se4all.org/wp-content/uploads/2015/05/SE4ALL_2014_annual_report_final.pdf> The Cadmus Group, Inc. Cadmus to Develop Water Efficiency Guide for Airports. 2014. Web. <http://www.cadmusgroup.com/news/cadmus-develop-water-efficiency-guide-airports/>. The World Bank. What A Waste: A Global Review of Solid Waste Management. 2012. Print US Environmental Protection Agency. How to Start A Recycling Program at Your Airport. 2010. Web. <http://www.epa.gov /osw/conserve/rrr/rogo/documents/airports/htm>. US Environmental Protection Agency. Standard Volume to Weight Conversion Factors. 2006. Web. < www.epa.gov/osw/partnerships/wastewise/pubs/conversions/pdf>. United Nations Educational, Scientific and Cultural Organization, Water Cooperation 2013. Facts and Figures. 2013.Web. <http://www.unwater.org/water-cooperation-2013/water-cooperation/facts-and-figures/en/>. United Nations News Centre. World Population Projected to Reach 9.6 Billion by 2050- UN Report. Web. <http://www.un.org/apps/news/story.asp?NewsID=45165#.VVV7uflViko>. United States Environmental Protection Agency. Summary of the Clean Water Act. 2015. Web. <http://www2.epa.gov/laws-regulations/summary-clean-water-act>. United States Environmental Protection Agency. Executive Order 13514: Federal Leadership in Environmental, Energy, and Economic Performance. 2012. Web. <http://www.epa.gov/greeningepa/practices/eo13514.htm>. United States Environmental Protection Agency. Carbon Equivalencies. 2015. Web. United States Geological Survey. How Much Water Is There On, In, and Above the Earth. 2014. Web. <https://water.usgs.gov/edu/earthhowmuch.html>. U.S. Water Alliance. About Us. 2015. Web. < http://uswateralliance.org/alliance-overview/>. World Water Council. Water Crisis: Towards A Way to Improve the Situation. Web. <http://www.worldwatercouncil.org/library/archives/water-crisis/>.

56
ACKNOWLEDGEMENTS
Thank you to all the HNL and DOT-A staff and extended community for your knowledge, expertise, insight, and support in the creation of this resource. The following individuals and organizations are among many who have helped in the creation of the 2014 Elements Baseline Update:
DOT-A Allen Muranaka Andrew Watson
Ann Shiigi Anne Hayashi
Benton Ho Brian Kami Cathy Ehia
Charles Seabury Chris Murphy
Deane Kadokawa Dennis Lopez
Eddy Takiguchi Evan Kimoto
Gary Yokoyama Gaylene Chun
Guy Ichinotsubo Janne Brash
Jimmy Koshino Joy Masuda
Keith Ishinaga Kimberly Evans Kurt Yamasaki
Lynette Kawaoka Mary Montez
Perle Ho Ross Smith Roy Sakata
Segundo Velasco Wesley Matsunaga
Community
Stan Hirta—Honolulu Disposal Service Gail Suzuki-Jones—DBEDT
Elisa Asato—Honolulu Disposal Service Craig Matsuo—Honolulu Recovery Systems
Dan Maxwell—Johnson Controls, Inc. Leigh Masui—Johnson Controls, Inc.
Alan Okimoto—DBEDT
Naomi Akamine—DBEDT Carilyn Shon—DBEDT
Mark Robinson—Momentum Bay Steven Olson—Engineering Economics, Inc.

57
58
ACRONYMS AND ABBREVIATIONS
ACA: Airport Carbon Accreditation
ACI: NA- Airports Council International of North America
APU: Auxiliary Power Unit
ARFF: Aircraft Rescue & Firefighting Facility
BWS: Board of Water Supply
C&CH: City and County of Honolulu
C&D: Construction and Demolition
CONRAC: Consolidated Rental Car Facility
DOH: State of Hawai‘i, Department of Health
DOT: State of Hawai‘i, Department of Transportation
DOT-A: State of Hawai‘i, Department of Transportation Airports Division
DOT-H: Department of Transportation Highways Division
ECM: Energy Conservation Measure
EONS: Economic viability, Operational efficiency, Natural resource conservation, and Social responsibility
EPA: Environmental Protection Agency
EPF: Emergency Power Facility
EMCS: Energy Management and Control System
ESPC: Energy Savings Performance Contract
FAA: Federal Aviation Administration
gal: Gallons
GAV: Ground Access Vehicle
GRI: Global Reporting Initiatives
GPU: Ground Power Unit
GSE: Ground Support Equipment
HECO: Hawaiian Electric Company
HNL: Honolulu International Airport
HVAC: Heating, Ventilation, and Air Conditioning
IIT: Interisland Terminal
JBPHH: Joint Base Pearl Harbor Hickam
JCI: Johnson Controls, Incorporated
kGal: Kilogallon
kWh: Kilowatt hour

59
LEED: Leadership in Energy & Environmental Design
lbs: Pounds
LPG: Liquid Propane Gas
MSW: Municipal Solid Waste
mtCO2e: Metric Ton of Carbon Dioxide Equivalent
MW: Megawatts
NOAA: National Oceanic Atmospheric Administration
NPDES: National Pollutant Discharge Elimination System
NRDC: Natural Resource Defense Council
OST: Overseas Terminal
PV: Solar Photovoltaic
SAG: Sustainable Aviation Guidance Alliance
sDOT-A: Sustainable Department of Transportation Airports Division
sHNL: Sustainable Honolulu International Airport
SNG: Synthetic Natural Gas
SWMPP: Storm water Management Program Plan
TRB: Transportation Research Board
TRBACRP: Transportation Research Board Airport Cooperative Research Program
GHG Protocol: Greenhouse Gas Protocol developed by the World Resources Institute and World Business Council for
Sustainable Development
WRI: World Resources Institute

60
AIRP
ORT
S
Honolulu Intl LAWA St. Paul Intl ACRP: Eval Impacts of
Sus Prac on O&M Newark Liberty Intl Teterboro Fresno Yosemite Intl
Efficiency & Conservation
Energy Energy Energy Conservation Energy Conservation Energy
Renewable Energy Renewable Energy Renewable Energy Alternative Fuels
Track, Monitor & Report
Greenhouse Gas Emissions Greenhouse Gases Greenhouse Gases
Air Quality & Emissions
Air Quality Air Quality Air Quality Air Emissions
IEQ Indoor Environmental Quality
Efficiency & Conservation
Water Water Conservation Water Management Water Conservation
Quality Water Quality
Stormwater Stormwater Management
Reduction & Management Waste Management Waste Management Waste Management Solid Waste Management Waste Minimization Solid Waste
Recycling Recycling Recycling Recycling Recycling Recycling
HazMat Hazardous Materials Hazardous Materials
Resourcing Material & Resources Consumables & Materials
Employees Health & Welfare of Employees
Health, Safety & Security
Travelers
Partnerships
Administration
Community Community Outreach Community Outreach Community Outreach
Socioeconomic Socioeconomic Benefits
Operational Efficiency Operational Efficiency
Administrative Processes
Contracts & Procurement
Contract and Lease Management
Climate Change Climate Change Adaptation Climate Change Adaptation
Transportation Transportation Ground TransportationSurface Transportation
Management
Noise Airport Noise & Mitigation Noise
Facilities Green Buildings, Facilities & Infrastructure
Economic impact
Land Use Sustainable Site & Land Use Compatibility
Landscape Landscape Management
Construction
Design Sustainable Design
Environment
Natural Resource Management
Sustainability Goals
OTH
ER
Operations
Natural Resource Management
Sustainability Categories Matrix AnalysisSUSTAINABILITY
CATEGORIES
ENER
GYW
ASTE
WAT
ERCA
RBO
N

61
Hartsfield-Jackson Atlanta Intl Orlando Intl Denver Intl Newton City-County
Ithaca Tompkins Regional Tampa Intl Nashville Intl TOTAL
Energy Management Energy Energy Energy Efficiency Energy Conservation Energy Management Passenger Terminal Energy Efficiency
12
Renewable Energy 4
Greenhouse Gas Emissions Greenhouse Gas Emissions 6
Emissions Reduction Air Pollutant Emissions Air Quality Enhancement Air Quality 8
1
Integrated Water Resources Management
Water Water Conservation Water Efficiency Water Conservation 9
Water Quality Water Quality Protection 3
Stormwater Management 2
Waste Reduction Waste Solid Waste Sent to Landfills Solid Waste Reduction 10
Recycling 6
Hazardous Materials 3
Materials Use Materials Management 5
Employee Satisfaction 2
Health, Safety & Security 1
Travelers 1
Business Partners 1
Administration 1
Partnerships & Community Involvement Community Partnerships Community Outreach Community Outreach Community Community Support 9
Socioeconomic Benefits Socioeconomic 3
Operations & Maintenance 3
1
Procurement Buy green 3
Climate Change 2
Ground TransportationSurface Transportation
Management Surface Transportation 6
Noise Management Noise Abatement Aircraft Noise 5
1
Financial Sustainability Regional Economic Impact 2
Land Use Compatibility Land Use Land Use On- & Off-Site 4
1
Green Construction Construction Construction Build Green 4
Design 2
Environment 1
Land & Natural Resource Management
Natural Systems Management (NSM) - Air
Natural Resources Conservation
4
NSM - Water 1
NSM - Biodiversity (2) 1
NSM - Waste (2) 1
Sustainability Goals & Targets
Institution of Sustainability 2

62
PAU