2014 diversity and inclusion survey
28
2014 Diversity and Inclusion State of the Industry
-
Upload
cb-bowman-mcec-master-corporate-executive-coach -
Category
Business
-
view
120 -
download
1
Transcript of 2014 diversity and inclusion survey

2014 Diversity and Inclusion
State of the Industry

DEMOGRAPHICS
• 44.7 percent of respondents are director level or above.
• 59.7 percent of responding organizations are in the private sector.
• 30.6 percent or responding organizations have a diversity and inclusion budget less
than 100 thousand dollars.
393 Respondents
26.0%
37.8%
17.4%
18.8%
0% 10% 20% 30% 40%
Mostly located in onecountry in one location
Mostly located in onecountry with multiple
locations
Mostly located in onecountry with some global
distribution
Highly distributed withmultiple locations across
the globe
How would you describe the geographic distribution of your workforce?
44.3%
14.8% 10.9%
29.9%
0%
5%
10%
15%
20%
25%
30%
35%
40%
45%
50%
0 to 2,500 2,500 to 5,000 5,000 to10,000
10,000+
Organization Size

Trends in Diversity and Inclusion • The majority of respondents view Diversity and
Inclusion as a strategic enabler for their organization.
• 33 percent of survey takers consider Diversity and
Inclusion critically important to the success of the
entire organization.
• More than half of respondents report that their
organizations do not track supplier diversity.
• 73 percent of responding organizations set targets for increasing racial and gender diversity.

How is the diversity and inclusion function at your organization organized?
46.9%
34.6%
18.5%
Centralized
Mixed (cross-functional)
Decentralized

The diversity and inclusion function at my organization is:
16.2%
52.1%
0.3% 0.3%
23.3%
0%
10%
20%
30%
40%
50%
60%
A stand-alonefunction
A subset functionwithin another
department
Outsourced to someextent
Completelyoutsourced
We do not have aD&I function

What is the title of the head of the D&I function at your organization?
32.1%
22.1%
12.1%
11.6%
5.1%
1.0%
0% 5% 10% 15% 20% 25% 30% 35%
We don't have anyone in this role
VP/officer/department head of HR or HR-related department or function
Other senior HR executive
Chief Diversity Officer/Chief DiversityExecutive
Executive
Chief Learning Officer

At my organization, the head of the D&I function reports to:
30.9%
24.7%
21.8%
0%
5%
10%
15%
20%
25%
30%
35%
No one in this role CEO Chief Human Resources Officer

What department does the head of D&I at your organization work in?
57.5%
7.5%
6.9%
6.1%
0% 10% 20% 30% 40% 50% 60% 70%
Human Resources
Learning & Development
Talent/Workforce Management
Operations

Which of the following does your organization’s D&I strategy target?
63.9% 61.5% 61.2%
26.0%
18.3% 18.0%
1.9%
0%
10%
20%
30%
40%
50%
60%
70%

In my view, the diversity and inclusion function at my organization operates as:
16.6%
14.0%
69.4%
A cost center
A necessary but costlycontributor to the business
A strategic enabler for ourbusiness strategy

In the view of senior leadership at my organization, the D&I function operates as:
16.0%
25.5% 58.5% A cost center
A necessary but costlycontributor to the business
A strategic enabler for ourbusiness strategy

Please rate the level of importance of diversity and inclusion to the success of your
entire organization from your perspective:
33.0%
30.6%
17.0%
13.1%
6.3%
0% 5% 10% 15% 20% 25% 30% 35%
Critically important
Very important
Important
Somewhat important
Not important at all
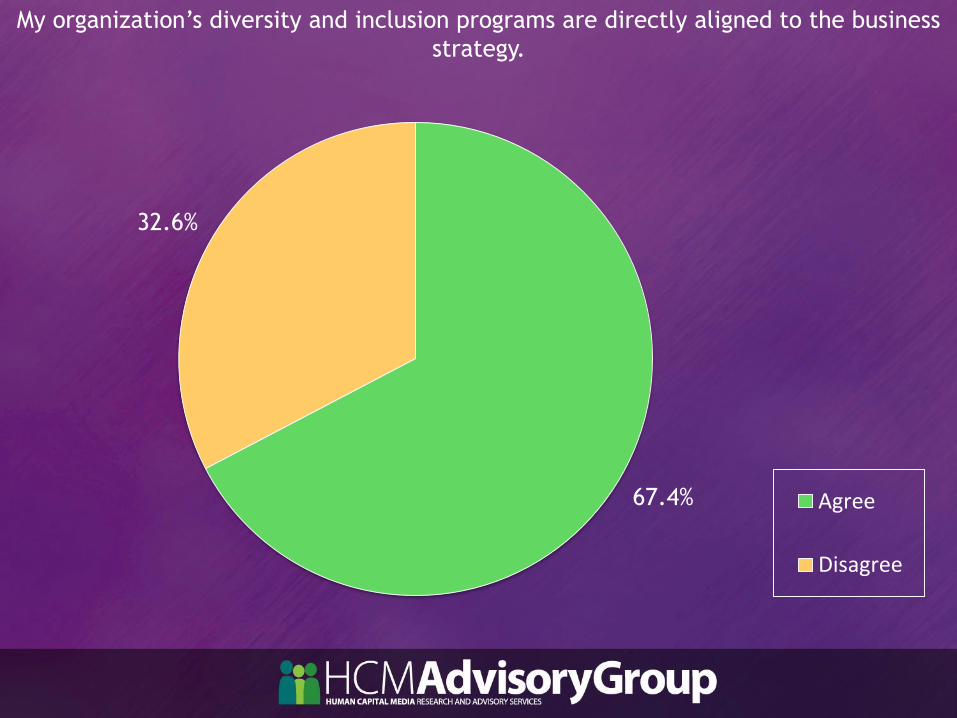
My organization’s diversity and inclusion programs are directly aligned to the business
strategy.
67.4%
32.6%
Agree
Disagree

Does your organization track supplier diversity?
18.6%
27.9%
53.5%
Yes
To some extent
No

Which of the following diverse suppliers does your organization target?
78.4% 74.3%
51.5% 48.5%
35.7%
0%
10%
20%
30%
40%
50%
60%
70%
80%
90%
Ethnic minority-owned businesses
Women-ownedbusinesses
Veteran-ownedbusinesses
Disabled-ownedbusinesses
LGBT-ownedbusinesses

Does your organization set annual targets to increase supplier diversity?
27.9%
35.2%
36.9%
Yes
To some extent
No

Does your organization have specific strategies to improve supplier diversity?
50.8% 49.2%
Yes
No

Organizations gather measurements, metrics, or track these employee
segments.
93.5% 86.6% 85.0%
72.2% 70.9%
58.8% 52.6%
29.3% 25.6%
17.0%
0%
10%
20%
30%
40%
50%
60%
70%
80%
90%
100%

How often are these metrics reviewed by the leader of the diversity and inclusion
function?
40.8%
38.6%
35.8%
35.2%
29.9%
26.4%
29.6%
17.2%
8.5%
6.4%
7.8%
6.6%
0.8%
0.8%
0.8%
1.4%
0% 5% 10% 15% 20% 25% 30% 35% 40% 45%
Gender
Age
Race/Ethnicity
Disability Status
Annually Quarterly Monthly Weekly

How often are these metrics reviewed by the leader of the diversity and inclusion
function?
25.6%
25.2%
15.7%
12.1%
17.8%
10.3%
8.9%
7.4%
4.6%
3.5%
3.0%
3.0%
0.6%
0.6%
0.6%
0.9%
0% 5% 10% 15% 20% 25% 30%
National Origin
Familial Status
Sexual Orientation
Gender Identity
Annually Quarterly Monthly Weekly

Are diversity and inclusion metrics reported to the senior leadership team?
42.2%
37.7%
20.1%
Yes
To some extent
No

Does your organization create annual targets to increase this employee segment?
73.2% 72.7%
41.5% 40.0%
27.8%
19.5%
6.3% 5.9% 3.9%
0%
10%
20%
30%
40%
50%
60%
70%
80%

Does your organization have specific D&I programs for this employee segment?
67.4%
62.2%
42.5%
41.5%
33.2%
26.9%
24.4%
11.4%
10.9%
0% 10% 20% 30% 40% 50% 60% 70% 80%
Gender
Race
Veteran Status
Disability Status
Age
National Origin
Gender Identity
Familial Status
Religious Affiliation

Which of the following D&I strategies/programs are used by your organization?
60.6%
46.8% 44.6%
39.4% 38.8% 36.0%
20.0%
0%
10%
20%
30%
40%
50%
60%
70%
Culturalcompetency and/orsensitivity training
Diversity council Communityoutreach
Employee resourcegroups (ERGs)
Externalbenchmarking for
diversity &inclusion
Executiveeducation/coaching
programs
Partner with line ofbusiness peers

Are your organization’s management performance, pay, bonuses and
promotions tied to diversity and inclusion indicators?
13.8%
86.2%
Yes
No

Benchmarking will help you improve your D&I function
and contribute to improving the industry as a whole.
• Understand best practices of D&I.
• Understand how to bridge from representation to
utilization.
• Gain recognition as an industry leader contributing
to the art of D&I.
Apply for the 2015 DVI Today!

To learn more about Diversity Executive’s benchmarking program, visit our FAQ or download the free Executive Summary.