2014 CUSTOMER SATISFACTION SURVEYS FINAL REPORT
147
Submitted to: Delaware Department of Transportation Submitted by: AECOM 0 1 2 3 4 5 6 7 2014 CUSTOMER SATISFACTION SURVEYS FINAL REPORT August 2014
Transcript of 2014 CUSTOMER SATISFACTION SURVEYS FINAL REPORT

Submitted to: Delaware Department of Transportation Submitted by: AECOM
01234567
2014 CUSTOMER SATISFACTION SURVEYS FINAL REPORT
August 2014

2014 CUSTOMER SATISFACTION SURVEYS
TABLE OF CONTENTS
Chapter 1 Executive Summary 1-1
1.1 Introduction ............................................................................................................................ 1-1 1.2 General Transportation User Survey ..................................................................................... 1-2
1.2.1 Profile of Customer Satisfaction Results ......................................................................... 1-2 1.2.2 Satisfaction Index ............................................................................................................ 1-4 1.2.3 Mobility Assessment Results ........................................................................................... 1-5 1.2.4 Improvement Action Results ............................................................................................ 1-6 1.2.5 Perceived Effectiveness .................................................................................................. 1-6 1.2.6 Continuation of Additions to the 2012 Survey ................................................................. 1-6
1.3 Transit-Served Market Area Survey ....................................................................................... 1-7 1.3.1 Reasons for Not Using Public Transit on a Frequent Basis ............................................ 1-7 1.3.2 Importance-Performance Quadrant Analysis .................................................................. 1-9 1.3.3 Satisfaction Index .......................................................................................................... 1-10 1.3.4 Mobility Assessment Results ......................................................................................... 1-11 1.3.5 Transit Service Awareness & Familiarity ....................................................................... 1-12 1.3.6 Knowledge of Bus Services In Area .............................................................................. 1-12 1.3.7 Recognition of & Familiarity with DART First State ....................................................... 1-12 1.3.8 Transit Information Sources .......................................................................................... 1-14
1.4 Shippers and Carriers Survey .............................................................................................. 1-17 1.4.1 Satisfaction Index .......................................................................................................... 1-19 1.4.2 Biggest Freight Problems Facing Businesses ............................................................... 1-20
Chapter 2 General Transportation Users Survey 2-1
2.1 Survey Objectives .................................................................................................................. 2-1 2.2 Summary of Research Methodology ...................................................................................... 2-1 2.3 Relative Importance & Performance of Modal Attributes ....................................................... 2-2
2.3.1 Drive-Alone or Single-Occupant-Vehicle (SOV) Users ................................................... 2-2 2.3.2 All Motorists ..................................................................................................................... 2-8 2.3.3 Carpoolers (Ride or Drive with Others) ......................................................................... 2-13 2.3.4 Transit Users ................................................................................................................. 2-16 2.3.5 Bicyclists ........................................................................................................................ 2-23 2.3.6 Pedestrians .................................................................................................................... 2-27
2.4 Overall Satisfaction Ratings ................................................................................................. 2-33 2.4.1 Summary of Modal Satisfaction Question Results ........................................................ 2-33 2.4.2 Perceptions of Mobility .................................................................................................. 2-37
2.5 Community Concerns ........................................................................................................... 2-37 2.6 Ability to Walk in Neighborhoods ......................................................................................... 2-38 2.7 Improvement Action Ratings ................................................................................................ 2-38
2.7.1 Perceived Effectiveness ................................................................................................ 2-38 2.8 Demographics ...................................................................................................................... 2-41
2.8.1 Residential Tenure ........................................................................................................ 2-41 2.8.2 Motor Vehicle Availability ............................................................................................... 2-41 2.8.3 Respondent Age ............................................................................................................ 2-42 2.8.4 Residential Area Type ................................................................................................... 2-42 2.8.5 Ethnicity ......................................................................................................................... 2-42

2.8.6 Number of Persons in Household 16 years or Older .................................................... 2-43 2.8.7 Household Income ......................................................................................................... 2-43 2.8.8 Respondent Gender ...................................................................................................... 2-43
Chapter 3 Transit-Served Market Area Survey 3-1
3.1 Survey Objectives ................................................................................................................... 3-1 3.2 Summary of Research Methodology ...................................................................................... 3-1 3.3 Reasons for Not Using Public Transit on a Frequent Basis ................................................... 3-2 3.4 Relative Importance & Performance of Modal Attributes ....................................................... 3-3
3.4.1 Drive-Alone or Single-Occupant-Vehicle (SOV) Users .................................................... 3-4 3.4.2 All Motorists .................................................................................................................... 3-10 3.4.3 Carpoolers (Ride or Drive with Others) .......................................................................... 3-15 3.4.4 Bicyclists ......................................................................................................................... 3-18 3.4.5 Pedestrians .................................................................................................................... 3-22
3.5 Overall Satisfaction Ratings ................................................................................................. 3-27 3.5.1 Summary of Modal Satisfaction Question Results ......................................................... 3-27 3.5.2 Perceptions of Mobility ................................................................................................... 3-30
3.6 Transit Awareness ................................................................................................................ 3-31 3.6.1 Knowledge of Bus Services In Area ............................................................................... 3-31 3.6.2 Recognition of & Familiarity with DART First State ........................................................ 3-31 3.6.3 Transit Information Sources ........................................................................................... 3-33
3.7 Demographics....................................................................................................................... 3-37 3.7.1 Residential Tenure ......................................................................................................... 3-37 3.7.2 Motor Vehicle Availability ............................................................................................... 3-37 3.7.3 Respondent Age ............................................................................................................. 3-37 3.7.4 Residential Area Type .................................................................................................... 3-38 3.7.5 Ethnicity .......................................................................................................................... 3-38 3.7.6 Number of Persons in Household 16 years or Older ..................................................... 3-38 3.7.7 Household Income ......................................................................................................... 3-39 3.7.8 Respondent Gender ....................................................................................................... 3-39
Chapter 4 Shippers and Carriers Survey 4-1
4.1 Survey Objectives ................................................................................................................... 4-1 4.2 Summary of Research Methodology ...................................................................................... 4-1 4.3 Relative Importance & Performance of Modal Attributes ....................................................... 4-2
4.3.1 Those Who Ship, Carry or Transport by Truck ................................................................ 4-2 4.3.2 Rail Freight ....................................................................................................................... 4-9 4.3.3 Air Freight ...................................................................................................................... 4-16 4.3.4 Port of Wilmington .......................................................................................................... 4-20
4.4 Overall Satisfaction Ratings ................................................................................................. 4-27 4.4.1 Summary of Modal Satisfaction Survey Results ............................................................ 4-27
4.5 Biggest Freight Problems Facing Businesses ...................................................................... 4-30 4.6 About the Businesses ........................................................................................................... 4-30
4.6.1 Length of Time Doing Business in Delaware ................................................................. 4-30 4.6.2 Goods Shipped or Carried ............................................................................................. 4-31 4.6.3 Number of Business Locations ...................................................................................... 4-31
Chapter 5 Comparison of Results 5-1
5.1 Introduction ............................................................................................................................. 5-1 5.2 Satisfaction Index ................................................................................................................... 5-1 5.3 Conclusions ............................................................................................................................ 5-5

LIST OF FIGURES
Chapter 1 Executive Summary
Figure 1-1 Chart of User Groups .................................................................................................. 1-2 Figure 1-2 High Priority Attributes - General Transportation User Survey ................................... 1-3 Figure 1-3 Satisfaction Indices - 2003 through 2014 - All User Groups, General Transportation
User Survey ........................................................................................................................... 1-5 Figure 1-4 Chart of User Groups .................................................................................................. 1-5 Figure 1-5 Reasons for Not Using Public Transit on a Frequent Basis - 2014 ............................ 1-7 Figure 1-6 High Priority Attributes – Transit Served Survey ........................................................ 1-9 Figure 1-7 Satisfaction Indices – 2003 through 2014 - All User Groups, Transit-Served Market
Area Survey ......................................................................................................................... 1-11 Figure 1-8 Awareness of DART First State ................................................................................ 1-12 Figure 1-9 How familiar would you say you are with DART or DART First State –do you know a
great deal about the agency, some, just a little or not much at all? .................................... 1-13 Figure 1-10 Level Familiarity with Bus Routes and How to Use the System, 2014 Data in Red.......................................................................................................................... 1-13 Figure 1-11 Sources Used & Helpfulness, 2014 Data in Red .................................................... 1-14 Figure 1-12 High Priority Attributes – Shippers & Carriers Survey ............................................ 1-18 Figure 1-13 Satisfaction Indices - 2003 through 2014 - All Modes, Shippers and Carriers Survey ................................................................................................................................. 1-20 Figure 1-14 Biggest Freight Issue/Problem Facing Your Business ............................................ 1-20
Chapter 2 General Transportation Users Survey
Figure 2-1 Importance of Highway Attributes ............................................................................... 2-3 Figure 2-2 Mean Importance Ratings – SOV Users ..................................................................... 2-4 Figure 2-3 Performance of Highway Attributes ............................................................................ 2-4 Figure 2-4 Mean Performance Ratings – SOV Users .................................................................. 2-5 Figure 2-5 Importance-Performance Ratings and Satisfaction Indices – SOV Users .................. 2-6 Figure 2-6 Importance – Performance Quadrants ........................................................................ 2-7 Figure 2-7 Importance – Performance Quadrant Analysis - SOV Users ...................................... 2-7 Figure 2-8 Importance of Highway Attributes - All Motorists ........................................................ 2-9 Figure 2-9 Mean Importance Ratings – All Motorists ................................................................. 2-10 Figure 2-10 Performance of Highway Attributes - All Motorists ................................................. 2-10 Figure 2-11 Mean Performance Ratings – All Motorists............................................................. 2-11 Figure 2-12 Importance-Performance Ratings and Satisfaction Indices – All Motorists ............ 2-12 Figure 2-13 Importance – Performance Quadrant Analysis – All Motorists ............................... 2-12 Figure 2-14 Importance of Carpool Attributes - All Carpoolers .................................................. 2-14 Figure 2-15 Mean Importance Ratings – All Carpoolers ............................................................ 2-14 Figure 2-16 Performance of Carpool Attributes - All Carpoolers ................................................ 2-15 Figure 2-17 Mean Performance Ratings – All Carpoolers ......................................................... 2-15 Figure 2-18 Importance – Performance Ratings and Satisfaction Indices - All Carpoolers ....... 2-16 Figure 2-19 Importance – Performance Quadrant Analysis - All Carpoolers ............................. 2-16 Figure 2-20 Importance of Transit Attributes .............................................................................. 2-17 Figure 2-21 Mean Importance Ratings - Transit Users .............................................................. 2-18 Figure 2-22 Performance of Transit Attributes ........................................................................... 2-19 Figure 2-23 Mean Performance Ratings – Transit Users ........................................................... 2-20 Figure 2-24 Importance-Performance Ratings and Satisfaction Indices – Transit Users .......... 2-21 Figure 2-25 Importance – Performance Quadrant Analysis – Transit Users ............................. 2-22 Figure 2-26 Importance of Bicycle Attributes ............................................................................. 2-23 Figure 2-27 Mean Importance Ratings – Bicycle Users ............................................................. 2-24
Figure 2-28 Performance of Bicycle Attributes ........................................................................... 2-24 Figure 2-29 Mean Performance Ratings - Bicycle Users ........................................................... 2-25 Figure 2-30 Importance – Performance Ratings and Satisfaction Indices – Bicycle Users ....... 2-26 Figure 2-31 Importance – Performance Quadrant Analysis – Bicycle Users ............................. 2-26 Figure 2-32 Importance of Pedestrian Attributes ........................................................................ 2-28 Figure 2-33 Mean Importance Ratings - Pedestrians................................................................. 2-29 Figure 2-34 Performance of Pedestrian Attributes ..................................................................... 2-29 Figure 2-35 Mean Performance Ratings - Pedestrians .............................................................. 2-30 Figure 2-36 Importance-Performance Ratings and Satisfaction Indices - Pedestrians ............. 2-31 Figure 2-37 Importance-Performance Quadrant Analysis - Pedestrians ................................... 2-32 Figure 2-38 Results of the Summary Modal Satisfaction Questions (2014 data in Red) ........... 2-33 Figure 2-39 Results of Transportation System Satisfaction Questions ...................................... 2-35 Figure 2-40 Overall Transportation System Satisfaction by County – (2014 Data in Red) ........ 2-36 Figure 2-41 Community Concerns Considered in Transportation Projects (2014 Data in Red) 2-38 Figure 2-42 Ease of Walking Around the Community You Live in (2014 Data in Red) .............. 2-38 Figure 2-43 Action Evaluation – How Effective Would <the Action> Be In Improving the
Transportation System? ...................................................................................................... 2-39 Figure 2-44 Residential Tenure .................................................................................................. 2-41 Figure 2-45 Motor Vehicle Availability ........................................................................................ 2-41 Figure 2-46 Respondent Age ..................................................................................................... 2-42 Figure 2-47 Residential Area Type ............................................................................................. 2-42 Figure 2-48 Ethnicity ................................................................................................................... 2-42 Figure 2-49 Number of Persons Aged 16 or Older ..................................................................... 2-43 Figure 2-50 Household Income .................................................................................................. 2-43 Figure 2-51 Respondent Gender ................................................................................................ 2-43 Chapter 3 Transit-Served Market Area Survey
Figure 3-1 Reasons for Not Using Public Transit on a Frequent Basis........................................ 3-3 Figure 3-2 Importance of Highway Attributes ............................................................................... 3-4 Figure 3-3 Mean Importance Ratings – SOV Users ..................................................................... 3-5 Figure 3-4 Performance of Highway Attributes ............................................................................ 3-6 Figure 3-5 Mean Performance Ratings – SOV Users .................................................................. 3-7 Figure 3-6 Importance-Performance Ratings and Satisfaction Indices – SOV Users .................. 3-8 Figure 3-7 Importance – Performance Quadrants ........................................................................ 3-8 Figure 3-8 Importance – Performance Quadrant Analysis - SOV Users ...................................... 3-9 Figure 3-9 Importance of Highway Attributes ............................................................................. 3-10 Figure 3-10 Mean Importance Ratings – All Motorists ............................................................... 3-11 Figure 3-11 Performance of Highway Attributes ........................................................................ 3-12 Figure 3-12 Mean Performance Ratings – All Motorists............................................................. 3-13 Figure 3-13 Importance-Performance Ratings and Satisfaction Indices – All Motorists ............ 3-13 Figure 3-14 Importance – Performance Quadrant Analysis – All Motorists ............................... 3-14 Figure 3-15 Importance of Carpool Attributes ............................................................................ 3-15 Figure 3-16 Mean Importance Ratings – All Carpoolers ............................................................ 3-16 Figure 3-17 Performance of Carpool Attributes .......................................................................... 3-16 Figure 3-18 Mean Performance Ratings – All Carpoolers ......................................................... 3-17 Figure 3-19 Importance – Performance Ratings and Satisfaction Indices – All Carpoolers ...... 3-17 Figure 3-20 Importance – Performance Quadrant Analysis - All Carpoolers ............................. 3-17 Figure 3-21 Importance of Bicycle Attributes ............................................................................. 3-18 Figure 3-22 Mean Importance Ratings – Bicyclists .................................................................... 3-19 Figure 3-23 Performance of Bicycle Attributes ........................................................................... 3-19 Figure 3-24 Mean Performance Ratings – Bicyclists ................................................................. 3-20 Figure 3-25 Importance-Performance Ratings and Satisfaction Indices – Bicyclists ................. 3-20 Figure 3-26 Importance-Performance Quadrant Analysis – Bicyclists ....................................... 3-21 Figure 3-27 Importance of Pedestrian Attributes ........................................................................ 3-22

Figure 3-28 Mean Importance Ratings – Pedestrians ................................................................ 3-23 Figure 3-29 Performance of Pedestrian Attributes ..................................................................... 3-23 Figure 3-30 Mean Performance Ratings – Pedestrians ............................................................. 3-24 Figure 3-31 Importance-Performance Ratings and Satisfaction Indices – Pedestrians ............. 3-25 Figure 3-32 Importance-Performance Quadrant Analysis – Pedestrians................................... 3-26 Figure 3-33 Results of the Summary Modal Satisfaction Questions – 2014 Data in Red .......... 3-27 Figure 3-34 Overall Transportation System Satisfaction by County – 2014 Data in Red .......... 3-29 Figure 3-35 Results of Overall Transportation System Satisfaction Questions ......................... 3-30 Figure 3-36 Awareness of DART First State .............................................................................. 3-31 Figure 3-37 How familiar would you say you are with DART or DART First State –do you know a great deal about the agency, some, just a little or not much at all? ....................... 3-32 Figure 3-38 Level Familiarity with Bus Routes and How to Use the System, 2014 Data in Red ...................................................................................................................................... 3-32 Figure 3-39 Sources Used & Helpfulness - 2014 Data in Red ................................................... 3-33 Figure 3-40 Residential Tenure .................................................................................................. 3-37 Figure 3-41 Motor Vehicle Availability ........................................................................................ 3-37 Figure 3-42 Respondent Age ..................................................................................................... 3-37 Figure 3-43 Residential Area Type ............................................................................................. 3-38 Figure 3-44 Ethnicity ................................................................................................................... 3-38 Figure 3-45 Number of Persons Aged 16 or Older ..................................................................... 3-38 Figure 3-46 Household Income .................................................................................................. 3-39 Figure 3-47 Respondent Gender ................................................................................................ 3-39 Chapter 4 Shippers and Carriers Survey
Figure 4-1 Importance of Highway Attributes ............................................................................... 4-3 Figure 4-2 Mean Importance Ratings – Businesses Using Trucks to Move Goods ..................... 4-4 Figure 4-3 Performance of Highway Attributes ............................................................................ 4-5 Figure 4-4 Mean Performance Ratings - Businesses Using Trucks to Move Goods ................... 4-6 Figure 4-5 Importance-Performance Ratings and Satisfaction Indices - Businesses using Trucks
to Move Goods ...................................................................................................................... 4-7 Figure 4-6 Importance – Performance Quadrants ........................................................................ 4-8 Figure 4-7 Importance – Performance Quadrant Analysis - Businesses Using Trucks to Move
Goods .................................................................................................................................... 4-8 Figure 4-8 Importance of Rail Freight Attributes ........................................................................ 4-10 Figure 4-9 Mean Importance Ratings - Businesses Using Rail Freight to Move Goods ............ 4-11 Figure 4-10 Performance of Rail Freight Attributes .................................................................... 4-12 Figure 4-11 Mean Performance Ratings - Businesses Using Rail Freight to Move Goods ....... 4-13 Figure 4-12 Importance-Performance Ratings and Satisfaction Indices – Rail Freight ............. 4-14 Figure 4-13 Importance – Performance Quadrant Analysis – Rail Freight ................................ 4-15 Figure 4-14 Importance of Air Freight Attributes ........................................................................ 4-16 Figure 4-15 Mean Importance Ratings - Businesses Using Air Freight to Move Goods ............ 4-17 Figure 4-16 Performance of Air Freight Attributes ...................................................................... 4-17 Figure 4-17 Mean Performance Ratings - Businesses Using Air Freight to Move Goods ......... 4-18 Figure 4-18 Importance-Performance Ratings and Satisfaction Indices – Air Freight ............... 4-19 Figure 4-19 Importance – Performance Quadrant Analysis – Air Freight .................................. 4-20 Figure 4-20 Importance of Port of Wilmington Attributes………………......................................4-21 Figure 4-21 Mean Importance Ratings – Port of Wilmington……………………………………...4-22 Figure 4-22 Performance of Port of Wilmington Attributes…………………………………………4-23 Figure 4-23 Mean Performance Ratings – Port of Wilmington…………………………………….4-24 Figure 4-24 Importance – Performance Ratings and Satisfaction Indices –Port of Wilmington.4-25 Figure 4-25 Importance – Performance Quadrant Analysis – Port of Wilmington…………...….4-26 Figure 4-26 Summary Modal Satisfaction Questions – 2014 Data in Red ................................. 4-27

Figure 4-27 Should the state do more, less or about the same to improve the movement of goods
…? 2014 Data in Red .......................................................................................................... 4-29 Figure 4-28 Biggest Freight Issue/Problem Facing Your Business ............................................ 4-30 Figure 4-29 Length of Time Doing Business in Delaware .......................................................... 4-30 Figure 4-30 Goods or Materials Shipped or Carried .................................................................. 4-31 Figure 4-31 Number of Business Locations ............................................................................... 4-31
Chapter 5 Comparison of Results
Figure 5-1 Customer Satisfaction Index – General Transportation User Survey – 2014 Data in Bold .................................................................................................................................... 5-2 Figure 5-2 Customer Satisfaction Index – General Transportation User Survey ......................... 5-2 Figure 5-3 Customer Satisfaction Index – Transit-Served Market Area Survey - 2014 Data in Bold
............................................................................................................................................... 5-3 Figure 5-4 Customer Satisfaction Index – Transit Served Market Area Survey .......................... 5-3 Figure 5-5 Customer Satisfaction Index – Shippers and Carriers Survey - 2014 Data in Bold ... 5-4 Figure 5-6 Customer Satisfaction Index - Shippers and Carriers…………………………….…….5-4

2014 Customer Satisfaction Surveys Executive Summary
Final Report Page 1-1
Chapter 1
Executive Summary The following summarizes the key findings of the customer satisfaction surveys conducted in 2014 for the Delaware Department of Transportation. Customer Satisfaction Surveys were first conducted in 1997 and are repeated on a nearly annual basis to obtain trend data. The survey data are used as inputs into the Department’s progress monitoring program. Readers are encouraged to read the full report for additional details. AECOM conducted the study with Abt SRBI as sub-consultant.
1.1 Introduction Like the previous survey efforts, the main objective of the 2014 study was to ascertain information about customer satisfaction with the transportation system in Delaware. Information from the 2014 survey can be compared to the previous surveys and when repeated, allows the Department to monitor customer satisfaction over time. Information from the surveys serves as a set of inputs into the Department’s progress monitoring program. This program assesses the Department's performance against the goals and objectives of the Statewide Long-Range Transportation Plan. In 2014, three different user groups were surveyed as part of this study. These user groups represent some of the different customer segments served by the Department. The first and largest survey was a random statewide survey of 1,208 Delaware residents aged 16 years and older, entitled the General Transportation User Survey. In the previous survey done in 2012, cell phone and online (Internet) interviews were conducted for the first time in addition to land line telephone interviews to yield more representative results. This 2014 survey also utilizes a mix of cell phone, land line telephone and online (Internet) interviews. Like previous efforts, the specific information objectives for the 2014 survey were • For users of each transportation mode, to ascertain the level of importance of various
attributes. • For users of each transportation mode, to ascertain the level of performance of various
attributes. • For users of each transportation mode, to ascertain the level of satisfaction attained for each
modal attribute and for the mode overall. The second survey conducted was a random statewide survey of 89 Delaware residents, aged 16 years and older. This survey was directed at residents that reside in the transit-served areas of Delaware, but whom had not taken transit during the previous month. This survey was also conducted in the previous survey years. This survey is entitled the Transit-Served Market Area Survey. Similar to the 2012 survey, the 2014 survey included cell phone interviews and internet-based surveys. Like the previous efforts, the specific information objectives were: • For users of each transportation mode, to ascertain the level of importance of various
attributes. • For users of each transportation mode, to ascertain the level of performance of various
attributes. • For users of each transportation mode, to ascertain the level of satisfaction attained for each
modal attribute and for the mode overall. • To identify Delawareans’ awareness of and familiarity with transit services. • To identify Delawareans’ use and satisfaction with different transit service communication
methods. In addition to the above objectives, in the year 2001, questions were added to explore potential barriers to transit use. A series of questions were added to the survey to understand why those residing in transit-served areas do not use transit more frequently. These questions have been used in every survey since 2001.

2014 Customer Satisfaction Surveys Executive Summary
Final Report Page 1-2
The third survey conducted was a telephone survey of 97 businesses that ship, carry or transport goods in Delaware. Entitled the Shippers and Carriers Survey, the sample frame for this survey was the International Registration Plan (IRP) database, augmented by lists of shortline and Class I railroads and tenants at the Port of Wilmington. This survey was also conducted in the previous survey years. Like the previous survey years, the specific information objectives in 2014 were: • For businesses using each transportation mode, to ascertain the level of importance of
various attributes. • For businesses using each transportation mode, to ascertain the level of performance of
various attributes. • For businesses using each transportation mode, to ascertain the level of satisfaction attained
for each modal attribute and for the mode overall. Figure 1-1 below provides chart showing the various user groups surveyed in 2014.
Figure 1-1 Chart of User Groups
User Group Sample Size
Description
General Transportation 1,208 Random statewide survey of adult residents of Delaware
Transit-Served 89
Random statewide survey of adult residents that live in the “transit-served” areas of Delaware (that is, within ¼ mile of a bus route) that currently do not use transit
Shippers and Carriers 97 Random statewide survey of businesses in Delaware that either ship, carry or transport goods in Delaware
1.2 General Transportation User Survey
1.2.1 Profile of Customer Satisfaction Results In the survey, respondents were asked to rate the importance, and to assess the current transportation system performance on a specific set of service attributes for each mode that was used the previous week. Five modes were asked about and include: driving alone, carpooling (riding or driving with others), using transit, bicycling, and walking. As was found in the previous survey years, drive-alone was the most prevalent form of transportation used the previous week. For 2014, 72% of respondents made drive-alone trips, 61% made carpool trips, 16% walked for some of their trips, 8% made trips by transit and 2% made trips by bicycle. The importance-performance ratings given by customers using each mode for the different service attributes asked about in the survey can be summarized into four importance-performance quadrants for policy-makers and decision-makers to use. The attributes that were in the highest priority quadrant for corrective action (these are attributes that were rated above average in importance but below average in performance by customers) for each mode are shown in Figure 1-2 and are included the following for 2014, as well as the surveys since 2003:

2014 Customer Satisfaction Surveys Executive Summary
Final Report Page 1-3
Figure 1-2 High Priority Attributes - General Transportation User Survey
AUTO 2014
AUTO 2012
AUTO 2009
AUTO 2006
AUTO 2005
AUTO 2004
AUTO 2003
Having highways free from congestion
Having well-planned sequencing and timing of traffic signals
Pavement condition on roadways
Having highways free from congestion
Having well-planned sequencing and timing of traffic signals
Pavement condition on roadways
Having highways free from congestion
Having well-planned sequencing and timing of traffic signals
Pavement condition on roadways
Having highways free from congestion
Having well-planned sequencing and timing of traffic signals
Having highways free from congestion
Having well-planned sequencing and timing of traffic signals
Having highways free from congestion
Having well-planned sequencing and timing of traffic signals
Having highways free from congestion
Having well-planned sequencing and timing of traffic signals
CARPOOL 2014
CARPOOL 2012
CARPOOL 2009
CARPOOL 2006
CARPOOL 2005
CARPOOL 2004
CARPOOL 2003
Having special lanes on highways just for High Occupancy Vehicles (HOVs) like carpools and buses
Having special lanes on highways just for High Occupancy Vehicles (HOVs) like carpools and buses
Having special lanes on highways just for High Occupancy Vehicles (HOVs) like carpools and buses
Having special lanes on highways just for High Occupancy Vehicles (HOVs) like carpools and buses
Having special lanes on highways just for High Occupancy Vehicles (HOVs) like carpools and buses
Having special lanes on highways just for High Occupancy Vehicles (HOVs) like carpools and buses
Having special lanes on highways just for High Occupancy Vehicles (HOVs) like carpools and buses
TRANSIT 2014
TRANSIT 2012
TRANSIT 2009
TRANSIT 2006
TRANSIT 2005
TRANSIT 2004
TRANSIT 2003
Covered shelters and stations
Bus-to-bus transfers
Having information on when to expect transit delays
Having frequent transit service
Courteous on-board personnel
Safe and secure waiting areas
Having information on when to expect transit delays
Having frequent transit service
Having information on when to expect transit delays
Having covered shelters and stations
Having information on when to expect transit delays
Having information on when to expect transit delays
Having seats available to sit
Having frequent transit service
Having covered shelters and stations
Having information on when to expect transit delays
Having transit stops and stations with good lighting
Having information on when to expect transit delays
Having transit stops and stations with good lighting

2014 Customer Satisfaction Surveys Executive Summary
Final Report Page 1-4
BICYCLISTS 2014
BICYCLISTS 2012
BICYCLISTS 2009
BICYCLISTS 2006
BICYCLISTS 2005
BICYCLISTS 2004
BICYCLISTS 2003
Having separate bicycle paths
Having signed bicycle routes
Having separate bicycle paths
Having striped bicycle lanes
Having signed bicycle routes
Having striped bicycle lanes
Having wide, paved shoulders
Having low volume motor vehicle traffic
Having bicycle friendly drainage grates
Having separate bicycle paths
Having adequate street lighting
Having bicycle racks and lockers
Having striped bicycle lanes on roads
Having bicycle friendly drainage grates
Having wide, paved shoulders
PEDESTRIANS 2014
PEDESTRIANS 2012
PEDESTRIANS 2009
PEDESTRIANS 2006
PEDESTRIANS 2005
PEDESTRIANS 2004
PEDESTRIANS 2003
Having sidewalks to commercial areas
Having sidewalks and other places to walk between your neighborhood and other neighborhoods
Having sidewalks to commercial areas
Having sidewalks and other places to walk between your neighborhood and other neighborhoods
Adequate street lighting
Pedestrian overpasses to cross highways
Having sidewalks that connect neighborhoods to commercial areas
Having intersections with pedestrian signals and push buttons
Having sidewalks that connect neighborhoods to commercial areas
Having intersections with pedestrian signals and push buttons
Having sidewalks that connect neighborhoods to commercial areas
No attribute fell into the high-priority corrective action quadrant for pedestrians this year
As can be seen above, the data are mostly similar across survey years, lending credence to the survey findings and to increased attention and investment by the Department on improvement actions geared to improve these service attributes. As in the previous surveys, "highways free from congestion" “well planned sequencing and timing of traffic signals,” and “pavement condition on roadways” rank as a high priority attributes for motorists with the recent addition of “pavement condition on roadways” to this set in 2009. A key finding, for all survey years, is that despite the higher ranking given for congestion relief, "having many travel mode choices" ranks as a low priority attribute. Similar to the results from the previous survey years, the difference in priority between “highways free from congestion” and “having many travel mode choices” demonstrates that Delaware residents that drive alone are not yet seeing a relationship between these two attributes. This finding may mean more education and marketing efforts are needed.
1.2.2 Satisfaction Index Figure 1-3 displays the satisfaction indices computed for each user group, based on the importance-performance data collected in the General Transportation User Survey. To develop the satisfaction index, the mean rating for both importance and performance were computed for each attribute. The satisfaction index is calculated by computing the ratio between the overall mean performance rating to the overall mean importance rating for users of each mode. This index demonstrates the balance between importance and performance in the minds of customers in that user group. The higher the value of the satisfaction index, the higher the level of customer satisfaction. Similar satisfaction indices were computed for all survey years.

2014 Customer Satisfaction Surveys Executive Summary
Final Report Page 1-5
Figure 1-3 Satisfaction Indices - 2003 through 2014 - All User Groups, General Transportation User Survey
Figure 1-4 Chart of User Groups
User Group Description
SOVs Those respondents that reported driving alone for some of their trips during the previous week.
Motorists Those respondents that reported driving alone only, carpooling only, or driving alone, but also carpooling for some of their trips during the previous week.
Carpoolers Those respondents that carpooled for some of their trips during the previous week.
Transit Those respondents that used transit for some of their trips the previous week.
Bike Those respondents that indicated they had made a trip by bicycle the previous week.
Pedestrian Those respondents that indicated they walked for some of their trips the previous week.
1.2.3 Mobility Assessment Results As a follow-up, respondents were asked to assess whether or not they believed they had many different travel modes to choose from or alternatively, if they thought they had few options to choose from. As was done in the previous survey years, in the 2014 survey, the following question was posed to all respondents:
“And would you say that you have many different travel modes to choose from such as transit, biking and walking to meet your travel needs or would you say you have very few options to choose from?”
0102030405060708090
1002012
2012
2009
2006
2005
2004
2003
2014 2012 2009 2006 2005 2004 2003

2014 Customer Satisfaction Surveys Executive Summary
Final Report Page 1-6
If respondents indicated they had few options, they were asked, in an open-ended question, what modes they would like access to. This year 42% of respondents said they have many options to choose from, while 56% stated that they have few options and 2% could not say. The share of respondents stating that they had many options in 2014 was the same as the 2012 and 2009 survey results. Like the previous surveys differences were noted by county in 2014, as 49% of New Castle County residents stated that they had many options to choose from, compared to 38% of Kent County residents and 28% of Sussex County residents. Differences were noted by residential area type as well. Fifty-two percent (52%) of city/town residents and 43% of suburban residents stated that they that they had many options to choose from, compared to 28% of rural residents.
1.2.4 Improvement Action Results
As was done in the previous surveys, fifteen improvement actions, representing a sub-set of priority actions suggested in the long range plans of the Department or the Metropolitan Planning Organizations (MPOs) in the state were evaluated by respondents in terms of their perceived effectiveness to improve the transportation system in the state. This section of the report provides the results of this series of questions posed to all respondents in the General Transportation User survey.
1.2.5 Perceived Effectiveness For each action, respondents were asked to identify how effective it would be in improving the transportation system with response categories ranging from “very effective”, “somewhat effective”, “not very effective”, or “not at all effective”. The top four actions perceived by Delaware residents to be the most effective actions to improve the transportation system are
• Coordinating and better timing traffic signals; • Creating service patrols to quickly respond to accidents, stalled vehicles, etc.; • Designing communities that make it easier for people to walk and bike to stores,
schools and other public facilities and to other neighborhoods; and • Improving and expanding bus services.
The results from this year's survey were consistent with past results as the four actions above were also found to be among the top actions in all prior surveys. The most highly rated transit action was “improving and expanding bus service.” Fifty-two percent (52%) of respondents to the survey thought this action would be “very” effective. Actions perceived to be less effective by Delaware residents include: • Building more highways; and, • Providing new information systems that make it easier to carpool.
1.2.6 Continuation of Additions to the 2012 Survey
Similar to the 2012 survey, in 2014 both cell phone and online (Internet) interviews were conducted in addition to land line telephone interviews to yield more representative results. Cell phone interviewing was restricted to those households who had cell phones but no land line telephone. Telephone respondents in the land line sample were recruited using random digit dialing (RDD), from bocks of numbers known to consist of land lines. Cell phone only respondents were recruited using cell phone series blocks. These telephone numbers were dialed by hand and interviewers verified that respondents were in a safe position to talk (e.g., not driving at the time), were 16 years or older, resided in Delaware, and in what county. The geographic assignment for the cell sample is problematic, since addresses are based on the billing center associated with the account instead of the residence of the account holder.

2014 Customer Satisfaction Surveys Executive Summary
Final Report Page 1-7
Respondent mobility is an additional issue. In order to properly control for this, respondents were asked to confirm that they lived in Delaware as well as which county. Internet respondents were recruited through an online panel. The sample source for the Internet panel was Research Now. Research Now emailed survey invitations to their panelists in each of Delaware’s three counties. Respondents confirmed their residence in Delaware and their specific county.
1.3 Transit-Served Market Area Survey
Like the previous efforts, the focus of the 2014 survey was to obtain information from potential transit customers in the transit-served areas of Delaware. Therefore, those respondents that had used transit during the previous month were screened out of this survey. As in the past, for the purposes of this survey, the transit served market area was defined to be the area within ¼ mile of an existing transit route. Similar to the General Transportation User Survey, in this survey respondents were asked to rate the importance and assess the performance of the transportation system across a set of attributes for each mode that was used the previous week. Four modes were asked about and include driving alone, carpooling (riding or driving with others), bicycling and walking. Similar to the 2012 survey, cell phone and online (Internet) interviews were conducted in 2014 in addition to land line telephone interviews to yield more representative results. The 2014 survey showed that 81% of the sample made drive-alone trips. Additionally, 75% of the sample carpooled, 18% walked, and 4% bicycled for some trips the previous week. As was found in the previous survey years, drive-alone was the most prevalent form of transportation used the previous week.
1.3.1 Reasons for Not Using Public Transit on a Frequent Basis In 2001, nineteen questions were added to the Transit-Served Market Area Survey questionnaire. This series of questions pertain to the reasons why public transit (bus or rail) service is not used more frequently. For each question, the respondent was asked to give a response of yes or no, depending on whether the statement was a reason why he/she did not use public transit more frequently. This section details the responses to these questions for 2014.
Figure 1-5 Reasons for Not Using Public Transit on a Frequent Basis - 2014
0.010.020.030.040.050.060.070.080.090.0
100.0

2014 Customer Satisfaction Surveys Executive Summary
Final Report Page 1-8
As can be seen in the chart, the primary reason why respondents in the transit-served areas of Delaware do not use transit is because “public transit takes longer than driving.” Almost three out of every five respondents (59%) indicated this as a reason why they do not use transit more frequently. The second most frequent reason respondents indicated that they do not use transit is that “public transit is inconvenient or hard to use if you need to run errands during your trip” (56%). The less frequent reasons for not taking public transit include: Public transit is crowded and I can’t get a seat (4%), Public transit is dirty (10%), and Don’t like the people who use public transit (11%). These findings are similar to prior survey results.

2014 Customer Satisfaction Surveys Executive Summary
Final Report Page 1-9
1.3.2 Importance-Performance Quadrant Analysis The importance-performance ratings given to the different modal attributes asked about in the survey by customers of each mode were summarized into four importance-performance quadrants for the transit-served areas of Delaware for policy-makers and decision-makers to use. The attributes that are in the highest priority quadrant for corrective action (attributes that were rated as above average in importance but below average in performance by customers) for each user group are in Figure 1-9, and includes the results from this survey year and past survey years.
Figure 1-6 High Priority Attributes – Transit Served Survey
AUTO 2014
AUTO 2012
AUTO 2009
AUTO 2006
AUTO 2005
AUTO 2004
AUTO 2003
Having highways free from congestion Having well-
planned sequencing and timing of traffic lights The condition of
pavement on highways Info on when to
expect delays and road closings
Having highways free from congestion Having well-
planned sequencing and timing of traffic lights
Having highways free from congestion Having well-
planned sequencing and timing of traffic lights
Having highways free from congestion Having well-
planned sequencing and timing of traffic lights The
condition of pavement on highways
Having highways free from congestion Having well-
planned sequencing and timing of traffic lights
Having highways free from congestion Having well-
planned sequencing and timing of traffic lights
Having highways free from congestion Having well-
planned sequencing and timing of traffic lights The
condition of pavement on highways
CARPOOL 2014
CARPOOL 2012
CARPOOL 2009
CARPOOL 2006
CARPOOL 2005
CARPOOL 2004
CARPOOL 2003
Having special lanes on streets and highways for carpools and buses
Having special lanes on streets and highways for carpools and buses
No attribute fell into the corrective action quadrant for carpoolers.
Having special lanes on streets and highways for carpools and buses
No attribute fell into the corrective action quadrant for carpoolers.
Having special lanes on streets and highways for carpools and buses
Having special lanes on streets and highways for carpools and buses
BICYCLISTS 2014
BICYCLISTS 2012
BICYCLISTS 2009
BICYCLISTS 2006
BICYCLISTS 2005
BICYCLISTS 2004
BICYCLISTS 2003
Having separate bicycle paths
Having signed bicycle routes
Having striped bicycle lanes
Having roadways free of debris
Having adequate street lighting
Having wide, paved shoulders
Having bicycle friendly drainage grates
Having separate bicycle paths
Having low traffic volume
Having low speed traffic
Having striped bicycle lanes
Having signed bicycle routes
Having low traffic volume
Having low speed traffic
Having bicycle racks and lockers
Having striped bicycle lanes Having shower
facilities Having separate
bicycle paths Having bicycle
friendly drainage grates Having roadways
free of debris Having signed
bicycle routes Having adequate
street lighting Having low traffic
volume Having low speed
traffic
Having striped bicycle lanes
Having bicycle racks and lockers
Having shower facilities
Having separate bike paths
Having striped bicycle lanes

2014 Customer Satisfaction Surveys Executive Summary
Final Report Page 1-10
PEDESTRIANS 2014
PEDESTRIANS 2012
PEDESTRIANS 2009
PEDESTRIANS
2006
PEDESTRIANS 2005
PEDESTRIANS 2004
PEDESTRIANS
2003 Having
sidewalks connecting neighborhoods to commercial areas
Having sidewalks and other places to walk between your neighborhood and other neighborhoods
Having sidewalks and other placed to walk in your neighborhood
Having sidewalks connecting neighborhoods to commercial areas
Having sidewalks and other places to walk between your neighborhood and other neighborhoods
Having sidewalks and other placed to walk in your neighborhood
Having low volume traffic
Having sidewalks and other places to walk between your neighborhood and other neighborhoods
Having sidewalks connecting neighborhoods to commercial areas
Having pedestrian signals and push buttons
Having marked crosswalks at intersections
Having sidewalks and other places to walk in your neighborhood
Having sidewalks to and from transit stations and stops
Having pedestrian overpasses to cross highways
Having pedestrian signals and push buttons
Having adequate street lighting
Having marked crosswalks at intersections
Having low volume motor vehicle traffic
As can be seen in Figure 1-9 above, there is a consistency in results across survey years. As stated previously, this lends credence to the survey findings and to the use of the results to target investment priorities. It should be noted that this year’s survey witnessed significant reduction in bicycle attributes that require priority corrective actions as can be seen in the above figure.
1.3.3 Satisfaction Index Figure 1-10 provides the satisfaction index computed for each user group, based on the importance-performance data collected in the Transit-Served Market Area Survey. To develop the satisfaction index, the mean rating for both importance and performance were computed for each attribute. The satisfaction index is calculated by computing the ratio between the overall mean performance rating to the overall mean importance rating for users of each mode. This index demonstrates the balance between importance and performance in the minds of customers in that user group. The higher the value of the satisfaction index, the higher the level of customer satisfaction.

2014 Customer Satisfaction Surveys Executive Summary
Final Report Page 1-11
Figure 1-7 Satisfaction Indices – 2003 through 2014 - All User Groups, Transit-Served Market Area Survey
* Extreme fluctuation is due to very small sample sizes.
1.3.4 Mobility Assessment Results Similar to the General Transportation User Survey, respondents were asked to assess whether or not they thought they had many different travel modes to meet their travel needs or alternatively, if they thought they had "few options to choose from." The question as posed in the survey was:
“And would you say that you have many different travel modes to choose from such as transit, biking and walking to meet your travel needs or would you say you have very few options to choose from?”
If respondents indicated they had “few options,” they were asked, in an open-ended question, what modes they would like access to. As was found in previous years, even though respondents live within a transit-served market area, the response to the first question was mixed. For 2014, 33% indicated that they had “many different modes to choose from,” while 67% indicated that they had “few options.” This was similar to 2012 when 38% indicated that they had “many different modes to choose from,” while 62% indicated that they had “few options.” However, the results were significantly different in the 2009 survey. In 2009, 80% indicated that they had “many different modes to choose from,” while 19% indicated that they had “few options,” and 2% could not say. In terms of county of residence, for 2014, residents residing in Sussex County (29%) and Kent County (29%) were less likely to say that they had “many modes to choose from” as compared to residents from New Castle County (41%). For this survey year, when respondents were asked what modes they would like access to, 40% indicated they would like access to transit or bus. This percentage was exactly similar to 2012 (40%) but slightly lower than the 2009, 2006, 2005, 2004 and 2003 results (58%, 58%, 66%, 53% and 53% respectively). For 2014, 19% indicated they would like access to bicycle paths, 7% indicated wanting access to pedestrian facilities, and 4% indicated wanting improvements relating to “personal auto access needs.” Again these percentages were exactly the same as compared to the 2012 survey results.
0
20
40
60
80
100
120
140
2012
2012
2009
2006
2005
2004
2003
2014 2012 2009 2006 2005 2004 2003

2014 Customer Satisfaction Surveys Executive Summary
Final Report Page 1-12
1.3.5 Transit Service Awareness & Familiarity As was done in the previous survey years, respondents were asked about their level of knowledge regarding bus services in their area. Additionally, respondents were asked a series of questions to ascertain their level of awareness of DART First State and their familiarity with DART First State services. Following this series of questions, respondents that had looked for transit information over the past year were asked whether or not they had used a specific information source and how helpful they found the source.
1.3.6 Knowledge of Bus Services in Area For 2014, 87% of the respondents knew that they had bus service available in their area. This was slightly higher than 2009 (81%) and 2006 (84%) survey results but lower than 2012 (93%); however the variation is not significant. When respondents in 2014 were asked if they had bus service within walking distance of home, 80% indicated that bus service was within walking distance. This percentage was in the similar range as compared to the results from previous survey years (79% in 2012, 73% in 2009, 75% in 2006, 67% in 2005, 77% in 2004, 79% in 2003, 84% in 2002, 69% in 2001, 72% in 2000, 86% in 1999, 60% in 1998, and 79% in 1997). Those respondents that indicated there was bus service within walking distance of home were asked if sidewalks were available to reach the bus stop. In 2014, 67% stated that there were sidewalks available to reach the bus stops. This percentage is slightly lower than the 2009 (72%) and 2006 (70%) surveys but higher than 2012 (63%). When asked if they knew the route number(s) of the bus service, 34% of the respondents said they knew the route numbers. This percentage was higher than the 20% in the 2012 survey, 14% in the 2009 survey, but lower than the 35% found in the 2006 survey; however, in 2006 none of these respondents could specify the route number.
1.3.7 Recognition of & Familiarity with DART First State All respondents were asked a series of questions to ascertain the level of awareness of DART or DART First State. Figure 1-11 provides the results from these questions.
Figure 1-8 Awareness of DART First State
More than half (60%) of residents in the transit-served market areas of Delaware could name DART or DART First State as the operator of bus services in Delaware. Thirty-six percent (36%) could recognize DART First State when provided the name, and the remaining 4% could not
DART First State
Awareness Level
2014 Percent
2012 Percent
2009 Percent
2006 Percent
2005 Percent
2004 Percent
2003 Percent
2002 Percent
Names DART First State (unaided awareness)
60% 50% 73% 93% 71% 86% 93% 94%
Recalls DART First State (aided awareness)
36% 41% 17% 7% 18% 10% 7% 2%
Unaware of DART First State
4% 9% 10% 0% 11% 4% 0% 4%
Total 100% 100% 100% 100% 100% 100% 100% 100%

2014 Customer Satisfaction Surveys Executive Summary
Final Report Page 1-13
recall or did not know the name DART First State. These results in general showed a lower unaided awareness of the name of DART First State than previous years, but much higher recall recognition of the name of DART First State than previous years, except 2012. Respondents were then asked how familiar they were with DART or DART First State. The results are outlined in the figure below for 2014 as well as the other survey years.
Figure 1-9 How familiar would you say you are with DART or DART First State –do you know a great deal about the agency, some, just a little or not much at all?
Response 2014 Percent
2012 Percent
2009 Percent
2006 Percent
2005 Percent
2004 Percent
2003 Percent
2002 Percent
A great deal 8% 9% 4% 6% 6% 14% 12% 2% Some 34% 39% 11% 20% 36% 21% 22% 34% Just a little 31% 24% 13% 23% 31% 21% 14% 21% Not much at all
27% 28% 71% 51% 27% 44% 51% 39%
Dk (vol) 0% 0% 1% 0% 0% 0% 1% 4% The responses to this question indicated that in general the overall level of knowledge about DART or DART First State has been somewhat similar in the past decade with the exception of 2006 and 2009 (2014-42%, 2012-47%, 2009-15%, 2006-26%, 2005-42%, 2004–35%, 2003-34%, 2002–36%, 2001–33%). Respondents were then asked to assess their level of familiarity, on a scale of 1 to 7, about where bus routes go and with how to use the system. The responses are outlined in the following figure for all survey years.
Figure 1-10 Level Familiarity with Bus Routes and How to Use the System, 2014 Data in Red
Question Not Familiar
2 3 4 5 6 Very Familiar
DK (vol) Year
Where you can pick up buses & where bus routes go?
46% 44% 38% 40% 32% 31% 30% 25% 17% 32% 37% 38% 40%
9% 17% 4%
18% 17% 13% 16% 12% 15% 25% 11% 23% 8%
14% 17% 6% 8%
20% 11% 10% 18% 4% 7%
11% 11% 8%
9% 5%
18% 8% 4%
10% 12% 13% 5% 8% 2% 3% 8%
13% 8%
18% 9%
11% 11% 10% 15% 26% 11% 13% 6% 4%
6% 3%
13% 8% 3% 6% 6% 5%
12% 1% 5% 6% 9%
3% 6% 2% 6% 8% 8%
11% 8% 8% 6% 4% 3% 5%
0% 0% 1% 3% 5%
10% 5% 4%
13% 10% 27% 9%
18%
2014 2012 2009 2006 2005 2004 2003 2002 2001 2000 1999 1998 1997
How to use DART First State buses, pay fares, purchase tickets?
47% 55% 49% 39% 32% 34% 40% 33% 24% 37% 29% 55% 47%
16% 19% 0%
12% 12% 20% 15% 4%
20% 13% 18% 17% 9%
8% 6% 4%
10% 13% 4% 3%
11% 10% 6% 4% 9% 8%
8% 4% 6% 9% 3% 1% 6% 8%
14% 11% 0% 3% 8%
8% 9%
31% 5%
10% 12% 11% 22% 7%
14% 6% 3% 5%
8% 0% 8% 9% 1%
13% 9% 5%
11% 0% 6% 3% 3%
7% 7% 2%
12% 21% 10% 12% 13% 1% 7% 4% 6% 3%
5% 0% 0% 4% 8% 6% 4% 4%
13% 12% 33% 4%
18%
2014 2012 2009 2006 2005 2004 2003 2002 2001 2000 1999 1998 1997
As can be seen in Figure 1-13 above, the level of familiarity regarding bus service areas and how to use bus service remains generally low in the transit-served areas of Delaware.

2014 Customer Satisfaction Surveys Executive Summary
Final Report Page 1-14
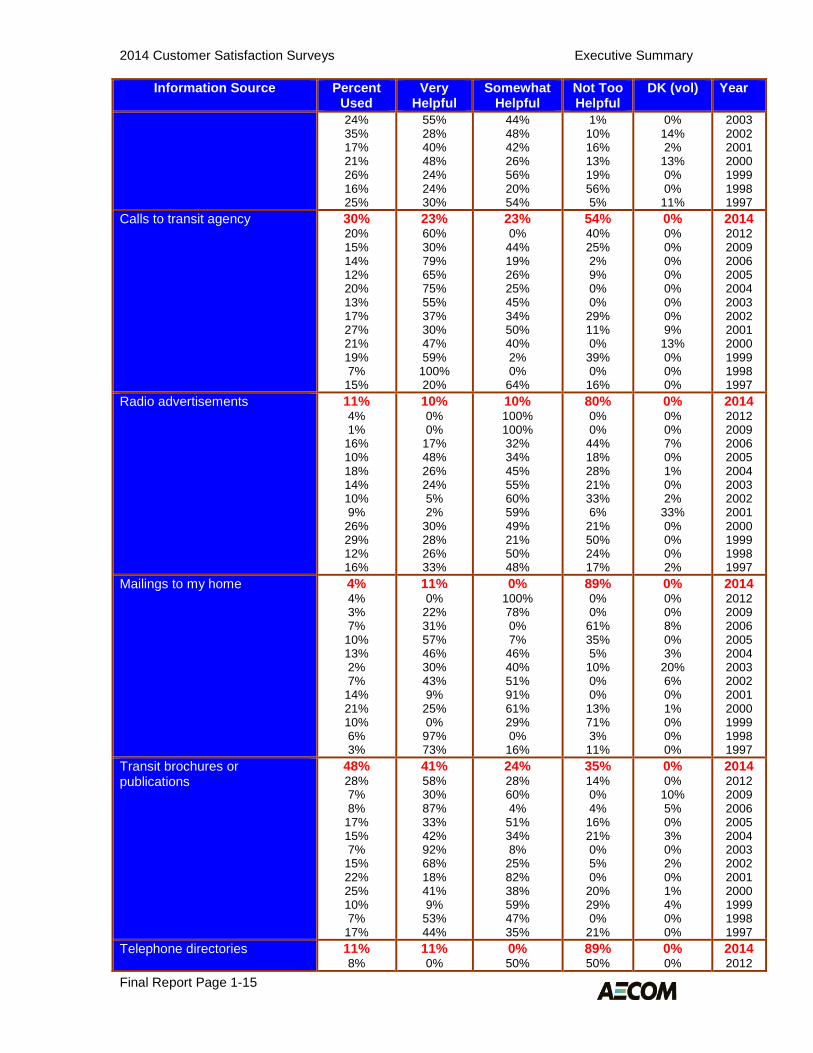
1.3.8 Transit Information Sources Respondents were asked if over the past year, they had looked for information about transit services. For 2014, 33% of respondents indicated that they looked for information on transit services. This was similar to past 2012 (28%), 2009 (22%), 2006 (33%), 2005 (28%), and 2004 (34%) percentage of respondents who looked for information on transit services. Following this question, respondents were asked specifically about whether they had received information about transit from eleven different information sources. For each source used, respondents were then asked how helpful the information was.
Figure 1-11 Sources Used & Helpfulness, 2014 Data in Red
Information Source Percent Used
Very Helpful
Somewhat Helpful
Not Too Helpful
DK (vol) Year
Printed bus schedules 63% 46% 20% 35% 43% 22% 35% 28% 44% 23% 36% 21% 29%
45% 46% 36% 75% 49% 73% 52% 67% 54% 53% 34% 45% 51%
30% 46% 58% 16% 43% 24% 47% 31% 27% 21% 44% 14% 19%
25% 8% 6% 9% 8% 2% 1% 2%
12% 14% 22% 28% 20%
0% 0% 0% 0% 0% 1% 0% 0% 7%
12% 0%
14% 10%
2014 2012 2009 2006 2005 2004 2003 2002 2001 2000 1999 1998 1997
Newspaper/magazine advertisements
7% 8% 7%
13% 13% 23% 14% 13% 19% 34% 29% 22% 27%
11% 0%
32% 55% 23% 13% 45% 10% 3%
42% 14% 45% 21%
11% 100% 68% 27% 39% 39% 30% 30% 58% 34% 25% 55% 42%
78% 0% 0%
18% 36% 36% 21% 60% 39% 17% 61% 0%
27%
0% 0% 0% 0%
12% 12% 4% 0% 0% 7% 0% 0%
10%
2014 2012 2009 2006 2005 2004 2003 2002 2001 2000 1999 1998 1997
Billboards 7% 4% 2%
13% 11% 20% 20% 24% 13% 25% 29% 15% 16%
11% 0% 0%
27% 24% 28% 16% 4% 0%
51% 28% 21% 18%
0% 100% 58% 26% 45% 52% 64% 51% 49% 45% 28% 20% 7%
89% 0%
42% 47% 10% 17% 17% 35% 51% 4%
43% 58% 71%
0% 0% 0% 0%
21% 3% 3%
10% 0% 0% 1% 0% 5%
2014 2012 2009 2006 2005 2004 2003 2002 2001 2000 1999 1998 1997
Other people 30% 36% 8%
22% 19% 31%
29% 44% 4%
65% 61% 58%
7% 45% 68% 17% 26% 32%
64% 11% 27% 18% 13% 10%
0% 0% 0% 0% 0% 0%
2014 2012 2009 2006 2005 2004
2014 Customer Satisfaction Surveys Executive Summary
Final Report Page 1-15
Information Source Percent Used
Very Helpful
Somewhat Helpful
Not Too Helpful
DK (vol) Year
24% 35% 17% 21% 26% 16% 25%
55% 28% 40% 48% 24% 24% 30%
44% 48% 42% 26% 56% 20% 54%
1% 10% 16% 13% 19% 56% 5%
0% 14% 2%
13% 0% 0%
11%
2003 2002 2001 2000 1999 1998 1997
Calls to transit agency 30% 20% 15% 14% 12% 20% 13% 17% 27% 21% 19% 7%
15%
23% 60% 30% 79% 65% 75% 55% 37% 30% 47% 59%
100% 20%
23% 0%
44% 19% 26% 25% 45% 34% 50% 40% 2% 0%
64%
54% 40% 25% 2% 9% 0% 0%
29% 11% 0%
39% 0%
16%
0% 0% 0% 0% 0% 0% 0% 0% 9%
13% 0% 0% 0%
2014 2012 2009 2006 2005 2004 2003 2002 2001 2000 1999 1998 1997
Radio advertisements 11% 4% 1%
16% 10% 18% 14% 10% 9%
26% 29% 12% 16%
10% 0% 0%
17% 48% 26% 24% 5% 2%
30% 28% 26% 33%
10% 100% 100% 32% 34% 45% 55% 60% 59% 49% 21% 50% 48%
80% 0% 0%
44% 18% 28% 21% 33% 6%
21% 50% 24% 17%
0% 0% 0% 7% 0% 1% 0% 2%
33% 0% 0% 0% 2%
2014 2012 2009 2006 2005 2004 2003 2002 2001 2000 1999 1998 1997
Mailings to my home 4% 4% 3% 7%
10% 13% 2% 7%
14% 21% 10% 6% 3%
11% 0%
22% 31% 57% 46% 30% 43% 9%
25% 0%
97% 73%
0% 100% 78% 0% 7%
46% 40% 51% 91% 61% 29% 0%
16%
89% 0% 0%
61% 35% 5%
10% 0% 0%
13% 71% 3%
11%
0% 0% 0% 8% 0% 3%
20% 6% 0% 1% 0% 0% 0%
2014 2012 2009 2006 2005 2004 2003 2002 2001 2000 1999 1998 1997
Transit brochures or publications
48% 28% 7% 8%
17% 15% 7%
15% 22% 25% 10% 7%
17%
41% 58% 30% 87% 33% 42% 92% 68% 18% 41% 9%
53% 44%
24% 28% 60% 4%
51% 34% 8%
25% 82% 38% 59% 47% 35%
35% 14% 0% 4%
16% 21% 0% 5% 0%
20% 29% 0%
21%
0% 0%
10% 5% 0% 3% 0% 2% 0% 1% 4% 0% 0%
2014 2012 2009 2006 2005 2004 2003 2002 2001 2000 1999 1998 1997
Telephone directories 11% 8%
11% 0%
0% 50%
89% 50%
0% 0%
2014 2012

2014 Customer Satisfaction Surveys Executive Summary
Final Report Page 1-16
Information Source Percent Used
Very Helpful
Somewhat Helpful
Not Too Helpful
DK (vol) Year
5% 12% 11% 13% 18% 19% 6%
24% 17% 13% 15%
41% 67% 69% 38% 13% 43% 50% 65% 35% 8%
41%
18% 20% 31% 42% 84% 29% 9%
12% 51% 48% 57%
41% 8% 0%
18% 3%
26% 41% 22% 0%
44% 2%
0% 5% 0% 3% 0% 2% 0% 1%
15% 0% 0%
2009 2006 2005 2004 2003 2002 2001 2000 1999 1998 1997
Newspaper articles 7% 8% 1% 9% 9%
11% 18% 8%
14% 24% 36% 22% 20%
10% 50% 0%
36% 36% 27% 33% 11% 19% 76% 23% 31% 26%
10% 50%
100% 40% 40% 47% 59% 78% 62% 24% 28% 56% 56%
80% 0% 0% 0% 0% 3% 4%
11% 19% 0%
48% 13% 18%
0% 0% 0%
24% 24% 23% 4% 0% 0% 0% 1% 0% 0%
2014 2012 2009 2006 2005 2004 2003 2002 2001 2000 1999 1998 1997
DART First State website (added to survey in 2000)
71% 79% 14% 16% 25% 22% 13% 15% 21% 13%
38% 47% 67% 92% 74% 71%
60% 33% 26% 60%
52% 37% 34% 6%
24% 17% 39% 17% 61% 38%
10% 16% 0% 2% 2%
12% 0%
48% 0% 2%
0% 0% 0% 0% 0% 0% 1% 2%
13% 0%
2014 2012 2009 2006 2005 2004 2003 2002 2001 2000

2014 Customer Satisfaction Surveys Executive Summary
Final Report Page 1-17
The most used source of information about transit services in the 2014 survey was information obtained from the DART First State website (71%), which is much higher than other forms of information. The second most used source of information in 2014 was printed bus schedules (63%), which was the most used source of information in the 2009 survey. Most helpful sources of information include: printed bus schedules (45%) and transit brochures and publications (41%).
1.4 Shippers and Carriers Survey As was done in the previous survey years, businesses were asked to rate the importance and to assess the current transportation system performance on a set of attributes for each mode that were used to ship, carry or transport goods and materials. Four modes were asked about and include: trucking, rail freight, air freight and the Port of Wilmington. Like the previous surveys, trucking was the most prevalent form of freight transportation used. For 2014, 94% of the businesses sampled indicated that they shipped goods by truck in Delaware, 20% via the Port of Wilmington, 12% shipped via rail freight, and 1% via air freight. In the 2012 survey, 89% of the businesses sampled indicated that they shipped goods by truck in Delaware, 23% via the Port of Wilmington, 10% shipped via rail freight, and 2% via air freight. In the 2009 survey, 93% of the businesses sampled indicated that their company moved goods by truck in Delaware, 10% of the businesses shipped goods via the Port of Wilmington, 4% shipped via rail freight, and no businesses indicated that they had shipped via air freight. The importance-performance ratings given to specific modal attributes by businesses using each mode can be summarized into four importance-performance quadrants for policy-makers and decision-makers to use. The attributes that are in the highest priority quadrant for corrective action are displayed in Figure 1-15 (attributes that were rated above average in importance but below average in performance by customers) and for each mode in all the survey years include the following:

2014 Customer Satisfaction Surveys Executive Summary
Final Report Page 1-18
Figure 1-12 High Priority Attributes – Shippers & Carriers Survey
TRUCKING 2014
TRUCKING 2012
TRUCKING 2009
TRUCKING 2006
TRUCKING 2005
TRUCKING 2004
TRUCKING 2003
Having highways free from congestion Having well-
planned sequencing and timing of traffic signals Having wide,
paved shoulders on highways and roads Having
information on when to expect delays and closings Having few toll
roads Having wide
intersections with turning lanes
Having highways free from congestion Having well-
planned sequencing and timing of traffic signals Having wide,
paved shoulders on highways and roads Having
information on when to expect delays and closings Having few
weight restricted bridges Having
highways with wide travel lanes
Having highways free from congestion Having well-
planned sequencing and timing of traffic signals Having wide
intersections with turning lanes Having wide,
paved shoulders on highways and roads Highway
system with few toll roads Having
information on when to expect delays and closings
Having highways free from congestion Having well-
planned sequencing and timing of traffic lights Having wide
intersections with turning lanes Having wide,
paved shoulders on highways and roads Having few
weight restricted roads
Having highways free from congestion Having well-
planned sequencing and timing of traffic lights Having wide
intersections with turning lanes Having wide,
paved shoulders on highways and roads
Having information on when to expect delays and closings Having
highways free from congestion Having well-
planned sequencing and timing of traffic lights Having wide
intersections with turning lanes Having wide,
paved shoulders on highways and roads Highways with
wide travel lanes
Having information on when to expect delays and closings Having
highways free from congestion Having well-
planned sequencing and timing of traffic lights Having wide
intersections with turning lanes Highways with
wide travel lanes Having wide,
paved shoulders on highways and roads
RAIL 2014
RAIL 2012
RAIL 2009
RAIL 2006
RAIL 2005
RAIL 2004
RAIL 2003
None Having numerous interchange points on the freight rail system
Having good condition track, roadbed & right-of-way for shortline railroads
Having minimal conflicts with rail passenger service
Having multi-track rail operations available
Having competitive services to businesses off main lines
Having good condition track, roadbed & right-of-way for Class 1 railroads
Having good condition track, roadbed & right-of-way for shortline railroads
Having truck-to-rail commodity transfer points
Eliminating clearance restrictions for high-cube or double-stack operations
Having good condition track, roadbed & right-of-way for Class 1 railroads
Eliminating clearance restrictions for high-cube or double-stack operations
Having competitive rates & services to businesses from shortline railroads
Having good condition track, roadbed & right-of-way for railroads serving Port of Wilmington
Having minimal conflicts with rail passenger services
Having truck-to-rail commodity transfer points
Having multi-track rail operations available

2014 Customer Satisfaction Surveys Executive Summary
Final Report Page 1-19
No businesses surveyed used air freight to ship or receive goods in 2009
Having highways free from congestion near airports
No businesses surveyed used air freight to ship or receive goods in 2005
Having highways free from congestion near airports
Having numerous airports for air cargo service
Having good highway access to airports
Having highways free from congestion near airports
Having fuel available at the airport
No businesses surveyed used air freight to ship or receive goods in 2002
PORT 2014
PORT 2012
PORT 2009
PORT 2006
PORT 2005
PORT 2004
PORT 2003
Having good condition dock facilities
Having deep and wide berths
Having deep channels
Having good internal traffic flow at the port
Having good condition doc facilities
Having reasonable port fees
Having deep and wide berths
Having competitive service and attention by shippers at the port
Having deep channels
Having good condition doc facilities
Having reasonable port fees
Having deep and wide berths
Having good internal traffic flow at the port
No attribute fell into the corrective action quadrant.
Having warehousing space available
Having reasonable port fees
Having ample cranes for trans-loading
Having good highway access to the Port
Having good condition dock facilities
Having competitive service and attention by shippers at the port
Having warehousing space available
Having reasonable port fees
Having deep channels
Having good internal traffic flow at the port
Having deep and wide berths
Having competitive service and attention by shippers at the port
Having warehousing space available
As is seen above in Figure 1-15, most of the high priority attributes for trucking have remained consistent over the past survey years which provides confidence in the validity of the ratings. The attributes with high priority tend to fluctuate within the other modes (air, rail and port) when compared to past survey years. One prominent example is that in 2014, there are no high priority attributes for corrective actions in rail freight. These fluctuations are due to the small sample sizes obtained for these modes.
1.4.1 Satisfaction Index Figure 1-16 provides the satisfaction index computed for each user group, based on the importance-performance data collected in the Shippers and Carriers Survey. To develop the satisfaction index, the mean rating for both importance and performance were computed for each attribute. The satisfaction index is calculated by computing the ratio between the overall mean performance rating to the overall mean importance rating for users of each mode. This index demonstrates the balance between importance and performance in the minds of customers in that user group. The higher the value of the satisfaction index, the higher the level of customer satisfaction.

2014 Customer Satisfaction Surveys Executive Summary
Final Report Page 1-20
Figure 1-13 Satisfaction Indices - 2003 through 2014 - All Modes, Shippers and Carriers Survey
* Extreme fluctuation is due to very small sample sizes.
1.4.2 Biggest Freight Problems Facing Businesses Near the end of the questionnaire, in an open-ended question, businesses were asked about the biggest freight issue or problem that is facing their business. The responses to this question were coded by hand and are displayed in Figure 1-17 below.
Figure 1-14 Biggest Freight Issue/Problem Facing Your Business
Issue or Problem Mentioned
2014 Percent
2012 Percent
2009 Percent
2006 Percent
2005 Percent
2004 Percent
2003 Percent
Roadway congestion 26% 20% 35% 32% 18% 35% 43%
Taxes, registrations, tolls, fees (and fuel costs for 2003 and prior surveys)
10% 3% 12% 20% 2% 10% 6%
Poor condition of roadways
16% 8% 17% 13% 5% 7% 5%
Roadway construction 0% 0% 4% 7% 8% 4% 4% Traffic signals 3% 6% 2% 4% 8% 0% 20% Roadway connectivity 0% 0% 0% 3% 3% 1% 3% Weigh scales 0% 0% 5% 1% 4% 1% 3% Weight restrictions 12% 18% 0% 1% 4% 2% 2% Roadway geometrics 0% 0% 0% 1% 0% 1% 5% Fuel Costs 9% 7% 1% 0% 11% 13% N/A Other comment (various)
23% 25% 24% 0% 14% 9% 0%
Concern with other driver behavior*
0% 0% 0% 0% 1% 0% 9%
Nothing mentioned 1% 13% 0% 18% 22% 17% 0%
0
20
40
60
80
100
120 2012201220092006200520042003
2014 2012 2009 2006
2005
2004 2003

2014 Customer Satisfaction Surveys Executive Summary
Final Report Page 1-21
For 2014, “roadway congestion” was the most frequently mentioned response, followed by “poor condition of roadways.” As can be seen, 26% of respondents indicated “roadway congestion” as the major problem that their business faces in Delaware for 2014. “Roadway congestion” was the most frequently mentioned response in all the prior surveys. Twenty-three percent (23%) responded with “other/various comments” as the biggest issue facing their business. “Poor condition of roadways” was also a frequently mentioned response at 16%. “Weight restrictions” was the fourth most frequently mentioned response (12%). The remaining issues and problems by companies surveyed were “taxes, registrations, tolls, fees” (10%), “fuel costs” (9%), and “traffic signals” (3%).

2014 Customer Satisfaction Surveys General Transportation Users Survey
Final Report, Page 2-1
Chapter 2 GENERAL TRANSPORTATION USERS SURVEY
2.1 Survey Objectives The main objective of this survey was to provide DelDOT with data to assess how satisfied different customer segments are with the current transportation system. Information from this survey can be compared to previous surveys and allows the Department to monitor customer satisfaction over time. Information from the survey serves as a set of inputs into the Department’s progress monitoring program. This program assesses performance against the goals and objectives of the Statewide Long-Range Transportation Plan. Mirroring the previous Customer Satisfaction Surveys, the information objectives for the 2014 survey were: For users of each transportation mode, to ascertain the level of importance of various
attributes. For users of each transportation mode, to ascertain the level of performance perceived for
each of the attributes. For users of each transportation mode, to identify the level of satisfaction attained for each
attribute and for the mode overall.
2.2 Summary of Research Methodology AECOM developed the questionnaire for the baseline customer satisfaction survey conducted in 1997, in consultation with DelDOT’s Division of Planning. Customer Satisfaction Surveys have been completed by DelDOT on nearly an annual basis since 1997. As was done for the most recent past General Transportation User survey (completed in 2012), the same questionnaire was used for 2014. Like the previous surveys, a market research survey firm administered the interviews. For this 2014 survey, Abt SRBI conducted the interviews; Abt SRBI administered the 2012 interviews as well. An SPSS (a statistical software package) computer file was developed to process the survey information by AECOM. The SPSS system enabled AECOM research staff to integrate the survey data so it could be presented in aggregate form. Similar to the previous surveys, the 2014 survey involved interviews with a random probability sample of Delaware residents aged 16 years or older. In the previous survey done in 2012, cell phone and online (Internet) interviews were conducted for the first time in addition to land line telephone interviews to yield more representative results. This 2014 survey also utilizes a mix of cell phone, land line telephone and online (Internet) interviews. Cell phone interviewing was restricted to those households who had cell phones but no land line telephone. Telephone respondents in the land line sample were recruited using random digit dialing (RDD), from bocks of numbers known to consist of land lines. Cell phone only respondents were recruited using cell phone series blocks. These telephone numbers were dialed by hand and interviewers verified that respondents were in a safe position to talk (e.g., not driving at the time), were 16 years or older, resided in Delaware, and in what county. The geographic assignment for the cell sample is problematic, since addresses are based on the billing center associated with the account instead of the residence of the account holder. Respondent mobility is an additional issue. In order to properly control for this, respondents were asked to confirm that they lived in Delaware as well as which county. Internet respondents were recruited through an online panel. The sample source for the Internet panel was Research Now. Research Now emailed survey invitations to their panelists in each of Delaware’s three counties. Respondents confirmed their residence in Delaware and their specific county.

2014 Customer Satisfaction Surveys General Transportation Users Survey
Final Report, Page 2-2
All telephone interviewing, both cell phone and land line, was conducted using the same Internet screens which the Internet respondents saw. All interviewing was done in English. The sample size for the 2014 survey was similar to previous years, with a total of 1,208 interviews completed. In total, there were 1,019 telephone interviews (531 land line, 488 cell phone) and 189 internet interviews. The interviews were conducted during evenings and weekends between February 25, 2014 and March 11, 2014, by professional and experienced interviewers who were monitored on-site. The average length of interview (telephone) was just over 13 minutes. A combination of RDD and cell telephone samples and Internet panel was used to represent all those age 16 or older in Delaware’s three counties. The research design and sample used in the 2014 survey produced results that were deemed to be very accurate. There was only a 5% chance that the range of possible error in the results reported statewide is greater than ±2.8%. The percentages obtained in the survey were estimates of what the distribution of responses would be if the entire population had been surveyed. “Sampling error” is a statistical term that describes the probable difference between interviewing everyone in a given population and a sample drawn from that population. For example, the sampling error associated with a sample of 1,208 persons is ± 2.8 % at a 95% confidence interval. Thus, if 50% of those in a sample of 1,208 were found to agree with a particular statement, the percentage of agreement within the population from which the sample was drawn would be between 47.2% and 52.8% (50% ±2.8%), 95 times out of 100. Sample error increases as sample size decreases. For example if statements are made based on a sample of 300 persons, the sampling error is ±5.7%. This must be kept in mind when comparing the responses of different subgroups within the sample (e.g. men compared to women, suburbanites compared to city dwellers, etc.). Interviews were weighted to properly reflect the state’s population by county. A weighting factor is used to adjust the sample when statewide data are reported.
2.3 Relative Importance & Performance of Modal Attributes This section provides an in-depth examination of the importance and performance of various service attributes by user group for the General Transportation User Survey. Respondents were asked to rate the importance of each attribute on a 7-point scale (a rating of 1 meant “not at all important," while a rating of 7 meant “extremely important”) and the current performance of the attribute on a 7-point scale (a rating of 1 meant “poor” while a 7 meant “excellent”). Percentages are presented first and then the average ratings are presented for each attribute, and ordered from most important to least important or highest performance to lowest. Like the previous surveys, respondents were asked only to rate the attributes for each mode they used in the previous week.
2.3.1 Drive-Alone or Single-Occupant-Vehicle (SOV) Users For the 2014 survey, 72% of the sample indicated that they made drive-alone trips the previous week. While this was lower than the share found in the 2012 survey (83%), it was similar to the share in the 2009 survey (71%). Those with incomes greater than $35,000 were more likely to have driven alone than those with incomes less than $35,000 (78% versus 54%). In 2014, the percentage of drive-alone trips in the income group less than $35,000 (54%) was significantly lower compared to the 2012 survey (80%). Residents under the age of 50 were slightly less as likely to have made drive-alone trips, when compared to residents over the age of 50 years (70% and 75%, respectively). Similar to previous surveys, white residents were more likely to have driven alone (77%) in comparison to non-white residents (60%). Not surprisingly rural and suburban residents were more likely to have driven alone (74% each) than city/town (67%) residents. No significant differences by county were noted. Residents of New Castle County (72%) and Sussex County (72%) were equally as likely to have made drive-alone trips and these results were very similar to residents of Kent County (73%). The survey results also showed that men and women were nearly equally likely to have driven alone last week (74% and 71% respectively).

2014 Customer Satisfaction Surveys General Transportation Users Survey
Final Report, Page 2-3
2.3.1.1 Attribute Importance Those respondents that reported driving alone for some of their trips during the previous week were asked to rate the importance of twelve service-related attributes on a 1 to 7-point scale. The results are displayed in the table below.
Figure 2-1 Importance of Highway Attributes Not at all
important Extremely
Important
Attribute 1 2 3 4 5 6 7 Total Mean Hwy signs visible both at day and night 1% 0% 1% 2% 6% 11% 79% 100% 6.61
Timely snow plowing and salting 1% 1% 1% 3% 6% 14% 75% 100% 6.55
Clear lane lines on highways 1% 1% 1% 3% 9% 16% 71% 100% 6.50
Condition of pavement on hwys 1% 0% 1% 3% 8% 18% 69% 100% 6.46 Having clearly marked and protected work zones 1% 1% 1% 3% 10% 16% 67% 100% 6.36 Well-planned sequencing & timing of traffic lights 2% 1% 1% 3% 14% 18% 60% 100% 6.23
Hwys free from congestion 1% 1% 2% 4% 17% 18% 58% 100% 6.20 Info. on when to expect delays, road closings 2% 2% 5% 5% 20% 17% 50% 100% 5.92 Hwy signs that provide direction, mileage 2% 1% 4% 9% 19% 18% 48% 100% 5.90 Keeping land adjacent to hwys litter free 2% 2% 3% 10% 20% 21% 42% 100% 5.77 Keeping lands adjacent to hwys landscaped, mowed 4% 4% 8% 17% 25% 15% 27% 100% 5.09 Having many travel mode choices 14% 6% 12% 11% 24% 11% 21% 100% 4.50 Similar to previous surveys, among SOV users in Delaware the most important attribute was “highway signs visible both day and night”. For the 2014 survey, “timely snow plowing and salting” was the second most important attribute especially considering the harsh winter season experienced by the users. Similar to the 2012 survey, the least important attribute was “having many travel mode choices.” Like the previous surveys, “highways free from congestion” ranked in the middle level of importance among the attributes, yet “having many travel mode choices” ranked last. The difference in importance between the two illustrated that Delaware residents that drive alone are not yet seeing a relationship between these two attributes. This finding may indicate a continued need for more educational and marketing efforts on how choice of modes could impact quality of life in Delaware. The figure below illustrates the mean importance of the twelve attributes for SOV users.

2014 Customer Satisfaction Surveys General Transportation Users Survey
Final Report, Page 2-4
Figure 2-2 Mean Importance Ratings – SOV Users
2.3.1.2 Attribute Performance In addition to asking respondents how important each attribute was to them, the 2014 survey like the previous surveys, also asked the respondent how well the current transportation system was performing on each attribute. Again, a seven-point scale was used, with 1 meaning “poor” and 7 meaning “excellent”. The results are displayed in the table below.
Figure 2-3 Performance of Highway Attributes Poor Excellent Attribute 1 2 3 4 5 6 7 Total Mean Having clearly marked and protected work zones 1% 1% 2% 8% 24% 32% 31% 100% 5.75 Hwy signs visible both at day and night 1% 2% 4% 10% 24% 28% 32% 100% 5.64
Clear lane lines on highways 2% 2% 6% 11% 26% 27% 26% 100% 5.43 Hwy signs that provide direction, mileage 2% 2% 7% 11% 28% 29% 20% 100% 5.35 Keeping lands adjacent to hwys landscaped, mowed 3% 2% 7% 15% 28% 26% 18% 100% 5.22
Timely snow plowing and salting 4% 3% 6% 14% 23% 28% 22% 100% 5.21 Keeping land adjacent to hwys litter free 4% 5% 6% 14% 29% 25% 16% 100% 4.99 Info. on when to expect delays, road closings 4% 6% 11% 16% 28% 21% 15% 100% 4.92 Well-planned sequencing & timing of traffic lights 7% 5% 10% 20% 26% 16% 16% 100% 4.70 Having many travel mode choices 5% 8% 12% 21% 26% 17% 10% 100% 4.67
Hwys free from congestion 8% 3% 11% 17% 32% 16% 11% 100% 4.59
Condition of pavement on hwys 7% 5% 11% 18% 32% 17% 12% 100% 4.57 Generally as found in surveys such as this, and similar to what was found in previous years, performance ratings were lower than importance ratings. “Having clearly marked and protected
1
2
3
4
5
6
7 6.61 6.55 6.50 6.46 6.36 6.23 6.20 5.92 5.90 5.77
5.09
4.50
Extremely Important
Not at all Important

2014 Customer Satisfaction Surveys General Transportation Users Survey
Final Report, Page 2-5
work zones” and “highway signs visible both at day and night” were top performers in this year’s survey and were among the highest performing attributes in prior surveys as well. Similar to the previous surveys, some of the lowest rated attributes in terms of performance in the 2014 survey were “condition of pavement on highways’” “highways free from congestion” and “having many travel mode choices.” It should be noted that the performance rating for “well-planned sequencing & timing of traffic lights” improved in the 2014 survey compared to the previous survey (2012), when this attribute was one of the lowest performers. The following displays the mean performance ratings for drive-alone motorists.
Figure 2-4 Mean Performance Ratings – SOV Users
2.3.1.3 Importance-Performance Analysis By comparing an attribute across both dimensions (importance and performance), one can separate the attributes customers feel are very important and are currently less satisfied with, from those attributes of less importance. Importance-performance analysis is designed to take into account that not all shortfalls in service quality are of equal concern to customers. When an attribute that is considered to be of primary importance falls short of a desirable level of performance that is of greater concern compared to when a peripheral attribute is unsatisfactory in terms of performance. Thus, projects to address or improve shortfalls in a critical area (an attribute rated as high in importance, but low in performance) should be given a higher priority than projects proposed to rectify shortfalls in areas of marginal importance (attributes rated low in importance). To develop the satisfaction index, the mean rating based on both importance and performance was computed for each attribute. The satisfaction index was calculated by computing the ratio between the mean performance rating to the mean importance rating for each attribute. This index demonstrates the balance between importance and performance in the minds of customers. The higher the value of the index, the higher was the level of customer satisfaction on that attribute.
1
2
3
4
5
6
7
5.75 5.64 5.43 5.35 5.22 5.21 4.99 4.92
4.70 4.67 4.59 4.57
Excellent
Poor

2014 Customer Satisfaction Surveys General Transportation Users Survey
Final Report, Page 2-6
Figure 2-5 Importance-Performance Ratings and Satisfaction Indices – SOV Users
Attribute 2014 Mean Importance Rating
2014 Mean Performance
Rating
Satisfaction Index
Having many travel mode choices 4.50 4.67 103.78 Keeping lands adjacent to hwys landscaped, mowed 5.09 5.22 102.55 Hwy signs that provide direction, mileage 5.90 5.35 90.68 Having clearly marked and protected work zones 6.36 5.75 90.41 Keeping land adjacent to hwys litter free 5.77 4.99 86.48 Hwy signs visible both at day and night 6.61 5.64 85.33 Clear lane lines on highways 6.50 5.43 83.54 Info. on when to expect delays, road closings 5.92 4.92 83.11 Timely snow plowing and salting 6.55 5.21 79.54 Well-planned sequencing & timing of traffic lights 6.23 4.70 75.44 Hwys free from congestion 6.20 4.59 74.03 Condition of pavement on hwys 6.46 4.57 70.74 The highest level of satisfaction was obtained for the attribute of “having many travel mode choices”. The second highest level of satisfaction was obtained on the attribute of ““keeping lands adjacent to highways landscaped and mowed.” Both these attributes were also the top two attributes in the 2012 survey in terms of satisfaction. The lowest level of satisfaction for those who drive alone was found for “condition of pavement on highways” and “highways free from congestion.” These results were similar to the 2004, 2005, 2006, 2009 and 2012 survey findings. As was performed in the previous Customer Satisfaction Survey reports, another way of viewing the results of the importance-performance series of questions is the use of quadrant analysis. Quadrant analysis is designed to take into account that not all short falls in service quality are of equal concern to customers. Quadrant analysis can assist policy makers in decision-making by placing the attributes along two dimensions -- the importance of the attribute to the customers and the performance on the provision of the attribute. Having these two dimensions of customer evaluation allows for the creation of four performance quadrants as can be seen below. This type of analysis is more beneficial than simply using rank ordering of attributes, because it defines the customer’s assessment of the services by assigning them to “action quadrants”. Particularly at a time when resources for services may be limited, it is useful for policy makers to have an accurate view of the specific services that need attention from a customer viewpoint. For example, quadrant analysis can separate the attributes customers feel are very important and currently not satisfied with from those that they are satisfied with. This can distinguish attributes that are in need of corrective action (attributes with low satisfaction scores) versus those that may not need any immediate action but merely require continued maintenance (attributes with high satisfaction scores). Attributes targeted for corrective action should be addressed before attributes targeted for maintenance action.

2014 Customer Satisfaction Surveys General Transportation Users Survey
Final Report, Page 2-7
Figure 2-6 Importance – Performance Quadrants Pe
rform
ance
Rat
ing
on A
ttrib
ute
Importance Rating of Attribute Quadrants Below Average
Above Average
Above Average
(Quadrant 2) Maintenance Action: Low Priority
(Quadrant 1) Maintenance Action: High Priority
Below Average
(Quadrant 3) Corrective Action: Low Priority
(Quadrant 4) Corrective Action: High Priority
Each attribute is assigned to a quadrant based on its relative rating to all other attributes. Therefore, the intersection of the importance and performances axes is the average of the different attributes. For example, say the average of all the importance ratings is 6.0. A line is drawn through the grid at 6.0 on the x-axis indicating the overall average importance rating. Continuing this example, say the average performance rating for all attributes is 5.0, so a line is drawn on the y-axis at 5.0. Thus, the two axes intersect at the overall mean rating of 6.0 for importance and 5.0 for performance, and a grid results with four action quadrants. The attributes falling in Quadrant 4 have above average importance ratings, but have performance ratings that are below average (thus, these attributes are above average importance and below average performance). The attributes that fall within this quadrant should be the highest priority for corrective action. Attributes that fall within Quadrant 3 are both below average importance and below average performance. These attributes also need corrective action, but immediate attention is not required since the attributes are less important to customers. These items should be monitored and receive attention or investment after the more important attributes in Quadrant 4 are addressed. The attributes in Quadrant 2 are above average in performance and below average in importance. Attributes in this quadrant need only maintenance action and are the lowest priority of all the four quadrants. Items that fall within Quadrant 1 are above average in importance and above average in performance. Although these attributes are doing well currently, they are high priority for maintenance action and should not be neglected. These are salient issues to customers and need to be followed closely. The table below shows how the twelve attributes asked of SOV users fall into the four quadrants.
Figure 2-7 Importance – Performance Quadrant Analysis - SOV Users
Perfo
rman
ce R
atin
g
on A
ttrib
ute
Importance Rating of Attribute Quadrants Below Average
Above Average
Above Average (2) Maintenance: Low Priority Landscaping & Mowing
Directional Highway Signs
(1) Maintenance: High Priority
Clearly Marked Work Zones Clear Lane Lines
Signs Visible Day & Night Snow Plowing & Salting
Below Average
(3) Corrective: Low Priority
Mode Choices Info on Delays & Closings
Litter Free Highways
(4) Corrective: High Priority
Pavement Condition Timing of Traffic Lights
Highways Free of Congestion

2014 Customer Satisfaction Surveys General Transportation Users Survey
Final Report, Page 2-8
The attributes in Quadrant 1 represent items which SOV users regarded as important and on which Delaware received high marks. Although these attributes were currently perceived to be faring well, they are a high priority for maintenance and should not be neglected. These are attributes that are important to SOV users and are salient issues customers are attentive to. “Having clearly marked and protected work zones,” “having clear lane lines on the highway,” “having highway signs that are visible during both during the day and at night,” and “having timely snow plowing and salting” fell into Quadrant 1 in 2014. These were the same attributes in Quadrant 1 in the 2012 survey as well. The attributes in Quadrant 2 are those SOV users rate high in performance but low in importance. Therefore, while these attributes need some maintenance action, they are not as salient to SOV users as the items in Quadrant 1. The attributes, “keeping land adjacent to highways landscaped and mowed,” and “highway signs that provide direction and mileage,” fell in Quadrant 2 in 2014, similar to the 2012 survey results. Delaware is given low performance ratings on attributes falling into Quadrant 3, but these items are also of low importance to SOV users. In terms of action, these attributes should be considered for corrective action, but lower in priority when compared to attributes in Quadrant 4. “Having many travel mode choices”, “having information on when to expect traffic delays and road closings”, and “keeping land adjacent to highways litter free” were the attributes in this quadrant for SOV users in 2014. While the first two attributes belonged to this quadrant in 2012 as well, “keeping land adjacent to highways litter free” was in Quadrant 2 in the 2012 survey, suggesting perceived deteriorated performance in 2014. Quadrant 4 represents those attributes rated high in importance but low in performance, thus representing attributes with low customer satisfaction. These attributes are the ones which should be of highest priority to receive corrective action and for SOV users they were “condition of pavement on highways,” “having well-planned sequencing and timing of traffic lights,” and “having highways free from congestion.” These were the Quadrant 4 attributes as well in the 2009 and 2012 surveys.
2.3.2 All Motorists The previous analysis provided a snapshot of customer satisfaction for those that drove-alone during the week prior to the survey. However, from a policy development perspective, it is more useful to examine the data for all motorists (those that drove-alone only, those that carpooled only and those that drove-alone but also carpooled) to derive guidance on appropriate highway improvement actions from a customer perspective. This section of the report provides an examination of the data across all motorists (those that drove alone only, those that carpooled only and those that drove alone, but also carpooled). Of the 1,208 Delawareans surveyed, 1,100 respondents traveled either alone or with others in a motor vehicle the previous week (91%). This percentage was slightly lower than found in the 2012 survey (96%).
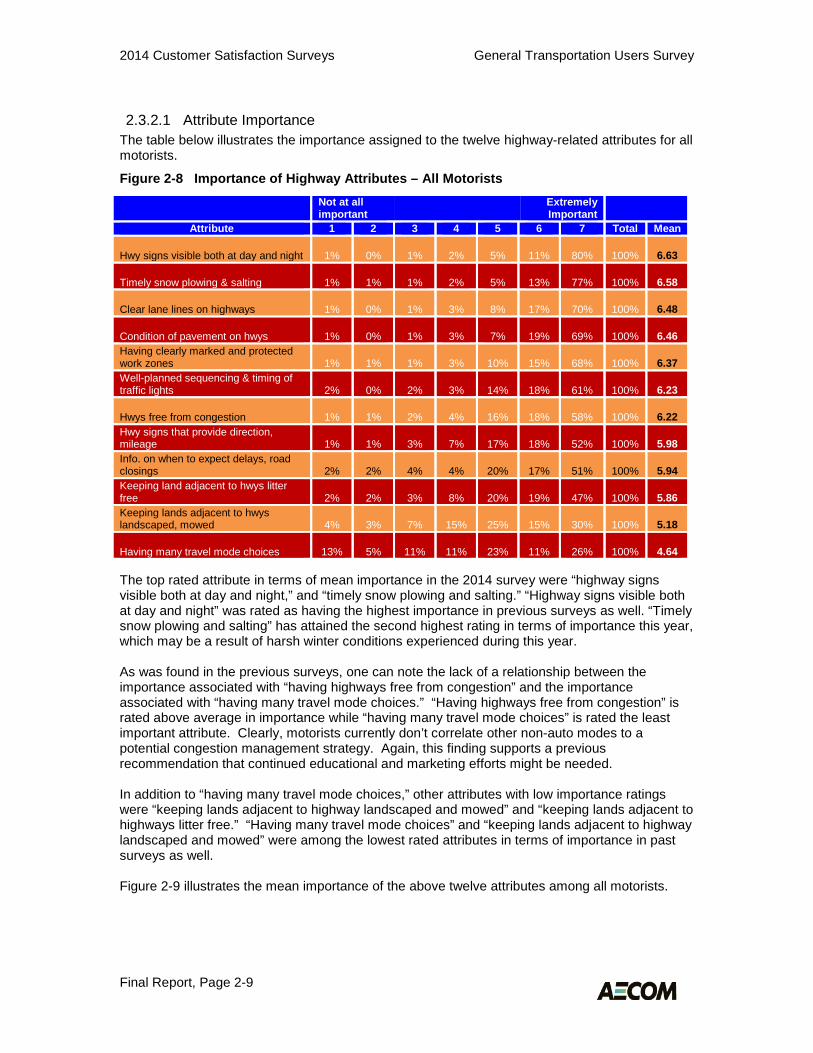
2014 Customer Satisfaction Surveys General Transportation Users Survey
Final Report, Page 2-9
2.3.2.1 Attribute Importance The table below illustrates the importance assigned to the twelve highway-related attributes for all motorists.
Figure 2-8 Importance of Highway Attributes – All Motorists Not at all
important Extremely
Important
Attribute 1 2 3 4 5 6 7 Total Mean
Hwy signs visible both at day and night 1% 0% 1% 2% 5% 11% 80% 100% 6.63
Timely snow plowing & salting 1% 1% 1% 2% 5% 13% 77% 100% 6.58
Clear lane lines on highways 1% 0% 1% 3% 8% 17% 70% 100% 6.48
Condition of pavement on hwys 1% 0% 1% 3% 7% 19% 69% 100% 6.46 Having clearly marked and protected work zones 1% 1% 1% 3% 10% 15% 68% 100% 6.37 Well-planned sequencing & timing of traffic lights 2% 0% 2% 3% 14% 18% 61% 100% 6.23
Hwys free from congestion 1% 1% 2% 4% 16% 18% 58% 100% 6.22 Hwy signs that provide direction, mileage 1% 1% 3% 7% 17% 18% 52% 100% 5.98 Info. on when to expect delays, road closings 2% 2% 4% 4% 20% 17% 51% 100% 5.94 Keeping land adjacent to hwys litter free 2% 2% 3% 8% 20% 19% 47% 100% 5.86 Keeping lands adjacent to hwys landscaped, mowed 4% 3% 7% 15% 25% 15% 30% 100% 5.18
Having many travel mode choices 13% 5% 11% 11% 23% 11% 26% 100% 4.64
The top rated attribute in terms of mean importance in the 2014 survey were “highway signs visible both at day and night,” and “timely snow plowing and salting.” “Highway signs visible both at day and night” was rated as having the highest importance in previous surveys as well. “Timely snow plowing and salting” has attained the second highest rating in terms of importance this year, which may be a result of harsh winter conditions experienced during this year. As was found in the previous surveys, one can note the lack of a relationship between the importance associated with “having highways free from congestion” and the importance associated with “having many travel mode choices.” “Having highways free from congestion” is rated above average in importance while “having many travel mode choices” is rated the least important attribute. Clearly, motorists currently don’t correlate other non-auto modes to a potential congestion management strategy. Again, this finding supports a previous recommendation that continued educational and marketing efforts might be needed. In addition to “having many travel mode choices,” other attributes with low importance ratings were “keeping lands adjacent to highway landscaped and mowed” and “keeping lands adjacent to highways litter free.” “Having many travel mode choices” and “keeping lands adjacent to highway landscaped and mowed” were among the lowest rated attributes in terms of importance in past surveys as well. Figure 2-9 illustrates the mean importance of the above twelve attributes among all motorists.

2014 Customer Satisfaction Surveys General Transportation Users Survey
Final Report, Page 2-10
Figure 2-9 Mean Importance Ratings – All Motorists
2.3.2.2 Attribute Performance The table below provides the performance rating data obtained in the survey from all motorists.
Figure 2-10 Performance of Highway Attributes – All Motorists Poor Excellent
Attribute 1 2 3 4 5 6 7 Total Mean Having clearly marked and protected work zones 1% 1% 3% 8% 23% 31% 33% 100% 5.73
Hwy signs visible both at day and night 1% 2% 4% 10% 23% 29% 31% 100% 5.59
Clear lane lines on highways 2% 2% 6% 11% 27% 26% 26% 100% 5.41 Hwy signs that provide direction, mileage 2% 3% 8% 11% 26% 29% 22% 100% 5.32 Keeping lands adjacent to hwys landscaped, mowed 3% 3% 7% 14% 27% 26% 20% 100% 5.20
Timely snow plowing & salting 4% 4% 7% 13% 21% 28% 23% 100% 5.20
Keeping land adjacent to hwys litter free 4% 5% 8% 14% 28% 25% 17% 100% 4.98 Info. on when to expect delays, road closings 4% 5% 10% 17% 27% 21% 16% 100% 4.85 Well-planned sequencing & timing of traffic lights 7% 5% 10% 18% 26% 17% 18% 100% 4.73
Condition of pavement on hwys 6% 5% 11% 18% 30% 17% 12% 100% 4.61
Hwys free from congestion 7% 3% 12% 18% 31% 16% 13% 100% 4.61
Having many travel mode choices 5% 7% 13% 19% 28% 16% 11% 100% 4.49 As in the 2012 survey, “having clearly marked and protected work zones” and “highway signs visible both at day and night” were the top two attributes in terms of performance in 2014. Considering the harsh winter season experienced this year, the improved performance rating for “timely snow plowing and salting” indicated a perceived recognition of improved performance of
1
2
3
4
5
6
7 6.63 6.58 6.48 6.46 6.37 6.23 6.22 5.98 5.94 5.86
5.18 4.64
Extremely Important
Not at all Important

2014 Customer Satisfaction Surveys General Transportation Users Survey
Final Report, Page 2-11
plowing and salting operations compared to 2012. However, due to these same harsh winter conditions and frequent plowing and salting operations, the attribute “condition of pavement on highways” has deteriorated in terms of performance this year compared to 2012, a year during which the winter season was milder. As was found in previous years, for all motorists, the lowest performing attributes were “having many mode choices,” and “highways free from congestion.” The figure below depicts the mean performance ratings for each attribute.
Figure 2-11 Mean Performance Ratings – All Motorists
2.3.2.3 Importance-Performance Analysis Again, the most relevant information for policy-makers and decision-makers are the results of the importance-performance analysis for all motorists: those that drive-alone combined with those that carpool. The table below shows the mean importance and performance ratings and the satisfaction index for each attribute. Once again, the satisfaction index is calculated by computing the ratio between the mean performance rating to the mean importance rating. This index demonstrates the balance between importance and performance for that attribute in the minds of customers. The higher the value of the index, the higher the level of customer satisfaction found on that attribute.
1
2
3
4
5
6
7
5.73 5.59 5.41 5.32 5.20 5.20
4.98 4.85 4.73 4.61 4.61 4.49
Excellent
Poor

2014 Customer Satisfaction Surveys General Transportation Users Survey
Final Report, Page 2-12
Figure 2-12 Importance-Performance Ratings and Satisfaction Indices – All Motorists
Attribute 2014 Mean Importance Rating
2014 Mean Performance
Rating
Satisfaction Index
Keeping lands adjacent to hwys landscaped, mowed 5.18 5.20 100.40 Having many travel mode choices 4.64 4.49 96.77 Having clearly marked and protected work zones 6.37 5.73 89.95 Hwy signs that provide direction, mileage 5.98 5.32 88.96 Keeping land adjacent to hwys litter free 5.86 4.98 84.98 Hwy signs visible both at day and night 6.63 5.59 84.31 Clear lane lines on highways 6.48 5.41 83.49 Info. on when to expect delays, road closings 5.94 4.85 81.65 Timely snow plowing and salting 6.58 5.20 79.03 Well-planned sequencing & timing of traffic lights 6.23 4.73 75.92 Hwys free from congestion 6.22 4.61 74.12 Condition of pavement on hwys 6.46 4.61 71.36 As can be seen in the table above, the highest levels of satisfaction were obtained on the attributes “keeping lands adjacent to highways landscaped and mowed” and “having many travel mode choices.” These were also among the highest rated levels of satisfaction in the 2009 and 2012 surveys. The lowest levels of satisfaction were found for “condition of pavement on highways,” and “highways free from congestion.” “Highways free from congestion” was the lowest rated attribute in the 2012 survey as well. Importance-performance quadrant analysis was also performed on the data and the results are contained in the table below.
Figure 2-13 Importance – Performance Quadrant Analysis – All Motorists
Perfo
rman
ce R
atin
g on
Attr
ibut
e
Importance Rating of Attribute Quadrants Below Average
Above Average
Above Average
(2) Maintenance: Low Priority Landscaping & Mowing Directional Hwy Signs
(1) Maintenance: High Priority
Protected Work Zones Signs Visible Day & Night
Clear Lane Lines Snow Plowing & Salting
Below Average
(3) Corrective: Low Priority
Mode Choices Litter Free Hwys
Info on Delays & Closings
(4) Corrective: High Priority
Pavement Condition Hwys Free of Congestion
Timing/Sequencing Signals
The attributes in Quadrant 1 represent items which all motorists regard as important and on which Delaware receives high ratings for performance. Customer satisfaction has currently been

2014 Customer Satisfaction Surveys General Transportation Users Survey
Final Report, Page 2-13
attained on these four attributes. These attributes are high priority for maintenance, because they are important to motorists and are notable factors that motorists are attentive to. For 2014, Quadrant 1 contained “having clearly marked and protected work zones,” “highway signs visible both at day and night,” “clear lane lines on highways,” and “timely snow plowing and salting.” The first three attributes were in Quadrant 1 in the 2012 survey as well. “Timely snow plowing and salting” was in Quadrant 4 in 2012, suggesting improved performance in 2014. This is a significantly positive change, especially considering the harsh winter season experienced in 2014. Quadrant 2 attributes are those which motorists rate high in performance but low in importance. Thus relative to Quadrant 1 attributes, these items are of lower priority for maintenance action or investments, as these attributes are not as salient to motorists as the items in Quadrant 1. “Land adjacent to highways kept landscaped and mowed,” and “highway signs giving information on direction and mileage,” were Quadrant 2 attributes in 2014. These attributes were Quadrant 2 attributes in the 2012, 2009, 2006, and 2005 surveys as well. Low performance ratings are given to attributes falling into Quadrant 3 but these items are also of less importance to motorists. “Having many travel mode choices,” “keeping lands adjacent to highways litter free,” and “information on delays and road closings” were the Quadrant 3 attributes for motorists in this year’s survey. “Keeping lands adjacent to highways litter free,” and “information on delays and road closings” were the Quadrant 2 attributes in 2012, suggesting a perception of reduced performance in 2014. However, it should be noted that these attributes were Quadrant 3 attributes in 2009 as well. Because of lower performance ratings, Quadrant 3 attributes should be targeted for corrective action but with a lower priority than those attributes in Quadrant 4. Quadrant 4 represents those attributes rated high in importance but low in satisfaction with the delivery of these services. These attributes should be targeted for high priority corrective action and in 2014 for motorists they were “condition of pavement on highways,” “highways free from congestion,” and “well-planned sequencing and timing of traffic lights.” These were Quadrant 4 attributes in 2009 and 2012 as well.
2.3.3 Carpoolers (Ride or Drive with Others) As was done in the previous survey years, carpoolers were broken into two groups by the survey instrument: those that only carpooled (did not drive alone during the previous week) and those that carpooled but also drove alone. All carpoolers rated the same twelve highway attributes (these results have been reported in the above section) but they also rated three additional attributes that relate specifically to carpooling. In the 2014 survey results, a total of 737 Delawareans of the 1,208 surveyed this year (61% of the sample), indicated that they carpooled (rode or drove with others) the previous week. This share was slightly lower that of 2012 (66%) but higher than those obtained from the 2009 (33%), 2006 (32%), and 2005 (32%) survey results. Respondents under 50 years were more likely to have made carpool trips compared to respondents over 50 years of age (66% and 55%, respectively). There were no significant differences noted by gender, as males were nearly equally likely as females to have made carpool trips (58% and 64%, respectively) the previous week. Also, respondents with household income less than $35,000 were nearly equally likely as those with household income greater than $35,000 to have made carpool trips (59% and 63% respectively). White respondents were also found to be nearly equally as likely as non-white respondents to have made carpool trips (63% and 58% respectively). By area type, respondents in city or town areas, suburban areas and rural areas (64%, 62% and 56% respectively) were also found to be nearly equally likely to have made carpool trips the previous week.

2014 Customer Satisfaction Surveys General Transportation Users Survey
Final Report, Page 2-14
By county, Kent County residents were nearly equally likely to have made carpool trips compared than New Castle County residents and Sussex County Residents (Kent County 63%, New Castle County 62%, and Sussex County 59%). Thus in general in 2014, no significant variation was found by differentiating attributes (such as gender, age, county, etc.) when it came to carpooling. The results in this section report the rating results for the carpooling attributes among all carpoolers.
2.3.3.1 Attribute Importance Those respondents who rode or drove with others during the previous week were asked to rate the importance of three carpool-related attributes on the same seven-point scale. The results are displayed in the table below.
Figure 2-14 Importance of Carpool Attributes - All Carpoolers Not at all
important Extremely
Important
Attribute 1 2 3 4 5 6 7 Total Mean
HOV lanes for carpools and buses 18% 8% 9% 8% 19% 16% 22% 100% 4.37
Providing a system of park-and-rides 19% 9% 9% 11% 19% 13% 20% 100% 4.19
Information to help form carpools 24% 10% 11% 12% 19% 9% 15% 100% 3.79 For 2014, “HOV lanes for carpools and buses” was the top rated attribute in terms of importance for the first time. During previous surveys in the past decade (2012, 2009, 2006 and 2005), the highest rated attribute was always “providing a system of park-and-rides,” which has moved down in importance to the second spot in 2014. Like previous surveys, “information to help form carpools” was the lowest rated attribute in terms of importance. These results could denote that the majority of current carpooling is occurring among family, friends and acquaintances/ colleagues, and that current carpoolers do not see any need for additional sources of information to form carpools. Figure 2-15 illustrates the mean importance of each of the three carpool-related attributes.
Figure 2-15 Mean Importance Ratings – All Carpoolers
1
2
3
4
5
6
7
4.37 4.19 3.79
Extreme
Not at

2014 Customer Satisfaction Surveys General Transportation Users Survey
Final Report, Page 2-15
2.3.3.2 Attribute Performance Carpoolers were also asked to rate how well the current transportation system was performing on each of these three attributes. The results are displayed in the following table.
Figure 2-16 Performance of Carpool Attributes – All Carpoolers Poor Excellent
Attribute 1 2 3 4 5 6 7 Total Mean
Providing a system of park-and-rides 8% 7% 11% 18% 29% 14% 13% 100% 4.46
Information to help form carpools 21% 11% 14% 16% 22% 10% 6% 100% 3.60
HOV lanes for carpools and buses 34% 11% 9% 11% 19% 5% 10% 100% 3.26 Like the previous survey results and as can be expected, the performance ratings were found to be lower than the importance ratings. As was found in the previous surveys, “providing a system of park-and-rides” was the highest rated attribute, while “HOV lanes for carpools and buses” was the lowest. The following figure shows the mean performance for each of the three carpool attributes.
Figure 2-17 Mean Performance Ratings – All Carpoolers
2.3.3.3 Importance-Performance Analysis The table below shows the mean importance and performance ratings and the satisfaction index for each attribute. To develop the satisfaction index, the mean rating for both importance and performance were computed for each attribute. The satisfaction index is calculated by computing the ratio between the mean performance rating to the mean importance rating for each attribute. The value of this index demonstrates the balance between importance and performance in the minds of the users for that attribute. The higher the value of the index, the higher the level of customer satisfaction found on that attribute.
1
2
3
4
5
6
7
4.46
3.60 3.26
Excellent
Poor

2014 Customer Satisfaction Surveys General Transportation Users Survey
Final Report, Page 2-16
Figure 2-18 Importance – Performance Ratings and Satisfaction Indices - All Carpoolers
Attribute 2014 Mean Importance
Rating
2014 Mean Performance
Rating
Satisfaction Index
Providing a system of park-and-rides 4.19 4.46 106.40 Information to help form carpools 3.79 3.60 94.99 HOV lanes for carpools and buses 4.37 3.26 74.60 Similar to 2012, the attribute with the highest level of satisfaction for carpoolers in 2014 was “providing a system of park-and-rides.” The lowest level of satisfaction was attained for the attribute of providing “HOV lanes for carpools and buses” similar to 2012. In the 2009 survey, “information to help form carpools” was the attribute with the highest level of satisfaction. Again, quadrant analysis was conducted on the importance-performance results from the carpool features. The results are contained in the following table.
Figure 2-19 Importance – Performance Quadrant Analysis - All Carpoolers
Perfo
rman
ce R
atin
g on
Attr
ibut
e
Importance Rating of Attribute Quadrants Below Average
Above Average
Above Average (2) Maintenance: Low Priority
(1) Maintenance: High Priority
Providing a System of Park & Rides Below Average
(3)
Corrective: Low Priority Information to Help Form Carpools
(4) Corrective: High Priority
HOV Lanes for Carpools & Buses The results of the quadrant analysis performed on the 2014 data exactly resembled the 2009 and 2012 survey results. Like prior surveys, Quadrant 1 showed that carpoolers regard “providing a system of park-and-rides” as important and Delaware received above average marks for performance. Work on “providing a system of park-and-rides” should remain a high priority action. There were no attributes in Quadrant 2 in 2014. The attributes that fall into Quadrant 3 have low performance ratings but are also of less importance. “Information to help form carpools” was a Quadrant 3 attribute in this year’s survey. This attribute should be targeted for corrective action but with a lower priority than those attributes in Quadrant 4. Quadrant 4 shows attributes rated, on average, high in importance but low in performance. As was found in prior surveys, “providing HOV lanes for carpools and buses” is located in Quadrant 4 for 2014. Especially considering the importance of this attribute as it ranked the highest of all carpoolers’ opinion, opportunities should be closely examined.
2.3.4 Transit Users Similar to the previous surveys along with motorists, bicyclists, and pedestrians, transit riders were also asked to rate the importance of transit service attributes and then the performance of those attributes. This section of the report describes the results of a series of rating questions posed to transit riders in the General Transportation User survey.

2014 Customer Satisfaction Surveys General Transportation Users Survey
Final Report, Page 2-17
Out of the total sample, only 8% of respondents (n=93) indicated that they had made a trip using transit (either a bus or a train) during the previous week. This was slightly higher than the transit percentages from the surveys in the past decade - 2012 (6%), 2009 (4%), 2006 (5%), 2005 (3%), 2004 (7%) and 2003 (3%). In the 2014 survey, New Castle County respondents had the highest percentage of transit users (10%), followed by Kent County (6%) and Sussex County (2%). Those respondents with a yearly household income over $35,000 were less likely to use transit than those with a yearly household income under $35,000 (6% and 14%, respectively). Non-white respondents were more likely to use transit than white respondents (15% and 4%, respectively) and 10% of respondents under 50 years old use transit compared to 5% of respondents over 50 years old.
2.3.4.1 Attribute Importance Like previous surveys, for transit users, the questionnaire contained thirteen attributes of transit service. Each respondent was asked to rate the importance of each attribute on a seven-point scale and following the importance rating questions, respondents were asked to rate the current performance of each attribute. The results of the attribute importance ratings are displayed in the following table.
Figure 2-20 Importance of Transit Attributes Not at all
important Extremely
Important
Attribute 1 2 3 4 5 6 7 Total Mean
Safe & secure waiting areas 0% 0% 0% 2% 9% 4% 86% 100% 6.74
Courteous on-board personnel 0% 0% 0% 2% 16% 24% 57% 100% 6.50
Frequent transit service 0% 2% 0% 3% 10% 13% 72% 100% 6.49 Sidewalks to & from transit stations & stops 2% 2% 0% 0% 10% 11% 75% 100% 6.48 Info on when to expect transit delays 0% 2% 0% 6% 10% 6% 77% 100% 6.48 Covered shelters & stations where I can wait 1% 0% 0% 5% 6% 21% 68% 100% 6.47
Bus-to-bus transfers 1% 2% 0% 8% 5% 15% 70% 100% 6.45 Info on transit schedules and fares 0% 2% 0% 2% 21% 13% 63% 100% 6.31 Transit stops & stations w/ good lighting 1% 2% 0% 9% 8% 14% 67% 100% 6.31
Seat availability 0% 4% 2% 4% 10% 15% 65% 100% 6.27 Good condition & clean vehicle interiors 0% 2% 0% 10% 11% 23% 54% 100% 6.15
Litter free stations and stops 0% 2% 6% 8% 10% 17% 56% 100% 6.05 Special lanes on hwys for transit vehicles 7% 3% 0% 8% 19% 19% 44% 100% 5.80 As can be seen in the above table, “having safe and secure waiting areas,” “courteous on-board personnel,” and “frequent transit service” were the most important attributes. “Having safe and secure waiting areas” was rated as the most important transit attribute in the 2012 survey as well. The attribute “frequency of transit service”, which was a middle ranked attribute in the 2012 survey in terms of importance has moved up by four spots to the third most important attribute in the 2014 survey.

2014 Customer Satisfaction Surveys General Transportation Users Survey
Final Report, Page 2-18
As in previous survey years, the lowest rated attribute in terms of importance was “special lanes on highways for transit vehicles.” The attribute “bus-to-bus transfers”, which was the second lowest rated attribute in terms of importance in the 2012 survey, has also moved up by five spots in importance. This may indicate that Delaware transit users are now realizing the need for more frequent transit service and better connectivity among routes. The following figure illustrates the mean importance rating for each transit attribute.
Figure 2-21 Mean Importance Ratings - Transit Users
2.3.4.2 Attribute Performance Along with importance ratings, respondents that used transit the previous week also provided ratings, on a seven-point scale, regarding how well the current transit system is performing on each attribute. The table below provides the data for this series of questions.
1
2
3
4
5
6
7 6.74 6.50 6.49 6.48 6.48 6.47 6.45 6.31 6.31 6.27 6.15 6.05 5.80
Extremely Important
Not at all Important

2014 Customer Satisfaction Surveys General Transportation Users Survey
Final Report, Page 2-19
Figure 2-22 Performance of Transit Attributes Poor Excellent
Attribute 1 2 3 4 5 6 7 Total Mean Info on transit schedules and fares 6% 0% 14% 10% 12% 19% 40% 100% 5.43
Courteous on-board personnel 6% 0% 9% 13% 22% 27% 22% 100% 5.40 Good condition & clean vehicle interiors 7% 5% 0% 7% 30% 33% 19% 100% 5.25
Safe & secure waiting areas 7% 3% 9% 10% 13% 36% 21% 100% 5.21
Litter free stations and stops 7% 8% 5% 15% 17% 38% 11% 100% 5.07 Sidewalks to & from transit stations & stops 10% 2% 2% 20% 29% 14% 22% 100% 4.95 Transit stops & stations w/ good lighting 8% 10% 5% 16% 22% 21% 18% 100% 4.78
Seat availability 11% 6% 9% 6% 33% 17% 17% 100% 4.71 Info on when to expect transit delays 10% 12% 6% 15% 28% 14% 15% 100% 4.56 Covered shelters & stations where I can wait 14% 13% 4% 12% 33% 10% 15% 100% 4.36
Frequent transit service 21% 3% 8% 14% 25% 9% 20% 100% 4.30
Bus-to-bus transfers 27% 5% 3% 20% 11% 23% 10% 100% 4.21 Special lanes on hwys for transit vehicles 29% 14% 4% 17% 9% 8% 19% 100% 3.93 In terms of performance, transit service in Delaware was rated as performing very well on “info on transit schedules and fares” and “courteous on-board personnel.” The latter attribute has shown significant performance improvement in 2014 (ranked 3rd of 13 attributes with mean performance value of 5.40) as compared to the 2012 survey (ranked 9th of 13 attributes with mean performance value of 4.45). “Safe and secure waiting areas” has also significantly improved in performance in 2014 (ranked 4th of 13 attributes with mean performance value of 5.21) compared to the 2012 survey (ranked 11th of 13 attributes with mean performance value of 4.13). Poor performing attributes included “special lanes on highways for transit vehicles” and “bus-to-bus transfers.” While “special lanes on highways for transit vehicles” was also the second lowest rated attributes in the 2012 survey, the performance of “bus-to-bus transfer” attribute has deteriorated significantly in the 2014 survey compared to the 2012 survey. The following figure illustrates the mean performance rating for each transit attribute.

2014 Customer Satisfaction Surveys General Transportation Users Survey
Final Report, Page 2-20
Figure 2-23 Mean Performance Ratings – Transit Users
2.3.4.3 Importance-Performance Analysis Importance-performance analysis was also conducted on the transit user attribute rating data. The importance and performance ratings and satisfaction index for each attribute is displayed below. To develop the satisfaction index, the mean rating for both importance and performance were computed for each attribute. The satisfaction index is calculated by computing the ratio between the mean performance rating to the mean importance rating for each attribute. This index demonstrates the balance between importance and performance for that attribute in the minds of customers. The higher the value of the index, the higher the level of customer satisfaction found on that attribute. When the mean performance rating exceeds the mean importance rating, the satisfaction index is over 100. This may mean that resources are being over-expended on that attribute relative to the importance of the attribute to customers and some resources can be reallocated.
1
2
3
4
5
6
7
5.43 5.40 5.25 5.21 5.07 4.95 4.78 4.71 4.56
4.36 4.30 4.21 3.93
Excellent
Poor

2014 Customer Satisfaction Surveys General Transportation Users Survey
Final Report, Page 2-21
Figure 2-24 Importance-Performance Ratings and Satisfaction Indices – Transit Users
Attribute 2014 Mean Importance
Rating
2014 Mean Performance
Rating
Satisfaction Index
Info on transit schedules and fares 6.31 5.43 86.05 Good condition & clean vehicle interiors 6.15 5.25 85.37 Litter free stations and stops 6.05 5.07 83.80 Courteous on-board personnel 6.50 5.40 83.08 Safe & secure waiting areas 6.74 5.21 77.30 Sidewalks to & from transit stations & stops 6.48 4.95 76.39 Transit stops & stations w/ good lighting 6.31 4.78 75.75 Seat availability 6.27 4.71 75.12 Info on when to expect transit delays 6.48 4.56 70.37 Special lanes on hwys for transit vehicles 5.80 3.93 67.76 Covered shelters & stations where I can wait 6.47 4.36 67.39 Frequent transit service 6.49 4.30 66.26 Bus-to-bus transfers 6.45 4.21 65.27 Satisfaction was the highest for “information on transit schedules and fares” and “good condition and clean vehicle interiors.” Satisfaction for “courteous on-board personnel,” and “safe & secure waiting areas” improved significantly from the 2012 survey. Expectations for performance were not being met on the attributes of “bus-to-bus transfers,” and “frequent transit service” according to the 2014 survey results. “Bus-to-bus transfers” showed significant decrease compared to the 2012 survey results, suggesting customer satisfaction deterioration on this attribute in Delaware. Importance-performance quadrant analysis was conducted to provide further guidance on the interpretation and use of the rating data. The results are contained in the following table.

2014 Customer Satisfaction Surveys General Transportation Users Survey
Final Report, Page 2-22
Figure 2-25 Importance – Performance Quadrant Analysis – Transit Users Pe
rform
ance
Rat
ing
on A
ttrib
ute
Importance Rating of Attribute Quadrants Below Average
Above Average
Above Average
(2) Maintenance: Low Priority
Good Condition, Clean Interiors Litter Free Stations & Stops
Stops & Stations w/ Good Lighting Info on Transit Schedules & Fares
(1) Maintenance: High Priority Sidewalks to/from Stops
Courteous On-Board Personnel Safe & Secure Waiting Areas
Below Average
(3) Corrective: Low Priority
Special Lanes on Highways Seat Availability
(4) Corrective: High Priority
Frequency of Transit Service Info on When to Expect Delays
Covered Shelters/Stations Bus-to-Bus Transfers
Items in Quadrant 1 contain attributes that are considered both high in importance and performance. Customer satisfaction has currently being attained on these attributes. Continuing to deliver on these attributes should be a high priority. For 2014, three attributes fell in Quadrant 1. These attributes were “sidewalks to and from transit stops and stations,” “having courteous on-board personnel,” and “having safe and secure waiting areas.” Of these three attributes in Quadrant 1, “sidewalks to and from transit stops and stations” was also in Quadrant 1 in the 2012 survey. “Having courteous on-board personnel,” and “having safe and secure waiting areas,” were in Quadrant 4 in 2012, suggesting improved performance in 2014 Items in Quadrant 2 are those that respondents rated as having importance ratings below the overall average but performance ratings are above the overall average. Accordingly, these attributes would be the lowest priority for future investments. “Good condition and clean vehicle interiors,” “transit stations and stops that are litter free,” “transit stops and stations with good lighting,” and “info on transit schedules and fares” were placed in Quadrant 2 in this year’s survey. In the 2012 survey, the first three attributes also fell in the same quadrant, suggesting consistent importance and performance over the past two years. “Info on transit schedules and fares” was placed in Quadrant 1 in 2012, suggesting decreased importance but sustained performance in 2014. The attributes that fall into Quadrant 3 have low performance ratings but are of less importance. “Having special lanes on highways for transit vehicles,” and “seat availability” were located in Quadrant 3 in the 2014 survey. “Having special lanes on highways for transit vehicles” was placed in Quadrant 3 in the previous two surveys (2009 and 2012) as well. However, “seat availability was in Quadrant 1 in 2012, suggesting reduction in both importance and performance in 2014. Quadrant 4 shows attributes rated, on average, high in importance but low in performance. Items in Quadrant 4 in the 2014 survey were “having frequent transit service,” “information on when to expect transit delays,” ”providing covered shelters and stations where I can wait,” and “having bus-to-bus transfers.” The first two attributes were placed in Quadrant 4 in past surveys as well. ”Providing covered shelters and stations where I can wait” was placed in Quadrant 1 in 2012, suggesting decreased performance in 2014. “Having bus-to-bus transfers” was placed in Quadrant 2 in the 2012 survey, suggesting increased importance but deteriorated performance in 2014.

2014 Customer Satisfaction Surveys General Transportation Users Survey
Final Report, Page 2-23
2.3.5 Bicyclists Just like the previous surveys, respondents were also asked if they had used a bicycle for any of the previous week’s trips. If a respondent indicated that a bicycle trip was made, the respondent was asked to rate both the importance and performance of twelve different attributes. A low percent of the sample in 2014 made a trip by bicycle during the previous week, 2% (n=20). This percentage was slightly lower than the 2012 survey (4%) but similar to almost all the surveys prior to 2012. Due to the small sample size, the data from this group cannot be deemed representative of all bicycle users.
2.3.5.1 Attribute Importance Bicyclists were asked to rate the importance of twelve different attributes on a scale of 1 to 7, with a “1” being “not at all important” and a “7” being “extremely important”. The results are outlined in the following table showing the percentage distribution of response for each rating along with the mean importance as computed for each attribute. Attributes are ordered in the table by mean importance value.
Figure 2-26 Importance of Bicycle Attributes Not at all important Extremely
Important
Attribute 1 2 3 4 5 6 7 Total Mean Roadways clear of debris 0% 0% 0% 6% 24% 17% 53% 100% 6.19 Adequate street lighting 0% 0% 0% 1% 32% 25% 43% 100% 6.09 Striped bicycle lanes 0% 0% 0% 5% 33% 14% 48% 100% 6.06 Signed bicycle routes 0% 0% 1% 7% 25% 27% 40% 100% 5.99 Smooth pavement on roadways 0% 0% 0% 5% 33% 24% 38% 100% 5.95 Wide, paved shoulders 0% 0% 0% 5% 28% 36% 32% 100% 5.95 Separate bicycle paths 0% 0% 0% 23% 24% 12% 41% 100% 5.72 Bicycle friendly drainage grates 4% 0% 0% 14% 32% 23% 27% 100% 5.50 Bicycle racks and lockers 7% 0% 0% 11% 32% 27% 23% 100% 5.38 Low speed motor vehicle traffic 3% 8% 6% 23% 25% 7% 27% 100% 4.95 Low volume motor vehicle traffic 4% 3% 10% 26% 29% 7% 20% 100% 4.81 Shower facilities 44% 12% 0% 12% 25% 5% 2% 100% 2.95
In this year’s survey, “roadways clear of debris” and “adequate street lighting” were the top rated attributes for importance. “Roadway clear of debris” was the highest rated attribute in terms of importance in the 2009 survey as well while “adequate street lighting” was the second highest important attribute in the 2012 survey. Mirroring previous survey results, the least important attribute by far in 2014 was “shower facilities.” The mean importance rating for each attribute is displayed graphically in the figure below.

2014 Customer Satisfaction Surveys General Transportation Users Survey
Final Report, Page 2-24
Figure 2-27 Mean Importance Ratings – Bicycle Users
2.3.5.2 Attribute Performance Just as other users, bicyclists were asked to rate the performance provided by the current transportation system for each of the twelve attributes. The following table provides the performance ratings associated with each attribute.
Figure 2-28 Performance of Bicycle Attributes Poor Excellent
Attribute 1 2 3 4 5 6 7 Total Mean
Adequate street lighting 0% 7% 10% 13% 19% 40% 11% 100% 5.14
Roadways clear of debris 0% 7% 2% 21% 38% 25% 8% 100% 4.97 Smooth pavement on roadways 13% 5% 0% 6% 41% 23% 12% 100% 4.73
Wide, paved shoulders 0% 7% 16% 11% 41% 23% 2% 100% 4.69 Low volume motor vehicle traffic 0% 5% 12% 49% 19% 13% 2% 100% 4.56
Striped bicycle lanes 3% 7% 19% 11% 32% 26% 2% 100% 4.55 Low speed motor vehicle traffic 0% 4% 23% 21% 40% 5% 6% 100% 4.54 Bicycle friendly drainage grates 3% 16% 1% 43% 17% 13% 7% 100% 4.53
Signed bicycle routes 0% 17% 1% 33% 20% 25% 4% 100% 4.46
Separate bicycle paths 0% 7% 31% 17% 25% 16% 4% 100% 4.23
Bicycle racks and lockers 15% 18% 23% 17% 10% 11% 7% 100% 3.96
Shower facilities 41% 10% 24% 4% 14% 4% 3% 100% 3.22 As was found in previous surveys and as can be seen in the above table, the performance ratings for bicycle users were lower than the other modes discussed. This year’s survey showed that “adequate street lighting” and “roadways clear of debris” were the highest rated attributes for
1
2
3
4
5
6
76.19 6.09 6.06 5.99 5.95 5.95
5.72 5.50 5.38 4.95 4.81
2.95
Extremely Important
Not at all Important

2014 Customer Satisfaction Surveys General Transportation Users Survey
Final Report, Page 2-25
performance, while “shower facilities” and “bicycle racks and lockers” were the lowest rated attributes for performance. “Roadways clear of debris” was the highest performing attribute in the 2009, 2006, 2005, 2004, 2003, 2002 and 2001 surveys. “Shower facilities” was found to be a low performance attribute in all prior surveys, too. The figure below illustrates the mean performance associated with each bicycle attribute.
Figure 2-29 Mean Performance Ratings - Bicycle Users
Clearly, compared to the other modes discussed and as was found in the previous survey years, bicycle users’ expectations for system performance were not being met. As with the other modes, importance-performance analysis was conducted on the data. The results are discussed in the next section.
2.3.5.3 Importance-Performance Analysis The table below shows for each of the twelve attributes the mean importance rating, the mean performance rating, and the satisfaction index. To develop the satisfaction index, the mean rating for both importance and performance were computed for each attribute. The satisfaction index is calculated by computing the ratio between the mean performance rating to the mean importance rating. This index demonstrates the balance between importance and performance in the minds of the users for that attribute. The higher the value of the index, the higher the level of customer satisfaction found on that attribute.
1
2
3
4
5
6
7
5.14 4.97
4.73 4.69 4.56 4.55 4.54 4.53 4.46 4.23 3.96
3.22
Excellent
Poor
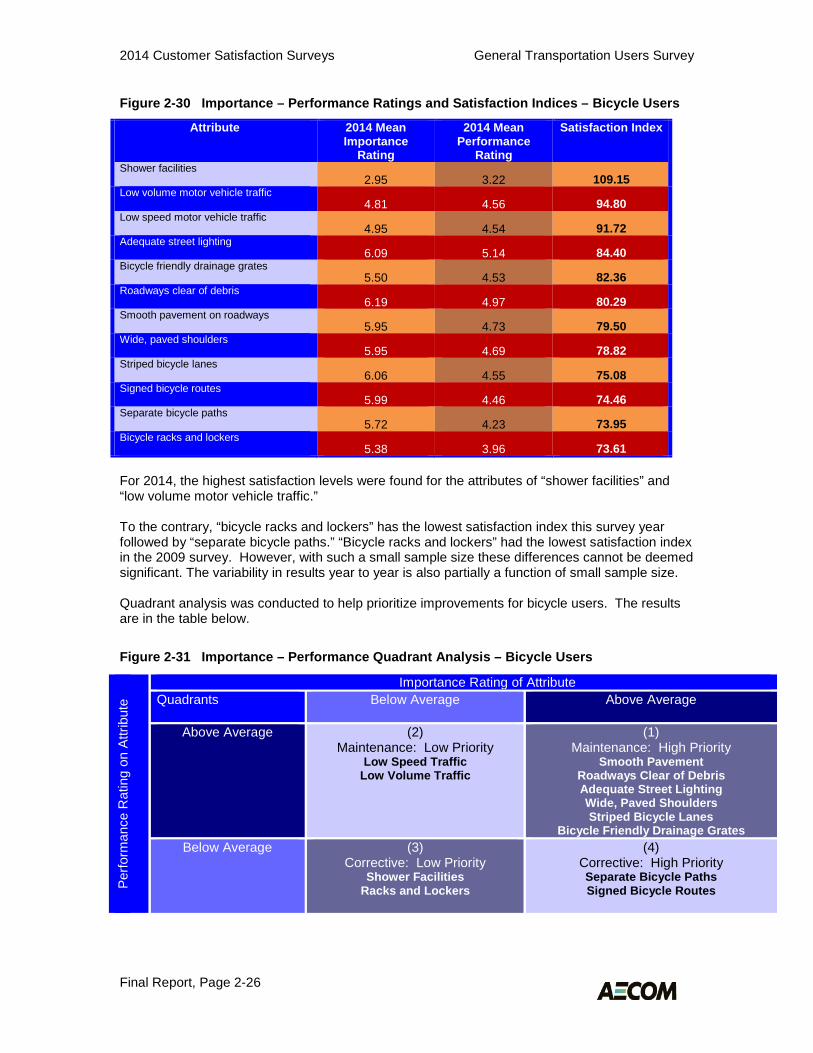
2014 Customer Satisfaction Surveys General Transportation Users Survey
Final Report, Page 2-26
Figure 2-30 Importance – Performance Ratings and Satisfaction Indices – Bicycle Users
Attribute 2014 Mean Importance
Rating
2014 Mean Performance
Rating
Satisfaction Index
Shower facilities 2.95 3.22 109.15 Low volume motor vehicle traffic 4.81 4.56 94.80 Low speed motor vehicle traffic 4.95 4.54 91.72 Adequate street lighting 6.09 5.14 84.40 Bicycle friendly drainage grates 5.50 4.53 82.36 Roadways clear of debris 6.19 4.97 80.29 Smooth pavement on roadways 5.95 4.73 79.50 Wide, paved shoulders 5.95 4.69 78.82 Striped bicycle lanes 6.06 4.55 75.08 Signed bicycle routes 5.99 4.46 74.46 Separate bicycle paths 5.72 4.23 73.95 Bicycle racks and lockers 5.38 3.96 73.61 For 2014, the highest satisfaction levels were found for the attributes of “shower facilities” and “low volume motor vehicle traffic.” To the contrary, “bicycle racks and lockers” has the lowest satisfaction index this survey year followed by “separate bicycle paths.” “Bicycle racks and lockers” had the lowest satisfaction index in the 2009 survey. However, with such a small sample size these differences cannot be deemed significant. The variability in results year to year is also partially a function of small sample size. Quadrant analysis was conducted to help prioritize improvements for bicycle users. The results are in the table below.
Figure 2-31 Importance – Performance Quadrant Analysis – Bicycle Users
Perfo
rman
ce R
atin
g on
Attr
ibut
e
Importance Rating of Attribute Quadrants Below Average
Above Average
Above Average (2) Maintenance: Low Priority
Low Speed Traffic Low Volume Traffic
(1) Maintenance: High Priority
Smooth Pavement Roadways Clear of Debris Adequate Street Lighting Wide, Paved Shoulders Striped Bicycle Lanes
Bicycle Friendly Drainage Grates Below Average
(3)
Corrective: Low Priority Shower Facilities
Racks and Lockers
(4) Corrective: High Priority Separate Bicycle Paths Signed Bicycle Routes

2014 Customer Satisfaction Surveys General Transportation Users Survey
Final Report, Page 2-27
Six bicycle attributes fell into Quadrant 1 and these attributes should be high in priority for continued expenditures. Quadrant 1 attributes this year included “smooth pavement on roadways,” “roadways clear of debris,” “Adequate street lighting,” “wide, paved shoulders,” “striped bicycle lanes’” and “bicycle friendly drainage grates.” The first four of these attributes were placed in Quadrant 1 in the 2009 and 2012 surveys as well. “Bicycle friendly drainage grates” was in Quadrant 2 in 2012, suggesting improved importance in 2014. “Striped bicycle lanes” was in Quadrant 4 in the 2012 survey, suggesting improved performance in 2014. Quadrant 2 attributes have an above average performance rating, but are rated below average in importance. In this year’s survey, two attributes were placed in Quadrant 2: “low volume motor vehicle traffic” and “low speed motor vehicle traffic.” “Low speed motor vehicle traffic” was placed in Quadrant 3 in the both 2009 and 2012 surveys but “low volume motor vehicle traffic” was placed in Quadrant 1 in the 2012 survey, suggesting a decrease in importance as perceived by respondents. Quadrant 3 attributes are targeted for corrective action because of their low performance ratings. However, due to their low importance, these attributes are much lower in priority than those in Quadrant 4. Located in Quadrant 3 were the attributes “shower facilities,” and “bicycle racks and lockers.” Both the attributes were Quadrant 3 attributes in both the 2009 and 2012 surveys as well. Quadrant 4 contained two attributes this year and they were “separate bicycle paths” and “signed bicycle routes.” Attributes in Quadrant 4 should be given the highest priority for increased investment in Delaware, as these are attributes with above average importance ratings but below average performance ratings. “Signed bicycle routes” was in Quadrant 3 in 2012, suggesting increased importance in 2014. It should be noted that due to the small sample size, the data from this customer group should be used with caution.
2.3.6 Pedestrians As in the prior surveys, respondents that indicated that they walked for some of their trips during the previous week were also asked a series of importance and performance questions. This section of the report will discuss the results of the pedestrian rating questions. Out of the full sample, 16% of the respondents indicated that they walked for some of the trips they made during the previous week (n=188). This percentage was lower than the 2012 survey (21%) but greater than all the surveys prior to 2012: 2009 (13%), 2006 (10%), 2005 (10%), 2003 (9%), 2002 (12%), 2001(9%), and 2000 (12%). Although 2014 pedestrian percentage was lower compared to 2012, a general trend over the past decade shows that over time, more Delaware residents are reporting that they walk for some of their trips. Similar to previous surveys, differences were noted by residential area type. Seventeen percent (17%) of city/town residents and 18% of suburban residents stated that they made walking trips compared to 8% of rural residents. Nearly similar percentage of white and non-white residents made walking trips (14% and 18%, respectively). Nineteen (19%) of New Castle County residents made walking trips compared to 13% of Sussex County residents and 9% of Kent County residents. About the same percentage of residents under 50 years old and over 50 years old made walking trips in the previous week (16% and 15%, respectively).
2.3.6.1 Attribute Importance Walkers were asked to rate the importance of 13 attributes as they relate to walking trips. The results are contained in the table below.

2014 Customer Satisfaction Surveys General Transportation Users Survey
Final Report, Page 2-28
Figure 2-32 Importance of Pedestrian Attributes Not at all important Extremely
Important
Attribute 1 2 3 4 5 6 7 Total Mean
Adequate street lighting 0% 0% 1% 4% 14% 13% 68% 100% 6.42
Sidewalks clear of debris 1% 1% 3% 7% 7% 17% 65% 100% 6.28 Marked crosswalks at intersections & other locations 3% 0% 1% 3% 17% 14% 63% 100% 6.24
Sidewalks to commercial areas 2% 1% 1% 3% 15% 21% 57% 100% 6.18
Sidewalks in my neighborhood 4% 1% 1% 3% 15% 22% 54% 100% 6.05 Pedestrian signals and push buttons 4% 3% 2% 5% 9% 19% 58% 100% 6.01 Sidewalks between neighborhoods 2% 1% 5% 10% 11% 18% 53% 100% 5.93 Sidewalks to & from transit stations & stops 4% 5% 4% 9% 12% 13% 54% 100% 5.75
Wide sidewalks 5% 1% 6% 6% 20% 15% 47% 100% 5.69 Pedestrian overpasses to cross highways 7% 1% 4% 10% 20% 11% 48% 100% 5.60
Low speed motor vehicle traffic 4% 3% 7% 7% 19% 22% 37% 100% 5.53
Low volume motor vehicle traffic 3% 7% 4% 13% 29% 18% 26% 100% 5.18
Street trees 19% 7% 12% 14% 16% 14% 19% 100% 4.23 For 2014, the highest rated attributes in terms of importance were “adequate street lighting” and “sidewalks clear of debris.” “Adequate street lighting” was found to be among the top attributes in importance in previous surveys. Again, like all previous survey years, the least important attribute was “street trees.” Figure 2-33 displays the mean importance rating assigned to each attribute by pedestrians.

2014 Customer Satisfaction Surveys General Transportation Users Survey
Final Report, Page 2-29
Figure 2-33 Mean Importance Ratings - Pedestrians
2.3.6.2 Attribute Performance The table below presents the results of the performance rating questions.
Figure 2-34 Performance of Pedestrian Attributes Poor Excellent
Attribute 1 2 3 4 5 6 7 Total Mean Marked crosswalks at intersections & other locations 6% 1% 13% 10% 22% 20% 30% 100% 5.18
Adequate street lighting 8% 5% 12% 8% 30% 21% 17% 100% 4.82 Pedestrian signals and push buttons 10% 3% 11% 9% 28% 17% 22% 100% 4.80
Sidewalks clear of debris 13% 3% 8% 14% 16% 23% 23% 100% 4.80
Sidewalks in my neighborhood 9% 9% 7% 17% 15% 21% 21% 100% 4.75 Sidewalks to & from transit stations & stops 10% 13% 5% 17% 16% 22% 18% 100% 4.69
Low speed motor vehicle traffic 9% 3% 8% 22% 33% 14% 12% 100% 4.61
Sidewalks between neighborhoods 17% 7% 7% 13% 22% 14% 18% 100% 4.40 Low volume motor vehicle traffic 10% 3% 10% 32% 25% 13% 8% 100% 4.33 Wide sidewalks 13% 5% 9% 29% 20% 11% 13% 100% 4.29 Sidewalks to commercial areas 15% 10% 10% 16% 18% 15% 16% 100% 4.28
Street trees 17% 13% 19% 11% 18% 15% 7% 100% 4.01 Pedestrian overpasses to cross highways 24% 15% 13% 18% 9% 11% 11% 100% 3.62
1
2
3
4
5
6
76.42 6.28 6.24 6.18 6.05 6.01 5.93
5.75 5.69 5.60 5.53 5.18
4.23
Extremely Important
Not at all Important

2014 Customer Satisfaction Surveys General Transportation Users Survey
Final Report, Page 2-30
Similar to bicyclists, pedestrian performance ratings were low when compared to the motorized travel modes. This was also found in the prior surveys. “Marked crosswalks at intersections and other locations,” and “adequate street lighting” were top performing attributes in the 2014 survey. “Marked crosswalks at intersections and other locations” was among the top performance attributes in prior surveys as well. “Adequate street lighting” showed significant improvement in performance in 2014 compared to 2012. It should also be noted that in the 2012 survey “pedestrian signals and push buttons” rose significantly in performance compared the 2009 survey and this perceived higher performance level was maintained according to the 2014 survey. On the other end of the scale, “pedestrian overpasses to cross highways” and “street trees” were clearly perceived to be low performing attributes. This was found in previous surveys as well. The figure below illustrates the mean performance rating for each attribute as rated by pedestrians.
Figure 2-35 Mean Performance Ratings - Pedestrians
2.3.6.3 Importance-Performance Analysis Similar to the other modes, importance-performance analysis was undertaken on the pedestrian rating data. The table below illustrates the satisfaction index and the importance and performance ratings for the thirteen attributes. To develop the satisfaction index, the mean rating for both importance and performance were computed for each attribute. The satisfaction index is calculated by computing the ratio between the mean performance rating to the mean importance rating for each attribute. This index demonstrates the balance between importance and performance in the minds of the users on an attribute. The higher the value of the index, the higher the level of customer satisfaction found on the attribute.
1
2
3
4
5
6
7
5.18 4.82 4.80 4.80 4.75 4.69 4.61
4.40 4.33 4.29 4.28 4.01
3.62
Excellent
Poor

2014 Customer Satisfaction Surveys General Transportation Users Survey
Final Report, Page 2-31
Figure 2-36 Importance-Performance Ratings and Satisfaction Indices - Pedestrians
Attribute 2014 Mean Importance Rating
2014 Mean Performance
Rating
Satisfaction Index
Street trees 4.23 4.01 94.80 Low volume motor vehicle traffic 5.18 4.33 83.59 Low speed motor vehicle traffic 5.53 4.61 83.36 Marked crosswalks at intersections & other locations 6.24 5.18 83.01 Sidewalks to & from transit stations & stops 5.75 4.69 81.57 Pedestrian signals and push buttons 6.01 4.80 79.87 Sidewalks in my neighborhood 6.05 4.75 78.51 Sidewalks clear of debris 6.28 4.80 76.43 Wide sidewalks 5.69 4.29 75.40 Adequate street lighting 6.42 4.82 75.08 Sidewalks between neighborhoods 5.93 4.40 74.20 Sidewalks to commercial areas 6.18 4.28 69.26 Pedestrian overpasses to cross highways 5.60 3.62 64.64 Customer satisfaction was not being attained on the attributes of “pedestrian overpasses to cross highways” and “sidewalks to commercial area.” “Pedestrian overpasses to cross highways” had the lowest rated satisfaction index in past surveys as well. Customer satisfaction was more closely met on the attributes of “street trees” and “low volume motor vehicle traffic.” “Street trees” had the highest rated satisfaction index in past surveys as well. Quadrant analysis was also performed on the importance-performance data to help prioritize actions or investments. The results of the quadrant analysis are displayed in Figure 2-37.

2014 Customer Satisfaction Surveys General Transportation Users Survey
Final Report, Page 2-32
Figure 2-37 Importance-Performance Quadrant Analysis - Pedestrians Pe
rform
ance
Rat
ing
on A
ttrib
ute
Importance Rating of Attribute Quadrants Below Average Above Average Above Average (2)
Maintenance: Low Priority Sidewalks to/from Transit Stops Low Speed Motor Vehicle Traffic
(1) Maintenance: High Priority Sidewalks Clear of Debris
Marked Crosswalks Sidewalks in my Neighborhood
Pedestrian Signals & Push Buttons Adequate Street Lighting
Below Average
(3) Corrective: Low Priority
Street Trees Low Volume Motor Vehicle Traffic
Wide Sidewalks Pedestrian Overpasses
(4) Corrective: High Priority
Sidewalks to Commercial Areas Sidewalks Between Neighborhoods
Items in Quadrant 1 contain attributes that are considered both high in importance and performance. Customer satisfaction is currently being attained on these attributes. Continuing to deliver on these attributes should be a high priority. In this year’s survey five out of the thirteen attributes fell into Quadrant 1. These attributes were “sidewalks clear of debris,” “marked crosswalks,” “sidewalks in my neighborhood,” “pedestrian signals and push buttons,” and “adequate street lighting. “ In the 2012 survey, the first four attributes were also in Quadrant 1. “Adequate street lighting” was in Quadrant 4 in 2012, suggesting improved performance in 2014. Items in Quadrant 2 are those that respondents rated as having importance ratings below the overall average but performance ratings are above the overall average. Accordingly, these attributes would be the lowest priority for future investments. In 2012, no attributes were placed in Quadrant 2. However, the 2014 survey showed “sidewalks to and from transit stops and stations,” and “low speed motor vehicle traffic” in this quadrant. “Sidewalks to and from transit stops” was in Quadrant 1 in 2012, suggesting reduced important in 2014. However, in 2009 this attribute belonged to Quadrant 2 only. In 2012, attribute “low speed motor vehicle traffic” belonged to Quadrant 3, suggesting an improved perceived performance in 2014. Attributes in Quadrant 3 require corrective action because of their relatively low performance ratings. However, since these attributes are not as important to the walking public, these attributes should be the lowest in priority for any type of corrective action. Attributes included in Quadrant 3 in 2014 were “street trees,” “low volume motor vehicle traffic,” “wide sidewalks,” and “pedestrian overpass.” In the 2012 survey, the first three attributes also belonged to the same quadrant. “Pedestrian overpass” was placed in Quadrant 4 in 2012, suggesting reduced perceived importance in 2014. Attributes in Quadrant 4 should be given the highest priority for increased investment in Delaware, as these are attributes with above average importance ratings but below average performance ratings. Quadrant 4 contained two attributes this survey year: “sidewalks to commercial areas,” and “sidewalks between neighborhoods.” Both these attributes were placed in this quadrant in the 2012 survey as well.

2014 Customer Satisfaction Surveys General Transportation Users Survey
Final Report, Page 2-33
2.4 Overall Satisfaction Ratings This section of the report discusses the results of the summary modal satisfaction questions posed to each respondent at the end of each of the modal importance and performance rating questions.
2.4.1 Summary of Modal Satisfaction Question Results As was done in the previous surveys, following the attribute rating questions, each respondent was asked to verbally rate the overall performance of the current system in meeting their transportation needs for each mode that the respondent had indicated that he/she had used. The respondent was asked to choose a response from “very well”, “somewhat well”, “not too well”, or “not at all” for each question. The results for each mode and for the system as a whole are outlined in the following figure.
Figure 2-38 Results of the Summary Modal Satisfaction Questions (2014 data in Red)
Question Very Well Somewhat
Well Not Too
Well Not At
All DK (vol)
And overall, how well does the state’s system of roads and hwys meet your needs?
35% 41% (2012) 35% (2009) 28% (2006) 32% (2005) 28% (2004) 36% (2003) 31% (2002) 31% (2001) 27% (2000) 26% (1999) 27% (1998) 33% (1997)
55% 49% (2012) 56% (2009) 56% (2006) 53% (2005) 57% (2004) 55% (2003) 59% (2002) 56% (2001) 54% (2000) 57% (1999) 62% (1998) 56% (1997)
7% 7% (2012) 7% (2009)
10% (2006) 9% (2005)
10% (2004) 7% (2003) 8% (2002) 8% (2001)
11% (2000) 10% (1999) 9% (1998) 9% (1997)
2% 2% (2012) 2% (2009) 4% (2006) 4% (2005) 3% (2004) 2% (2003) 1% (2002) 2% (2001) 4% (2000) 4% (1999) 1% (1998) 1% (1997)
1% 1% (2012) 0% (2009) 2% (2006) 2% (2005) 2% (2004) 0% (2003) 1% (2002) 3% (2001) 4% (2000) 3% (1999) 1% (1998) 1% (1997)
And overall, how well does the state’s transit system meet your needs?
29% 19% (2012) 24% (2009) 26% (2006) 57% (2005) 27% (2004) 32% (2003) 29% (2002) 40% (2001) 38% (2000) 40% (1999) 15% (1998) 33% (1997)
47% 44% (2012) 54% (2009) 31% (2006) 21% (2005) 45% (2004) 38% (2003) 48% (2002) 36% (2001) 38% (2000) 24% (1999) 54% (1998) 49% (1997)
18% 22% (2012) 15% (2009) 22% (2006) 17% (2005) 17% (2004) 7% (2003)
13% (2002) 4% (2001) 8% (2000) 6% (1999)
17% (1998) 8% (1997)
6% 15% (2012) 2% (2009) 4% (2006) 3% (2005) 4% (2004)
10% (2003) 6% (2002) 8% (2001) 9% (2000)
16% (1999) 6% (1998) 2% (1997)
0% 0% (2012) 5% (2009)
17% (2006) 2% (2005) 7% (2004)
13% (2003) 4% (2002)
12% (2001) 7% (2000)
15% (1999) 8% (1998) 8% (1997)
And overall, how well does the state’s transportation system meet your needs for bicycle trips?
41% 25% (2012) 17% (2009) 21% (2006) 28% (2005) 10% (2004) 15% (2003) 7% (2002)
33% (2001) 16% (2000) 23% (1999) 40% (1998) 20% (1997)
34% 56% (2012) 54% (2009) 41% (2006) 32% (2005) 36% (2004) 51% (2003) 62% (2002) 21% (2001) 48% (2000) 21% (1999) 12% (1998) 27% (1997)
22% 17% (2012) 16% (2009) 12% (2006) 23% (2005) 28% (2004) 19% (2003) 19% (2002) 25% (2001) 10% (2000) 23% (1999) 21% (1998) 22% (1997)
3% 2% (2012) 9% (2009)
16% (2006) 12% (2005) 23% (2004) 13% (2003) 12% (2002) 4% (2001)
21% (2000) 2% (1999)
11% (1998) 28% (1997)
0% 0% (2012) 3% (2009)
10% (2006) 5% (2005) 3% (2004) 2% (2003) 0% (2002)
17% (2001) 5% (2000)
32% (1999) 16% (1998) 3% (1997)

2014 Customer Satisfaction Surveys General Transportation Users Survey
Final Report, Page 2-34
Question Very Well Somewhat Well
Not Too Well
Not At All
DK (vol)
And overall, how well does the state’s transportation system meet your needs for walking trips?
16% 24% (2012) 23% (2009) 24% (2006) 27% (2005) 13% (2004) 24% (2003) 31% (2002) 21% (2001) 24% (2000) 18% (1999) 16% (1998) 14% (1997)
57% 53% (2012) 46% (2009) 49% (2006) 46% (2005) 50% (2004) 53% (2003) 45% (2002) 48% (2001) 40% (2000) 55% (1999) 44% (1998) 61% (1997)
19% 19% (2012) 25% (2009) 15% (2006) 14% (2005) 22% (2004) 10% (2003) 16% (2002) 15% (2001) 15% (2000) 16% (1999) 29% (1998) 13% (1997)
8% 4% (2012) 6% (2009)
12% (2006) 9% (2005) 9% (2004) 8% (2003) 4% (2002) 9% (2001)
10% (2000) 7% (1999) 6% (1998) 9% (1997)
0% 0% (2012) 0% (2009) 0% (2006) 4% (2005) 6% (2004) 5% (2003) 4% (2002) 7% (2001)
11% (2000) 4% (1999) 5% (1998) 3% (1997)
And as a whole, how well does Delaware’s transportation system meet your travel needs?
27% 31% (2012) 29% (2009) 27% (2006) 25% (2005) 22% (2004) 25% (2003) 22% (2002) 26% (2001) 22% (2000) 28% (1999) 20% (1998) 30% (1997)
54% 45% (2012) 50% (2009) 45% (2006) 44% (2005) 51% (2004) 47% (2003) 55% (2002) 52% (2001) 49% (2000) 51% (1999) 59% (1998) 50% (1997)
10% 13% (2012) 10% (2009) 13% (2006) 11% (2005) 13% (2004) 8% (2003)
10% (2002) 9% (2001)
12% (2000) 9% (1999)
11% (1998) 11% (1997)
7% 9% (2012) 7% (2009)
10% (2006) 12% (2005) 7% (2004) 9% (2003) 5% (2002) 7% (2001)
10% (2000) 6% (1999) 4% (1998) 5% (1997)
2% 2% (2012) 4% (2009) 5% (2006) 8% (2005) 7% (2004)
11% (2003) 8% (2002) 6% (2001) 7% (2000) 6% (1999) 6% (1998) 4% (1997)
As was found in the prior surveys, the respondents in the year 2014 survey gave the highest ratings to the road and highway system, with 90% responding with “very well” or “somewhat well” responses. This share was exactly the same as the previous survey (2012) and in general slightly higher than, or close to, all the surveys prior to 2012. The share of respondents that rated the transit system as meeting their needs “very well” or “somewhat well” in 2014 (76%) was higher than the 2012 survey share (63%) but was similar to the 2009 survey share (78%). The share of respondents that rated their bicycle trips as meeting their needs “very well” or “somewhat well” in 2014 was slightly lower than the 2012 survey: 75% of the respondents in 2014 as compared to 81% in 2012 survey. However, compared to all the surveys prior to 2012, the 2014 share was still higher, suggesting that the satisfaction improvement achieved in 2012 survey has largely been maintained. Slightly lower than the 2012 survey results, 73% of the respondents in 2014 stated that their walking needs were satisfied “very well” or “somewhat well” compared to the 77% in the 2012 survey results. As was done in the previous years, all users were asked to rate Delaware’s transportation system as a whole, and the results showed that about four of every five customers feel that the system is meeting their travel needs well. Eighty-one percent (81%) stated that the system is either meeting their needs “very well” or “somewhat well” in 2014. This was slightly higher than the 76% of 2012 respondents who answered that the system was meeting their needs well. The results of this series of questions are displayed in the next chart for Delaware for each mode and overall.

2014 Customer Satisfaction Surveys General Transportation Users Survey
Final Report, Page 2-35
Figure 2-39 Results of Transportation System Satisfaction Questions
Figure 2-40 displays below, by county, the results for all thirteen survey years – 2014, 2012, 2009, 2006, 2005, 2004, 2003, 2002, 2001, 2000, 1999, 1998 and 1997. In 2014, the results showed similar satisfaction in roads and highways by users of New Castle County and Kent County compared to 2012. Significant increase in satisfaction was noticed in transit users in Kent County and Sussex County compared to 2012. Some movement in the satisfaction rating was observed for the bicycle and pedestrian modes; however, this movement cannot be deemed to be reliable due to small sample sizes, especially when the data are broken down on a county basis for these modes. In terms of the overall system satisfaction, New Castle County has shown improvement in 2014 (86% favorable ratings compared to 78% in 2012). For Kent County and Sussex County, the favorable satisfaction ratings in 2014 were about the same as that in 2012.
0%
10%
20%
30%
40%
50%
60%
70%
80%
90%
100%
Auto Transit Bicycle Pedestrian Overall
Very Well Somewhat Well Not too Well Not at all DK (Vol)

2014 Customer Satisfaction Surveys General Transportation Users Survey
Final Report, Page 2-36
Figure 2-40 Overall Transportation System Satisfaction by County – (2014 Data in Red)
Mode New Castle Kent County Sussex County Very or
Somewhat Well
Not Too or Not at All
Well
Very or Somewhat
Well
Not Too or Not at All
Well
Very or Somewhat
Well
Not Too or Not at All Well
Roads & hwys
90% 89% (2012) 91% (2009) 85% (2006) 86% (2005) 95% (2004) 94% (2003) 91% (2002) 89% (2001) 83% (2000) 85% (1999) 89% (1998) 88% (1997)
10% 11% (2012) 9% (2009)
15% (2006) 14% (2005) 5% (2004) 6% (2003) 9% (2002)
11% (2001) 17% (2000) 15% (1999) 11% (1998) 12% (1997)
94% 94% (2012) 91% (2009) 91% (2006) 92% (2005) 95% (2004) 90% (2003) 95% (2002) 88% (2001) 89% (2000) 86% (1999) 93% (1998) 95% (1997)
6% 6% (2012)
10% (2009) 9% (2006) 8% (2005) 5% (2004)
10% (2003) 5% (2002)
12% (2001) 11% (2000) 14% (1999) 7% (1998) 5% (1997)
90% 94% (2012) 94% (2009) 87% (2006) 87% (2005) 88% (2004) 86% (2003) 89% (2002) 90% (2001) 85% (2000) 89% (1999) 85% (1998) 87% (1997)
10% 6% (2012) 6% (2009)
13% (2006) 13% (2005) 12% (2004) 14% (2003) 11% (2002) 10% (2001) 15% (2000) 11% (1999) 15% (1998) 13% (1997)
Transit
73% 70% (2012) 77% (2009) 68% (2006) 80% (2005) 80% (2004) 80% (2003) 80% (2002) 89% (2001) 85% (2000) 70% (1999) 78% (1998) 93% (1997)
27% 30% (2012) 18% (2009) 32% (2006) 20% (2005) 20% (2004) 12% (2003) 20% (2002) 11% (2001) 15% (2000) 30% (1999) 21% (1998) 7% (1997)
92% 80% (2012) 73% (2009) 75% (2006) 79% (2005) 82% (2004) 77% (2003) 88% (2002) 73% (2001) 77% (2000) 100%(1999) 83% (1998) 75% (1997)
8% 20% (2012) 20% (2009) 25% (2006) 21% (2005) 18% (2004) 23% (2003) 12% (2002) 27% (2001) 23% (2000) 0% (1999) 16% (1998) 5% (1997)
100% 80% (2012) 100% (2009) 69% (2006) 80% (2005) 43% (2004) 50% (2003) 67% (2002) 65% (2001) 50% (2000) 71% (1999) 46% (1998) 67% (1997)
0% 20% (2012) 0% (2009)
31% (2006) 20% (2005) 57% (2004) 50% (2003) 33% (2002) 35% (2001) 50% (2000) 29% (1999) 54% (1998) 33% (1997)
Bicycle
73% 86% (2012) 88% (2009) 100% (2006) 63% (2005) 40% (2004) 67% (2003) 75% (2002) 75% (2001) 69% (2000) 50% (1999) 66% (1998) 43% (1997)
27% 14% (2012) 13% (2009) 0% (2006)
37% (2005) 60% (2004) 33% (2003) 25% (2002) 25% (2001) 31% (2000) 50% (1999) 33% (1998) 57% (1997)
100% 50% (2012) 73% (2009) 70% (2006) 40% (2005) 67% (2004) 82% (2003) 50% (2002) 60% (2001) 67% (2000) 80% (1999) 50% (1998) 44% (1997)
0% 50% (2012) 17% (2009) 30% (2006) 60% (2005) 33% (2004) 18% (2003) 50% (2002) 40% (2001) 33% (2000) 20% (1999) 50% (1998) 56% (1997)
62% 63% (2012) 47% (2009) 40% (2006) 78% (2005) 52% (2004) 50% (2003) 25% (2002) 50% (2001) 67% (2000) 73% (1999) 58% (1998) 63% (1997)
38% 37% (2012) 54% (2009) 60% (2006) 22% (2005) 48% (2004) 50% (2003) 75% (2002) 50% (2001) 33% (2000) 27% (1999) 42% (1998) 37% (1997)
Pedestrian
72% 81% (2012) 71% (2009) 78% (2006) 80% (2005) 67% (2004) 80% (2003) 80% (2002) 78% (2001) 78% (2000) 77% (1999) 62% (1998) 82% (1997)
28% 19% (2012) 29% (2009) 22% (2006) 20% (2005) 33% (2004) 20% (2003) 20% (2002) 22% (2001) 22% (2000) 23% (1999) 38% (1998) 18% (1997)
75% 62% (2012) 69% (2009) 67% (2006) 61% (2005) 78% (2004) 91% (2003) 80% (2002) 77% (2001) 61% (2000) 76% (1999) 63% (1998) 56% (1997)
25% 38% (2012) 32% (2009) 33% (2006) 39% (2005) 22% (2004) 9% (2003)
20% (2002) 23% (2001) 39% (2000) 24% (1999) 37% (1998) 44% (1997)
74% 59% (2012) 60% (2009) 55% (2006) 73% (2005) 59% (2004) 72% (2003) 72% (2002) 45% (2001) 63% (2000) 77% (1999) 66% (1998) 52% (1997)
26% 41% (2012) 40% (2009) 45% (2006) 27% (2005) 41% (2004) 28% (2003) 28% (2002) 55% (2001) 38% (2000) 23% (1999) 34% (1998) 48% (1997)

2014 Customer Satisfaction Surveys General Transportation Users Survey
Final Report, Page 2-37
Mode New Castle Kent County Sussex County Very or
Somewhat Well
Not Too or Not at All
Well
Very or Somewhat
Well
Not Too or Not at All
Well
Very or Somewhat
Well
Not Too or Not at All Well
Overall System
86% 78% (2012) 83% (2009) 76% (2006) 76% (2005) 80% (2004) 81% (2003) 84% (2002) 83% (2001) 77% (2000) 86% (1999) 84% (1998) 84% (1997)
14% 22% (2012) 16% (2009) 24% (2006) 24% (2005) 20% (2004) 19% (2003) 16% (2002) 17% (2001) 23% (2000) 14% (1999) 16% (1998) 16% (1997)
81% 81% (2012) 85% (2009) 81% (2006) 74% (2005) 79% (2004) 80% (2003) 82% (2002) 81% (2001) 79% (2000) 80% (1999) 83% (1998) 84% (1997)
19% 19% (2012) 16% (2009) 19% (2006) 26% (2005) 21% (2004) 20% (2003) 18% (2002) 19% (2001) 21% (2000) 20% (1999) 17% (1998) 16% (1997)
79% 80% (2012) 79% (2009) 76% (2006) 74% (2005) 74% (2004) 75% (2003) 80% (2002) 82% (2001) 73% (2000) 83% (1999) 79% (1998) 80% (1997)
21% 20% (2012) 21% (2009) 24% (2006) 26% (2005) 26% (2004) 25% (2003) 20% (2002) 18% (2001) 27% (2000) 17% (1999) 21% (1998) 20% (1997)
2.4.2 Perceptions of Mobility As a follow-up, respondents were asked to assess whether or not they believed they had many different travel modes to choose from or alternatively, if they thought they had few options to choose from. As was done in the previous survey years, in the 2012 survey, the following question was posed to all respondents:
“And would you say that you have many different travel modes to choose from such as transit, biking and walking to meet your travel needs or would you say you have very few options to choose from?”
If respondents indicated they had few options, they were asked, in an open-ended question, what modes they would like access to. This year 42% of respondents said they have many options to choose from, while 56% stated that they have few options and 2% could not say. The share of respondents stating that they had many options in 2014 was the same as the 2012 and 2009 survey results. Like the previous surveys differences were noted by county in 2014, as 49% of New Castle County residents stated that they had many options to choose from, compared to 38% of Kent County residents and 28% of Sussex County residents. Differences were noted by residential area type as well. Fifty-two percent (52%) of city/town residents and 43% of suburban residents stated that they that they had many options to choose from, compared to 28% of rural residents. When those that responded they had few options to choose from were asked what modes they would like to have access to, the majority indicated that they would like access to transit, 24% for buses and 16% for trains. Five percent (5%) indicated improved access to public transportation without specifying the type. Nine percent (9%) indicated improved access to bicycle paths or bicycle facilities, 3% would like access to pedestrian facilities, 8% indicated improved personal auto needs, and 23% could not specify or had some other comment.
2.5 Community Concerns In the 2009 survey, a question was added asking the respondents how well the Delaware Department of Transportation takes community concerns into consideration when planning and constructing transportation projects. The results are provided below in Figure 2-41.

2014 Customer Satisfaction Surveys General Transportation Users Survey
Final Report, Page 2-38
Figure 2- 41 Community Concerns Considered in Transportation Projects - (2014 Data in Red)
Question Excellent Good Only Fair Poor DK (vol) How well does the Delaware Department of Transportation take community concerns into consideration when developing and constructing transportation projects?
9% 9% (2012) 7% (2009)
43% 40% (2012) 41% (2009)
33% 35% (2012) 28% (2009)
11% 11% (2012) 10% (2009)
4% 5% (2012) 14% (2009)
More than half of the respondents (52%) described the Delaware Department of Transportation’s consideration of community concerns as either “excellent” or “good”, which was slightly higher than the 2012 and 2009 survey responses (49% and 48% respectively). Forty-four percent (44%) rated DelDOT as “only fair” or “poor” in considering community concerns and the remaining could not provide the response. In the 2014 survey, 59% of Kent County residents described DelDOT’s consideration of community concerns as “excellent” or “good,” compared to 54% of New Castle County and 52% of Sussex County residents.
2.6 Ability to Walk in Neighborhoods In the 2009 survey, a question was added asking how easy it is for the respondent to walk in the community where he or she lives. The results are shown below in Figure 42.
Figure 2- 42 Ease of Walking Around the Community You Live in - (2014 Data in Red)
Slightly more than half of the respondents (56%) indicated that it was “very easy” to walk in the community they live and nearly one-quarter (28%) stated it was “somewhat easy” with the remainder indicating “not very easy”. These shares were very similar to the 2012 survey shares. The results for this question were relatively similar across the three counties. The highest results were found from New Castle County residents where 57% of respondents said “very easy” followed closely by Sussex County at 56% and Kent County at 54%.
2.7 Improvement Action Ratings As was done in the prior twelve surveys, fifteen improvement actions, representing a sub-set of priority actions suggested in the long range plans of the Department or the Metropolitan Planning Organizations (MPOs) in the state, were evaluated by respondents in terms of their perceived effectiveness to improve the transportation system in the state. This section of the report provides the results of this series of questions posed to all respondents in the General Transportation User survey.
2.7.1 Perceived Effectiveness Fifteen different actions were presented to respondents in the survey. For each action, respondents were asked to identify how effective it would be in improving the transportation
Question Very Easy Somewhat Easy
Not Very Easy
DK (vol)
And how easy would you say it is to walk around the community that you live in – would you say it is very easy, somewhat easy or not very easy at all?
56% 55% (2012) 61% (2009)
28% 28% (2012) 24% (2009)
15% 16% (2012) 15% (2009)
1% 1% (2012) 1% (2009)

2014 Customer Satisfaction Surveys General Transportation Users Survey
Final Report, Page 2-39
system with response categories ranging from “very effective”, “somewhat effective”, “not very effective”, or “not at all effective”. The table below depicts the response.
Figure 2-43 Action Evaluation – How Effective Would <the Action> Be In Improving the Transportation System?
How Effective? Action Very Some Not
too Not at
all DK
Coordinating and better timing traffic signals 63% 28% 5% 3% 1%
Creating service patrols to quickly respond to accidents, stalled vehicles, etc. 58% 33% 5% 3% 1%
Designing communities that make it easier for people to walk and bike to stores, schools, and other public facilities and to other neighborhoods 57% 28% 7% 7% 1%
Improving and expanding bus services 52% 31% 8% 6% 2%
Constructing more sidewalks 51% 27% 12% 9% 1%
Implementing new technologies to make highways more efficient 47% 38% 9% 4% 2%
Expanding passenger railroad services 46% 29% 13% 10% 2%
Providing new information systems to make it easier to take transit 45% 37% 10% 7% 1%
Widening existing highways 42% 37% 11% 9% 1%
Expanding bicycle networks (bike trails, lanes, routes) 40% 35% 14% 9% 2%
Providing special lanes on highways for carpools and buses 38% 34% 17% 9% 2%
Building more connecting roads between neighborhoods and commercial areas 38% 35% 17% 9% 1%
Developing more park-and-rides 34% 39% 15% 10% 2%
Providing new information systems to make it easier to carpool 32% 41% 16% 9% 2%
Building more highways 29% 34% 22% 13% 2%
The above table orders the fifteen actions asked about from highest percentage to lowest percentage for the response of “very effective”. As can be seen in the table, the top four actions perceived by Delaware residents to be the most effective actions to improve the transportation system were:
• Coordinating and better timing traffic signals; • Creating service patrols to quickly respond to accidents, stalled vehicles, etc.; • Designing communities that make it easier for people to walk and bike to stores,
schools and other public facilities and to other neighborhoods; and • Improving and expanding bus services.
The results from this year's survey were consistent with past results as the four actions above were also found to be among the top actions in all prior surveys. Two among the top four actions relate to better and improved management of the existing highway system to maximize capacity and operations (traffic signal coordination and emergency service patrols). The public seems to be more supportive of efforts to better manage existing highway transportation infrastructure in the state as opposed to building new infrastructure.

2014 Customer Satisfaction Surveys General Transportation Users Survey
Final Report, Page 2-40
The application of coordinated signal timing, emergency service patrols, and Intelligent Transportation Systems are all related to strategies outlined in either Delaware’s Statewide Long Range Transportation Plan or the transportation plans of the MPOs in the state, including Sussex County’s Transportation Plan to support the improved management of the existing transportation system. The results from the 2014 survey and the prior surveys clearly show that state residents feel these actions will be effective enhancements to optimize the performance and efficiency of the existing transportation system. Also important was the effectiveness rating given to improved community design. The transportation plans for Delaware argue that many of the state’s transportation problems can be traced to poor coordination between land use and transportation planning. As such, suggested actions are presented in the transportation plans to better link transportation and land use, such as “community transportation design,” which calls for improvements in both community design and transportation facility design to better support travel by alternative modes. The 2014 survey results showed that 58% of the public in Delaware stated that designing communities to make it easier to walk and bike would be “very” effective and another 29% stated that it would be “somewhat” effective. The public clearly supports statewide efforts to link transportation and land use, and to improve the design of communities to better support other travel modes. Transit action “Improving and expanding bus service” was one of the top four effective actions. Fifty-four percent (54%) of respondents to the survey thought this action would be “very” effective. This action was among the highest rated in past surveys as well. Actions perceived to be less effective by Delaware residents include: • Building more highways; and, • Providing new information systems that make it easier to carpool. Both these actions were the bottom two actions in terms of effectiveness in the 2012 survey as well. Building more highways was perceived to be less effective by respondents in all prior surveys.

2014 Customer Satisfaction Surveys General Transportation Users Survey
Final Report, Page 2-41
2.8 Demographics This section of the report provides the responses to the demographic questions contained in the survey. The demographic questions included: residential tenure, motor vehicle availability per household, respondent age, number of persons in household over age 16, residential area type, ethnicity, household income and respondent gender. All tables below show response by county, and for the state as a whole.
2.8.1 Residential Tenure As an opening question, respondents were asked how long they had lived in Delaware. The table below outlines the response.
Figure 2-44 Residential Tenure
Response Statewide Kent County New Castle County
Sussex County
Less than a year 3% 4% 3% 1% 1 to 2 years 3% 2% 4% 1% 3-5 years 6% 5% 6% 9% 6-10 years 11% 12% 11% 10% 11-20 years 15% 15% 13% 18% 21-30 years 11% 10% 11% 11% More than 30 years 16% 15% 18% 11% All my life 35% 37% 34% 39% Dk (vol) 0% 0% 0% 0%
2.8.2 Motor Vehicle Availability Respondents were asked to indicate the number of motor vehicles available to their household. The table below outlines the response.
Figure 2-45 Motor Vehicle Availability
Number of Vehicles Statewide Kent County New Castle County
Sussex County
None 5% 5% 6% 2% One 24% 22% 25% 21% Two 41% 39% 41% 43% Three 17% 20% 15% 20% Four or more 13% 14% 13% 14% Dk (vol) 0% 0% 0% 0%

2014 Customer Satisfaction Surveys General Transportation Users Survey
Final Report, Page 2-42
2.8.3 Respondent Age At the end of the survey, the more sensitive demographic questions were asked. Respondents were asked to indicate an age category. The table below shows the results.
Figure 2-46 Respondent Age
Age Category Statewide Kent County New Castle County
Sussex County
16-29 years 24% 25% 25% 18% 30-49 years 32% 33% 35% 27% 50-64 years 25% 23% 24% 28% 65 or over 19% 19% 16% 27% REF (vol) 0% 0% 0% 0%
2.8.4 Residential Area Type Respondents were asked if they lived in a city/town, a suburban area or a rural area. The response is in the following table.
Figure 2-47 Residential Area Type
Area Type Statewide Kent County New Castle County
Sussex County
City/town 29% 36% 28% 28% Suburban 48% 31% 64% 21% Rural 23% 33% 8% 51% DK (vol) 0% 0% 0% 0%
2.8.5 Ethnicity The survey also included a question on ethnicity. The following depicts the response to this question.
Figure 2-48 Ethnicity
Ethnic group Statewide Kent County New Castle County
Sussex County
White, Caucasian 68% 69% 64% 78% Black, African American 21% 24% 23% 12% Latino, Hispanic, Mexican American
3% 2% 3% 5%
Asian, Pacific Islander 3% 2% 4% 1% Native American, American Indian
2% 1% 2% 1%
Other 3% 2% 4% 3% REF/DK (vol) 0% 0% 0% 0%

2014 Customer Satisfaction Surveys General Transportation Users Survey
Final Report, Page 2-43
2.8.6 Number of Persons in Household 16 years or Older The survey also asked for the number of persons in the household that were 16 years of age or older. The response is depicted below.
Figure 2-49 Number of Persons Aged 16 or Older
Number of persons
Statewide Kent County New Castle County
Sussex County
One 17% 14% 18% 16% Two 47% 49% 45% 53% Three 20% 24% 19% 18% Four 11% 9% 12% 11% Five 4% 2% 5% 2% Six or more 1% 2% 1% 0% DK/not sure (vol) 0% 0% 0% 0%
2.8.7 Household Income The survey then asked respondents to indicate a category that contained their household income. The following table provides the data.
Figure 2-50 Household Income
Income Category Statewide Kent County New Castle County
Sussex County
Less than $15,000 5% 7% 4% 9% $15 - $24,999 9% 10% 8% 9% $25 – $34,999 11% 10% 10% 12% $35 - $49,999 14% 16% 13% 14% $50 - $74,999 18% 18% 19% 17% $75 - $99,999 19% 23% 18% 17% $100 - $149,999 15% 12% 16% 13% $150,000 & over 10% 4% 12% 9% REF/DK (vol) 0% 0% 0% 0%
2.8.8 Respondent Gender Along with the above demographic data, respondent gender was also obtained. The data are below.
Figure 2-51 Respondent Gender
Gender Statewide Kent County New Castle County
Sussex County
Male 48% 48% 48% 48% Female 52% 52% 52% 52%

2014 Customer Satisfaction Surveys Transit-Served Market Area Survey
Final Report, Page 3-1
Chapter 3
TRANSIT-SERVED MARKET AREA SURVEY
3.1 Survey Objectives Similar to the General Transportation User Survey, the main objective of this survey was to provide DelDOT with data to assess the level of customer satisfaction with the current transportation system. However, instead of a random statewide survey of residents, the 2014 Transit-Served Market Area Survey, like the previous surveys, collected data on customer satisfaction and transit service awareness from Delawareans residing in geographic markets that are served by transit. This survey was first conducted in 1997 and has been repeated on a nearly annual basis since then. Information from this survey can be compared to previous surveys, and allows the Department to monitor customer satisfaction over time. Information from this survey, as well as the previous surveys, serves as a set of inputs into the Department’s progress monitoring program to assess performance against the goals and objectives of the Statewide Long-Range Transportation Plan. Importantly, the transit service awareness data can help in the development of transit service marketing programs. As in the previous survey years, the specific information objectives for this year’s survey were: For users of each transportation mode, to ascertain the level of importance of various
attributes. For users of each transportation mode, to ascertain the level of performance perceived for
each of the attributes. For users of each transportation mode, to identify the level of satisfaction attained for each
modal attribute and for the mode overall. To identify Delawareans’ awareness of and familiarity with transit services. To identify Delawareans’ use and satisfaction regarding different transit service
communication methods. In addition to the above beginning in 2001 questions were added to the survey to explore potential barriers to transit use: why those residing in transit-served areas of the state do not use transit.
3.2 Summary of Research Methodology AECOM developed the questionnaire for the Transit Served Market Area survey in consultation with DelDOT’s Division of Planning in 1997. Customer Satisfaction Surveys have been completed on nearly an annual basis since 1997. The same questionnaire used in the 2012 survey was used this year to accommodate interviewing by land line telephone as well as cell phone and Internet interviewing. A separately bound Technical Appendix has been prepared and contains frequency and cross-tabulated tables showing the distribution of response for each question. Like the previous surveys, a market research firm administered the interviews. For this 2014 survey, Abt SRBI conducted the interviews. An SPSS (a statistical software package) computer file was developed to process the survey information by AECOM. The SPSS system enabled AECOM research staff to integrate the survey data so it could be presented in aggregate form. Similar to the 2012 survey, online (Internet) interviews were conducted in addition to land line telephone interviews to yield more representative results. As was done in the previous survey years, the 2014 survey involved interviews with a disproportionate random probability sample of Delaware residents aged 16 years and older, residing within transit-served areas of Delaware. The transit-served interviews were conducted

2014 Customer Satisfaction Surveys Transit-Served Market Area Survey
Final Report, Page 3-2
beginning in April 2014 and concluding in May of 2014. The sample size for the 2014 survey was similar to previous years with a total of 89 interviews completed. Transit-served areas in Delaware were identified by using geo-location indicating the latitude and longitude of DelDOT bus routes and include residents residing within one-quarter mile radius of a transit route, screening out individuals that had used transit (either bus or rail) in the previous month. Households that live within a quarter mile of DART bus routes were identified using Address Based Sample (a file which the United States Postal Service licenses to list vendors) and sampled on the basis of Census blocks, the smallest unit which the Census Bureau defines.
Four thousand two hundred (4,200) households were selected, equally split across Delaware’s three counties. Each household was mailed a black and white postcard with the Delaware logo, with the following note:
The State of Delaware would like you to participate in a survey on life in Delaware. Your household was selected to provide your opinions, and your participation is important! Please have someone in your household (an adult, or age 16+) go online (www.opinionport.com/de4) and type in the code from the other side of this card. Everything will be held in strictest confidence.
(If you don’t have Internet access, please call 866-898-5274 to arrange to be interviewed on the telephone.)
The postcards were mailed on April 16, 2014. Three hundred and sixty one postcards were returned to Abt SRBI as undeliverable. Through the online link or by calling the toll free number, 89 residents participated. The online survey was closed on May 12, 2014, when households were no longer responding.
Respondents were weighted according to the demographic profiles of the households in the Census blocks; at the same time weighting corrected for the disproportionate, nearly equal sampling of all three counties. Statewide, the margin of error for a sample of 89 is approximately ± 10% at the 95% confidence level.
3.3 Reasons for Not Using Public Transit on a Frequent Basis In 2001, twenty questions were added to the Transit-Served Market Area Survey questionnaire. These questions pertain to the reasons why respondents do not use public transit (bus or rail) services more frequently. For each question, every respondent was asked to give a response of yes or no, depending on whether the statement was a reason why he or she did not take public transit more frequently. This section details the responses to these questions for 2014.

2014 Customer Satisfaction Surveys Transit-Served Market Area Survey
Final Report, Page 3-3
Figure 3-1 Reasons for Not Using Public Transit on a Frequent Basis
As can be seen in Figure 3-1, the primary reason why respondents in the transit-served areas of Delaware do not use transit is because “public transit takes longer than driving.” Almost three out of every five respondents (59%) indicated this as a reason why they do not use transit more frequently. The second most frequent reason respondents indicated that they do not use transit is that “public transit is inconvenient or hard to use if you need to run errands during your trip” (56%). The less frequent reasons for not taking public transit include: Public transit is crowded and I can’t get a seat (4%), Public transit is dirty (10%), and I don’t like the people who use public transit (11%). These findings are similar to prior survey results.
3.4 Relative Importance & Performance of Modal Attributes This section provides an in-depth examination of the importance and performance of various attributes by mode. As was done in the previous survey years, respondents were asked to rate the importance of each attribute on a 7-point scale (a rating of “1” meant “not at all important,” while a rating of “7” meant “extremely important”) and the current performance of the attribute on a 7-point scale (a rating of “1” meant “poor,” while a “7” meant “excellent”). Percentage distributions are presented first and then the average scores are presented for each attribute, and are ordered from most important to least important, or highest performance to lowest. Of note, respondents were only asked to rate the attributes for each mode they used in the previous week. Importantly, transit service ratings are not reported in this chapter, as transit users were screened out from this survey effort. As was done in previous survey years, DelDOT was interested in obtaining information from potential transit users. Transit rider information can be found in in Chapter 2 from the results of the General Transportation User survey. For readers interested in
0.010.020.030.040.050.060.070.080.090.0
100.0

2014 Customer Satisfaction Surveys Transit-Served Market Area Survey
Final Report, Page 3-4
detailed information on transit riders in Delaware, the Delaware Transit Corporation (DTC) conducts passenger surveys and DTC should be contacted for survey reports.
3.4.1 Drive-Alone or Single-Occupant-Vehicle (SOV) Users The 2014 survey showed that 81% of the sample made drive-alone trips, which is slightly lower than the 2012 survey result (86%) but higher than survey years prior to 2012. Seventy-four percent (74%) of respondents in the 2009 survey and 44% of respondents in the 2006 survey reported to have made drive-alone trips. White respondents were slightly more likely to indicate that they drove-alone (81%) as non-white respondents (73%). Male respondents were equally likely to indicate that they drove-alone (81%) as compared to female respondents (80%). New Castle County residents (91%) were more likely than other counties to indicate that they drove alone compared to the 79% and 71% of Kent County and Sussex County residents, respectively.
3.4.1.1 Attribute Importance Those respondents that reported driving alone for some of their trips during the previous week were asked to rate the importance of twelve attributes on a 1 to 7-point scale. The results are displayed in the table below.
Figure 3-2 Importance of Highway Attributes Not at all
important Extremely
Important
Attribute 1 2 3 4 5 6 7 Total Mean
Hwy signs visible day and night 1% 0% 3% 3% 6% 10% 77% 100% 6.51 Well-planned sequencing & timing of traffic lights 0% 1% 3% 3% 4% 27% 61% 100% 6.39
Clear lane lines on the hwy 1% 3% 1% 0% 7% 26% 60% 100% 6.34
Hwys free of congestion 0% 0% 0% 4% 13% 34% 49% 100% 6.31
Timely snow plowing and salting 1% 3% 0% 4% 13% 15% 63% 100% 6.27
Condition of pavement on hwys 1% 3% 4% 6% 7% 15% 64% 100% 6.16 Info on when to expect delays, road closings 1% 3% 1% 9% 10% 28% 47% 100% 6.01 Hwy signs that provide direction, mileage 3% 1% 4% 6% 12% 27% 46% 100% 5.93 Clearly marked and protected work zones 3% 3% 7% 6% 15% 19% 48% 100% 5.77 Keeping land adjacent to hwys litter free 6% 6% 7% 12% 25% 22% 23% 100% 5.06 Keeping land adjacent to hwys landscaped, mowed 9% 9% 9% 19% 21% 17% 17% 100% 4.56
Having many travel mode choices 26% 4% 9% 16% 16% 12% 16% 100% 4.03 The survey findings indicate the most important attributes for SOV users are “highway signs visible both day and night,” “well-planned sequencing and timing of traffic lights,” and “clear lane lines on highways.” “Highway signs visible both day and night,”” was given the highest importance in the 2012 survey as well. The least important attributes are “having many travel mode choices” and “keeping land adjacent to highways landscaped and mowed.” Both these attributes were the lowest-rated attributes in the 2012 survey as well. The figure below illustrates the mean importance rating of each of the above twelve attributes.

2014 Customer Satisfaction Surveys Transit-Served Market Area Survey
Final Report, Page 3-5
Figure 3-3 Mean Importance Ratings – SOV Users
1
2
3
4
5
6
7 6.51 6.39 6.34 6.31 6.27 6.16 6.01 5.93 5.77
5.06 4.56
4.03
Extremely Important
Not at all Important

2014 Customer Satisfaction Surveys Transit-Served Market Area Survey
Final Report, Page 3-6
3.4.1.2 Attribute Performance In addition to asking respondents how important each attribute was to them, this year’s survey, like the previous efforts, also asked respondents how well the current transportation system was performing on each attribute. Again, a seven-point scale was used, with a “1” meaning “poor” and a “7” meaning “excellent”. The results are displayed in the following table.
Figure 3-4 Performance of Highway Attributes Poor Excellent
Attribute 1 2 3 4 5 6 7 Total Mean Clearly marked and protected work zones 1% 0% 4% 9% 24% 33% 29% 100% 5.67
Hwy signs visible day and night 0% 0% 6% 13% 23% 39% 20% 100% 5.54
Timely snow plowing and salting 0% 6% 1% 12% 26% 36% 19% 100% 5.46
Clear lane lines on the hwy 3% 0% 4% 16% 24% 31% 21% 100% 5.39 Hwy signs that provide direction, mileage 1% 0% 6% 20% 27% 23% 22% 100% 5.33 Info on when to expect delays, road closings 3% 7% 4% 21% 21% 31% 11% 100% 4.91 Keeping land adjacent to hwys landscaped, mowed 7% 1% 7% 22% 25% 30% 7% 100% 4.80
Having many travel mode choices 13% 5% 5% 23% 29% 19% 6% 100% 4.76 Keeping land adjacent to hwys litter free 7% 6% 7% 24% 25% 24% 7% 100% 4.58
Condition of pavement on hwys 6% 9% 17% 12% 29% 17% 10% 100% 4.47
Hwys free of congestion 6% 13% 13% 24% 22% 18% 4% 100% 4.24 Well-planned sequencing & timing of traffic lights 13% 9% 18% 22% 13% 18% 7% 100% 4.07 Similar to the previous surveys, performance ratings are lower than importance ratings. The attributes with the highest average performance ratings are “clearly marked and protected work zones,” “highway signs visible both day and night,” and “timely snow plowing and salting.” The first two attributes were top performer in the 2012 survey as well. Similar to the 2012 survey, the lowest performing attribute for 2014 was “well-planned sequencing and timing of traffic lights.” Other low performers include “highways free from congestion” and “condition of pavements on highways.” These attributes were among the lowest rated in terms of performance in most of the previous surveys as well. The following figure displays the mean performance ratings.

2014 Customer Satisfaction Surveys Transit-Served Market Area Survey
Final Report, Page 3-7
Figure 3-5 Mean Performance Ratings – SOV Users
3.4.1.3 Importance-Performance Analysis By comparing an attribute across both dimensions (importance and performance), one can separate the attributes customers feel are very important and are currently less satisfied with, from those attributes of less importance. Importance-performance analysis is designed to take into account that not all shortfalls in quality are of equal concern to customers. When an attribute that is considered to be of primary importance falls short of a desirable level of performance that is of greater concern then when a peripheral attribute is unsatisfactory in terms of performance. Thus, actions to address or improve shortfalls in a critical area (an attribute rated as high in importance) would be given a higher priority by customers than actions proposed to rectify shortfalls in areas of marginal importance (attributes rated low in importance). To develop the satisfaction index, the mean rating for both importance and performance were computed for each attribute. The satisfaction index is calculated by computing the ratio between the mean performance rating to the mean importance rating for each attribute. This index demonstrates the balance between importance and performance in the minds of customers on an attribute. The higher the value of the satisfaction index, the higher the level of customer satisfaction on that attribute.
1.00
2.00
3.00
4.00
5.00
6.00
7.00
5.67 5.54 5.46 5.39 5.33 4.91 4.80 4.76 4.58 4.47 4.24 4.07
Excellent
Poor

2014 Customer Satisfaction Surveys Transit-Served Market Area Survey
Final Report, Page 3-8
Figure 3-6 Importance-Performance Ratings and Satisfaction Indices – SOV Users
Attribute 2014 Mean Importance
Rating
2014 Mean Performance
Rating
Satisfaction Index
Having many travel mode choices
4.03
4.76
118.11
Keeping land adjacent to hwys landscaped, mowed
4.56
4.80
105.26
Clearly marked and protected work zones
5.77
5.67
98.27
Keeping land adjacent to hwys litter free
5.06
4.58
90.51
Hwy signs that provide direction, mileage
5.93
5.33
89.88
Timely snow plowing and salting
6.27
5.46
87.08
Hwy signs visible day and night
6.51
5.54
85.10
Clear lane lines on the hwy
6.34
5.39
85.02
Info on when to expect delays, road closings
6.01
4.91
81.70
Condition of pavement on hwys
6.16
4.47
72.56
Hwys free of congestion
6.31
4.24
67.19
Well-planned sequencing & timing of traffic lights
6.39
4.07
63.69
The attributes with the highest customer satisfaction index were “having many travel mode choices,” “keeping lands adjacent to highways landscaped and mowed,” and “clearly marked and protected work zones.” The first two attributes had high customer satisfaction ratings in the 2012, 2009 and 2006 surveys as well. Customer satisfaction is not being obtained on the attributes of “having well-planned sequencing and timing of traffic lights” and “having highways free from congestion.” This was found in all previous surveys as well. Similar to the analysis provided on the results of the General Transportation User survey and as was done in previous survey years, quadrant analysis was conducted on the results of this survey as well. Quadrant analysis can assist policy makers in service program decisions by placing the attributes along two dimensions -- the importance of the attribute to customers and the satisfaction with the performance on the provision of these services. Having these two dimensions of public evaluation allows for the creation of four performance quadrants as can be seen below.
Figure 3-7 Importance – Performance Quadrants
Perfo
rman
ce R
atin
g on
Attr
ibut
e
Importance Rating of Attribute Quadrants Below Average
Above Average
Above Average (2) Maintenance: Low Priority
(1) Maintenance: High Priority
Below Average
(3) Corrective: Low Priority
(4) Corrective: High Priority
The attributes falling in Quadrant 4 are higher than the overall mean of all importance ratings and are below the overall mean of all performance ratings (thus, above average importance and

2014 Customer Satisfaction Surveys Transit-Served Market Area Survey
Final Report, Page 3-9
below average performance). The attributes that fall within this quadrant should be of the highest priority for corrective action. Attributes that fall within Quadrant 3 are both below average importance and below average performance. These attributes also need corrective action, but immediate attention is not required since the attributes are less important to customers. These items should be monitored and receive attention or investment after the more important attributes in Quadrant 4 are addressed. The attributes in Quadrant 2 are above average in performance and below average in importance. Attributes in this quadrant need only maintenance action and are of the lowest priority. Items that fall within Quadrant 1 are above average in importance and above average in performance. Although these attributes are doing well currently, they are high priority for maintenance action and should not be neglected. These are salient issues to customers and need to be followed closely. The table below shows how the twelve attributes, asked of SOV users in the transit-served areas of Delaware, fell into the four quadrants.
Figure 3-8 Importance – Performance Quadrant Analysis - SOV Users
Perfo
rman
ce R
atin
g on
Attr
ibut
e
Importance Rating of Attribute Quadrants Below Average
Above Average
Above Average (2) Maintenance: Low Priority
Work Zones
(1) Maintenance: High Priority
Clear Lane Lines Snow Plowing & Salting Directional Hwy Signs
Signs Visible Day and Night Below Average
(3)
Corrective: Low Priority Mode Choice
Litter Free Hwys Landscaping & Mowing
(4) Corrective: High Priority
Highways Free of Congestion Timing/Sequencing Signals
Pavement Condition Info on Delays & Closings
The attributes in Quadrant 1 represent items which customers in transit-served areas regard as important and on which Delaware received a high mark. Although the attributes are perceived to be faring well now, they are a high priority for maintenance and should not be neglected. These attributes are important to customers and are salient issues that customers are attentive to. “Clear lane lines on highways,” “timely snow plowing and salting,” “highway signs that provide direction and mileage,” and “highway signs visible day and night” fell into Quadrant 1 in this year’s survey. All these attributes were in Quadrant 1 in the 2012 as well. The attributes in Quadrant 2 are those that customers rate high in performance but low in importance. Therefore, while these attributes need some maintenance action, they are not as salient to customers as the items in Quadrant 1. “Clearly marked and protected worked zones” belonged to Quadrant 2 in 2014. This attribute was in Quadrant 4 in 2012, indicating improved performance but reduced important in 2014. Delaware is given low performance ratings on attributes falling into Quadrant 3, but these items are also of low importance to customers in the transit-served market area. In terms of action, these attributes should be slated for corrective action but is lower in priority compared to attributes in Quadrant 4. “Having many mode choices,” “keeping land adjacent to highways litter free” and “keeping lands adjacent to highways landscaped and mowed” were in this Quadrant in 2014. The first two attributes also belonged to Quadrant 3 in the 2012 survey. “Keeping lands adjacent to highways landscaped and mowed” was in Quadrant 2 in 2012, suggesting deteriorated performance in 2014.

2014 Customer Satisfaction Surveys Transit-Served Market Area Survey
Final Report, Page 3-10
Quadrant 4 represents those attributes rated high in importance but low in performance, thus representing attributes with low customer satisfaction. These attributes are the highest priority for receiving corrective action and for customers they were “having highways free of congestion,” “having well-planned sequencing and timing of traffic lights,” “condition of pavement on highways,” and “info on when to expect delays and road closings.” The first two attributes were Quadrant 4 attributes in 2012 as well as most of the prior surveys.
3.4.2 All Motorists The previous analyses provided a snapshot of customer satisfaction for those that drove-alone and reside within a transit-served area of Delaware. However, from a policy development perspective, it is more useful to examine the data for all motorists (those that drove-alone only, those that carpooled only, and those that drove-alone but also carpooled) to derive guidance on appropriate highway improvement strategies. This section of the report provides an examination of the data across all motorists in the transit-served areas of Delaware. For the 2014 survey, 94% (n=84) of the sample reported traveling either alone in a motor vehicle or with others.
3.4.2.1 Attribute Importance The table below illustrates the importance assigned to the twelve highway-related attributes in the transit-served market areas of Delaware for all motorists (those who drove alone the previous week as well as those who carpooled).
Figure 3-9 Importance of Highway Attributes Not at all
important Extremely
Important
Attribute 1 2 3 4 5 6 7 Total Mean
Hwy signs visible day and night 2% 0% 2% 2% 5% 11% 77% 100% 6.48
Clear lane lines on highways 2% 2% 1% 0% 7% 23% 63% 100% 6.30 Well-planned sequencing & timing of traffic lights 2% 1% 2% 4% 4% 27% 60% 100% 6.24
Timely snow plowing and salting 2% 2% 0% 4% 12% 14% 65% 100% 6.23 Condition of pavement on hwys 2% 2% 4% 5% 7% 12% 67% 100% 6.17
Hwys free from congestion 1% 0% 0% 5% 15% 32% 48% 100% 6.17 Hwy signs that provide direction, mileage 4% 1% 4% 5% 10% 27% 51% 100% 5.98 Info on when to expect delays, road closings 2% 2% 1% 9% 9% 29% 48% 100% 5.96 Clearly marked and protected work zones 4% 2% 7% 6% 16% 16% 49% 100% 5.72
Keeping land adjacent to hwys litter free 6% 5% 6% 12% 22% 24% 25% 100% 5.12 Keeping land adjacent to hwys landscaped, mowed 8% 7% 7% 17% 20% 19% 20% 100% 4.73
Having many travel mode choices 26% 4% 9% 16% 17% 14% 15% 100% 3.95 The top rated attributes in terms of mean importance are: Highway signs visible day and night, Clear lane lines on highways, and, Well-planned sequencing and timing of traffic lights.

2014 Customer Satisfaction Surveys Transit-Served Market Area Survey
Final Report, Page 3-11
“Highway signs visible day and night” was the top-rated attribute in terms of importance in the 2012 survey as well. This year the lowest rated attributes in terms of importance are: Having many travel mode choices, Keeping land adjacent to highways landscaped and mowed, and, Keeping land adjacent to highways litter free. These three attributes were among the lowest rated attributes in the 2012 and 2009 surveys, as well. One can again note the lack of a relationship between the importance associated with “having highways free from congestion” and the importance associated with “having many travel mode choices.” “Highways free from congestion” has a much higher importance rating than “having many travel mode choices.” Clearly motorists continue to view other non-auto modes as a different or alternative choice to the automobile but not as a potential congestion management strategy. The figure below illustrates the mean importance of each of the above twelve attributes among all motorists.
Figure 3-10 Mean Importance Ratings – All Motorists
1.00
2.00
3.00
4.00
5.00
6.00
7.00 6.48 6.30 6.24 6.23 6.17 6.17 5.98 5.96 5.72 5.12
4.73
3.95
Extremely Important
Not at all Important

2014 Customer Satisfaction Surveys Transit-Served Market Area Survey
Final Report, Page 3-12
3.4.2.2 Attribute Performance The table below provides the performance rating data obtained in the survey from all motorists.
Figure 3-11 Performance of Highway Attributes Poor Excellent
Attribute 1 2 3 4 5 6 7 Total Mean Clearly marked and protected work zones 2% 1% 6% 7% 25% 27% 31% 100% 5.57
Hwy signs visible day and night 2% 0% 7% 13% 22% 34% 22% 100% 5.40
Timely snow plowing and salting 1% 7% 2% 11% 23% 32% 23% 100% 5.35
Clear lane lines on highways 5% 1% 4% 17% 23% 26% 25% 100% 5.30 Hwy signs that provide direction, mileage 4% 1% 5% 18% 27% 20% 25% 100% 5.25 Info on when to expect delays, road closings 5% 7% 5% 23% 21% 27% 12% 100% 4.79 Keeping land adjacent to hwys mowed and landscaped 7% 2% 8% 19% 27% 28% 8% 100% 4.72
Keeping land adjacent to hwys litter free 7% 5% 9% 22% 27% 21% 10% 100% 4.57
Condition of pavement on hwys 7% 8% 16% 12% 28% 16% 13% 100% 4.45
Having many travel mode choices 12% 4% 8% 22% 30% 16% 7% 100% 4.30
Hwys free from congestion 10% 13% 12% 21% 23% 16% 5% 100% 4.01 Well-planned sequencing & timing of traffic lights 12% 10% 15% 23% 16% 16% 7% 100% 3.99 Top performing attributes in 2014 were: Clearly marked and protected work zones, Highway signs visible day and night, and Timely snow plowing and salting. The attribute “clear lane lines on highways” was one of the three top rated attributes for performance in the 2005, 2006, 2009 and 2012 surveys as well. Low performing attributes in 2014 were: Well-planned sequencing and timing of traffic lights, Highways free from congestion, and Having many travel mode choices. These attributes were among the attributes with the lowest performance ratings in most of the prior surveys as well. The figure below depicts the mean performance ratings for each attribute. , mowed

2014 Customer Satisfaction Surveys Transit-Served Market Area Survey
Final Report, Page 3-13
Figure 3-12 Mean Performance Ratings – All Motorists
3.4.2.3 Importance-Performance Analysis Again, some of the most relevant information for policy-makers and decision-makers are the results of the importance-performance analysis for all motorists. The table below shows the mean importance and performance ratings for each attribute and that attribute's relative level of satisfaction.
Figure 3-13 Importance-Performance Ratings and Satisfaction Indices – All Motorists
Attribute 2014 Mean Importance Rating
2014 Mean Performance
Rating
Satisfaction Index
Having many travel mode choices 3.95 4.30 108.88 Keeping land adjacent to hwys landscaped, mowed 4.73 4.72 99.75 Clearly marked and protected work zones 5.72 5.57 97.35 Keeping land adjacent to hwys litter free 5.12 4.57 89.31 Hwy signs that provide direction, mileage 5.98 5.25 87.90 Timely snow plowing and salting 6.23 5.35 85.87 Clear lane lines on highways 6.30 5.30 84.14 Hwy signs visible day and night 6.48 5.40 83.35 Info on when to expect delays, road closings 5.96 4.79 80.25 Condition of pavement on hwys 6.17 4.45 72.05 Hwys free from congestion 6.17 4.01 65.02 Well-planned sequencing & timing of traffic lights 6.24 3.99 63.86 Satisfaction was highest for the attributes of “having many travel mode choices,” “keeping land adjacent to highways landscaped and mowed,” and “clearly marked and protected work zones.”
1.00
2.00
3.00
4.00
5.00
6.00
7.00
5.57 5.40 5.35 5.30 5.25 4.79 4.72 4.57 4.45 4.30
4.01 3.99
Excellent
Poor

2014 Customer Satisfaction Surveys Transit-Served Market Area Survey
Final Report, Page 3-14
“Having many travel mode choices” and “keeping lands adjacent to highways landscaped and mowed” showed high levels of satisfaction in the 2006, 2009 and 2012 surveys as well The lowest level of satisfaction occurs with “well-planned sequencing and timing of traffic lights” followed by “highways free from congestion” and “condition of pavement on highways.” These were the lowest rated attributes in terms of satisfaction in the prior survey as well including 2012. Importance-performance quadrant analysis was also performed on the data and the results are contained in the following table.
Figure 3-14 Importance – Performance Quadrant Analysis – All Motorists
Perfo
rman
ce R
atin
g on
Attr
ibut
e
Importance Rating of Attribute Quadrants Below Average
Above Average
Above Average (2) Maintenance: Low Priority
Work Zones
(1) Maintenance: High Priority
Clear Lane Lines Snow Plowing & Salting
Direction Hwy Signs Signs Visible
Below Average
(3) Corrective: Low Priority
Mode Choice Litter Free Hwys
Landscaping & Mowing
(4) Corrective: High Priority
Hwys Free of Congestion Timing/Sequencing Signals
Pavement Condition Info on Delays & Closings
For 2014, the quadrant analysis results for the “all motorists” user group was exactly identical to the quadrant analysis results for the “SOV” user group. The attributes in Quadrant 1 represent items which all motorists in transit-served areas regard as important and on which Delaware receives high ratings for performance. For 2014, Quadrant 1 contained four attributes and they were “clear lane lines on highways,” “timely snow plowing and salting,” “highway signs that provide direction and mileage,” and “highway signs visible day and night.” These attributes were Quadrant 1 attributes in the 2009 and 2012 surveys as well. Quadrant 2 attributes are those that all motorists rate high in performance but low in importance. Thus relative to Quadrant 1 attributes, these items are of lower priority for maintenance action or investments, as these attributes are not as salient to motorists as the items in Quadrant 1. “Clearly marked and protected worked zones” belonged to Quadrant 2 in 2014. This attribute was in Quadrant 1 in 2012, indicating reduced important in 2014. Low performance ratings are given to attributes falling into Quadrant 3, but these items are also of less importance to motorists. “Having many mode choices,” “keeping land adjacent to highways litter free” and “keeping lands adjacent to highways landscaped and mowed” were in this Quadrant in 2014. The first two attributes also belonged to Quadrant 3 in the 2012 survey. “Keeping lands adjacent to highways landscaped and mowed” was in Quadrant 2 in 2012, suggesting deteriorated performance in 2014. Quadrant 4 represents those attributes rated high in importance, but low in satisfaction with the delivery of these services. These attributes should be targeted for high priority corrective action and for motorists within transit-served areas they were “having highways free of congestion,” “having well-planned sequencing and timing of traffic lights,” “condition of pavement on highways,” and “info on when to expect delays and road closings.” The first two attributes were Quadrant 4 attributes in the 2012 survey as well.
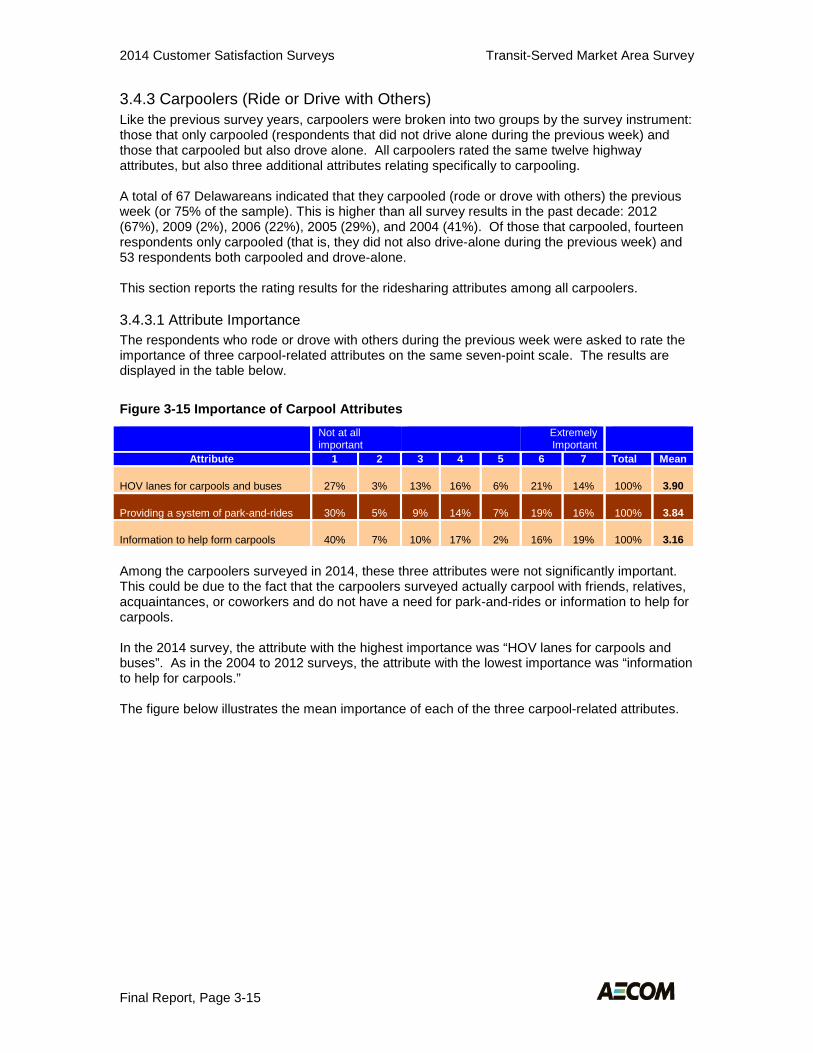
2014 Customer Satisfaction Surveys Transit-Served Market Area Survey
Final Report, Page 3-15
3.4.3 Carpoolers (Ride or Drive with Others) Like the previous survey years, carpoolers were broken into two groups by the survey instrument: those that only carpooled (respondents that did not drive alone during the previous week) and those that carpooled but also drove alone. All carpoolers rated the same twelve highway attributes, but also three additional attributes relating specifically to carpooling. A total of 67 Delawareans indicated that they carpooled (rode or drove with others) the previous week (or 75% of the sample). This is higher than all survey results in the past decade: 2012 (67%), 2009 (2%), 2006 (22%), 2005 (29%), and 2004 (41%). Of those that carpooled, fourteen respondents only carpooled (that is, they did not also drive-alone during the previous week) and 53 respondents both carpooled and drove-alone. This section reports the rating results for the ridesharing attributes among all carpoolers.
3.4.3.1 Attribute Importance The respondents who rode or drove with others during the previous week were asked to rate the importance of three carpool-related attributes on the same seven-point scale. The results are displayed in the table below.
Figure 3-15 Importance of Carpool Attributes Not at all
important Extremely
Important
Attribute 1 2 3 4 5 6 7 Total Mean
HOV lanes for carpools and buses 27% 3% 13% 16% 6% 21% 14% 100% 3.90
Providing a system of park-and-rides 30% 5% 9% 14% 7% 19% 16% 100% 3.84
Information to help form carpools 40% 7% 10% 17% 2% 16% 19% 100% 3.16 Among the carpoolers surveyed in 2014, these three attributes were not significantly important. This could be due to the fact that the carpoolers surveyed actually carpool with friends, relatives, acquaintances, or coworkers and do not have a need for park-and-rides or information to help for carpools. In the 2014 survey, the attribute with the highest importance was “HOV lanes for carpools and buses”. As in the 2004 to 2012 surveys, the attribute with the lowest importance was “information to help for carpools.” The figure below illustrates the mean importance of each of the three carpool-related attributes.

2014 Customer Satisfaction Surveys Transit-Served Market Area Survey
Final Report, Page 3-16
Figure 3-16 Mean Importance Ratings – All Carpoolers
3.4.3.2 Attribute Performance Carpoolers were also asked to rate how well the current transportation system was performing on each of these three attributes. The results are displayed in the table below.
Figure 3-17 Performance of Carpool Attributes Poor Excellent
Attribute 1 2 3 4 5 6 7 Total Mean
Providing a system of park-and-rides 16% 2% 19% 23% 19% 12% 9% 100% 3.98 Information to help form carpools 30% 5% 13% 23% 18% 5% 8% 100% 3.38
HOV lanes for carpools and buses 32% 0% 23% 20% 18% 0% 7% 100% 3.20 In the 2014 survey, the highest performing attribute was “providing system of park-and-rides” and the attribute with the lowest performance rating was “HOV lanes for carpools and buses,” which was the lowest performing attribute in the 2002, 2003, 2004, 2006, 2009 and 2012 surveys as well. The figure below shows the mean performance for each of the three carpool attributes.
1.00
2.00
3.00
4.00
5.00
6.00
7.00
HOV Lanes Park-Rides Carpool Info
3.90 3.84
3.16
Extremely Important
Not at all Important

2014 Customer Satisfaction Surveys Transit-Served Market Area Survey
Final Report, Page 3-17
Figure 3-18 Mean Performance Ratings – All Carpoolers
3.4.3.3 Importance-Performance Analysis The satisfaction index for each carpool attribute is contained in the table below, accompanied by the mean ratings for importance and performance.
Figure 3-19 Importance – Performance Ratings and Satisfaction Indices – All Carpoolers
Attribute 2014 Mean Importance Rating
2014 Mean Performance
Rating
Satisfaction Index
Information to help form carpools 3.16 3.38 106.96 Providing a system of park-and-rides 3.84 3.98 103.64 HOV lanes for carpools and buses 3.90 3.20 82.05 The 2014 survey results showed the highest rating of satisfaction for “information to help form carpools” and the lowest satisfaction for “HOV lanes for carpools and buses,” which was the lowest attribute in terms of satisfaction in the 2012, 2009, 2006 and 2005 survey as well. Again, quadrant analysis was conducted on the importance-performance results from the carpool features. The results are contained in the table below.
Figure 3-20 Importance – Performance Quadrant Analysis - All Carpoolers
Perfo
rman
ce R
atin
g on
Attr
ibut
e
Importance Rating of Attribute Quadrants Below Average
Above Average
Above Average (2) Maintenance: Low Priority
(1) Maintenance: High Priority System of Park and Rides
Below Average
(3) Corrective: Low Priority Info to Form Carpools
(4) Corrective: High Priority
HOV Lanes In the 2014 survey, “providing a system of park-and-rides” was placed in Quadrant 1, “information to help for carpools” was placed in Quadrant 3, and “HOV lanes for carpools and buses” was placed in Quadrant 4. Except for “info to form carpools”, which belonged to Quadrant 2 in 2012, other two results were similar to the 2012 survey.
1.00
2.00
3.00
4.00
5.00
6.00
7.00
Park-Rides Carpool Info HOV lanes
3.98 3.38 3.20
Excellent
Poor

2014 Customer Satisfaction Surveys Transit-Served Market Area Survey
Final Report, Page 3-18
3.4.4 Bicyclists Just as in the General Transportation User survey and as was done in the previous survey years, respondents were asked if they had used a bicycle for any of the previous week’s trips. If a respondent indicated that a bicycle trip was made, the respondent was asked to rate both the importance and performance of twelve different attributes. For 2012, 4% (n=4) of the transit-served sample made a trip by bicycle the previous week. This was lower than the 2009 (10%) and but similar to 2012 (3%) and 2006 (5%) surveys. Relatively low percentages were also found in all prior years. Since the sample of bicycle riders was very small, variations across different categories such as area type, gender, and age could not be examined. Due to the small sample size, the data from this group should not be deemed representative of bicycle users that reside in the transit-served areas of Delaware.
3.4.4.1 Attribute Importance The four bicycle users were asked to rate the importance of twelve different attributes on a seven-point scale, with a “1” being “not at all important,” and a “7” being “extremely important”. The results are outlined in the following table showing the percentage distribution of response for each rating along with the mean importance as computed for each attribute. Attributes are ordered in the table by mean importance.
Figure 3-21 Importance of Bicycle Attributes Not at all
important Extremely
Important
Attribute 1 2 3 4 5 6 7 Total Mean Wide, paved shoulders 0% 0% 0% 0% 0% 0% 100% 100% 7.00 Separate bicycle paths 0% 0% 0% 0% 0% 33% 67% 100% 7.00 Striped bicycle lanes 0% 0% 0% 0% 25% 25% 50% 100% 6.25 Signed bicycle routes 0% 0% 0% 0% 25% 25% 50% 100% 6.25 Bicycle friendly drainage grates 0% 0% 33% 0% 0% 0% 67% 100% 6.25 Roadways clear of debris 0% 0% 0% 0% 25% 25% 50% 100% 6.25 Adequate street lighting 0% 0% 0% 25% 0% 0% 75% 100% 6.25 Smooth pavement on roadways 0% 0% 0% 0% 25% 25% 50% 100% 6.25 Bicycle racks and lockers 0% 0% 0% 25% 25% 25% 25% 100% 5.50 Low volume motor vehicle traffic 25% 0% 0% 75% 0% 0% 0% 100% 3.25 Shower facilities 50% 0% 25% 0% 0% 0% 25% 100% 3.00 Low speed motor vehicle traffic 50% 0% 0% 50% 0% 0% 0% 100% 2.50 The four respondents who made a trip by bicycle the previous week rated twelve attributes of importance. These respondents gave “wide, paved shoulders,” “separate bicycle paths” and “striped bicycle lanes” the highest ratings. The lowest rated attributes of importance in 2014 were “Low speed motor vehicle traffic” and “shower facilities.” “Shower faculties” was also one of the lowest rated attribute for importance in the 2006, 2009 and 2012 surveys.

2014 Customer Satisfaction Surveys Transit-Served Market Area Survey
Final Report, Page 3-19
Figure 3-22 Mean Importance Ratings – Bicyclists
3.4.4.2 Attribute Performance Just as other users, the bicycle users were asked to rate the performance provided by the current transportation system for each of the twelve attributes.
Figure 3-23 Performance of Bicycle Attributes Poor Excellent
Attribute 1 2 3 4 5 6 7 Total Mean Adequate street lighting 33% 0% 0% 0% 0% 67% 0% 100% 5.25 Wide, paved shoulders 0% 25% 0% 0% 50% 25% 0% 100% 4.50 Striped bicycle lanes 0% 25% 0% 25% 0% 50% 0% 100% 4.50 Bicycle friendly drainage grates 0% 67% 0% 0% 0% 33% 0% 100% 4.50 Smooth pavement on roadways 0% 0% 25% 25% 25% 25% 0% 100% 4.50 Bicycle racks and lockers 33% 0% 33% 0% 33% 0% 0% 100% 4.25 Signed bicycle routes 0% 25% 0% 50% 25% 0% 0% 100% 3.75 Roadways clear of debris 25% 25% 0% 0% 0% 50% 0% 100% 3.75 Low volume motor vehicle traffic 50% 0% 0% 50% 0% 0% 0% 100% 2.50 Low speed motor vehicle traffic 50% 0% 0% 50% 0% 0% 0% 100% 2.50 Separate bicycle paths 50% 25% 0% 0% 25% 0% 0% 100% 2.25 Shower facilities 75% 25% 0% 0% 0% 0% 0% 100% 1.25 Top-rated bicycle attributes for performance included “adequate street lighting,” “wide and paved shoulders,” and “striped bicycle lanes.” All of these attributes were mid-range performers in the 2012 survey. “Shower facilities” had lowest performance rating in 2014, similar to the 2005, 2006, 2009 and 2012 surveys. “Separate bicycle paths” had the second lowest performance rating in this year’s survey similar to the 2012 survey but it was rated very high in the 2009 survey.
1.00
2.00
3.00
4.00
5.00
6.00
7.007.00 7.00
6.25 6.25 6.25 6.25 6.25 6.25
5.50
3.25 3.00
2.50
Extremely Important
Not at all Important

2014 Customer Satisfaction Surveys Transit-Served Market Area Survey
Final Report, Page 3-20
Figure 3-24 Mean Performance Ratings – Bicyclists
3.4.4.3 Importance-Performance Analysis As with the other modes, importance-performance analysis was performed.
Figure 3-25 Importance-Performance Ratings and Satisfaction Indices – Bicyclists
Attribute 2014 Mean Importance Rating
2014 Mean Performance Rating
Satisfaction Index
Low speed motor vehicle traffic
2.50
2.50
100.00
Adequate street lighting
6.25
5.25
84.00
Bicycle racks and lockers
5.50
4.25
77.27
Low volume motor vehicle traffic
3.25
2.50
76.92
Smooth pavement on roadways
6.25
4.50
72.00
Bicycle friendly drainage grates
6.25
4.50
72.00
Striped bicycle lanes
6.25
4.50
72.00
Wide, paved shoulders
7.00
4.50
64.29
Signed bicycle routes
6.25
3.75
60.00
Roadways clear of debris
6.25
3.75
60.00
Shower facilities
3.00
1.25
41.67
Separate bicycle paths
7.00
2.25
32.14
In 2014 one attribute “low speed motor vehicle traffic” had an index at 100, meaning that satisfaction was being achieved. Other attributes with high levels of satisfaction in 2014 were “adequate street lighting” and “bicycle racks and lockers.” The lowest levels of satisfaction were found for “separate bicycle paths,” “shower facilities,” and “roadways clear of debris.” “Separate bicycle paths” was one of the lowest performing attributes in 2012 as well. “Shower facilities” was one of the highest performing attributes in both 2009 and
0.00
1.00
2.00
3.00
4.00
5.00
6.00
7.00
5.25
4.50 4.50 4.50 4.50 4.25
3.75 3.75
2.50 2.50 2.25
1.25
Excellent
Poor

2014 Customer Satisfaction Surveys Transit-Served Market Area Survey
Final Report, Page 3-21
2012 surveys but dropped to one of the lowest performing attribute in 2014. Again, these results and any comparison to prior year results needs be done with caution due to the very small sample size of respondents obtained in this survey year as well as other years. The results of the quadrant analysis are contained in the figure below.
Figure 3-26 Importance-Performance Quadrant Analysis – Bicyclists
Perfo
rman
ce R
atin
g on
Attr
ibut
e
Importance Rating of Attribute Quadrants Below Average
Above Average
Above Average (2) Maintenance: Low Priority
(1) Maintenance: High Priority
Signed Bicycle Routes Striped Bicycle Lanes
Roadways Free of Debris Adequate Street Lighting Wide, Paved Shoulders
Bicycle Friendly Drainage Grates Racks and Lockers Smooth Pavement
Below Average
(3) Corrective: Low Priority
Low Volume Traffic Shower Facilities Low Speed Traffic
(4) Corrective: High Priority Separate Bicycle Paths
Quadrant 1 attributes are perceived to be both above average in performance, as well as importance and as such are high priority attributes for investment. In 2014 eight attributes belonged to this quadrant compared to one in 2012. Those attributes were “signed bicycle routes,” “striped bicycle lanes,” “roadway free of debris,” “adequate street lighting,” “wide and paved shoulder,” “bicycle friendly drainage grates,” “bicycle racks and lockers,” and “smooth pavement on roadways.” The first six attributes belonged to Quadrant 4 in 2012, suggesting improved performance in 2014. “Bicycle racks and lockers” was in Quadrant 3 in 2012, suggesting both increased importance and improved performance in 2014. “Smooth pavement on roadways” was a Quadrant 2 attribute in 2012, suggesting increased importance in 2014. Quadrant 2 attributes are those that bicyclists rate high in performance but low in importance. Thus relative to Quadrant 1 attributes, these items are of lower priority for maintenance action or investments, as these attributes are not as salient to bicyclists as the items in Quadrant 1. There were no attributes in Quadrant 2 in this year’s survey. Three attributes fell into Quadrant 3 for 2014. They were “low volume motor vehicle traffic,” “shower facilities,” and “low speed motor vehicle traffic.” “Low volume motor vehicle traffic” was in Quadrant 1 in the 2012, suggesting both decreased importance and deteriorated performance. The remaining two attributes were in Quadrant 2 in 2012, suggesting deteriorated performance in 2014. Only one attribute belonged to Quadrant 4 in 2014. It was “separate bicycle paths.” This attributed belonged to Quadrant 4 in the 2012 survey as well. Attributes in Quadrant 4 should be targeted for investment due to their higher than average importance rating and their lower than average performance rating. These results should be used with caution due to the small sample size.

2014 Customer Satisfaction Surveys Transit-Served Market Area Survey
Final Report, Page 3-22
3.4.5 Pedestrians Like the other modes, respondents that indicated they had walked for some of their trips during the previous week were also asked a series of importance and performance questions. This section of the report will discuss the results of the pedestrian rating questions from the Transit-Served Market Area survey. Sixteen respondents (18%) reported that they walked for some of the trips they made the previous week. This share is much lower than the 2012 survey (33%) but was found similar to prior surveys. Sussex County residents were more likely to make walking trips in the previous week at 29%, compared to 13% each for Kent and New Castle County residents.
3.4.5.1 Attribute Importance Pedestrians were asked to rate the importance of thirteen attributes as they relate to walking trips. The results are contained in the table below.
Figure 3-27 Importance of Pedestrian Attributes Not at all important Extremely
Important
Attribute 1 2 3 4 5 6 7 Total Mean
Adequate street lighting 0% 0% 0% 6% 6% 0% 88% 100% 6.69
Sidewalks in my neighborhood 0% 0% 0% 0% 13% 20% 67% 100% 6.63
Sidewalks clear of debris 0% 0% 0% 0% 6% 25% 69% 100% 6.63 Sidewalks between neighborhoods 0% 0% 0% 6% 6% 13% 75% 100% 6.56
Sidewalks to commercial areas 0% 0% 0% 6% 13% 19% 63% 100% 6.38 Sidewalks to & from transit stations & stops 0% 0% 0% 13% 7% 27% 53% 100% 6.31 Marked crosswalks at intersections & other locations 0% 6% 6% 0% 6% 13% 69% 100% 6.19 Pedestrian signals and push buttons 0% 6% 6% 13% 6% 31% 38% 100% 5.63 Pedestrian overpasses to cross highways 0% 0% 13% 6% 19% 31% 31% 100% 5.62
Low volume motor vehicle traffic 0% 7% 0% 29% 7% 43% 14% 100% 5.56
Wide sidewalks 6% 0% 0% 6% 31% 31% 25% 100% 5.50
Low speed motor vehicle traffic 6% 6% 6% 13% 6% 38% 25% 100% 5.19
Street trees 25% 13% 0% 19% 25% 6% 13% 100% 3.75 According to the pedestrian respondents in the 2014 survey, the most important attributes included “adequate street lighting,” “sidewalks in my neighborhood,” “sidewalks clear of debris,” and “sidewalks between neighborhoods.” “Sidewalks in my neighborhood” had a relatively high importance rating in the 2009 and 2012 surveys as well. Attributes with low importance ratings include “street trees,” “low speed motor vehicle traffic,” and “wide sidewalks.” “Street trees” and “wide sidewalks” were lower importance rating attributes in the 2012 survey as well. The following figure displays the mean importance rating assigned to each attribute by pedestrians.

2014 Customer Satisfaction Surveys Transit-Served Market Area Survey
Final Report, Page 3-23
Figure 3-28 Mean Importance Ratings – Pedestrians
3.4.5.2 Attribute Performance The table below presents the results of the performance rating questions.
Figure 3-29 Performance of Pedestrian Attributes Poor Excellent
Attribute 1 2 3 4 5 6 7 Total Mean Marked crosswalks at intersections & other locations 0% 0% 19% 13% 19% 25% 25% 100% 5.25 Sidewalks to & from transit stations & stops 7% 7% 0% 29% 14% 21% 21% 100% 5.25
Sidewalks clear of debris 6% 13% 0% 13% 13% 25% 31% 100% 5.13
Low speed motor vehicle traffic 0% 0% 13% 33% 27% 7% 20% 100% 5.06 Pedestrian signals and push buttons 6% 0% 6% 25% 25% 13% 25% 100% 5.00
Adequate street lighting 0% 0% 38% 6% 13% 25% 19% 100% 4.81
Low volume motor vehicle traffic 7% 7% 7% 43% 14% 14% 7% 100% 4.69
Street trees 23% 8% 15% 23% 8% 8% 15% 100% 4.50
Sidewalks in my neighborhood 19% 6% 6% 6% 25% 13% 25% 100% 4.50
Sidewalks to commercial areas 19% 13% 0% 13% 19% 6% 31% 100% 4.44
Wide sidewalks 20% 7% 7% 20% 13% 13% 20% 100% 4.44 Sidewalks between neighborhoods 13% 13% 6% 25% 13% 13% 19% 100% 4.25 Pedestrian overpasses to cross highways 38% 6% 0% 6% 19% 13% 19% 100% 4.06
1.00
2.00
3.00
4.00
5.00
6.00
7.00 6.69 6.63 6.63 6.56 6.38 6.31 6.19 5.63 5.62 5.56 5.50
5.19
3.75
Extremely Important
Not at all Importan

2014 Customer Satisfaction Surveys Transit-Served Market Area Survey
Final Report, Page 3-24
For 2014, the top-performing attributes were “marked crosswalks at intersections & other locations,” “sidewalks to & from transit stations & stops,” and “sidewalks clear of debris.” “Sidewalks to and from transit stops and stations” and “sidewalks clear of debris” were the top attributes for performance in the 2009 and 2012 surveys. The lowest performers for 2014 include “pedestrian overpasses to cross highways” and “sidewalks between neighborhoods.” These attributes were lowest performers in the 2012 survey as well. The following figure illustrates the mean performance rating for each attribute as rated by pedestrians.
Figure 3-30 Mean Performance Ratings – Pedestrians
1.00
2.00
3.00
4.00
5.00
6.00
7.00
5.25 5.25 5.13 5.06 5.00 4.81 4.69 4.50 4.50 4.44 4.44
4.25 4.06
Excellent
Poor

2014 Customer Satisfaction Surveys Transit-Served Market Area Survey
Final Report, Page 3-25
3.4.5.3 Importance-Performance Analysis Similar to the other modes, importance-performance analysis was conducted on the pedestrian rating results – both calculating the satisfaction index, as well as conducting quadrant analysis. The mean importance and performance ratings and satisfaction indices for the thirteen pedestrian attributes are in the table below.
Figure 3-31 Importance-Performance Ratings and Satisfaction Indices – Pedestrians
Attribute 2014 Mean Importance Rating
2014 Mean Performance
Rating
Satisfaction Index
Street trees 3.75 4.50 120.00
Low speed motor vehicle traffic 5.19 5.06 97.50
Pedestrian signals and push buttons 5.63 5.00 88.81 Marked crosswalks at intersections & other locations 6.19 5.25 84.81
Low volume motor vehicle traffic 5.56 4.69 84.35 Sidewalks to & from transit stations & stops 6.31 5.25 83.20
Wide sidewalks 5.50 4.44 80.73
Sidewalks clear of debris 6.63 5.13 77.38 Pedestrian overpasses to cross highways 5.62 4.06 72.24
Adequate street lighting 6.69 4.81 71.90
Sidewalks to commercial areas 6.38 4.44 69.59
Sidewalks in my neighborhood 6.63 4.50 67.87
Sidewalks between neighborhoods 6.56 4.25 64.79 The attributes with the highest satisfaction rating are “street trees,” “low speed motor vehicle traffic,” and “pedestrian signals and push buttons.” “Street trees” received a high satisfaction index in the 2012 survey as well. The lowest level of satisfaction was attained on “sidewalks between neighborhoods” followed by “sidewalks in my neighborhood” and “sidewalks to commercial areas.” “Sidewalks between neighborhoods” and “sidewalks to commercial areas” had the lowest satisfaction index in the 2012 survey as well. The results of the quadrant analysis are contained in the following figure.
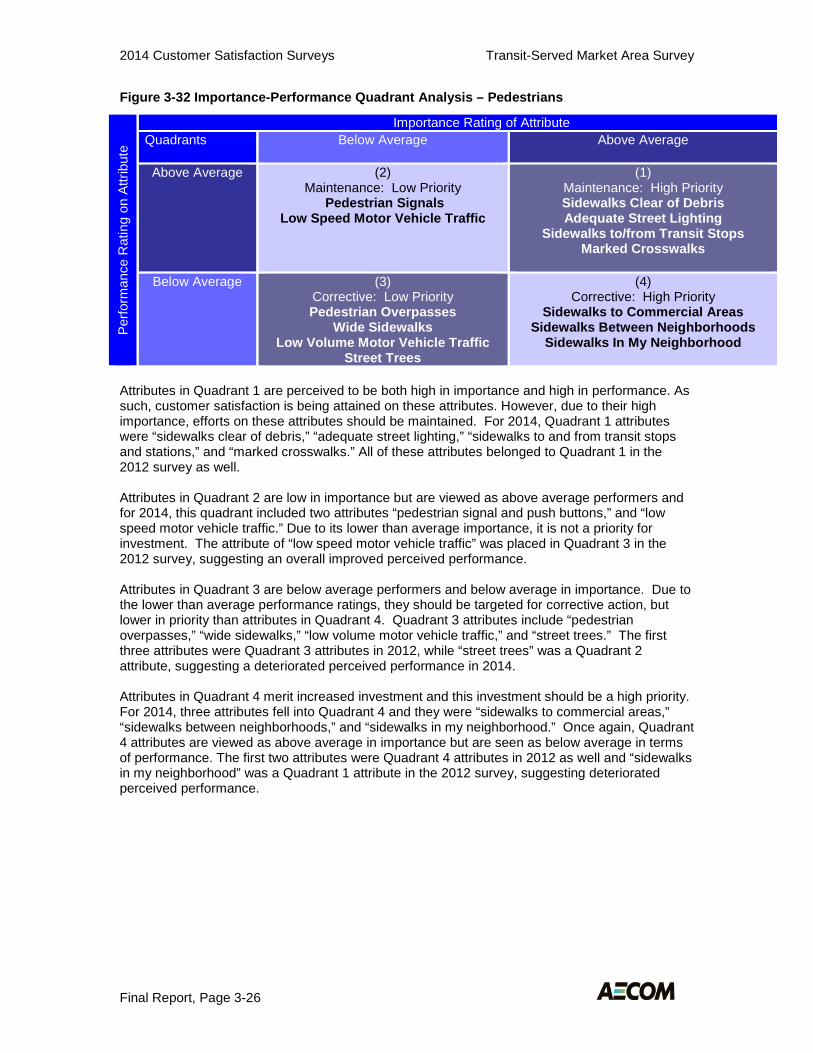
2014 Customer Satisfaction Surveys Transit-Served Market Area Survey
Final Report, Page 3-26
Figure 3-32 Importance-Performance Quadrant Analysis – Pedestrians
Perfo
rman
ce R
atin
g on
Attr
ibut
e Importance Rating of Attribute
Quadrants Below Average
Above Average
Above Average (2) Maintenance: Low Priority
Pedestrian Signals Low Speed Motor Vehicle Traffic
(1) Maintenance: High Priority Sidewalks Clear of Debris Adequate Street Lighting
Sidewalks to/from Transit Stops Marked Crosswalks
Below Average
(3)
Corrective: Low Priority Pedestrian Overpasses
Wide Sidewalks Low Volume Motor Vehicle Traffic
Street Trees
(4) Corrective: High Priority
Sidewalks to Commercial Areas Sidewalks Between Neighborhoods
Sidewalks In My Neighborhood
Attributes in Quadrant 1 are perceived to be both high in importance and high in performance. As such, customer satisfaction is being attained on these attributes. However, due to their high importance, efforts on these attributes should be maintained. For 2014, Quadrant 1 attributes were “sidewalks clear of debris,” “adequate street lighting,” “sidewalks to and from transit stops and stations,” and “marked crosswalks.” All of these attributes belonged to Quadrant 1 in the 2012 survey as well. Attributes in Quadrant 2 are low in importance but are viewed as above average performers and for 2014, this quadrant included two attributes “pedestrian signal and push buttons,” and “low speed motor vehicle traffic.” Due to its lower than average importance, it is not a priority for investment. The attribute of “low speed motor vehicle traffic” was placed in Quadrant 3 in the 2012 survey, suggesting an overall improved perceived performance. Attributes in Quadrant 3 are below average performers and below average in importance. Due to the lower than average performance ratings, they should be targeted for corrective action, but lower in priority than attributes in Quadrant 4. Quadrant 3 attributes include “pedestrian overpasses,” “wide sidewalks,” “low volume motor vehicle traffic,” and “street trees.” The first three attributes were Quadrant 3 attributes in 2012, while “street trees” was a Quadrant 2 attribute, suggesting a deteriorated perceived performance in 2014. Attributes in Quadrant 4 merit increased investment and this investment should be a high priority. For 2014, three attributes fell into Quadrant 4 and they were “sidewalks to commercial areas,” “sidewalks between neighborhoods,” and “sidewalks in my neighborhood.” Once again, Quadrant 4 attributes are viewed as above average in importance but are seen as below average in terms of performance. The first two attributes were Quadrant 4 attributes in 2012 as well and “sidewalks in my neighborhood” was a Quadrant 1 attribute in the 2012 survey, suggesting deteriorated perceived performance.

2014 Customer Satisfaction Surveys Transit-Served Market Area Survey
Final Report, Page 3-27
3.5 Overall Satisfaction Ratings This section of the report discusses the results of the summary modal satisfaction questions posed to each respondent in the Transit-Served Market Area interview at the end of each of the modal importance and performance rating questions.
3.5.1 Summary of Modal Satisfaction Question Results Following the attribute rating questions, each respondent was asked to verbally rate the performance of the current system in meeting their transportation needs for each mode that the respondent had indicated that he/she had used. The respondent was asked to choose a response from “very well”, “somewhat well”, “not too well”, or “not at all” for each question. The results for each mode and for the system as a whole are outlined in the figure below and include comparable data from the previous survey years.
Figure 3-33 Results of the Summary Modal Satisfaction Questions – 2014 Data in Red
Question Very Well Somewhat Well
Not Too Well
Not At All
DK (vol) Year
And overall, how well does the state’s system of roads and hwys meet your needs?
38% 46% 27% 36% 39% 35% 38% 32% 38% 41% 30% 49% 26%
53% 52% 71% 58% 42% 46% 53% 57% 54% 45% 65% 38% 65%
9% 2% 1% 2%
14% 12% 9%
11% 8% 9% 5% 3% 3%
0% 0% 0% 4% 5% 4% 0% 0% 0% 4% 0% 3% 5%
0% 0% 0% 0% 0% 3% 0% 0% 0% 1% 0% 6% 0%
2014 2012 2009 2006 20052004 2003 2002 2001 2000 1999 1998 1997
And overall, how well does the state’s transportation system meet your needs for bicycle trips?
0% 0%
30% 44% 0%
13% 0%
20% 0%
19% 12% 90% 0%
25% 0%
40% 44%
100% 0% 7%
20% 100%
5% 0% 0% 0%
75% 100% 30% 12% 0%
87% 64% 40% 0%
55% 6% 5%
28%
0% 0% 0% 0% 0% 0%
29% 0% 0% 3% 0% 0%
72%
0% 0% 0% 0% 0% 0% 0%
20% 0%
18% 82% 5% 0%
2014 2012 2009 2006 20052004 2003 2002 2001 2000 1999 1998 1997
And overall, how well does the state’s transportation system meet your needs for walking trips?
19% 24% 14% 26% 19% 26% 40% 18% 4%
22% 43% 6%
39%
50% 52% 86% 49% 60% 17% 60% 74% 57% 52% 43% 49% 26%
25% 21% 0%
25% 21% 55% 0% 8% 2%
13% 3% 2%
23%
6% 3% 0% 0% 0% 2% 0% 0% 8% 2%
10% 0%
12%
0% 0% 0% 0% 0% 0% 0% 0%
29% 11% 1%
43% 0%
2014 2012 2009 2006 20052004 2003 2002 2001 2000 1999 1998 1997

2014 Customer Satisfaction Surveys Transit-Served Market Area Survey
Final Report, Page 3-28
Question Very Well Somewhat Well
Not Too Well
Not At All
DK (vol) Year
And as a whole, how well does Delaware’s transportation system meet your travel needs?
25% 33% 19% 19% 15% 33% 22% 18% 30% 19% 26% 42% 21%
48% 51% 78% 42% 47% 47% 62% 53% 57% 43% 62% 26% 49%
18% 7% 2%
15% 17% 10% 9% 15% 7% 14% 9% 6%
18%
7% 9% 0%
22% 21% 10% 7%
14% 5% 6% 2%
17% 9%
0% 0% 2% 2% 0% 0% 0% 0% 1%
18% 1% 9% 3%
2014 2012 2009 2006 2005 2004 2003 2002 2001 2000 1999 1998 1997
Respondents rated the road and highway system rather well in terms of meeting their travel needs as 91% rated the system as meeting their needs either “very well” or “somewhat well.” While these results were slightly lower than 2012 (98%), they were similar to those found in prior surveys. This year 75% of the bicyclists surveyed rated the system as meeting their needs “not too well” This should be assessed cautiously as only 4 respondents reported to have ridden their bicycles for one or more trips in the past week and therefore provide a very small sample size. This year’s result showed some improvement over 2012, when 100% indicated the system was meeting their needs “not too well”. However, the trend is opposite compared to 2005, 2006 and 2009 survey results where majority (88%, 100% and 70% respectively) rated the system favorably as “somewhat well”. Again, this fluctuation was most likely a result of small sample sizes and thus, conclusions cannot be made. This year more than two thirds of pedestrians surveyed, 69%, rated the system “very well” or “somewhat well.” This is similar to the results of the 2012 (74%) and 2006 (75%), but higher than the 2004 results (43%) and lower than the 2009 (100%), 2003 (100%), and 2002 (92%) results. However, like with bicyclists, only a few pedestrians were in the sample in most survey years, and the fluctuation was most likely the result of small sample sizes. All respondents were asked to rate Delaware’s transportation system as a whole, and this year’s results indicate that 73% of respondents think that the transportation system as a whole is meeting their needs “very well” or “somewhat well.” This is lower than the past two surveys (97% in the 2009 and 84% in 2012). The table below shows the data by county of residence.

2014 Customer Satisfaction Surveys Transit-Served Market Area Survey
Final Report, Page 3-29
The results of this series of questions are displayed in the chart below for each mode and overall.
Figure 3-34 Overall Transportation System Satisfaction by County – (2014 Data in Red)
Mode New Castle Kent County Sussex County Year Very or
Somewhat Well
Not Too or Not at All Well
Very or Somewhat
Well
Not Too or Not at All Well
Very or Somewhat
Well
Not Too or Not at All Well
Roads & hwys 91% 100% 100% 95% 80% 79% 91% 87% 91% 85% 98% 93% 91%
9% 0% 0% 5%
20% 17% 9%
13% 9%
15% 2% 8% 9%
92% 96% 35% 94% 93% 85%
100% 92%
100% 92% 90% 93% 96%
8% 4%
65% 6% 7%
15% 0% 8% 0% 8%
10% 8% 4%
90% 98%
100% 90% 26% 14% 0%
18% 11% 11% 15% 3% 9%
10% 2% 0%
10% 74% 86%
100% 82% 90% 89% 85% 97% 91%
2014 2012 2009 2006 2005 2004 2003 2002 2001 2000 1999 1998 1997
Bicycle 0% 0% 0%
100% 100%
0% 0% 0% 0%
30% N/A
100% 0%
100% 100%
0% 0% 0%
100% 100% 100%
0% 70% N/A 0%
100%
N/A N/A 43% 0% 0% 0% 0%
50% 0%
100% 100% 100%
0%
N/A N/A 57% 0% 0% 0%
100% 50% 0% 0% 0% 0%
100%
33% 0%
72% 0% 0% 0% 0% 0% 0%
50% 0%
50% N/A
67% 100% 28%
100% 0%
100% 100% 100% 100% 50%
100% 50% N/A
2014 2012 2009 2006 2005 2004 2003 2002 2001 2000 1999 1998 1997
Pedestrian 50% 60%
100% 75% 80% 33%
100% 100% 100% 79% 89%
100% 63%
50% 40% 0%
25% 20% 67% 0% 0% 0%
22% 11% 0%
37%
33% 67%
100% 100% 75%
100% 100% 57% 0%
50% 66%
100% 100%
67% 33% 0% 0%
25% 0% 0%
43% 100% 50% 33% 0% 0%
89% 83%
100% 67% 25% 50% 0%
28% 20% 62% 0% 0% 0%
11% 17% 0%
33% 75% 50%
100% 72% 80% 38%
100% 100%, 100%
2014 2012 2009 2006 2005 2004 2003 2002 2001 2000 1999 1998 1997
Overall System 74% 78%
100% 67% 62% 82% 85% 69% 91% 60% 94% 73% 70%
26% 22% 0%
33% 38% 18% 15% 31% 9%
40% 6%
27% 30%
75% 78% 51% 65% 58% 77% 82% 78% 71% 80% 80% 73% 82%
25% 22% 49% 35% 42% 23% 18% 22% 29% 20% 20% 27% 18%
77% 91% 59% 45% 41% 39% 27% 14% 17% 25% 18% 10% 9%
23% 9%
41% 55% 59% 61% 73% 86% 83% 75% 81% 90% 91%
2014 2012 2009 2006 2005 2004 2003 2002 2001 2000 1999 1998 1997

2014 Customer Satisfaction Surveys Transit-Served Market Area Survey
Final Report, Page 3-30
3.5.2 Perceptions of Mobility As was done in the previous surveys, in this year’s survey respondents were asked to assess whether or not they believed they had many different travel modes to choose from or alternatively, if they thought they had few options to choose from. In the survey, the following question was posed to all respondents:
“And would you say you have many different travel modes to choose from such as transit, biking and walking to meet your travel needs or would you say you have very few options to choose from?”
If respondents indicated they had “few options,” they were asked, in an open-ended question, what modes they would like access to. As was found in previous years, even though respondents live within a transit-served market area, the response to the first question was mixed. For 2014, 33% indicated that they had “many different modes to choose from,” while 67% indicated that they had “few options.” This was similar to 2012 when 38% indicated that they had “many different modes to choose from,” while 62% indicated that they had “few options.” However, the results were significantly different in the 2009 survey. In 2009, 80% indicated that they had “many different modes to choose from,” while 19% indicated that they had “few options,” and 2% could not say. In terms of county of residence, for 2014, residents residing in Sussex County (29%) and Kent County (29%) were less likely to say that they had “many modes to choose from” as compared to residents from New Castle County (41%). For this survey year, when respondents were asked what modes they would like access to, 40% indicated they would like access to transit or bus. This percentage was exactly similar to 2012 (40%) but slightly lower than the 2009, 2006, 2005, 2004 and 2003 results (58%, 58%, 66%, 53% and 53% respectively). For 2014, 19% indicated they would like access to bicycle paths, 7% indicated wanting access to pedestrian facilities, and 4% indicated wanting improvements relating to “personal auto access needs.” Again these percentages were exact same compared to the 2012 survey.
0%
10%
20%
30%
40%
50%
60%
70%
80%
90%
100%
Auto Bicycle Pedestrian Overall
Very Well Somewhat Well Not too Well Not at all Dk
Figure 3-35 Results of Overall Transportation System Satisfaction Questions

2014 Customer Satisfaction Surveys Transit-Served Market Area Survey
Final Report, Page 3-31
3.6 Transit Awareness As was done in the previous survey years, this section of the report discusses the results of a series of questions regarding transit services. First, respondents were asked about their level of knowledge regarding bus services in their area. Following these questions, respondents were asked a series of questions to ascertain their level of awareness of DART First State and their familiarity with DART First State services. Following this series of questions, respondents that had looked for transit information over the past year were asked whether or not they had used a specific information source and how helpful they found the source.
3.6.1 Knowledge of Bus Services In Area For 2014, 87% of the respondents knew that they had bus service available in their area. This was slightly higher than 2009 (81%) and 2006 (84%) survey results but lower than 2012 (93%). When respondents in 2014 were asked if they had bus service within walking distance of home, 80% indicated that bus service was within walking distance. This percentage was in the similar range compared to the results from previous survey years (79% in 2012, 73% in 2009, 75% in 2006, 67% in 2005, 77% in 2004, 79% in 2003, 84% in 2002, 69% in 2001, 72% in 2000, 86% in 1999, 60% in 1998, and 79% in 1997). Those respondents that indicated there was bus service within walking distance of home were asked if sidewalks were available to reach the bus stop. In 2014, 67% stated that there were sidewalks available to reach the bus stops. This percentage is slightly lower than the 2009 (72%) and 2006 (70%) surveys but higher than 2012 (63%). When asked if they knew the route number(s) of the bus service, 34% of the respondents said they knew the route numbers. This percentage was higher than the 20% in the 2012 survey, 14% in the 2009 survey, but lower than the 35% found in the 2006 survey; however, in 2006 none of these respondents could specify the route number.
3.6.2 Recognition of and Familiarity with DART First State All respondents were asked a series of questions to ascertain the level of awareness of DART or DART First State. The figure below provides the results from these questions.
Figure 3-36 Awareness of DART First State
DART First State
Awareness Level
2014 Percent
2012 Percent
2009 Percent
2006 Percent
2005 Percent
2004 Percent
2003 Percent
2002 Percent
2001 Percent
2000 Percent
Names DART First State (unaided awareness)
60% 50% 73% 93% 71% 86% 93% 94% 87% 75%
Recalls DART First State (aided awareness)
36% 41% 17% 7% 18% 10% 7% 2% 10% 10%
Unaware of DART First State
4% 9% 10% 0% 11% 4% 0% 4% 3% 15%
Total 100% 100% 100% 100% 100% 100% 100% 100% 100% 100%

2014 Customer Satisfaction Surveys Transit-Served Market Area Survey
Final Report, Page 3-32
More than half (60%) of residents in the transit-served market areas of Delaware could name DART or DART First State as the operator of bus services in Delaware. Thirty-six percent (36%) could recognize DART First State when provided the name, and the remaining 4% could not recall or did not know the name DART First State. These results in general showed a lower unaided awareness of the name of DART First State than previous years, but much higher recall recognition of the name of DART First State than previous years, except 2012. Respondents were then asked how familiar they were with DART or DART First State. The results are outlined in the figure below for 2012 as well as the other survey years.
Figure 3-37 How familiar would you say you are with DART or DART First State –do you know a great deal about the agency, some, just a little or not much at all?
Response 2014 Percent
2012 Percent
2009 Percent
2006 Percent
2005 Percent
2004 Percent
2003 Percent
2002 Percent
2001 Percent
2000 Percent
A great deal 8% 9% 4% 6% 6% 14% 12% 2% 8% 4% Some 34% 39% 11% 20% 36% 21% 22% 34% 25% 23% Just a little 31% 24% 13% 23% 31% 21% 14% 21% 21% 27% Not much at all
27% 28% 71% 51% 27% 44% 51% 39% 45% 36%
Dk (vol) 0% 0% 1% 0% 0% 0% 1% 4% 1% 10% The responses to this question indicated that in general the overall level of knowledge about DART or DART First State has been somewhat similar in the past decade with the exception of 2006 and 2009 (2014-42%, 2012-47%, 2009-15%, 2006-26%, 2005-42%, 2004–35%, 2003-34%, 2002–36%, 2001–33%). Respondents were then asked to assess their level of familiarity, on a scale of 1 to 7, about where bus routes go and with how to use the system. The responses are outlined in the following figure for all survey years.
Figure 3-38 Level Familiarity with Bus Routes and How to Use the System, (2014 Data in Red)
Question Not Familiar
2 3 4 5 6 Very Familiar
DK (vol) Year
Where you can pick up buses & where bus routes go?
46% 44% 38% 40% 32% 31% 30% 25% 17% 32% 37% 38% 40%
9% 17% 4%
18% 17% 13% 16% 12% 15% 25% 11% 23% 8%
14% 17% 6% 8%
20% 11% 10% 18% 4% 7%
11% 11% 8%
9% 5%
18% 8% 4%
10% 12% 13% 5% 8% 2% 3% 8%
13% 8%
18% 9%
11% 11% 10% 15% 26% 11% 13% 6% 4%
6% 3%
13% 8% 3% 6% 6% 5%
12% 1% 5% 6% 9%
3% 6% 2% 6% 8% 8%
11% 8% 8% 6% 4% 3% 5%
0% 0% 1% 3% 5%
10% 5% 4%
13% 10% 27% 9%
18%
2014 2012 2009 2006 2005 2004 2003 2002 2001 2000 1999 1998 1997

2014 Customer Satisfaction Surveys Transit-Served Market Area Survey
Final Report, Page 3-33
How to use DART First State buses, pay fares, purchase tickets?
47% 55% 49% 39% 32% 34% 40% 33% 24% 37% 29% 55% 47%
16% 19% 0%
12% 12% 20% 15% 4%
20% 13% 18% 17% 9%
8% 6% 4%
10% 13% 4% 3%
11% 10% 6% 4% 9% 8%
8% 4% 6% 9% 3% 1% 6% 8%
14% 11% 0% 3% 8%
8% 9%
31% 5%
10% 12% 11% 22% 7%
14% 6% 3% 5%
8% 0% 8% 9% 1%
13% 9% 5%
11% 0% 6% 3% 3%
7% 7% 2%
12% 21% 10% 12% 13% 1% 7% 4% 6% 3%
5% 0% 0% 4% 8% 6% 4% 4%
13% 12% 33% 4%
18%
2014 2012 2009 2006 2005 2004 2003 2002 2001 2000 1999 1998 1997
As can be seen in the table above, the level of familiarity regarding bus routes and how to use bus service remains generally low for the transit-served areas of Delaware.
3.6.3 Transit Information Sources Respondents were asked if over the past year, they had looked for information about transit services. For 2014, 33% of respondents indicated that they looked for information on transit services. This was similar to past 2012 (28%), 2009 (22%), 2006 (33%), 2005 (28%), and 2004 (34%) percentage of respondents who looked for information on transit services. Following this question, respondents were asked specifically about whether they had received information about transit from eleven different information sources. For each source used, respondents were then asked how helpful the information was.
Figure 3-39 Sources Used & Helpfulness – (2014 Data in Red)
Information Source Percent Used
Very Helpful
Somewhat Helpful
Not Too Helpful
DK (vol) Year
Printed bus schedules 63% 46% 20% 35% 43% 22% 35% 28% 44% 23% 36% 21% 29%
45% 46% 36% 75% 49% 73% 52% 67% 54% 53% 34% 45% 51%
30% 46% 58% 16% 43% 24% 47% 31% 27% 21% 44% 14% 19%
25% 8% 6% 9% 8% 2% 1% 2%
12% 14% 22% 28% 20%
0% 0% 0% 0% 0% 1% 0% 0% 7%
12% 0%
14% 10%
2014 2012 2009 2006 2005 2004 2003 2002 2001 2000 1999 1998 1997
Newspaper/magazine advertisements
7% 8% 7%
13% 13% 23% 14% 13% 19% 34% 29% 22% 27%
11% 0%
32% 55% 23% 13% 45% 10% 3%
42% 14% 45% 21%
11% 100% 68% 27% 39% 39% 30% 30% 58% 34% 25% 55% 42%
78% 0% 0%
18% 36% 36% 21% 60% 39% 17% 61% 0%
27%
0% 0% 0% 0%
12% 12% 4% 0% 0% 7% 0% 0%
10%
2014 2012 2009 2006 2005 2004 2003 2002 2001 2000 1999 1998 1997

2014 Customer Satisfaction Surveys Transit-Served Market Area Survey
Final Report, Page 3-34
Information Source Percent Used
Very Helpful
Somewhat Helpful
Not Too Helpful
DK (vol) Year
Billboards 7% 4% 2%
13% 11% 20% 20% 24% 13% 25% 29% 15% 16%
11% 0% 0%
27% 24% 28% 16% 4% 0%
51% 28% 21% 18%
0% 100% 58% 26% 45% 52% 64% 51% 49% 45% 28% 20% 7%
89% 0%
42% 47% 10% 17% 17% 35% 51% 4%
43% 58% 71%
0% 0% 0% 0%
21% 3% 3%
10% 0% 0% 1% 0% 5%
2014 2012 2009 2006 2005 2004 2003 2002 2001 2000 1999 1998 1997
Other people 30% 36% 8%
22% 19% 31% 24% 35% 17% 21% 26% 16% 25%
29% 44% 4%
65% 61% 58% 55% 28% 40% 48% 24% 24% 30%
7% 45% 68% 17% 26% 32% 44% 48% 42% 26% 56% 20% 54%
64% 11% 27% 18% 13% 10% 1%
10% 16% 13% 19% 56% 5%
0% 0% 0% 0% 0% 0% 0%
14% 2%
13% 0% 0%
11%
2014 2012 2009 2006 2005 2004 2003 2002 2001 2000 1999 1998 1997
Calls to transit agency 30% 20% 15% 14% 12% 20% 13% 17% 27% 21% 19% 7%
15%
23% 60% 30% 79% 65% 75% 55% 37% 30% 47% 59%
100% 20%
23% 0%
44% 19% 26% 25% 45% 34% 50% 40% 2% 0%
64%
54% 40% 25% 2% 9% 0% 0%
29% 11% 0%
39% 0%
16%
0% 0% 0% 0% 0% 0% 0% 0% 9%
13% 0% 0% 0%
2014 2012 2009 2006 2005 2004 2003 2002 2001 2000 1999 1998 1997
Radio advertisements 11% 4% 1%
16% 10% 18% 14% 10% 9%
26% 29% 12% 16%
10% 0% 0%
17% 48% 26% 24% 5% 2%
30% 28% 26% 33%
10% 100% 100% 32% 34% 45% 55% 60% 59% 49% 21% 50% 48%
80% 0% 0%
44% 18% 28% 21% 33% 6%
21% 50% 24% 17%
0% 0% 0% 7% 0% 1% 0% 2%
33% 0% 0% 0% 2%
2014 2012 2009 2006 2005 2004 2003 2002 2001 2000 1999 1998 1997
Mailings to my home 4% 4% 3% 7%
10% 13% 2%
11% 0%
22% 31% 57% 46% 30%
0% 100% 78% 0% 7%
46% 40%
89% 0% 0%
61% 35% 5%
10%
0% 0% 0% 8% 0% 3%
20%
2014 2012 2009 2006 2005 2004 2003

2014 Customer Satisfaction Surveys Transit-Served Market Area Survey
Final Report, Page 3-35
Information Source Percent Used
Very Helpful
Somewhat Helpful
Not Too Helpful
DK (vol) Year
7% 14% 21% 10% 6% 3%
43% 9%
25% 0%
97% 73%
51% 91% 61% 29% 0%
16%
0% 0%
13% 71% 3%
11%
6% 0% 1% 0% 0% 0%
2002 2001 2000 1999 1998 1997
Transit brochures or publications
48% 28% 7% 8%
17% 15% 7%
15% 22% 25% 10% 7%
17%
41% 58% 30% 87% 33% 42% 92% 68% 18% 41% 9%
53% 44%
24% 28% 60% 4%
51% 34% 8%
25% 82% 38% 59% 47% 35%
35% 14% 0% 4%
16% 21% 0% 5% 0%
20% 29% 0%
21%
0% 0%
10% 5% 0% 3% 0% 2% 0% 1% 4% 0% 0%
2014 2012 2009 2006 2005 2004 2003 2002 2001 2000 1999 1998 1997
Telephone directories 11% 8% 5%
12% 11% 13% 18% 19% 6%
24% 17% 13% 15%
11% 0%
41% 67% 69% 38% 13% 43% 50% 65% 35% 8%
41%
0% 50% 18% 20% 31% 42% 84% 29% 9%
12% 51% 48% 57%
89% 50% 41% 8% 0%
18% 3%
26% 41% 22% 0%
44% 2%
0% 0% 0% 5% 0% 3% 0% 2% 0% 1%
15% 0% 0%
2014 2012 2009 2006 2005 2004 2003 2002 2001 2000 1999 1998 1997
Newspaper articles 7% 8% 1% 9% 9%
11% 18% 8%
14% 24% 36% 22% 20%
10% 50% 0%
36% 36% 27% 33% 11% 19% 76% 23% 31% 26%
10% 50%
100% 40% 40% 47% 59% 78% 62% 24% 28% 56% 56%
80% 0% 0% 0% 0% 3% 4%
11% 19% 0%
48% 13% 18%
0% 0% 0%
24% 24% 23% 4% 0% 0% 0% 1% 0% 0%
2014 2012 2009 2006 2005 2004 2003 2002 2001 2000 1999 1998 1997
DART First State website (added to survey in 2000)
71% 79% 14% 16% 25% 22% 13% 15% 21% 13%
38% 47% 67% 92% 74% 71%
60% 33% 26% 60%
52% 37% 34% 6%
24% 17% 39% 17% 61% 38%
10% 16% 0% 2% 2%
12% 0%
48% 0% 2%
0% 0% 0% 0% 0% 0% 1% 2%
13% 0%
2014 2012 2009 2006 2005 2004 2003 2002 2001 2000
The most used source of information about transit services in the 2014 survey was information obtained from the DART First State website (71%), which is much higher than other forms of

2014 Customer Satisfaction Surveys Transit-Served Market Area Survey
Final Report, Page 3-36
information. The second most used source of information in 2014 was printed bus schedules (63%), which was the most used source of information in the 2009 survey. Most helpful sources of information include: printed bus schedules (45%) and transit brochures and publications (41%).

2014 Customer Satisfaction Surveys Transit-Served Market Area Survey
Final Report, Page 3-37
3.7 Demographics This section of the report provides the responses to the demographic questions contained in the survey. The demographic questions included: residential tenure, motor vehicle availability per household, respondent age, number of persons in household over age 16, residential area type, ethnicity, household income and respondent gender. All tables show response by county, as well as for the state as a whole.
3.7.1 Residential Tenure As an opening question, respondents were asked how long they had lived in Delaware.
Figure 3-40 Residential Tenure
Response Statewide Kent County New Castle County
Sussex County
Less than a year 0% 0% 0% 0% 1 or 2 years 6% 13% 0% 7% 3-5 years 7% 4% 9% 7% 6-10 years 5% 4% 6% 3% 11-20 years 16% 17% 6% 26% 21-30 years 13% 13% 13% 13% More than 30 years 31% 17% 44% 29% All my life 23% 33% 22% 16%
3.7.2 Motor Vehicle Availability Respondents were asked to indicate the number of motor vehicles available to the household. The table below outlines the response.
Figure 3-41 Motor Vehicle Availability
Number of Vehicles
Statewide Kent County New Castle County
Sussex County
None 3% 0% 3% 7% One 29% 38% 25% 26% Two 40% 38% 41% 42% Three 16% 17% 19% 13% Four or more 12% 8% 13% 13%
3.7.3 Respondent Age At the end of the questionnaire, the more sensitive demographic questions were asked. Respondents were asked to indicate an age category. The table below shows the results.
Figure 3-42 Respondent Age
Age Category Statewide Kent County New Castle County
Sussex County
16-29 years 3% 4% 6% 0% 30-49 years 19% 29% 15% 16% 50-64 years 41% 42% 44% 36% 65 or over 37% 25% 35% 48% REF (vol) 0% 0% 0% 0%

2014 Customer Satisfaction Surveys Transit-Served Market Area Survey
Final Report, Page 3-38
3.7.4 Residential Area Type Respondents were asked if they lived in a city/town, a suburban area or a rural area. The response is in the following table.
Figure 3-43 Residential Area Type
Area Type Statewide Kent County New Castle County
Sussex County
City/town 46% 46% 21% 74% Suburban 45% 33% 79% 16% Rural 9% 21% 0% 10% DK (vol) 0% 0% 0% 0%
3.7.5 Ethnicity The survey also included a question on ethnicity. The following depicts the response to this question.
Figure 3-44 Ethnicity
Ethnic group Statewide Kent County
New Castle County
Sussex County
White, Caucasian 83% 79% 77% 94% Black, African American 11% 13% 18% 3% Latino, Hispanic, Mexican American 1% 4% 0% 0% Asian, Pacific Islander 2% 0% 6% 0% Native American, American Indian 0% 0% 0% 0% Other 2% 4% 0% 3% REF/DK (vol) 0% 0% 0% 0%
3.7.6 Number of Persons in Household 16 years or Older The survey also asked for the number of persons in the household that were 16 years of age or older. The response is depicted below.
Figure 3-45 Number of Persons Aged 16 or Older
Number of persons
Statewide Kent County
New Castle Sussex County
One 23% 21% 21% 27% Two 52% 58% 46% 53% Three 16% 17% 21% 10% Four 7% 4% 6% 10% Five or more 2% 0% 6% 0% DK/not sure (vol) 0% 0% 0% 0%

2014 Customer Satisfaction Surveys Transit-Served Market Area Survey
Final Report, Page 3-39
3.7.7 Household Income The survey also asked respondents to indicate a category that contained their household income. The following table provides the data.
Figure 3-46 Household Income
Income Category Statewide Kent County New Castle Sussex County
Less than $15,000 5% 0% 3% 11% $15 - $24,999 5% 8% 3% 4% $25 – $34,999 12% 13% 16% 7% $35 - $49,999 8% 8% 7% 11% $50 - $74,999 24% 33% 23% 18% $75 - $99,999 24% 25% 23% 25% $100 - $149,999 15% 13% 13% 18% $150,000 and over 7% 0% 13% 7% REF/DK (vol) 0% 0% 0% 0%
3.7.8 Respondent Gender Along with the above demographic data, respondent gender was also obtained. The data are below.
Figure 3-47 Respondent Gender
Gender Statewide Kent County New Castle Sussex County Male 55% 46% 65% 52% Female 45% 54% 35% 48%

2014 Customer Satisfaction Surveys Shippers and Carriers Survey
Final Report, Page 4-1
Chapter 4 SHIPPERS AND CARRIERS SURVEY
4.1 Survey Objectives Similar to the General Transportation User Survey and the Transit-Served Market Area Survey, the main objective of this survey, like the previous Shippers and Carriers Surveys, was to provide DelDOT with data to assess the level of customer satisfaction with the current transportation system. However, instead of a random statewide survey of households, this survey collected data on customer satisfaction from businesses that ship, carry, or transport goods in Delaware. Information from this survey can serve as a measure of customer satisfaction that can be monitored over time. Information from the survey can be used as inputs into the Department’s progress monitoring program to assess performance against the goals and objectives of the Statewide Long-Range Transportation Plan. Importantly, the data can help in the development of improvement strategies aimed at the goods movement industry. Customer Satisfaction Surveys have been completed on nearly an annual basis since 1997. Like the previous eleven surveys, the specific information objectives for this survey were: • For businesses using each transportation mode, to ascertain the level of importance of various
service attributes. • For businesses using each transportation mode, to ascertain the level of performance
perceived for each of the service attributes. • For businesses using each transportation mode, to identify the level of satisfaction attained for
each modal service attribute and for the mode overall. • To identify, from each firm’s perspective, the most critical freight issue facing the business.
4.2 Summary of Research Methodology AECOM developed the questionnaire for the baseline customer satisfaction survey conducted in 1997, in consultation with DelDOT’s Division of Planning. Customer Satisfaction Surveys have been completed on nearly an annual basis since 1997. The same questionnaire used in the 2012 survey was used this year to accommodate both telephone as well as Internet interviewing. A separately bound Technical Appendix has been prepared and contains frequency and cross-tabulated tables showing the distribution of response for each question. Like the previous surveys, a market research firm administered the interviews. For this 2014 survey, Abt SRBI conducted the interviews. An SPSS (a statistical software package) computer file was developed to process the survey information by AECOM. The SPSS system enabled AECOM research staff to integrate the survey data so it could be presented in aggregate form. Similar to the 2012 survey, online (Internet) interviews were conducted this year in addition to land line telephone interviews to yield more representative results. A total of 97 interviews were completed among companies that ship, transport or carry goods through Delaware. The sample frame for this survey was Delaware’s International Registration Plan (IRP) database augmented with railroads and Port of Wilmington tenants and steamship lines listings provided by DelDOT. One thousand one hundred and eighty (1,180) advance postcards were mailed to the above frame on April 30, 2014. Printed in black and white, one side had the Delaware logo the following message:
The State of Delaware is conducting an important survey and has commissioned Abt SRBI to conduct the survey. You might be called in the coming days. Please participate, as your opinion matters.

2014 Customer Satisfaction Surveys Shippers and Carriers Survey
Final Report, Page 4-2
Telephone interviewing began one week later (May 5, 2014), to allow the postcards to arrive. Data collection ended on May 20, 2014. In total, 97 respondents participated in the study. Of these, 87 were shippers and 10 were carriers. Attempts to complete a survey with a Class 1 railroad were unsuccessful despite repeated attempts, even to the point of providing the contact information for DelDOT personnel who could vouch for the legitimacy of the survey. Completed interviews were approximately 12 minutes in duration on average.
4.3 Relative Importance & Performance of Modal Attributes The next section of this chapter provides an in-depth examination of the importance and performance of various service attributes by mode. Like previous surveys, businesses were asked to rate the importance of each attribute on a 7-point scale (a rating of 1 meant “not at all important” while a rating of 7 meant “extremely important”), and then rate the current performance of the attribute on a 7-point scale (a rating of 1 meant “poor” while a 7 meant “excellent”). Percentage distributions are presented first and then the average scores are presented for each attribute and are ordered from most important to least important or highest performance to lowest. Of note, businesses were only asked to rate the attributes for each mode the business uses to ship, carry, or transport goods.
4.3.1 Those Who Ship, Carry or Transport by Truck When asked, “Does your firm ship, carry or transport goods or materials by truck using Delaware’s highway system?” ninety-four percent (94%) of the sample indicated that their company moved goods by truck in Delaware. This percentage is slightly higher than the previous survey’s results (89% in 2012). These businesses were then asked how many tons of freight were shipped or received via truck in Delaware. Fifty-seven percent (57%) of the respondents could not specify the tonnage. This was lower than the 2012 survey results (62%). Of the 42 respondents who could specify the amount of tonnage they shipped by truck on Delaware’s highway system, four (10%) shipped 100 or less tons; seven (17%) shipped between 101 and 1,000 tons; nineteen (45%) shipped between 1,001 and 50,000 tons; eight (19%) shipped between 50,001 and 500,000 tons; and four (10%) shipped over 500,000 tons.
4.3.1.1 Attribute Importance Those businesses that reported using Delaware’s highways for the shipment of goods were asked to rate the importance of 18 service-related attributes on a 1 to 7 scale. The results are displayed in the table below.

2014 Customer Satisfaction Surveys Shippers and Carriers Survey
Final Report, Page 4-3
Figure 4-1 Importance of Highway Attributes Not at all
important Extremely
Important
Attribute 1 2 3 4 5 6 7 Total Mean
Hwys free from congestion 0% 0% 0% 3% 9% 8% 80% 100% 6.64 Wide intersections with turning lanes 1% 1% 3% 3% 13% 17% 61% 100% 6.21 Well-planned sequencing & timing of traffic lights 3% 0% 1% 7% 12% 13% 63% 100% 6.18
Hwys w/ wide travel lanes 3% 0% 3% 2% 17% 12% 62% 100% 6.14 Hwy & freeway interchanges with ramps that trucks can negotiate 7% 0% 1% 3% 8% 16% 66% 100% 6.13
Timely snow plowing and salting 6% 1% 2% 9% 4% 12% 66% 100% 6.04
Hwys w/ few weight restrictions 3% 0% 4% 6% 17% 16% 54% 100% 5.97 A transportation system with interconnected hwys 7% 1% 0% 2% 19% 13% 58% 100% 5.97 Info on when to expect delays & road closings 3% 1% 6% 6% 12% 16% 57% 100% 5.96
Hwys w/ wide, paved shoulders 3% 2% 1% 8% 18% 12% 56% 100% 5.93 Hwys w/ few weight restricted bridges 7% 0% 2% 5% 19% 16% 52% 100% 5.83
Hwy system with few toll roads 10% 0% 4% 2% 14% 14% 54% 100% 5.72 Hwys with few height restricted overpasses 16% 3% 5% 5% 21% 14% 37% 100% 5.01 Well-staffed and efficient weigh stations 23% 1% 3% 11% 24% 10% 28% 100% 4.55 Rest areas that can accommodate trucks 34% 8% 8% 6% 13% 6% 26% 100% 3.77 Hwy system w/good access to the Port of Wilmington 49% 8% 2% 4% 14% 1% 21% 100% 3.16 Hwy system w/good access to freight railroads 48% 13% 7% 7% 6% 2% 18% 100% 2.87 Hwy system w/good airport access 58% 11% 6% 6% 4% 2% 13% 100% 2.48 Among businesses using Delaware’s highways to move goods, the most important attributes were: • Highways free from congestion; • Wide intersections with turning lanes; • Well planned sequencing and timing of traffic lights; • Highways with wide travel lanes and; • Highways and freeway interchanges with ramps that trucks can negotiate.
These results were similar to the results of previous surveys. All the important attributes listed above were also important in the 2012 survey except for “well planned sequencing and timing of traffic lights”, which moved up from 12th rank in terms of importance in the 2012 survey to the 3rd rank in the 2014 survey. The least important attributes are: • Highway system with good airport access; • Highway system with good access to freight railroads; and • Highway system with good access to the Port of Wilmington. These attributes were rated least important attributes in the 2012 survey as well as prior surveys.

2014 Customer Satisfaction Surveys Shippers and Carriers Survey
Final Report, Page 4-4
The figure below illustrates the mean importance of each of the above 18 attributes for businesses using trucks to move goods on Delaware’s highways.
Figure 4-2 Mean Importance Ratings – Businesses Using Trucks to Move Goods
4.3.1.2 Attribute Performance In addition to asking companies how important each attribute was, this survey, like the other surveys, also asked companies how well the current transportation system was performing on each attribute. Again, a seven-point scale was used, with a “1” meaning “poor” and a “7” meaning “excellent”. The results are displayed in the table below.
1
2
3
4
5
6
7 6.64
6.21 6.18 6.14 6.13 6.04 5.97 5.97 5.96 5.93 5.83 5.72
5.01
4.55
3.77
3.16 2.87
2.48
Extremely Important
Not at all Important

2014 Customer Satisfaction Surveys Shippers and Carriers Survey
Final Report, Page 4-5
Figure 4-3 Performance of Highway Attributes Poor Excellent
Attribute 1 2 3 4 5 6 7 Total Mean Hwys with few height restricted overpasses 1% 1% 1% 9% 42% 29% 17% 100% 5.44 A transportation system with interconnected hwys 3% 2% 1% 9% 32% 36% 16% 100% 5.36 Hwy system w/good access to the Port of Wilmington 7% 2% 6% 4% 33% 22% 27% 100% 5.27 Well-staffed and efficient weigh stations 7% 3% 7% 7% 26% 27% 23% 100% 5.18 Hwy & freeway interchanges with ramps that trucks can negotiate 2% 1% 8% 12% 39% 20% 18% 100% 5.14
Timely snow plowing and salting 3% 6% 3% 16% 23% 31% 18% 100% 5.14 Hwys w/ few weight restricted bridges 3% 0% 3% 18% 44% 24% 9% 100% 5.09
Hwys w/ wide travel lanes 2% 2% 2% 24% 37% 23% 10% 100% 4.99
Hwy system w/good airport access 14% 0% 4% 4% 37% 26% 16% 100% 4.91
Hwys w/ few weight restrictions 6% 1% 4% 14% 44% 23% 8% 100% 4.87
Hwy system with few toll roads 3% 5% 9% 18% 31% 25% 9% 100% 4.80 Rest areas that can accommodate trucks 12% 5% 13% 6% 28% 15% 21% 100% 4.63 Info on when to expect delays & road closings 5% 6% 13% 22% 24% 17% 13% 100% 4.59 Hwy system w/good access to freight railroads 9% 4% 4% 23% 34% 19% 8% 100% 4.55 Wide intersections with turning lanes 7% 3% 9% 25% 32% 16% 9% 100% 4.54
Hwys w/ wide, paved shoulders 6% 3% 13% 23% 31% 19% 6% 100% 4.50
Hwys free from congestion 3% 14% 17% 24% 26% 11% 6% 100% 4.11 Well-planned sequencing & timing of traffic lights 12% 11% 17% 17% 31% 12% 2% 100% 3.88
Similar to the other surveys, the performance ratings were lower than the importance ratings. In this survey, the attributes with the highest average performance were: • Highways with few height restricted overpasses; • A transportation system with interconnected highways; and • Highway system with good access to the Port of Wilmington. The attributes of “highways with few height restricted overpasses” and “a transportation system with interconnected highways” were among the top attributes in terms of performance among previous Shippers and Carriers surveys as well.
The lowest rated attributes in terms of performance are: • Well-planned sequencing and timing of traffic lights; • Highways free from congestion; • Highways with wide paved shoulders; and, • Wide intersections with turning lanes. “Well-planned sequencing and timing of traffic lights,” and “highways free from congestion,” were the two lowest rated attributes for performance in the 2009 and 2012 surveys as well, and were among the lowest rated attributes in other past surveys.

2014 Customer Satisfaction Surveys Shippers and Carriers Survey
Final Report, Page 4-6
The following displays the mean performance ratings.
Figure 4-4 Mean Performance Ratings - Businesses Using Trucks to Move Goods
4.3.1.3 Importance-Performance Analysis By comparing attributes across both dimensions (importance and performance), one can separate the attributes customers feel are very important and are currently less satisfied with their performance from those attributes of less importance. Importance-performance analysis is designed to take into account that not all shortfalls in service quality are of equal concern to customers. When an attribute that is considered to be of primary importance falls short of a desirable level of performance, it is of greater concern than when a peripheral attribute is unsatisfactory in terms of performance. Thus, projects to address or improve shortfalls in a critical area (an attribute rated as high in importance) would be given a higher priority by the public than projects proposed to rectify shortfalls in areas of marginal importance (attributes rated low in importance). To develop the satisfaction index, the mean rating for both importance and performance were computed for each attribute. The satisfaction index is then calculated by computing the ratio between the mean performance rating and the mean importance rating for each attribute. This index demonstrates the balance between importance and performance on an attribute in the minds of customers. The higher the value of the satisfaction index, the higher the level of customer satisfaction on that attribute.
1.00
2.00
3.00
4.00
5.00
6.00
7.00
5.44 5.36 5.27 5.18 5.14 5.14 5.09 4.99 4.91 4.87 4.80 4.63 4.59 4.56 4.54 4.50
4.11 3.88
Excellent
Poor

2014 Customer Satisfaction Surveys Shippers and Carriers Survey
Final Report, Page 4-7
Figure 4-5 Importance-Performance Ratings and Satisfaction Indices - Businesses Using Trucks to Move Goods
Attribute
2014 Mean Importance
Rating
2014 Mean Performance
Rating Satisfaction
Index Hwy system w/good airport access 2.48 4.91 197.98 Hwy system w/good access to the Port of Wilmington 3.16 5.27 166.77
Hwy system w/good access to freight railroads 2.87 4.55 158.54
Rest areas that can accommodate trucks 3.77 4.63 122.81
Well-staffed and efficient weigh stations 4.55 5.18 113.85
Hwys with few height restricted overpasses 5.01 5.44 108.58
A transportation system with interconnected hwys 5.97 5.36 89.78
Hwys w/ few weight restricted bridges 5.83 5.09 87.31
Timely snow plowing and salting 6.04 5.14 85.10
Hwy system with few toll roads 5.72 4.80 83.92 Hwy & freeway interchanges with ramps that trucks can negotiate 6.13 5.14 83.85
Hwys w/ few weight restrictions 5.97 4.87 81.57
Hwys w/ wide travel lanes 6.14 4.99 81.27
Info on when to expect delays & road closings 5.96 4.59 77.01
Hwys w/ wide, paved shoulders 5.93 4.50 75.89
Wide intersections with turning lanes 6.21 4.54 73.11
Well-planned sequencing & timing of traffic lights 6.18 3.88 62.78
Hwys free from congestion 6.64 4.11 61.90 As reflected in the figure above, very high levels of satisfaction of over 100 were obtained on six attributes. These six attributes were “a highway system with good airport access,” “a highway system with good access to the Port of Wilmington,” “a highway system with good access to freight railroads,” “rest areas that can accommodate trucks,” “well-staffed and efficient weight stations,” and “highways with few height restricted overpasses.” These attributes were among the top attributes in the 2009 and 2012 surveys as well. The lowest levels of satisfaction were found for the attributes “highways free from congestion,” “well-planned sequencing and timing of traffic lights,” and “wide intersections with turning lanes.” These findings were similar to the findings in 2012 Shippers and Carriers survey and similar to the other Customer Satisfaction surveys conducted. Similar to the analysis provided on the results of the other surveys, quadrant analysis was conducted on the results of this survey as well. Quadrant analysis can assist policy makers in service program decisions by placing attributes along two dimensions -- the importance of attributes to customers and their performance. Having these two dimensions of customer evaluation allows for the creation of four performance quadrants as can be seen below.

2014 Customer Satisfaction Surveys Shippers and Carriers Survey
Final Report, Page 4-8
Figure 4-6 Importance – Performance Quadrants Pe
rform
ance
Rat
ing
on A
ttrib
ute
Importance Rating of Attribute Quadrants Below Average
Above Average
Above Average (2) Maintenance: Low Priority
(1) Maintenance: High Priority
Below Average
(3) Corrective: Low Priority
(4) Corrective: High Priority
The attributes falling in Quadrant 4 are above the mean of all importance ratings and are below the mean of all performance ratings (thus, above average importance and below average performance). The services or attributes that fall within this quadrant should be the highest priority for corrective action. Services or attributes that fall within Quadrant 3 are both below average importance and below average performance. These services or attributes also need corrective action, but immediate attention is not required since these attributes are less important to the customers. These items should be monitored and receive attention or investment after the more important attributes in Quadrant 4 are addressed. The attributes in Quadrant 2 are above average in performance and below average in importance. Attributes in this quadrant need only maintenance action and are of the lowest priority. Items that fall within Quadrant 1 are above average in importance and above average in performance. Although these services or attributes are doing well currently, they are high priority for maintenance action and should not be neglected. These are salient issues to customers and need to be followed closely. The table below shows the eighteen attributes asked of firms that use trucks for shipping goods.
Figure 4-7 Importance – Performance Quadrant Analysis - Businesses Using Trucks to Move Goods
Perfo
rman
ce R
atin
g on
Attr
ibut
e
Importance Rating of Attribute Quadrants Below Average
Above Average
Above Average
(2) Maintenance: Low Priority
Good Airport Access Port of Wilmington Access
Height-Restricted Overpasses Efficient Weigh Stations
(1) Maintenance: High Priority Interconnected Highways
Highway Interchange Ramps Snow Plowing & Salting
Few Weight Restricted Roads Few Weight Restricted Bridges Hwys with Wide Travel Lanes
Below Average
(3) Corrective: Low Priority
Access to Freight Railroads Rest Areas for Trucks
(4) Corrective: High Priority Information on Delays
Wide, Paved Shoulders Sequencing & Timing of Signals Highways Free from Congestion
Few Toll Roads Wide Intersection Turning Lanes
The attributes in Quadrant 1 represent areas which firms using trucks to move goods regard as important, and on which Delaware received high marks. Although the attributes are perceived to be

2014 Customer Satisfaction Surveys Shippers and Carriers Survey
Final Report, Page 4-9
fairing well now, they are a high priority for maintenance and should not be neglected. These are attributes that are important to companies that ship or move goods by truck and are salient issues that these companies are attentive to. The attributes “interconnected highways,” “having highways with ramps that trucks can negotiate,” “timely snow plowing and salting,” “having few weight-restricted roads,” “having few weight restricted bridges,” and “highways with wide travel lanes” were located in Quadrant 1 in the 2014 survey. The first four attributes were placed in Quadrant 1 in the 2012 survey as well. The remaining two attributes of “having few weight restricted bridges,” and “highways with wide travel lanes” were Quadrant 4 attributes in the 2012 survey, which indicates perceived performance improvement in those two attributes. The attributes in Quadrant 2 are those that companies that ship by truck rate high in performance but low in importance. Therefore, while these attributes need some maintenance action, they are not as salient to companies that ship by truck as the items in Quadrant 1. The attributes “good airport access,” “good access to the Port of Wilmington”, “highways with few height-restricted overpasses,” and “well-staffed and efficient weighing stations” fell into Quadrant 2. In terms of improvement strategies or investments, these are attributes of lowest priority. The first three attributes were Quadrant 2 attributes in the 2012 survey as well. “Well-staffed and efficient weighing stations” was a Quadrant 3 attribute in 2012, indicating performance improvement in 2014 in that attribute. Two attributes fell into Quadrant 3 for 2014: “access to freight railroads,” and “rest areas that accommodate trucks.” These attributes have lower than average performance ratings and lower than average importance ratings. Both these attributes were placed in Quadrant 3 in the 2012 survey as well. Quadrant 4 represents attributes rated high in importance but low in performance, thus representing attributes with lowest customer satisfaction. These attributes are the ones that should be the highest priority to receive corrective action or additional investment. For firms that ship by truck, there were six such attributes in this quadrant this year: “having information on when to expect delays and road closings,” “wide, paved shoulders,” “well-planned sequencing and timing of traffic signals,” “highways free from congestion,” “highway system with few toll roads,” and “wide intersections with turning lanes.” All the attributes except “highway system with few toll roads” were Quadrant 4 attributes in the 2012 survey as well. “Highway system with few toll roads” was placed in Quadrant 1 in the 2012 survey.
4.3.2 Rail Freight This section of the report provides an examination of the importance and performance data obtained from businesses that ship, carry, or transport goods or materials by rail or rail intermodal. Of those businesses surveyed, twelve companies out of the total 97 surveyed (12%) indicated that they shipped, carried or transported goods by rail. This response was similar to the 2012 survey (10%) but higher than the 2009 survey (4% in 2009). Due to the very small sample size, the data from this group should be used with caution. Similar to the companies that shipped via truck, companies shipping by rail were asked to specify the tonnage shipped by rail freight over the past year. One company was not able to specify tonnage. Of the 11 respondents that could specify tonnage, one (9%) transported 100 tons or less; two (18%) transported between 101 and 1,000 tons; six (55%) transported between 1,001 and 50,000 tons; one (9%) transported between 50,001 and 500,000 tons; and one (9%) transported over 500,000 tons.
4.3.2.1 Attribute Importance The table below illustrates the importance assigned to the fourteen service attributes asked of the nine companies that shipped or carried goods or materials by rail freight.

2014 Customer Satisfaction Surveys Shippers and Carriers Survey
Final Report, Page 4-10
Figure 4-8 Importance of Rail Freight Attributes Not at all
important Extremely
Important
Attribute 1 2 3 4 5 6 7 Total Mean Good condition track, roadbed & ROW for Class 1 railroads 0% 8% 0% 0% 17% 8% 67% 100% 6.17 Competitive service & attention from shortline railroads 0% 9% 9% 0% 0% 18% 64% 100% 6.00 Good condition track, roadbed & ROW for shortline railroads 8% 0% 8% 0% 0% 17% 67% 100% 6.00 Competitive service & attention from Class 1 railroads 9% 0% 9% 0% 9% 9% 64% 100% 5.82 Having competitive services to businesses off main lines 0% 25% 0% 0% 17% 8% 50% 100% 5.33
Having multi-track rail operations available 17% 17% 8% 17% 0% 8% 33% 100% 4.25
Having rail-to-truck commodity transfer points 33% 0% 17% 0% 8% 8% 33% 100% 4.08
Minimal conflicts with rail services 46% 0% 0% 9% 9% 0% 36% 100% 3.82
Eliminating clearance restrictions for high-cube or double-stack operations 33% 17% 8% 0% 8% 8% 25% 100% 3.58 Having bulk intermodal distribution facilities & services available 33% 8% 17% 0% 17% 17% 8% 100% 3.42 Having intermodal container-on-flat-car facilities & services 36% 9% 9% 9% 18% 9% 9% 100% 3.27 Good condition track, roadbed & ROW for the railroad serving the Port of Wilmington 50% 8% 8% 0% 0% 8% 25% 100% 3.17 Having numerous interchange points on the rail freight system 33% 33% 0% 11% 0% 11% 11% 100% 2.89 Having intermodal trailer-on-flat-car facilities & services 58% 8% 8% 17% 0% 0% 8% 100% 2.25
Among the companies that transport via rail, the most important attributes were:
• Good condition track, roadbed & ROW for Class 1 railroads; • Competitive service & attention from shortline railroads; and, • Good condition track, roadbed & ROW for shortline railroads.
”Good condition track, roadbed & ROW for Class 1 railroads” and “good condition track, roadbed & ROW for shortline railroads” received high importance ratings in the 2006, 2009 and 2012 surveys as well. The least important attributes were:
• Having intermodal trailer-on-flat-car facilities and services; • Having numerous interchange points on the rail freight system and, • Good condition track, roadbed & ROW for the railroad serving the Port of Wilmington.
“Having intermodal trailer-on-flat-car facilities & services” and “good condition track, roadbed & ROW for the railroad serving the Port of Wilmington” were rated least important attributes in the 2012 survey as well. The figure below illustrates the mean importance of each of the above fourteen attributes among the rail freight users.

2014 Customer Satisfaction Surveys Shippers and Carriers Survey
Final Report, Page 4-11
Figure 4-9 Mean Importance Ratings - Businesses Using Rail Freight to Move Goods
1
2
3
4
5
6
7
6.17 6.00 6.00
5.82
5.33
4.25 4.08
3.82 3.58 3.42
3.27 3.17 2.89
2.25
Extremely
Not at all Important

2014 Customer Satisfaction Surveys Shippers and Carriers Survey
Final Report, Page 4-12
4.3.2.2 Attribute Performance The table below provides the performance rating data obtained in the survey from the rail freight users.
Figure 4-10 Performance of Rail Freight Attributes Poor Excellent
Attribute 1 2 3 4 5 6 7 Total Mean
Good condition track, roadbed & ROW for Class 1 railroads 0% 0% 0% 20% 20% 40% 20% 100% 5.60 Having competitive services to businesses off main lines 0% 0% 22% 11% 44% 11% 11% 100% 4.78 Competitive service & attention from Class 1 railroads 0% 10% 10% 10% 40% 30% 0% 100% 4.70 Good condition track, roadbed & ROW for shortline railroads 0% 10% 10% 20% 30% 20% 10% 100% 4.70 Having numerous interchange points on the rail freight system 0% 0% 44% 11% 22% 0% 22% 100% 4.44 Competitive service & attention from shortline railroads 0% 11% 11% 22% 33% 22% 0% 100% 4.44
Minimal conflicts with rail services 11% 11% 22% 11% 11% 33% 0% 100% 4.00
Good condition track, roadbed & ROW for the railroad serving the Port of Wilmington 25% 13% 13% 0% 13% 25% 13% 100% 3.88 Having rail-to-truck commodity transfer points 13% 13% 25% 0% 38% 13% 0% 100% 3.75 Having bulk intermodal distribution facilities & services available 13% 25% 13% 13% 25% 13% 0% 100% 3.50
Having multi-track rail operations available 30% 0% 40% 0% 20% 10% 0% 100% 3.10
Having intermodal container-on-flat-car facilities & services 33% 17% 17% 0% 17% 17% 0% 100% 3.00 Eliminating clearance restrictions for high-cube or double-stack operations 33% 17% 17% 0% 33% 0% 0% 100% 2.83 Having intermodal trailer-on-flat-car facilities & services 20% 0% 60% 20% 0% 0% 0% 100% 2.80
The top-performing attributes for 2014 were “good condition track, roadbed and Row for Class 1 railroads,” “having competitive services to businesses off main lines,” “competitive service and attention from Class 1 railroads,” and “good condition track, roadbed and Row for Class 1 railroads.” “Good condition track, roadbed & ROW for Class 1 railroads” was one of the highest rated performance attributes in the 2012 survey as well. The lowest rated attributes for performance were “having intermodal trailer-on-flat car facilities & services,” “eliminating clearance restrictions on high-cube or double stack operations,” “having intermodal container-on-flat-car facilities & services,” and “having multi-track rail operations available.” “Having intermodal container-on-flat-car facilities & services” and “having intermodal trailer-on-flat car facilities & services” were among the lowest rated performance attributes in the 2006, 2009 and 2012 surveys as well. The figure below depicts the mean performance ratings for each attribute.

2014 Customer Satisfaction Surveys Shippers and Carriers Survey
Final Report, Page 4-13
Figure 4-11 Mean Performance Ratings - Businesses Using Rail Freight to Move Goods
1.00
2.00
3.00
4.00
5.00
6.00
7.00
5.60
4.78 4.70 4.70
4.44 4.44
4.00 3.88 3.75 3.50
3.10 3.00 2.83 2.80
Excellent
Poor
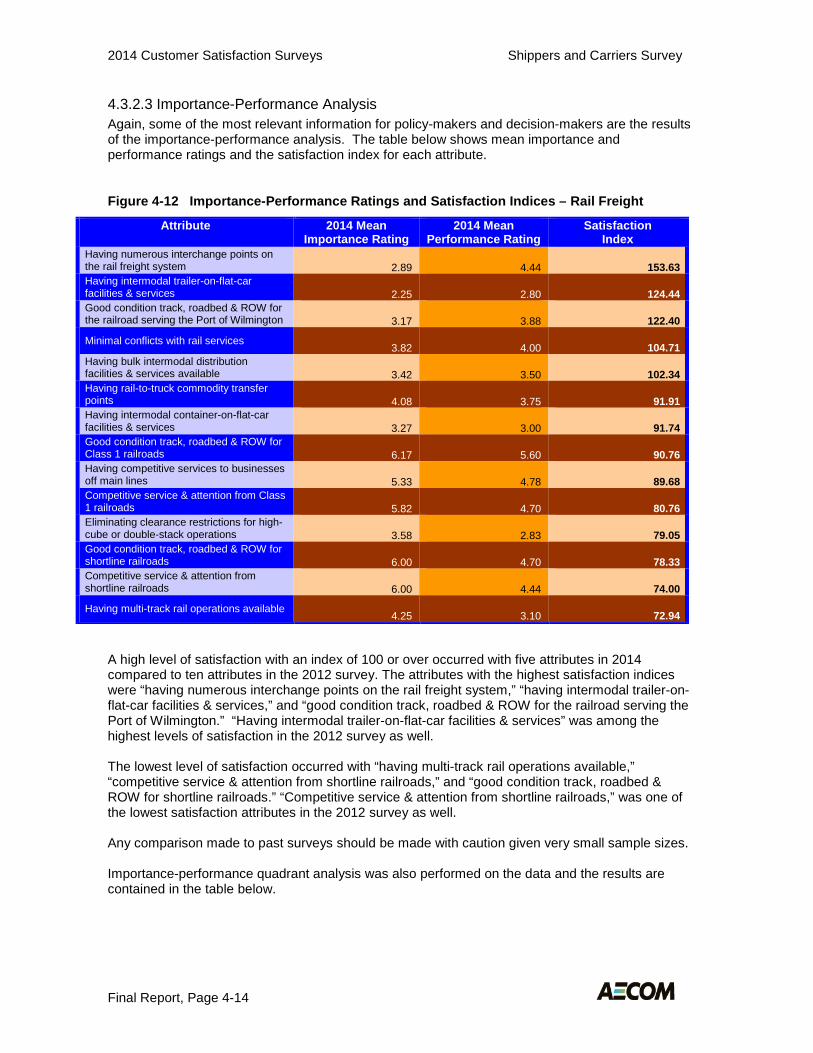
2014 Customer Satisfaction Surveys Shippers and Carriers Survey
Final Report, Page 4-14
4.3.2.3 Importance-Performance Analysis Again, some of the most relevant information for policy-makers and decision-makers are the results of the importance-performance analysis. The table below shows mean importance and performance ratings and the satisfaction index for each attribute.
Figure 4-12 Importance-Performance Ratings and Satisfaction Indices – Rail Freight
Attribute 2014 Mean Importance Rating
2014 Mean Performance Rating
Satisfaction Index
Having numerous interchange points on the rail freight system 2.89 4.44 153.63 Having intermodal trailer-on-flat-car facilities & services 2.25 2.80 124.44 Good condition track, roadbed & ROW for the railroad serving the Port of Wilmington 3.17 3.88 122.40
Minimal conflicts with rail services 3.82 4.00 104.71
Having bulk intermodal distribution facilities & services available 3.42 3.50 102.34 Having rail-to-truck commodity transfer points 4.08 3.75 91.91 Having intermodal container-on-flat-car facilities & services 3.27 3.00 91.74 Good condition track, roadbed & ROW for Class 1 railroads 6.17 5.60 90.76 Having competitive services to businesses off main lines 5.33 4.78 89.68 Competitive service & attention from Class 1 railroads 5.82 4.70 80.76 Eliminating clearance restrictions for high-cube or double-stack operations 3.58 2.83 79.05 Good condition track, roadbed & ROW for shortline railroads 6.00 4.70 78.33 Competitive service & attention from shortline railroads 6.00 4.44 74.00
Having multi-track rail operations available 4.25 3.10 72.94
A high level of satisfaction with an index of 100 or over occurred with five attributes in 2014 compared to ten attributes in the 2012 survey. The attributes with the highest satisfaction indices were “having numerous interchange points on the rail freight system,” “having intermodal trailer-on-flat-car facilities & services,” and “good condition track, roadbed & ROW for the railroad serving the Port of Wilmington.” “Having intermodal trailer-on-flat-car facilities & services” was among the highest levels of satisfaction in the 2012 survey as well. The lowest level of satisfaction occurred with “having multi-track rail operations available,” “competitive service & attention from shortline railroads,” and “good condition track, roadbed & ROW for shortline railroads.” “Competitive service & attention from shortline railroads,” was one of the lowest satisfaction attributes in the 2012 survey as well. Any comparison made to past surveys should be made with caution given very small sample sizes. Importance-performance quadrant analysis was also performed on the data and the results are contained in the table below.

2014 Customer Satisfaction Surveys Shippers and Carriers Survey
Final Report, Page 4-15
Figure 4-13 Importance – Performance Quadrant Analysis – Rail Freight Pe
rform
ance
Rat
ing
on A
ttrib
ute
Importance Rating of Attribute Quadrants Below Average
Above Average
Above Average
(2) Maintenance: Low Priority
Numerous Interchange Points Minimal Passenger Rail Conflicts
(1) Maintenance: High Priority
Good Service - Class 1 Good Service - Shortline
Good Conditions - Class 1 Good Service off Main Lines Good Condition - Shortline
Below Average
(3) Corrective: Low Priority
Intermodal Container-on-Flat-Car Intermodal Trailer-on-Flat-Car
Eliminating Clearance Restrictions Good Conditions - Port of Wilmington
Bulk Intermodal Distribution Points Multi-Track Rail Operations
Rail-to-Truck Commodity Transfer
(4) Corrective: High Priority
For 2014, five attributes belonged to Quadrant 1: “competitive service and attention from Class 1 railroads,” “competitive service and attention from shortline railroads,” “good condition track, roadbed and ROW for Class 1 railroads,” “having competitive services to businesses off main lines,” and “good condition track, roadbed and ROW for shortline railroads”. “Good condition track, roadbed and ROW for shortline railroads” was in Quadrant 4 in the 2012 survey while all other attributes shown in Quadrant 1 were Quadrant 1 attributes in 2012 and prior surveys as well. Quadrant 2 attributes are those that users of rail freight rate high in performance but low in importance. Thus relative to other quadrants, attributes in this quadrant are of lower priority for maintenance action or investment, as these attributes are not as salient to rail freight users as the items in Quadrants 1 or 4. In 2014, there were two attributes in Quadrant 2: “having numerous interchange points on the rail freight system,” and “minimal conflicts with passenger rail services.” In the 2012 survey, “having numerous interchange points on the rail freight system,” was in Quadrant 4, and “minimal conflicts with passenger rail services” was in Quadrant 3. As can be seen, Quadrant 3 contained maximum number of attributes (7) for 2014, and they all had lower than average performance and importance ratings. “Having intermodal container-on-flat-car facilities and services,” “having intermodal trailer-on-flat car facilities and services,” “eliminating clearance restrictions for high-cube or double-stack operations,” and “good condition track, roadbed & ROW for the railroad serving the Port of Wilmington” were in this quadrant in the 2009 and 2012 surveys as well while the remaining three belonged to Quadrant 3 in the 2012 survey. Quadrant 4 represents attributes rated high in importance, but low in performance and as a result are considered attributes with the lowest levels of customer satisfaction. These attributes should be of the highest priority to receive corrective action or investment. This year no attributes belonged to this quadrant. Given the small sample size, the data should be used with caution and any change from 2012 or prior surveys cannot be deemed significant.

2014 Customer Satisfaction Surveys Shippers and Carriers Survey
Final Report, Page 4-16
4.3.3 Air Freight In 2014, only one (1) of the businesses surveyed indicated that they shipped, carried or transported goods or materials by air freight. This is similar to the results of previous Shippers and Carriers surveys where a very low number of businesses indicated that they shipped goods by air (the range has been from 0 to 6 businesses any given survey year). The results in this section of the report provide information on the importance and performance ratings on nine attributes asked of companies shipping by air freight.
4.3.3.1 Attribute Importance The table below illustrates the importance assigned to the nine service attributes asked of the companies that shipped or carried goods or materials by air freight.
Figure 4-14 Importance of Air Freight Attributes Not at all
important Extremely
Important
Attribute 1 2 3 4 5 6 7 Total Mean
Highway access to airports 0% 0% 0% 0% 0% 0% 100% 100% 7.00
Highways free from congestion near airports 0% 0% 0% 0% 0% 0% 100% 100% 7.00 Having competitive service and attention by air cargo carriers 0% 0% 0% 0% 0% 0% 100% 100% 7.00
Having space available for aircraft storage 0% 0% 0% 0% 0% 0% 100% 100% 7.00
Having facilities available for aircraft maintenance 0% 0% 0% 0% 0% 0% 100% 100% 7.00
Having fuel available at the airport 0% 0% 0% 0% 0% 0% 100% 100% 7.00
Reasonable parking and/or landing fees for aircraft 0% 0% 0% 0% 0% 0% 100% 100% 7.00 Having warehousing/storage terminals available near airports 0% 0% 0% 0% 0% 0% 100% 100% 7.00 Having numerous airports available for air cargo service 0% 0% 0% 0% 100% 0% 0% 100% 5.00
Eight (8) of the nine attributes in the survey were given the highest importance rating of seven (7) for the 2014 survey by the one respondent indicating usage of air freight. The results should not be used for any comparison with previous surveys due to the insignificant sample size. The attributes with the lowest importance rating for the 2014 survey was “having numerous airports available for air cargo service.” Again, no comparison can be performed to previous survey results due to the extremely small sample size.

2014 Customer Satisfaction Surveys Shippers and Carriers Survey
Final Report, Page 4-17
Figure 4-15 Mean Importance Ratings - Businesses Using Air Freight to Move Goods
4.3.3.2 Attribute Performance The table below provides the performance rating data obtained in the survey from the air freight users.
Figure 4-16 Performance of Air Freight Attributes Poor Excellent
Attribute 1 2 3 4 5 6 7 Total Mean
Highway access to airports 100% 0% 0% 0% 0% 0% 0% 100% 1.00
Highways free from congestion near airports 100% 0% 0% 0% 0% 0% 0% 100% 1.00 Having competitive service and attention by air cargo carriers 100% 0% 0% 0% 0% 0% 0% 100% 1.00
Having space available for aircraft storage 100% 0% 0% 0% 0% 0% 0% 100% 1.00
Having facilities available for aircraft maintenance 100% 0% 0% 0% 0% 0% 0% 100% 1.00
Having fuel available at the airport 100% 0% 0% 0% 0% 0% 0% 100% 1.00
Having numerous airports available for air cargo service 100% 0% 0% 0% 0% 0% 0% 100% 1.00 Reasonable parking and/or landing fees for aircraft 100% 0% 0% 0% 0% 0% 0% 100% 1.00 Having warehousing/storage terminals available near airports 100% 0% 0% 0% 0% 0% 0% 100% 1.00
1.00
2.00
3.00
4.00
5.00
6.00
7.007.00 7.00 7.00 7.00 7.00 7.00 7.00 7.00
5.00
Extremely Important
Not at all Important

2014 Customer Satisfaction Surveys Shippers and Carriers Survey
Final Report, Page 4-18
All nine attributes received the exact same performance level rating of 1 (poor performance) based on the one respondent using air freight. These results indicate that the business surveyed for air freight services was not happy with the performance of the air freight system in Delaware; these results cannot be used for doing comparisons with previous surveys due to an inadequate sample size.
Figure 4-17 Mean Performance Ratings - Businesses Using Air Freight to Move Goods
1.00
2.00
3.00
4.00
5.00
6.00
7.00
1.00 1.00 1.00 1.00 1.00 1.00 1.00 1.00 1.00
Excellent
Poor

2014 Customer Satisfaction Surveys Shippers and Carriers Survey
Final Report, Page 4-19
4.3.3.3 Importance-Performance Analysis Again, some of the most relevant information for policy-makers and decision-makers are the results of the importance-performance analysis. The table below shows mean importance and performance ratings and the satisfaction index for each attribute.
Figure 4-18 Importance-Performance Ratings and Satisfaction Indices – Air Freight
Attribute 2014 Mean Importance Rating
2014 Mean Performance Rating
Satisfaction Index
Having numerous airports available for air cargo service 5.00 1.00 20.00
Highway access to airports 7.00 1.00 14.29
Highways free from congestion near airports 7.00 1.00 14.29 Having competitive service and attention by air cargo carriers 7.00 1.00 14.29
Having space available for aircraft storage 7.00 1.00 14.29
Having facilities available for aircraft maintenance 7.00 1.00 14.29
Having fuel available at the airport 7.00 1.00 14.29
Reasonable parking and/or landing fees for aircraft 7.00 1.00 14.29 Having warehousing/storage terminals available near airports 7.00 1.00 14.29
All nine attributes showed a low satisfaction level based on the lone respondent in the air freight category. Importance-performance quadrant analysis was also performed on the data and the results are contained in the table below. Given the inadequate sample size, the data should not be used for any comparison.

2014 Customer Satisfaction Surveys Shippers and Carriers Survey
Final Report, Page 4-20
Figure 4-19 Importance – Performance Quadrant Analysis – Air Freight Pe
rform
ance
Rat
ing
on A
ttrib
ute
Importance Rating of Attribute Quadrants Below Average
Above Average
Above Average
(2) Maintenance: Low Priority
Numerous Airports Available
(1) Maintenance: High Priority
Highway Access to Airports Warehousing Available near
Airports Reasonable Parking/Landing Fees Competitive Service and Attention
Congestion Fuel Available
Aircraft Maintenance Aircraft Storage
Below Average
(3) Corrective: Low Priority
(4) Corrective: High Priority
Eight of the nine attributes belonged in Quadrant 1 in 2014. These results cannot be used for any comparison or assessment due to the insignificant sample size. Unlike Quadrant 1, Quadrant 2 attributes received a lower than average importance rating. Due to their high performance and low importance, these attributes are of low priority but require maintenance to ensure their continued high performance. For the 2014 survey, the attribute “Having numerous airports available for air cargo service” was placed in this quadrant. Attributes in Quadrant 3 require continued attention and maintenance due to their lower than average performance ratings. No attributes belonged to this quadrant in 2014. Quadrant 4 represents attributes that received a high rating in importance and low rating in performance. These attributes should be of the highest priority for additional investment and attention. No attributes belonged to this quadrant in 2014. Once again it should be noted that these air freight survey results should not be used for any comparison due to the inadequate sample size
4.3.4 Port of Wilmington In this year’s survey 19 businesses out of the total 97 surveyed (20%) stated that they shipped or received goods through the Port of Wilmington. This result is similar to the 2012 survey (19 businesses – 23%). Five of the nineteen businesses interviewed were not able to specify the tonnage shipped through the Port of Wilmington. Of the thirteen businesses that could specify how much tonnage they shipped via the Port of Wilmington, four (29%) shipped 100 tons or less; one (7%) shipped between 101 and 1,000 tons; three (21%) shipped between 1,001 and 50,000 tons; three (21%) shipped between 50,001 and 500,000 tons; and three (21%) shipped over 500,000 tons.

2014 Customer Satisfaction Surveys Shippers and Carriers Survey
Final Report, Page 4-21
4.3.4.1 Attribute Importance The twenty businesses were asked to rate the importance of fifteen different attributes on a scale of 1 to 7, with a “1” being “not at all important” and a “7” being “extremely important”. The results are outlined in the following table showing the percentage distribution of response for each rating along with the mean importance as computed for each attribute. Attributes are ordered in the table by mean importance value.
Figure 4-20 Importance of Port of Wilmington Attributes Not at all important Extremely
Important
Attribute 1 2 3 4 5 6 7 Total Mean Good hwy access to the Port of Wilmington 0% 5% 0% 5% 11% 16% 63% 100% 6.21 Good internal traffic flow at the Port 0% 5% 0% 11% 5% 11% 68% 100% 6.21
Reasonable port fees 5% 5% 0% 5% 5% 16% 63% 100% 6.00
Good condition dock facilities 5% 5% 11% 0% 5% 5% 68% 100% 5.84
Having deep and wide berths 11% 6% 6% 0% 6% 6% 67% 100% 5.67 Competitive service & attention by shippers 17% 0% 0% 11% 17% 6% 50% 100% 5.28
Having deep channels 26% 0% 5% 5% 0% 11% 53% 100% 4.95 Having bulk cargo unloaders available 32% 11% 5% 0% 11% 5% 37% 100% 4.11 Having gantry cranes w/100 ton capacity 42% 5% 0% 11% 0% 5% 37% 100% 3.84
Open storage facilities available 37% 11% 0% 16% 0% 0% 37% 100% 3.79 Good rail access to the Port of Wilmington 42% 11% 0% 5% 5% 5% 32% 100% 3.63 Having 40-ton mobile cranes available 42% 11% 5% 0% 11% 0% 32% 100% 3.53 Ample cranes of various types for trans-loading containers 47% 5% 5% 0% 11% 0% 32% 100% 3.47 Having warehousing space available 42% 16% 0% 5% 5% 5% 26% 100% 3.37 Having cold storage facilities available 53% 11% 0% 0% 5% 5% 26% 100% 3.16 The most important attributes in this year’s survey are “good highway access to the Port of Wilmington” and “good internal traffic flow at the Port.” Both the attributes were among the most important attributes in the 2012 survey as well. The least important attributes were “having cold storage facilities available and” “having warehousing space available.” These attributes were among the average rated attributes of importance in the 2012 survey. The mean importance rating for each attribute is displayed graphically in the figure below.

2014 Customer Satisfaction Surveys Shippers and Carriers Survey
Final Report, Page 4-22
Figure 4-21 Mean Importance Ratings – Port of Wilmington
1.00
2.00
3.00
4.00
5.00
6.00
7.00
6.21 6.21 6.00 5.84
5.67
5.28 4.95
4.11 3.84 3.79
3.63 3.53 3.47 3.37 3.16
Extremely Important
Not at all Important

2014 Customer Satisfaction Surveys Shippers and Carriers Survey
Final Report, Page 4-23
4.3.4.2 Attribute Performance Just as other users were asked to rate the performance provided by the mode used, Port of Wilmington users were also asked to rate the performance of each of the fifteen attributes. The following table provides the performance ratings associated with each attribute.
Figure 4-22 Performance of Port of Wilmington Attributes Not at all important Extremely
Important
Attribute 1 2 3 4 5 6 7 Total Mean Good hwy access to the Port of Wilmington 0% 0% 6% 6% 22% 33% 33% 100% 5.83 Having cold storage facilities available 0% 0% 0% 11% 22% 44% 22% 100% 5.78
Open storage facilities available 0% 0% 0% 9% 36% 36% 18% 100% 5.64 Having warehousing space available 0% 0% 0% 20% 20% 40% 20% 100% 5.60 Having gantry cranes w/100 ton capacity 0% 13% 0% 13% 13% 50% 13% 100% 5.25 Competitive service & attention by shippers 0% 0% 0% 31% 15% 54% 0% 100% 5.23
Reasonable port fees 7% 0% 0% 21% 21% 29% 21% 100% 5.21 Having 40-ton mobile cranes available 0% 0% 10% 10% 40% 30% 10% 100% 5.20 Having bulk cargo unloaders available 11% 11% 0% 11% 11% 11% 44% 100% 5.11
Good condition dock facilities 0% 0% 8% 33% 25% 17% 17% 100% 5.00 Good rail access to the Port of Wilmington 0% 9% 9% 9% 36% 27% 9% 100% 4.91 Good internal traffic flow at the Port 0% 0% 13% 13% 56% 13% 6% 100% 4.88 Ample cranes of various types for trans-loading containers 0% 0% 36% 9% 9% 36% 9% 100% 4.73
Having deep channels 0% 0% 18% 27% 18% 36% 0% 100% 4.73
Having deep and wide berths 0% 9% 18% 18% 18% 27% 9% 100% 4.64 “Good highway access to the Port of Wilmington,” “having cold storage facilities available,” and “having open storage facilities available” were the highest rated attributes in terms of performance in this year’s survey. “Good highway access to the Port of Wilmington” and “having cold storage facilities available” were the highest rated attributes in terms of performance in the 2012 and 2012 survey as well. “Having open storage facilities available” was also one of the high ranking attributes in 2012. “Having deep and wide berths,” “having deep channels,” and “ample cranes of various types for trans-loading containers” were the lowest rated attributes for performance in this year’s survey. “Having deep channels” and “ample cranes of various types for trans-loading containers” were the lowest rating attributes in the 2012 survey as well. “Having deep and wide berths” was also one of the lower rating attributes in 2012.

2014 Customer Satisfaction Surveys Shippers and Carriers Survey
Final Report, Page 4-24
Figure 4-23 Mean Performance Ratings – Port of Wilmington
As with the other modes, importance-performance analysis was conducted on the data. The results are discussed in the next section.
1.00
2.00
3.00
4.00
5.00
6.00
7.00
5.83 5.78 5.64 5.60
5.25 5.23 5.21 5.20 5.11 5.00 4.91 4.88 4.73 4.73 4.64
Extremely Important
Not at all

2014 Customer Satisfaction Surveys Shippers and Carriers Survey
Final Report, Page 4-25
4.3.4.3 Importance-Performance Analysis The table below shows for each of the fifteen attributes the mean importance rating, the mean performance rating, and the satisfaction index.
Figure 4-24 Importance – Performance Ratings and Satisfaction Indices –Port of Wilmington
Attribute 2014 Mean Importance Rating
2014 Mean Performance Rating
Satisfaction Index
Having cold storage facilities available 3.16 5.78 182.91
Having warehousing space available 3.37 5.60 166.17
Open storage facilities available 3.79 5.64 148.81 Having 40-ton mobile cranes available 3.53 5.20 147.31 Having gantry cranes w/100 ton capacity 3.84 5.25 136.72 Ample cranes of various types for trans-loading containers 3.47 4.73 136.31 Good rail access to the Port of Wilmington 3.63 4.91 135.26 Having bulk cargo unloaders available 4.11 5.11 124.33 Competitive service & attention by shippers 5.28 5.23 99.05
Having deep channels 4.95 4.73 95.56 Good hwy access to the Port of Wilmington 6.21 5.83 93.88
Reasonable port fees 6.00 5.21 86.83
Good condition dock facilities 5.84 5.00 85.62
Having deep and wide berths 5.67 4.64 81.83
Good internal traffic flow at the Port 6.21 4.88 78.58 As reflected in the figure above, very high levels of satisfaction with indices of over 100 were obtained on nine of the fifteen attributes in 2014 compared to four attributes in 2012. For these attributes the average performance exceeds the average importance ratings. The highest levels of satisfaction were seen for the attributes of “having cold storage facilities available,” “having warehousing space available,” and “open storage facilities available”. “Having cold storage facilities available” and “open storage facilities available” had one of the highest satisfaction indices in 2012 as well. The lowest level of satisfaction occurred on the attributes “good internal traffic flow at the Port” and “having deep and wide berths.” These attributes had lower satisfaction indices in the 2009 and 2012 surveys as well. Quadrant analysis was conducted to help prioritize improvements for users of the Port of Wilmington. The results are in the table below.
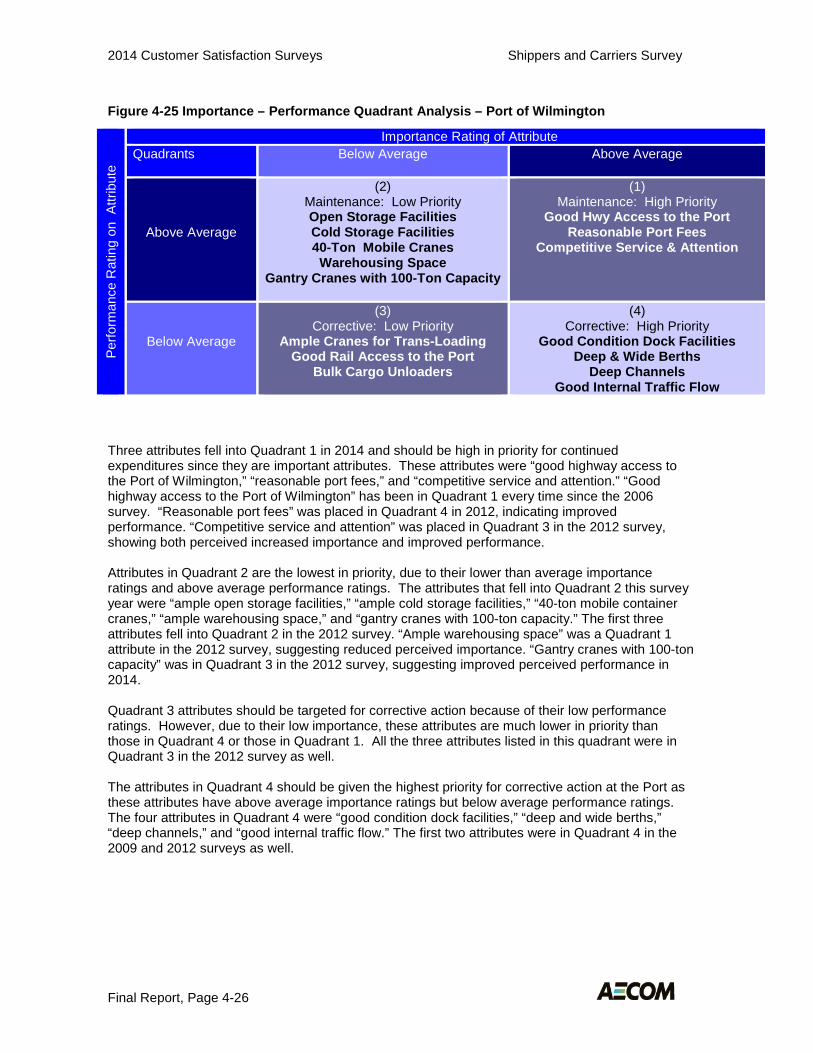
2014 Customer Satisfaction Surveys Shippers and Carriers Survey
Final Report, Page 4-26
Figure 4-25 Importance – Performance Quadrant Analysis – Port of Wilmington Pe
rform
ance
Rat
ing
on A
ttrib
ute
Importance Rating of Attribute Quadrants Below Average
Above Average
Above Average
(2) Maintenance: Low Priority Open Storage Facilities Cold Storage Facilities 40-Ton Mobile Cranes Warehousing Space
Gantry Cranes with 100-Ton Capacity
(1) Maintenance: High Priority
Good Hwy Access to the Port Reasonable Port Fees
Competitive Service & Attention
Below Average
(3) Corrective: Low Priority
Ample Cranes for Trans-Loading Good Rail Access to the Port
Bulk Cargo Unloaders
(4) Corrective: High Priority
Good Condition Dock Facilities Deep & Wide Berths
Deep Channels Good Internal Traffic Flow
Good Internal Traffic Flow
Three attributes fell into Quadrant 1 in 2014 and should be high in priority for continued expenditures since they are important attributes. These attributes were “good highway access to the Port of Wilmington,” “reasonable port fees,” and “competitive service and attention.” “Good highway access to the Port of Wilmington” has been in Quadrant 1 every time since the 2006 survey. “Reasonable port fees” was placed in Quadrant 4 in 2012, indicating improved performance. “Competitive service and attention” was placed in Quadrant 3 in the 2012 survey, showing both perceived increased importance and improved performance. Attributes in Quadrant 2 are the lowest in priority, due to their lower than average importance ratings and above average performance ratings. The attributes that fell into Quadrant 2 this survey year were “ample open storage facilities,” “ample cold storage facilities,” “40-ton mobile container cranes,” “ample warehousing space,” and “gantry cranes with 100-ton capacity.” The first three attributes fell into Quadrant 2 in the 2012 survey. “Ample warehousing space” was a Quadrant 1 attribute in the 2012 survey, suggesting reduced perceived importance. “Gantry cranes with 100-ton capacity” was in Quadrant 3 in the 2012 survey, suggesting improved perceived performance in 2014. Quadrant 3 attributes should be targeted for corrective action because of their low performance ratings. However, due to their low importance, these attributes are much lower in priority than those in Quadrant 4 or those in Quadrant 1. All the three attributes listed in this quadrant were in Quadrant 3 in the 2012 survey as well. The attributes in Quadrant 4 should be given the highest priority for corrective action at the Port as these attributes have above average importance ratings but below average performance ratings. The four attributes in Quadrant 4 were “good condition dock facilities,” “deep and wide berths,” “deep channels,” and “good internal traffic flow.” The first two attributes were in Quadrant 4 in the 2009 and 2012 surveys as well.

2014 Customer Satisfaction Surveys Shippers and Carriers Survey
Final Report, Page 4-27
4.4 Overall Satisfaction Ratings This section of the report discusses the results of the summary modal satisfaction question and other general questions posed to each business.
4.4.1 Summary Modal Satisfaction Question Results Prior to the attribute rating questions, each business was asked to rate the overall performance of the current system in meeting their transportation needs for each mode that the company had indicated that they used. Businesses were asked to choose a response from “excellent”, “good”, “fair”, or “poor” for each question. The results for each mode and for the system as a whole are outlined in the figure below. Bolded red percentages are the results from the 2014 survey and the other percentages listed are for prior survey years.
Figure 4-26 Summary Modal Satisfaction Questions – (2014 Data in Red)
Question Excellent Good Fair Poor DK (vol) Year And overall, how would you rate Delaware’s system of roads and highways for moving goods?
16% 23% 8%
15% 8% 9% 6% 8% 4% 7%
10% 14% 12%
64% 52% 56% 49% 57% 51% 55% 61% 67% 64% 63% 42% 59%
18% 22% 30% 30% 25% 31% 28% 22% 22% 21% 20% 27% 22%
2% 3% 7% 6% 10% 9%
11% 7% 7% 7% 7%
14% 7%
0% 0% 0% 0% 0% 0% 0% 2% 0% 1% 0% 2% 0%
2014 2012 2009 2006 2005 2004 2003 2002 2001 2000 1999 1998 1997
And overall, how would you rate the rail freight system in Delaware for moving goods?
25% 25% 25% 0% 0%
13% 50% 40% 43% 25% 13% 0% 0%
50% 50% 75% 100% 25% 50% 17% 20% 29% 25% 0%
50% 60%
17% 24% 0% 0% 0%
25% 33% 0%
28% 25% 38% 50% 30%
8% 0% 0% 0% 25% 0% 0%
20% 0%
13% 13% 0%
10%
0% 1% 0% 0% 50% 12% 0%
20% 0%
12% 38% 0% 0%
2014 2012 2009 2006 2005 2004 2003 2002 2001 2000 1999 1998 1997
And overall, how would you rate the air freight system in Delaware for moving goods?
0% 0% 0%
67% 0% 0%
50% 0% 0% 0% 0%
25% 0%
0% 100% 0% 0% 0%
17% 0% 0%
100% 50% 50% 50% 60%
50% 0% 0% 0% 0% 0%
50% 0% 0% 0% 0%
25% 20%
50% 0% 0%
33% 0%
17% 0% 0% 0% 0% 0% 0% 0%
0% 0% 0% 0% 0%
66% 0% 0% 0%
50% 50% 0%
20%
2014 2012 2009 2006 20052004 2003 2002 2001 2000 1999 1998 1997

2014 Customer Satisfaction Surveys Shippers and Carriers Survey
Final Report, Page 4-28
And overall, how would you rate the Port of Wilmington for moving goods?
11% 10% 30% 0% 0%
37% 0%
34% 33% 5%
25% 18% 46%
56% 50% 40% 100% 60% 38% 80% 22% 22% 74% 46% 46% 55%
33% 35% 10% 0% 40% 0%
20% 33% 45% 10% 21% 27% 0%
0% 5%
20% 0% 0% 0% 0%
11% 0% 0% 4% 9% 0%
0% 0% 0% 0% 0%
25% 0% 0% 0%
11% 4% 0% 0%
2014 2012 2009 2006 2005 2004 2003 2002 2001 2000 1999 1998 1997
Overall, how well do you think Delaware’s transportation system is meeting your company’s goods movement needs?
30% 33% 24% 32% 30% 24% 25% 28% 34% 19% 35% 26% 33%
69% 64% 64% 55% 58% 58% 66% 63% 56% 66% 55% 55% 56%
1% 3%
11% 10% 8%
10% 9% 3% 7% 8% 5%
14% 6%
0% 0% 1% 0% 4% 4% 0% 2% 1% 2% 2% 5% 4%
0% 0% 0% 3% 0% 4% 0% 4% 2% 5% 3% 1% 1%
2014 2012 2009 2006 20052004 2003 2002 2001 2000 1999 1998 1997

2014 Customer Satisfaction Surveys Shippers and Carriers Survey
Final Report, Page 4-29
All businesses were asked to rate Delaware’s transportation system as a whole, and the results showed that most businesses feel the system meets their transportation needs. In 2014, 99% of businesses stated that the system is meeting their needs “very well” or “somewhat well,” and this is higher than all prior survey years (97% in 2012, 88% in 2009, 87% in 2006, 88% in 2005, 82% in 2004, 91% in 2003, 91% in 2002, 90% in 2001, 85% in 2000, 90% in 1999, 81% in 1998 and 89% in 1997). At the end of the attribute rating questions, businesses were asked if the state should do “more,” “less” or “about the same” to improve the movement of goods for each mode used. The results are in the following table with data from the 2014 survey shown in bold, and with comparable data from the prior surveys also listed.
Figure 4-27 Should the state do more, less or about the same to improve the movement of goods …? (2014 Data in Red)
Mode More Less About the Same
DK (vol) Year
Roads and Highways 63% 52% 70% 59% 64% 74% 68% 58% 59% 67% 63% 63% 60%
1% 2% 1% 2% 1% 0% 0% 1% 0% 1% 0% 3% 0%
36% 46% 28% 34% 33% 26% 30% 34% 41% 30% 34% 33% 37%
0% 0% 1% 5% 2% 0% 2% 7% 0% 2% 3% 1% 3%
2014 2012 2009 2006 2005 2004 2003 2002 2001 2000 1999 1998 1997
Rail Freight 67% 56% 75% 100% 75% 63%
100% 60% 71% 37% 25% 50% 70%
8% 0% 0% 0% 0% 0% 0%
20% 0% 0% 0% 0% 0%
25% 44% 25% 0% 25% 25% 0% 0%
29% 38% 25% 50% 10%
0% 0% 0% 0% 0%
12% 0%
20% 0%
25% 50% 0%
10%
2014 2012 2009 2006 2005 2004 2003 2002 2001 2000 1999 1998 1997
Air Freight 100% 0% 0%
67% 0%
33% 100%
0% 100%
0% 50% 25% 40%
0% 0% 0% 0% 0% 0% 0% 0% 0% 0% 0% 0% 0%
0% 99% 0% 0% 0% 0% 0% 0% 0%
25% 25% 50% 60%
0% 1% 0%
33% 0%
67% 0% 0% 0%
75% 25% 25% 0%
2014 2012 2009 2006 2005 2004 2003 2002 2001 2000 1999 1998 1997

2014 Customer Satisfaction Surveys Shippers and Carriers Survey
Final Report, Page 4-30
4.5 Biggest Freight Problems Facing Businesses Near the end of the questionnaire, in an open-ended question, businesses were asked about the biggest freight issue or problem that is facing their business. The responses to this question were coded by hand and are displayed in the table below.
Figure 4-28 Biggest Freight Issue/Problem Facing Your Business
Issue or Problem Mentioned
2014 Percent
2012 Percent
2009 Percent
2006 Percent
2005 Percent
2004 Percent
2003 Percent
2002 Percent
2001 Percent
Roadway congestion 26% 20% 35% 32% 18% 35% 43% 26% 15%
Taxes, registrations, tolls, fees (and fuel costs for 2003 and prior surveys)
10% 3% 12% 20% 2% 10% 6% 14% 24%
Poor condition of roadways
16% 8% 17% 13% 5% 7% 5% 2% 3%
Roadway construction 0% 0% 4% 7% 8% 4% 4% 1% 6% Traffic signals 3% 6% 2% 4% 8% 0% 20% 21% 2% Roadway connectivity 0% 0% 0% 3% 3% 1% 3% 1% 2% Weigh scales 0% 0% 5% 1% 4% 1% 3% 2% 2% Weight restrictions 12% 18% 0% 1% 4% 2% 2% 3% 8% Roadway geometrics 0% 0% 0% 1% 0% 1% 5% 3% 6% Fuel Costs 9% 7% 1% 0% 11% 13% N/A N/A N/A Other comment (various)
23% 25% 24% 0% 14% 9% 0% 0% 12%
Concern with other driver behavior*
0% 0% 0% 0% 1% 0% 9% 27% 4%
Nothing mentioned 1% 13% 0% 18% 22% 17% 0% 0% 16% For 2014, the most frequently mentioned responses were “roadway congestion” and “poor condition of roadways”, as well as offering some other varied comment. “Roadway congestion” was the most frequently mentioned response in all prior surveys.
4.6 About the Businesses Similar to the other surveys, classification questions were posed to the businesses to provide descriptive information about the companies participating in the survey. The results are discussed in this section.
4.6.1 Length of Time Doing Business in Delaware All firms, at the beginning of the interview, were asked how long they had been doing business in the state. The response is depicted below.
Figure 4-29 Length of Time Doing Business in Delaware
Time Period Percent Less than 1 year 0% 1-2 years 0% 3-5 years 0% 6-10 years 1% More than 10 years 99% DK (Vol) 0%

2014 Customer Satisfaction Surveys Shippers and Carriers Survey
Final Report, Page 4-31
As was found in the previous surveys, for the 2014 survey the majority of firms surveyed have been doing business in Delaware for over ten years.
4.6.2 Goods Shipped or Carried All firms were asked, in an open-ended question, what goods or materials the company primarily shipped or carried. The open-ended responses were then coded by hand. The table below depicts the response to this question.
Figure 4-30 Goods or Materials Shipped or Carried
Primary Goods or Materials Shipped or Carried
Percent
Building and/or construction materials 26% Machinery & heavy equipment 16% Combination of goods/materials 0% Food 12% Agricultural products 7% Automobiles & Automobile parts 0% Waste/Trash/Recyclables 3% Other 28% Petroleum products 0% Metals 5% Household goods 1% Retail goods 0% Forest products 0% Paper products 0% Chemical and pharmaceuticals 2% Mail 0% As can be seen in the above table, the range of goods is diverse. The predominant goods shipped or carried were building/construction materials and machinery/heavy equipment, similar to previous survey years.
4.6.3 Number of Business Locations Companies were also asked how many business locations they have in Delaware. The response is in the table below. These results were similar to the previous survey years, with one location being the predominant response.
Figure 4-31 Number of Business Locations
Number of Locations Percent One 79% Two 12% Three 4% Four or more 5% Varied work locations 0% DK (Vol) 0%

2014 Customer Satisfaction Surveys Comparison of Results
Final Report Page 5-1
Chapter 5 COMPARISON OF RESULTS
5.1 Introduction An important objective of this study was to ascertain customer satisfaction with the transportation system across various user groups and to compare these results with data collected in previous survey years. This section of the report compares and contrasts the customer satisfaction data that were collected in each of the surveys conducted in 2014 and compares the results to prior survey data.
5.2 Satisfaction Index As was done in the previous survey years, it is possible to develop an index or overall measure from the importance-performance data that were collected in the 2014 survey effort. To develop the satisfaction index, the overall mean ratings for both importance and performance were computed for each user group. An index of customer satisfaction can then be calculated by computing the ratio between the overall mean performance rating to the overall mean importance rating for each user group. The higher the value of the satisfaction index is, the greater the level of customer satisfaction with that mode. The value of the satisfaction index exceeds 100 when the overall mean performance rating is greater than the overall mean importance rating (as will be seen, this occurred in all survey years in different user groups). The results are displayed in the tables below for each survey completed in 2014 and are compared to the results from prior years. As can be seen in Figure 5-1, the 2014 indices generated from the General Transportation User Survey are relatively similar for most modes when compared to other survey years. However, when looking closely, the satisfaction indices for all motorists are higher than the previous surveys. The satisfaction indices for SOVs, all carpoolers, bicycles and pedestrians in 2014 are higher than most of the previous survey years. The satisfaction index for transit riders in 2014, although higher than 2012, is lower than all past surveys before 2012. Figure 5-2 displays the customer satisfaction indices from the General Transportation User Survey.

2014 Customer Satisfaction Surveys Comparison of Results
Final Report Page 5-2
Figure 5-1 Customer Satisfaction Index – General Transportation User Survey – 2014 Data in Bold
Transportation User
Group 2014
Overall Mean
Importance Rating
2014 Overall Mean
Performance Rating
2014 Satisfaction
Index
2012 Satisfaction
Index
2009 Satisfaction
Index
2006 Satisfaction
Index
2005 Satisfaction
Index
2004 Satisfaction
Index
2003 Satisfaction
Index
2002 Satisfaction
Index
2001 Satisfaction
Index
SOV (single-occupant vehicle) users
6.0 5.1 85.5 86.1 84.4 80.7 82.6 80.3 82.1 80.9 79.8
All motorists (carpool and SOV – hwy only attributes)
6.0 5.1 84.2 83.9 84.1 80.5 82.5 80.9 82.3 81.7 79.9
All carpoolers (carpool attributes)
4.1 3.8 92.0 93.3 88.5 83.6 82.3 87.4 80.4 91.4 92.2
Transit riders 6.3 4.8 75.4 73.7 76.8 86.6 94.1 88.3 77.2 85.8 86.9
Bicyclists 5.5 4.5 83.2 70.2 71.0 84.1 66.3 59.6 74.8 67.9 83.8
Pedestrians 5.8 4.5 78.4 78.1 72.7 76.3 76.1 74.9 75.9 75.8 82.3
Figure 5-2 Customer Satisfaction Index – General Transportation User Survey
0
10
20
30
40
50
60
70
80
90
100
2014
2012
2009
2006
2005
2004
2003
2002
2001

2014 Customer Satisfaction Surveys Comparison of Results
Final Report Page 5-3
Figure 5-3 Customer Satisfaction Index – Transit-Served Market Area Survey - 2014 Data in Bold
Transportation User Group
2014 Overall Mean
Importance Rating
2014 Overall Mean
Performance Rating
2014 Satisfaction
Index
2012 Satisfaction
Index
2009 Satisfaction
Index
2006 Satisfaction
Index
2005 Satisfaction
Index
2004 Satisfaction
Index
2003 Satisfaction
Index
2002 Satisfaction
Index
2001 Satisfaction
Index
SOV (single-occupant vehicle) users
5.8 4.9 87.0 86.2 77.8 85.6 80.4 86.9 86.5 87.8 89.0
All motorists (carpool and SOV – hwy only attributes)
5.8 4.8 84.8 86.8 77.9 85.1 82.5 86.1 86.7 89.9 89.0
All carpoolers (carpool attributes)
3.6 3.5 97.6 133.0 0* 104.1 69.2 80.3 91.7 95.7 109.8
Bicyclists 5.5 3.6 67.7 77.0 76.7 77.3 36.2 46.5 52.6 72.6 67.9 Pedestrians 5.9 4.7 81.8 87.2 90.3 58.0 76.1 71.1 80.9 88.1 91.9
*The two carpoolers surveyed in 2009 could not provide performance ratings; therefore, there is no representative satisfaction index. Figure 5-3 above shows that the 2014 Transit-Served Market Area Survey indices are relatively similar to past survey results. When looking closely, the satisfaction index for SOV users in 2014 is higher than all prior survey years except for 2002. The all motorists 2014 satisfaction index is higher than the 2009 and 2005 survey results, but lower than all other surveys. The carpoolers satisfaction index in 2014 had a lower value in all applicable surveys since 2006 it is still higher than all survey results prior to 2006. The 2014 satisfaction indices for bicyclists is higher than 2005, 2004, and 2003 survey results but lower than 2012, 2009, 2006 and 2002 survey results. Pedestrians in the 2014 survey generated a satisfaction index that is higher than 2006, 2005, 2004, 2003, and 2002 results, but lower than 2012, 2009 and 2001 results. Figure 5-4 displays the customer satisfaction indices for the Transit-Served Market Area Survey.
Figure 5-4 Customer Satisfaction Index – Transit Served Market Area Survey
0
20
40
60
80
100
120
140
SOVS Motorists Carpoolers Bike Pedestrians
201420122009200620052004200320022001

2014 Customer Satisfaction Surveys Comparison of Results
Final Report Page 5-4
Figure 5-5 Customer Satisfaction Index – Shippers and Carriers Survey - 2014 Data in Bold
Transportation User Group
2014 Overall Mean
Importance Score
2014 Overall Mean
Performance Score
2014 Satisfaction Index
2012 Satisfactio
n Index
2009 Satisfactio
n Index
2006 Satisfactio
n Index
2005 Satisfactio
n Index
2004 Satisfaction
Index
2003 Satisfaction
Index
2002 Satisfaction
Index
2001 Satisfactio
n Index
Ship by truck 5.3 4.8 92.0 94.1 90.7 89.6 82.8 86.0 89.7 85.6 89.8 Ship by rail freight
4.3 4.0 92.5 112.7 93.9 68.0 72.4 93.9 78.0 116.5 89.6
Ship by air freight
6.8 1.0 14.9 111.2 No data* 73.0 No data* 62.0 94.4 No data* 41.1
Ship via the Port of Wilmington
4.6 5.2 119.9 94.1 118.7 119.2 92.4 96.5 91.2 98.1 99.4
No data*– Indices are not available. There were no businesses that shipped via air freight in the 2009, 2005 and 2002 surveys.
As shown in Figure 5-5, in the 2014 Shippers and Carriers Survey, the highest satisfaction index was obtained for businesses that ship via Port of Wilmington. The 2014 satisfaction index for rail freight is higher than the 2006, 2005, and 2003 survey results, but lower than the 2012, 2009 and 2004 survey years; however no comparison can be made to 2009, 2005, or 2002 survey results as no respondents indicated using this transport mode in those survey years. The 2014 satisfaction index for businesses that ship via truck is higher than all past survey years except for 2012. The Port of Wilmington had consistently high satisfaction indices compared to other modes over the past survey years. The 2014 satisfaction index for the Port is highest compared to all the previous survey years. Fluctuations in air freight can be attributed to the small sample size of companies that ship via air freight that participate in the survey. Figure 5-6 displays the satisfaction indices for the Shippers and Carriers Survey.
Figure 5-6 Customer Satisfaction Index – Shippers and Carriers Survey
* Extreme fluctuation is due to very small sample sizes.
0
20
40
60
80
100
120
Ship by Truck Ship via Rail Ship via Air* Ship via Port
2014
2012
2009
2006
2005
2004
2003
2002
2001

2014 Customer Satisfaction Surveys Comparison of Results
Final Report Page 5-5
5.3 Conclusions As was found in the previous survey years, high satisfaction indices (index values over 80) are computed for many user groups in Delaware. Accordingly, if transportation system improvements are undertaken on the high priority attributes identified in the Importance-Performance Quadrant Analyses by these users, high customer satisfaction indices should be found in future surveys as well.

About AECOM AECOM (NYSE: ACM) is a global provider of professional technical and management support services to a broad range of markets, including transportation, facilities, environmental, energy, water, and government. With approximately 45,000 employees around the world, AECOM is a leader in all of the key markets it serves. AECOM provides a blend of global reach, local knowledge, innovation, and technical excellence in delivering solutions that enhance and sustain the world’s built, natural and social environments. A Fortune 500 company, AECOM serves clients in more than 150 countries and had revenue of $8.1 billion during the 12-month period ended December 31, 2013. More information on AECOM and its services can be found at www.aecom.com.
AECOM 516 East State Street Trenton, NJ 08609 www.aecom.com