
2014 CONSUMER HEALTH SENTIMENTS REPORT - Nielsen
16
2014 CONSUMER HEALTH SENTIMENTS REPORT A CLOSER LOOK AT THE UNINSURED CONSUMER
Transcript of 2014 CONSUMER HEALTH SENTIMENTS REPORT - Nielsen
12014 CONSUMER HEALTH SENTIMENTS REPORT Copyright © 2014 The Nielsen Company
2014 CONSUMER HEALTH SENTIMENTS REPORTA CLOSER LOOK AT THE UNINSURED CONSUMER
2 2014 CONSUMER HEALTH SENTIMENTS REPORT
2014 CONSUMER HEALTH SENTIMENTS REPORTA CLOSER LOOK AT THE UNINSURED CONSUMER
Despite continued political debate, it seems that the Affordable Care
Act (ACA), signed into law by President Obama in 2010, is here to stay.
While the law means different things to the different entities involved
in the health care industry, one thing is certain—things will never be
the same. Many primary care physicians, taxed with too many patients
due to decreasing numbers of generalist physicians, have been forced
to consolidate into larger health systems. Health insurers, no longer
allowed to underwrite the individual market and ordered by law to spend
$0.80 for every dollar earned, specifically on health services, also are
feeling the impact on business-as-usual. Then there are those who are
feeling the greatest influence from the ACA—the consumers.
Designed to help aid those unable to provide health insurance coverage
for themselves and/or their families, the ACA appears to be working
with an estimated 9 to 10 million newly insured consumers entering
the system in 2014, according to several recent studies. Yet, this is just
the beginning. The trend is expected to continue into 2015 enrollment
with Centers for Medicare/Medicaid Services (CMS) estimates of
6.2% projected growth from 2015 to 20221. These numbers can be
extremely attractive to health insurers who see opportunity to bulk up
their membership. However, it may not be ideal to cast a broad net to
capture the uninsured seeking coverage for the first time (or first time in
several years)—it must be a refined process that stems from building a
foundational understanding of this consumer.
1Centers for Medicare & Medicaid Services. “National Health Expenditure Projections 2012-2022.” Accessed 8/5/14: http://www.cms.gov/Research-Statistics-Data-and-Systems/Statistics-Trends-and-Reports/NationalHealthExpendData/downloads/proj2012.pdf
32014 CONSUMER HEALTH SENTIMENTS REPORT Copyright © 2014 The Nielsen Company
HEALTHY BEHAVIORS AND RISK: INSURED, PREVIOUSLY UNINSURED AND UNINSURED Two provisions of the ACA have created challenges (or opportunities,
depending on your position) for insurers: 1) the individual mandate
requires all U.S. citizens to carry coverage or face a tax penalty, and
2) guaranteed issue prohibits denying an individual coverage for
pre-existing conditions. Combined, these provide a great incentive—
even more so when accounting for potential federal subsidies for the
uninsured to seek and obtain coverage that may have previously been
unobtainable due to either cost or pre-existing conditions. So, while
the uninsured clearly have attractive market potential, it would be
shortsighted to consider every consumer in this category the same way.
The 2014 Nielsen Health Insurance Track is a study designed to gain a
deeper understanding of consumers in a post-ACA health care system.
Potential risk is of particular interest when attempting to understand
the uninsured market. Risk can come in many forms, from chronic
conditions to unhealthy attitudes and behaviors. Yet the uninsured,
especially those who have been so for most of their lives, pose a unique
problem for insurers: there is little data available to describe them—not
only in medical terms, but in lifestyle terms. This means that on many
occasions, a previously uninsured individual entering the market for the
first time will have little historical information available. A Health Risk
Assessment (HRA) may be their first foray into the health care industry.
Let’s begin our investigation into the uninsured’s health by considering
two measures: number of chronic conditions and self-reported health
status, with a measure on a 5-point scale from “Poor” to “Excellent.”
Using the 2014 study, we examine three mutually exclusive groups: the
Insured, the Previously Uninsured, and the Uninsured.
4 2014 CONSUMER HEALTH SENTIMENTS REPORT
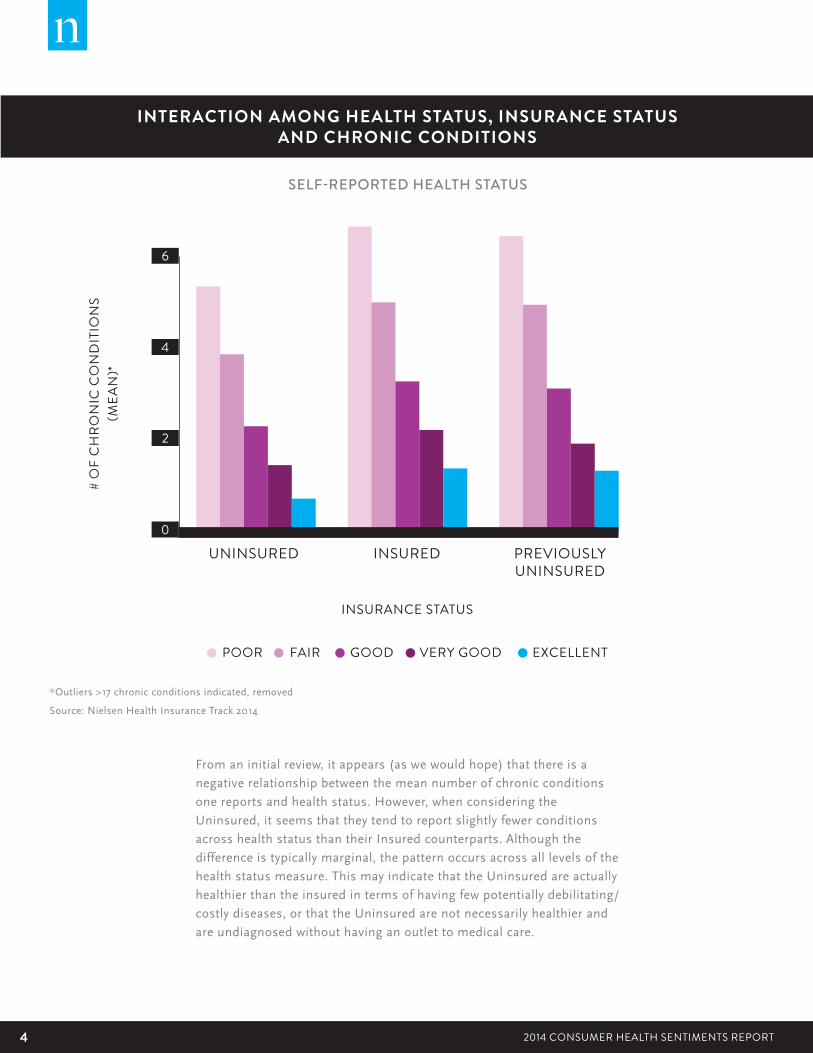
From an initial review, it appears (as we would hope) that there is a
negative relationship between the mean number of chronic conditions
one reports and health status. However, when considering the
Uninsured, it seems that they tend to report slightly fewer conditions
across health status than their Insured counterparts. Although the
difference is typically marginal, the pattern occurs across all levels of the
health status measure. This may indicate that the Uninsured are actually
healthier than the insured in terms of having few potentially debilitating/
costly diseases, or that the Uninsured are not necessarily healthier and
are undiagnosed without having an outlet to medical care.
INTERACTION AMONG HEALTH STATUS, INSURANCE STATUS AND CHRONIC CONDITIONS
UNINSURED
POOR GOODFAIR VERY GOOD EXCELLENT
# O
F C
HR
ON
IC C
ON
DIT
ION
S
(MEA
N)*
SELF-REPORTED HEALTH STATUS
INSURANCE STATUS
INSURED PREVIOUSLY UNINSURED
6
4
2
0
*Outliers >17 chronic conditions indicated, removed
Source: Nielsen Health Insurance Track 2014
52014 CONSUMER HEALTH SENTIMENTS REPORT Copyright © 2014 The Nielsen Company
UNINSURED
POOR GOODFAIR VERY GOOD EXCELLENT
# O
F PH
YSIC
AL
AC
TIV
ITIE
S PE
R W
EEK
(M
EAN
)*
INSURANCE STATUS
INSURED PREVIOUSLY UNINSURED
3
2
1
0
* Outliers >6 weekly activities indicated, removed
Source: Nielsen Health Insurance Track 2014
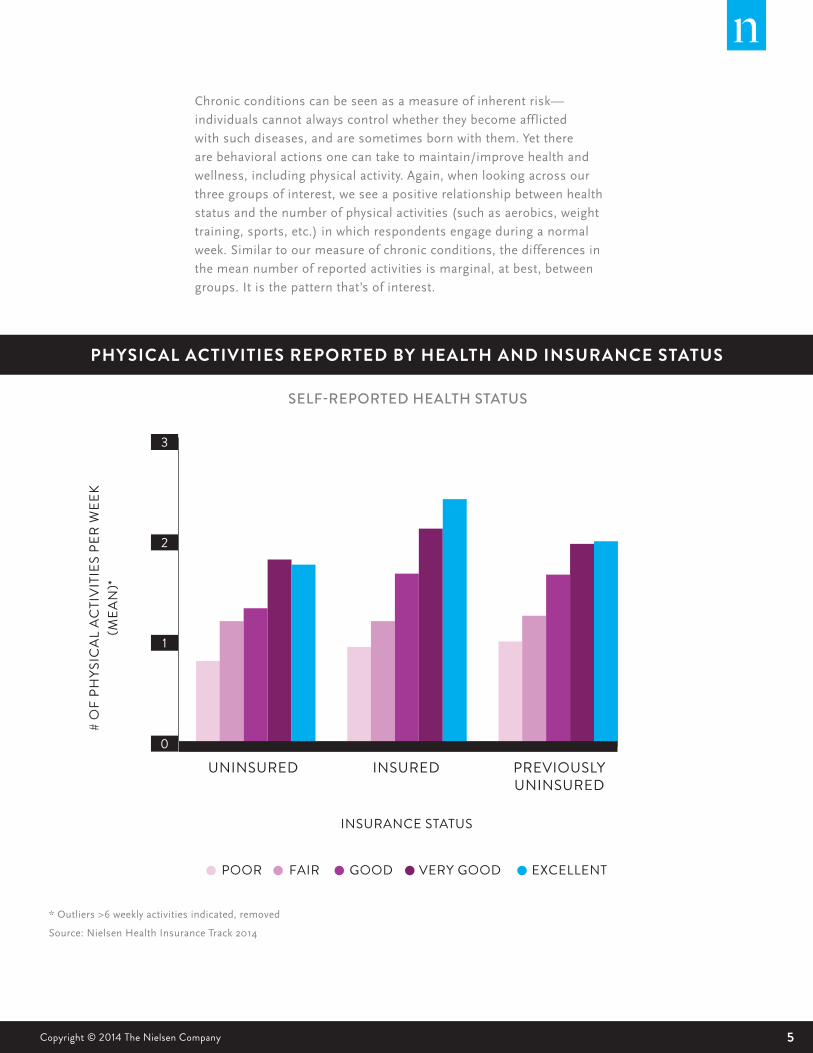
Chronic conditions can be seen as a measure of inherent risk—
individuals cannot always control whether they become afflicted
with such diseases, and are sometimes born with them. Yet there
are behavioral actions one can take to maintain/improve health and
wellness, including physical activity. Again, when looking across our
three groups of interest, we see a positive relationship between health
status and the number of physical activities (such as aerobics, weight
training, sports, etc.) in which respondents engage during a normal
week. Similar to our measure of chronic conditions, the differences in
the mean number of reported activities is marginal, at best, between
groups. It is the pattern that’s of interest.
PHYSICAL ACTIVITIES REPORTED BY HEALTH AND INSURANCE STATUS
SELF-REPORTED HEALTH STATUS
6 2014 CONSUMER HEALTH SENTIMENTS REPORT
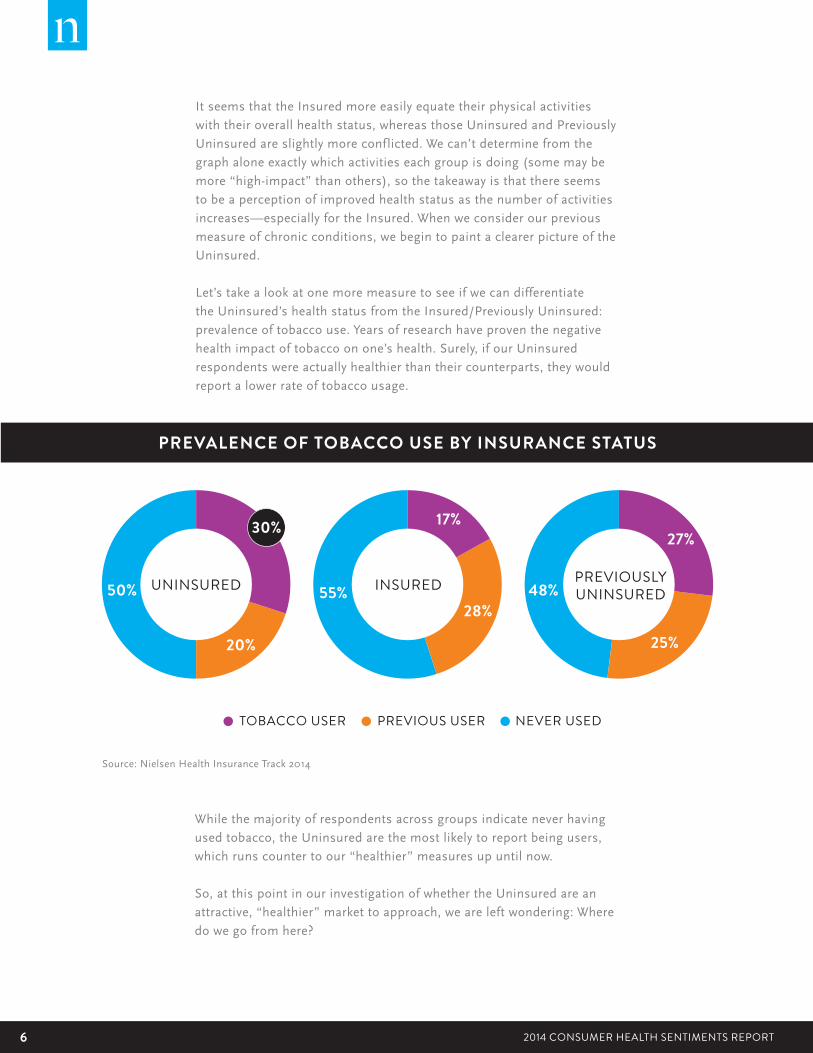
PREVALENCE OF TOBACCO USE BY INSURANCE STATUS
It seems that the Insured more easily equate their physical activities
with their overall health status, whereas those Uninsured and Previously
Uninsured are slightly more conflicted. We can’t determine from the
graph alone exactly which activities each group is doing (some may be
more “high-impact” than others), so the takeaway is that there seems
to be a perception of improved health status as the number of activities
increases—especially for the Insured. When we consider our previous
measure of chronic conditions, we begin to paint a clearer picture of the
Uninsured.
Let’s take a look at one more measure to see if we can differentiate
the Uninsured’s health status from the Insured/Previously Uninsured:
prevalence of tobacco use. Years of research have proven the negative
health impact of tobacco on one’s health. Surely, if our Uninsured
respondents were actually healthier than their counterparts, they would
report a lower rate of tobacco usage.
Source: Nielsen Health Insurance Track 2014
TOBACCO USER NEVER USEDPREVIOUS USER
While the majority of respondents across groups indicate never having
used tobacco, the Uninsured are the most likely to report being users,
which runs counter to our “healthier” measures up until now.
So, at this point in our investigation of whether the Uninsured are an
attractive, “healthier” market to approach, we are left wondering: Where
do we go from here?
UNINSURED INSURED PREVIOUSLY UNINSURED50% 55% 48%
17%27%
20% 25%
28%
30%
72014 CONSUMER HEALTH SENTIMENTS REPORT Copyright © 2014 The Nielsen Company
PREVALENCE OF TOBACCO USE BY INSURANCE STATUS
D I G G I N G D E E P E R F O R A M O R E C O M P L E T E V I E WLet’s take a step back. Granted, our example above uses only three
data points (chronic conditions, healthy activities and tobacco use)
coming from a single research study. A savvy researcher’s appetite for
knowing more about the Uninsured would not be sated. Because no
single study will provide all the answers, many researchers will find the
need to combine sources for a better understanding of these groups.
The Nielsen Health Insurance Track can provide far more behavioral
insights—thousands more—and it links to Nielsen PRIZM segmentation
for a more extensive view of consumers.
Nielsen’s PRIZM® segmentation model classifies every U.S. household
into one of 66 segments based on household lifestyle behaviors, media
and purchasing preferences. From this, a wealth of information is
available as PRIZM is linked to thousands of Nielsen and third-party data
assets. This allows a much broader picture of the consumer outside of a
single survey’s data—everything from what they watch to what they buy.
You can think of the Nielsen Health Insurance Track as a starting point
to a much more robust collection of insightful information around any
specific group of interest to your business.
In this particular situation, we would like to know more about the
Uninsured. Let’s start by finding out which PRIZM segments include the
highest proportions of this group within the Nielsen Health Insurance
Track. Although PRIZM is composed of 66 segments, these segments
can be rolled up into cohesive groups based on their “Lifestage” (a
combination of measures based on age, affluence, and presence of
children within a household) and their “Social Group” (a combination
of affluence and urbanization—a proprietary Nielsen measure
accounting for population density surrounding a household).
8 2014 CONSUMER HEALTH SENTIMENTS REPORT
YOUNGER YEARS
SUBURBANURBAN
MIDLIFE SUCCESS
4.5%
ELITE SUBURBS
0.6%
URBAN UPTOWN
3.4%
YOUNG ACHIEVERS
11.2%
THE AFFLUENTIALS
2.6%
MIDTOWNMIX8.2%
STRIVING SINGLES
24.4%
MIDDLEBURBS5.4%
INNER SUBURBS
10.2%
URBAN CORES
11.4%
FAMILY LIFE
SECOND CITY
ACCUMULATED WEALTH
0.5%
SECOND CITY SOCIETY
1.4%
YOUNG ACCUMULATORS
3.7%
CITY CENTERS
5.6%
MAINSTREAM FAMILIES
12.7%
MICRO-CITY BLUES16.8%
SUSTAINING FAMILIES
16.1%
MATURE YEARS
TOWN AND COUNTRY
AFFLUENT EMPTY NESTS
1.1%
LANDED GENTRY
1.3%
CONSERVATIVE CLASSICS
1.6%
COUNTRY COMFORT
3.3%
CAUTIOUS COUPLES
6.7%
MIDDLE AMERICA
7.6%
SUSTAINING SENIORS
16.4%
RUSTIC LIVING
21.2%
$$$
$$$
$
$
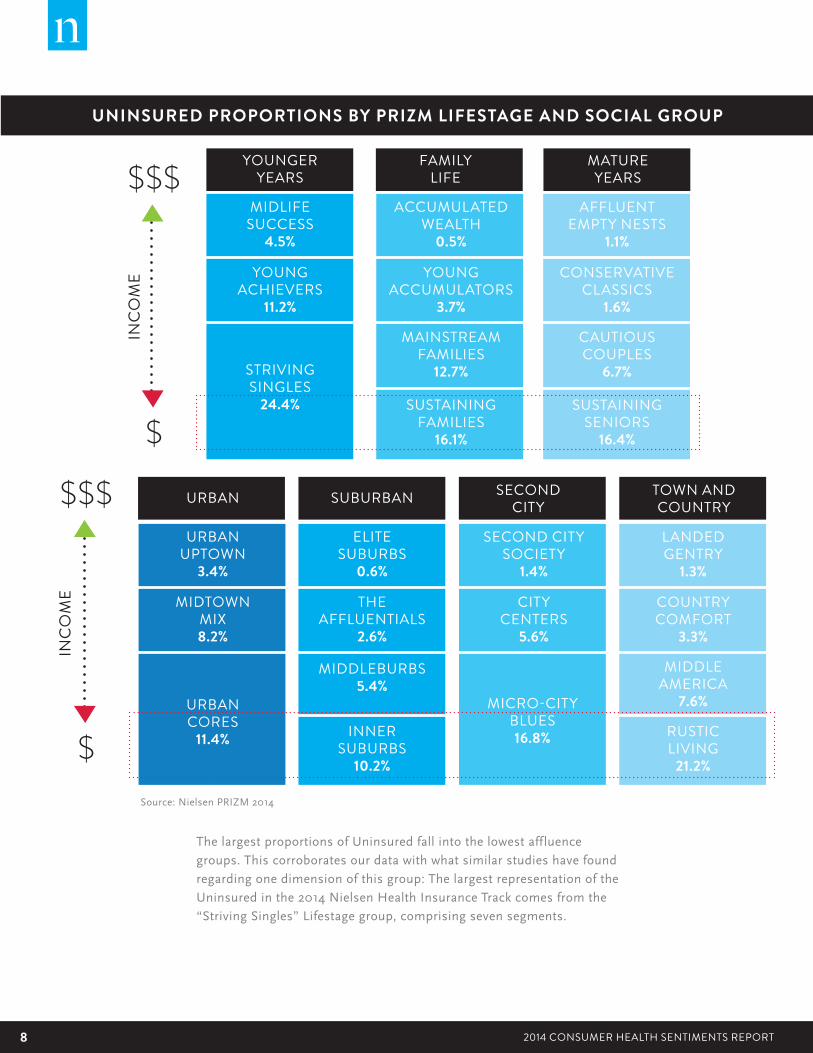
UNINSURED PROPORTIONS BY PRIZM LIFESTAGE AND SOCIAL GROUP
Source: Nielsen PRIZM 2014
The largest proportions of Uninsured fall into the lowest affluence
groups. This corroborates our data with what similar studies have found
regarding one dimension of this group: The largest representation of the
Uninsured in the 2014 Nielsen Health Insurance Track comes from the
“Striving Singles” Lifestage group, comprising seven segments.
INC
OM
E
INC
OM
E
92014 CONSUMER HEALTH SENTIMENTS REPORT Copyright © 2014 The Nielsen Company
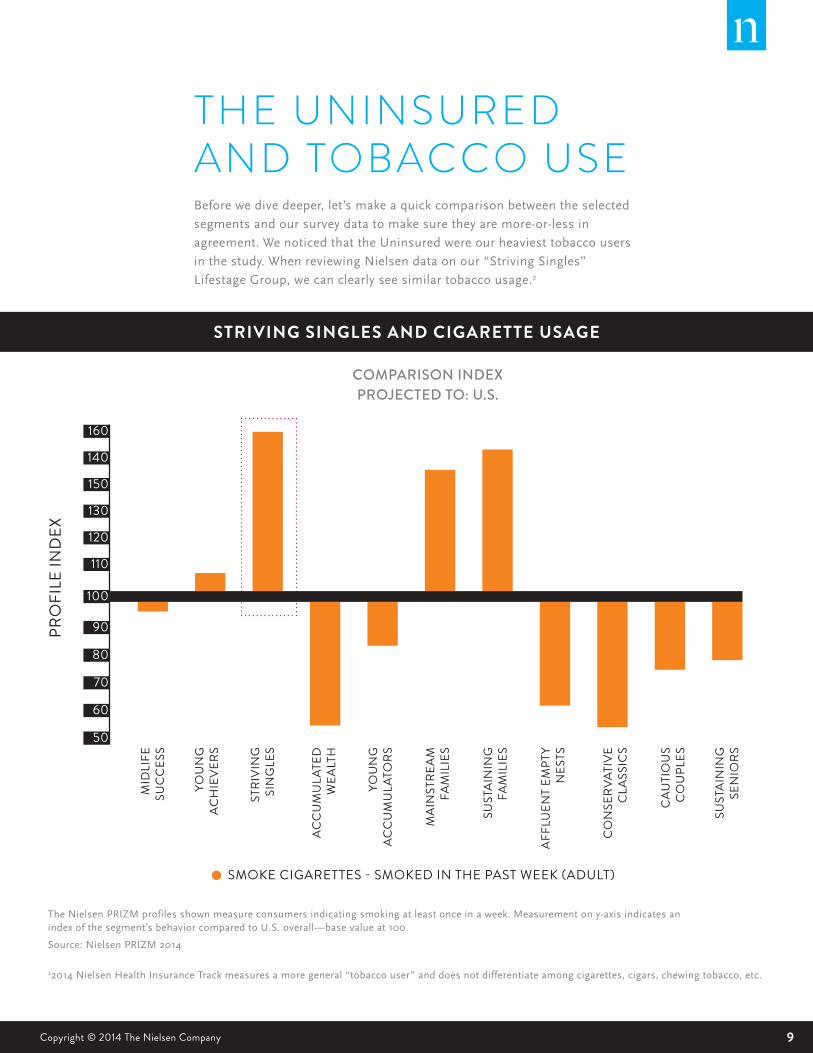
THE UNINSURED AND TOBACCO USEBefore we dive deeper, let’s make a quick comparison between the selected
segments and our survey data to make sure they are more-or-less in
agreement. We noticed that the Uninsured were our heaviest tobacco users
in the study. When reviewing Nielsen data on our “Striving Singles”
Lifestage Group, we can clearly see similar tobacco usage.2
STRIVING SINGLES AND CIGARETTE USAGE
MID
LIFE
SU
CC
ESS
YOU
NG
ACH
IEVE
RS
YOU
NG
ACC
UM
ULA
TORS
MAI
NST
REAM
FAM
ILIE
S
SUST
AIN
ING
FAM
ILIE
S
AFFL
UEN
T EM
PTY
NES
TS
CO
NSE
RVAT
IVE
CLA
SSIC
S
CAU
TIO
US
CO
UPL
ES
SUST
AIN
ING
SEN
IORS
STRI
VIN
GSI
NG
LES
ACC
UM
ULA
TED
WEA
LTH
PRO
FILE
IND
EX
SMOKE CIGARETTES - SMOKED IN THE PAST WEEK (ADULT)
The Nielsen PRIZM profiles shown measure consumers indicating smoking at least once in a week. Measurement on y-axis indicates an index of the segment’s behavior compared to U.S. overall—base value at 100.
Source: Nielsen PRIZM 2014
22014 Nielsen Health Insurance Track measures a more general “tobacco user” and does not differentiate among cigarettes, cigars, chewing tobacco, etc.
COMPARISON INDEX PROJECTED TO: U.S.
160
150
140
130
120
110
100
90
80
70
60
50
10 2014 CONSUMER HEALTH SENTIMENTS REPORT
MID
LIFE
SU
CC
ESS
YOU
NG
ACH
IEVE
RS
YOU
NG
ACC
UM
ULA
TORS
MAI
NST
REAM
FAM
ILIE
S
SUST
AIN
ING
FAM
ILIE
S
AFFL
UEN
T EM
PTY
NES
TS
CO
NSE
RVAT
IVE
CLA
SSIC
S
CAU
TIO
US
CO
UPL
ES
SUST
AIN
ING
SEN
IORS
STRI
VIN
GSI
NG
LES
ACC
UM
ULA
TED
WEA
LTH
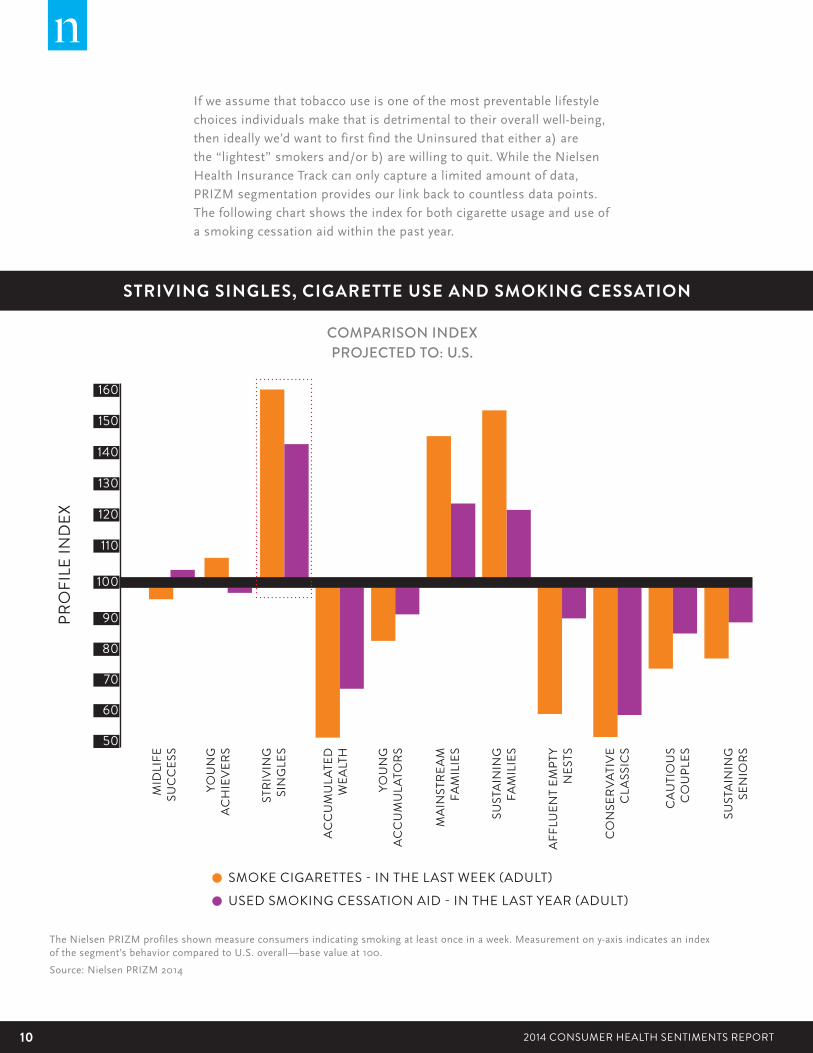
STRIVING SINGLES, CIGARETTE USE AND SMOKING CESSATION
The Nielsen PRIZM profiles shown measure consumers indicating smoking at least once in a week. Measurement on y-axis indicates an index of the segment’s behavior compared to U.S. overall—base value at 100.
Source: Nielsen PRIZM 2014
PRO
FILE
IND
EX
SMOKE CIGARETTES - IN THE LAST WEEK (ADULT)USED SMOKING CESSATION AID - IN THE LAST YEAR (ADULT)
If we assume that tobacco use is one of the most preventable lifestyle
choices individuals make that is detrimental to their overall well-being,
then ideally we’d want to first find the Uninsured that either a) are
the “lightest” smokers and/or b) are willing to quit. While the Nielsen
Health Insurance Track can only capture a limited amount of data,
PRIZM segmentation provides our link back to countless data points.
The following chart shows the index for both cigarette usage and use of
a smoking cessation aid within the past year.
COMPARISON INDEXPROJECTED TO: U.S.
160
150
140
130
120
110
100
90
80
70
60
50
112014 CONSUMER HEALTH SENTIMENTS REPORT Copyright © 2014 The Nielsen Company
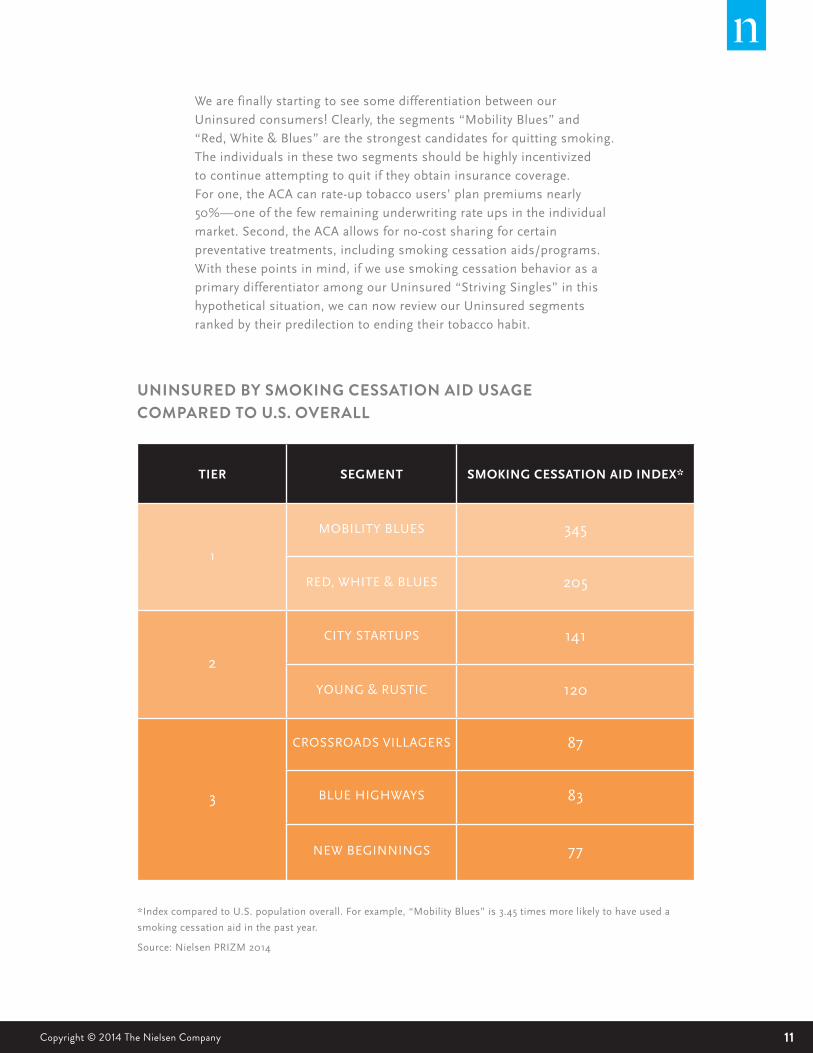
*Index compared to U.S. population overall. For example, “Mobility Blues” is 3.45 times more likely to have used a
smoking cessation aid in the past year.
Source: Nielsen PRIZM 2014
We are finally starting to see some differentiation between our
Uninsured consumers! Clearly, the segments “Mobility Blues” and
“Red, White & Blues” are the strongest candidates for quitting smoking.
The individuals in these two segments should be highly incentivized
to continue attempting to quit if they obtain insurance coverage.
For one, the ACA can rate-up tobacco users’ plan premiums nearly
50%—one of the few remaining underwriting rate ups in the individual
market. Second, the ACA allows for no-cost sharing for certain
preventative treatments, including smoking cessation aids/programs.
With these points in mind, if we use smoking cessation behavior as a
primary differentiator among our Uninsured “Striving Singles” in this
hypothetical situation, we can now review our Uninsured segments
ranked by their predilection to ending their tobacco habit.
TIER SEGMENT SMOKING CESSATION AID INDEX*
1
MOBILITY BLUES 345
RED, WHITE & BLUES 205
2
CITY STARTUPS 141
YOUNG & RUSTIC 120
3
CROSSROADS VILLAGERS 87
BLUE HIGHWAYS 83
NEW BEGINNINGS 77
UNINSURED BY SMOKING CESSATION AID USAGE COMPARED TO U.S. OVERALL
12 2014 CONSUMER HEALTH SENTIMENTS REPORT
U N D E R S TA N D I N G T H E B E H AV I O R S O F C O N S U M E R S E G M E N T SBy using the power of Nielsen’s PRIZM segmentation model, we can
expose numerous behaviors exhibited by our segment tiers of interest.
When we simply examine how these segments index on specific
behaviors relative to the U.S. population overall, a clearer picture forms.
Here is a set of example health and wellness behaviors by tier and index:
132014 CONSUMER HEALTH SENTIMENTS REPORT Copyright © 2014 The Nielsen Company
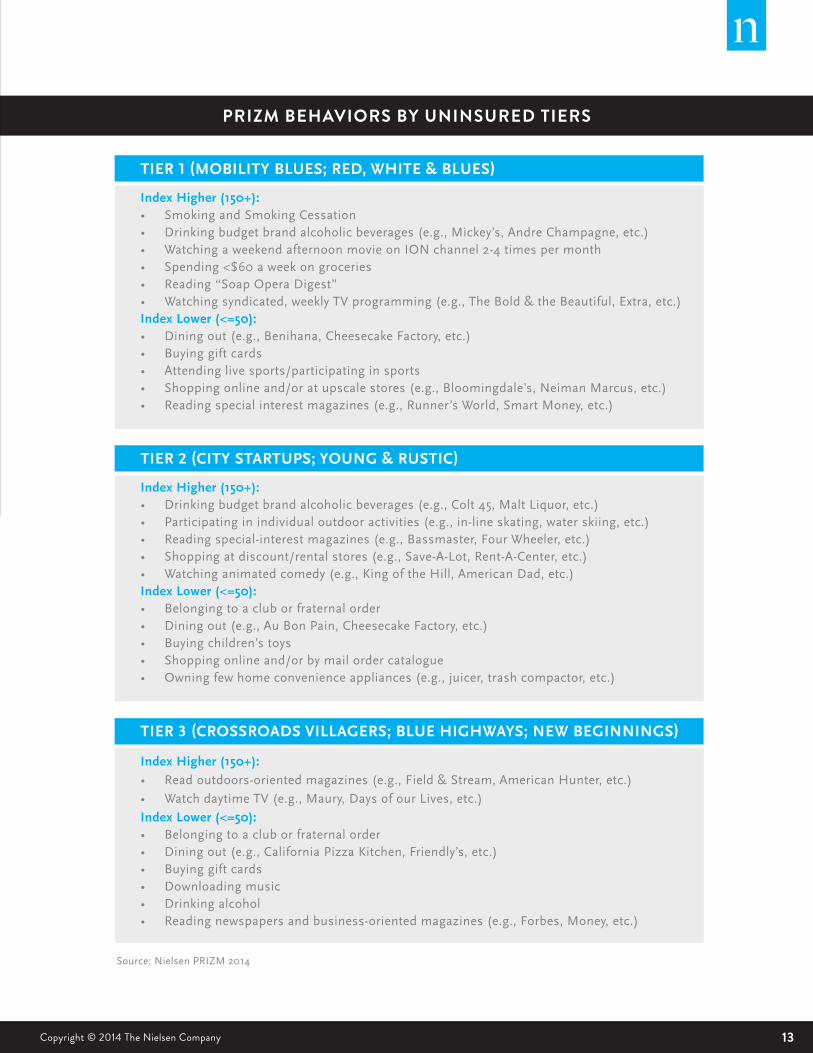
PRIZM BEHAVIORS BY UNINSURED TIERS
TIER 1 (MOBILITY BLUES; RED, WHITE & BLUES)
Index Higher (150+):• Smoking and Smoking Cessation• Drinking budget brand alcoholic beverages (e.g., Mickey’s, Andre Champagne, etc.)• Watching a weekend afternoon movie on ION channel 2-4 times per month• Spending <$60 a week on groceries• Reading “Soap Opera Digest”• Watching syndicated, weekly TV programming (e.g., The Bold & the Beautiful, Extra, etc.)Index Lower (<=50):• Dining out (e.g., Benihana, Cheesecake Factory, etc.)• Buying gift cards• Attending live sports/participating in sports• Shopping online and/or at upscale stores (e.g., Bloomingdale’s, Neiman Marcus, etc.)• Reading special interest magazines (e.g., Runner’s World, Smart Money, etc.)
TIER 2 (CITY STARTUPS; YOUNG & RUSTIC)
Index Higher (150+):• Drinking budget brand alcoholic beverages (e.g., Colt 45, Malt Liquor, etc.)• Participating in individual outdoor activities (e.g., in-line skating, water skiing, etc.)• Reading special-interest magazines (e.g., Bassmaster, Four Wheeler, etc.)• Shopping at discount/rental stores (e.g., Save-A-Lot, Rent-A-Center, etc.)• Watching animated comedy (e.g., King of the Hill, American Dad, etc.)Index Lower (<=50):• Belonging to a club or fraternal order• Dining out (e.g., Au Bon Pain, Cheesecake Factory, etc.)• Buying children’s toys• Shopping online and/or by mail order catalogue• Owning few home convenience appliances (e.g., juicer, trash compactor, etc.)
TIER 3 (CROSSROADS VILLAGERS; BLUE HIGHWAYS; NEW BEGINNINGS)
Index Higher (150+):• Read outdoors-oriented magazines (e.g., Field & Stream, American Hunter, etc.)
• Watch daytime TV (e.g., Maury, Days of our Lives, etc.)
Index Lower (<=50):• Belonging to a club or fraternal order• Dining out (e.g., California Pizza Kitchen, Friendly’s, etc.)• Buying gift cards• Downloading music• Drinking alcohol• Reading newspapers and business-oriented magazines (e.g., Forbes, Money, etc.)
Source: Nielsen PRIZM 2014
14 2014 CONSUMER HEALTH SENTIMENTS REPORT
Both similarities and differences exist among our three tiers, and
while these behaviors are just examples, they illustrate the level of
detail available to describe PRIZM segments. Take for example Tier 1:
“Watching a weekend afternoon movie on ION channel 2-4 times per
month”—the minutiae captured by PRIZM can be quite profound. Not
only does PRIZM aid in our quest to understand the health status of
the Uninsured, but it also provides information that can be used for
marketing purposes—often new territory for health insurers traditionally
marketing to groups/employers.
S E G M E N TAT I O N B R I N G S F O C U S TO YO U R M A R K E T I N G E F F O R T SAlthough our example is simply illustrative and the particular needs
of a company will vary, PRIZM presents a unique way of looking at the
consumer from a 360-degree perspective. Starting from segmentation
(to understand the consumer), Nielsen further provides the ability to
find consumers geographically. For example, our “Mobility Blues” and
“Red, White & Blues” segments are heavily concentrated in southwest
Oregon and most of Colorado. Building on that foundation, we can
determine the optimal methods for engaging these consumers according
to client strategy and tactics.
The Uninsured will continue to be of interest within the health care
industry as more and more seek coverage. With Nielsen’s PRIZM
segmentation in your tool box, the opportunity to focus marketing efforts
on key segments becomes a reality.
METHODOLOGY
Nielsen Health Insurance Track is a survey conducted biennially,
collecting consumer-level data on behaviors related to health insurance
coverage, purchase process, and health behaviors/risk. Approximately
25,000 respondents, sampled to be nationally representative, participate.
For more information please contact your Nielsen representative.
152014 CONSUMER HEALTH SENTIMENTS REPORT Copyright © 2014 The Nielsen Company
ABOUT NIELSEN Nielsen N.V. (NYSE: NLSN) is a global information and measurement
company with leading market positions in marketing and consumer
information, television and other media measurement, online
intelligence and mobile measurement. Nielsen has a presence in
approximately 100 countries, with headquarters in New York, USA
and Diemen, the Netherlands.
For more information, visit www.nielsen.com.
Copyright © 2014 The Nielsen Company. All rights reserved. Nielsen and
the Nielsen logo are trademarks or registered trademarks of CZT/ACN
Trademarks, L.L.C. Other product and service names are trademarks or
registered trademarks of their respective companies. 14/8214

16 2014 CONSUMER HEALTH SENTIMENTS REPORT