
2014 college women’s ultimate data from nwc
13
2014 College Women’s Ultimate Data Collected from teams at the 2014 Northwest Challenge
-
Upload
kyle-weisbrod -
Category
Sports
-
view
429 -
download
0
Transcript of 2014 college women’s ultimate data from nwc

2014 College Women’s Ultimate DataCollected from teams at the 2014 Northwest Challenge

Table of Contents
Team Finances……………………………………………………………………………………3Club Organization and Structure……………………………………………….....……8Team and Recruiting…………………………………………………..…………………….11

Team Finances: Estimated Team Expenses*
Oregon
Wash
ington
Carleto
n
Whitm
an
Colorado
Ohio State UBC
Averag
e$0
$5,000$10,000$15,000$20,000$25,000$30,000$35,000$40,000$45,000
Estimated Total Team Expense (including costs paid for by players)
*Some teams provided estimates without player expenses. That data was not included.
SchoolWhat do you estimate is the total
amount your team spends annually?
Oregon $42,000
Washington $42,000
Carleton $40,000
Whitman $20,000
Colorado $21,000
Ohio State $30,000
UBC $27,000Average $31,714

Team Finances: School Funding vs. Fundraising
0 2000 4000 6000 8000 10000 120000
2000
4000
6000
8000
10000
12000
Victoria
Oregon
Washington
Western Washington Carleton
UCLA
Whitman
Tufts
Colorado
Ohio State
UBC
Average
Fundraising vs. School Support
School Funding ($)Te
am F
undr
aisin
g ($
)
School School Funding Fundraising
Victoria $750 $3,000
Oregon $10,000 $10,000
Washington $1,400 $8,000
Western Washington $2,500 $1,900
Carleton $7,500 $1,000
UCLA $1,500 $4,500
Whitman $10,000 $3,500
Tufts $3,000 $1,500
Colorado $3,600 $4,000
Ohio State $2,500 $5,000
UBC $0 $1,500Average $3,886 $3,991

Team Finances: Player Dues
Victoria
Oregon
Washington
Western Washington
Carleton
UCLA
Whitman
Tufts
Colorado
Ohio State
UBC
Average
$0 $200 $400 $600 $800 $1,000 $1,200
$50
$450
$350
$75
$250
$600
$0
$0
$275
$1,000
$900
$359
How much money do you ask each player in dues annually?
TeamHow much money do you ask each player in
dues annually?Victoria $50Oregon $450Washington $350Western Washington $75Carleton $250UCLA $600Whitman $0Tufts $0Colorado $275Ohio State $1,000UBC $900Average $359

Team Finances: Fundraising Sources
Sponsorship (5 Teams) Host Tournament (7 Teams)
Parent/Alumi Outreach (8 Teams)
Merchandise Sales (5 Teams)
Stadium and Other Clean-Ups (3 Teams)
Bake/Food Sales (3Teams)
$0
$500
$1,000
$1,500
$2,000
$2,500
$3,000
$3,500
$4,000
Common Fundraising Sources
Min Max Average
Source Min Max AverageSponsorships (5 Teams) $500 $1,500 $1,020Host Tournament (7 Teams) $250 $3,500 $1,775Parent/Alumi Outreach (8 Teams) $500 $2,500 $1,681Merchandise Sales (5 Teams) $500 $1,200 $850Stadium and Other Clean-Ups (3 Teams) $440 $2,000 $1,147Bake/Food Sales (3Teams) $300 $846 $549

Team Finances: Other Fundraising Sources• Club Nights • Pumpkin Pull• Bottle Drives• Throw-a-Thon• Pub Nights and Team Hosted Parties• Team Hosted 5K

Club Organization: Relationship with School• All 11 Schools that responded fall under their Club Sports
Department (no teams report into the Athletic Department)
• 3 teams have a contact within their school’s Athletic Department
Establishing and maintaining relationships with your school’s Athletic Department may pay dividends down the road. As we work toward identifying the direction that we want Women’s College Ultimate to take, relationships with key decision makers and influencers can be valuable to help ensure that we gain access to resources while maintaining values and player-control in the sport.

Club Organization: 5 Year Organizational Goals• Make Ultimate more affordable• Create a B-Team• Make more money• Increased support from school and establish
an endowment• Establish sponsorships and develop a B-team• Increase support from school• Increase support from school, increase
fundraising• Establish a B-team, find consistent coaching
staff, increase financial support from the school
• Fundraise more effectively• Establish a B-team and gain financial
support from the school• Increase support from the school,
maintain our B-team, spend more time fundraising, find sponsorships, increase alumni and parent involvement
• Increase support from our school• Find creative fundraising opportunities• Lower costs by competing at more local,
competitive tournaments
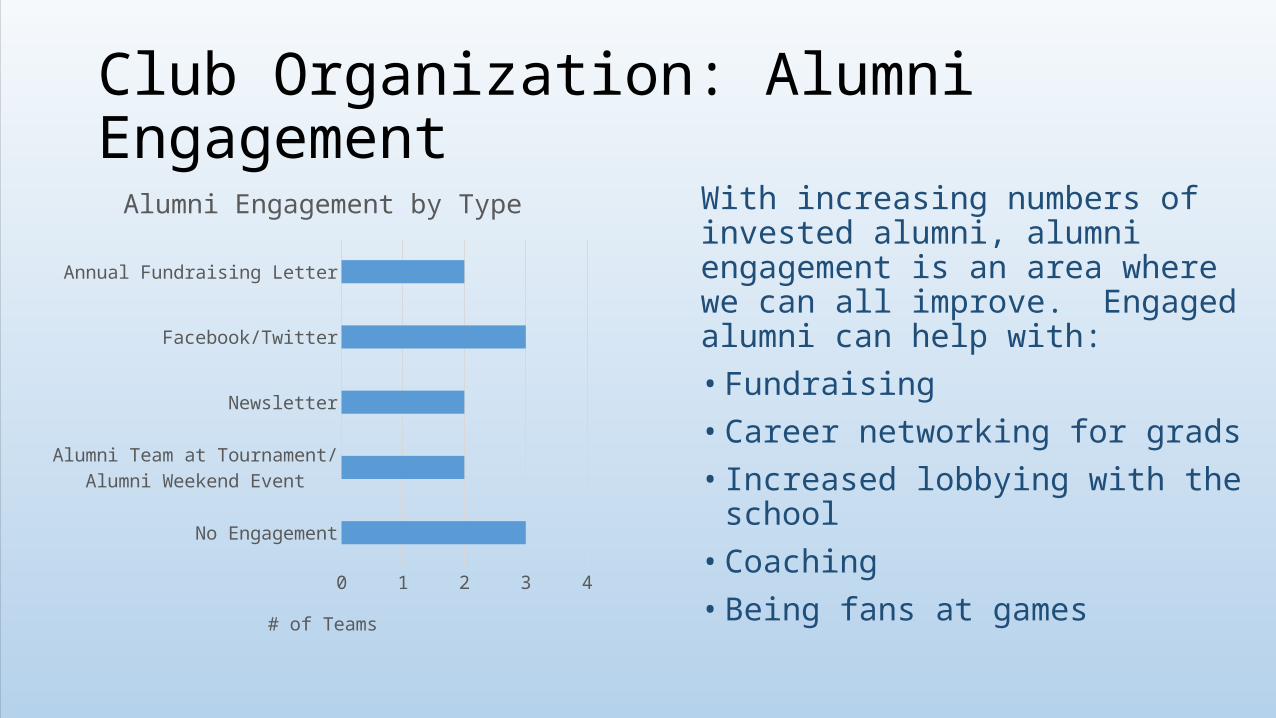
Club Organization: Alumni Engagement
No Engagement
Alumni Team at Tournament/ Alumni Weekend Event
Newsletter
Facebook/Twitter
Annual Fundraising Letter
0 1 2 3 4
Alumni Engagement by Type
# of Teams
With increasing numbers of invested alumni, alumni engagement is an area where we can all improve. Engaged alumni can help with:• Fundraising• Career networking for grads• Increased lobbying with the school• Coaching• Being fans at games

Team and Recruiting: Tryouts, Team Size, and B-Teams
B-teams can provide programs with the opportunity to tailor the Ultimate experience toward participants who are seeking different experiences. B-teams allow highly competitive and motivated athletes to pursue competitive goals while still providing playing and development opportunities for newer and less competitive players that allows the sport to grow and programs to thrive in the long term.
Minimum # of Players
Maximum # of Players Average
Try-Outs 30 60 45.5
Roster 20 26 22.27
• 10/11 (90.91%) of teams held try-outs for the 2014 season• 9/11 (81.82%) of teams had a B-team in 2014
• Avg. # of Players at Try-outs: 47.22• Min # of Players at Try-outs: 30
• 5/11 (45.45%) of teams Regularly have a B-Team

Team and Recruiting: Successful Recruiting Methods
• Word of mouth
• Club Sports advertises for us
• Hanging out at the gym to get athletic people
• Booth at the info fair
• Being involved in the local HS Ultimate community
• Poaching dissatisfied varsity athletes
• Presence at the school’s activities and club sports fair
• Open practices for the fall season and pick-up
• Social media
• Visible practices
• College e-mail announcements
• Connections with incoming youth players
• Club days
• Rec/IMA leagues
• Players recruiting their friends

To Join the College Women’s Ultimate Growth and Development Group:Contact: Jesse Shofner([email protected])