Michael D. Gallagher Acting Assistant Secretary U.S. Department of Commerce
Upload
arthur-oliverCategory
view
214download
0
2014 CENCOM Performance Measures2014

Employee Development 3 Certified Training Officers 2 Acting Leads 1 Acting Assistant Supervisor 2 Assistant Supervisors 1 Supervisor
CENCOM Training Program
Initial Training
9 week Primary Call Receiver Academy (PCRA)8 - 12 weeks of floor training with a Certified Training Officer (CTO) 3 months working on own as PCR
4 week Law Enforcement Academy (LEDA)
6 - 12 weeks of floor training with a CTO6 months working on own as LE Dispatcher
6 day Fire Dispatch Academy (FDA)2 - 4 weeks 1/2 days of floor training with a CTO

These training accomplishments would not have been possible without the dedication of CENCOM’s instructors, CTOs, and academy facilitators, as well as the countless employees who volunteered their time to assist within these roles.
Continuing Education• Advanced CTO training• Peer Support and Critical Incident Stress. • 40 hour Crisis Intervention training with law enforcement• 40 hours of continuing education related to teamwork, data, Unified Command, drug
taskforces, Amber Alerts and missing and exploited children. • Supervisor group training on communication, leadership, and project management.

Average Tenure: 8.9 Years
Retention Rates:Non-Probationary 90%. Probationary: 83%
Hours of overtime worked: 10,379 hours
Hours of overtime worked: 10,446 hours
Retention Rates:Non-Probationary 98%. Probationary: 57%
Average Tenure: 9.6 Years
Average sick leave per employee: OUR EMPLOYEES34.28 hours

2009 2010 2011 2012 2013 2014
911 157027 159937 157381 166809 165860 178860
10-digit 11806 13448 12043 12576 12745 13382
Non-emergency 66387 69008 60847 58301 65333 52429
Outgoing 54646 67248 62268 62707 59984 63387
25000125000225000325000
Calls processed by the dispatch floor

IMAGE TITLEThis is sample text, and should be replaced with actual content. This is sample text, and should be replaced with actual content.
Goal Meet or exceed national and local time standards for 911 call processing
2008 2009 2010 2011 2012 2013 2014
Answer 95% of all 911 calls
within 15 seconds or less
(NFPA 1221)
97.25% 98.56% 98.97% 99.43% 99.21% 99.24% 99.18%
Answer 90% of all 911 calls
within 10 seconds or less (CENCOM goal)
87.79% 93.34% 95.85% 96.66% 95.85% 95.72% 96.05%

Percentage of Abandoned Calls: 2013 = 3.59%2014 = 4.01%
Calls on Hold over 30 Seconds: 2013 = 2.28% 2014 = 2.85%
Efficie
ncy

1994
1995
1996
1997
1998
1999
2000
2001
2002
2003
2004
2005
2006
2007
2008
2009
2010
2011
2012
2013
2014
165000
195000
225000
255000
LE Fire Misc
Total Events Dispatched 1993 to 2014
2014: 214,200 LE; 32,731 Fire/EMS; 3,692 other. 2013: 209,424 LE; 29,914 Fire/EMS; 2,231 other.
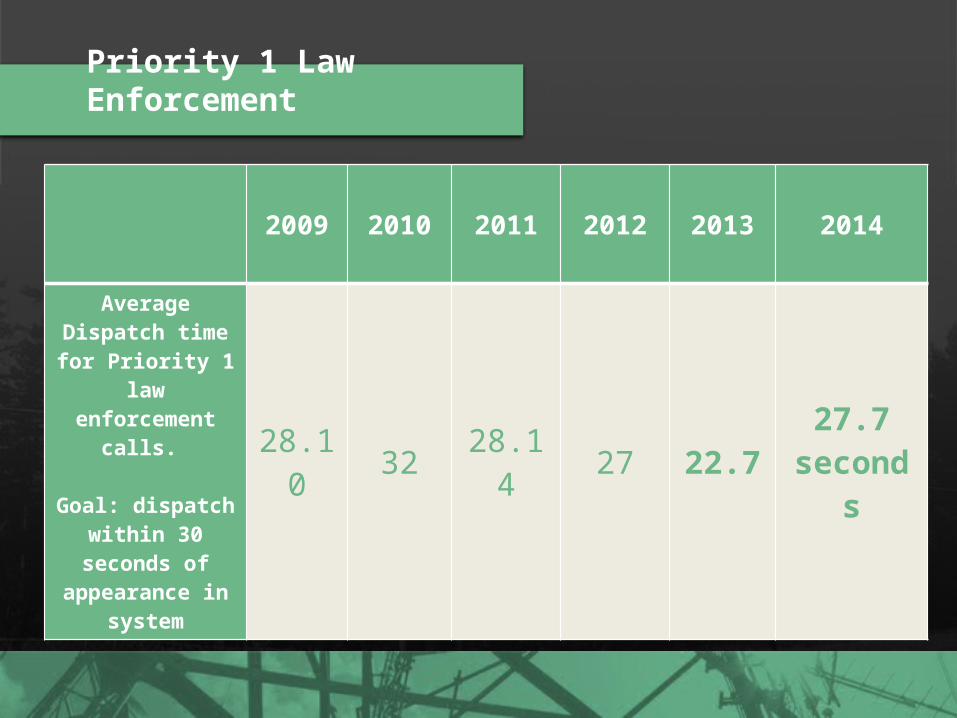
Priority 1 Law Enforcement
2009 2010 2011 2012 2013 2014
Average Dispatch time for Priority 1 law enforcement
calls.
Goal: dispatch within 30 seconds of appearance in
system
28.10
3228.1
427 22.7
27.7 second
s

Fire Dispatching
2013 201480% within 60 seconds 69.50% 66.00%
95% within 106 seconds 91.91% 88.66%
90% within 90 seconds 91.50% 91.66%
99% within 120 seconds 97.00% 97.25%
This is measured using the simple format below: • 80 percent of emergency alarm processing
shall be completed within 60 seconds and
• 95 percent of alarm processing shall be completed within 106 seconds
except for o Calls requiring emergency medical dispatch
questioning and pre-arrival medical instructions
o Calls requiring language translationo Calls requiring the use of a TTY/TDD device or
audio/video relay serviceso Calls of criminal activity that require
information vital to emergency responder safety prior to dispatching units
o Hazardous material incidentso Technical rescue events Which shall be completed within 90 seconds 90 percent of the time and within 120 seconds 99 percent of the time.
NFPA 1221 - Fire/EMS Call Processing Times
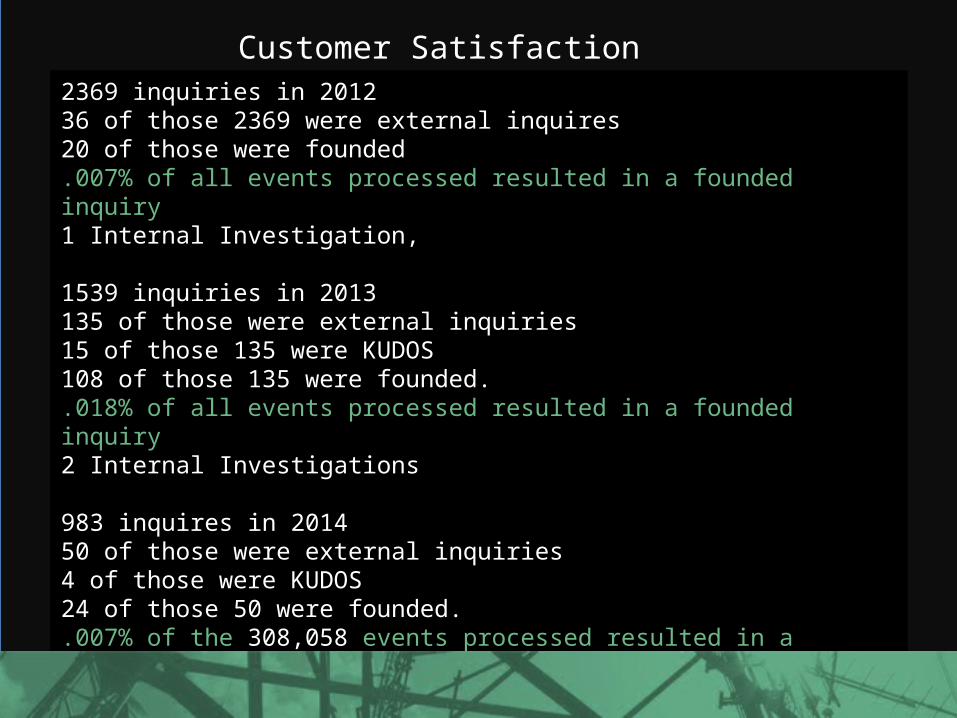
2369 inquiries in 2012 36 of those 2369 were external inquires 20 of those were founded .007% of all events processed resulted in a founded inquiry 1 Internal Investigation,
1539 inquiries in 2013 135 of those were external inquiries15 of those 135 were KUDOS108 of those 135 were founded. .018% of all events processed resulted in a founded inquiry 2 Internal Investigations
983 inquires in 2014 50 of those were external inquiries 4 of those were KUDOS 24 of those 50 were founded. .007% of the 308,058 events processed resulted in a founded inquiry1 Internal Investigation, unfounded
Customer Satisfaction
2010 2011 2012 2013 20140
50
100
150
200
250
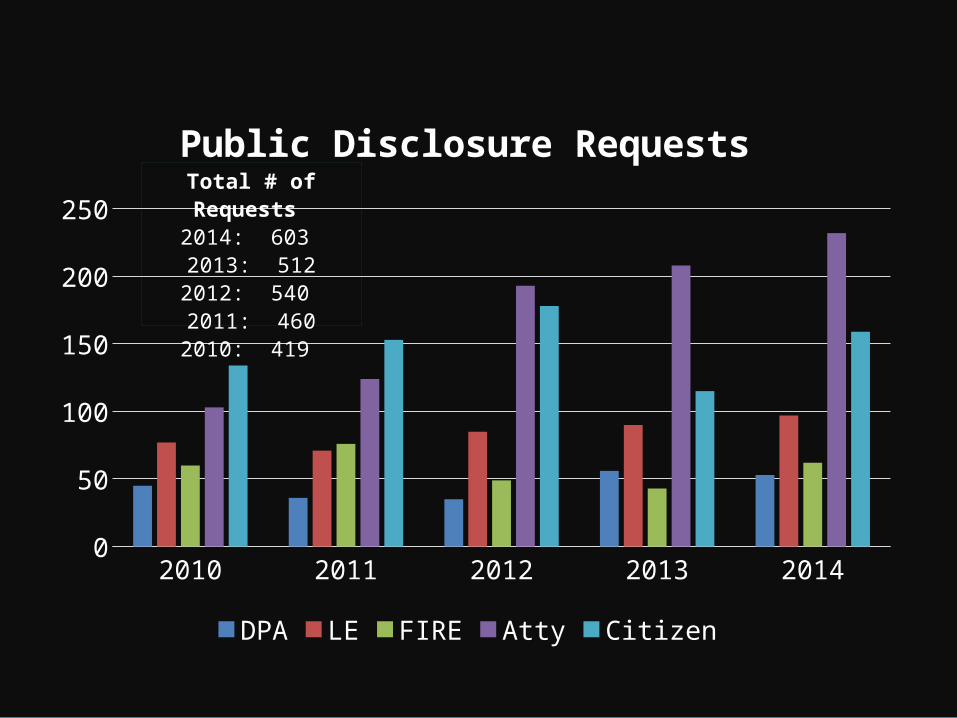
Public Disclosure Requests
DPA LE FIRE Atty Citizen
Total # of Requests 2014: 603 2013: 5122012: 540 2011: 4602010: 419

SYSTEM RELIABILITYGOAL: All systems functional and accurate 99.999%
CAD: 100% MCT: 99.991%Radio: 100%911: 99.981%
MAP/CAD ADDRESS ACCURACY 92% of MSAG errors were corrected within 30 days
100% of MSAG error corrected within 90 days90% of new names are entered into CAD within 7 days.
P.01 Grade of Service Compliant