2014 Capitalization Rate Study - State of California STATE BOARD OF EQUALIZATION. 2014 ....
101
CALIFORNIA STATE BOARD OF EQUALIZATION 2014 Capitalization Rate Study Property and Special Taxes Department David J. Gau, Deputy Director State-Assessed Properties Division John K. Thompson, Chief Lien Date 2014 ____________________________________________________________________________________________________________ BETTY T. YEE SEN. GEORGE RUNNER (Ret.) MICHELLE STEEL JEROME E. HORTON JOHN CHIANG CYNTHIA BRIDGES BOARD MEMBERS First District Second District Third District Fourth District State Controller Executive Director San Francisco Lancaster Orange County Los Angeles __________________________________________________________________________________________________________________________________________________________________________________________________
Transcript of 2014 Capitalization Rate Study - State of California STATE BOARD OF EQUALIZATION. 2014 ....

CALIFORNIA STATE BOARD OF EQUALIZATION
2014 Capitalization Rate Study
Property and Special Taxes Department David J. Gau, Deputy Director
State-Assessed Properties Division
John K. Thompson, Chief
Lien Date 2014 ____________________________________________________________________________________________________________
BETTY T. YEE SEN. GEORGE RUNNER (Ret.) MICHELLE STEEL JEROME E. HORTON JOHN CHIANG CYNTHIA BRIDGES BOARD MEMBERS First District Second District Third District Fourth District State Controller Executive Director
San Francisco Lancaster Orange County Los Angeles __________________________________________________________________________________________________________________________________________________________________________________________________

Executive Summary
i
“The income approach to value includes any method of converting an income stream into a present value estimate (i.e., an indicator of current fair market value). The income approach is also called the capitalization approach because capitalization is the process of converting an expected income into an indicator of value. The methods or techniques used in the income approach may be relatively simple (e.g., income or rent multipliers and direct capitalization), or more complex (e.g., various yield capitalization techniques). All of these methods are referred to as capitalization techniques because they convert an expected future income stream into a present value estimate. The income approach requires careful application because small variations in its key variables (capitalization rate, duration of income stream, estimated income and expenses, etc.) will be mathematically leveraged into a wide range of estimated value. This is particularly true for the capitalization rate variable. The reliability of the income approach is no greater than the validity of the assumptions used to estimate the key variables. The mathematical techniques used in the approach, while sometimes complicated, are merely tools for converting these assumptions into an estimate of current market value.”1 I. Authority for Capitalization Rate Study
Property Tax Rule 8 (g) (2) provides the authority for the method in which the capitalization rates were developed in this study. The rule states “the capitalization rate may be developed…
By deriving a weighted average of the capitalization rates for debt and for equity capital appropriate to the California money markets (the band-of-investment method) and adding increments for expenses that are excluded from outgo because they are based on the value that is being sought or the income that is being capitalized. The appraiser shall weight the rates for debt and equity capital by the respective amounts of such capital he deems most likely to be employed by prospective purchasers.”
II. Band of Investment Approach
In its simplest form, the band of investment method assumes that a purchaser would pay cash (or equity) for a portion of the property and would borrow the balance of the purchase price. For example:
Debt 30% x Cost of Debt 7% = 2.1% Equity 70% x Cost of Equity 12% = 8.4% Weighted Average Cost of Capital 10.5%
1 Assessors’ Handbook 501, Basic Appraisal, Revised January 2002
Executive Summary
ii
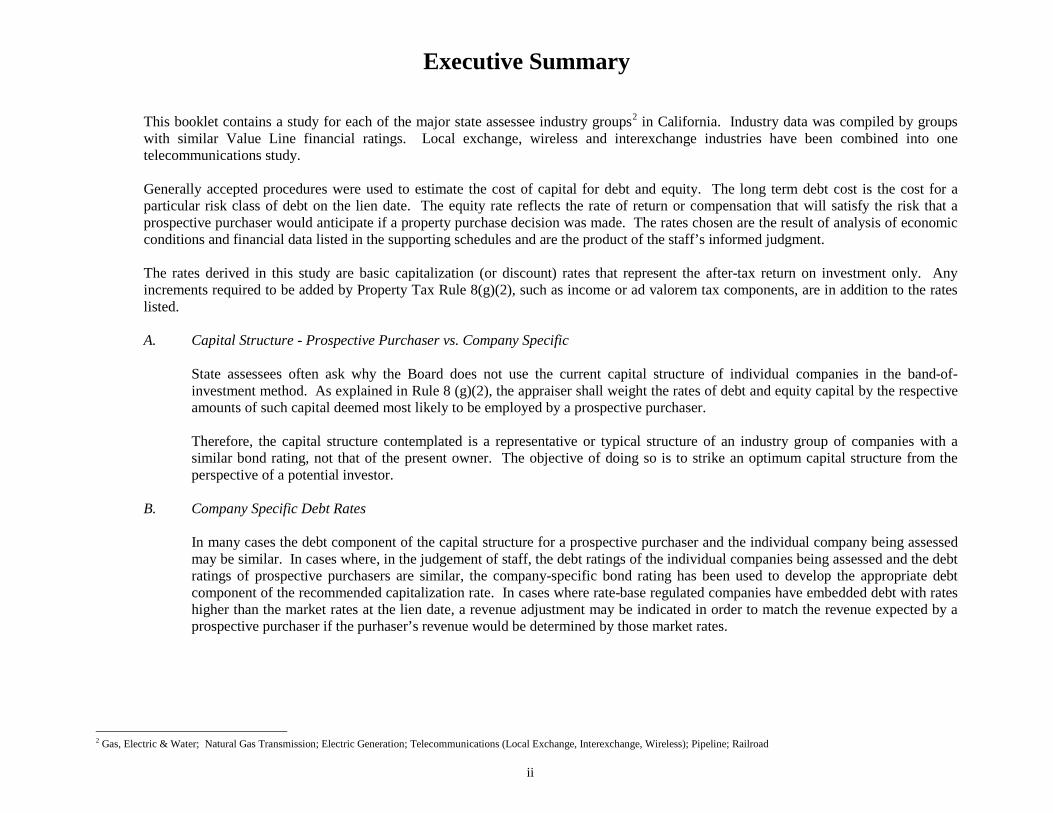
This booklet contains a study for each of the major state assessee industry groups2 in California. Industry data was compiled by groups with similar Value Line financial ratings. Local exchange, wireless and interexchange industries have been combined into one telecommunications study. Generally accepted procedures were used to estimate the cost of capital for debt and equity. The long term debt cost is the cost for a particular risk class of debt on the lien date. The equity rate reflects the rate of return or compensation that will satisfy the risk that a prospective purchaser would anticipate if a property purchase decision was made. The rates chosen are the result of analysis of economic conditions and financial data listed in the supporting schedules and are the product of the staff’s informed judgment. The rates derived in this study are basic capitalization (or discount) rates that represent the after-tax return on investment only. Any increments required to be added by Property Tax Rule 8(g)(2), such as income or ad valorem tax components, are in addition to the rates listed.
A. Capital Structure - Prospective Purchaser vs. Company Specific
State assessees often ask why the Board does not use the current capital structure of individual companies in the band-of-investment method. As explained in Rule 8 (g)(2), the appraiser shall weight the rates of debt and equity capital by the respective amounts of such capital deemed most likely to be employed by a prospective purchaser. Therefore, the capital structure contemplated is a representative or typical structure of an industry group of companies with a similar bond rating, not that of the present owner. The objective of doing so is to strike an optimum capital structure from the perspective of a potential investor.
B. Company Specific Debt Rates
In many cases the debt component of the capital structure for a prospective purchaser and the individual company being assessed may be similar. In cases where, in the judgement of staff, the debt ratings of the individual companies being assessed and the debt ratings of prospective purchasers are similar, the company-specific bond rating has been used to develop the appropriate debt component of the recommended capitalization rate. In cases where rate-base regulated companies have embedded debt with rates higher than the market rates at the lien date, a revenue adjustment may be indicated in order to match the revenue expected by a prospective purchaser if the purhaser’s revenue would be determined by those market rates.
2 Gas, Electric & Water; Natural Gas Transmission; Electric Generation; Telecommunications (Local Exchange, Interexchange, Wireless); Pipeline; Railroad
Executive Summary
iii
C. Impact of Holding Companies on Determination of Capital Structure
Many of the larger state assessees are subsidiaries of their holding company. Stock purchases related to a subsidiary must be made through the parent holding company. Since there is no direct market data for state assessees that are subsidiaries of a holding company, staff must rely, in great part, upon market data related to the holding company.
III. Capital Asset Pricing Model The Capital Asset Pricing Model (CAPM) is a widely accepted theory used to estimate the cost of equity capital. In the application of CAPM, the most sensitive component affecting the outcome is the estimate of the beta3 coefficient. The choice of different time frames and frequencies of measurement in the calculation of the beta can produce significantly different results. Another factor in the use of beta is the choice of whether to use an unadjusted beta or a beta adjusted to reflect the fact that betas tend to revert to the mean over time. In this study, three betas were obtained from separate sources: one adjusted (Value Line) and two unadjusted. Generally the betas from the three sources are averaged to establish the beta used to estimate the cost of equity capital for a specific industry. However, the average beta for highly regulated industries, such as gas or electric transmission and distribution, tend to understate the risk inherent in those securities. Accordingly, for companies in highly regulated environments, the Value Line adjusted beta was chosen as a better estimate of the relative risk in the calculation of the required equity return.
IV. Flotation Costs When new issues of both debt and equity capital are sold to investors, the issuing company incurs transaction costs such as underwriting fees, legal expenses, and prospectus preparation costs. These costs of issuing securities are known as flotation costs. Much like loan fees or points on a mortgage, flotation costs effectively reduce the net proceeds that a firm will receive from issuing securities. The cost of capital is adjusted upward to reflect the expected flotation costs incurred to issue securities. Since the flotation costs are reflected in the weighted average cost of capital, the flotation costs should not be allowed as expenses in projecting cash flows to be capitalized. Each basic capitalization rate in this study has been adjusted to reflect flotation costs.
V. Utilization of Other Studies and Data
Staff appraisers reviewed data and capitalization rate studies submitted by assessees and interested parties in addition to a review of recent regulatory rate case filings and decisions, and where appropriate, used this information in the development of the staff derived rates.
The capitalization rates published in this study are intended to be applied to the unitary operations of the companies subject to assessment by the California State Board of Equalization.
3 The covariance of the returns of a security regressed against the returns of the overall market - a measurement of relative volatility

Page 1
BasicPreferred Common Preferred Common Preferred Cap
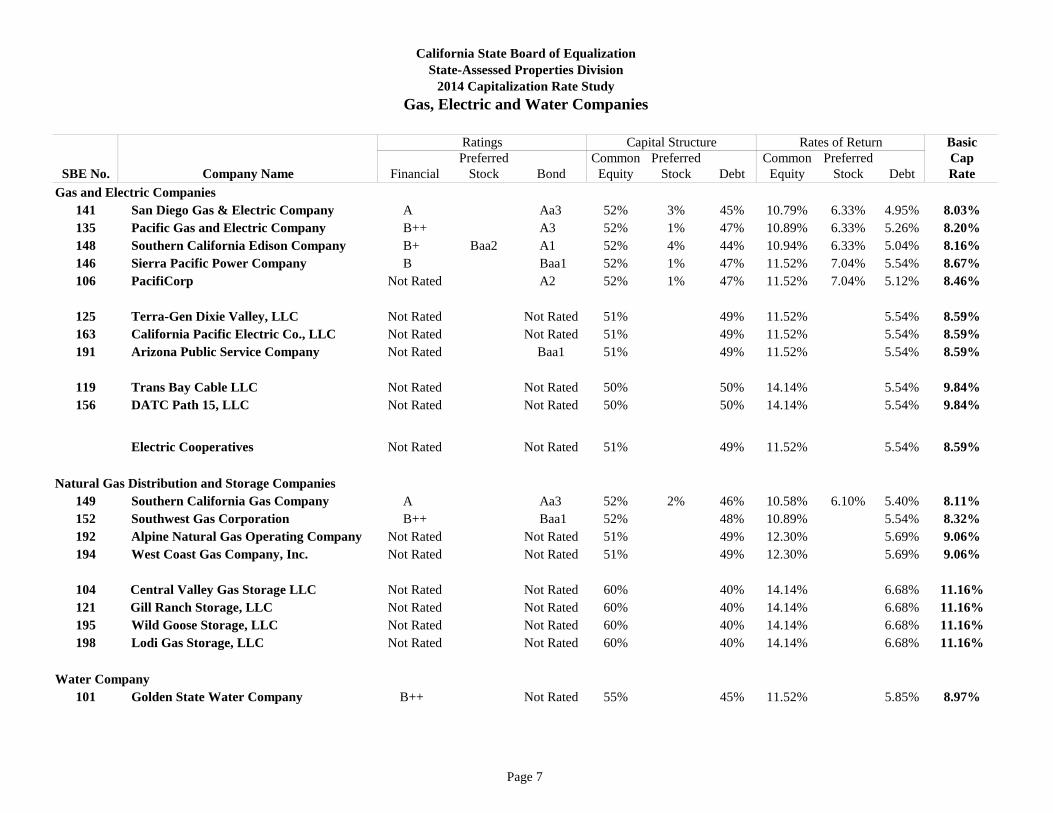
SBE No. Company Name Financial Stock Bond Equity Stock Debt Equity Stock Debt RateGas and Electric Companies
141 San Diego Gas & Electric Company A Aa3 52% 3% 45% 10.79% 6.33% 4.95% 8.03%135 Pacific Gas and Electric Company B++ A3 52% 1% 47% 10.89% 6.33% 5.26% 8.20%148 Southern California Edison Company B+ Baa2 A1 52% 4% 44% 10.94% 6.33% 5.04% 8.16%146 Sierra Pacific Power Company B Baa1 52% 1% 47% 11.52% 7.04% 5.54% 8.67%106 PacifiCorp Not Rated A2 52% 1% 47% 11.52% 7.04% 5.12% 8.46%
125 Terra-Gen Dixie Valley, LLC Not Rated Not Rated 51% 49% 11.52% 5.54% 8.59%163 California Pacific Electric Co., LLC Not Rated Not Rated 51% 49% 11.52% 5.54% 8.59%191 Arizona Public Service Company Not Rated Baa1 51% 49% 11.52% 5.54% 8.59%
119 Trans Bay Cable LLC Not Rated Not Rated 50% 50% 14.14% 5.54% 9.84%156 DATC Path 15, LLC Not Rated Not Rated 50% 50% 14.14% 5.54% 9.84%
Electric Cooperatives Not Rated Not Rated 51% 49% 11.52% 5.54% 8.59%
Natural Gas Distribution and Storage Companies149 Southern California Gas Company A Aa3 52% 2% 46% 10.58% 6.10% 5.40% 8.11%152 Southwest Gas Corporation B++ Baa1 52% 48% 10.89% 5.54% 8.32%192 Alpine Natural Gas Operating Compan Not Rated Not Rated 51% 49% 12.30% 5.69% 9.06%194 West Coast Gas Company, Inc. Not Rated Not Rated 51% 49% 12.30% 5.69% 9.06%
104 Central Valley Gas Storage LLC Not Rated Not Rated 60% 40% 14.14% 6.68% 11.16%121 Gill Ranch Storage, LLC Not Rated Not Rated 60% 40% 14.14% 6.68% 11.16%195 Wild Goose Storage, LLC Not Rated Not Rated 60% 40% 14.14% 6.68% 11.16%198 Lodi Gas Storage, LLC Not Rated Not Rated 60% 40% 14.14% 6.68% 11.16%
Water Company101 Golden State Water Company B++ Not Rated 55% 45% 11.52% 5.85% 8.97%
California State Board of EqualizationState-Assessed Properties Division
2014 Capitalization Rate StudyGas, Electric and Water Companies
Ratings Capital Structure Rates of Return

Page 2
Basic Common Common Cap
SBE No. Company Name Financial Bond Equity Debt Equity Debt Rate
153 Transwestern Pipeline Company Not Rated Not Rated 75% 25% 12.57% 5.34% 10.76%
180 North Baja Pipeline, LLC Not Rated Not Rated 75% 25% 12.57% 5.34% 10.76%
187 Mojave Pipeline Company, LLC Not Rated Not Rated 75% 25% 12.57% 5.34% 10.76%
188 Kern River Gas Transmission Company Not Rated Not Rated 75% 25% 12.57% 5.34% 10.76%
189 Standard Pacific Gas Line, Incorporated Not Rated Not Rated 75% 25% 12.57% 5.34% 10.76%
190 Tuscarora Gas Transmission Company Not Rated Not Rated 75% 25% 12.57% 5.34% 10.76%
196 Questar Southern Trails Pipeline Company Not Rated Not Rated 75% 25% 12.57% 5.34% 10.76%
197 El Paso Pipeline Partners, L.P. Not Rated Not Rated 75% 25% 12.57% 5.34% 10.76%
California State Board of Equalization State-Assessed Properties Division
2014 Capitalization Rate StudyNatural Gas Transmission Companies
Ratings Capital Structure Rates of Return

Page 3
BasicCommon Common Cap
Facility Type Financial Bond Equity Debt Equity Debt Rate3
Modern Electric Generation Technology 1 B B2 60% 40% 13.61% 7.12% 11.02%
Older Electric Generation Technology 2 B B2 60% 40% 15.71% 8.14% 12.68%
1 Modern Electric Generation Technology - Generally high efficiency combined-cycle or simple cycle gas turbine electric generation facilities incorporating contemporary generation technologies.2 Older Electric Generation Technology - Generally older steam turbine electric generation facilities that were sold off by vertically integrated electric utilities and for which no replacements, other than for routine maintenance have been made.
3 Staff may adjust the rates stated above if the specific situation of a facility warrants an adjustment to its basic capitalization rate.
California State Board of EqualizationState-Assessed Properties Division
2014 Capitalization Rate StudyElectric Generation Facilities
Ratings Capital Structure Rates of Return

Page 4
BasicCommon Common Cap
SBE No. Company Name Financial Bond Equity Debt Equity Debt Rate
Local Exchange Companies279 Pacific Bell Telephone Company A++ A2 70% 30% 12.25% 4.91% 10.05%201 Verizon California, Inc. A++ A3 70% 30% 12.25% 5.06% 10.09%284 Citizens Telecommunications Company of California, Inc. B Not Rated 65% 35% 13.30% 5.48% 10.56%294 SureWest Telephone C++ Not Rated 65% 35% 13.30% 5.48% 10.56%
Other Local Exchange Companies Not Rated Not Rated 65% 35% 15.65% 5.63% 12.14%
Wireless Companies2606 AT&T Mobility LLC A++ A2 70% 30% 11.73% 4.91% 9.68%2532 Los Angeles SMSA Ltd., Partnership A++ A3 70% 30% 11.73% 5.06% 9.73%2552 Fresno MSA Limited Partnership A++ A3 70% 30% 11.73% 5.06% 9.73%2559 Cellco Partnership A++ A3 70% 30% 11.73% 5.06% 9.73%2669 California RSA #4 Partnership A++ A3 70% 30% 11.73% 5.06% 9.73%2748 T-Mobile West Corporation B Not Rated 65% 35% 13.04% 5.63% 10.44%2720 Sprint Telephony PCS, L.P. C++ B3 65% 35% 14.87% 6.34% 11.88%
Other Wireless Companies1 Not Rated Not Rated 55% 45% 16.96% 7.86% 12.87%
Wireless Reseller Companies Not Rated Not Rated 55% 45% 19.06% 8.37% 14.25%
Interexchange Companies2310 AT&T Communications A++ A2 70% 30% 13.04% 4.91% 10.60%2274 MCI Communications Services, Inc. A++ A3 70% 30% 13.04% 5.06% 10.64%2372 MCI Metro Access Transmission Services, LLC A++ A3 70% 30% 13.04% 5.06% 10.64%2463 CenturyLink, Inc. B+ Baa3 65% 35% 14.61% 5.48% 11.41%7522 tw telecom of california l.p. B B1 65% 35% 14.61% 6.05% 11.61%2014 Sprint Communications Company, L.P. C++ B3 60% 40% 16.96% 6.34% 12.71%7761 Level 3 Communications, LLC C++ Caa2 60% 40% 16.96% 7.86% 13.32%
Other Interexchange Carriers Not Rated Not Rated 55% 45% 21.68% 7.86% 15.46%
Other Interexchange Resellers Not Rated Not Rated 55% 45% 24.82% 8.37% 17.42%1 Includes Radio Telephone and Paging Companies
California State Board of Equalization State-Assessed Properties Division
2014 Capitalization Rate StudyTelecommunications Companies
Ratings Capital Structure Rates of Return
Page 5
Basic Common Cap
SBE No. Company Name Financial Bond Equity Debt Equity Debt Rate
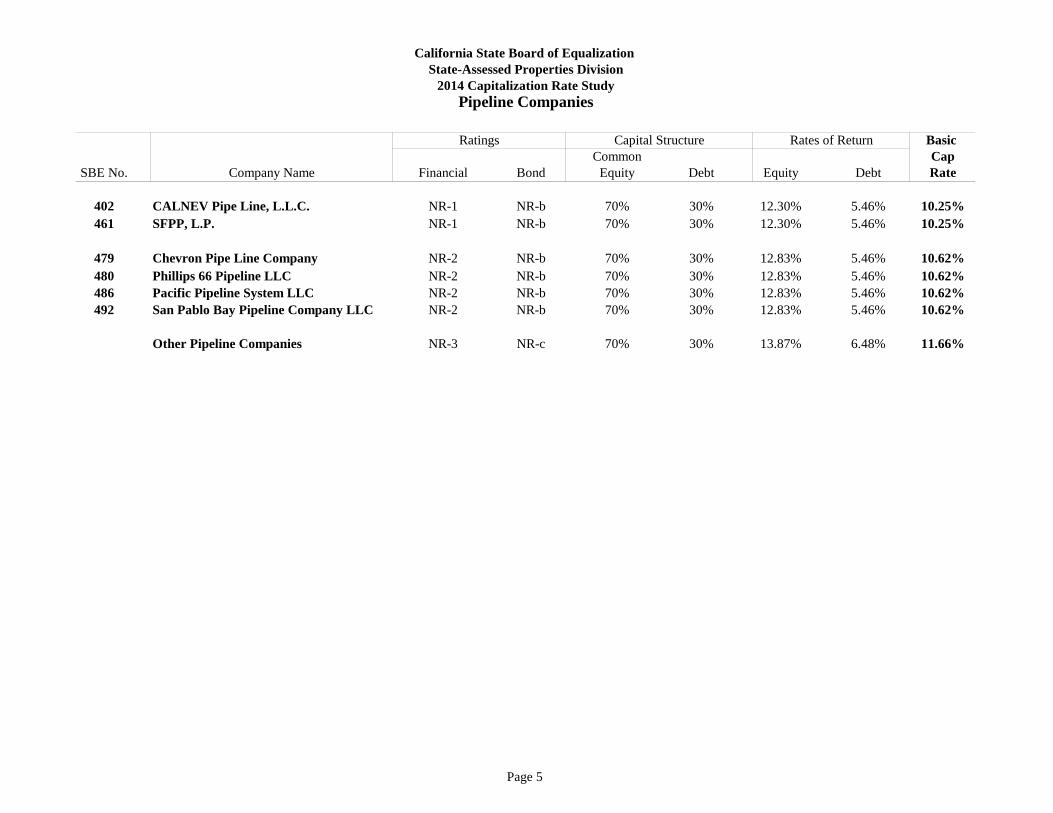
402 CALNEV Pipe Line, L.L.C. NR-1 NR-b 70% 30% 12.30% 5.46% 10.25%461 SFPP, L.P. NR-1 NR-b 70% 30% 12.30% 5.46% 10.25%
479 Chevron Pipe Line Company NR-2 NR-b 70% 30% 12.83% 5.46% 10.62%480 Phillips 66 Pipeline LLC NR-2 NR-b 70% 30% 12.83% 5.46% 10.62%486 Pacific Pipeline System LLC NR-2 NR-b 70% 30% 12.83% 5.46% 10.62%492 San Pablo Bay Pipeline Company LLC NR-2 NR-b 70% 30% 12.83% 5.46% 10.62%
Other Pipeline Companies NR-3 NR-c 70% 30% 13.87% 6.48% 11.66%
California State Board of Equalization State-Assessed Properties Division
2014 Capitalization Rate StudyPipeline Companies
Ratings Capital Structure Rates of Return
Page 6
SBENo.
CompanyName Financial Bond
CommonEquity Debt
CommonEquity Debt
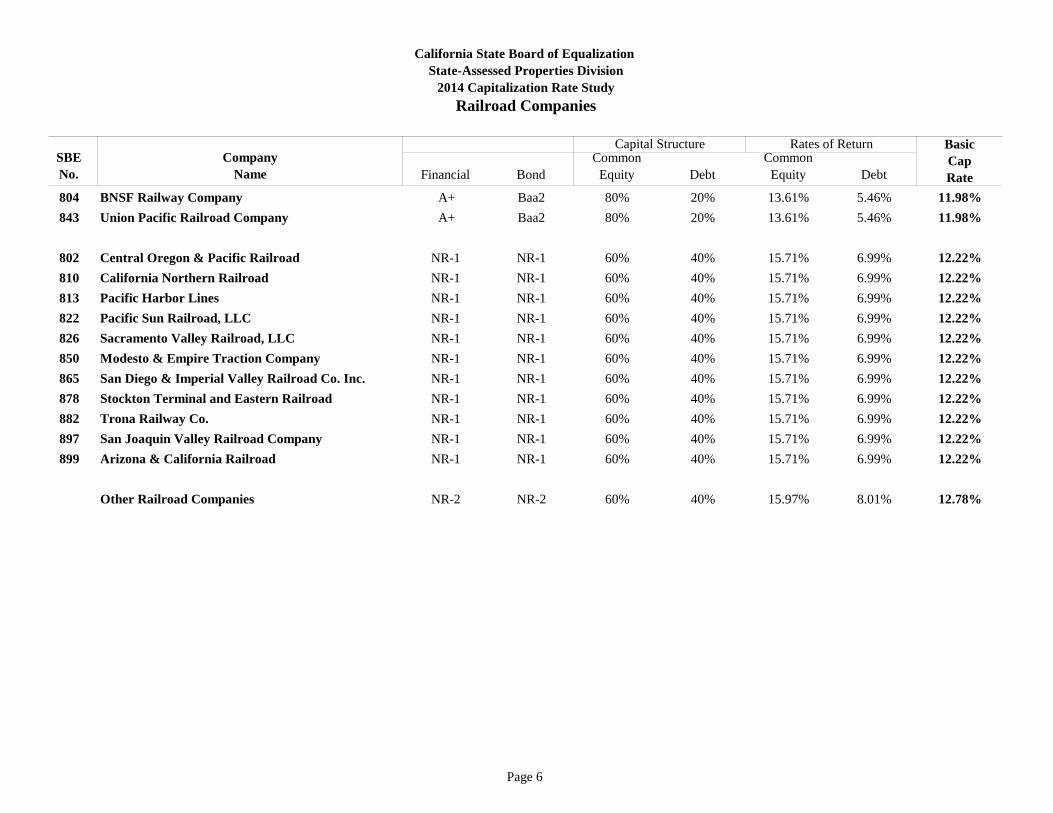
804 BNSF Railway Company A+ Baa2 80% 20% 13.61% 5.46% 11.98%843 Union Pacific Railroad Company A+ Baa2 80% 20% 13.61% 5.46% 11.98%
802 Central Oregon & Pacific Railroad NR-1 NR-1 60% 40% 15.71% 6.99% 12.22%810 California Northern Railroad NR-1 NR-1 60% 40% 15.71% 6.99% 12.22%813 Pacific Harbor Lines NR-1 NR-1 60% 40% 15.71% 6.99% 12.22%822 Pacific Sun Railroad, LLC NR-1 NR-1 60% 40% 15.71% 6.99% 12.22%826 Sacramento Valley Railroad, LLC NR-1 NR-1 60% 40% 15.71% 6.99% 12.22%850 Modesto & Empire Traction Company NR-1 NR-1 60% 40% 15.71% 6.99% 12.22%865 San Diego & Imperial Valley Railroad Co. Inc. NR-1 NR-1 60% 40% 15.71% 6.99% 12.22%878 Stockton Terminal and Eastern Railroad NR-1 NR-1 60% 40% 15.71% 6.99% 12.22%882 Trona Railway Co. NR-1 NR-1 60% 40% 15.71% 6.99% 12.22%897 San Joaquin Valley Railroad Company NR-1 NR-1 60% 40% 15.71% 6.99% 12.22%899 Arizona & California Railroad NR-1 NR-1 60% 40% 15.71% 6.99% 12.22%
Other Railroad Companies NR-2 NR-2 60% 40% 15.97% 8.01% 12.78%
California State Board of Equalization State-Assessed Properties Division
2014 Capitalization Rate StudyRailroad Companies
Capital Structure Rates of Return BasicCapRate
Page 7
BasicPreferred Common Preferred Common Preferred Cap
SBE No. Company Name Financial Stock Bond Equity Stock Debt Equity Stock Debt RateGas and Electric Companies
141 San Diego Gas & Electric Company A Aa3 52% 3% 45% 10.79% 6.33% 4.95% 8.03%135 Pacific Gas and Electric Company B++ A3 52% 1% 47% 10.89% 6.33% 5.26% 8.20%148 Southern California Edison Company B+ Baa2 A1 52% 4% 44% 10.94% 6.33% 5.04% 8.16%146 Sierra Pacific Power Company B Baa1 52% 1% 47% 11.52% 7.04% 5.54% 8.67%106 PacifiCorp Not Rated A2 52% 1% 47% 11.52% 7.04% 5.12% 8.46%
125 Terra-Gen Dixie Valley, LLC Not Rated Not Rated 51% 49% 11.52% 5.54% 8.59%163 California Pacific Electric Co., LLC Not Rated Not Rated 51% 49% 11.52% 5.54% 8.59%191 Arizona Public Service Company Not Rated Baa1 51% 49% 11.52% 5.54% 8.59%
119 Trans Bay Cable LLC Not Rated Not Rated 50% 50% 14.14% 5.54% 9.84%156 DATC Path 15, LLC Not Rated Not Rated 50% 50% 14.14% 5.54% 9.84%
Electric Cooperatives Not Rated Not Rated 51% 49% 11.52% 5.54% 8.59%
Natural Gas Distribution and Storage Companies149 Southern California Gas Company A Aa3 52% 2% 46% 10.58% 6.10% 5.40% 8.11%152 Southwest Gas Corporation B++ Baa1 52% 48% 10.89% 5.54% 8.32%192 Alpine Natural Gas Operating Company Not Rated Not Rated 51% 49% 12.30% 5.69% 9.06%194 West Coast Gas Company, Inc. Not Rated Not Rated 51% 49% 12.30% 5.69% 9.06%
104 Central Valley Gas Storage LLC Not Rated Not Rated 60% 40% 14.14% 6.68% 11.16%121 Gill Ranch Storage, LLC Not Rated Not Rated 60% 40% 14.14% 6.68% 11.16%195 Wild Goose Storage, LLC Not Rated Not Rated 60% 40% 14.14% 6.68% 11.16%198 Lodi Gas Storage, LLC Not Rated Not Rated 60% 40% 14.14% 6.68% 11.16%
Water Company101 Golden State Water Company B++ Not Rated 55% 45% 11.52% 5.85% 8.97%
Ratings Capital Structure
California State Board of EqualizationState-Assessed Properties Division
2014 Capitalization Rate StudyGas, Electric and Water Companies
Rates of Return
Page 8
2014 Capitalization Rate Study Gas, Electric and Water Companies
Industry Notes • In establishing the capital structures for the rate-regulated utilities, staff considered the decisions of the California Public Utilities Commission
(CPUC). For the non-rate-regulated utilities, the capital structures were developed based on the financial data collected and the relative risks of the utilities sampled in the Capitalization Rate Study.
• Staff considered the following in the development of equity rates:
1. CPUC-authorized rates of return 2. FERC-authorized rates of return 3. Discounted Cash Flow Model 4. Capital Asset Pricing Model – ex post and ex ante risk premiums
• Staff considered the following in the development of debt rates:
1. Moody’s Utility Bond Yield Spreads 2. The debt rates that a prospective purchaser would expect at lien date
• The following utilities were added to the 2014 Capitalization Rate Study sample:
1. Pepco Holdings, Inc. 2. York Water Co.
• The following utilities were removed from the 2014 Capitalization Rate Study sample: 1. CH Energy Group, Inc. was acquired by Fortis Inc., which is traded on the Toronto Stock Exchange. 2. NV Energy, Inc. merged into MidAmerican Energy Holdings Company, which is privately owned.
Page 9
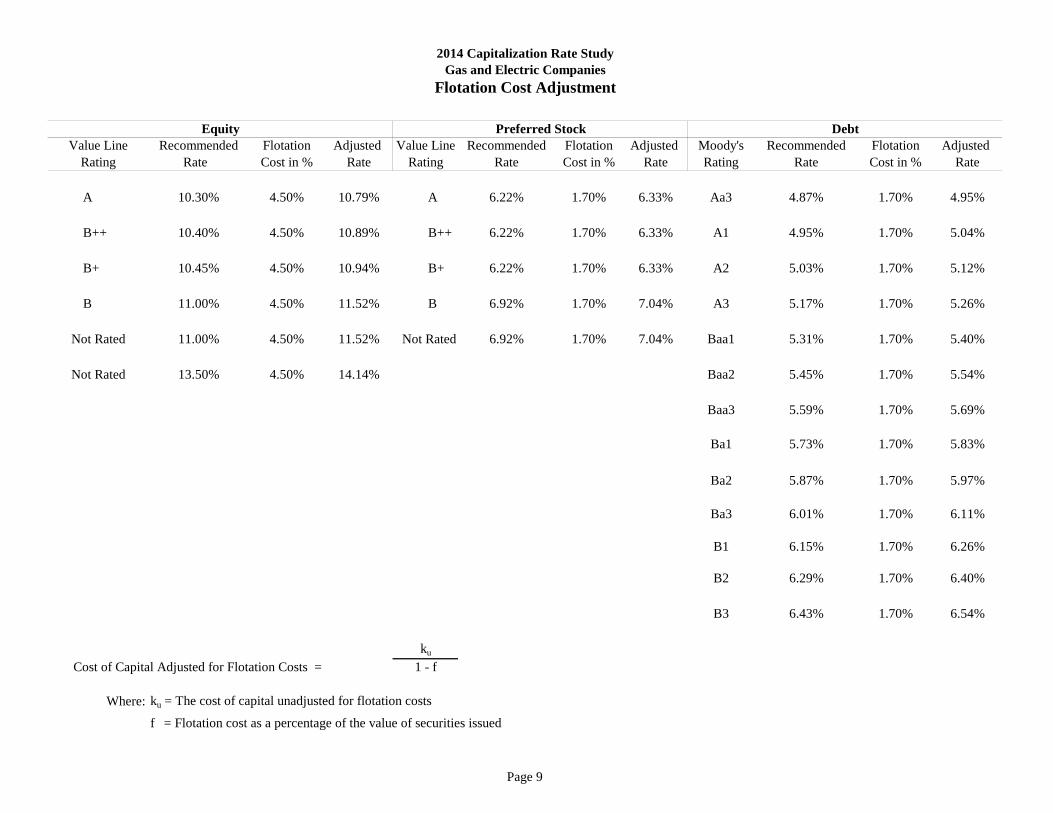
Value Line Recommended Flotation Adjusted Value Line Recommended Flotation Adjusted Moody's Recommended Flotation Adjusted Rating Rate Cost in % Rate Rating Rate Cost in % Rate Rating Rate Cost in % Rate
A 10.30% 4.50% 10.79% A 6.22% 1.70% 6.33% Aa3 4.87% 1.70% 4.95%
B++ 10.40% 4.50% 10.89% B++ 6.22% 1.70% 6.33% A1 4.95% 1.70% 5.04%
B+ 10.45% 4.50% 10.94% B+ 6.22% 1.70% 6.33% A2 5.03% 1.70% 5.12%
B 11.00% 4.50% 11.52% B 6.92% 1.70% 7.04% A3 5.17% 1.70% 5.26%
Not Rated 11.00% 4.50% 11.52% Not Rated 6.92% 1.70% 7.04% Baa1 5.31% 1.70% 5.40%
Not Rated 13.50% 4.50% 14.14% Baa2 5.45% 1.70% 5.54%
Baa3 5.59% 1.70% 5.69%
Ba1 5.73% 1.70% 5.83%
Ba2 5.87% 1.70% 5.97%
Ba3 6.01% 1.70% 6.11%
B1 6.15% 1.70% 6.26%
B2 6.29% 1.70% 6.40%
B3 6.43% 1.70% 6.54%
ku
Cost of Capital Adjusted for Flotation Costs = 1 - f
Where: ku = The cost of capital unadjusted for flotation costs
f = Flotation cost as a percentage of the value of securities issued
2014 Capitalization Rate StudyGas and Electric Companies
Flotation Cost Adjustment
Equity DebtPreferred Stock
Page 10
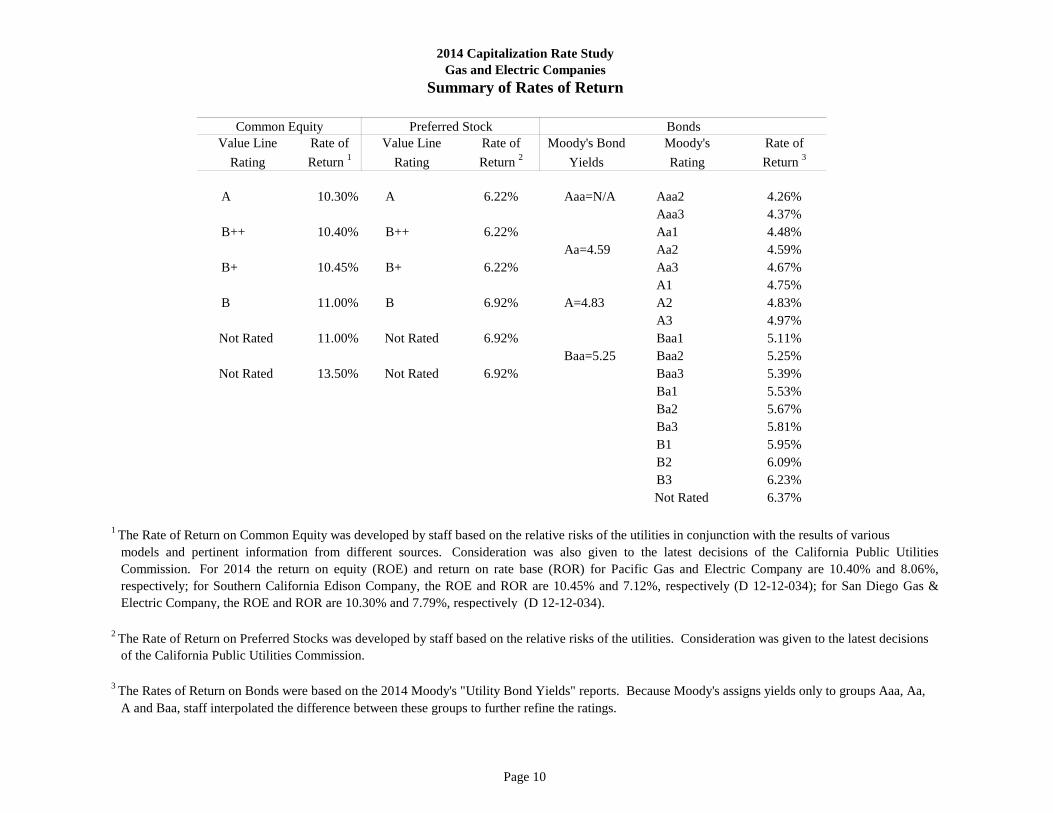
Value Line Rate of Value Line Rate of Moody's Bond Moody's Rate ofRating Return 1 Rating Return 2 Yields Rating Return 3
A 10.30% A 6.22% Aaa=N/A Aaa2 4.26%Aaa3 4.37%
B++ 10.40% B++ 6.22% Aa1 4.48%Aa=4.59 Aa2 4.59%
B+ 10.45% B+ 6.22% Aa3 4.67%A1 4.75%
B 11.00% B 6.92% A=4.83 A2 4.83%A3 4.97%
Not Rated 11.00% Not Rated 6.92% Baa1 5.11%Baa=5.25 Baa2 5.25%
Not Rated 13.50% Not Rated 6.92% Baa3 5.39%Ba1 5.53%Ba2 5.67%Ba3 5.81%B1 5.95%B2 6.09%B3 6.23%
Not Rated 6.37%
of the California Public Utilities Commission.
Common Equity
2014 Capitalization Rate StudyGas and Electric Companies
Summary of Rates of Return
Preferred Stock Bonds
A and Baa, staff interpolated the difference between these groups to further refine the ratings.
1 The Rate of Return on Common Equity was developed by staff based on the relative risks of the utilities in conjunction with the results of various
2 The Rate of Return on Preferred Stocks was developed by staff based on the relative risks of the utilities. Consideration was given to the latest decisions
models and pertinent information from different sources. Consideration was also given to the latest decisions of the California Public UtilitiesCommission. For 2014 the return on equity (ROE) and return on rate base (ROR) for Pacific Gas and Electric Company are 10.40% and 8.06%,respectively; for Southern California Edison Company, the ROE and ROR are 10.45% and 7.12%, respectively (D 12-12-034); for San Diego Gas &Electric Company, the ROE and ROR are 10.30% and 7.79%, respectively (D 12-12-034).
3 The Rates of Return on Bonds were based on the 2014 Moody's "Utility Bond Yields" reports. Because Moody's assigns yields only to groups Aaa, Aa,
Page 11
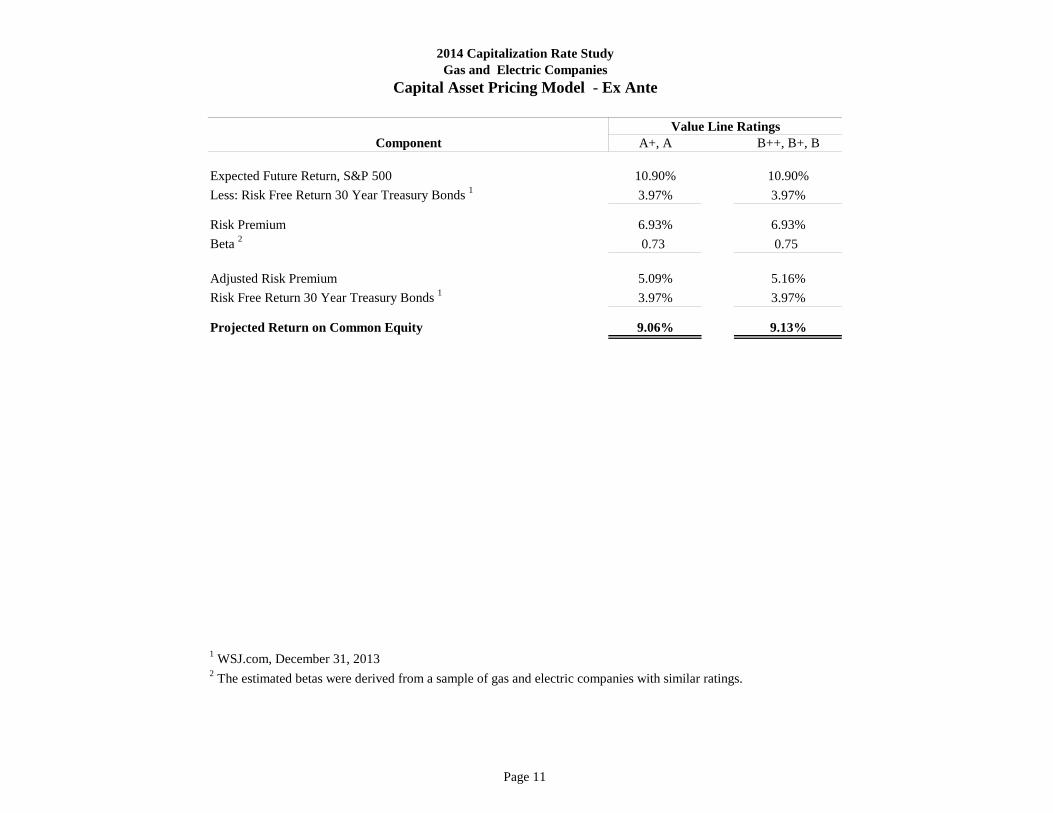
Component A+, A B++, B+, B
Expected Future Return, S&P 500 10.90% 10.90%Less: Risk Free Return 30 Year Treasury Bonds 1 3.97% 3.97%
Risk Premium 6.93% 6.93%Beta 2 0.73 0.75
Adjusted Risk Premium 5.09% 5.16%Risk Free Return 30 Year Treasury Bonds 1 3.97% 3.97%
Projected Return on Common Equity 9.06% 9.13%
1 WSJ.com, December 31, 20132 The estimated betas were derived from a sample of gas and electric companies with similar ratings.
Value Line Ratings
2014 Capitalization Rate StudyGas and Electric Companies
Capital Asset Pricing Model - Ex Ante

Page 12
Component A+, A B++, B+, B
Common Stock Returns, S&P 500 (1928 - 2013) 1 11.50% 11.50%Less: 10 Year Treasury Bonds (1928 - 2013) 1 5.21% 5.21%
Risk Premium 6.29% 6.29%Beta 2 0.73 0.75
Adjusted Risk Premium 4.62% 4.69%Risk Free Return 30 Year Treasury Bonds 3 3.97% 3.97%
Projected Return on Common Equity 8.59% 8.66%
1 Damodaran Online, January 5, 2014 2 The estimated betas were derived from a sample of gas and electric companies with similar ratings. 3 WSJ.com, December 31, 2013
2014 Capitalization Rate StudyGas and Electric Companies
Capital Asset Pricing Model - Ex Post
Value Line Ratings

Page 13
2014 Capitalization Rate StudyGas and Electric Companies
Equity Rates
a b c d e f g h i j k l mStock Est. Est. Dividend Est. Est. E/P DvYld+ DvYld+
Value Line Company Price 2014 2013 2013 2014 Yield Dividend Earnings Ratio DvGrth ErngsGrRating Name 12/31/13 Earnings Earnings Dividends Dividends (g/c) Growth Growth (d/c) (h+i) (h+j)
A+ Consolidated Edison, Inc. 55.28 3.85 3.80 2.46 2.50 4.52% 1.50% 2.17% 6.96% 6.02% 6.69%A Allete, Inc. 49.88 2.75 2.60 1.90 1.96 3.93% 3.50% 6.00% 5.51% 7.43% 9.93%A Alliant Energy Corp. 51.60 3.45 3.25 1.88 1.96 3.80% 4.50% 5.37% 6.69% 8.30% 9.17%A Avista Corp. 28.19 1.85 1.75 1.22 1.28 4.54% 4.50% 4.67% 6.56% 9.04% 9.21%A Cleco Corp. 46.62 2.75 2.60 1.43 1.58 3.39% 10.00% 7.17% 5.90% 13.39% 10.56%A Duke Energy Corp. 69.01 4.50 4.05 3.09 3.15 4.56% 2.00% 3.67% 6.52% 6.56% 8.23%A Integrys Energy Group, Inc. 54.41 3.70 3.60 2.72 2.72 5.00% 1.00% 4.87% 6.80% 6.00% 9.87%A MGE Energy Inc. 57.71 3.30 3.15 1.60 1.65 2.86% 3.50% 6.50% 5.72% 6.36% 9.36%A NextEra Energy, Inc. 85.62 5.25 5.00 2.64 2.88 3.36% 8.50% 6.10% 6.13% 11.86% 9.46%A OGE Energy Corp. 33.90 2.00 1.85 0.85 0.93 2.74% 8.50% 5.33% 5.90% 11.24% 8.08%A Pinnacle West Capital Corp. 52.92 3.85 3.70 1.66 2.29 4.33% 2.00% 4.67% 7.28% 6.33% 8.99%A Sempra Energy 89.76 4.55 4.30 2.52 2.64 2.94% 7.50% 5.33% 5.07% 10.44% 8.27%A Southern Co. 41.11 2.80 2.65 2.01 2.08 5.06% 3.50% 3.47% 6.81% 8.56% 8.53%A Vectren Corp. 35.50 2.20 1.65 1.43 1.45 4.08% 2.50% 5.83% 6.20% 6.58% 9.92%A Wisconsin Energy Corp. 41.34 2.60 2.45 1.45 1.56 3.77% 13.00% 5.93% 6.29% 16.77% 9.71%
Mean 3.93% 5.07% 5.14% 6.29% 8.99% 9.06%Median 3.93% 3.50% 5.33% 6.29% 8.30% 9.21%Weighted Average 8.94% 8.61%
Sources: Columns a, d, e, f, g and i were extracted from Value Line.Column j represents the average estimated earnings growth extracted from Value Line, Zacks.com and ThomsonReuters.com.Column c was acquired from Finance.Yahoo.com and represents December 31, 2013 closing stock prices.
Page 14
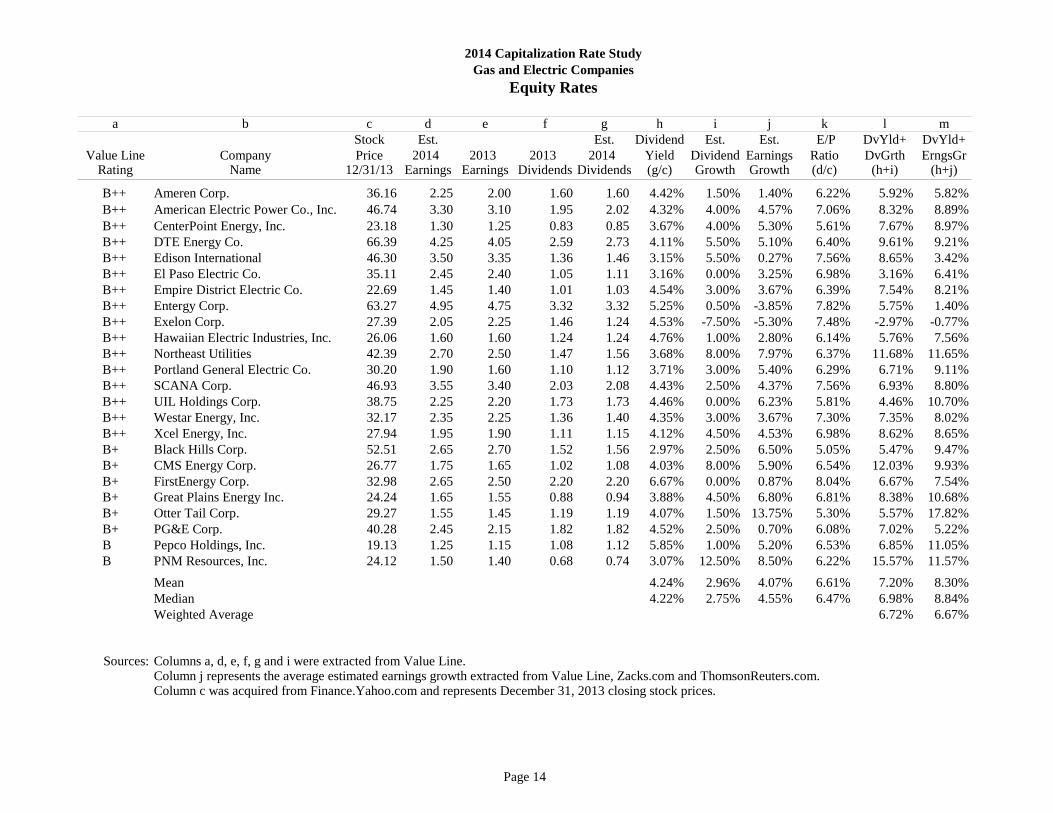
2014 Capitalization Rate StudyGas and Electric Companies
Equity Rates
a b c d e f g h i j k l mStock Est. Est. Dividend Est. Est. E/P DvYld+ DvYld+
Value Line Company Price 2014 2013 2013 2014 Yield Dividend Earnings Ratio DvGrth ErngsGrRating Name 12/31/13 Earnings Earnings Dividends Dividends (g/c) Growth Growth (d/c) (h+i) (h+j)
B++ Ameren Corp. 36.16 2.25 2.00 1.60 1.60 4.42% 1.50% 1.40% 6.22% 5.92% 5.82%B++ American Electric Power Co., Inc. 46.74 3.30 3.10 1.95 2.02 4.32% 4.00% 4.57% 7.06% 8.32% 8.89%B++ CenterPoint Energy, Inc. 23.18 1.30 1.25 0.83 0.85 3.67% 4.00% 5.30% 5.61% 7.67% 8.97%B++ DTE Energy Co. 66.39 4.25 4.05 2.59 2.73 4.11% 5.50% 5.10% 6.40% 9.61% 9.21%B++ Edison International 46.30 3.50 3.35 1.36 1.46 3.15% 5.50% 0.27% 7.56% 8.65% 3.42%B++ El Paso Electric Co. 35.11 2.45 2.40 1.05 1.11 3.16% 0.00% 3.25% 6.98% 3.16% 6.41%B++ Empire District Electric Co. 22.69 1.45 1.40 1.01 1.03 4.54% 3.00% 3.67% 6.39% 7.54% 8.21%B++ Entergy Corp. 63.27 4.95 4.75 3.32 3.32 5.25% 0.50% -3.85% 7.82% 5.75% 1.40%B++ Exelon Corp. 27.39 2.05 2.25 1.46 1.24 4.53% -7.50% -5.30% 7.48% -2.97% -0.77%B++ Hawaiian Electric Industries, Inc. 26.06 1.60 1.60 1.24 1.24 4.76% 1.00% 2.80% 6.14% 5.76% 7.56%B++ Northeast Utilities 42.39 2.70 2.50 1.47 1.56 3.68% 8.00% 7.97% 6.37% 11.68% 11.65%B++ Portland General Electric Co. 30.20 1.90 1.60 1.10 1.12 3.71% 3.00% 5.40% 6.29% 6.71% 9.11%B++ SCANA Corp. 46.93 3.55 3.40 2.03 2.08 4.43% 2.50% 4.37% 7.56% 6.93% 8.80%B++ UIL Holdings Corp. 38.75 2.25 2.20 1.73 1.73 4.46% 0.00% 6.23% 5.81% 4.46% 10.70%B++ Westar Energy, Inc. 32.17 2.35 2.25 1.36 1.40 4.35% 3.00% 3.67% 7.30% 7.35% 8.02%B++ Xcel Energy, Inc. 27.94 1.95 1.90 1.11 1.15 4.12% 4.50% 4.53% 6.98% 8.62% 8.65%B+ Black Hills Corp. 52.51 2.65 2.70 1.52 1.56 2.97% 2.50% 6.50% 5.05% 5.47% 9.47%B+ CMS Energy Corp. 26.77 1.75 1.65 1.02 1.08 4.03% 8.00% 5.90% 6.54% 12.03% 9.93%B+ FirstEnergy Corp. 32.98 2.65 2.50 2.20 2.20 6.67% 0.00% 0.87% 8.04% 6.67% 7.54%B+ Great Plains Energy Inc. 24.24 1.65 1.55 0.88 0.94 3.88% 4.50% 6.80% 6.81% 8.38% 10.68%B+ Otter Tail Corp. 29.27 1.55 1.45 1.19 1.19 4.07% 1.50% 13.75% 5.30% 5.57% 17.82%B+ PG&E Corp. 40.28 2.45 2.15 1.82 1.82 4.52% 2.50% 0.70% 6.08% 7.02% 5.22%B Pepco Holdings, Inc. 19.13 1.25 1.15 1.08 1.12 5.85% 1.00% 5.20% 6.53% 6.85% 11.05%B PNM Resources, Inc. 24.12 1.50 1.40 0.68 0.74 3.07% 12.50% 8.50% 6.22% 15.57% 11.57%
Mean 4.24% 2.96% 4.07% 6.61% 7.20% 8.30%Median 4.22% 2.75% 4.55% 6.47% 6.98% 8.84%Weighted Average 6.72% 6.67%
Sources: Columns a, d, e, f, g and i were extracted from Value Line.Column j represents the average estimated earnings growth extracted from Value Line, Zacks.com and ThomsonReuters.com.Column c was acquired from Finance.Yahoo.com and represents December 31, 2013 closing stock prices.

Page 15
2014 Capitalization Rate StudyGas and Electric Companies
Long Term Earnings Growth
a b c d e fValue Line Rating Company Name
A+ Consolidated Edison, Inc. 2.50% 2.30% 1.70% 2.17%A Allete, Inc. 6.00% 6.00% 6.00% 6.00%A Alliant Energy Corp. 6.00% 5.30% 4.80% 5.37%A Avista Corp. 4.00% 5.00% 5.00% 4.67%A Cleco Corp. 5.50% 8.00% 8.00% 7.17%A Duke Energy Corp. 4.00% 3.60% 3.40% 3.67%A Integrys Energy Group, Inc. 4.50% 4.80% 5.30% 4.87%A MGE Energy Inc. 6.50% N/A N/A 6.50%A NextEra Energy, Inc. 5.50% 6.20% 6.60% 6.10%A OGE Energy Corp. 5.00% 6.00% 5.00% 5.33%A Pinnacle West Capital Corp. 5.00% 4.50% 4.50% 4.67%A Sempra Energy 4.50% 6.00% 5.50% 5.33%A Southern Co. 3.00% 3.90% 3.50% 3.47%A Vectren Corp. 7.50% 5.00% 5.00% 5.83%A Wisconsin Energy Corp. 7.00% 5.50% 5.30% 5.93%B++ Ameren Corp. -0.50% 2.70% 2.00% 1.40%B++ American Electric Power Co., Inc. 5.50% 4.10% 4.10% 4.57%B++ CenterPoint Energy, Inc. 6.00% 5.30% 4.60% 5.30%B++ DTE Energy Co. 5.00% 5.50% 4.80% 5.10%B++ Edison International 1.50% 0.60% -1.30% 0.27%B++ El Paso Electric Co. 3.00% 3.50% N/A 3.25%B++ Empire District Electric Co. 5.00% 3.00% 3.00% 3.67%B++ Entergy Corp. -3.50% N/A -4.20% -3.85%B++ Exelon Corp. -5.50% -2.70% -7.70% -5.30%B++ Hawaiian Electric Industries, Inc. 3.50% 2.40% 2.50% 2.80%B++ Northeast Utilities 8.00% 7.80% 8.10% 7.97%B++ Portland General Electric Co. 3.50% 6.00% 6.70% 5.40%B++ SCANA Corp. 4.50% 4.40% 4.20% 4.37%B++ UIL Holdings Corp. 4.00% 7.60% 7.10% 6.23%B++ Westar Energy, Inc. 6.00% 4.00% 1.00% 3.67%B++ Xcel Energy, Inc. 4.50% 4.30% 4.80% 4.53%
Value Line AverageThomsonZacks
Page 16
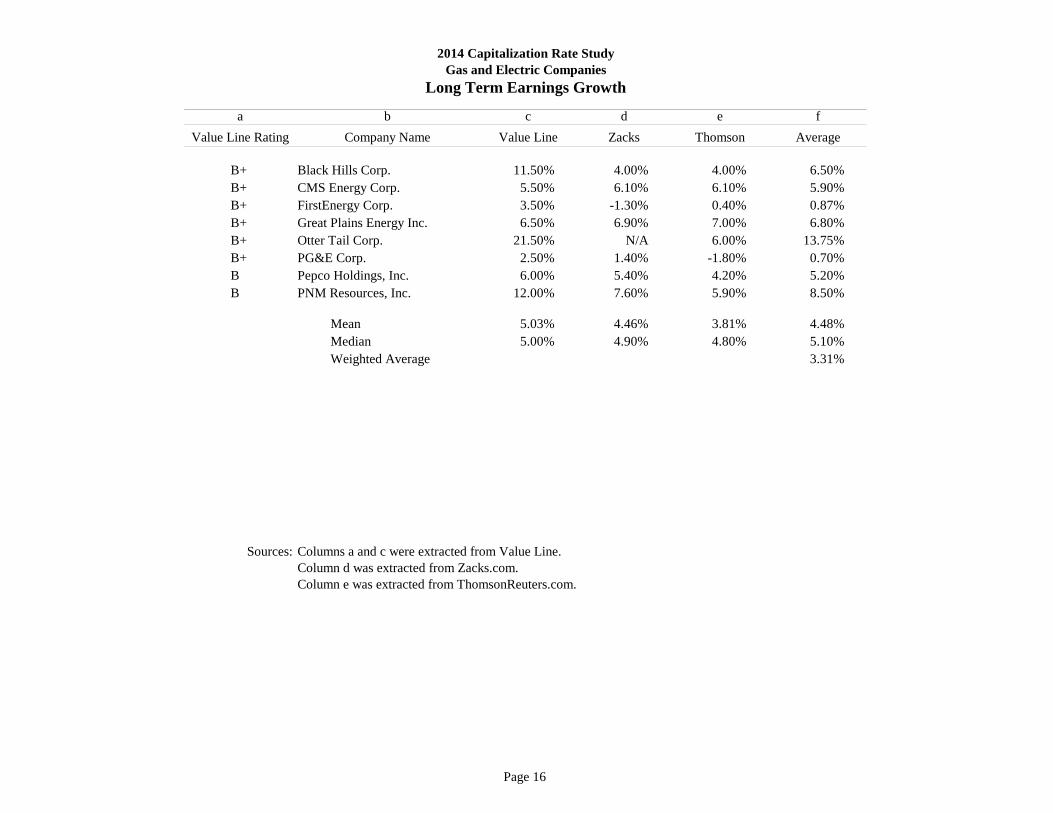
2014 Capitalization Rate StudyGas and Electric Companies
Long Term Earnings Growth
a b c d e fValue Line Rating Company Name
B+ Black Hills Corp. 11.50% 4.00% 4.00% 6.50%B+ CMS Energy Corp. 5.50% 6.10% 6.10% 5.90%B+ FirstEnergy Corp. 3.50% -1.30% 0.40% 0.87%B+ Great Plains Energy Inc. 6.50% 6.90% 7.00% 6.80%B+ Otter Tail Corp. 21.50% N/A 6.00% 13.75%B+ PG&E Corp. 2.50% 1.40% -1.80% 0.70%B Pepco Holdings, Inc. 6.00% 5.40% 4.20% 5.20%B PNM Resources, Inc. 12.00% 7.60% 5.90% 8.50%
Mean 5.03% 4.46% 3.81% 4.48%Median 5.00% 4.90% 4.80% 5.10%Weighted Average 3.31%
Sources: Columns a and c were extracted from Value Line. Column d was extracted from Zacks.com.Column e was extracted from ThomsonReuters.com.
Value Line AverageThomsonZacks

Page 17
a b c d e f g h i j k l Common Common Mkt Value L.T. Pfd Common Total L.T. Pfd Common
Value Line Company Stock Stock Price Equity Debt Stock Equity Capital Debt Stock EquityRating Name Outstanding 12/31/13 ($million) ($million) ($million) ($million) ($million) % % %
A+ Consolidated Edison, Inc. 292,888,192 55.28 16,190.86 10,493.00 0.00 16,190.86 26,683.86 39.32% 0.00% 60.68%A Allete, Inc. 40,736,213 49.88 2,031.92 1,064.20 0.00 2,031.92 3,096.12 34.37% 0.00% 65.63%A Alliant Energy Corp. 110,943,669 51.60 5,724.69 3,104.80 200.00 5,724.69 9,029.49 34.39% 2.21% 63.40%A Avista Corp. 59,985,467 28.19 1,690.99 1,248.50 0.00 1,690.99 2,939.49 42.47% 0.00% 57.53%A Cleco Corp. 60,452,158 46.62 2,818.28 1,291.00 0.00 2,818.28 4,109.28 31.42% 0.00% 68.58%A Duke Energy Corp. 705,908,295 69.01 48,714.73 37,359.00 0.00 48,714.73 86,073.73 43.40% 0.00% 56.60%A Integrys Energy Group, Inc. 79,807,435 54.41 4,342.32 2,506.20 51.10 4,342.32 6,899.62 36.32% 0.74% 62.94%A MGE Energy Inc. 23,113,638 57.71 1,333.89 400.40 0.00 1,333.89 1,734.29 23.09% 0.00% 76.91%A NextEra Energy, Inc. 430,681,556 85.62 36,874.95 23,862.00 0.00 36,874.95 60,736.95 39.29% 0.00% 60.71%A OGE Energy Corp. 198,453,261 33.90 6,727.57 2,400.00 0.00 6,727.57 9,127.57 26.29% 0.00% 73.71%A Pinnacle West Capital Corp. 109,996,850 52.92 5,821.03 2,820.20 0.00 5,821.03 8,641.23 32.64% 0.00% 67.36%A Sempra Energy 244,248,233 89.76 21,923.72 10,530.00 99.00 21,923.72 32,552.72 32.35% 0.30% 67.35%A Southern Co. 873,903,083 41.11 35,926.16 19,943.00 1,082.00 35,926.16 56,951.16 35.02% 1.90% 63.08%A Vectren Corp. 82,361,172 35.50 2,923.82 1,906.50 0.00 2,923.82 4,830.32 39.47% 0.00% 60.53%A Wisconsin Energy Corp. 226,519,569 41.34 9,364.32 4,370.90 30.40 9,364.32 13,765.62 31.75% 0.22% 68.03%
Mean 34.77% 0.36% 64.87%Median 34.39% 0.00% 63.40%Weighted Average 37.69% 0.45% 61.87%
Sources: Columns a, c, f and g were extracted from Value Line. Column d was acquired from Finance.Yahoo.com and represents December 31, 2013 closing stock prices.
2014 Capitalization Rate StudyGas and Electric Companies
Capital Structure
Page 18
a b c d e f g h i j k l Common Common Mkt Value L.T. Pfd Common Total L.T. Pfd Common
Value Line Stock Stock Price Equity Debt Stock Equity Capital Debt Stock EquityRating Company Name Outstanding 12/31/13 ($million) ($million) ($million) ($million) ($million) % % %
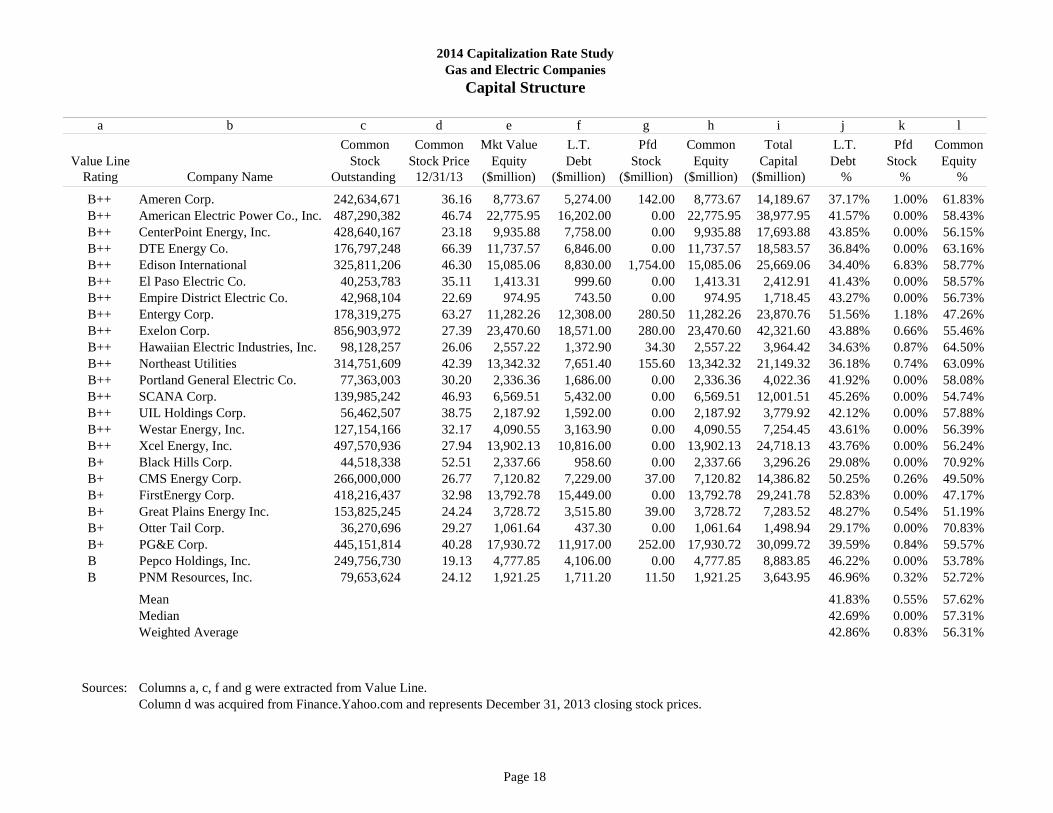
B++ Ameren Corp. 242,634,671 36.16 8,773.67 5,274.00 142.00 8,773.67 14,189.67 37.17% 1.00% 61.83%B++ American Electric Power Co., Inc. 487,290,382 46.74 22,775.95 16,202.00 0.00 22,775.95 38,977.95 41.57% 0.00% 58.43%B++ CenterPoint Energy, Inc. 428,640,167 23.18 9,935.88 7,758.00 0.00 9,935.88 17,693.88 43.85% 0.00% 56.15%B++ DTE Energy Co. 176,797,248 66.39 11,737.57 6,846.00 0.00 11,737.57 18,583.57 36.84% 0.00% 63.16%B++ Edison International 325,811,206 46.30 15,085.06 8,830.00 1,754.00 15,085.06 25,669.06 34.40% 6.83% 58.77%B++ El Paso Electric Co. 40,253,783 35.11 1,413.31 999.60 0.00 1,413.31 2,412.91 41.43% 0.00% 58.57%B++ Empire District Electric Co. 42,968,104 22.69 974.95 743.50 0.00 974.95 1,718.45 43.27% 0.00% 56.73%B++ Entergy Corp. 178,319,275 63.27 11,282.26 12,308.00 280.50 11,282.26 23,870.76 51.56% 1.18% 47.26%B++ Exelon Corp. 856,903,972 27.39 23,470.60 18,571.00 280.00 23,470.60 42,321.60 43.88% 0.66% 55.46%B++ Hawaiian Electric Industries, Inc. 98,128,257 26.06 2,557.22 1,372.90 34.30 2,557.22 3,964.42 34.63% 0.87% 64.50%B++ Northeast Utilities 314,751,609 42.39 13,342.32 7,651.40 155.60 13,342.32 21,149.32 36.18% 0.74% 63.09%B++ Portland General Electric Co. 77,363,003 30.20 2,336.36 1,686.00 0.00 2,336.36 4,022.36 41.92% 0.00% 58.08%B++ SCANA Corp. 139,985,242 46.93 6,569.51 5,432.00 0.00 6,569.51 12,001.51 45.26% 0.00% 54.74%B++ UIL Holdings Corp. 56,462,507 38.75 2,187.92 1,592.00 0.00 2,187.92 3,779.92 42.12% 0.00% 57.88%B++ Westar Energy, Inc. 127,154,166 32.17 4,090.55 3,163.90 0.00 4,090.55 7,254.45 43.61% 0.00% 56.39%B++ Xcel Energy, Inc. 497,570,936 27.94 13,902.13 10,816.00 0.00 13,902.13 24,718.13 43.76% 0.00% 56.24%B+ Black Hills Corp. 44,518,338 52.51 2,337.66 958.60 0.00 2,337.66 3,296.26 29.08% 0.00% 70.92%B+ CMS Energy Corp. 266,000,000 26.77 7,120.82 7,229.00 37.00 7,120.82 14,386.82 50.25% 0.26% 49.50%B+ FirstEnergy Corp. 418,216,437 32.98 13,792.78 15,449.00 0.00 13,792.78 29,241.78 52.83% 0.00% 47.17%B+ Great Plains Energy Inc. 153,825,245 24.24 3,728.72 3,515.80 39.00 3,728.72 7,283.52 48.27% 0.54% 51.19%B+ Otter Tail Corp. 36,270,696 29.27 1,061.64 437.30 0.00 1,061.64 1,498.94 29.17% 0.00% 70.83%B+ PG&E Corp. 445,151,814 40.28 17,930.72 11,917.00 252.00 17,930.72 30,099.72 39.59% 0.84% 59.57%B Pepco Holdings, Inc. 249,756,730 19.13 4,777.85 4,106.00 0.00 4,777.85 8,883.85 46.22% 0.00% 53.78%B PNM Resources, Inc. 79,653,624 24.12 1,921.25 1,711.20 11.50 1,921.25 3,643.95 46.96% 0.32% 52.72%
Mean 41.83% 0.55% 57.62%Median 42.69% 0.00% 57.31%Weighted Average 42.86% 0.83% 56.31%
Sources: Columns a, c, f and g were extracted from Value Line. Column d was acquired from Finance.Yahoo.com and represents December 31, 2013 closing stock prices.
2014 Capitalization Rate StudyGas and Electric Companies
Capital Structure

Page 19
a b c d e f g h iValue Standard Company's Debt
Value Line Line Zacks & Poor's Average Tax Equity UnleveredRating Company Name Beta Beta Beta Beta Rate Ratio1 Beta2
A+ Consolidated Edison, Inc. 0.60 0.18 0.19 0.32 0.35 0.67 0.42A Allete, Inc. 0.75 0.62 0.75 0.71 0.22 0.56 0.52A Alliant Energy Corp. 0.75 0.51 0.44 0.57 0.15 0.65 0.48A Avista Corp. 0.70 0.74 0.74 0.73 0.36 0.85 0.45A Cleco Corp. 0.70 0.44 0.43 0.52 0.32 0.59 0.50A Duke Energy Corp. 0.65 0.28 0.34 0.42 0.34 0.59 0.47A Integrys Energy Group, Inc. 1.00 0.97 0.87 0.95 0.39 0.51 0.76A MGE Energy Inc. 0.65 0.42 0.35 0.47 0.38 0.32 0.54A NextEra Energy, Inc. 0.70 0.51 0.47 0.56 0.27 0.74 0.46A OGE Energy Corp. 0.85 0.71 0.72 0.76 0.25 0.48 0.62A Pinnacle West Capital Corp. 0.70 0.51 0.50 0.57 0.35 0.68 0.49A Sempra Energy 0.80 0.38 0.43 0.54 0.39 0.60 0.58A Southern Co. 0.55 0.24 0.26 0.35 0.36 0.59 0.40A Vectren Corp. 0.70 0.52 0.47 0.56 0.35 0.69 0.48A Wisconsin Energy Corp. 0.65 0.23 0.25 0.38 0.39 0.55 0.49
Mean 0.72 0.48 0.48 0.56 0.61 0.51Median 0.70 0.51 0.44 0.56 0.59 0.49Weighted Average 0.47 0.62 0.47
Relevered Beta based on 45% Debt Capital Structure and Mean Unlevered Beta 3 0.76Relevered Beta based on 45% Debt Capital Structure and Weighted Average Unlevered Beta 3 0.71
Sources: Columns a, c and g were extracted from Value Line.
Column d was extracted from Zacks.com. Column e was extracted from Standard and Poor's Stock Reports.
1 Average Debt to Equity Ratio over the last five years. 2 Unlevered Beta = Beta/[1+(1-tc)(D/E)]; where D/E is the debt to equity ratio, tc is the company's most recent tax rate. 3 Relevered Beta = [Unlevered Beta][1+(1-tp)(D/E)]; where D/E is the debt to equity ratio, tp is a prospective purchaser's tax rate (assumed to be 40%).
2014 Capitalization Rate StudyGas and Electric Companies
Beta Analysis
Page 20
a b c d e f g h iValue Standard Company's Debt
Value Line Line Zacks & Poor's Average Tax Equity UnleveredRating Company Name Beta Beta Beta Beta Rate Ratio1 Beta2
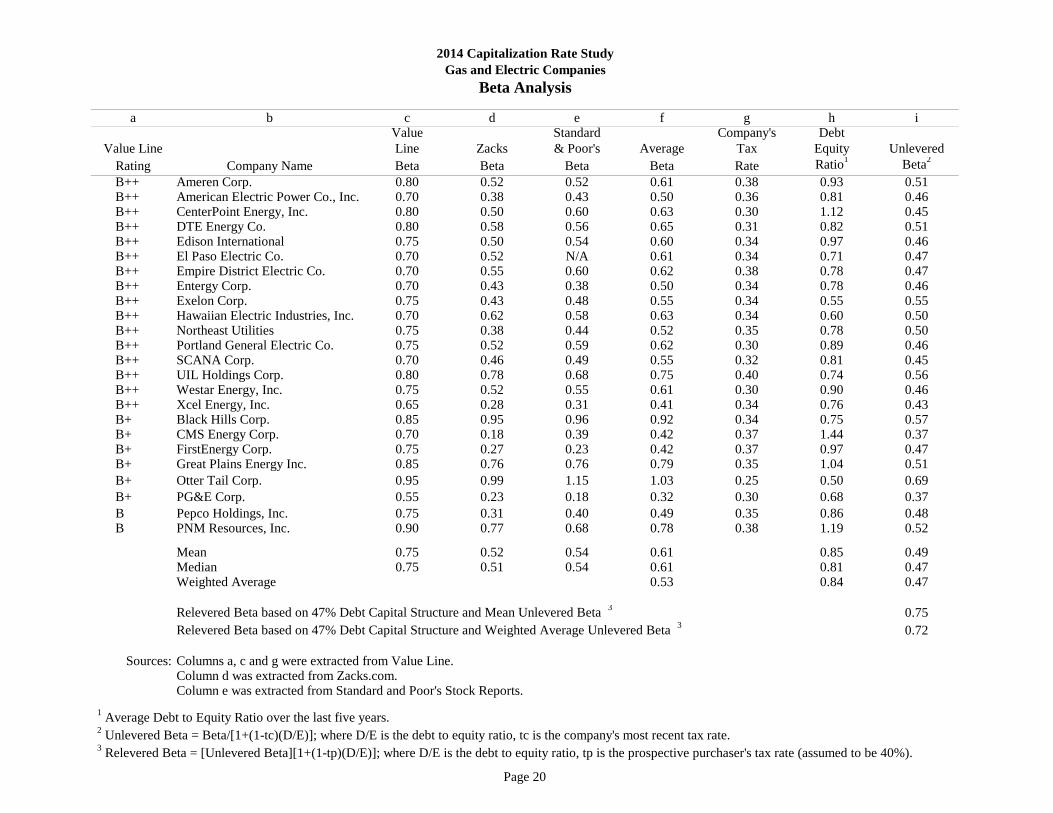
B++ Ameren Corp. 0.80 0.52 0.52 0.61 0.38 0.93 0.51B++ American Electric Power Co., Inc. 0.70 0.38 0.43 0.50 0.36 0.81 0.46B++ CenterPoint Energy, Inc. 0.80 0.50 0.60 0.63 0.30 1.12 0.45B++ DTE Energy Co. 0.80 0.58 0.56 0.65 0.31 0.82 0.51B++ Edison International 0.75 0.50 0.54 0.60 0.34 0.97 0.46B++ El Paso Electric Co. 0.70 0.52 N/A 0.61 0.34 0.71 0.47B++ Empire District Electric Co. 0.70 0.55 0.60 0.62 0.38 0.78 0.47B++ Entergy Corp. 0.70 0.43 0.38 0.50 0.34 0.78 0.46B++ Exelon Corp. 0.75 0.43 0.48 0.55 0.34 0.55 0.55B++ Hawaiian Electric Industries, Inc. 0.70 0.62 0.58 0.63 0.34 0.60 0.50B++ Northeast Utilities 0.75 0.38 0.44 0.52 0.35 0.78 0.50B++ Portland General Electric Co. 0.75 0.52 0.59 0.62 0.30 0.89 0.46B++ SCANA Corp. 0.70 0.46 0.49 0.55 0.32 0.81 0.45B++ UIL Holdings Corp. 0.80 0.78 0.68 0.75 0.40 0.74 0.56B++ Westar Energy, Inc. 0.75 0.52 0.55 0.61 0.30 0.90 0.46B++ Xcel Energy, Inc. 0.65 0.28 0.31 0.41 0.34 0.76 0.43B+ Black Hills Corp. 0.85 0.95 0.96 0.92 0.34 0.75 0.57B+ CMS Energy Corp. 0.70 0.18 0.39 0.42 0.37 1.44 0.37B+ FirstEnergy Corp. 0.75 0.27 0.23 0.42 0.37 0.97 0.47B+ Great Plains Energy Inc. 0.85 0.76 0.76 0.79 0.35 1.04 0.51B+ Otter Tail Corp. 0.95 0.99 1.15 1.03 0.25 0.50 0.69B+ PG&E Corp. 0.55 0.23 0.18 0.32 0.30 0.68 0.37B Pepco Holdings, Inc. 0.75 0.31 0.40 0.49 0.35 0.86 0.48B PNM Resources, Inc. 0.90 0.77 0.68 0.78 0.38 1.19 0.52
Mean 0.75 0.52 0.54 0.61 0.85 0.49Median 0.75 0.51 0.54 0.61 0.81 0.47Weighted Average 0.53 0.84 0.47
Relevered Beta based on 47% Debt Capital Structure and Mean Unlevered Beta 3 0.75Relevered Beta based on 47% Debt Capital Structure and Weighted Average Unlevered Beta 3 0.72
Sources: Columns a, c and g were extracted from Value Line. Column d was extracted from Zacks.com. Column e was extracted from Standard and Poor's Stock Reports.
1 Average Debt to Equity Ratio over the last five years. 2 Unlevered Beta = Beta/[1+(1-tc)(D/E)]; where D/E is the debt to equity ratio, tc is the company's most recent tax rate. 3 Relevered Beta = [Unlevered Beta][1+(1-tp)(D/E)]; where D/E is the debt to equity ratio, tp is the prospective purchaser's tax rate (assumed to be 40%).
2014 Capitalization Rate StudyGas and Electric Companies
Beta Analysis
Page 21
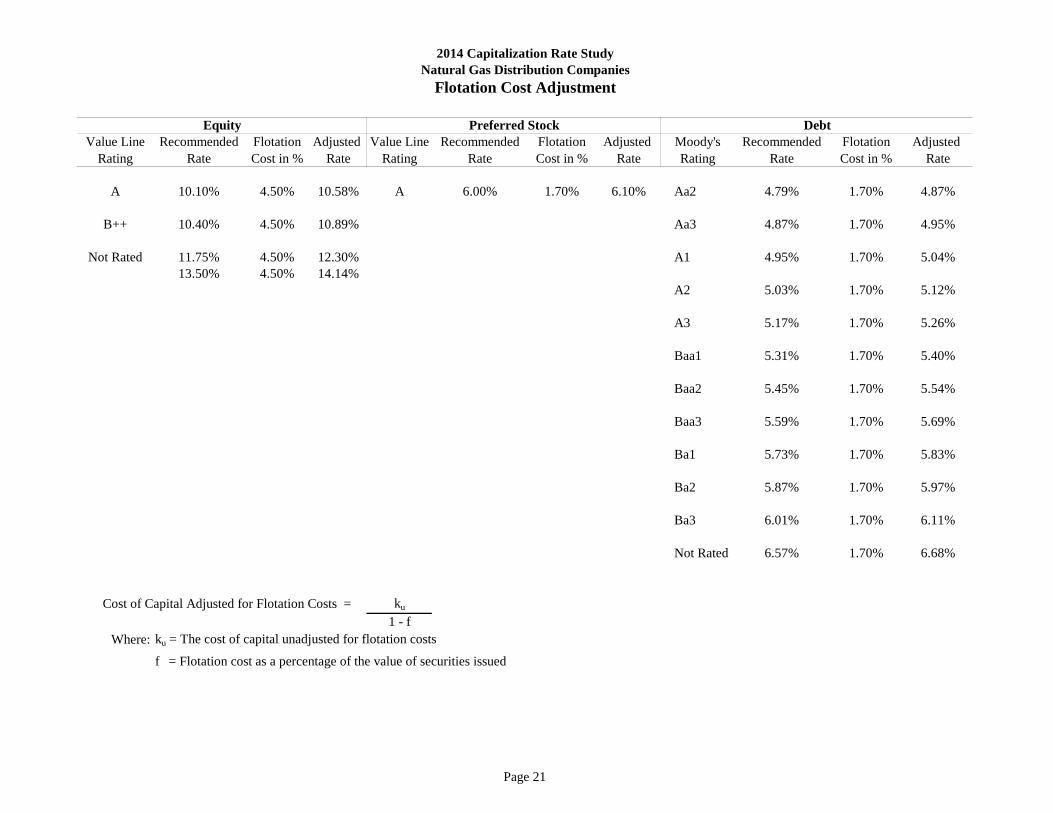
Value Line Recommended Flotation Adjusted Value Line Recommended Flotation Adjusted Moody's Recommended Flotation Adjusted Rating Rate Cost in % Rate Rating Rate Cost in % Rate Rating Rate Cost in % Rate
A 10.10% 4.50% 10.58% A 6.00% 1.70% 6.10% Aa2 4.79% 1.70% 4.87%
B++ 10.40% 4.50% 10.89% Aa3 4.87% 1.70% 4.95%
Not Rated 11.75% 4.50% 12.30% A1 4.95% 1.70% 5.04%13.50% 4.50% 14.14%
A2 5.03% 1.70% 5.12%
A3 5.17% 1.70% 5.26%
Baa1 5.31% 1.70% 5.40%
Baa2 5.45% 1.70% 5.54%
Baa3 5.59% 1.70% 5.69%
Ba1 5.73% 1.70% 5.83%
Ba2 5.87% 1.70% 5.97%
Ba3 6.01% 1.70% 6.11%
Not Rated 6.57% 1.70% 6.68%
Cost of Capital Adjusted for Flotation Costs = ku
1 - fWhere: ku = The cost of capital unadjusted for flotation costs
f = Flotation cost as a percentage of the value of securities issued
Equity DebtPreferred Stock
2014 Capitalization Rate StudyNatural Gas Distribution Companies
Flotation Cost Adjustment
Page 22
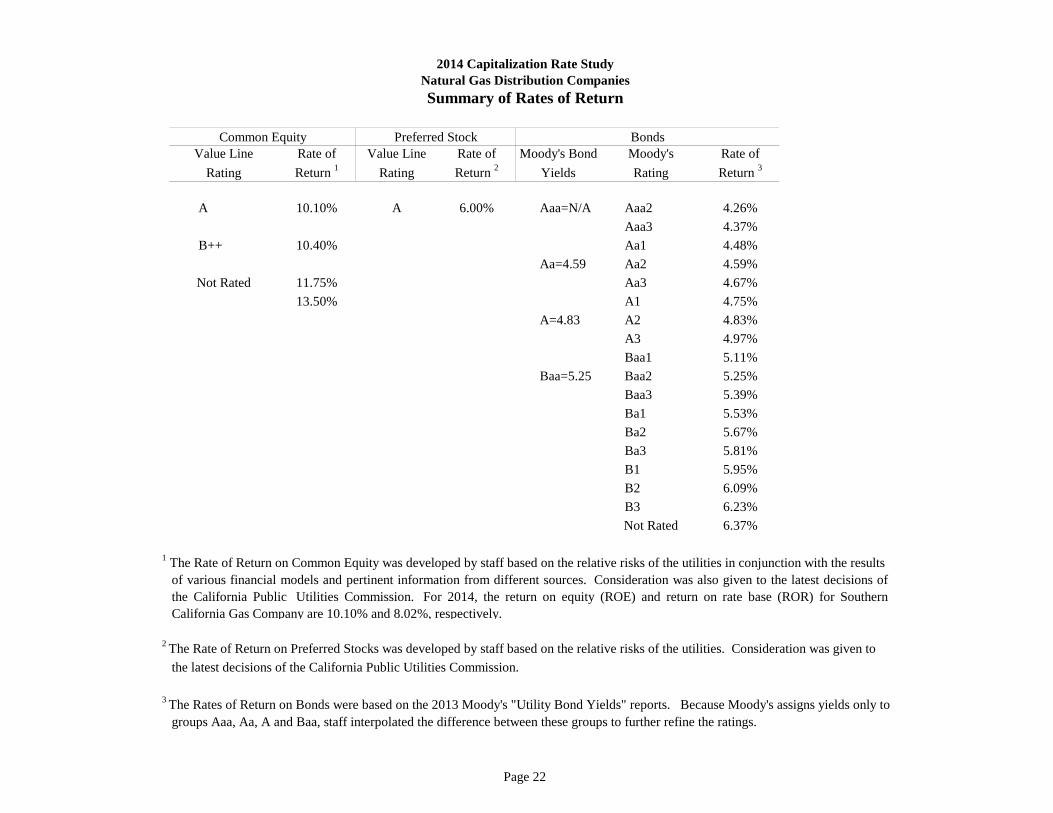
Value Line Rate of Value Line Rate of Moody's Bond Moody's Rate ofRating Return 1 Rating Return 2 Yields Rating Return 3
A 10.10% A 6.00% Aaa=N/A Aaa2 4.26%Aaa3 4.37%
B++ 10.40% Aa1 4.48%Aa=4.59 Aa2 4.59%
Not Rated 11.75% Aa3 4.67%13.50% A1 4.75%
A=4.83 A2 4.83%A3 4.97%Baa1 5.11%
Baa=5.25 Baa2 5.25%Baa3 5.39%Ba1 5.53%Ba2 5.67%Ba3 5.81%B1 5.95%B2 6.09%B3 6.23%Not Rated 6.37%
groups Aaa, Aa, A and Baa, staff interpolated the difference between these groups to further refine the ratings.
Common Equity Preferred Stock Bonds
2 The Rate of Return on Preferred Stocks was developed by staff based on the relative risks of the utilities. Consideration was given tothe latest decisions of the California Public Utilities Commission.
3 The Rates of Return on Bonds were based on the 2013 Moody's "Utility Bond Yields" reports. Because Moody's assigns yields only to
2014 Capitalization Rate StudyNatural Gas Distribution CompaniesSummary of Rates of Return
of various financial models and pertinent information from different sources. Consideration was also given to the latest decisions ofthe California Public Utilities Commission. For 2014, the return on equity (ROE) and return on rate base (ROR) for SouthernCalifornia Gas Company are 10.10% and 8.02%, respectively.
1 The Rate of Return on Common Equity was developed by staff based on the relative risks of the utilities in conjunction with the results
Page 23
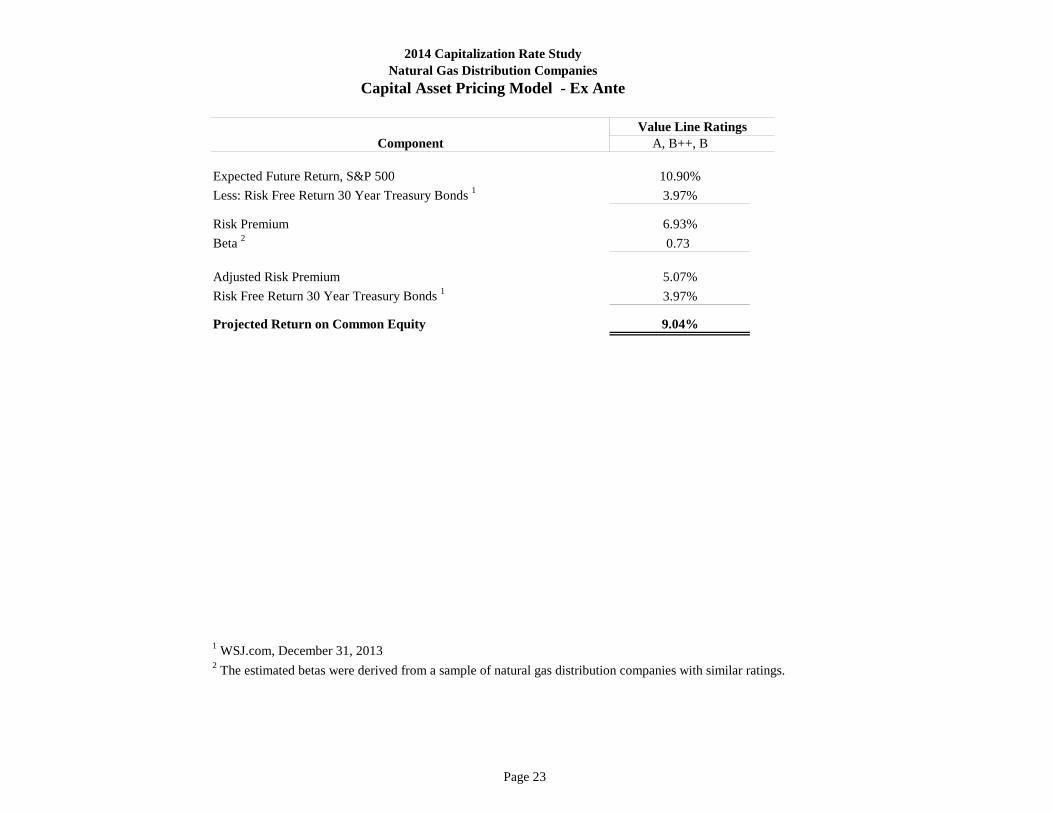
Component A, B++, B
Expected Future Return, S&P 500 10.90%Less: Risk Free Return 30 Year Treasury Bonds 1 3.97%
Risk Premium 6.93%Beta 2 0.73
Adjusted Risk Premium 5.07%Risk Free Return 30 Year Treasury Bonds 1 3.97%
Projected Return on Common Equity 9.04%
1 WSJ.com, December 31, 20132 The estimated betas were derived from a sample of natural gas distribution companies with similar ratings.
Value Line Ratings
2014 Capitalization Rate StudyNatural Gas Distribution Companies
Capital Asset Pricing Model - Ex Ante
Page 24
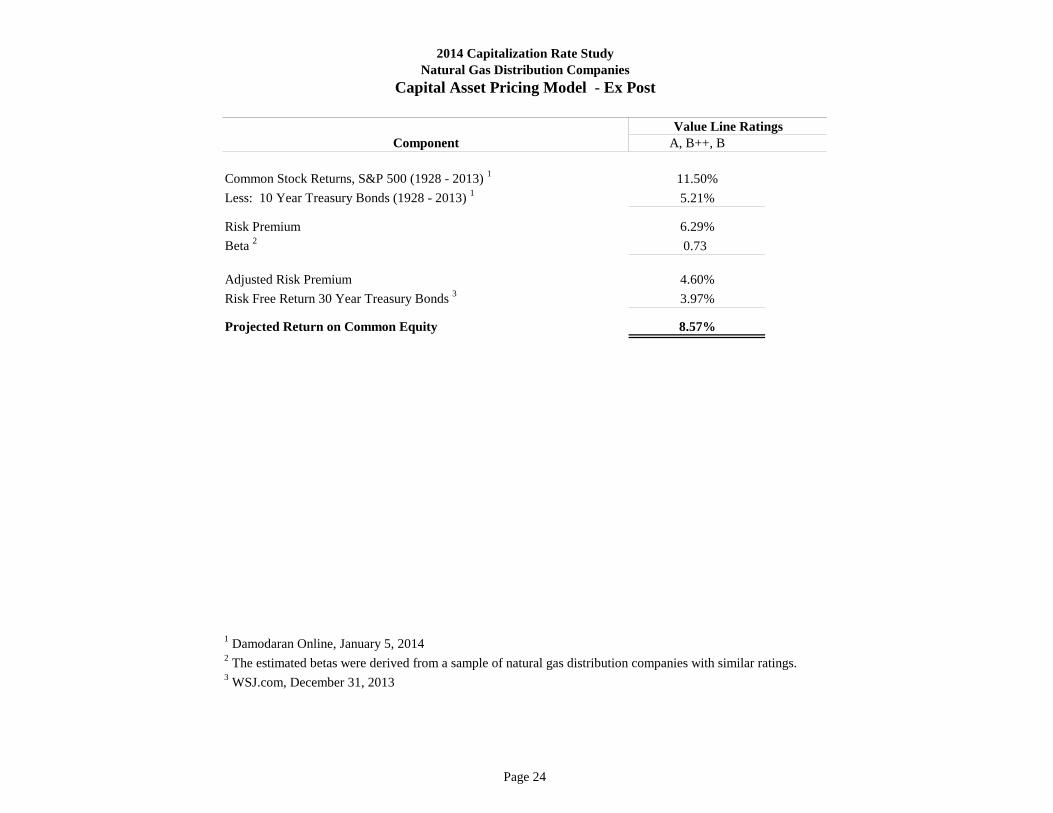
Component A, B++, B
Common Stock Returns, S&P 500 (1928 - 2013) 1 11.50%Less: 10 Year Treasury Bonds (1928 - 2013) 1 5.21%
Risk Premium 6.29%Beta 2 0.73
Adjusted Risk Premium 4.60%Risk Free Return 30 Year Treasury Bonds 3 3.97%
Projected Return on Common Equity 8.57%
1 Damodaran Online, January 5, 2014 2 The estimated betas were derived from a sample of natural gas distribution companies with similar ratings.3 WSJ.com, December 31, 2013
Value Line Ratings
2014 Capitalization Rate StudyNatural Gas Distribution Companies
Capital Asset Pricing Model - Ex Post
Page 25
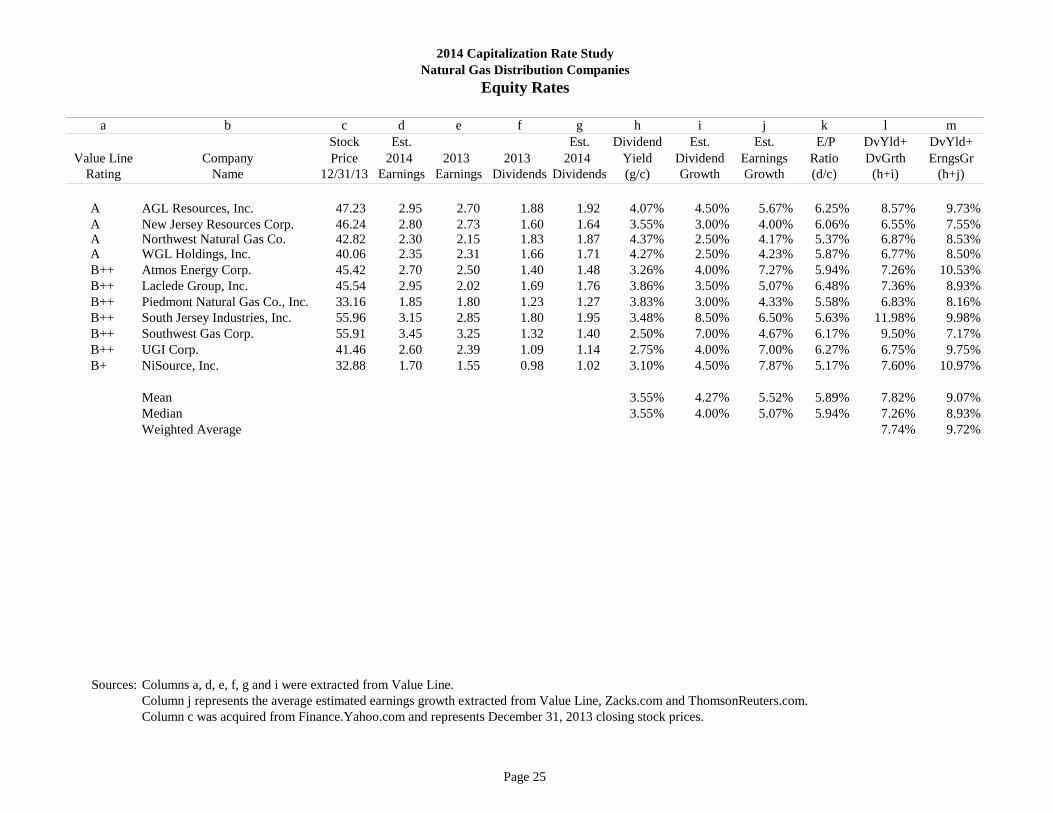
a b c d e f g h i j k l m Stock Est. Est. Dividend Est. Est. E/P DvYld+ DvYld+
Value Line Company Price 2014 2013 2013 2014 Yield Dividend Earnings Ratio DvGrth ErngsGrRating Name 12/31/13 Earnings Earnings Dividends Dividends (g/c) Growth Growth (d/c) (h+i) (h+j)
A AGL Resources, Inc. 47.23 2.95 2.70 1.88 1.92 4.07% 4.50% 5.67% 6.25% 8.57% 9.73%A New Jersey Resources Corp. 46.24 2.80 2.73 1.60 1.64 3.55% 3.00% 4.00% 6.06% 6.55% 7.55%A Northwest Natural Gas Co. 42.82 2.30 2.15 1.83 1.87 4.37% 2.50% 4.17% 5.37% 6.87% 8.53%A WGL Holdings, Inc. 40.06 2.35 2.31 1.66 1.71 4.27% 2.50% 4.23% 5.87% 6.77% 8.50%B++ Atmos Energy Corp. 45.42 2.70 2.50 1.40 1.48 3.26% 4.00% 7.27% 5.94% 7.26% 10.53%B++ Laclede Group, Inc. 45.54 2.95 2.02 1.69 1.76 3.86% 3.50% 5.07% 6.48% 7.36% 8.93%B++ Piedmont Natural Gas Co., Inc. 33.16 1.85 1.80 1.23 1.27 3.83% 3.00% 4.33% 5.58% 6.83% 8.16%B++ South Jersey Industries, Inc. 55.96 3.15 2.85 1.80 1.95 3.48% 8.50% 6.50% 5.63% 11.98% 9.98%B++ Southwest Gas Corp. 55.91 3.45 3.25 1.32 1.40 2.50% 7.00% 4.67% 6.17% 9.50% 7.17%B++ UGI Corp. 41.46 2.60 2.39 1.09 1.14 2.75% 4.00% 7.00% 6.27% 6.75% 9.75%B+ NiSource, Inc. 32.88 1.70 1.55 0.98 1.02 3.10% 4.50% 7.87% 5.17% 7.60% 10.97%
Mean 3.55% 4.27% 5.52% 5.89% 7.82% 9.07%Median 3.55% 4.00% 5.07% 5.94% 7.26% 8.93%Weighted Average 7.74% 9.72%
Sources: Columns a, d, e, f, g and i were extracted from Value Line.Column j represents the average estimated earnings growth extracted from Value Line, Zacks.com and ThomsonReuters.com.Column c was acquired from Finance.Yahoo.com and represents December 31, 2013 closing stock prices.
Natural Gas Distribution Companies2014 Capitalization Rate Study
Equity Rates

Page 26
a b c d e fValue Line
Rating Company Name Value Line Zacks Thomson Average
A AGL Resources, Inc. 8.00% 5.00% 4.00% 5.67%A New Jersey Resources Corp. 5.50% 4.00% 2.50% 4.00%A Northwest Natural Gas Co. 4.50% 4.00% 4.00% 4.17%A WGL Holdings, Inc. 3.50% 4.60% 4.60% 4.23%B++ Atmos Energy Corp. 7.50% 6.50% 7.80% 7.27%B++ Laclede Group, Inc. 6.00% 4.30% 4.90% 5.07%B++ Piedmont Natural Gas Co., Inc. 4.00% 5.00% 4.00% 4.33%B++ South Jersey Industries, Inc. 7.50% 6.00% 6.00% 6.50%B++ Southwest Gas Corp. 8.00% 3.40% 2.60% 4.67%B++ UGI Corp. 8.00% 6.00% N/A 7.00%B+ NiSource, Inc. 10.50% 6.60% 6.50% 7.87%
Mean 6.64% 5.04% 4.69% 5.52%Median 7.50% 5.00% 4.30% 5.07%Weighted Average 6.35%
Sources: Columns a and c were extracted from Value Line.Column d was extracted from Zacks.com.Column e was extracted from ThomsonReuters.com.
2014 Capitalization Rate StudyNatural Gas Distribution CompaniesLong Term Earnings Growth

Page 27
a b c d e f g h i j k l Common Common Mkt Value L.T. Pfd Common Total L.T. Pfd Common
Value Line Stock Stock Price Equity Debt Stock Equity Capital Debt Stock EquityRating Company Name Outstanding 12/31/13 ($million) ($million) ($million) ($million) ($million) % % %
A AGL Resources, Inc. 118,788,590 47.23 5,610.39 3,816.00 0.00 5,610.39 9,426.39 40.48% 0.00% 59.52%A New Jersey Resources Corp. 41,380,558 46.24 1,913.44 516.20 0.00 1,913.44 2,429.64 21.25% 0.00% 78.75%A Northwest Natural Gas Co. 27,002,556 42.82 1,156.25 681.70 0.00 1,156.25 1,837.95 37.09% 0.00% 62.91%A WGL Holdings, Inc. 51,809,755 40.06 2,075.50 524.10 28.20 2,075.50 2,627.80 19.94% 1.07% 78.98%B++ Atmos Energy Corp. 90,640,211 45.42 4,116.88 2,455.60 0.00 4,116.88 6,572.48 37.36% 0.00% 62.64%B++ Laclede Group, Inc. 32,709,763 45.54 1,489.60 912.70 0.00 1,489.60 2,402.30 37.99% 0.00% 62.01%B++ Piedmont Natural Gas Co., Inc. 75,930,485 33.16 2,517.85 875.00 0.00 2,517.85 3,392.85 25.79% 0.00% 74.21%B++ South Jersey Industries, Inc. 32,207,008 55.96 1,802.30 580.40 0.00 1,802.30 2,382.70 24.36% 0.00% 75.64%B++ Southwest Gas Corp. 46,350,863 55.91 2,591.48 1,280.40 0.00 2,591.48 3,871.88 33.07% 0.00% 66.93%B++ UGI Corp. 114,098,006 41.46 4,730.50 3,298.20 0.00 4,730.50 8,028.70 41.08% 0.00% 58.92%B+ NiSource, Inc. 313,294,844 32.88 10,301.13 7,089.10 0.00 10,301.13 17,390.23 40.76% 0.00% 59.24%
Mean 32.65% 0.10% 67.25%Median 37.09% 0.00% 62.91%Weighted Average 36.49% 0.05% 63.46%
Sources: Columns a, c, f and g were extracted from Value Line.Column d was acquired from Finance.Yahoo.com and represents December 31, 2013 closing stock prices.
2014 Capitalization Rate StudyNatural Gas Distribution Companies
Capital Structure
Page 28
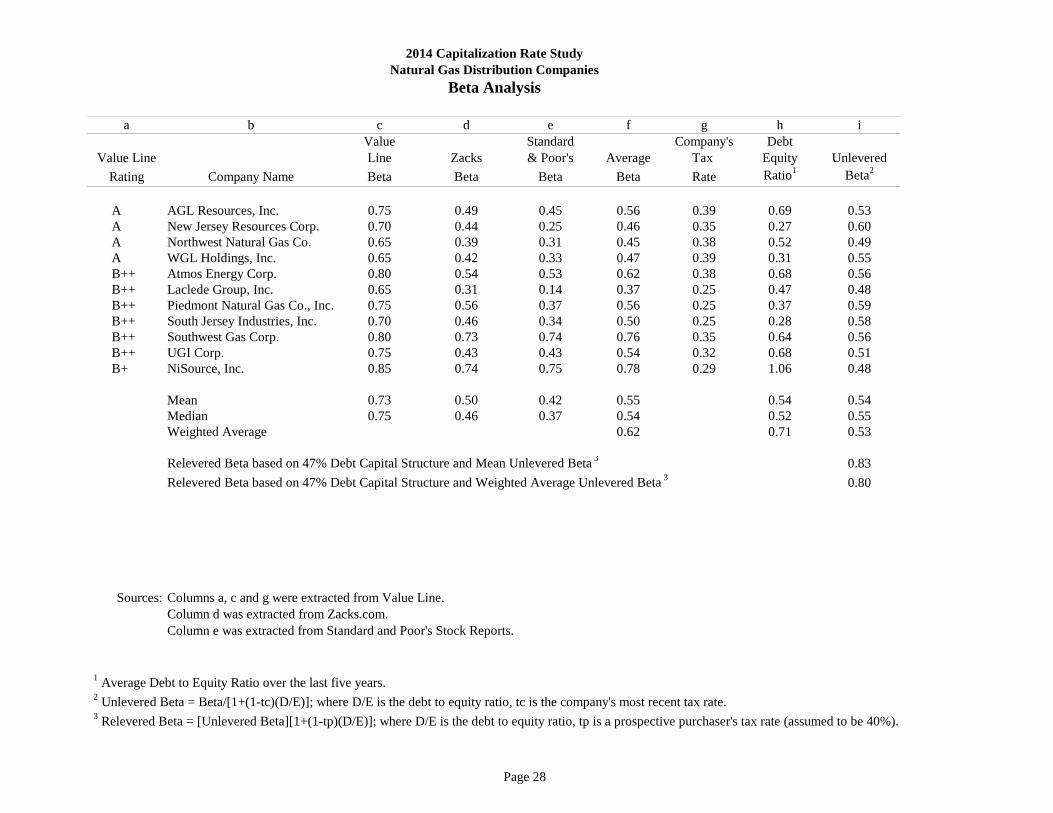
a b c d e f g h iValue Standard Company's Debt
Value Line Line Zacks & Poor's Average Tax Equity UnleveredRating Company Name Beta Beta Beta Beta Rate Ratio1 Beta2
A AGL Resources, Inc. 0.75 0.49 0.45 0.56 0.39 0.69 0.53A New Jersey Resources Corp. 0.70 0.44 0.25 0.46 0.35 0.27 0.60A Northwest Natural Gas Co. 0.65 0.39 0.31 0.45 0.38 0.52 0.49A WGL Holdings, Inc. 0.65 0.42 0.33 0.47 0.39 0.31 0.55B++ Atmos Energy Corp. 0.80 0.54 0.53 0.62 0.38 0.68 0.56B++ Laclede Group, Inc. 0.65 0.31 0.14 0.37 0.25 0.47 0.48B++ Piedmont Natural Gas Co., Inc. 0.75 0.56 0.37 0.56 0.25 0.37 0.59B++ South Jersey Industries, Inc. 0.70 0.46 0.34 0.50 0.25 0.28 0.58B++ Southwest Gas Corp. 0.80 0.73 0.74 0.76 0.35 0.64 0.56B++ UGI Corp. 0.75 0.43 0.43 0.54 0.32 0.68 0.51B+ NiSource, Inc. 0.85 0.74 0.75 0.78 0.29 1.06 0.48
Mean 0.73 0.50 0.42 0.55 0.54 0.54Median 0.75 0.46 0.37 0.54 0.52 0.55Weighted Average 0.62 0.71 0.53
Relevered Beta based on 47% Debt Capital Structure and Mean Unlevered Beta 3 0.83Relevered Beta based on 47% Debt Capital Structure and Weighted Average Unlevered Beta 3 0.80
Sources: Columns a, c and g were extracted from Value Line.Column d was extracted from Zacks.com. Column e was extracted from Standard and Poor's Stock Reports.
1 Average Debt to Equity Ratio over the last five years. 2 Unlevered Beta = Beta/[1+(1-tc)(D/E)]; where D/E is the debt to equity ratio, tc is the company's most recent tax rate. 3 Relevered Beta = [Unlevered Beta][1+(1-tp)(D/E)]; where D/E is the debt to equity ratio, tp is a prospective purchaser's tax rate (assumed to be 40%).
2014 Capitalization Rate StudyNatural Gas Distribution Companies
Beta Analysis
Page 29
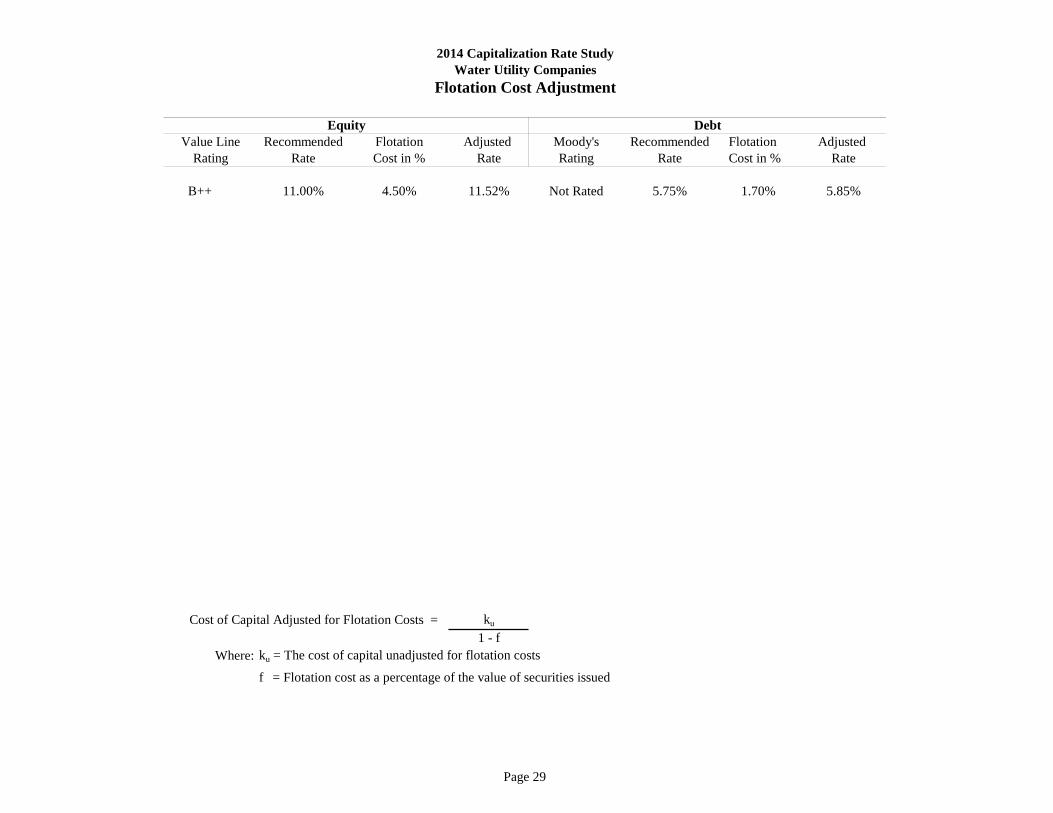
Value Line Recommended Flotation Adjusted Moody's Recommended Flotation Adjusted Rating Rate Cost in % Rate Rating Rate Cost in % Rate
B++ 11.00% 4.50% 11.52% Not Rated 5.75% 1.70% 5.85%
Cost of Capital Adjusted for Flotation Costs = ku
1 - fWhere: ku = The cost of capital unadjusted for flotation costs
f = Flotation cost as a percentage of the value of securities issued
2014 Capitalization Rate StudyWater Utility Companies
Flotation Cost Adjustment
DebtEquity
Page 30
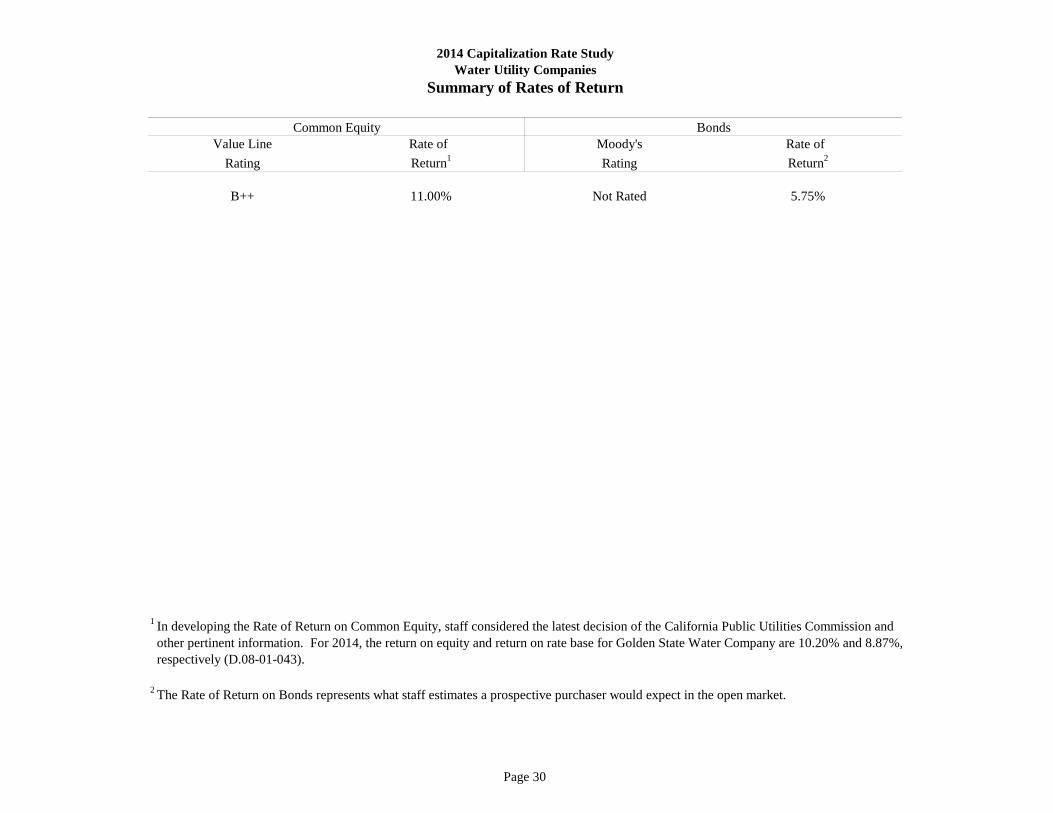
Value Line Rate of Moody's Rate ofRating Return1 Rating Return2
B++ 11.00% Not Rated 5.75%
1 In developing the Rate of Return on Common Equity, staff considered the latest decision of the California Public Utilities Commission and other pertinent information. For 2014, the return on equity and return on rate base for Golden State Water Company are 10.20% and 8.87%, respectively (D.08-01-043).
2 The Rate of Return on Bonds represents what staff estimates a prospective purchaser would expect in the open market.
2014 Capitalization Rate StudyWater Utility Companies
Summary of Rates of Return
Common Equity Bonds
Page 31
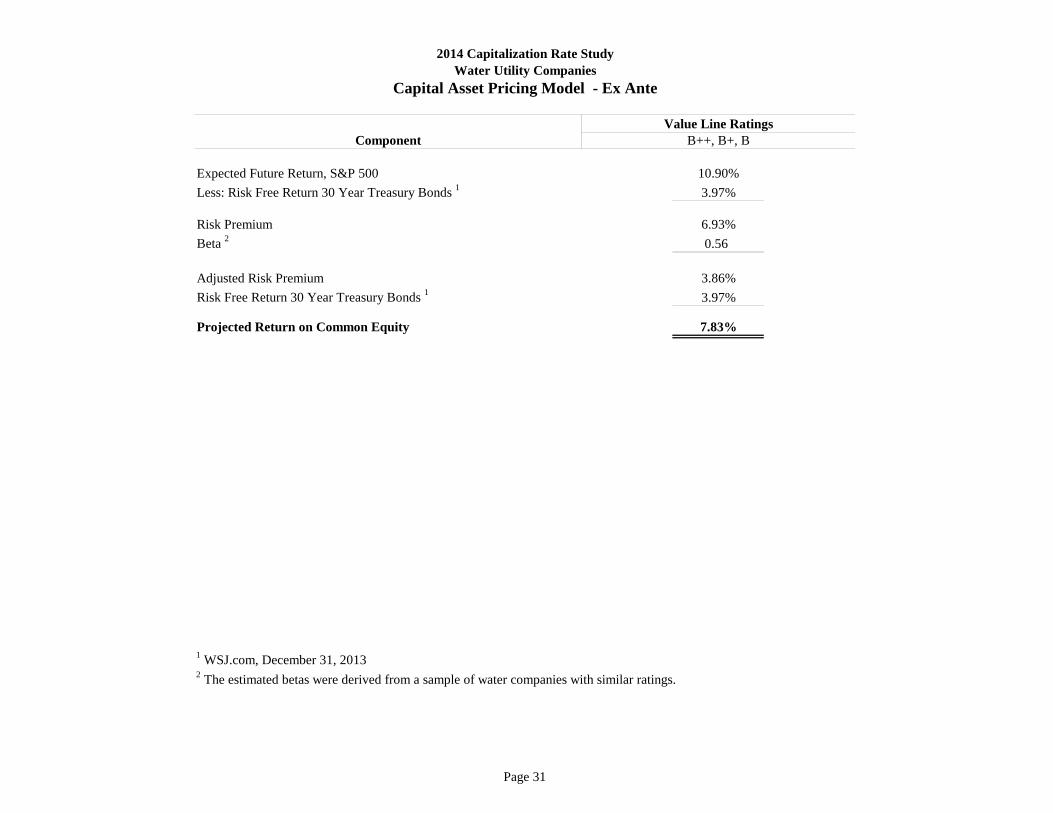
Component
Expected Future Return, S&P 500 10.90%Less: Risk Free Return 30 Year Treasury Bonds 1 3.97%
Risk Premium 6.93%Beta 2 0.56
Adjusted Risk Premium 3.86%Risk Free Return 30 Year Treasury Bonds 1 3.97%
Projected Return on Common Equity 7.83%
1 WSJ.com, December 31, 20132 The estimated betas were derived from a sample of water companies with similar ratings.
B++, B+, B
2014 Capitalization Rate StudyWater Utility Companies
Capital Asset Pricing Model - Ex Ante
Value Line Ratings

Page 32
Value Line RatingsComponent
Common Stock Returns, S&P 500 (1928 - 2013) 1 11.50%Less: 10 Year Treasury Bonds (1928 - 2013) 1 5.21%
Risk Premium 6.29%Beta 2 0.56
Adjusted Risk Premium 3.50%Risk Free Return 30 Year Treasury Bonds 3 3.97%
Projected Return on Common Equity 7.47%
1 Damodaran Online, January 5, 20142 The estimated betas were derived from a sample of water companies with similar ratings. 3 WSJ.com, December 31, 2013
2014 Capitalization Rate StudyWater Utility Companies
Capital Asset Pricing Model - Ex Post
B++, B+, B

Page 33
a b c d e f g h i j k l mStock Est. Est. Dividend Est. Est. E/P DvYld+ DvYld+
Value Line Company Price 2014 2013 2013 2014 Yield Dividend Earnings Ratio DvGrth ErngsGrRating Name 12/31/13 Earnings Earnings Dividends Dividends (g/c) Growth Growth (d/c) (h+i) (h+j)
A American States Water Co. 28.73 1.60 1.55 0.76 0.84 2.92% 10.00% 3.33% 5.57% 12.92% 6.26%B++ Aqua America, Inc. 23.59 1.25 1.15 0.58 0.64 2.71% 9.50% 7.13% 5.30% 12.21% 9.85%B++ California Water Service Group 23.07 1.15 0.95 0.64 0.68 2.95% 6.50% 6.33% 4.98% 9.45% 9.28%B++ Middlesex Water Company 20.94 1.05 1.00 0.75 0.76 3.63% 1.50% 4.00% 5.01% 5.13% 7.63%B+ American Water Works Co., Inc. 42.26 2.40 2.20 1.06 1.20 2.84% 7.50% 7.60% 5.68% 10.34% 10.44%B+ York Water Co. 20.93 0.90 0.75 0.55 0.57 2.72% 5.00% 6.50% 4.30% 7.72% 9.22%
Mean 2.96% 6.67% 5.82% 5.14% 9.63% 8.78%Median 2.88% 7.00% 6.42% 5.16% 9.89% 9.25%Weighted Average 10.77% 9.86%
Sources: Columns a, d, e, f, g and i were extracted from Value Line.Column j represents the average estimated earnings growth extracted from Value Line, Zacks.com and ThomsonReuters.com.Column c was acquired from Finance.Yahoo.com and represents December 31, 2013 closing stock prices.
2014 Capitalization Rate StudyWater Utility Companies
Equity Rates

Page 34
a b c d e fValue Line
Rating Company Name Value Line Zacks Thomson Average
A American States Water Co. 7.00% 2.00% 1.00% 3.33%B++ Aqua America, Inc. 10.00% 5.60% 5.80% 7.13%B++ California Water Service Group 7.00% 6.00% 6.00% 6.33%B++ Middlesex Water Company 4.00% N/A N/A 4.00%B+ American Water Works Co., Inc. 8.50% 7.20% 7.10% 7.60%B+ York Water Co. 6.50% N/A N/A 6.50%
Mean 7.17% 5.20% 4.98% 5.82%Median 7.00% 5.80% 5.90% 6.42%Weighted Average 7.02%
Sources: Columns a and c were extracted from Value Line.Column d was extracted from Zacks.com.Column e was extracted from ThomsonReuters.com.
2014 Capitalization Rate StudyWater Utility Companies
Long Term Earnings Growth
Page 35
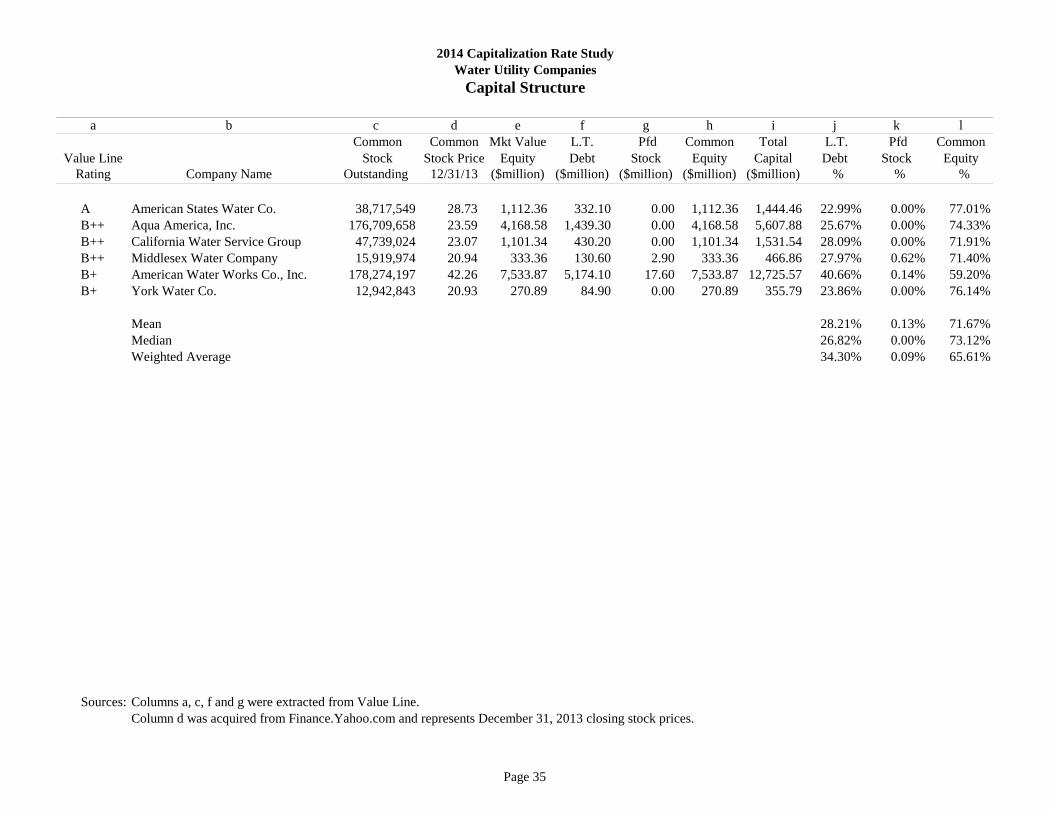
a b c d e f g h i j k l Common Common Mkt Value L.T. Pfd Common Total L.T. Pfd Common
Value Line Stock Stock Price Equity Debt Stock Equity Capital Debt Stock EquityRating Company Name Outstanding 12/31/13 ($million) ($million) ($million) ($million) ($million) % % %
A American States Water Co. 38,717,549 28.73 1,112.36 332.10 0.00 1,112.36 1,444.46 22.99% 0.00% 77.01%B++ Aqua America, Inc. 176,709,658 23.59 4,168.58 1,439.30 0.00 4,168.58 5,607.88 25.67% 0.00% 74.33%B++ California Water Service Group 47,739,024 23.07 1,101.34 430.20 0.00 1,101.34 1,531.54 28.09% 0.00% 71.91%B++ Middlesex Water Company 15,919,974 20.94 333.36 130.60 2.90 333.36 466.86 27.97% 0.62% 71.40%B+ American Water Works Co., Inc. 178,274,197 42.26 7,533.87 5,174.10 17.60 7,533.87 12,725.57 40.66% 0.14% 59.20%B+ York Water Co. 12,942,843 20.93 270.89 84.90 0.00 270.89 355.79 23.86% 0.00% 76.14%
Mean 28.21% 0.13% 71.67%Median 26.82% 0.00% 73.12%Weighted Average 34.30% 0.09% 65.61%
Sources: Columns a, c, f and g were extracted from Value Line.Column d was acquired from Finance.Yahoo.com and represents December 31, 2013 closing stock prices.
2014 Capitalization Rate StudyWater Utility Companies
Capital Structure
Page 36
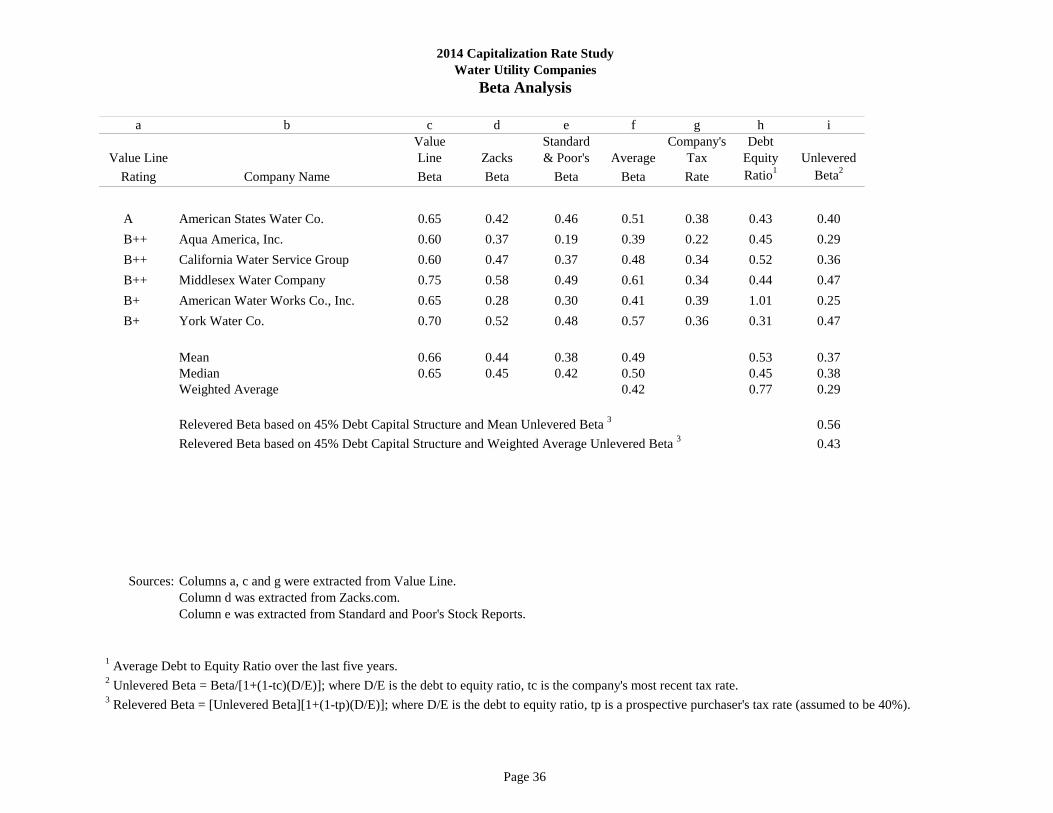
a b c d e f g h iValue Standard Company's Debt
Value Line Line Zacks & Poor's Average Tax Equity UnleveredRating Company Name Beta Beta Beta Beta Rate Ratio1 Beta2
A American States Water Co. 0.65 0.42 0.46 0.51 0.38 0.43 0.40B++ Aqua America, Inc. 0.60 0.37 0.19 0.39 0.22 0.45 0.29B++ California Water Service Group 0.60 0.47 0.37 0.48 0.34 0.52 0.36B++ Middlesex Water Company 0.75 0.58 0.49 0.61 0.34 0.44 0.47B+ American Water Works Co., Inc. 0.65 0.28 0.30 0.41 0.39 1.01 0.25B+ York Water Co. 0.70 0.52 0.48 0.57 0.36 0.31 0.47
Mean 0.66 0.44 0.38 0.49 0.53 0.37Median 0.65 0.45 0.42 0.50 0.45 0.38Weighted Average 0.42 0.77 0.29
Relevered Beta based on 45% Debt Capital Structure and Mean Unlevered Beta 3 0.56Relevered Beta based on 45% Debt Capital Structure and Weighted Average Unlevered Beta 3 0.43
Sources: Columns a, c and g were extracted from Value Line.Column d was extracted from Zacks.com. Column e was extracted from Standard and Poor's Stock Reports.
1 Average Debt to Equity Ratio over the last five years. 2 Unlevered Beta = Beta/[1+(1-tc)(D/E)]; where D/E is the debt to equity ratio, tc is the company's most recent tax rate. 3 Relevered Beta = [Unlevered Beta][1+(1-tp)(D/E)]; where D/E is the debt to equity ratio, tp is a prospective purchaser's tax rate (assumed to be 40%).
2014 Capitalization Rate StudyWater Utility Companies
Beta Analysis

Page 37
Basic Common Common Cap
SBE No. Company Name Financial Bond Equity Debt Equity Debt Rate
153 Transwestern Pipeline Company Not Rated Not Rated 75% 25% 12.57% 5.34% 10.76%
180 North Baja Pipeline, LLC Not Rated Not Rated 75% 25% 12.57% 5.34% 10.76%
187 Mojave Pipeline Company, LLC Not Rated Not Rated 75% 25% 12.57% 5.34% 10.76%
188 Kern River Gas Transmission Company Not Rated Not Rated 75% 25% 12.57% 5.34% 10.76%
189 Standard Pacific Gas Line, Incorporated Not Rated Not Rated 75% 25% 12.57% 5.34% 10.76%
190 Tuscarora Gas Transmission Company Not Rated Not Rated 75% 25% 12.57% 5.34% 10.76%
196 Questar Southern Trails Pipeline Company Not Rated Not Rated 75% 25% 12.57% 5.34% 10.76%
197 El Paso Pipeline Partners, L.P. Not Rated Not Rated 75% 25% 12.57% 5.34% 10.76%
Ratings Capital Structure Rates of Return
California State Board of Equalization State-Assessed Properties Division
2014 Capitalization Rate StudyNatural Gas Transmission Companies
Page 38
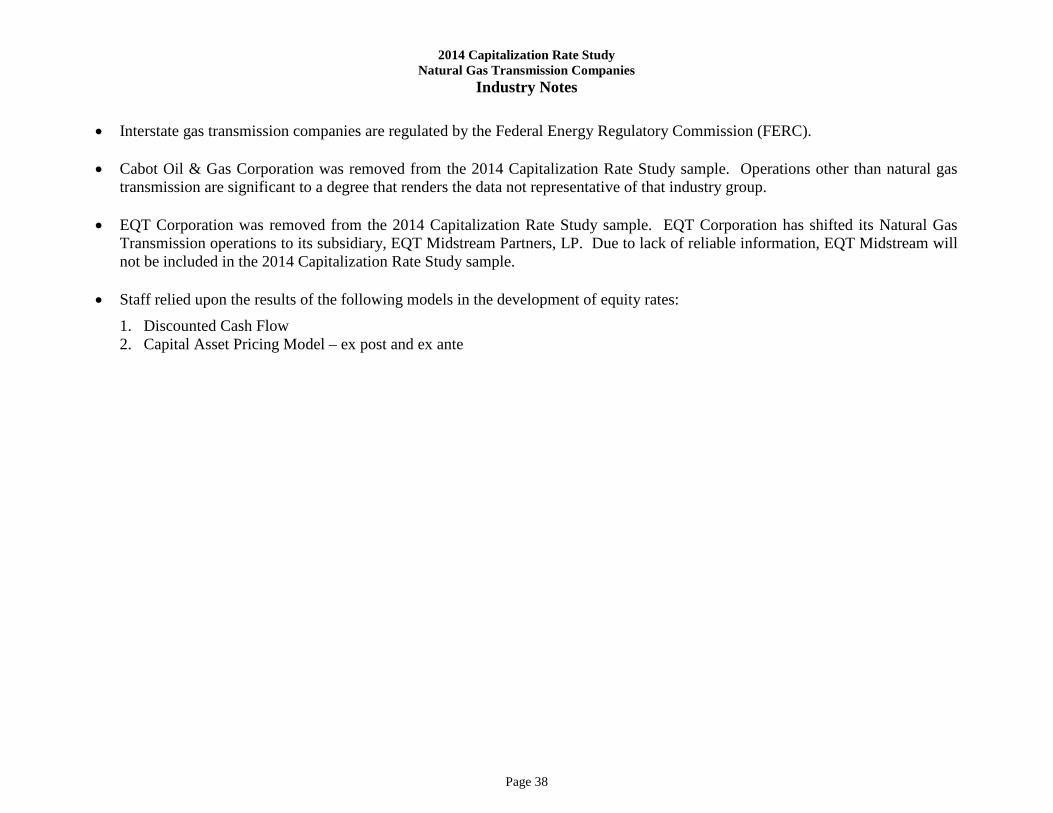
2014 Capitalization Rate Study Natural Gas Transmission Companies
Industry Notes • Interstate gas transmission companies are regulated by the Federal Energy Regulatory Commission (FERC). • Cabot Oil & Gas Corporation was removed from the 2014 Capitalization Rate Study sample. Operations other than natural gas
transmission are significant to a degree that renders the data not representative of that industry group.
• EQT Corporation was removed from the 2014 Capitalization Rate Study sample. EQT Corporation has shifted its Natural Gas Transmission operations to its subsidiary, EQT Midstream Partners, LP. Due to lack of reliable information, EQT Midstream will not be included in the 2014 Capitalization Rate Study sample.
• Staff relied upon the results of the following models in the development of equity rates:
1. Discounted Cash Flow 2. Capital Asset Pricing Model – ex post and ex ante
Page 39
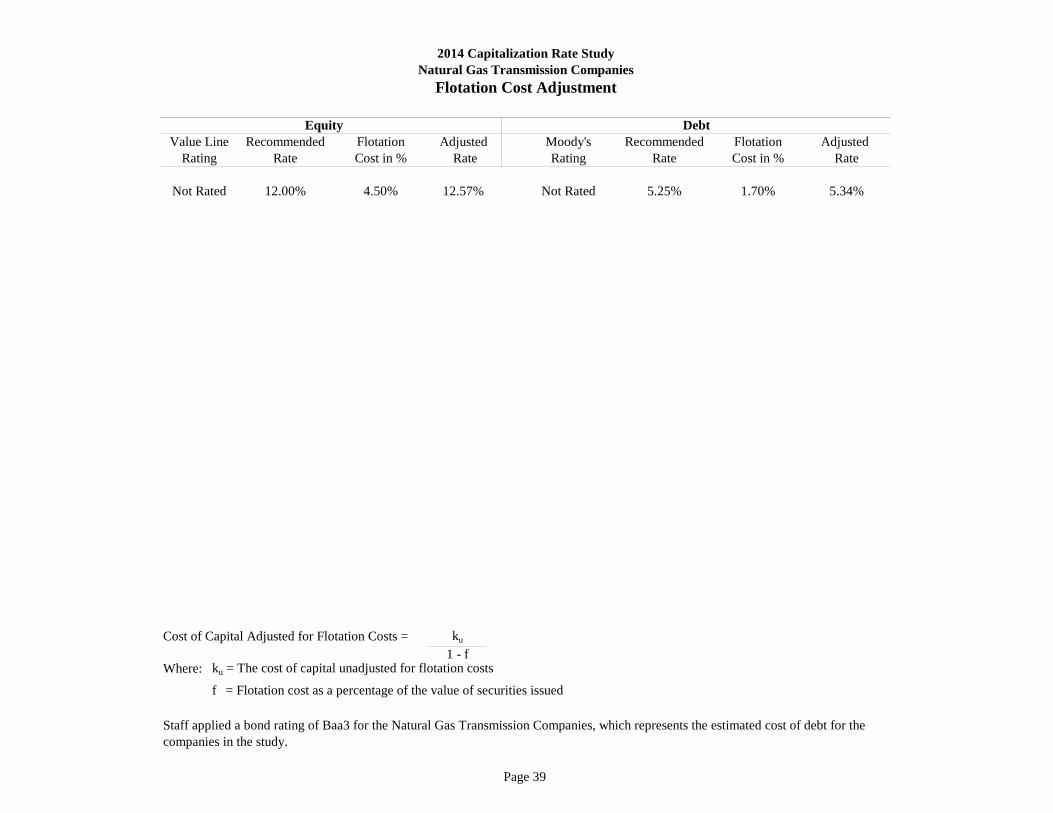
Recommended Flotation Moody's Recommended Flotation Adjusted Rate Cost in % Rating Rate Cost in % Rate
12.00% 4.50% 12.57% Not Rated 5.25% 1.70% 5.34%
Cost of Capital Adjusted for Flotation Costs = ku
1 - fWhere: ku = The cost of capital unadjusted for flotation costs
f = Flotation cost as a percentage of the value of securities issued
Staff applied a bond rating of Baa3 for the Natural Gas Transmission Companies, which represents the estimated cost of debt for thecompanies in the study.
Not Rated
Value LineRating
Equity
Rate
2014 Capitalization Rate StudyNatural Gas Transmission Companies
Flotation Cost Adjustment
Adjusted Debt
Page 40
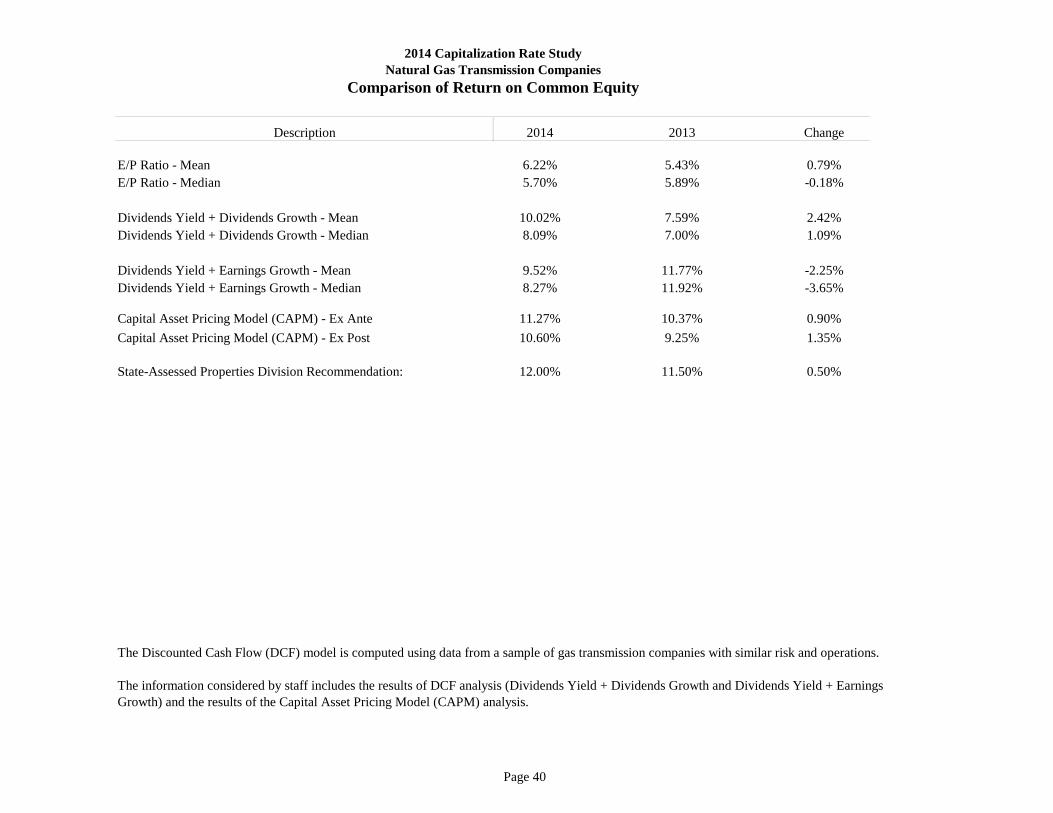
2014 Capitalization Rate StudyNatural Gas Transmission Companies
Comparison of Return on Common Equity
2014 2013 Change
E/P Ratio - Mean 6.22% 5.43% 0.79%E/P Ratio - Median 5.70% 5.89% -0.18%
Dividends Yield + Dividends Growth - Mean 10.02% 7.59% 2.42%Dividends Yield + Dividends Growth - Median 8.09% 7.00% 1.09%
Dividends Yield + Earnings Growth - Mean 9.52% 11.77% -2.25%Dividends Yield + Earnings Growth - Median 8.27% 11.92% -3.65%
Capital Asset Pricing Model (CAPM) - Ex Ante 11.27% 10.37% 0.90%Capital Asset Pricing Model (CAPM) - Ex Post 10.60% 9.25% 1.35%
State-Assessed Properties Division Recommendation: 12.00% 11.50% 0.50%
The Discounted Cash Flow (DCF) model is computed using data from a sample of gas transmission companies with similar risk and operations.
The information considered by staff includes the results of DCF analysis (Dividends Yield + Dividends Growth and Dividends Yield + EarningsGrowth) and the results of the Capital Asset Pricing Model (CAPM) analysis.
Description

Page 41
a b c d e f g h i j k l mStock 2014 2014 Dividend Est. Est. E/P Div Yld+ Div Yld+
Value Line Price Est. 2013 2013 Est. Yield Dividend Earnings Ratio Div Grwh Engs GrwhRating Company Name 12/31/13 Earnings Earnings Dividends Dividends (g/c) Growth Growth (d/c) (h+i) (h+j)
A Questar Corp. 22.99 1.25 1.18 0.71 0.75 3.26% 6.00% 4.90% 5.44% 9.26% 8.16% B++ Devon Energy Corp. 61.87 5.40 4.35 0.86 0.88 1.42% 5.50% 13.13% 8.73% 6.92% 14.56% B++ National Fuel Gas Co. 71.40 3.40 3.14 1.48 1.52 2.13% 3.00% 4.83% 4.76% 5.13% 6.96% B El Paso Pipeline Partners, L.P. 36.00 2.15 1.90 2.55 2.79 7.75% 11.00% 0.63% 5.97% 18.75% 8.38%
Mean 3.64% 6.38% 5.88% 6.22% 10.02% 9.52%Median 2.70% 5.75% 4.87% 5.70% 8.09% 8.27%Weighted Average 11.80% 14.77%
Sources: Columns a, d, e, f, g and i were extracted from Value Line.
Column c was extracted from Finance.Yahoo.com and represents December 31, 2013 closing stock prices.Column j is an average of Value Line, Zacks.com and ThomsonReuters.com.
2014 Capitalization Rate StudyNatural Gas Transmission Companies
Equity Rates
Page 42
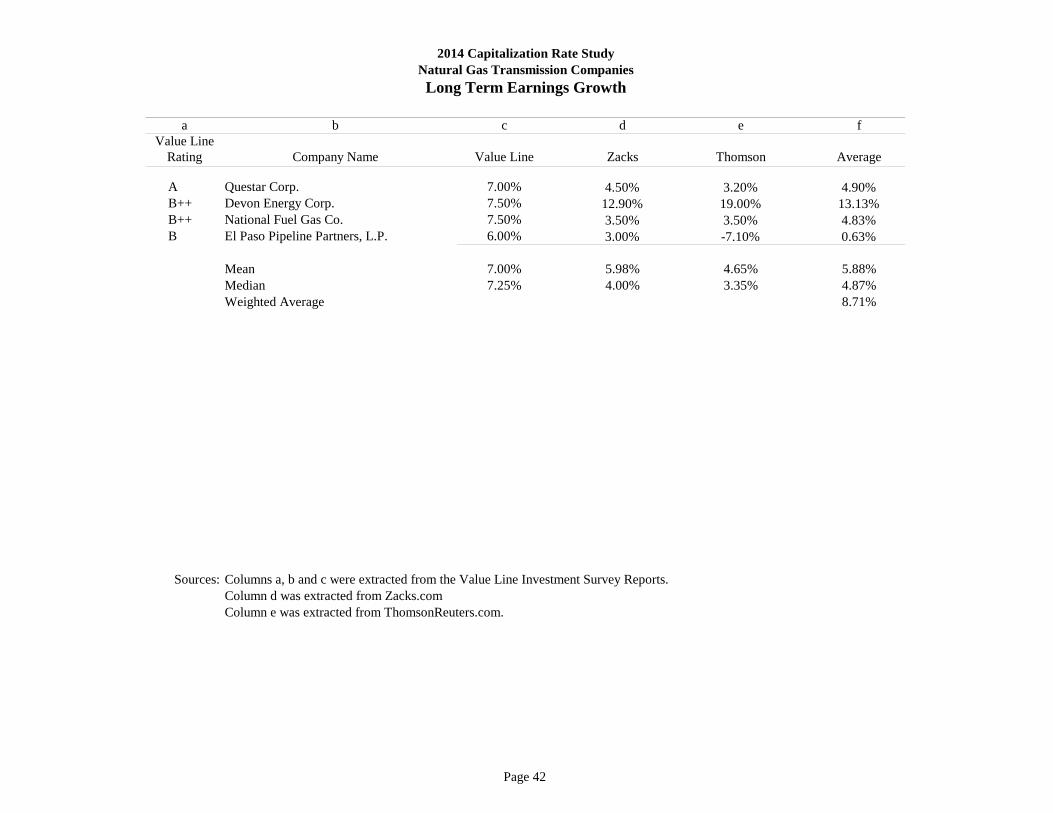
2014 Capitalization Rate StudyNatural Gas Transmission CompaniesLong Term Earnings Growth
a b c d e fValue Line
Rating Company Name Value Line Zacks Thomson Average
A Questar Corp. 7.00% 4.50% 3.20% 4.90% B++ Devon Energy Corp. 7.50% 12.90% 19.00% 13.13% B++ National Fuel Gas Co. 7.50% 3.50% 3.50% 4.83% B El Paso Pipeline Partners, L.P. 6.00% 3.00% -7.10% 0.63%
Mean 7.00% 5.98% 4.65% 5.88%Median 7.25% 4.00% 3.35% 4.87%Weighted Average 8.71%
Sources: Columns a, b and c were extracted from the Value Line Investment Survey Reports.Column d was extracted from Zacks.comColumn e was extracted from ThomsonReuters.com.
Page 43
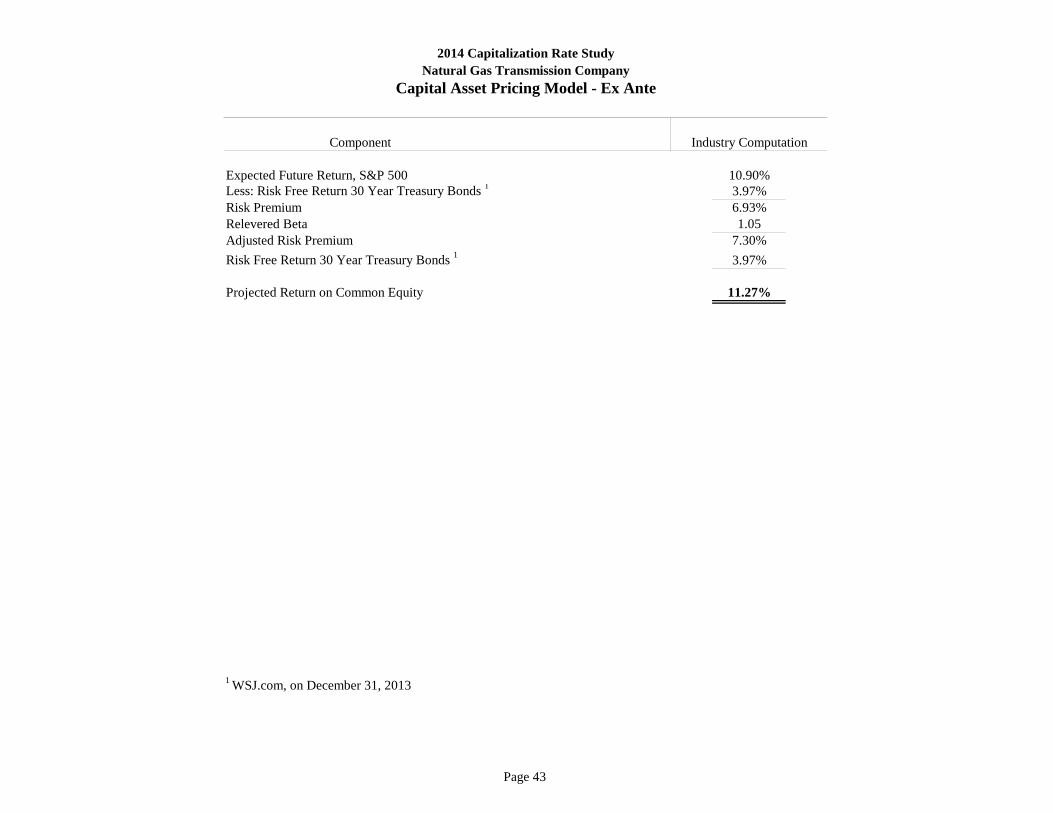
Component
Expected Future Return, S&P 500 10.90%Less: Risk Free Return 30 Year Treasury Bonds 1 3.97%Risk Premium 6.93%Relevered Beta 1.05Adjusted Risk Premium 7.30%Risk Free Return 30 Year Treasury Bonds 1 3.97%
Projected Return on Common Equity 11.27%
1 WSJ.com, on December 31, 2013
Industry Computation
2014 Capitalization Rate StudyNatural Gas Transmission Company
Capital Asset Pricing Model - Ex Ante
Page 44
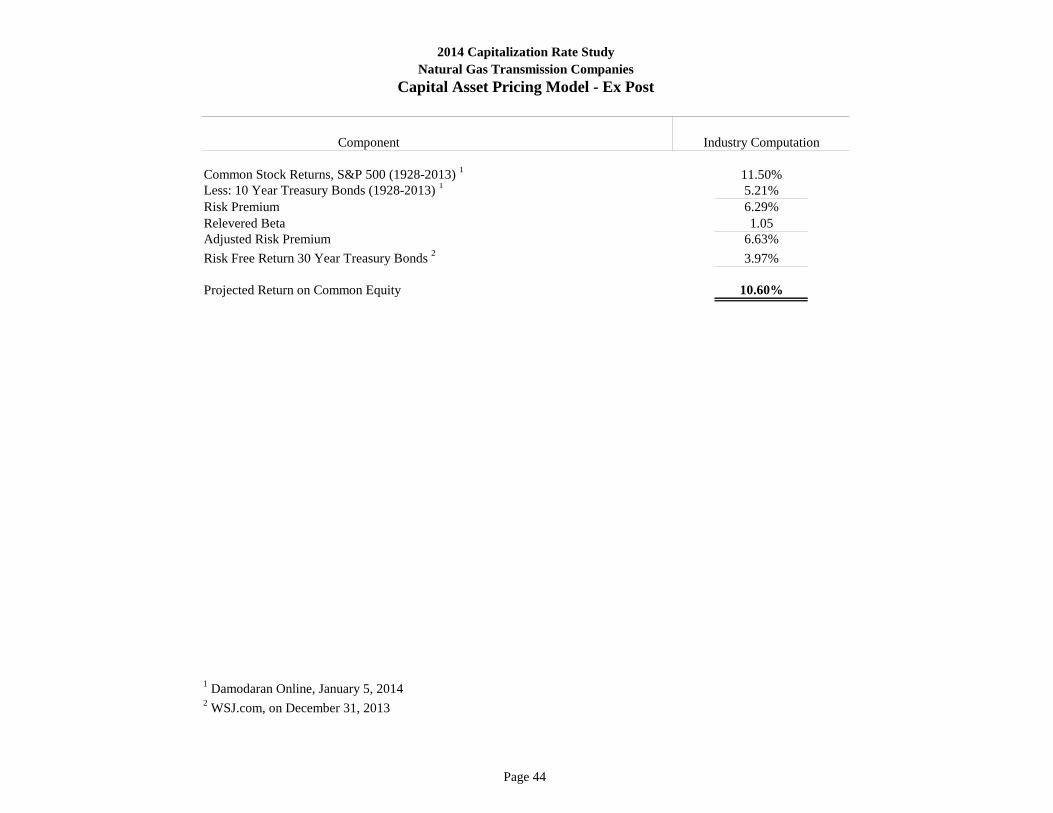
Component
Common Stock Returns, S&P 500 (1928-2013) 1 11.50%Less: 10 Year Treasury Bonds (1928-2013) 1 5.21%Risk Premium 6.29%Relevered Beta 1.05Adjusted Risk Premium 6.63%Risk Free Return 30 Year Treasury Bonds 2 3.97%
Projected Return on Common Equity 10.60%
1 Damodaran Online, January 5, 20142 WSJ.com, on December 31, 2013
Industry Computation
2014 Capitalization Rate StudyNatural Gas Transmission Companies
Capital Asset Pricing Model - Ex Post

Page 45
a b c d e f g h iValue Standard Company's Debt
Value Line Line's Zacks & Poor's Average Tax Equity UnleveredRating Company Name Beta Beta Beta Beta Rate Ratio 1 Beta 2
A Questar Corp. 0.80 0.54 0.40 0.58 0.36 0.26 0.50 B++ Devon Energy Corp. 1.25 1.44 1.27 1.32 0.35 0.20 1.17 B++ National Fuel Gas Co. 1.05 1.12 1.08 1.08 0.41 0.23 0.95 B El Paso Pipeline Partners, L.P. 0.65 0.21 0.08 0.31 0.40 1.00 0.20
Mean 0.94 0.83 0.71 0.82 0.42 0.70Median 0.93 0.83 0.74 0.83 0.25 0.72Weighted 1.01 2.36 0.88
Relevered Beta based on 25% Debt Capital Structure 0.84 3
Relevered Beta based on 25% Debt Capital Structure and a weighted average Beta 1.05 3
Sources: Column a, b, c and g were extracted from Value Line. 1 Average Debt to Equity Ratio over the last five years. 2 Unlevered Beta = Corrected Beta/[1+(1-tc)(D/E)]; where D/E is the debt to equity ratio, tc is the company's 2013 tax rate. 3 Relevered Beta = [Unlevered Beta][1+(1-tp)(D/E)]; where D/E is the debt to equity ratio, tp is a prospective purchaser's tax rate (assumed to be 40%).
Beta AnalysisNatural Gas Transmission Companies
2014 Capitalization Rate Study
Page 46
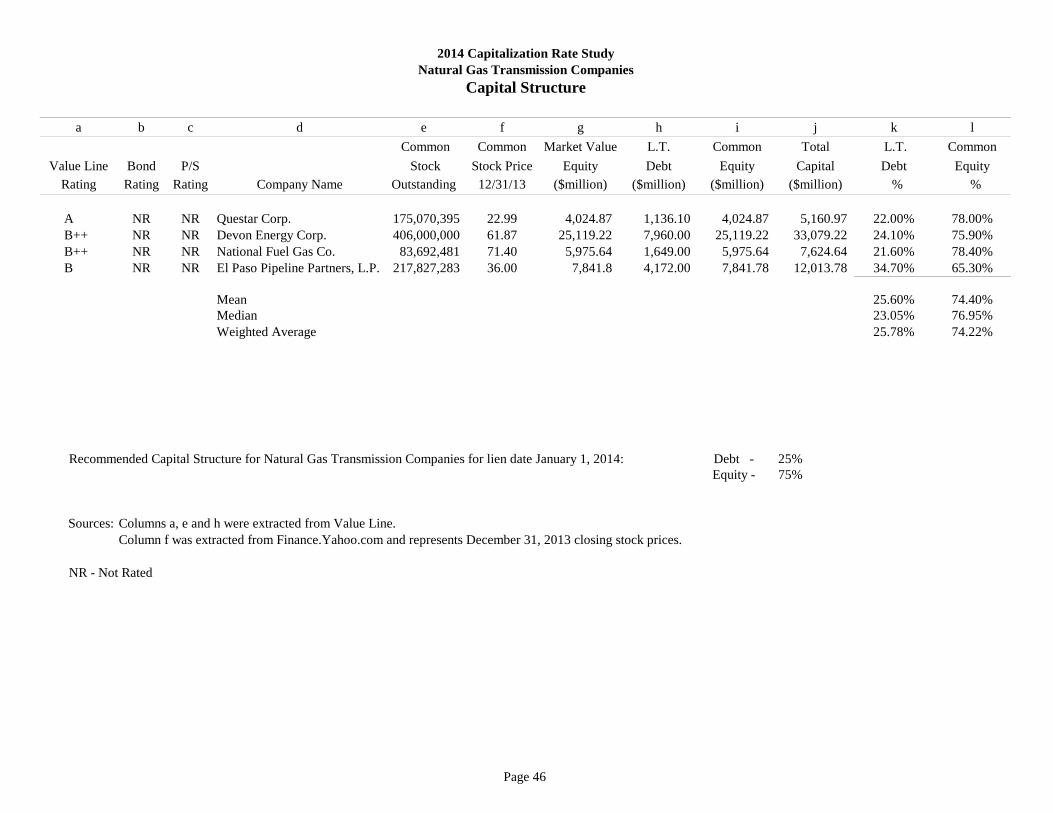
a b c d e f g h i j k l Common Common Market Value L.T. Common Total L.T. Common
Value Line Bond P/S Stock Stock Price Equity Debt Equity Capital Debt EquityRating Rating Rating Company Name Outstanding 12/31/13 ($million) ($million) ($million) ($million) % %
A NR NR Questar Corp. 175,070,395 22.99 4,024.87 1,136.10 4,024.87 5,160.97 22.00% 78.00%B++ NR NR Devon Energy Corp. 406,000,000 61.87 25,119.22 7,960.00 25,119.22 33,079.22 24.10% 75.90%B++ NR NR National Fuel Gas Co. 83,692,481 71.40 5,975.64 1,649.00 5,975.64 7,624.64 21.60% 78.40%B NR NR El Paso Pipeline Partners, L.P. 217,827,283 36.00 7,841.8 4,172.00 7,841.78 12,013.78 34.70% 65.30%
Mean 25.60% 74.40%Median 23.05% 76.95%Weighted Average 25.78% 74.22%
Recommended Capital Structure for Natural Gas Transmission Companies for lien date January 1, 2014: Debt - 25%Equity - 75%
Sources: Columns a, e and h were extracted from Value Line.Column f was extracted from Finance.Yahoo.com and represents December 31, 2013 closing stock prices.
NR - Not Rated
2014 Capitalization Rate StudyNatural Gas Transmission Companies
Capital Structure

Page 47
2014 Capitalization Rate StudyNatural Gas Transmission Companies
Bonds - Rate of Return
Aaa Aa A Baa Avg Utility
N/A 4.59% 4.83% 5.25% 4.89%
Source: Moody's Daily Long-Term Corporate Bond Yield Averages.
Bond RatingUtility Bond Yield
As of December 31, 2013
Page 48
BasicCommon Common Cap
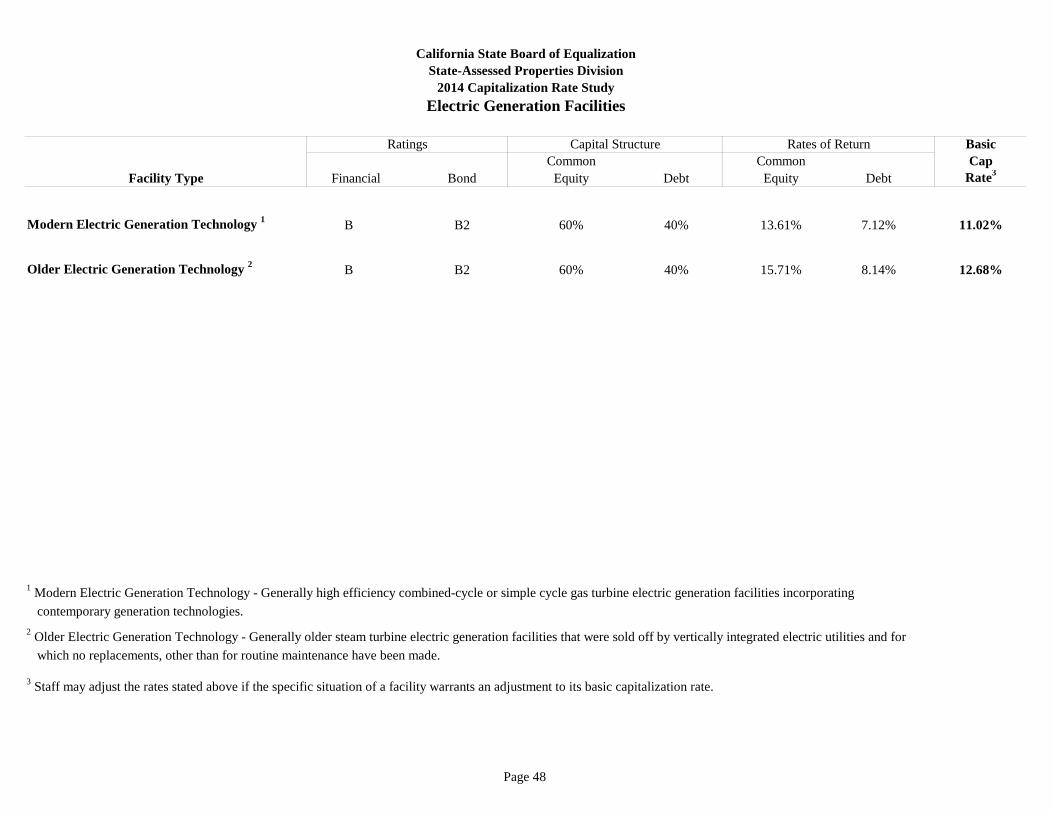
Facility Type Financial Bond Equity Debt Equity Debt Rate3
Modern Electric Generation Technology 1 B B2 60% 40% 13.61% 7.12% 11.02%
Older Electric Generation Technology 2 B B2 60% 40% 15.71% 8.14% 12.68%
1 Modern Electric Generation Technology - Generally high efficiency combined-cycle or simple cycle gas turbine electric generation facilities incorporating contemporary generation technologies.2 Older Electric Generation Technology - Generally older steam turbine electric generation facilities that were sold off by vertically integrated electric utilities and for which no replacements, other than for routine maintenance have been made.
3 Staff may adjust the rates stated above if the specific situation of a facility warrants an adjustment to its basic capitalization rate.
Ratings Capital Structure Rates of Return
California State Board of EqualizationState-Assessed Properties Division
2014 Capitalization Rate StudyElectric Generation Facilities
Page 49
2014 Capitalization Rate Study Electric Generation Facilities
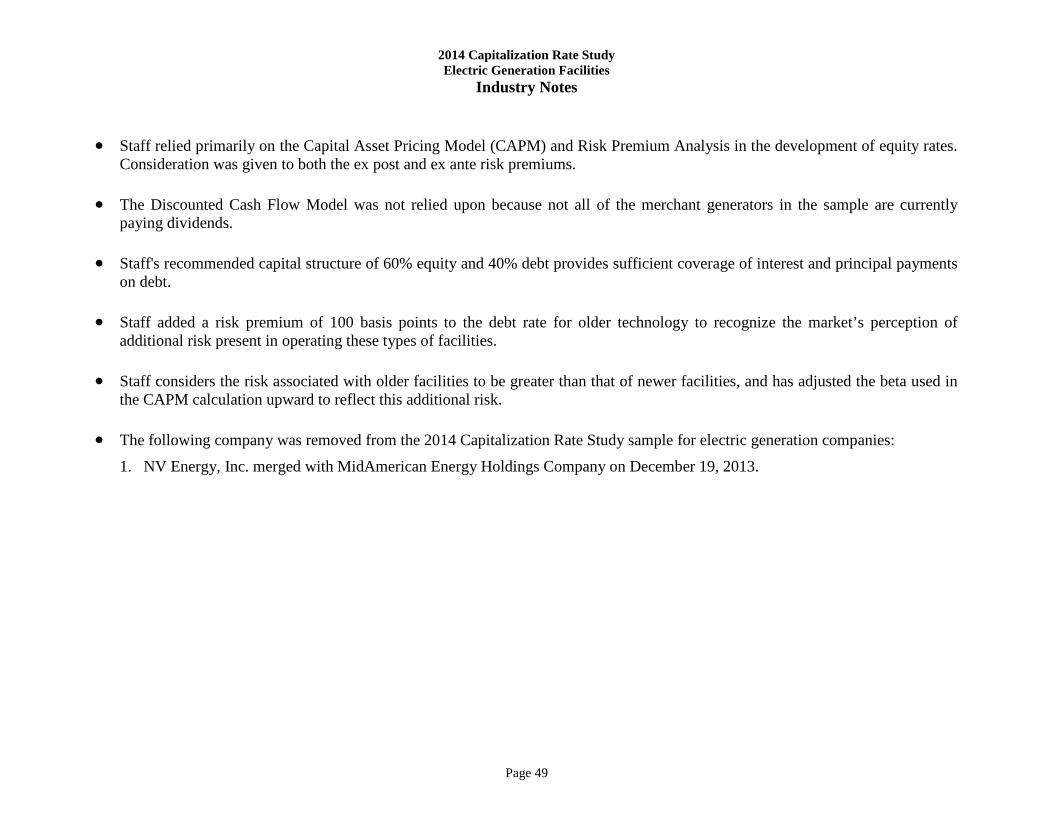
Industry Notes • Staff relied primarily on the Capital Asset Pricing Model (CAPM) and Risk Premium Analysis in the development of equity rates.
Consideration was given to both the ex post and ex ante risk premiums. • The Discounted Cash Flow Model was not relied upon because not all of the merchant generators in the sample are currently
paying dividends. • Staff's recommended capital structure of 60% equity and 40% debt provides sufficient coverage of interest and principal payments
on debt. • Staff added a risk premium of 100 basis points to the debt rate for older technology to recognize the market’s perception of
additional risk present in operating these types of facilities. • Staff considers the risk associated with older facilities to be greater than that of newer facilities, and has adjusted the beta used in
the CAPM calculation upward to reflect this additional risk. • The following company was removed from the 2014 Capitalization Rate Study sample for electric generation companies:
1. NV Energy, Inc. merged with MidAmerican Energy Holdings Company on December 19, 2013.
Page 50
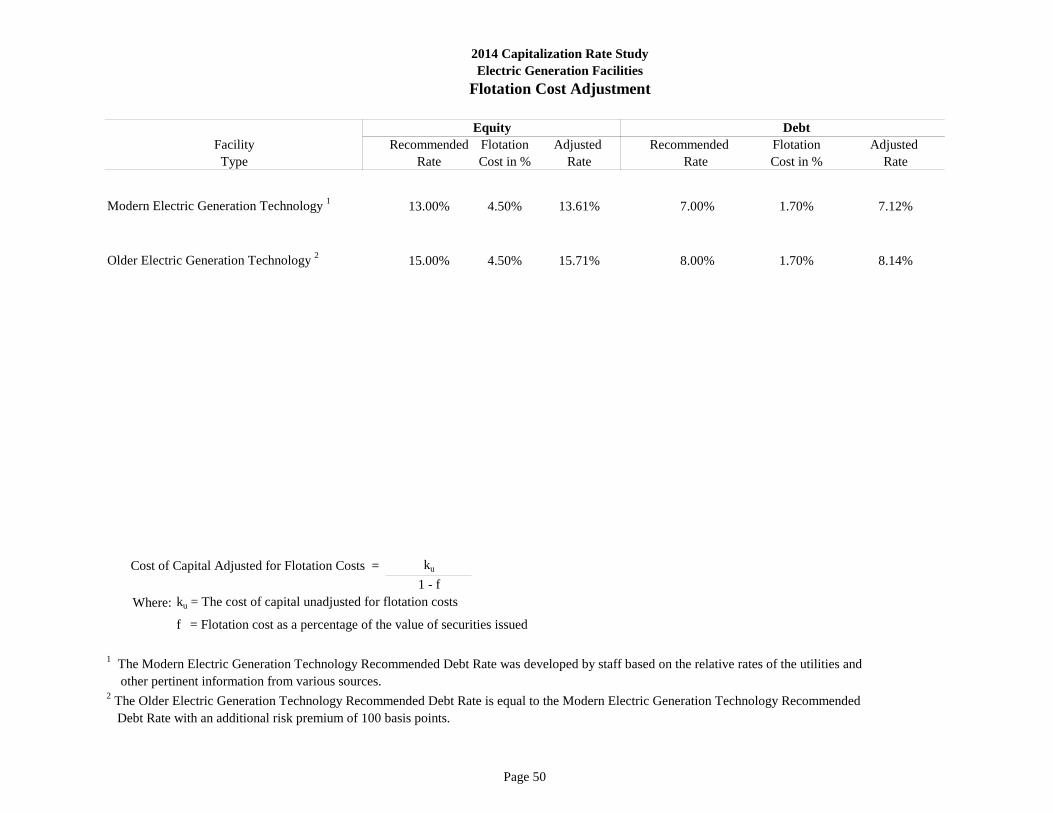
Recommended Flotation Adjusted Recommended Flotation Adjusted Rate Cost in % Rate Rate Cost in % Rate
Modern Electric Generation Technology 1 13.00% 4.50% 13.61% 7.00% 1.70% 7.12%
Older Electric Generation Technology 2 15.00% 4.50% 15.71% 8.00% 1.70% 8.14%
Cost of Capital Adjusted for Flotation Costs = ku
1 - fWhere: ku = The cost of capital unadjusted for flotation costs
f = Flotation cost as a percentage of the value of securities issued
1 The Modern Electric Generation Technology Recommended Debt Rate was developed by staff based on the relative rates of the utilities and other pertinent information from various sources.2 The Older Electric Generation Technology Recommended Debt Rate is equal to the Modern Electric Generation Technology Recommended Debt Rate with an additional risk premium of 100 basis points.
Type
Debt
2014 Capitalization Rate StudyElectric Generation Facilities
Flotation Cost Adjustment
FacilityEquity
Page 51
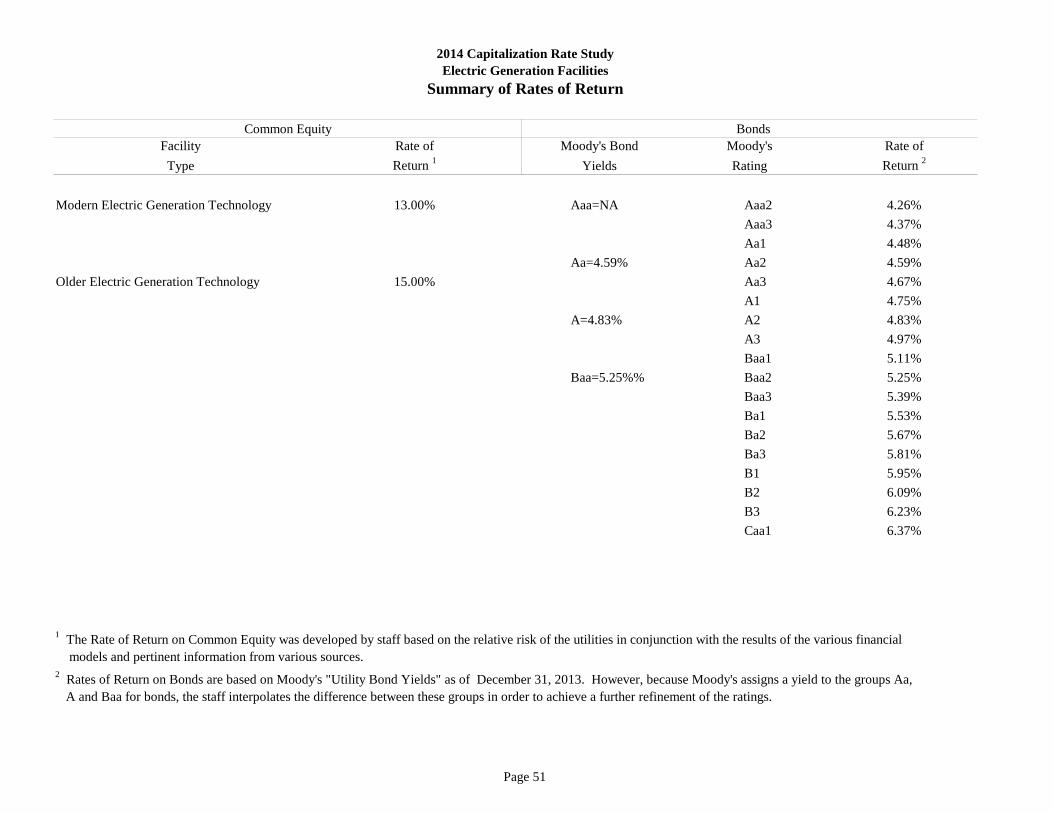
Facility Rate of Moody's Bond Moody's Rate ofType Return 1 Yields Rating Return 2
Modern Electric Generation Technology 13.00% Aaa=NA Aaa2 4.26%Aaa3 4.37%Aa1 4.48%
Aa=4.59% Aa2 4.59%Older Electric Generation Technology 15.00% Aa3 4.67%
A1 4.75%A=4.83% A2 4.83%
A3 4.97%Baa1 5.11%
Baa=5.25%% Baa2 5.25%Baa3 5.39%Ba1 5.53%Ba2 5.67%Ba3 5.81%B1 5.95%B2 6.09%B3 6.23%Caa1 6.37%
1 The Rate of Return on Common Equity was developed by staff based on the relative risk of the utilities in conjunction with the results of the various financial models and pertinent information from various sources.2 Rates of Return on Bonds are based on Moody's "Utility Bond Yields" as of December 31, 2013. However, because Moody's assigns a yield to the groups Aa, A and Baa for bonds, the staff interpolates the difference between these groups in order to achieve a further refinement of the ratings.
BondsCommon Equity
2014 Capitalization Rate StudyElectric Generation Facilities
Summary of Rates of Return
Page 52
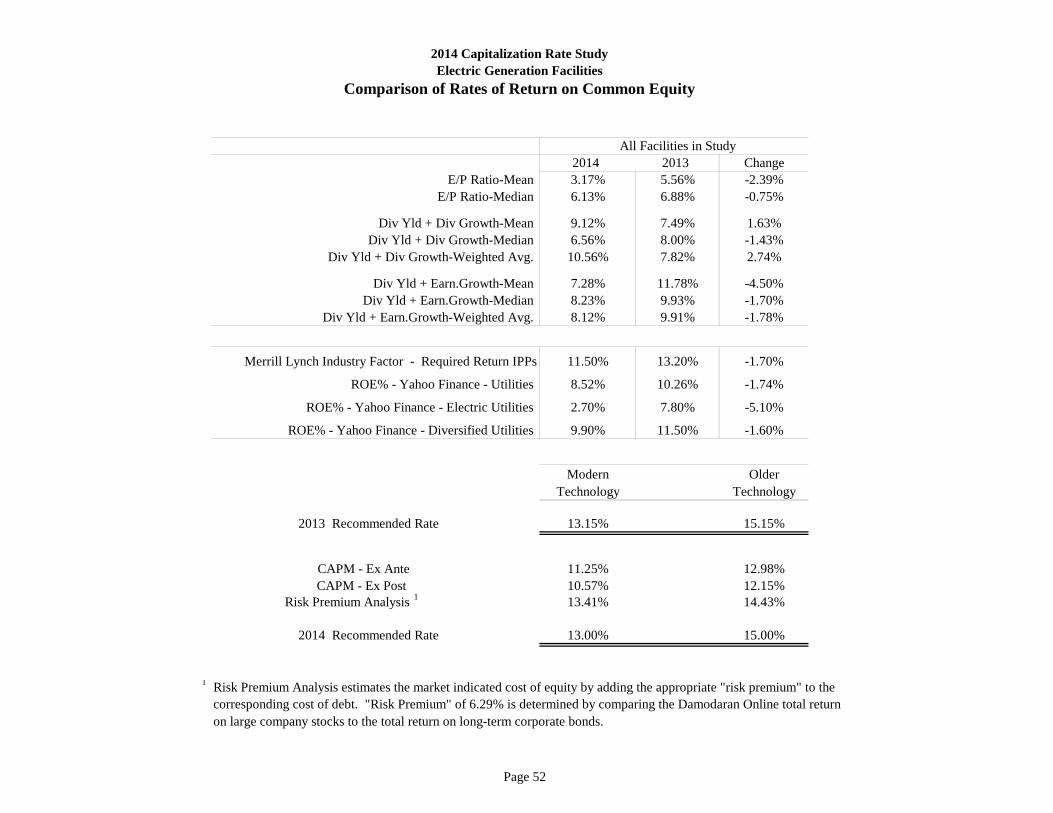
All Facilities in Study2014 2013 Change
E/P Ratio-Mean 3.17% 5.56% -2.39%E/P Ratio-Median 6.13% 6.88% -0.75%
Div Yld + Div Growth-Mean 9.12% 7.49% 1.63%Div Yld + Div Growth-Median 6.56% 8.00% -1.43%
Div Yld + Div Growth-Weighted Avg. 10.56% 7.82% 2.74%
Div Yld + Earn.Growth-Mean 7.28% 11.78% -4.50%Div Yld + Earn.Growth-Median 8.23% 9.93% -1.70%
Div Yld + Earn.Growth-Weighted Avg. 8.12% 9.91% -1.78%
Merrill Lynch Industry Factor - Required Return IPPs 11.50% 13.20% -1.70%
ROE% - Yahoo Finance - Utilities 8.52% 10.26% -1.74%
ROE% - Yahoo Finance - Electric Utilities 2.70% 7.80% -5.10%
ROE% - Yahoo Finance - Diversified Utilities 9.90% 11.50% -1.60%
Modern OlderTechnology Technology
2013 Recommended Rate 13.15% 15.15%
CAPM - Ex Ante 11.25% 12.98%CAPM - Ex Post 10.57% 12.15%
Risk Premium Analysis 1 13.41% 14.43%
2014 Recommended Rate 13.00% 15.00%
1 Risk Premium Analysis estimates the market indicated cost of equity by adding the appropriate "risk premium" to thecorresponding cost of debt. "Risk Premium" of 6.29% is determined by comparing the Damodaran Online total return on large company stocks to the total return on long-term corporate bonds.
2014 Capitalization Rate StudyElectric Generation Facilities
Comparison of Rates of Return on Common Equity
Page 53
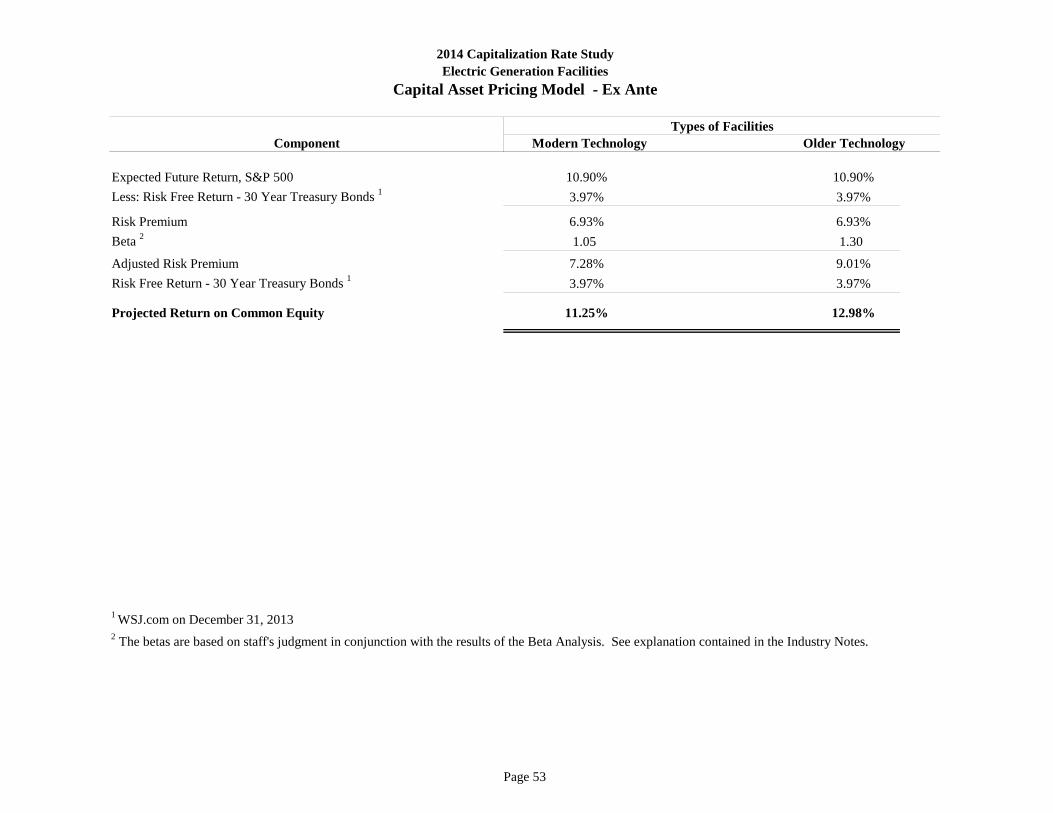
Component
Expected Future Return, S&P 500 10.90% 10.90%Less: Risk Free Return - 30 Year Treasury Bonds 1 3.97% 3.97%
Risk Premium 6.93% 6.93%Beta 2 1.05 1.30
Adjusted Risk Premium 7.28% 9.01%Risk Free Return - 30 Year Treasury Bonds 1 3.97% 3.97%
Projected Return on Common Equity 11.25% 12.98%
1 WSJ.com on December 31, 20132 The betas are based on staff's judgment in conjunction with the results of the Beta Analysis. See explanation contained in the Industry Notes.
2014 Capitalization Rate StudyElectric Generation Facilities
Capital Asset Pricing Model - Ex Ante
Modern Technology Older TechnologyTypes of Facilities
Page 54
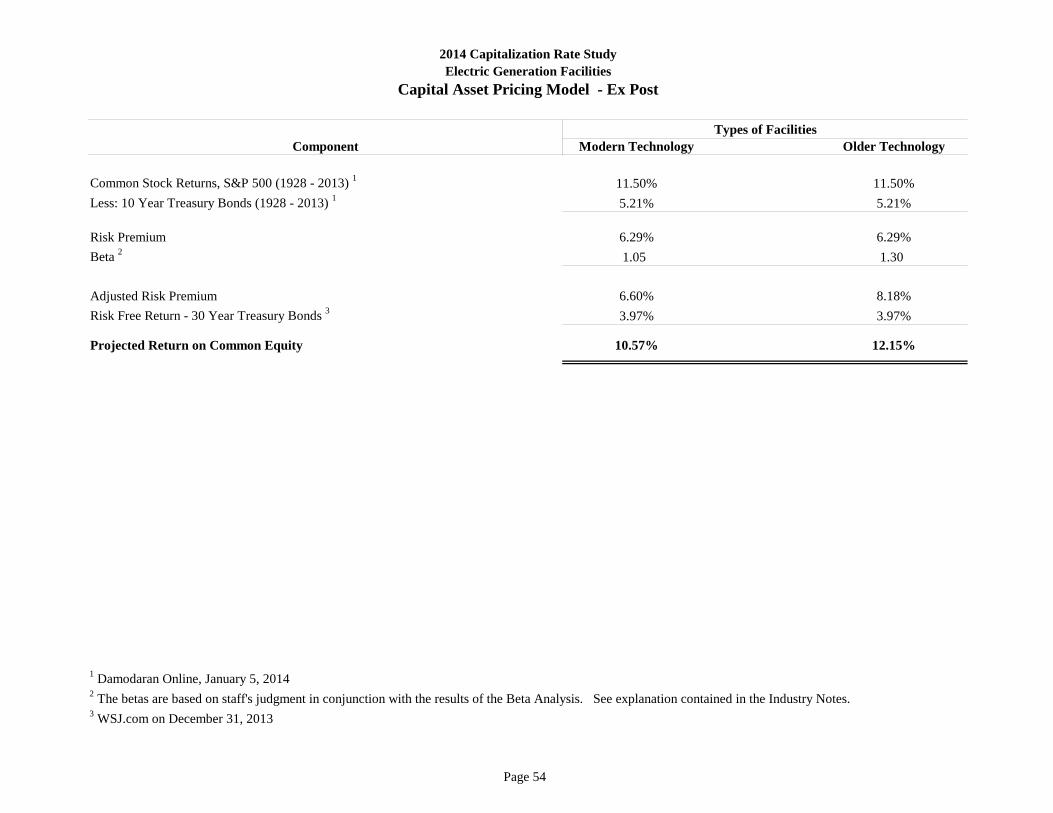
Component Modern Technology Older Technology
Common Stock Returns, S&P 500 (1928 - 2013) 1 11.50% 11.50%Less: 10 Year Treasury Bonds (1928 - 2013) 1 5.21% 5.21%
Risk Premium 6.29% 6.29%Beta 2 1.05 1.30
Adjusted Risk Premium 6.60% 8.18%Risk Free Return - 30 Year Treasury Bonds 3 3.97% 3.97%
Projected Return on Common Equity 10.57% 12.15%
1 Damodaran Online, January 5, 20142 The betas are based on staff's judgment in conjunction with the results of the Beta Analysis. See explanation contained in the Industry Notes.3 WSJ.com on December 31, 2013
Types of Facilities
2014 Capitalization Rate StudyElectric Generation Facilities
Capital Asset Pricing Model - Ex Post
Page 55
2014 Capitalization Rate StudyElectric Generation Facilities
Equity Rates
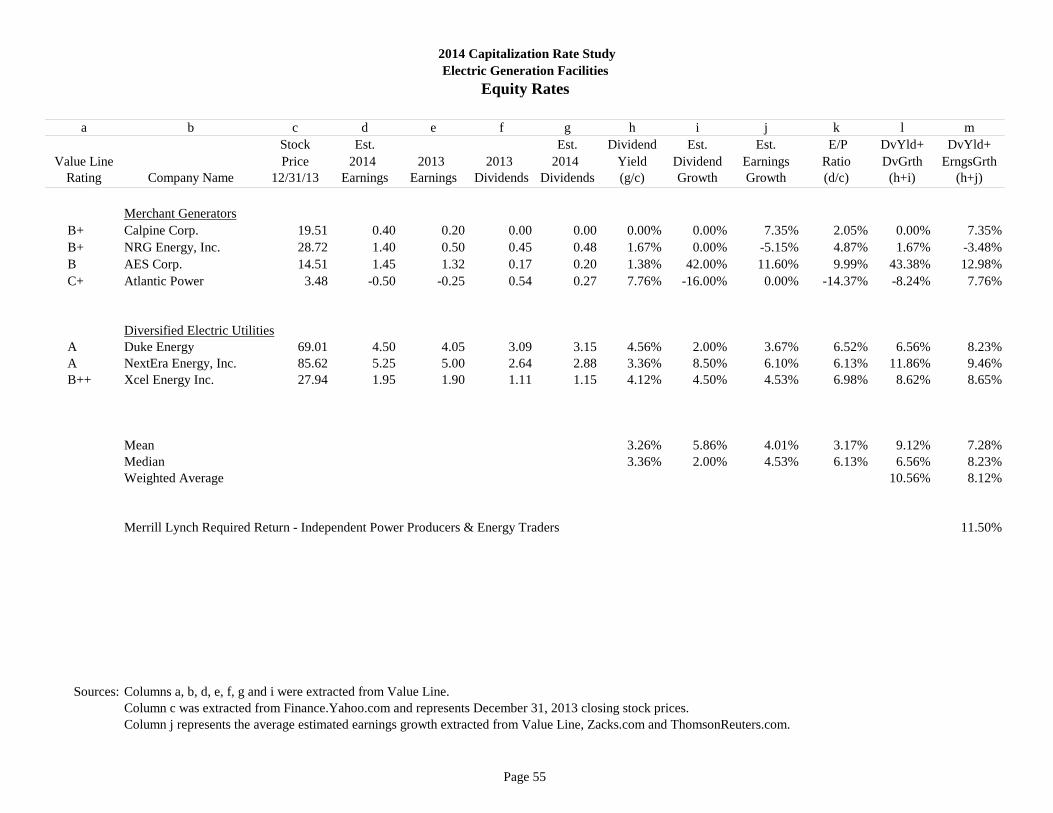
a b c d e f g h i j k l mStock Est. Est. Dividend Est. Est. E/P DvYld+ DvYld+
Value Line Price 2014 2013 2013 2014 Yield Dividend Earnings Ratio DvGrth ErngsGrthRating Company Name 12/31/13 Earnings Earnings Dividends Dividends (g/c) Growth Growth (d/c) (h+i) (h+j)
Merchant GeneratorsB+ Calpine Corp. 19.51 0.40 0.20 0.00 0.00 0.00% 0.00% 7.35% 2.05% 0.00% 7.35%B+ NRG Energy, Inc. 28.72 1.40 0.50 0.45 0.48 1.67% 0.00% -5.15% 4.87% 1.67% -3.48%B AES Corp. 14.51 1.45 1.32 0.17 0.20 1.38% 42.00% 11.60% 9.99% 43.38% 12.98%C+ Atlantic Power 3.48 -0.50 -0.25 0.54 0.27 7.76% -16.00% 0.00% -14.37% -8.24% 7.76%
Diversified Electric Utilities A Duke Energy 69.01 4.50 4.05 3.09 3.15 4.56% 2.00% 3.67% 6.52% 6.56% 8.23%A NextEra Energy, Inc. 85.62 5.25 5.00 2.64 2.88 3.36% 8.50% 6.10% 6.13% 11.86% 9.46%B++ Xcel Energy Inc. 27.94 1.95 1.90 1.11 1.15 4.12% 4.50% 4.53% 6.98% 8.62% 8.65%
Mean 3.26% 5.86% 4.01% 3.17% 9.12% 7.28%Median 3.36% 2.00% 4.53% 6.13% 6.56% 8.23%Weighted Average 10.56% 8.12%
Merrill Lynch Required Return - Independent Power Producers & Energy Traders 11.50%
Sources: Columns a, b, d, e, f, g and i were extracted from Value Line.Column c was extracted from Finance.Yahoo.com and represents December 31, 2013 closing stock prices.Column j represents the average estimated earnings growth extracted from Value Line, Zacks.com and ThomsonReuters.com.
Page 56
2014 Capitalization Rate StudyElectric Generation Facilities
Long Term Earnings Growth
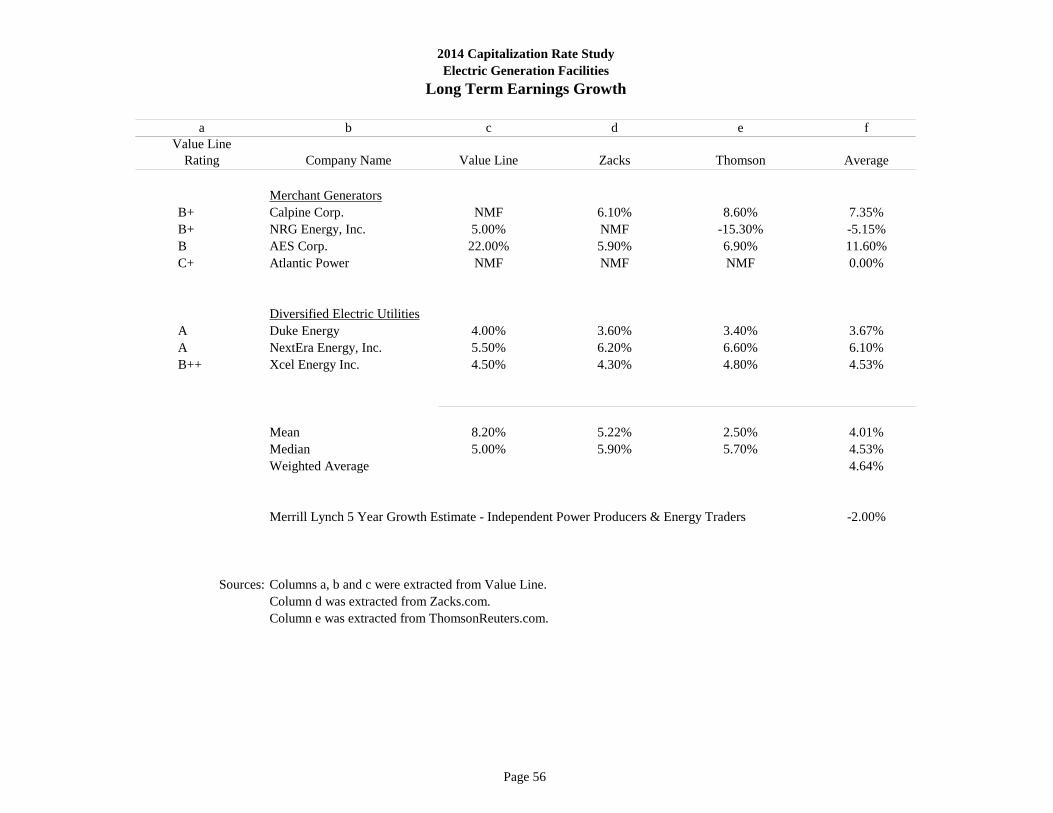
a b c d e fValue Line
Rating Company Name Value Line Zacks Thomson Average
Merchant GeneratorsB+ Calpine Corp. NMF 6.10% 8.60% 7.35%B+ NRG Energy, Inc. 5.00% NMF -15.30% -5.15%B AES Corp. 22.00% 5.90% 6.90% 11.60%C+ Atlantic Power NMF NMF NMF 0.00%
Diversified Electric UtilitiesA Duke Energy 4.00% 3.60% 3.40% 3.67%A NextEra Energy, Inc. 5.50% 6.20% 6.60% 6.10%B++ Xcel Energy Inc. 4.50% 4.30% 4.80% 4.53%
Mean 8.20% 5.22% 2.50% 4.01%Median 5.00% 5.90% 5.70% 4.53%Weighted Average 4.64%
Merrill Lynch 5 Year Growth Estimate - Independent Power Producers & Energy Traders -2.00%
Sources: Columns a, b and c were extracted from Value Line. Column d was extracted from Zacks.com.Column e was extracted from ThomsonReuters.com.
Page 57
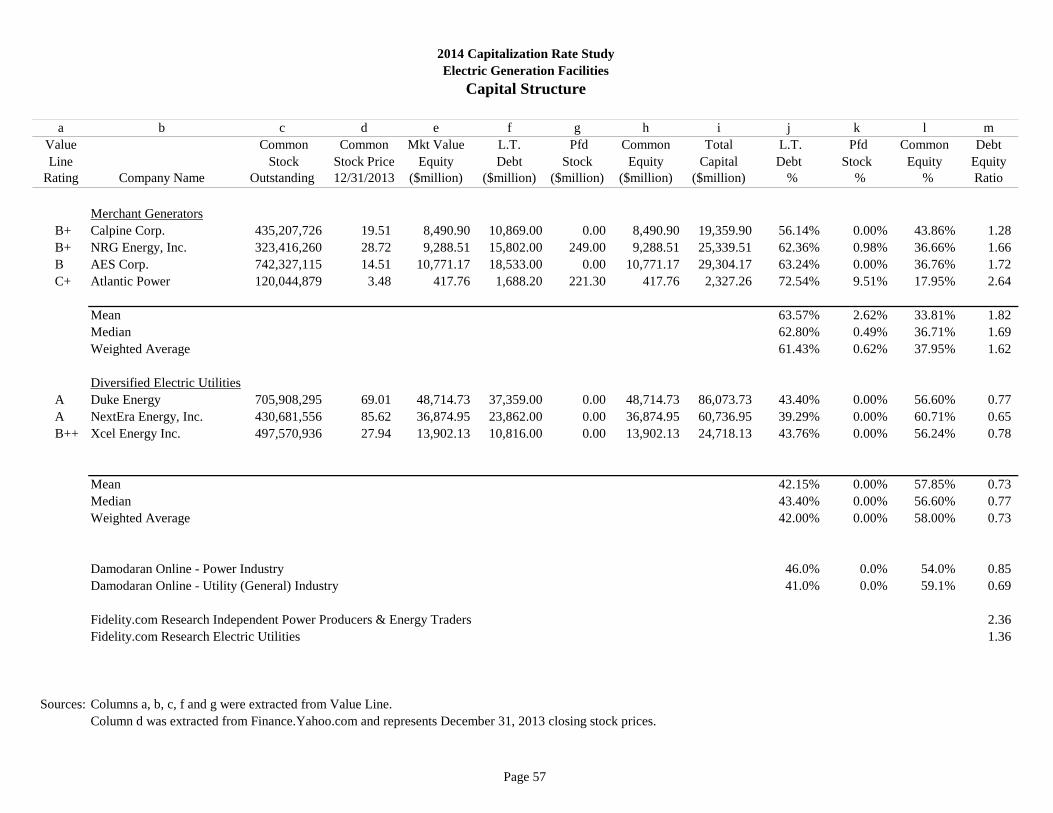
a b c d e f g h i j k l mValue Common Common Mkt Value L.T. Pfd Common Total L.T. Pfd Common DebtLine Stock Stock Price Equity Debt Stock Equity Capital Debt Stock Equity Equity
Rating Company Name Outstanding 12/31/2013 ($million) ($million) ($million) ($million) ($million) % % % Ratio
Merchant GeneratorsB+ Calpine Corp. 435,207,726 19.51 8,490.90 10,869.00 0.00 8,490.90 19,359.90 56.14% 0.00% 43.86% 1.28 B+ NRG Energy, Inc. 323,416,260 28.72 9,288.51 15,802.00 249.00 9,288.51 25,339.51 62.36% 0.98% 36.66% 1.66 B AES Corp. 742,327,115 14.51 10,771.17 18,533.00 0.00 10,771.17 29,304.17 63.24% 0.00% 36.76% 1.72 C+ Atlantic Power 120,044,879 3.48 417.76 1,688.20 221.30 417.76 2,327.26 72.54% 9.51% 17.95% 2.64
Mean 63.57% 2.62% 33.81% 1.82 Median 62.80% 0.49% 36.71% 1.69 Weighted Average 61.43% 0.62% 37.95% 1.62
Diversified Electric UtilitiesA Duke Energy 705,908,295 69.01 48,714.73 37,359.00 0.00 48,714.73 86,073.73 43.40% 0.00% 56.60% 0.77 A NextEra Energy, Inc. 430,681,556 85.62 36,874.95 23,862.00 0.00 36,874.95 60,736.95 39.29% 0.00% 60.71% 0.65 B++ Xcel Energy Inc. 497,570,936 27.94 13,902.13 10,816.00 0.00 13,902.13 24,718.13 43.76% 0.00% 56.24% 0.78
Mean 42.15% 0.00% 57.85% 0.73 Median 43.40% 0.00% 56.60% 0.77 Weighted Average 42.00% 0.00% 58.00% 0.73
Damodaran Online - Power Industry 46.0% 0.0% 54.0% 0.85 Damodaran Online - Utility (General) Industry 41.0% 0.0% 59.1% 0.69
Fidelity.com Research Independent Power Producers & Energy Traders 2.36 Fidelity.com Research Electric Utilities 1.36
Sources: Columns a, b, c, f and g were extracted from Value Line.Column d was extracted from Finance.Yahoo.com and represents December 31, 2013 closing stock prices.
2014 Capitalization Rate StudyElectric Generation Facilities
Capital Structure

Page 58
a b c d e f g h iValue Value Standard Company DebtLine Line Zacks & Poor's Average Tax Equity Unlevered
Rating Company Name Beta Beta Beta Beta Rate Ratio 1 Beta 2
Merchant GeneratorsB+ Calpine Corp. 1.10 1.18 1.17 1.15 0.10 1.24 0.58B+ NRG Energy, Inc. 1.05 0.67 0.57 0.76 0.30 1.78 0.37B AES Corp. 1.25 1.26 1.34 1.28 0.25 2.02 0.56C+ Atlantic Power 0.70 0.41 0.44 0.52 0.00 1.71 0.21
Mean 0.93 0.16 1.69 0.43Median 0.96 0.18 0.47Weighted 1.05 0.22 0.49
Diversified Electric UtilityA Duke Energy 0.65 0.28 0.34 0.42 0.34 0.64 0.30A NextEra Energy, Inc. 0.70 0.51 0.47 0.56 0.27 0.71 0.37B++ Xcel Energy Inc. 0.65 0.28 0.31 0.41 0.34 0.75 0.28
Mean 0.67 0.36 0.37 0.47 0.32 0.70 0.31Median 0.65 0.28 0.34 0.42 0.34 0.30Weighted 0.47 0.32 0.32
Merchant Generators Relevered Beta based on 40% Debt Capital Structure 0.69 3
Diversified Electric Utilities Relevered Beta based on 40% Debt Capital Structure 0.45 3
Merrill Lynch Adjusted Beta Independent Power Producers & Energy Traders 1.05
Sources: Columns a, b, c and g were extracted from Value Line. Column d was extracted from Zacks.com. Column e was extracted from Standard and Poor's Stock Reports.
1 Average Debt to Equity Ratio over the last five years. 2 Unlevered Beta = Corrected Beta/[1+(1-tc)(D/E)]; where D/E is the debt to equity ratio, tc is the company's 2013 tax rate. 3 Relevered Beta = [Unlevered Beta][1+(1-tp)(D/E)]; where D/E is the debt to equity ratio, tp is a prospective purchaser's tax rate (assumed to be 40%).
2014 Capitalization Rate StudyElectric Generation Facilities
Beta Analysis

Page 59
BasicCommon Common Cap
SBE No. Company Name Financial Bond Equity Debt Equity Debt Rate
Local Exchange Companies279 Pacific Bell Telephone Company A++ A2 70% 30% 12.25% 4.91% 10.05%201 Verizon California, Inc. A++ A3 70% 30% 12.25% 5.06% 10.09%284 Citizens Telecommunications Company of California, Inc. B Not Rated 65% 35% 13.30% 5.48% 10.56%294 SureWest Telephone C++ Not Rated 65% 35% 13.30% 5.48% 10.56%
Other Local Exchange Companies Not Rated Not Rated 65% 35% 15.65% 5.63% 12.14%
Wireless Companies2606 AT&T Mobility LLC A++ A2 70% 30% 11.73% 4.91% 9.68%2532 Los Angeles SMSA Ltd., Partnership A++ A3 70% 30% 11.73% 5.06% 9.73%2552 Fresno MSA Limited Partnership A++ A3 70% 30% 11.73% 5.06% 9.73%2559 Cellco Partnership A++ A3 70% 30% 11.73% 5.06% 9.73%2669 California RSA #4 Partnership A++ A3 70% 30% 11.73% 5.06% 9.73%2748 T-Mobile West Corporation B Not Rated 65% 35% 13.04% 5.63% 10.44%2720 Sprint Telephony PCS, L.P. C++ B3 65% 35% 14.87% 6.34% 11.88%
Other Wireless Companies1 Not Rated Not Rated 55% 45% 16.96% 7.86% 12.87%
Wireless Reseller Companies Not Rated Not Rated 55% 45% 19.06% 8.37% 14.25%
Interexchange Companies2310 AT&T Communications A++ A2 70% 30% 13.04% 4.91% 10.60%2274 MCI Communications Services, Inc. A++ A3 70% 30% 13.04% 5.06% 10.64%2372 MCI Metro Access Transmission Services, LLC A++ A3 70% 30% 13.04% 5.06% 10.64%2463 CenturyLink, Inc. B+ Baa3 65% 35% 14.61% 5.48% 11.41%7522 tw telecom of california l.p. B B1 65% 35% 14.61% 6.05% 11.61%2014 Sprint Communications Company, L.P. C++ B3 60% 40% 16.96% 6.34% 12.71%7761 Level 3 Communications, LLC C++ Caa2 60% 40% 16.96% 7.86% 13.32%
Other Interexchange Carriers Not Rated Not Rated 55% 45% 21.68% 7.86% 15.46%
Other Interexchange Resellers Not Rated Not Rated 55% 45% 24.82% 8.37% 17.42%1 Includes Radio Telephone and Paging Companies
California State Board of Equalization
Ratings Capital Structure Rates of Return
2014 Capitalization Rate StudyTelecommunications Companies
State-Assessed Properties Division
Page 60
2014 Capitalization Rate Study Telecommunications Companies
Industry Notes
• Staff conducted a consolidated capitalization rate study for the local exchange, wireless, and interexchange industries due to
the increasing convergence of these three industries. Separate capitalization rates were estimated for the companies in each of the three industries based on the relative risk experienced by each group of companies within their respective industries.
• Staff relied on the Discounted Cash Flow Model (DCF) and Capital Asset Pricing Model (CAPM) ex post and ex ante in the
development of equity rates.
• MetroPCS Communications, Inc. was removed from the 2014 Capitalization Rate Study sample as it was acquired by T-Mobile USA, Inc. in 2013.
• T-Mobile US, Inc. was added to the 2014 Capitalization Rate Study sample. T-Mobile USA, Inc. acquired Metro PCS Communications, Inc. in 2013. The combined company, renamed T-Mobile US, Inc., became a publicly traded company on the New York Stock Exchange under the ticker symbol TMUS.
• Warwick Valley Telephone Company changed its name to Alteva, Inc. and its trading ticker symbol to ALTV.
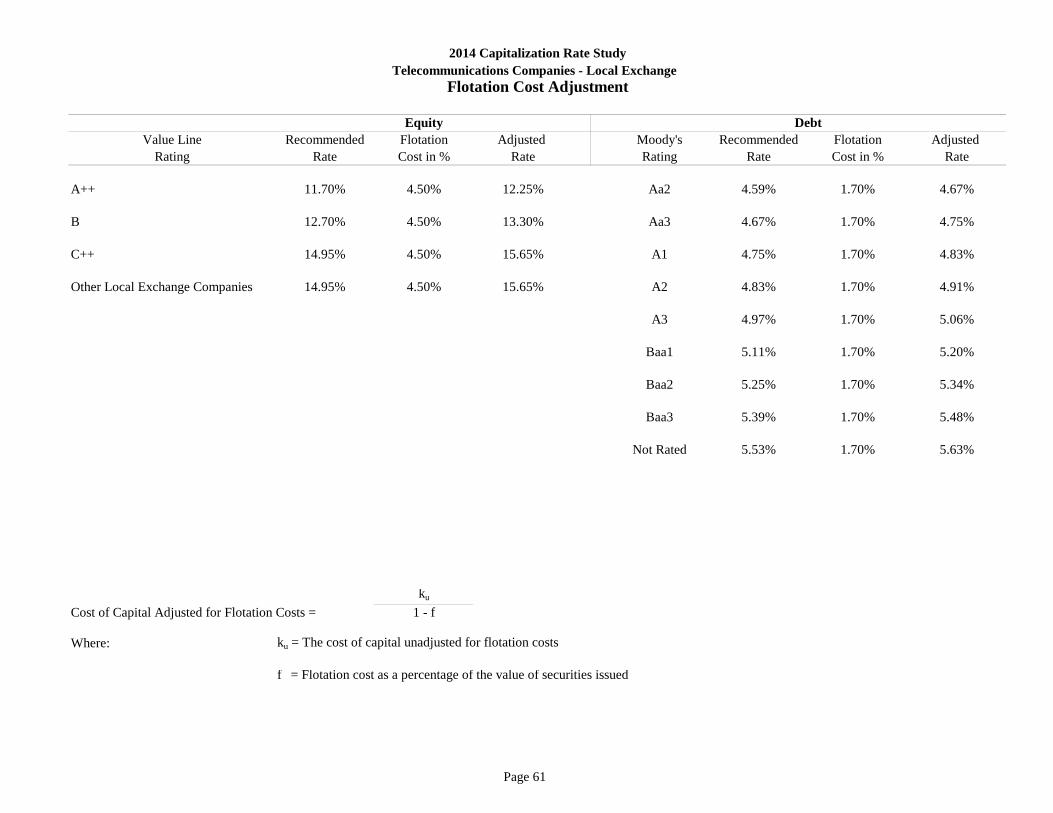
Page 61
Value Line Recommended Flotation Adjusted Moody's Recommended Flotation Adjusted Rating Rate Cost in % Rate Rating Rate Cost in % Rate
A++ 11.70% 4.50% 12.25% Aa2 4.59% 1.70% 4.67%
B 12.70% 4.50% 13.30% Aa3 4.67% 1.70% 4.75%
C++ 14.95% 4.50% 15.65% A1 4.75% 1.70% 4.83%
Other Local Exchange Companies 14.95% 4.50% 15.65% A2 4.83% 1.70% 4.91%
A3 4.97% 1.70% 5.06%
Baa1 5.11% 1.70% 5.20%
Baa2 5.25% 1.70% 5.34%
Baa3 5.39% 1.70% 5.48%
Not Rated 5.53% 1.70% 5.63%
ku
Cost of Capital Adjusted for Flotation Costs = 1 - f
Where: ku = The cost of capital unadjusted for flotation costs
f = Flotation cost as a percentage of the value of securities issued
Debt
2014 Capitalization Rate StudyTelecommunications Companies - Local Exchange
Flotation Cost Adjustment
Equity

Page 62
Value Line Recommended Flotation Adjusted Moody's Recommended Flotation Adjusted Rating Rate Cost in % Rate Rating Rate Cost in % Rate
A++ 11.20% 4.50% 11.73% Aa2 4.59% 1.70% 4.67%B 12.45% 4.50% 13.04% Aa3 4.67% 1.70% 4.75%C++ 14.20% 4.50% 14.87% A1 4.75% 1.70% 4.83%Other Wireless Companies1 16.20% 4.50% 16.96% A2 4.83% 1.70% 4.91%Wireless Reseller Companies 18.20% 4.50% 19.06% A3 4.97% 1.70% 5.06%
Baa1 5.11% 1.70% 5.20%Baa2 5.25% 1.70% 5.34%Baa3 5.39% 1.70% 5.48%Ba1 5.53% 1.70% 5.63%Ba2 5.67% 1.70% 5.77%Ba3 5.81% 1.70% 5.91%B1 5.95% 1.70% 6.05%B2 6.09% 1.70% 6.20%B3 6.23% 1.70% 6.34%
Not Rated 7.73% 1.70% 7.86%Not Rated 8.23% 1.70% 8.37%
ku
Cost of Capital Adjusted for Flotation Costs = 1 - f
Where: ku = The cost of capital unadjusted for flotation costs
f = Flotation cost as a percentage of the value of securities issued
1 Includes Radio Telephone and Paging Companies
2014 Capitalization Rate StudyTelecommunications Companies - Wireless
Flotation Cost Adjustment
DebtEquity

Page 63
Value Line Recommended Flotation Adjusted Moody's Recommended Flotation Adjusted Rating Rate Cost in % Rate Rating Rate Cost in % Rate
A++ 12.45% 4.50% 13.04% Aa2 4.59% 1.70% 4.67%B++, B 13.95% 4.50% 14.61% Aa3 4.67% 1.70% 4.75%C++ 16.20% 4.50% 16.96% A1 4.75% 1.70% 4.83%Other Interexchange Carriers 20.70% 4.50% 21.68% A2 4.83% 1.70% 4.91%Other Interexchange Resellers 23.70% 4.50% 24.82% A3 4.97% 1.70% 5.06%
Baa1 5.11% 1.70% 5.20%Baa2 5.25% 1.70% 5.34%Baa3 5.39% 1.70% 5.48%Ba1 5.53% 1.70% 5.63%Ba2 5.67% 1.70% 5.77%Ba3 5.81% 1.70% 5.91%B1 5.95% 1.70% 6.05%B2 6.09% 1.70% 6.20%B3 6.23% 1.70% 6.34%
Not Rated 7.73% 1.70% 7.86%Not Rated 8.23% 1.70% 8.37%
ku
Cost of Capital Adjusted for Flotation Costs = 1 - f
Where: ku = The cost of capital unadjusted for flotation costs
f = Flotation cost as a percentage of the value of securities issued
Debt
2014 Capitalization Rate StudyTelecommunications Companies - Interexchange
Flotation Cost Adjustment
Equity

Page 64
Description2014 2013 Change 2014 2013 Change 2014 2013 Change
Discounted Cash Flow Analysis E/P Ratio - Mean 7.15% 7.02% 0.13% 4.84% 6.61% -1.77% 4.58% 3.46% 1.13% E/P Ratio - Median 7.15% 7.02% 0.13% 5.38% 6.64% -1.27% 4.58% 3.46% 1.13%
Dividend Yield + Dividend Growth - Mean 7.77% 7.54% 0.24% 6.73% 6.89% -0.16% 7.90% 9.74% -1.85% Dividend Yield + Dividend Growth - Median 7.77% 7.54% 0.24% 6.78% 7.41% -0.63% 7.90% 9.74% -1.85% Weighted Average (Div. Yield + Div. Growth) 7.84% 7.69% 0.15% 6.67% 6.42% 0.25% 7.90% 9.74% -1.85%
Dividend Yield + Earnings Growth - Mean 12.61% 12.51% 0.10% 11.36% 12.67% -1.31% 14.36% 12.41% 1.95% Dividend Yield + Earnings Growth - Median 12.61% 12.51% 0.10% 10.06% 14.11% -4.06% 14.36% 12.41% 1.95% Weighted Average (Div. Yield + Earn. Growth) 12.57% 12.41% 0.16% 10.01% 12.42% -2.42% 14.36% 12.41% 1.95%
CAPM Analysis Ex Ante 8.27% 7.95% 0.32% 9.17% 9.14% 0.03% 10.62% 10.96% -0.34% Ex Post 7.87% 7.19% 0.68% 8.69% 8.20% 0.49% 10.01% 9.74% 0.27%
Recommended Rates Local Exchange 11.70% 11.50% 0.20% 12.70% 12.50% 0.20% 14.95% 14.75% 0.20% Wireless 11.20% 11.00% 0.20% 12.45% 12.25% 0.20% 14.20% 14.00% 0.20% Interexchange 12.45% 12.25% 0.20% 13.95% 13.75% 0.20% 16.20% 16.00% 0.20%
C++, C+, CA++ B++, B+, B
2014 Capitalization Rate StudyTelecommunications Companies
Comparison of Return on Common Equity
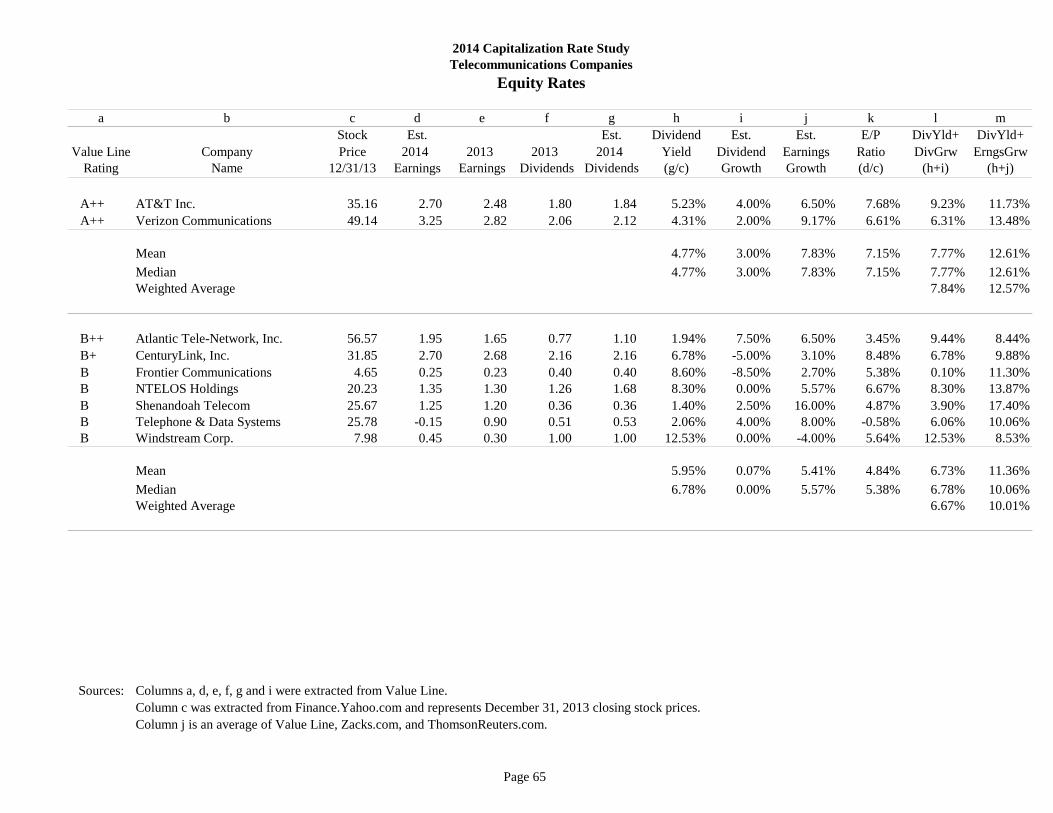
Page 65
a b c d e f g h i j k l mStock Est. Est. Dividend Est. Est. E/P DivYld+ DivYld+
Value Line Company Price 2014 2013 2013 2014 Yield Dividend Earnings Ratio DivGrw ErngsGrwRating Name 12/31/13 Earnings Earnings Dividends Dividends (g/c) Growth Growth (d/c) (h+i) (h+j)
A++ AT&T Inc. 35.16 2.70 2.48 1.80 1.84 5.23% 4.00% 6.50% 7.68% 9.23% 11.73%A++ Verizon Communications 49.14 3.25 2.82 2.06 2.12 4.31% 2.00% 9.17% 6.61% 6.31% 13.48%
Mean 4.77% 3.00% 7.83% 7.15% 7.77% 12.61%Median 4.77% 3.00% 7.83% 7.15% 7.77% 12.61%Weighted Average 7.84% 12.57%
B++ Atlantic Tele-Network, Inc. 56.57 1.95 1.65 0.77 1.10 1.94% 7.50% 6.50% 3.45% 9.44% 8.44%B+ CenturyLink, Inc. 31.85 2.70 2.68 2.16 2.16 6.78% -5.00% 3.10% 8.48% 6.78% 9.88%B Frontier Communications 4.65 0.25 0.23 0.40 0.40 8.60% -8.50% 2.70% 5.38% 0.10% 11.30%B NTELOS Holdings 20.23 1.35 1.30 1.26 1.68 8.30% 0.00% 5.57% 6.67% 8.30% 13.87%B Shenandoah Telecom 25.67 1.25 1.20 0.36 0.36 1.40% 2.50% 16.00% 4.87% 3.90% 17.40%B Telephone & Data Systems 25.78 -0.15 0.90 0.51 0.53 2.06% 4.00% 8.00% -0.58% 6.06% 10.06%B Windstream Corp. 7.98 0.45 0.30 1.00 1.00 12.53% 0.00% -4.00% 5.64% 12.53% 8.53%
Mean 5.95% 0.07% 5.41% 4.84% 6.73% 11.36%Median 6.78% 0.00% 5.57% 5.38% 6.78% 10.06%Weighted Average 6.67% 10.01%
Sources: Columns a, d, e, f, g and i were extracted from Value Line.Column c was extracted from Finance.Yahoo.com and represents December 31, 2013 closing stock prices.Column j is an average of Value Line, Zacks.com, and ThomsonReuters.com.
Telecommunications Companies2014 Capitalization Rate Study
Equity Rates

Page 66
a b c d e f g h i j k l mStock Est. Est. Dividend Est. Est. E/P DivYld+ DivYld+
Value Line Company Price 2014 2013 2013 2014 Yield Dividend Earnings Ratio DivGrw ErngsGrwRating Name 12/31/13 Earnings Earnings Dividends Dividends (g/c) Growth Growth (d/c) (h+i) (h+j)
C++ Consolidated Communications 19.63 0.90 0.95 1.55 1.55 7.90% 0.00% 6.47% 4.58% 7.90% 14.36%
Mean 7.90% 0.00% 6.47% 4.58% 7.90% 14.36%Median 7.90% 0.00% 6.47% 4.58% 7.90% 14.36%Weighted Average 7.90% 14.36%
Sources: Columns a, d, e, f, g and i were extracted from Value Line.Column c was extracted from Finance.Yahoo.com and represents December 31, 2013 closing stock prices.Column j is an average of Value Line, Zacks.com, and ThomsonReuters.com.
2014 Capitalization Rate StudyTelecommunications Companies
Equity Rates
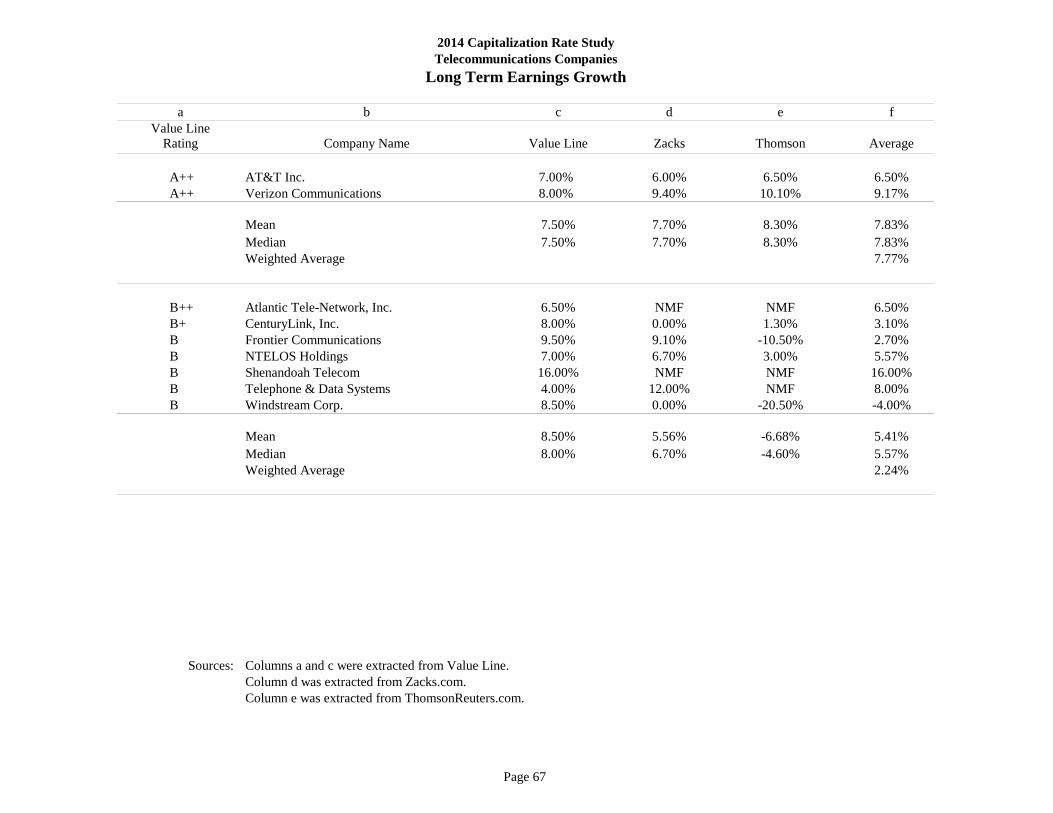
Page 67
a b c d e fValue Line
Rating Company Name Value Line Zacks Thomson Average
A++ AT&T Inc. 7.00% 6.00% 6.50% 6.50%A++ Verizon Communications 8.00% 9.40% 10.10% 9.17%
Mean 7.50% 7.70% 8.30% 7.83%Median 7.50% 7.70% 8.30% 7.83%Weighted Average 7.77%
B++ Atlantic Tele-Network, Inc. 6.50% NMF NMF 6.50%B+ CenturyLink, Inc. 8.00% 0.00% 1.30% 3.10%B Frontier Communications 9.50% 9.10% -10.50% 2.70%B NTELOS Holdings 7.00% 6.70% 3.00% 5.57%B Shenandoah Telecom 16.00% NMF NMF 16.00%B Telephone & Data Systems 4.00% 12.00% NMF 8.00%B Windstream Corp. 8.50% 0.00% -20.50% -4.00%
Mean 8.50% 5.56% -6.68% 5.41%Median 8.00% 6.70% -4.60% 5.57%Weighted Average 2.24%
Sources:
2014 Capitalization Rate StudyTelecommunications Companies
Columns a and c were extracted from Value Line. Column d was extracted from Zacks.com.Column e was extracted from ThomsonReuters.com.
Long Term Earnings Growth
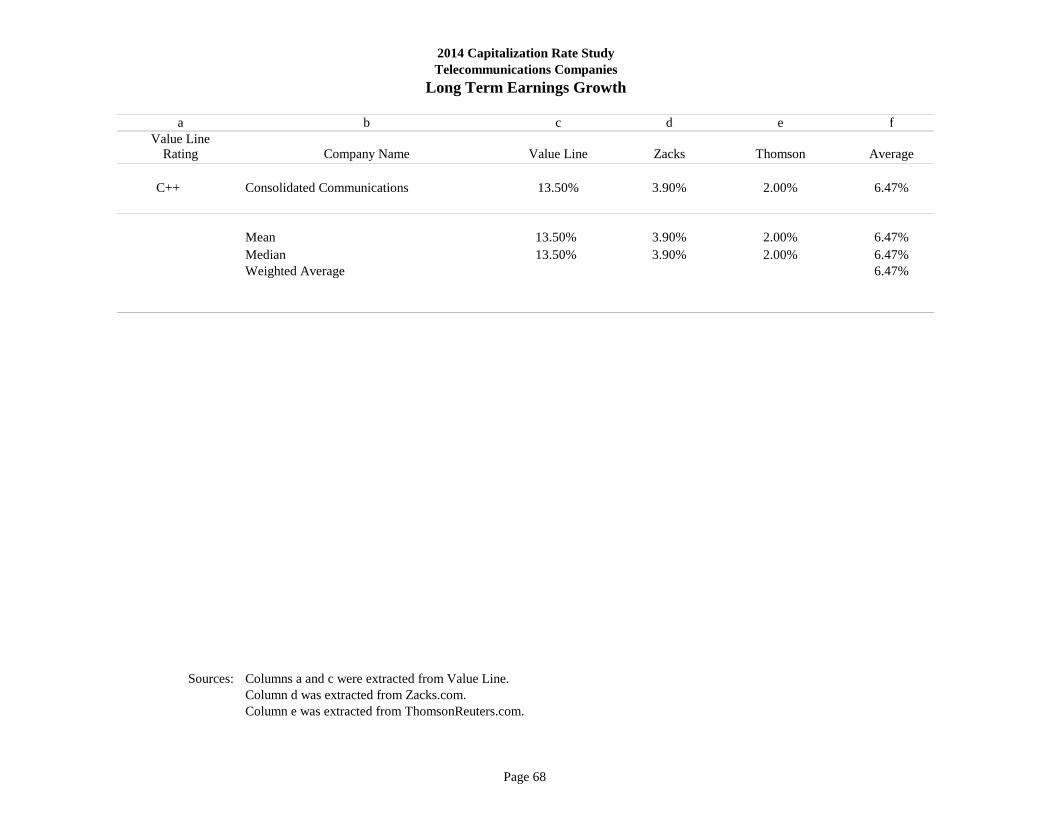
Page 68
a b c d e fValue Line
Rating Company Name Value Line Zacks Thomson Average
C++ Consolidated Communications 13.50% 3.90% 2.00% 6.47%
Mean 13.50% 3.90% 2.00% 6.47%Median 13.50% 3.90% 2.00% 6.47%Weighted Average 6.47%
Sources:
2014 Capitalization Rate StudyTelecommunications Companies
Column d was extracted from Zacks.com.Columns a and c were extracted from Value Line.
Column e was extracted from ThomsonReuters.com.
Long Term Earnings Growth
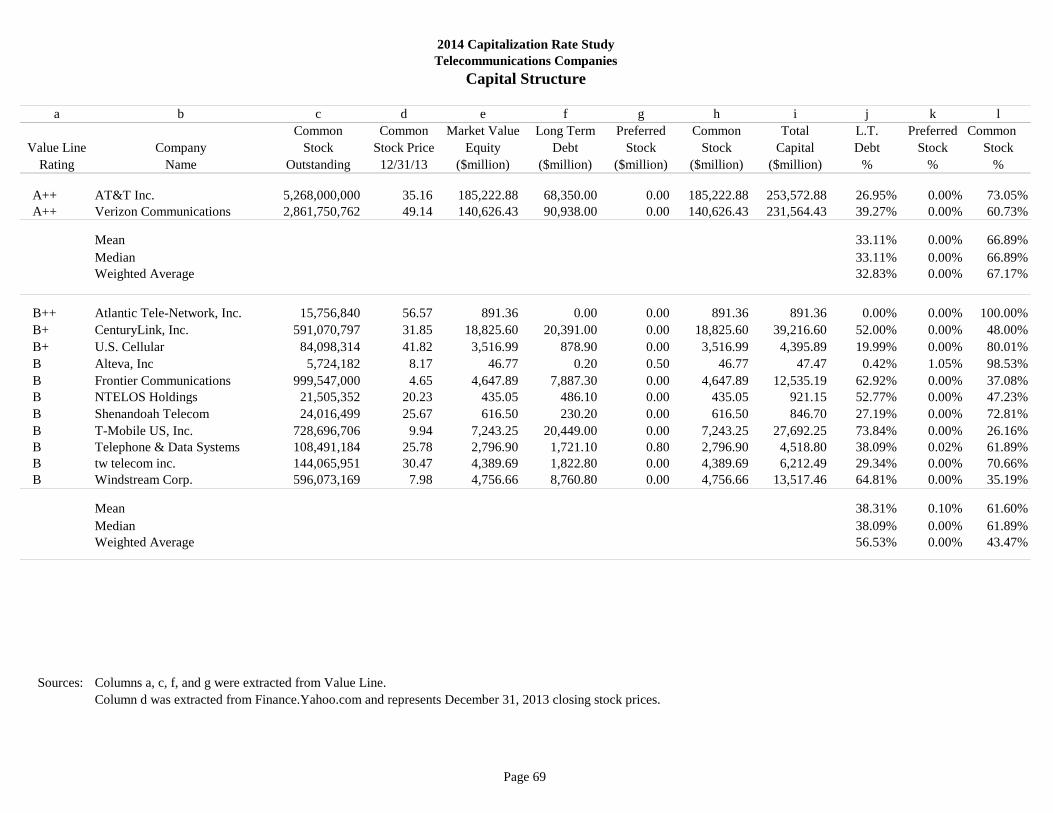
Page 69
a b c d e f g h i j k l
Common Common Market Value Long Term Preferred Common Total L.T. Preferred CommonValue Line Company Stock Stock Price Equity Debt Stock Stock Capital Debt Stock Stock
Rating Name Outstanding 12/31/13 ($million) ($million) ($million) ($million) ($million) % % %
A++ AT&T Inc. 5,268,000,000 35.16 185,222.88 68,350.00 0.00 185,222.88 253,572.88 26.95% 0.00% 73.05% A++ Verizon Communications 2,861,750,762 49.14 140,626.43 90,938.00 0.00 140,626.43 231,564.43 39.27% 0.00% 60.73%
Mean 33.11% 0.00% 66.89%Median 33.11% 0.00% 66.89%Weighted Average 32.83% 0.00% 67.17%
B++ Atlantic Tele-Network, Inc. 15,756,840 56.57 891.36 0.00 0.00 891.36 891.36 0.00% 0.00% 100.00%B+ CenturyLink, Inc. 591,070,797 31.85 18,825.60 20,391.00 0.00 18,825.60 39,216.60 52.00% 0.00% 48.00%B+ U.S. Cellular 84,098,314 41.82 3,516.99 878.90 0.00 3,516.99 4,395.89 19.99% 0.00% 80.01%B Alteva, Inc 5,724,182 8.17 46.77 0.20 0.50 46.77 47.47 0.42% 1.05% 98.53%B Frontier Communications 999,547,000 4.65 4,647.89 7,887.30 0.00 4,647.89 12,535.19 62.92% 0.00% 37.08%B NTELOS Holdings 21,505,352 20.23 435.05 486.10 0.00 435.05 921.15 52.77% 0.00% 47.23%B Shenandoah Telecom 24,016,499 25.67 616.50 230.20 0.00 616.50 846.70 27.19% 0.00% 72.81%B T-Mobile US, Inc. 728,696,706 9.94 7,243.25 20,449.00 0.00 7,243.25 27,692.25 73.84% 0.00% 26.16%B Telephone & Data Systems 108,491,184 25.78 2,796.90 1,721.10 0.80 2,796.90 4,518.80 38.09% 0.02% 61.89%B tw telecom inc. 144,065,951 30.47 4,389.69 1,822.80 0.00 4,389.69 6,212.49 29.34% 0.00% 70.66%B Windstream Corp. 596,073,169 7.98 4,756.66 8,760.80 0.00 4,756.66 13,517.46 64.81% 0.00% 35.19%
Mean 38.31% 0.10% 61.60%Median 38.09% 0.00% 61.89%Weighted Average 56.53% 0.00% 43.47%
Sources: Columns a, c, f, and g were extracted from Value Line.Column d was extracted from Finance.Yahoo.com and represents December 31, 2013 closing stock prices.
2014 Capitalization Rate StudyTelecommunications Companies
Capital Structure

Page 70
a b c d e f g h i j k l
Common Common Market Value Long Term Preferred Common Total L.T. Preferred CommonValue Line Company Stock Stock Price Equity Debt Stock Stock Capital Debt Stock Stock
Rating Name Outstanding 12/31/13 ($million) ($million) ($million) ($million) ($million) % % %
C++ Consolidated Communications 40,111,518 19.63 787.39 1,202.20 0.00 787.39 1,989.59 60.42% 0.00% 39.58% C++ General Communication 40,461,000 11.15 451.14 1082.70 0.00 451.14 1,533.84 70.59% 0.00% 29.41% C++ Level 3 Communications 223,605,574 33.17 7,417.00 8,537.00 0.00 7,417.00 15,954.00 53.51% 0.00% 46.49% C++ Sprint Nextel 3,942,164,011 10.75 42,378.26 32,420.00 0.00 42,378.26 74,798.26 43.34% 0.00% 56.66% C+ Alaska Communications 48,577,654 2.12 102.98 444.80 0.00 102.98 547.78 81.20% 0.00% 18.80% C+ Cincinnati Bell 208,037,869 3.56 740.61 2,108.20 129.40 740.61 2,978.21 70.79% 4.34% 24.87% C Leap Wireless 79,371,522 17.40 1,381.06 3,368.20 0.00 1,381.06 4,749.26 70.92% 0.00% 29.08%
Mean 64.40% 0.62% 34.98%Median 70.59% 0.00% 29.41%Weighted Average 47.94% 0.13% 51.93%
Sources: Columns a, c, f, and g were extracted from Value Line.Column d was extracted from Finance.Yahoo.com and represents December 31, 2013 closing stock prices.
2014 Capitalization Rate StudyTelecommunications Companies
Capital Structure

Page 71
Component A++ B++, B+, B C++, C+, C
Expected Future Return, S&P 500 10.90% 10.90% 10.90%
Less: Risk Free Return - 30 Year Treasury Bonds1 3.97% 3.97% 3.97%
Risk Premium 6.93% 6.93% 6.93%
Beta 2 0.62 0.75 0.96
Adjusted Risk Premium 4.30% 5.20% 6.65%
Risk Free Return - 30 Year Treasury Bonds1 3.97% 3.97% 3.97%
Projected Equity Yield 8.27% 9.17% 10.62%
1 WSJ.com, December 31, 20132 The estimated betas were derived from a representative sample of telecommunications companies with similar ratings.
2014 Capitalization Rate StudyTelecommunications Companies
Value Line Rating
Capital Asset Pricing Model - Ex Ante
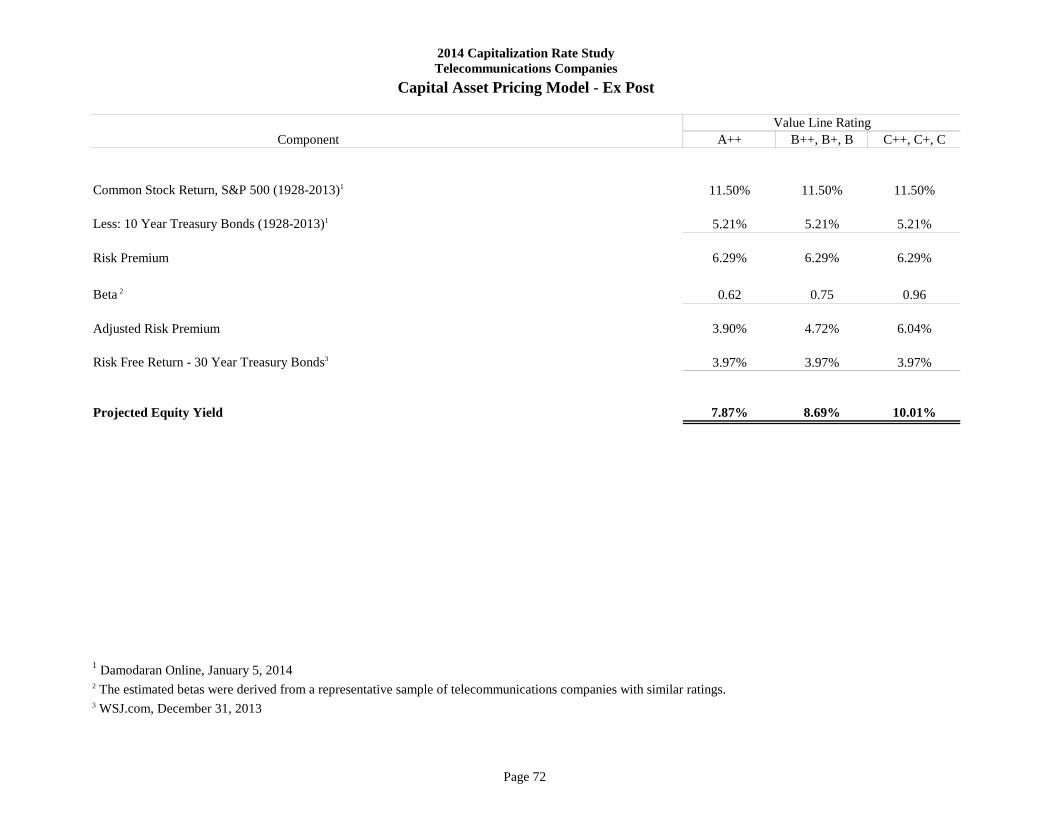
Page 72
Component A++ B++, B+, B C++, C+, C
Common Stock Return, S&P 500 (1928-2013)1 11.50% 11.50% 11.50%
Less: 10 Year Treasury Bonds (1928-2013)1 5.21% 5.21% 5.21%
Risk Premium 6.29% 6.29% 6.29%
Beta 2 0.62 0.75 0.96
Adjusted Risk Premium 3.90% 4.72% 6.04%
Risk Free Return - 30 Year Treasury Bonds3 3.97% 3.97% 3.97%
Projected Equity Yield 7.87% 8.69% 10.01%
1 Damodaran Online, January 5, 20142 The estimated betas were derived from a representative sample of telecommunications companies with similar ratings.3 WSJ.com, December 31, 2013
Value Line Rating
Capital Asset Pricing Model - Ex PostTelecommunications Companies2014 Capitalization Rate Study
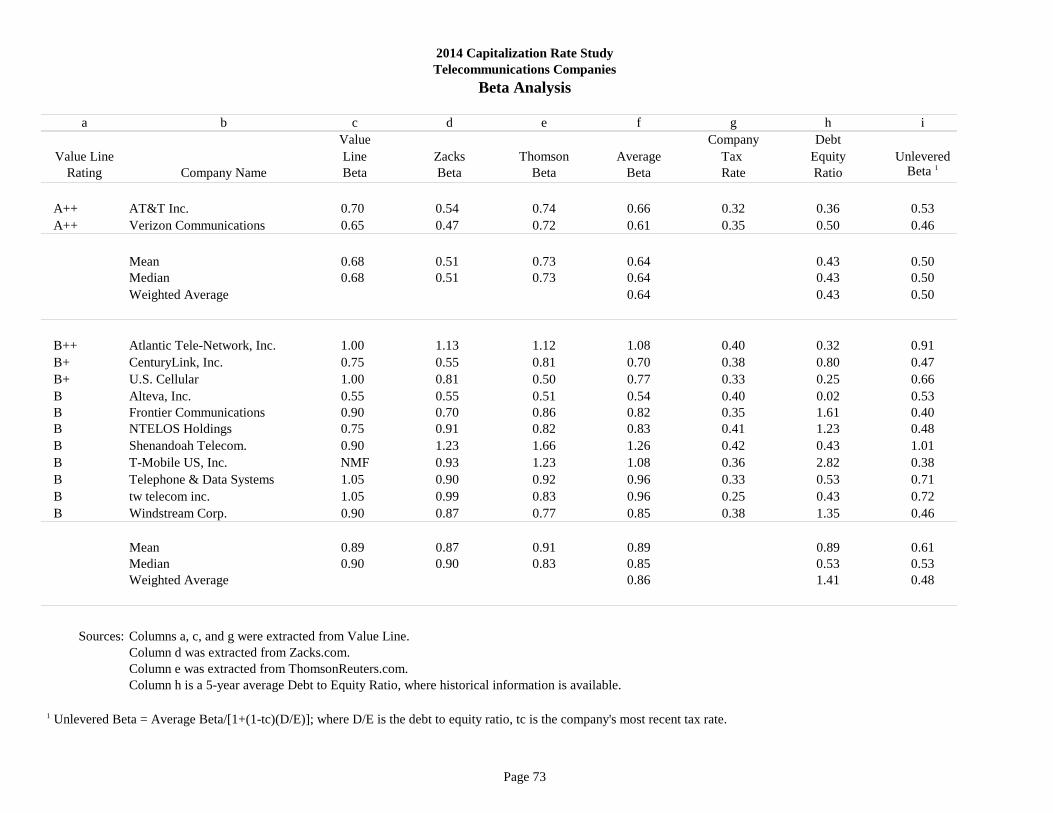
Page 73
a b c d e f g h iValue Company Debt
Value Line Line Zacks Thomson Average Tax Equity UnleveredRating Company Name Beta Beta Beta Beta Rate Ratio Beta 1
A++ AT&T Inc. 0.70 0.54 0.74 0.66 0.32 0.36 0.53 A++ Verizon Communications 0.65 0.47 0.72 0.61 0.35 0.50 0.46
Mean 0.68 0.51 0.73 0.64 0.43 0.50Median 0.68 0.51 0.73 0.64 0.43 0.50Weighted Average 0.64 0.43 0.50
B++ Atlantic Tele-Network, Inc. 1.00 1.13 1.12 1.08 0.40 0.32 0.91B+ CenturyLink, Inc. 0.75 0.55 0.81 0.70 0.38 0.80 0.47B+ U.S. Cellular 1.00 0.81 0.50 0.77 0.33 0.25 0.66B Alteva, Inc. 0.55 0.55 0.51 0.54 0.40 0.02 0.53B Frontier Communications 0.90 0.70 0.86 0.82 0.35 1.61 0.40B NTELOS Holdings 0.75 0.91 0.82 0.83 0.41 1.23 0.48B Shenandoah Telecom. 0.90 1.23 1.66 1.26 0.42 0.43 1.01B T-Mobile US, Inc. NMF 0.93 1.23 1.08 0.36 2.82 0.38B Telephone & Data Systems 1.05 0.90 0.92 0.96 0.33 0.53 0.71B tw telecom inc. 1.05 0.99 0.83 0.96 0.25 0.43 0.72B Windstream Corp. 0.90 0.87 0.77 0.85 0.38 1.35 0.46
Mean 0.89 0.87 0.91 0.89 0.89 0.61Median 0.90 0.90 0.83 0.85 0.53 0.53Weighted Average 0.86 1.41 0.48
Sources:
Column h is a 5-year average Debt to Equity Ratio, where historical information is available.
1 Unlevered Beta = Average Beta/[1+(1-tc)(D/E)]; where D/E is the debt to equity ratio, tc is the company's most recent tax rate.
2014 Capitalization Rate StudyTelecommunications Companies
Beta Analysis
Columns a, c, and g were extracted from Value Line. Column d was extracted from Zacks.com.Column e was extracted from ThomsonReuters.com.
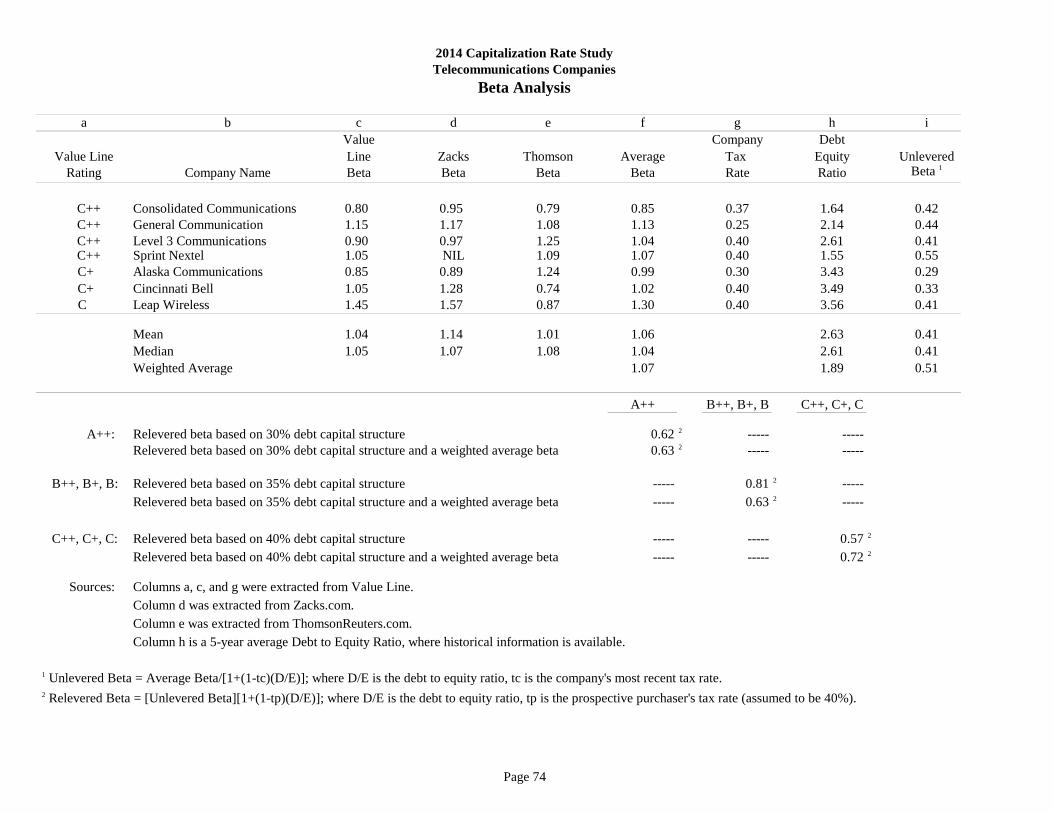
Page 74
a b c d e f g h iValue Company Debt
Value Line Line Zacks Thomson Average Tax Equity UnleveredRating Company Name Beta Beta Beta Beta Rate Ratio Beta 1
C++ Consolidated Communications 0.80 0.95 0.79 0.85 0.37 1.64 0.42 C++ General Communication 1.15 1.17 1.08 1.13 0.25 2.14 0.44 C++ Level 3 Communications 0.90 0.97 1.25 1.04 0.40 2.61 0.41 C++ Sprint Nextel 1.05 NIL 1.09 1.07 0.40 1.55 0.55
C+ Alaska Communications 0.85 0.89 1.24 0.99 0.30 3.43 0.29 C+ Cincinnati Bell 1.05 1.28 0.74 1.02 0.40 3.49 0.33C Leap Wireless 1.45 1.57 0.87 1.30 0.40 3.56 0.41
Mean 1.04 1.14 1.01 1.06 2.63 0.41Median 1.05 1.07 1.08 1.04 2.61 0.41Weighted Average 1.07 1.89 0.51
A++ B++, B+, B C++, C+, C
A++: Relevered beta based on 30% debt capital structure 0.62 2 ----- -----Relevered beta based on 30% debt capital structure and a weighted average beta 0.63 2 ----- -----
B++, B+, B: Relevered beta based on 35% debt capital structure ----- 0.81 2 -----Relevered beta based on 35% debt capital structure and a weighted average beta ----- 0.63 2 -----
C++, C+, C: Relevered beta based on 40% debt capital structure ----- ----- 0.57 2
Relevered beta based on 40% debt capital structure and a weighted average beta ----- ----- 0.72 2
Sources:
Column h is a 5-year average Debt to Equity Ratio, where historical information is available.
1 Unlevered Beta = Average Beta/[1+(1-tc)(D/E)]; where D/E is the debt to equity ratio, tc is the company's most recent tax rate. 2 Relevered Beta = [Unlevered Beta][1+(1-tp)(D/E)]; where D/E is the debt to equity ratio, tp is the prospective purchaser's tax rate (assumed to be 40%).
Column e was extracted from ThomsonReuters.com.
2014 Capitalization Rate StudyTelecommunications Companies
Beta Analysis
Columns a, c, and g were extracted from Value Line. Column d was extracted from Zacks.com.

Page 75
Basic Common Cap
SBE No. Company Name Financial Bond Equity Debt Equity Debt Rate
402 CALNEV Pipe Line, L.L.C. NR-1 NR-b 70% 30% 12.30% 5.46% 10.25%461 SFPP, L.P. NR-1 NR-b 70% 30% 12.30% 5.46% 10.25%
479 Chevron Pipe Line Company NR-2 NR-b 70% 30% 12.83% 5.46% 10.62%480 Phillips 66 Pipeline LLC NR-2 NR-b 70% 30% 12.83% 5.46% 10.62%486 Pacific Pipeline System LLC NR-2 NR-b 70% 30% 12.83% 5.46% 10.62%492 San Pablo Bay Pipeline Company LLC NR-2 NR-b 70% 30% 12.83% 5.46% 10.62%
Other Pipeline Companies NR-3 NR-c 70% 30% 13.87% 6.48% 11.66%
California State Board of Equalization State-Assessed Properties Division
Ratings Capital Structure Rates of Return
2014 Capitalization Rate StudyPipeline Companies

Page 76
2014 Capitalization Rate Study Pipeline Companies Industry Notes
• Staff relied primarily on the Discounted Cash Flow model in the development of equity rates.
• Magellan Midstream Partners, L. P. was removed from the Capitalization Rate Study as staff determined that its capital
structure was not representative a typical oil pipeline company.

Page 77
Value Line Recommended Moody's Recommended Flotation Cost Adjusted Rating Rate Rating Rate in % Rate
NR-1 11.75% 4.50% 12.30% NR-b 5.37% 1.70% 5.46%NR-2 12.25% 4.50% 12.83% NR-c 6.37% 1.70% 6.48%NR-3 13.25% 4.50% 13.87%
Cost of Capital Adjusted for Flotation Costs = ku
1 - fWhere: ku = The cost of capital unadjusted for flotation costs
f = Flotation cost as a percentage of the value of securities issued
NR-1: Not-Rated-1 pipelines are not directly traded because they are subsidiaries of larger companies. These are larger common carrierpipelines transmitting refined petroleum products.
NR-2: Not-Rated-2 pipelines are not directly traded because they are subsidiaries of larger companies. These are larger common carrierpipelines transmitting crude oil.
NR-3: Not-Rated-3 pipelines are smaller companies transporting petroleum products or crude oil.
NR-b: Although these companies do not have rated debt securities, the rating class "Baa" was chosen to represent these subsidiaries oflarger corporations.
NR-c: Issues of this size are not normally rated. An additional increment of 100 basis points (before flotation costs) has been added tothe "Baa" rate.
2014 Capitalization Rate StudyPipeline Companies
Flotation Cost Adjustment
Adjusted Rate
Equity DebtFlotation Cost
in %
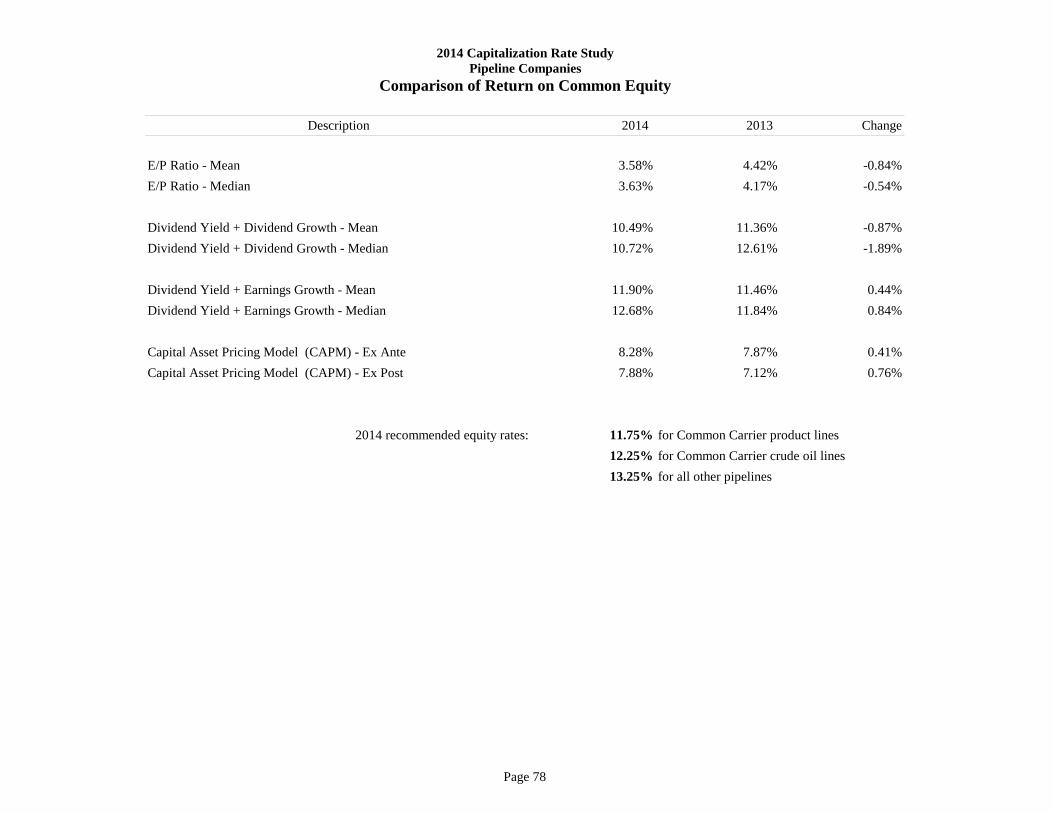
Page 78
2014 2013 Change
E/P Ratio - Mean 3.58% 4.42% -0.84%E/P Ratio - Median 3.63% 4.17% -0.54%
Dividend Yield + Dividend Growth - Mean 10.49% 11.36% -0.87%Dividend Yield + Dividend Growth - Median 10.72% 12.61% -1.89%
Dividend Yield + Earnings Growth - Mean 11.90% 11.46% 0.44%Dividend Yield + Earnings Growth - Median 12.68% 11.84% 0.84%
Capital Asset Pricing Model (CAPM) - Ex Ante 8.28% 7.87% 0.41%Capital Asset Pricing Model (CAPM) - Ex Post 7.88% 7.12% 0.76%
2014 recommended equity rates: 11.75% for Common Carrier product lines12.25% for Common Carrier crude oil lines13.25% for all other pipelines
Description
2014 Capitalization Rate StudyPipeline Companies
Comparison of Return on Common Equity
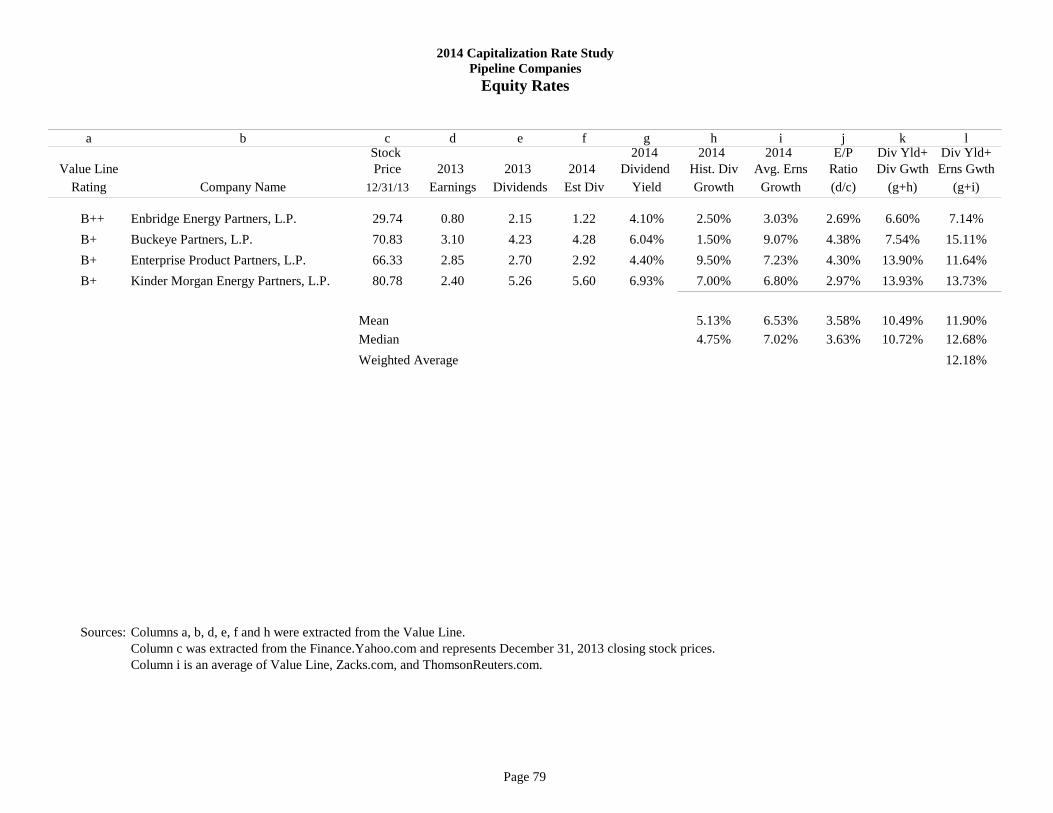
Page 79
a b c d e f g h i j k lStock 2014 2014 2014 E/P Div Yld+ Div Yld+
Value Line Price 2013 2013 2014 Dividend Hist. Div Avg. Erns Ratio Div Gwth Erns GwthRating Company Name 12/31/13 Earnings Dividends Est Div Yield Growth Growth (d/c) (g+h) (g+i)
B++ Enbridge Energy Partners, L.P. 29.74 0.80 2.15 1.22 4.10% 2.50% 3.03% 2.69% 6.60% 7.14%B+ Buckeye Partners, L.P. 70.83 3.10 4.23 4.28 6.04% 1.50% 9.07% 4.38% 7.54% 15.11%B+ Enterprise Product Partners, L.P. 66.33 2.85 2.70 2.92 4.40% 9.50% 7.23% 4.30% 13.90% 11.64%B+ Kinder Morgan Energy Partners, L.P. 80.78 2.40 5.26 5.60 6.93% 7.00% 6.80% 2.97% 13.93% 13.73%
Mean 5.13% 6.53% 3.58% 10.49% 11.90%Median 4.75% 7.02% 3.63% 10.72% 12.68%Weighted Average 12.18%
Sources: Columns a, b, d, e, f and h were extracted from the Value Line.Column c was extracted from the Finance.Yahoo.com and represents December 31, 2013 closing stock prices.Column i is an average of Value Line, Zacks.com, and ThomsonReuters.com.
2014 Capitalization Rate StudyPipeline Companies
Equity Rates

Page 80
2014 Capitalization Rate StudyPipeline Companies
Long Term Earnings Growth
a b c e fValue Line
Rating Company Name Value Line Thomson Average
B++ Enbridge Energy Partners, L.P. -7.50% 4.00% 12.60% 3.03%B+ Buckeye Partners, L.P. 7.50% 8.00% 11.70% 9.07%B+ Enterprise Product Partners, L.P. 10.00% 5.20% 6.50% 7.23%B+ Kinder Morgan Energy Partners, L.P. 11.00% 4.50% 4.90% 6.80%
Mean 5.25% 5.43% 8.93% 6.53%Median 8.75% 4.85% 9.10% 7.02%Weighted Average 6.82%
Sources: Columns a, b, and c were extracted from Value Line.Column d was extracted from Zacks.com.Column e was extracted from ThomsonReuters.com.
d
Zacks

Page 81
Component Industry Computation
Expected Future Return, S&P 500 10.90%Less: Risk Free Return 30 Year Treasury Bonds1 3.97% Risk Premium 6.93%Relevered Beta2 0.62Adjusted Risk Premium 4.31%Risk Free Return 30 Year Treasury Bonds1 3.97%
Projected Return on Common Equity 8.28%
1 WSJ.com on December 31, 20132 Weighted average using betas from Value Line, Zacks.com, and Standard & Poor's for a representative sample of pipeline companies.
2014 Capitalization Rate StudyPipeline Companies
Capital Asset Pricing Model - Ex Ante
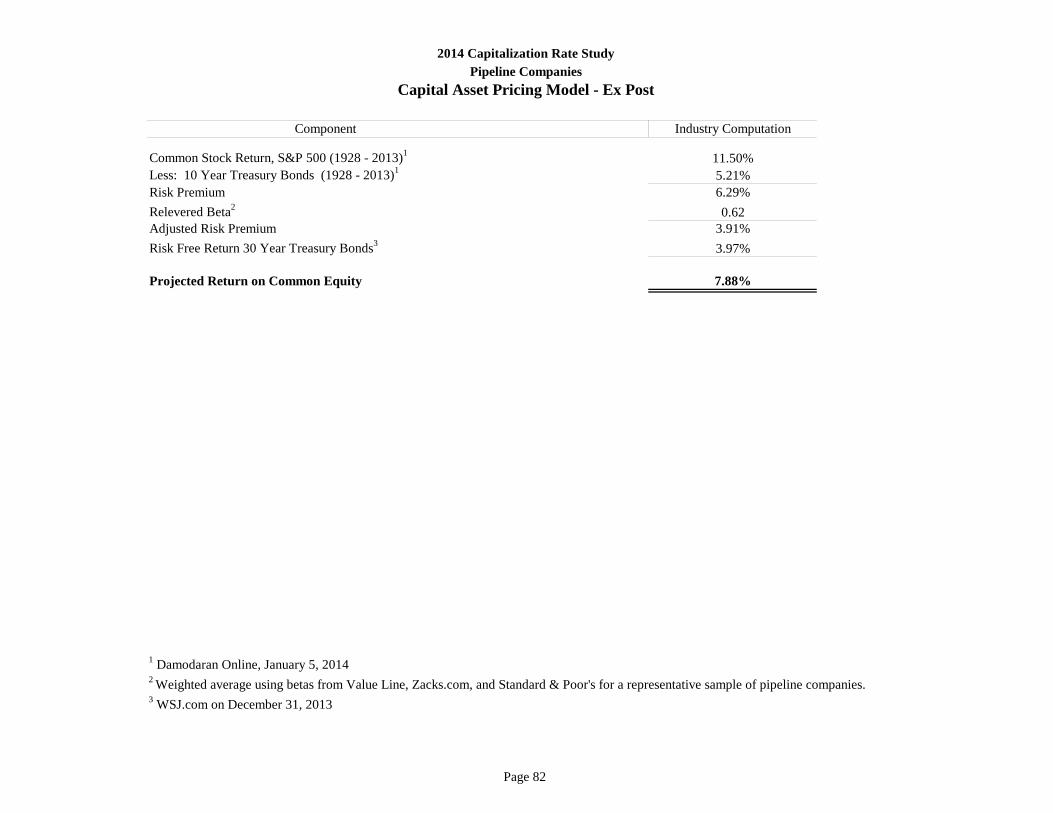
Page 82
Component Industry Computation
Common Stock Return, S&P 500 (1928 - 2013)1 11.50%Less: 10 Year Treasury Bonds (1928 - 2013)1 5.21%Risk Premium 6.29%Relevered Beta2 0.62Adjusted Risk Premium 3.91%Risk Free Return 30 Year Treasury Bonds3 3.97%
Projected Return on Common Equity 7.88%
1 Damodaran Online, January 5, 2014 2 Weighted average using betas from Value Line, Zacks.com, and Standard & Poor's for a representative sample of pipeline companies.3 WSJ.com on December 31, 2013
2014 Capitalization Rate StudyPipeline Companies
Capital Asset Pricing Model - Ex Post

Page 83
a b c e f g h iValue Standard Debt
Value Line Line & Poor's Average Tax Equity UnleveredRating Company Name Beta Beta Beta Rate Ratio Beta 1
B++ Enbridge Energy Partners, L.P. 0.90 0.52 0.74 0.72 0.40 0.53 0.55B+ Buckeye Partners, L.P. 0.75 0.23 0.33 0.44 0.40 0.33 0.36B+ Enterprise Product Partners, L.P. 0.80 0.60 0.64 0.68 0.40 0.27 0.59B+ Kinder Morgan Energy Partners, L.P. 0.75 0.42 0.32 0.50 0.40 0.53 0.38
Mean 0.80 0.44 0.51 0.58 0.40 0.41 0.47Median 0.78 0.47 0.49 0.59 0.40 0.43 0.46Weighted Average 0.60 0.39 0.49
Relevered beta based on 30% Debt Capital Structure 0.59 2
Relevered beta based on 30% Debt Capital Structure and a weighted average beta 0.62 2
Sources: Columns a, b, and c were extracted from Value Line.Column d was extracted from Zacks.com.Column e was extracted from ThomsonReuters.com.
Beta
2014 Capitalization Rate StudyPipeline Companies
Beta Analysis
d
Zacks
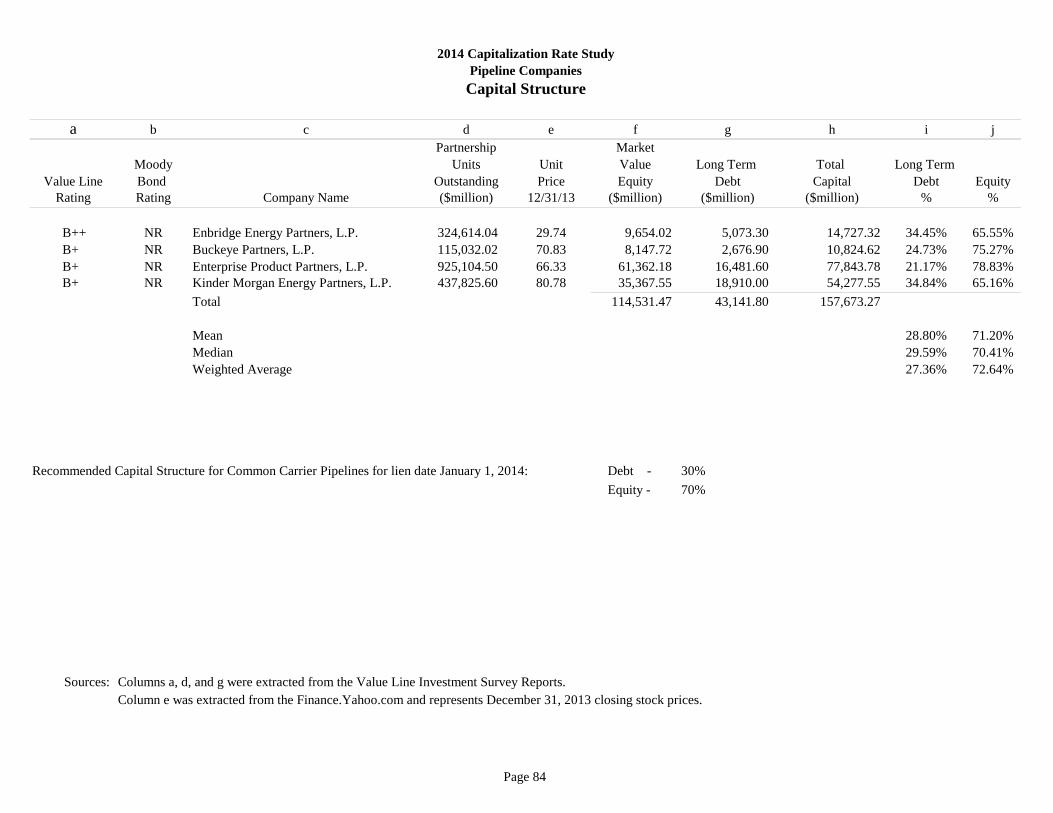
Page 84
a b c d e f g h i jPartnership Market
Moody Units Unit Value Long Term Total Long Term Value Line Bond Outstanding Price Equity Debt Capital Debt Equity
Rating Rating Company Name ($million) 12/31/13 ($million) ($million) ($million) % %
B++ NR Enbridge Energy Partners, L.P. 324,614.04 29.74 9,654.02 5,073.30 14,727.32 34.45% 65.55%B+ NR Buckeye Partners, L.P. 115,032.02 70.83 8,147.72 2,676.90 10,824.62 24.73% 75.27%B+ NR Enterprise Product Partners, L.P. 925,104.50 66.33 61,362.18 16,481.60 77,843.78 21.17% 78.83%B+ NR Kinder Morgan Energy Partners, L.P. 437,825.60 80.78 35,367.55 18,910.00 54,277.55 34.84% 65.16%
Total 114,531.47 43,141.80 157,673.27
Mean 28.80% 71.20%Median 29.59% 70.41%Weighted Average 27.36% 72.64%
Recommended Capital Structure for Common Carrier Pipelines for lien date January 1, 2014: Debt - 30%Equity - 70%
Sources: Columns a, d, and g were extracted from the Value Line Investment Survey Reports.Column e was extracted from the Finance.Yahoo.com and represents December 31, 2013 closing stock prices.
2014 Capitalization Rate StudyPipeline CompaniesCapital Structure
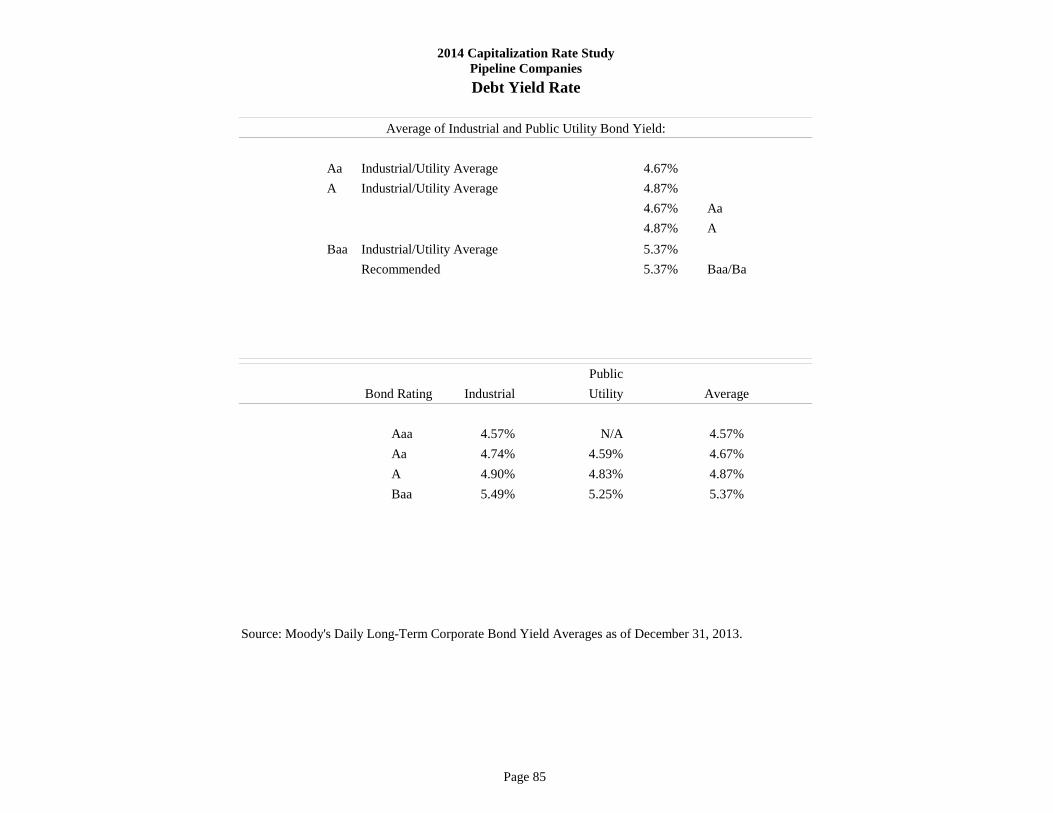
Page 85
Aa Industrial/Utility Average 4.67%A Industrial/Utility Average 4.87%
4.67% Aa4.87% A
Baa Industrial/Utility Average 5.37%Recommended 5.37% Baa/Ba
PublicBond Rating Industrial Utility Average
Aaa 4.57% N/A 4.57%Aa 4.74% 4.59% 4.67%A 4.90% 4.83% 4.87%Baa 5.49% 5.25% 5.37%
Source: Moody's Daily Long-Term Corporate Bond Yield Averages as of December 31, 2013.
2014 Capitalization Rate StudyPipeline CompaniesDebt Yield Rate
Average of Industrial and Public Utility Bond Yield:

Page 86
SBENo.
CompanyName Financial Bond
CommonEquity Debt
CommonEquity Debt
804 BNSF Railway Company A+ Baa2 80% 20% 13.61% 5.46% 11.98%843 Union Pacific Railroad Company A+ Baa2 80% 20% 13.61% 5.46% 11.98%
802 Central Oregon & Pacific Railroad NR-1 NR-1 60% 40% 15.71% 6.99% 12.22%810 California Northern Railroad NR-1 NR-1 60% 40% 15.71% 6.99% 12.22%813 Pacific Harbor Lines NR-1 NR-1 60% 40% 15.71% 6.99% 12.22%822 Pacific Sun Railroad, LLC NR-1 NR-1 60% 40% 15.71% 6.99% 12.22%826 Sacramento Valley Railroad, LLC NR-1 NR-1 60% 40% 15.71% 6.99% 12.22%850 Modesto & Empire Traction Company NR-1 NR-1 60% 40% 15.71% 6.99% 12.22%865 San Diego & Imperial Valley Railroad Co. Inc. NR-1 NR-1 60% 40% 15.71% 6.99% 12.22%878 Stockton Terminal and Eastern Railroad NR-1 NR-1 60% 40% 15.71% 6.99% 12.22%882 Trona Railway Co. NR-1 NR-1 60% 40% 15.71% 6.99% 12.22%897 San Joaquin Valley Railroad Company NR-1 NR-1 60% 40% 15.71% 6.99% 12.22%899 Arizona & California Railroad NR-1 NR-1 60% 40% 15.71% 6.99% 12.22%
Other Railroad Companies NR-2 NR-2 60% 40% 15.97% 8.01% 12.78%
Capital Structure Rates of Return
California State Board of Equalization State-Assessed Properties Division
2014 Capitalization Rate StudyRailroad Companies
BasicCapRate
Page 87
2014 Capitalization Rate Study Railroad Companies Industry Notes
• Staff relied upon the results of the following models in the development of equity rates:
1. Discounted Cash Flow Model 2. Capital Asset Pricing Model – ex post and ex ante

Page 88
ValueLine
RatingRecommended
Rate
FlotationCostin %
AdjustedRate
Moody'sRating
RecommendedRate
FlotationCostin %
AdjustedRate
B++, B+ 13.00% 4.50% 13.61% Baa2 5.37% 1.70% 5.46%
NR-1 15.00% 4.50% 15.71% NR-11 6.87% 1.70% 6.99%
NR-2 15.25% 4.50% 15.97% NR-22 7.87% 1.70% 8.01%
Cost of Capital Adjusted for Flotation Costs = ku
1 - fWhere: ku = The cost of capital unadjusted for flotation costs
f = Flotation cost as a percentage of the value of securities issued
1 NR-1: Represents short line railroad companies with stable historical income. An additional 150 basis points were added to the Baa2 bond rate to represent the additional risk premium. 2 NR-2: Represents short line railroad companies without stable historical income patterns. An additional 250 basis points were added to the Baa2 bond rate to represent the additional risk premium.
Equity
2014 Capitalization Rate StudyRailroad Companies
Flotation Cost Adjustment
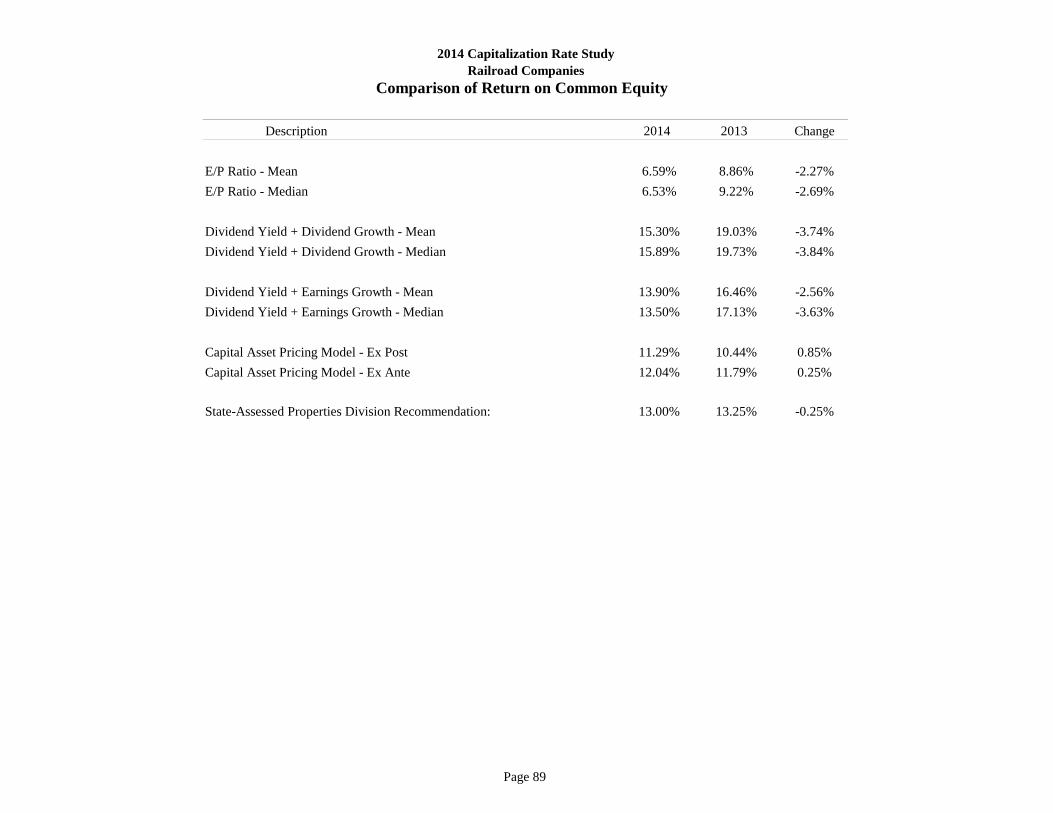
Page 89
Description 2014 2013 Change
E/P Ratio - Mean 6.59% 8.86% -2.27%E/P Ratio - Median 6.53% 9.22% -2.69%
Dividend Yield + Dividend Growth - Mean 15.30% 19.03% -3.74%Dividend Yield + Dividend Growth - Median 15.89% 19.73% -3.84%
Dividend Yield + Earnings Growth - Mean 13.90% 16.46% -2.56%Dividend Yield + Earnings Growth - Median 13.50% 17.13% -3.63%
Capital Asset Pricing Model - Ex Post 11.29% 10.44% 0.85%Capital Asset Pricing Model - Ex Ante 12.04% 11.79% 0.25%
State-Assessed Properties Division Recommendation: 13.00% 13.25% -0.25%
2014 Capitalization Rate StudyRailroad Companies
Comparison of Return on Common Equity

Page 90
a b c d e f g h i j k l mValue Line
RatingCompany
Name
StockPrice
12/31/13
Est. Earnings
2014Earnings
2013Dividends
2013
Est. Dividends
2014
Div Yield2014(g/c)
Value LineDividendEst Gwth
AverageEst Erns
Gwth
E/PRatio(d/c)
Div Yld +Dv Gwth
(h+i)
Div Yld +Erns Gwth
(h+j)
Class 1 Railroads:
A+ Union Pacific Corp. 167.31 10.80 9.50 2.96 3.16 1.89% 14.00% 12.87% 6.46% 15.89% 14.76%A Norfolk Southern Corp. 92.69 6.05 5.60 2.04 2.10 2.27% 9.00% 11.17% 6.53% 11.27% 13.43%B++ CSX Corp. 28.68 1.95 1.85 0.59 0.64 2.23% 16.50% 11.27% 6.80% 18.73% 13.50%
Mean 2.13% 13.17% 11.77% 6.59% 15.30% 13.90%Median 2.23% 14.00% 11.27% 6.53% 15.89% 13.50%Weighted Average 15.49% 14.15%
Sources: Columns a, d, e, f, g and i were extracted from Value Line.Column c was extracted from Finance.Yahoo.com and represents December 31, 2013 closing stock prices.Column j is an average of Value Line, Zacks.com and ThomsonReuters.com.
2014 Capitalization Rate StudyRailroad Companies
Equity Rates

Page 91
a b c d e fValue Line Value
Rating Company Name Line Zacks Thomson Average
Class 1 Railroads:
A+ Union Pacific Corp. 12.00% 12.50% 14.10% 12.87% A Norfolk Southern Corp. 9.50% 12.50% 11.50% 11.17% B++ CSX Corp. 12.00% 11.30% 10.50% 11.27%
Mean 11.17% 12.10% 12.03% 11.77%Median 12.00% 12.50% 11.50% 11.27%Weighted Average 12.10%
Sources: Columns a and c were extracted from Value Line.Column d was extracted from Zacks.com.Column e was extracted from ThomsonReuters.com.
2014 Capitalization Rate StudyRailroad Companies
Long Term Earnings Growth
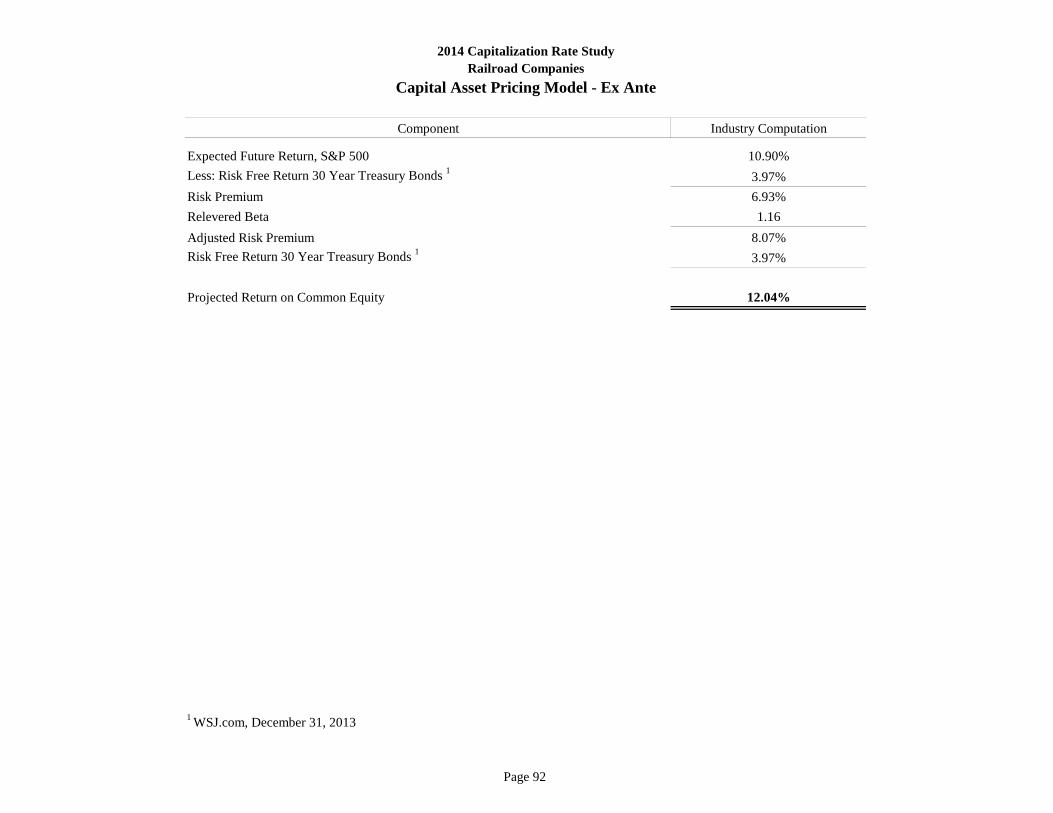
Page 92
Industry Computation
Expected Future Return, S&P 500 10.90%Less: Risk Free Return 30 Year Treasury Bonds 1 3.97%Risk Premium 6.93%Relevered Beta 1.16Adjusted Risk Premium 8.07%Risk Free Return 30 Year Treasury Bonds 1 3.97%
Projected Return on Common Equity 12.04%
1 WSJ.com, December 31, 2013
2014 Capitalization Rate StudyRailroad Companies
Capital Asset Pricing Model - Ex Ante
Component

Page 93
Industry Computation
Common Stock Returns, S&P 500 (1928 - 2013) 1 11.50%Less: 10 Year Treasury Bonds (1928 - 2013) 1 5.21%Risk Premium 6.29%Relevered Beta 1.16Adjusted Risk Premium 7.32%Risk Free Return 30 Year Treasury Bonds 2 3.97%
Projected Return on Common Equity 11.29%
1 Damodaran Online, January 5, 20142 WSJ.com, December 31, 2013
2014 Capitalization Rate StudyRailroad Companies
Capital Asset Pricing Model - Ex Post
Component

Page 94
a b c d e f g h iValueLine
Rating Company Name
ValueLineBeta
ZacksBeta
Thomson Beta
AverageBeta
Company's Tax Rate
DebtEquity
Ratio 1Unlevered
Beta 2
Class 1 Railroads:A+ Union Pacific Corp. 1.15 1.13 1.11 1.13 0.38 0.19 1.01A Norfolk Southern Corp. 1.15 1.24 1.26 1.22 0.38 0.33 1.01B++ CSX Corp. 1.25 1.33 1.15 1.24 0.37 0.36 1.01
Mean 1.18 1.23 1.17 1.20 0.29 1.01Median 1.15 1.24 1.15 1.22 0.33 1.01Weighted Average 1.18 0.26 1.01
Relevered Beta based on 20% Debt Capital Structure 1.16 3
Relevered Beta based on 20% Debt Capital Structure and a weighted average Beta 1.16 3
Non-Class 1 Railroads:B+ Genesee & Wyoming 1.30 1.44 1.45 1.40 0.27 0.24 1.19
Mean 1.30 1.44 1.45 1.40 0.24 1.19Median 1.30 1.44 1.45 1.40 0.24 1.19Weighted Average 1.40 0.24 1.19
Relevered Beta based on 40% Debt Capital Structure 1.67 3
Relevered Beta based on 40% Debt Capital Structure and a weighted average Beta 1.67 3
Sources: Columns a, c, and g were extracted from Value Line.Column d was extracted from Zacks.com.Column e was extracted from ThomsonReuters.com.
1 Average debt-to-equity ratio over the last five years.2 Unlevered Beta = Corrected Beta/[1+(1-tc)(D/E)]; where D/E is the debt-to-equity ratio, tc is the company's 2013 tax rate.3 Relevered Beta = [Unlevered Beta][1+(1-tp)(D/E)]; where D/E is the debt-to-equity ratio, tp is a prospective purchaser's tax rate (assumed to be 40%).
2014 Capitalization Rate StudyRailroad Companies
Beta Analysis
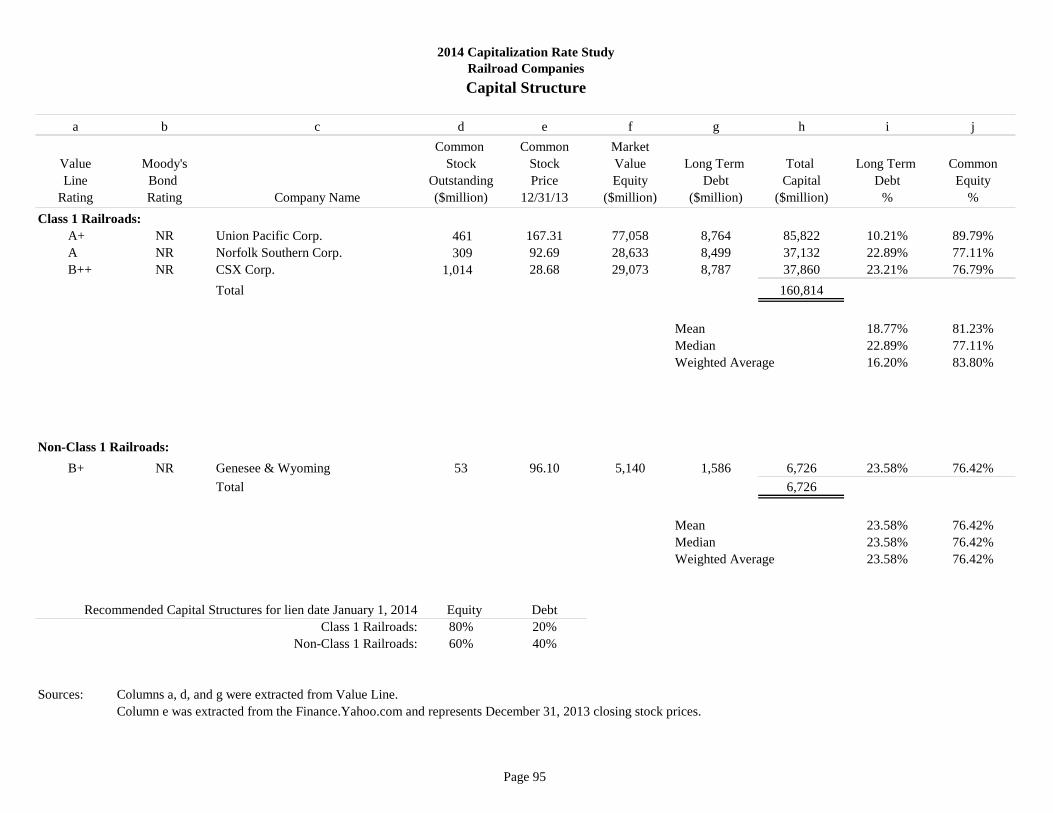
Page 95
a b c d e f g h i jCommon Common Market
Value Moody's Stock Stock Value Long Term Total Long Term CommonLine Bond Outstanding Price Equity Debt Capital Debt Equity
Rating Rating Company Name ($million) 12/31/13 ($million) ($million) ($million) % %Class 1 Railroads:
A+ NR Union Pacific Corp. 461 167.31 77,058 8,764 85,822 10.21% 89.79%A NR Norfolk Southern Corp. 309 92.69 28,633 8,499 37,132 22.89% 77.11%B++ NR CSX Corp. 1,014 28.68 29,073 8,787 37,860 23.21% 76.79%
Total 160,814
Mean 18.77% 81.23% Median 22.89% 77.11%
Weighted Average 16.20% 83.80%
Non-Class 1 Railroads:B+ NR Genesee & Wyoming 53 96.10 5,140 1,586 6,726 23.58% 76.42%
Total 6,726
Mean 23.58% 76.42% Median 23.58% 76.42%
Weighted Average 23.58% 76.42%
Recommended Capital Structures for lien date January 1, 2014 Equity DebtClass 1 Railroads: 80% 20%
Non-Class 1 Railroads: 60% 40%
Sources: Columns a, d, and g were extracted from Value Line.Column e was extracted from the Finance.Yahoo.com and represents December 31, 2013 closing stock prices.
2014 Capitalization Rate StudyRailroad CompaniesCapital Structure
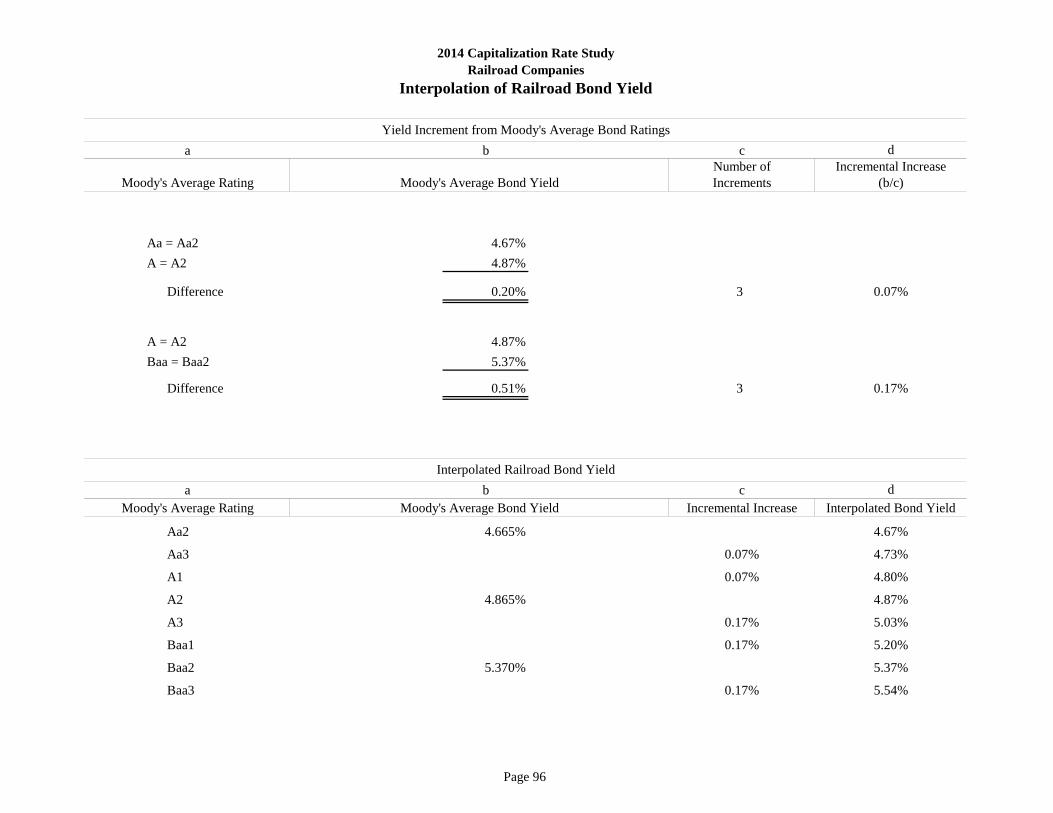
Page 96
a b cNumber of
Moody's Average Rating Increments
Aa = Aa2 4.67%A = A2 4.87%
Difference 0.20% 3
A = A2 4.87%Baa = Baa2 5.37%
Difference 0.51% 3
a b cMoody's Average Rating Incremental Increase
Aa2 4.665%
Aa3 0.07%
A1 0.07%
A2 4.865%
A3 0.17%
Baa1 0.17%
Baa2 5.370%
Baa3 0.17%
5.37%
5.54%
d
4.73%
4.80%
4.87%
5.20%
2014 Capitalization Rate StudyRailroad Companies
Interpolation of Railroad Bond Yield
Moody's Average Bond Yield (b/c)Incremental Increase
dYield Increment from Moody's Average Bond Ratings
Interpolated Railroad Bond Yield
0.07%
0.17%
Moody's Average Bond Yield
5.03%
4.67%
Interpolated Bond Yield

Page 97
Bond Rating Industrial Average
Aaa 4.57% 4.57%Aa 4.74% 4.67%A 4.90% 4.87%Baa 5.49% 5.37%
Source: Moody's Daily Long-Term Corporate Bond Yield Averages as of December 31, 2013.
4.83%5.25%
PublicUtility
2014 Capitalization Rate StudyRailroad CompaniesDebt Yield Rates
N/A4.59%