2014 Barclays Americas Select Franchise Conference · 2014 Barclays Americas Select Franchise...
25
Mark Graf EVP & Chief Financial Officer May 14, 2014 2014 Barclays Americas Select Franchise Conference ©2014 DISCOVER FINANCIAL SERVICES
Transcript of 2014 Barclays Americas Select Franchise Conference · 2014 Barclays Americas Select Franchise...
Mark GrafEVP & Chief Financial Officer
May 14, 2014
2014 Barclays Americas Select Franchise Conference
©2014 DISCOVER FINANCIAL SERVICES
2
Notice
The following slides are part of a presentation by Discover Financial Services (the "Company") and are intended to be viewed as part of that presentation. No representation is made that the information in these slides is complete.
The information provided herein includes certain non-GAAP financial measures. The reconciliations of such measures to the comparable GAAP figures are included at the end of this presentation, which is available on the Company's website at www.discoverfinancial.com.
The presentation contains forward-looking statements. You are cautioned not to place undue reliance on forward-looking statements, which speak only as of the date on which they are made, which reflect management’s estimates, projections, expectations or beliefs at that time, and which are subject to risks and uncertainties that may cause actual results to differ materially. For a discussion of certain risks and uncertainties that may affect the future results of the Company, please see "Special Note Regarding Forward-Looking Statements," "Risk Factors," "Business – Competition," "Business – Supervision and Regulation" and "Management’s Discussion and Analysis of Financial Condition and Results of Operations" in the Company’s Annual Report onForm 10-K for the year ended December 31, 2013 which is available on the Company’s website and the SEC’s website. The Company does not undertake to update or revise forward-looking statements as more information becomes available.
We own or have rights to use the trademarks, trade names and service marks that we use in conjunction with the operation of our business, including, but not limited to: Discover®, PULSE®, Cashback Bonus®, Discover Cashback CheckingSM, Discover it®, Discover® Network and Diners Club International®. All other trademarks, trade names and service marks included in this presentation are the property of their respective owners.
3
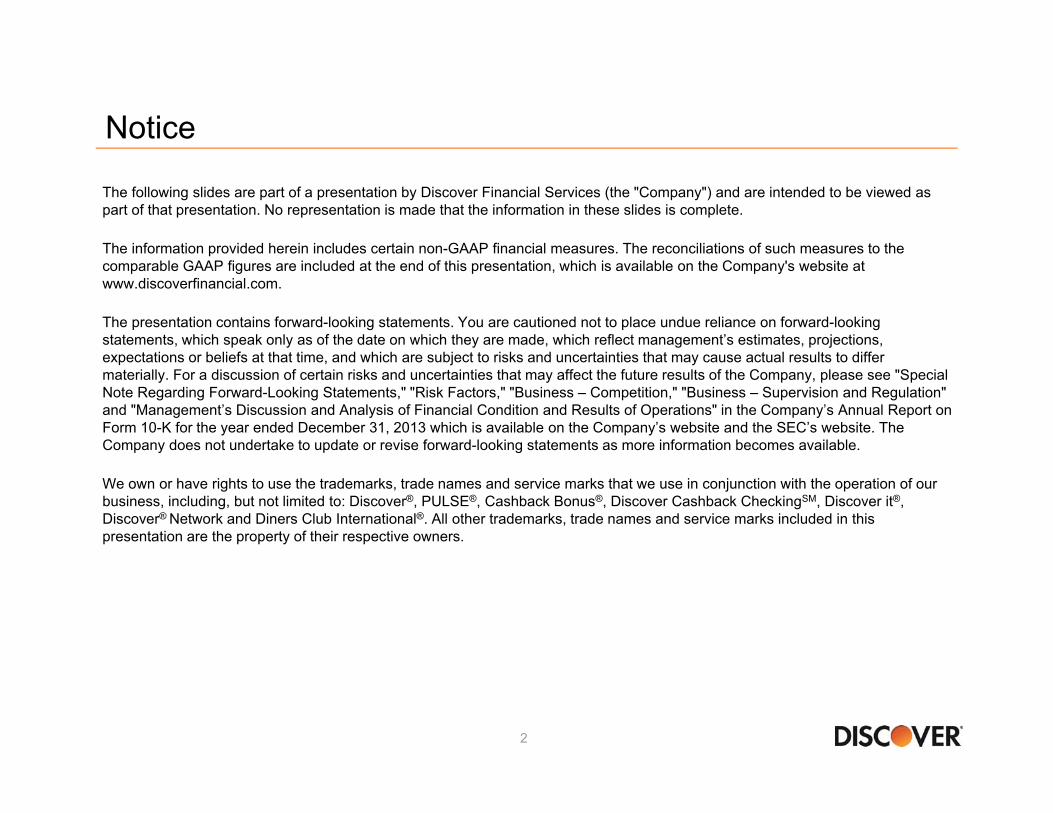
Positioned as the leading direct bank and payments partner
Note(s)– Balances as of December 31, 2013; payments volume based on the trailing four quarters ending 4Q13
Direct Banking(98% of 2013 Pre-Tax Profit)
Payment Services(2% of 2013 Pre-Tax Profit)
U.S. Card Issuing
• $53Bn in card receivables
• $110Bn card sales volume
• Leading cash rewards program
• 1 in 4 U.S. households
Deposits and Lending
• $28Bn direct-to-consumer deposits
• Cashback checking
• $12Bn personal loans and private student loans
• Home loan originations
• Home equity installment loans• $10Bn volume
• 30+ issuers
• $160Bn volume
• 4,000 issuers
• $27Bn volume
• 80 licensees
• 185+ countries / territories
Network Partners

4
Executive summary
• Driving superior returns
• Gaining card market share through loyal customer base, a new flagship product, cash rewards and customer experience
• Utilizing risk management capabilities to grow non-card assets
• Leveraging the network to benefit Discover card while pursuing payments partnerships
• Creating shareholder value through effective capital management

5
2014 Priorities and initiatives
• Grow Discover card loan share while maintaining leading credit performance– Discover it enhancements– Mobile / e-commerce / rewards / service innovation
• Expand direct consumer banking products– Grow student, personal and home equity businesses– Broad market direct checking (leverage new core banking platform)
• Grow global network volume and acceptance– Continue implementing existing partnerships (Ariba, PayPal, etc.)– Expand other non-traditional partners
• Optimize funding, cost structure and capital position
• Enhance operating model, including risk management and leadership development– Continue to enhance compliance, CCAR and other processes

6
19%
5%
Discover Large Banks
37%
66%
Discover Large Banks
6%
3%
Discover Large Banks
Direct Banking –Faster loan growth, better efficiencies and higher returns
2009-2013 AverageEfficiency Ratio(1)
(2)
Note(s)1. Non-interest expense divided by total revenue (net interest income and noninterest income)2. Bank holding companies participating in the 2014 Comprehensive Capital Analysis and Review (CCAR); excludes Ally Financial and Santander Holdings USA due to limited
information; excludes Discover3. 2009 adjusted to exclude $1.4 billion ($0.9 billion after taxes) Visa and MasterCard settlement
2009-2013 AverageReturn on Equity
(3) (2)
Source SNL, regulatory reports; Discover
2009-2013 CAGRTotal Loan Growth (%)
(2)

7
0%
2%
4%
6%
8%
10%
12%
1Q08 1Q10 1Q12 1Q14Discover Peer Group
-15%
-10%
-5%
0%
5%
10%
1Q08 1Q10 1Q12 1Q14
Discover Peer Group
U.S. Card -Outperforming peers in loan growth and credit performance
Card Loan Growth (%YOY)
Note(s)1. Includes weighted average card loan growth for American Express (U.S. Card), Bank of America (U.S. Card), Capital One (U.S. Card excl. installment loans and HSBC for
2Q12-1Q13; 2Q13 includes held for sale Best Buy portfolio; 3Q13-4Q13 based on management commentary), Citi (Citi-branded Cards N.A.), JPMorgan Chase (Card Services) and Wells Fargo (Consumer Credit Card 1Q12-4Q13); periods prior to 3Q08 adjusted to include estimated Washington Mutual receivables
2. Weighted average rate; includes U.S. card net charge-off rates for American Express (U.S. Card), Bank of America (U.S. Card), Capital One (U.S. Card), Citi (Citi-branded Cards N.A.), JPMorgan Chase (Card Services) and Wells Fargo (1Q11-3Q13)
(1)
Card Net Charge-Off Rate (%)
(2)
Source Public company data
83bps

8
Strong brand and service result in loyal customer baseTenure of ActiveAccounts (Yrs)
2013 Average UnaidedCard Brand Awareness
61 60
27 25
1712
DFS AXP JPM COF C BAC
11 12
7 8
3Q09 3Q13
Discover IndustrySource Argus Information and Advisory Services, LLC; Discover internal analysis
Note(s)1. Includes general purpose consumer credit cards only; excludes charge, corporate, private label, small business and debit; excludes Discover
Source Millward Brown Brand Tracking Study; 1Q13-4Q13
(1)
9
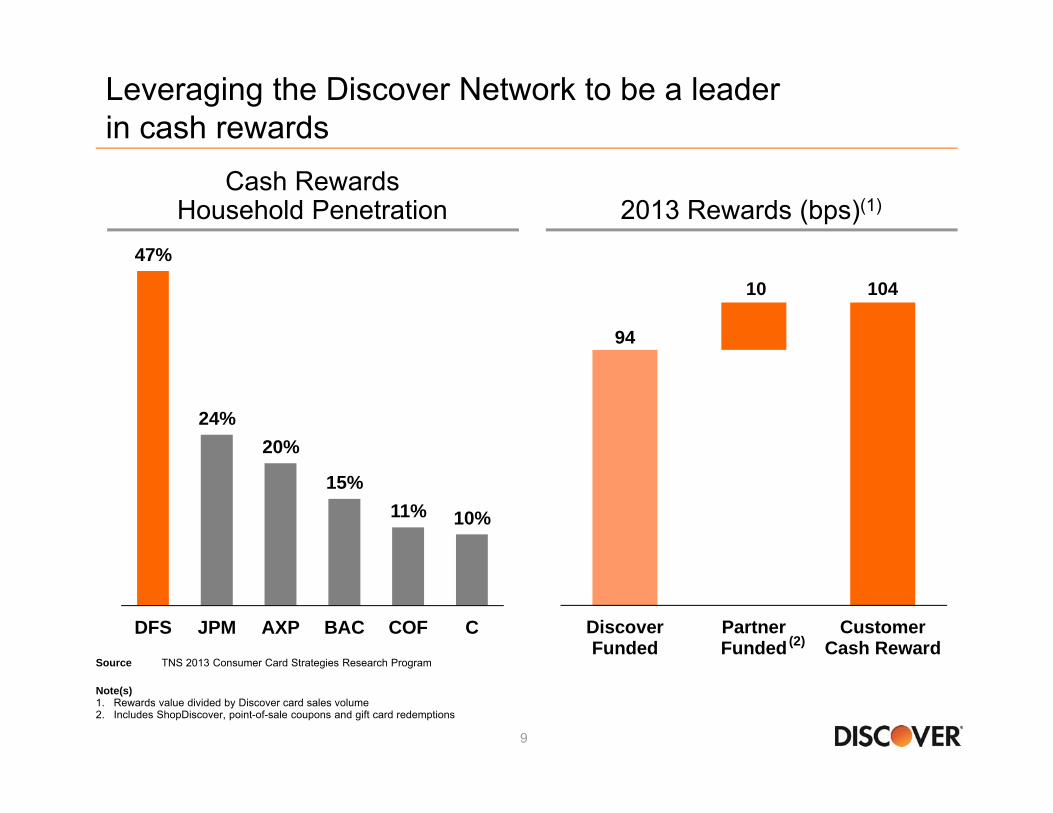
Leveraging the Discover Network to be a leader in cash rewards
2013 Rewards (bps)(1)Cash Rewards
Household Penetration
94
10 104
DiscoverFunded
PartnerFunded
CustomerCash Reward
Note(s)1. Rewards value divided by Discover card sales volume 2. Includes ShopDiscover, point-of-sale coupons and gift card redemptions
(2)
47%
24%20%
15%11% 10%
DFS JPM AXP BAC COF C
Source TNS 2013 Consumer Card Strategies Research Program
10
Revolving balances driving receivables growth
Card Loan Mix (%)(1)Card Receivable Growth ($Bn)
23% 18% 18%
52% 67% 68%
25%15% 14%
Pre-CARD Act 2012 2013
Promo/BT Standard Cash Advance & Other
Note(s)1. Credit card ending loans mix by component of balance; pre-CARD Act is average of 2006-2008 inclusive
$51.1
($0.4)
$0.3
$2.1 $53.1
2012 CashAdvance& Other
Promo/BT
Standard 2013

11
Achieving industry leading returns2013 U.S. Card Issuers
Net Interest Margin (NIM)(1,2)2013 U.S. Card Issuers
Pre-tax, Pre-Reserve ROA(1,3)
Note(s)1. American Express (U.S. Card), Capital One (U.S. Card adjusted for estimated impact of Best Buy portfolio sale), Citi (Citi-branded Cards N.A. based on segment tax rate) and
JPMorgan Chase (Card Services)2. Capital One, Citi, and JPMorgan Chase net interest margins include late fees, whereas American Express and Discover exclude late fees; Discover card net interest margin represents
credit card interest yield less total company average funding cost (total company interest expense / total company average receivables)3. Pre-tax income excluding the impact of changes in loan loss reserves divided by average card receivables, which is a non-GAAP measure; see appendix for Discover GAAP
reconciliation
13.1%
10.1% 9.7%9.3% 8.9%
COF DFS C JPM AXP
6.8% 6.7%
4.3% 4.4%3.9%
DFS AXP JPM COF CSource Public company data; Discover

12
Private Loans
$7
Federal Loans$101
Grants and
Other$139
Private Student Lending -Discover is the third largest private student lender
Academic Year 2012-2013Private Loan Market Share(1)
Note(s)1. Measure One Data provides industry-wide private student loan disbursements; Sallie Mae company reports; Wells Fargo disbursements based on internal estimates
Academic Year 2012-2013Sources of Education Funding
Sallie Mae54%
Wells Fargo20%
Discover16%
Other10%
Source College Board, Trends in Student Aid (Preliminary 2012-2013 Academic Year); excludes family contribution

13
2.3%
1.3%
Sallie Mae Discover
Student Loan Receivables ($Bn)(1)
Disciplined underwriting approach drives better student loan credit performance
2013 Net Charge-off Rate (%)
(3) (4)
Note(s)1. Represents year-end contractual receivable balances, which is a non-GAAP measure; see appendix for reconciliation2. Includes CitiAssist branded originated loans for 2011 and 20123. Defined as net losses to average receivables for the private education loan portfolio4. Defined as net losses to average managed contractual receivables, which is a non-GAAP measure for DFS; see appendix for reconciliation
$0.6 $1.0$2.1
$3.1$4.0
$4.7
$7.7$8.1
$8.5
2009 2010 2011 2012 2013Purchased Organic(2)

14
Personal Loans -Driving disciplined profitable growth
Overview Personal Loans ($Bn)
• Superior alternative for consolidating debt
• Typical installment loan characteristics:– 3-5 year term ‒ 300-400bps rate reduction
• Approximate average FICO of 750
• 60% of portfolio has another Discover relationship
0%
2%
4%
6%
8%
10%
$0
$1
$2
$3
$4
$5
2009 2010 2011 2012 2013
Total Loans Outstanding6 Month Lagged Charge-Off Rate

15
Direct-to-Consumer Deposits -Funding asset growth with deposits
OverviewDirect-to-Consumer
Deposits ($Bn)(1)
• Developed robust source of funding through direct-to-consumer deposits
• Significant investments in operational and technology infrastructure
• Shifting marketing mix toward indeterminate maturity products
• Launched Cashback Checking- No monthly service fees or
minimum balance- Mobile check deposit & online bill
pay- Free access to 60,000+ ATMs- Cashback on everyday
transactions (debit, bill pay, checks)Note(s)1. Includes affinity deposits
$13
$21
$27 $28 $28
2009 2010 2011 2012 2013
23% 38% 46% 47% 43% % of Funding

16
95 95 91 96 104 109 113 5 6 6 7 8 9 10 86 107 109 121
141 161 160 15 26 27
29 28 27
$186$223 $232
$251$282
$307 $310
2007 2008 2009 2010 2011 2012 2013
Payments -Increasing domestic and global acceptance
2007
Network Partners
Proprietary
• $186Bn volume• 265,000+ ATMs• 7MM+ acceptance locations• Operated in 34 countries/territories
• $310Bn volume• 1MM+ ATMs• 25MM+ acceptance locations • Operates in 185 countries/territories
2013
Volume ($Bn)
(1)
Note(s)1. Fiscal year ending November 30

17
Visa56%
MasterCard23%
Discover8%
Other13%
PULSE -Participating in a highly competitive debit industry
PULSE Volume ($Bn)
$109 $121
$141
$161 $160
2009 2010 2011 2012 2013Source The Nilson Report 2012 Debit market; Discover estimates
U.S. DebitVolume Share (%)
$2.0Tr Debit Market• 67% Signature• 33% PIN

18
Growing global acceptance through network alliances
Note(s)– The map denotes countries or territories with transactional activity in the last year (bright orange)– Outlet growth percentages reflect year-over-year change– Merchant locations based on third party estimates and internal reporting
Asia Pacific34%
North America8%
EMEA8%
Latin America22%
(March 2013)
(May 2013)
(November 2013)
19
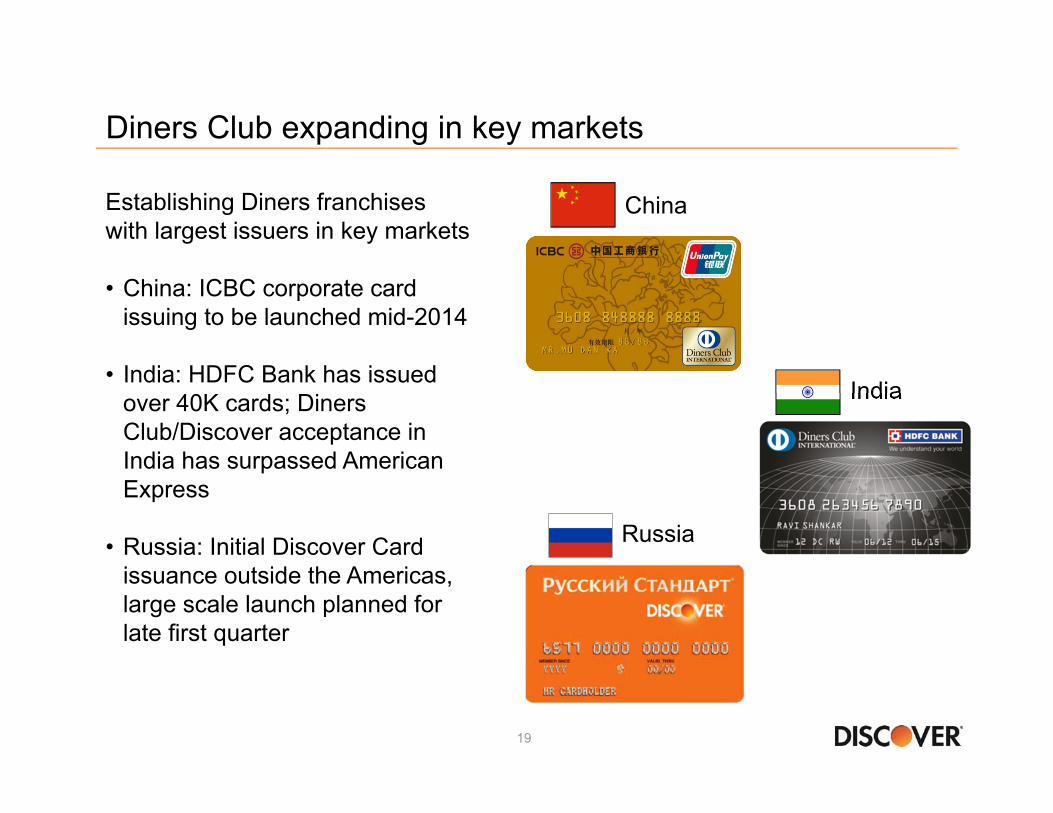
Diners Club expanding in key markets
China
India
Establishing Diners franchises with largest issuers in key markets
• China: ICBC corporate card issuing to be launched mid-2014
• India: HDFC Bank has issued over 40K cards; Diners Club/Discover acceptance in India has surpassed American Express
• Russia: Initial Discover Card issuance outside the Americas, large scale launch planned for late first quarter
Russia
20
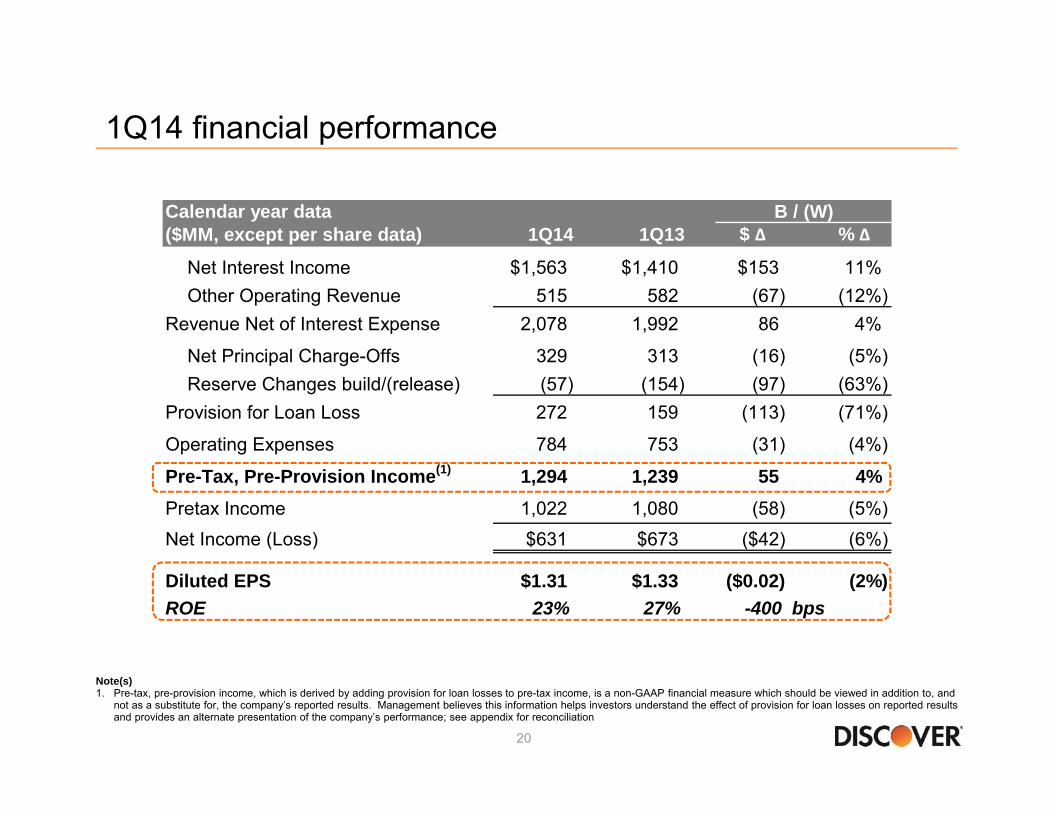
1Q14 financial performance
Note(s)1. Pre-tax, pre-provision income, which is derived by adding provision for loan losses to pre-tax income, is a non-GAAP financial measure which should be viewed in addition to, and
not as a substitute for, the company’s reported results. Management believes this information helps investors understand the effect of provision for loan losses on reported results and provides an alternate presentation of the company’s performance; see appendix for reconciliation
Calendar year data($MM, except per share data) 1Q14 1Q13 $ ∆ % ∆
Net Interest Income $1,563 $1,410 $153 11%Other Operating Revenue 515 582 (67) (12%)
Revenue Net of Interest Expense 2,078 1,992 86 4%
Net Principal Charge-Offs 329 313 (16) (5%)Reserve Changes build/(release) (57) (154) (97) (63%)
Provision for Loan Loss 272 159 (113) (71%)
Operating Expenses 784 753 (31) (4%)
Pre-Tax, Pre-Provision Income(1) 1,294 1,239 55 4%Pretax Income 1,022 1,080 (58) (5%)Net Income (Loss) $631 $673 ($42) (6%)
Diluted EPS $1.31 $1.33 ($0.02) (2%)ROE 23% 27% -400 bps
B / (W)
21
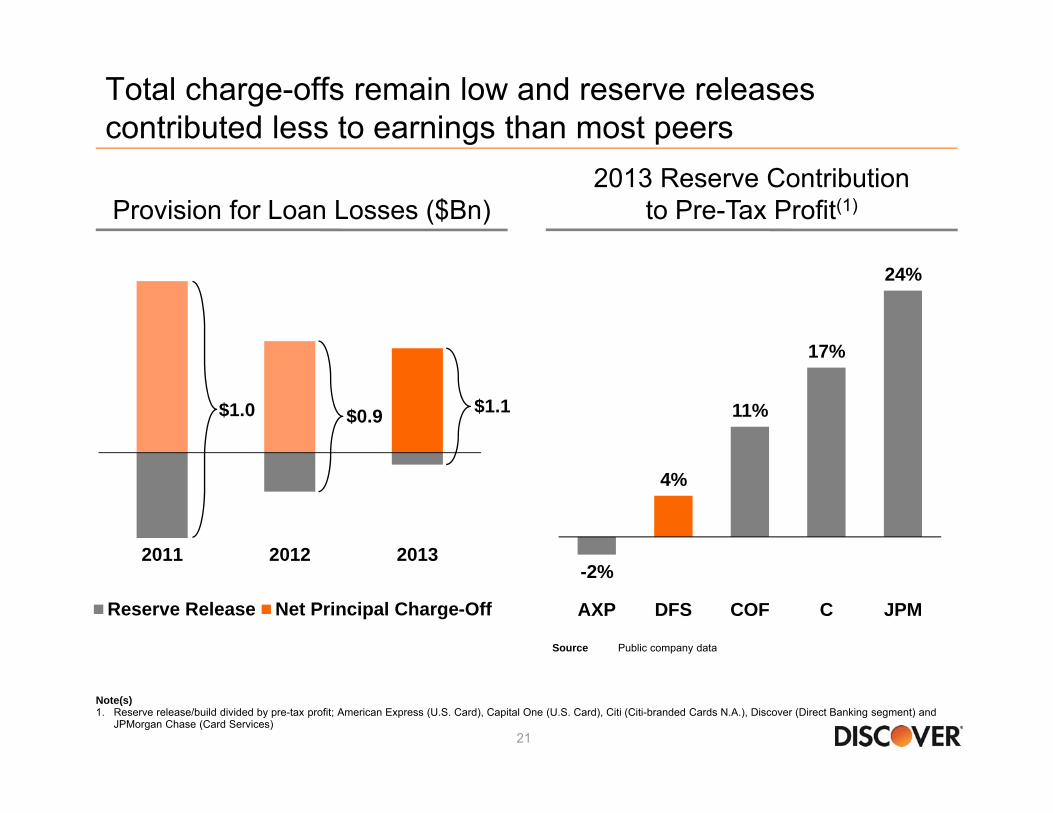
2011 2012 2013
Reserve Release Net Principal Charge-Off
Total charge-offs remain low and reserve releases contributed less to earnings than most peers
Provision for Loan Losses ($Bn)
$1.0 $0.9 $1.1
-2%
4%
11%
17%
24%
AXP DFS COF C JPM
2013 Reserve Contribution to Pre-Tax Profit(1)
Note(s)1. Reserve release/build divided by pre-tax profit; American Express (U.S. Card), Capital One (U.S. Card), Citi (Citi-branded Cards N.A.), Discover (Direct Banking segment) and
JPMorgan Chase (Card Services)
Source Public company data

22
12.1
7.5
14.8
1Q14
Fed Discount WindowABCP Committed LinesLiquidityPortfolio
5%
44%35%
25%
59%
28%
1% 3%
Spin (6/30/07) 1Q14
Direct Deposits Brokered DepositsABS and Other Senior Bank Notes
Continuing to strengthen and diversify funding sources while maintaining robust liquidity
Funding Mix ($Bn) Contingent Liquidity Sources ($Bn)
$49.7
Note(s)1. Includes affinity deposits
$34.4$65.3
(1)
23
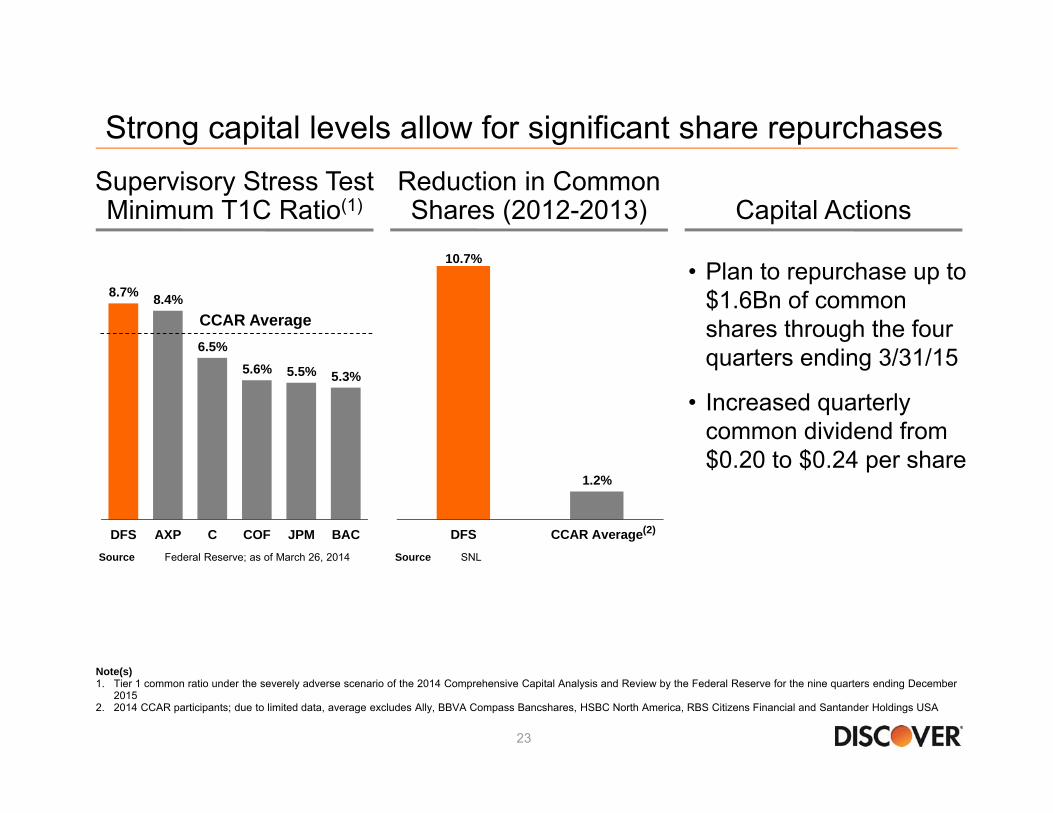
8.7% 8.4%
6.5%5.6% 5.5% 5.3%
DFS AXP C COF JPM BAC
Strong capital levels allow for significant share repurchases
Note(s)1. Tier 1 common ratio under the severely adverse scenario of the 2014 Comprehensive Capital Analysis and Review by the Federal Reserve for the nine quarters ending December
20152. 2014 CCAR participants; due to limited data, average excludes Ally, BBVA Compass Bancshares, HSBC North America, RBS Citizens Financial and Santander Holdings USA
Supervisory Stress TestMinimum T1C Ratio(1) Capital Actions
CCAR Average
• Plan to repurchase up to $1.6Bn of common shares through the four quarters ending 3/31/15
• Increased quarterly common dividend from $0.20 to $0.24 per share
10.7%
1.2%
DFS CCAR Average
Reduction in Common Shares (2012-2013)
Source SNL
(2)
Source Federal Reserve; as of March 26, 2014

Appendix

25
Reconciliation of GAAP to non-GAAP data12 Months Ended
(unaudited) 12/31/13Card Pretax Return on Assets 7.2%Card Reserve Changes (0.4%)Card Pretax Return on Assets (Excluding Reserve Changes)(1) 6.8%
(unaudited, $ in billions, calendar year data) 12/31/10 12/31/11 12/31/12 12/31/13GAAP Recorded Balance Purchased (Private) Credit Impaired Student Loans (ending loans) $3.1 $5.2 $4.7 $4.2Adjustment for Purchase Accounting Discount 0.6 0.4 0.3 0.3 Contractual Value Purchased (Private) Credit Impaired Student Loans (ending loans)(2) $3.7 $5.6 $5.0 $4.5GAAP Private Student Loans (ending loans) 1.0 2.1 3.1 4.0 Contractual Value Private Student Loans (ending loans)(2) $4.7 $7.7 $8.1 $8.5
12 Months Ended(unaudited, $ in millions) 12/31/13GAAP Recorded Balance Purchased (Private) Credit Impaired Student Loans (average loans) $4,434Adjustment for Purchase Accounting 315Contractual Value Purchased (Private) Credit Impaired Student Loans (average loans)(2) $4,749GAAP Private Student Loans (average loans) 3,561Contractual Value Private Student Loans (average loans)(2) $8,310
GAAP Private Student Loan Net Principal Charge-offs $46Adjustment for Purchased (Private) Credit Impaired Student Loans Net Principal Charge-offs 60Contractual Private Student Loan Net Principal Charge-offs(3) $106
2013 Net Charge-Off Rate 1.3%
(unaudited, in millions) 03/31/14 03/31/13Provision for loan losses $272 $159Income before income taxes 1,022 1,080Pre-tax, pre-provision income(4) $1,294 $1,239
Note(s):
Quarter Ended
4. Pre-tax, pre-provision income, which is derived by adding provision for loan losses to pre-tax income, is a non-GAAP financial measure which should be viewed in addition to, and not as a substitute for, the company’s reported results. Management believes this information helps investors understand the effect of provision for loan losses on reported results and provides an alternate presentation of the company’s performance.
1. Card pre-tax return on assets excluding loss reserve changes is a non-GAAP measure and represents the pre-tax earnings of Discover's U.S. credit card business excluding changes to the allowance for loan loss reserve. Card pre-tax return on assets excluding loss reserve changes is a meaningful measure to investors because it provides a competitive performance benchmark. 2. The contractual value of the purchased private student loan portfolio is a non-GAAP measure and represents purchased private student loans excluding the purchase accounting discount. The contractual value of the private student loan portfolio is meaningful to investors to understand total outstanding student loan balances without the purchase accounting discount. 3. Contractual private student loan net principal charge-offs is a non-GAAP measure and include net charge-offs on purchase credit impaired loans. Under GAAP any losses on such loans are charged against the nonaccretable difference established in purchased credit impaired accounting and are not reported as charge-offs. Contractual net principal charge-offs is meaningful to investors to see total portfolio losses.