2014 - Astra Industrial · * Other segments include AIG Holding Company. 605Gross Profit 1,919...
43
2014 Annual Report
Transcript of 2014 - Astra Industrial · * Other segments include AIG Holding Company. 605Gross Profit 1,919...

Overview 4
Group Snapshot 6
Board of Directors 8
Chairman's message 10
President's message 12
Our People; Our Assets 14
Social Responsibility 16
Events & Conferences 18
Table of Contents
About Astra Industrial Group Pages
Pages
Pages
Group Companies
Audited Financial Statements
Pharmaceutical Segment 20
Specialty Chemicals Segment 26
Power & Steel Segment 36
Other Segments 48
Independent auditors’ report 53
Consolidated balance sheet 54
Consolidated income statement 55
Consolidated cash flows statement 56
Consolidated statement of changes in shareholders’ equity 58
Notes to the consolidated financial statements 60 - 82

Astra Industrial Group (AIG) is one of the leading industrial investment companies in the Kingdom of Saudi Arabia that has been listed in Tadawul stock market in 2008. It strives to establish and develop various industrial projects that contribute positively to the national and regional (MENA) economies through producing high quality products to fulfill a share of the local/regional demand.
Diversification is a key component of the group’s philosophy. Such diversity enabled the group to maintain balanced sustainable performance. Diversification extends to industries, geography and client base. The group is currently within four segments, pharmaceuticals, specialty chemicals, power and steel, and industrial minerals. With around 15 manufacturing plants spread over 5 countries, the groups products serves more than 40 markets glabally.
Overview Business Segments
Astra Industrial Group owns 100% of the subsidiaries through direct and indirect ownership, except for:1) Astra Industrial Group owns 51% share in Al Tanmiya.2) Astra Industrial Group owns 76% share in Astra Energy.3) Astra Industrial Group owns 60% share in Astra Mining Company Limited.* Other segments include AIG Holding Company.
605Gross Profit
1,919Millions
Millions
Millions
SAR
SAR
SAR
Total Sales
109Net Profit
3
5

Subsidiaries
15 companies
Employees Registered Brands
ManufacturingFacilities
Operating Cash FlowSAR million
Capex
248SAR million
Total Assets
3,729SAR million
211
Products ReachCountries
14% CAGR14% CAGR
2014Total Sales 1,919 SAR million
21%
31%
48%
2010Total Sales 1,120 SAR million
40%
40%
20%
Power and Steel segment contributed around 21% to the total revenues. This segment had a growth of 16% in revenues during 2014 which was mainly driven by the commercial operation of Al Tanmiya Steel in Iraq.
Pharmaceutical segment is the major contributor to Group Revenues with 48% share. This segment had a growth of 7% during 2014.
Specialty Chemicals contributed around 31% to the total revenues. This segment had a growth of around 6% during 2014.
Export Sales
Global Reach
Revenue Breakdown
ManufacturingFacility

Board of Directors
Khaled Sabih MasriDeputy Chairman of the BoardChairman of Performance &Investment Committee
Kamil AbdulrahmanSadeddinMember of the BoardMember of Performance &Investment Committee
Ghassan IbrahimAkeelMember of the BoardMember of Performance &Investment CommitteeChairman of Audit Committee
Farraj MansourAbothenainMember of the BoardMember of Performance &Investment Committee
Sameer MohammedAl HamidiMember of the BoardMember of Audit CommitteeMember of Nominations &Remunerations Committee
Sabih Taher MasriChairman of the BoardMember of the Nominations & Remunerations Committee
Mohammad NajerAl UtaibiMember of the BoardMember of Performance& Investment Committee Ghiath Munir
SukhtianMember of the Board
Selman FaresAl FaresMember of the BoardMember of Audit CommitteeChairman of the Nomination & Remunerations Committee
9

Dear Shareholders,
On behalf of the board of directors, I am
delighted to present 2014 annual report
of Astra Industrial Group.
Astra Industrial Group heritage as Saudi
Industrial powerhouse runs deep. What
began with small greenfield projects
more than three decades ago has
transformed into a regional, diversified
industrial conglomerate with revenues
heading toward SAR 2 billion mark.
We pride ourselves for being among
the largest industrial conglomerate
businesses in the Kingdom of Saudi
Arabia and MENA region.
AIG since inception has been focused on
long term strategic investments in line
with it vision to build solid diversified
industrial platform that spreads over
the MENA region. We believe that
portfolio variety strengthens our
group’s long term sustainability and
enhances resilience against short term
fluctuations that is a well known feature
of the emerging markets.
The challenges faced by our businesses
within their industries were significant in
2014. The region recently experienced a
combination of geo-political instability,
economic disruptions and unexpected
overall oil price meltdown.
The group has maintained its growth
in terms of capacity, product portfolio
and market reach especially within
the pharmaceuticals and specialty
Chairman's messagechemicals segments. On the other hand,
there were some challenges within
other segments, which led to thorough
assessments and restructuring measures
to enable the businesses to cope with
current developments in their industries.
With regards to Tanmiya Steel in Iraq,
despite restless efforts to expedite the
execution of the project, the construction
period was prolonged due to the
significant obstacles. Nevertheless, by
end of 2013 we managed to start the
commercial operation marking 2014 as
the first year of operation of our project.
Our investment in Iraq is yet to realize
its fruits due to the current geopolitical
uncertainty in the country.
Despite the regional instability and global
volatility during 2014, the group remains
focused on its expansion plans. The group
has managed to penetrate new markets
widening its footprint and strengthening
position within existing markets.
On behalf of the Board of Directors, I would
like to thank all our customers, employees
and our management team for their
dedication, as well as our partner in the
private and government sector for their
on-going support, and all our shareholders
for their trust and confidence in our group.
"The group has maintained its growth in terms of capacity, product portfolio and market reach. . .
Despite the regional instability and global volatility during 2014, the group remains focused on its expansion plans."
Sabih Masri
Chairman of the Borad
Sabih Masri
11

President's message
Mohammed Al Hagbani
President
Dear Shareholders,
Amid the continuing challenge of the regional macroeconomic environment in 2014, AIG has continued growth breaking into a new record of revenues where it grew at 8% to reach SAR 1.9 billion compared to SAR 1.8 billion last year. On the other hand, overall profitability has experienced downward pressure, where net income has been significantly dropped to SAR 109 million compared to SAR 253 million in the previous year.
Power and steel segment developments have impacted the groups performance significantly during 2014. Our excitement about starting the commercial production of Tanmiya project in Iraq was challenged due to the geopolitical instability that caused major turbulance in Iraq's economy. Additionally lack of approved budget caused significant slowdown in the progress of the mega projects. As a result, the demand for steel weakend while credit risk increased, collectively causing the company to scale down its production, hence low utilization. Having said so, we are still firm believers in the fundamental drivers of the opportunity but we need to be cautious toward managing risk factors that are still apparent in Iraq. Steel structure business in Saudi was also affected due to the increase in competition and labor cost.
Pharmaceutical segment has continued to outpace market growth. While the
growth was at slower pace compared to previous year, this segment within the group remains robust, with steady growth across all markets. Specialty Chemical also continued growth with improvements in profitability while expanding into new markets.
For our undergoing expansion projects, Tabuk Pharmaceutical Manufacturing Company has concluded the construction of its state of the art facility in Dammam. It will be the only factory to produce Lyophilized products in the Kingdom. Furthermore, Astra mining started ground work of the calcium carbonate project to produce hydrated lime and quick lime. We expect the trial production to start in first quarter 2016. In addition to that, Astra Polymers Compounding Company has also started the ground work of establishing it's Masterbatch factory in India.
2014 was a reform year for the group that witnessed several streamlining initiatives within the group's companies. A quality assurance department was created to secure quality in every aspect/process within the organization. We have also launched development programs for strategic initiatives within different parts of our group.
We also stepped up our investments in brand building, R&D, presence in different markets and our most valuable asset; our people.
As part of investing in our society, we sponsored Career Day of King Saud University along with contributing to the University training program
through opening the door for university students to real life experience. We also sponsored Industrial Innovation Award that contributes to the development of the national industrial segment in the Kingdom. In addition to that, the group conducted many workshops to improve health awareness within the society.
Targeting new industries and products has always been part of Astra Industrial Group investment philosophy, the group will continue screening for industrial investment opportunities that adds value to the economy and our portfolio in line with AIG’s strategy.
I would like to thank our staff for their performance that contributed to the achievements of our group. I would also like to thank our honored clients for their trust and the suppliers of supporting services. Our thanks extend to the board and shareholders as well who are the cornerstones of our success.
"AIG has continued growth breaking into a new record of revenues where it grew at 9% . . .
2014 was a reform year for the group that witnessed several streamlining initiatives within the group's companies."
Mohammed Al Hagbani
13
Our People; Our Assets
2010Total Employees
1,940432 Saudis
*
2014Total Employees
3,172658 Saudis
2,514 Non Saud
is
1,506 Non Saudis
Increase in the
number of jobs for
Saudi Nationals
*
* Figures are for total employees present in the Kingdom of Saudi Arabia
Astra Industrial Group is proud to
employ over 4,800 highly motivated
people across its offices and
manufacturing locations. We strive to
provide our people with opportunities
for professional and personal fulfillment.
Through our human resource programs,
we are identifying competencies,
building leadership skills, enhancing
capabilities at all levels and promoting
a skilled workforce to address process
improvements, increase productivity
and most importantly comply with local
regulations.
Saudization and sustainable community development
We at Astra Industrial Group encourage
the employment of Saudi nationals
who ultimately will be the leading
force behind the development of the
economy. We employ Saudis nationals
both male and female at all levels in
our organization. Saudi employees
increased from around 430 during
2010 to around 655 in 2014. Saudi
nationals play a very crucial role in
the development of our organization.
We believe diversity, collaboration
and teamwork enhances performance
and drives innovation. We have also
created many job opportunities for
skilled and talented Saudi females in our
organization. Today, Astra Industrial Group
employs around 90 Saudi females at
various levels.
Employee training and development
Astra Industrial Group support its
employees for their personal development
and career growth. During 2014, Astra
Industrial Group sponsored many in
house training programs to develop
and uplift the potential of its manpower.
These includes leadership training,
quality systems, SAP, Team Building,
Time management, Communication etc.
We believe training and development is
vital to enhance the skill of our people
thereby improve the performance of our
organization.
15

Social ResponsibilityAstra Industrial Group believes that the society is integral to our priorities to which we remain for sustainable growth. During 2014 Astra Industrial Group has established social responsibility framework. The Group has sponsored many events and activities in the Kingdom of Saudi Arabia.
Raising awareness in society
Making positive contribution to society is a core element at Astra Industrial Group. The company focuses its corporate responsibility work on a key area that underscores its mission of improving health: raising awareness on the leading diseases which represents a major burden on health care systems:
Walk the Talk MarathonAstra Industrial Group together with Tabuk pharmaceuticals was the sponsor of Walk the Talk Marathon that was organized by Saudi Heart Association.
Diabetes awareness programTabuk sponsored Diabetes awareness program in many universities in Kingdom of Saudi Arabia namely Princess Noura University for Women, Prince Sultan University, Dar Al Uloom university, College of Excellence etc.
Apart from this, Tabuk has supported numerous activities across MENA region
in 2014.
Co-Operative Education Programs
Astra Industrial Group provided
opportunities for number for
enthusiastic Saudi students from
various universities and colleges to
allow them to gain practical work
experience and satisfy their academic
program graduation requirements.
We framed excellent training plans for
these students in order to enable them
to overcome the challenging highly
competitive job market.
Industrial Innovation Award
Saudi Industrial Property Authority
(Modon) honored Astra Industrial Group for
being the Gold sponsor at the Industrial
Innovation Award. The Industrial
Innovation award is launched by Modon to
achieve number of goals like development
of the industrial sector with innovative
industrial projects, attracting the creative
Saudi inventors to turn their scientific
achievement into projects in the industrial
cities, motivate and encourage innovators
to develop their ideas for industrial
opportunities, engaging the private sector
in the CSR sustainable programs, and
thereby achieving balanced development
for the promising areas.
Friends of Patients
Astra Industrial Group sponsored Friends
of patients organization during 2014.
Friends of Patients is an organization
who provide free medical equipment's to
the poor and needy. It is an organization
which brings smiles on peoples face.
Safety of Employees
Ensuring the safety of employees,
preserving the environment and
advancing the well being of the
neighborhood are top priorities at Astra
Industrial Group. We not only have
tradition of safety at work, but strongly
encourage the employees to carry this
mindset beyond the workplace and into
their homes and communities.
1
1 TPMC Diabetes awareness program.
17

4
5
3
1
1
2
3
4
5
2
Astra Chem stand at Saudi Agriculture exhibition.
From left to right: Astra Industrial Group President Mr. Mohammed Al Hagbani with International Building Systems Factory CEO Mr. Mufid Hattab at IBSF Engineering Day 2014.
Astra Industrial Group representatives at King Saud University for Career Day event.
Astra Polymer stand at Plastivison Arabia 2014.
From Left to right: Astra Chem CEO Mr. Yehia El Azab, Astra Industrial Group President Mr. Mohammed Al Hagbani, Ex-Minister of Agriculture Dr. Fahad bin Abdulrahman Balghunaim at Saudi Agriculture Exhibition.
Events and Conferences
King Saud UniversityCareer Day Event 2014
2014 Conference2014 Exhibition
AIG believes in active contribution to social / business events and conferences. During 2014 the group has participated in numerous events / conferences including:
19
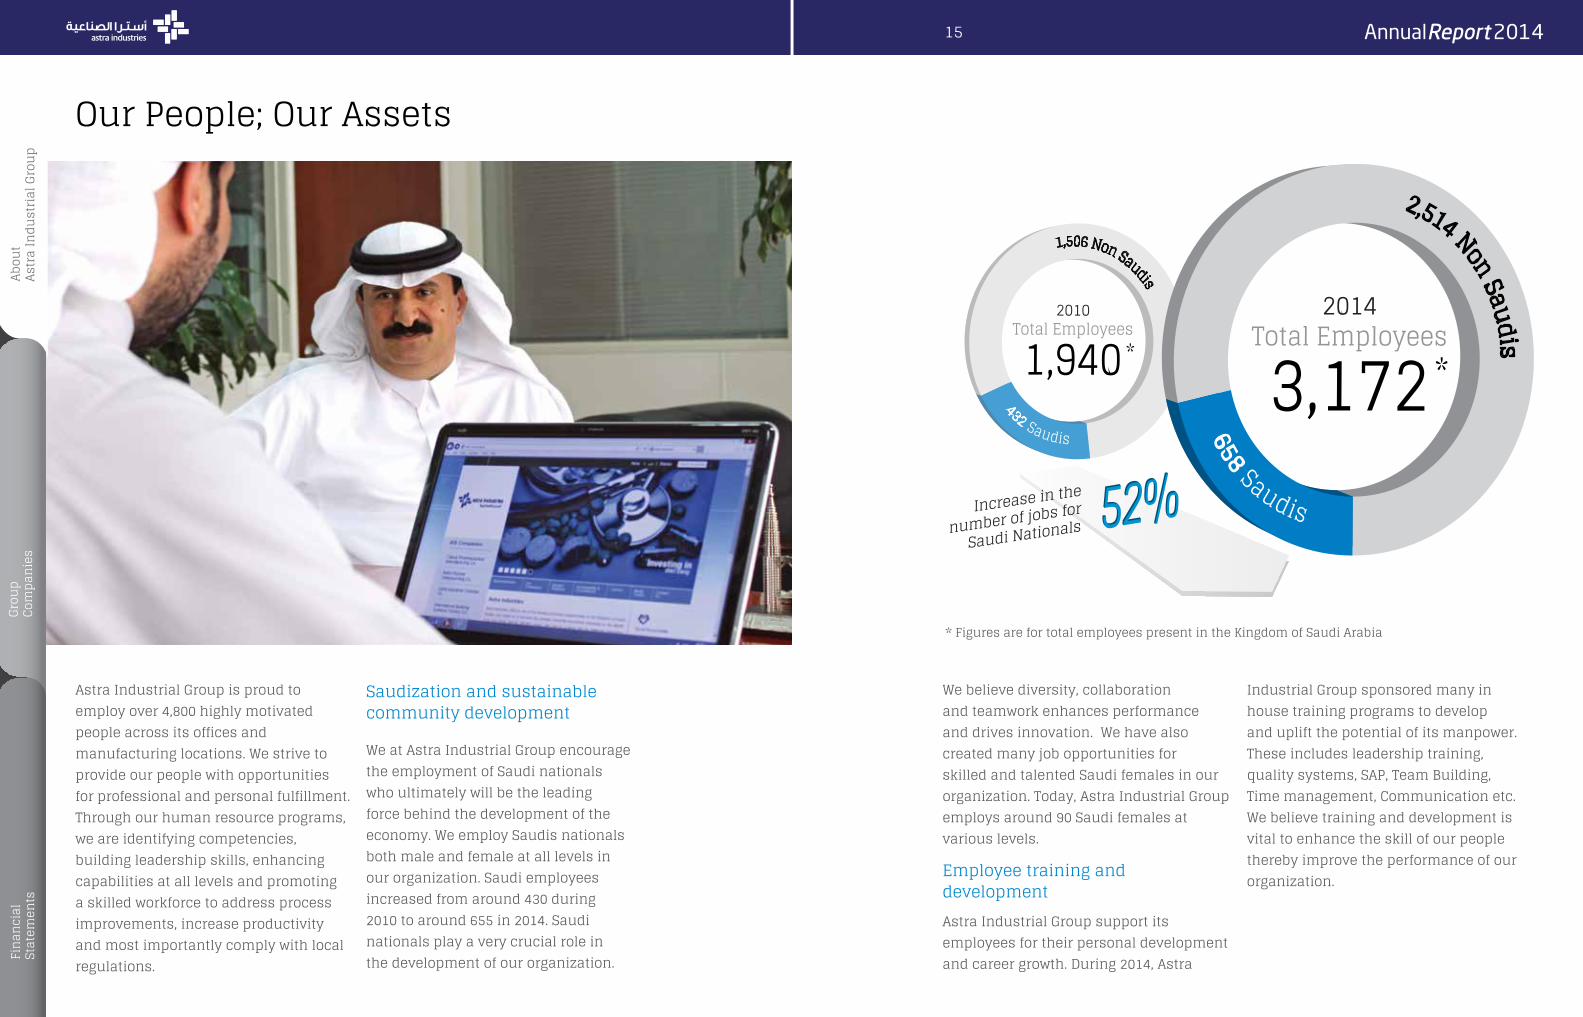
Pharmaceutical segmentat a glance
926 M.Revenues 7%
9%
17%
563 M.Gross Profit
169 M.Capex
Segment Companies: “Pharmaceutical segment is the major contributor to our Group Revenues with 48% share. This segment had a growth of 7% in revenues during 2014.”
SAR
SAR
SAR
21

“Tabuk Pharmaceutical has cemented its position as one of the region’s leading drug companies”
Tabuk Pharmaceutical Manufacturing Co. was established in 1994.
Its mission is to develop, manufacture, market and distribute branded generic pharmaceuticals and licensed products in the Middle east and North Africa.
The Company manufactures a wide range of drugs including tablets, capsules, injectable vial, oral syrup and suspension, dry and oral suspension, ointments and creams, sachets, external solutions and lotions, shampoos and nasal spray.
The Company prides itself on being the first EU-GMP certified facility in Saudi Arabia and one of the leading regional players.
Anti Infectives (against infections)
Respiratory system
Alimentory and Metabolism (Acid related disorders)
Musculo skeletal system (Muscles and Joints)
Cardivascular System (Heart and Blood vessels)
Nervous system and Others
Branded generic business
Tabuk develops, manufactures and markets a broad portfolio of more than 250 products.
Licensing business
Tabuk collaborates with global renowned partners such as LG life Sciences and Sanofi to manufacture and commercialize under-license products, further expanding its production and supplying physicians and patients with a wider range of treatment options.
Overview Product segments Business segments Global business Partners
Certified By:
23

Tabuk continued to outpace the market growth for another year.
Local presence of the Company was strengthened across all MENA countries, growing its sales significantly in that region.
The company invested heavily in building supply chain capabilities and enhancing its sales and marketing network.
The Company signed a number of in-licensing and manufacturing partnership deals with foreign pharmaceutical companies (eg. product-swap deal with America’s largest drug-manufacturer Pfizer).
The Company completed construction of it's Dammam plant which consist of the following segments:
Injectibles
Liquids
Semi Solids
Dammam plant will be the first facility in Saudi Arabia equipped to manufacture lyophilized injectable products.
SFDA approval on the plant has been obtained.
Trial production has started on some of the production lines that will be followed by registration of products with SFDA that usually takes around 6 -12 months. Subsequently, commercial production for registered products can commence.
The pre operating expenses related to this plant has been significant during the year.
2014 Developments
Dammam Plant
“Dammam plant will be the first facility in Saudi Arabia equipped to manufacture lyophilized products”
Image: TPMC plant - Tabuk
25

Specialty Chemicals segmentat a glance
587M.Revenues 6%
14%
161%
159M.Gross Profit
34M.Capex
Segment Companies:“Specialty Chemicals contributed around 31% to the total revenues. This segment had a growth of around 6% during 2014.”
SAR
SAR
SAR
27

Astra Polymers was established in 1993.
It is a leading company in the production of high-quality masterbatch (blends, additives, black, white, color), dust-free additive systems, custom-made thermoplastic compounds, liquid-based or paste colorants and custom-made compounding for the polymer manufacturing, polymer converting, petrochemical and plastics processing Industries.
The Company has sustainable business ties with major petrochemical producers allowing it to become a dominant player in the region.
Astra polymers has a strategic manufacturing JV with BASF in Saudi Arabia.
The Company has manufacturing presence in Saudi Arabia, United Arab Emirates and Turkey.
"A sought-after partner in technological innovation"
Master batch: Black, White and colors.
Additives: UV stabilizers, Anti Block master
batch, BOPP additives, Anti Static, and Anti
oxidants.
Compounds: HDPE Compound,
Polystyrene Compound, Polypropylene
Compound.*Manufacturing subsidiaries.
Overview Product segments Subsidiaries*:
"Premier supplier of specialty masterbatches, compounds and additive systems and a major compounder"
Image: Astra Polymers plant Jabel Ali free zone
(formerly Constab Middle East Polimer)Astra Polymer Free Zone, Turkey
Astra Speciality CompoundsIndia Pvt. Ltd.
29

2014 Developments
A new trading arm was established in Turkey, a step that is in line with the vision of the Company to assist in penetrating the Turkish market.
India Project
The factory in India will serve as a competitive production base, targeting markets in the Far East Asian region, and a specialized research and development center for the company.
The ground work started in 2014.
The factory is expected to start trial production by end of 2015.
A new color center for research and development was established in United Arab Emirates to better assess and respond to clients’ needs.
New blends were developed to add new value to the product portfolio, responding to the latest trends in the market. Astra Polymers free zone, Turkey enriched product portfolio through the development of new products.
"A new color center for research and development was established"
Image: Astra Polymers plant - Jabel Ali free zone.
"Sustainable business ties with major petrochemical producers allowing it to become a dominant player in the region."
31

The Company was founded in 1988 as supplier of Agrochemicals and Fertilizers.
It has a far-reaching distribution network that covers around 21 countries.
Astra Chem is committed to adhere to internationally-accredited quality standards such as standards of Food and Agriculture Organization (FAO), Collaborative International Pesticides Analytical Council (CIPAC) and International Fertilizer Development Center (IFDC). The Company applies international criteria, as stated by the US Environment Protection Agency (US EPA).
The Company acts as a reliable partner for international firms that serve the Middle East and North Africa.
Thanks to its deep understanding of growers’ needs, the Company has succeeded in adding value to the plant protection industry and sustainable farming.
Agrochemicals
Public health pesticides
Fertilizers
Seeds
Overview Producer and supplier of: Global Business Partners:
Compliant with:
Subsidiary*:"Far-reaching distribution network serving 21 countries"
Image: Astra Nova plant - Turkey
"Adding value to plant protection industry and sustainable farming"
*Manufacturing subsidiaries.
33

2014 Developments
The Company scaled up granular production, a step that led to its emergence as a reliable local provider of granular fertilizers in the market.
The Company expanded its presence in several markets like Oman, Egypt and Morocco and has introduced new products while it maintaining its strong foothold in its major markets Saudi, Algeria and Turkey.
The seed sector was enhanced through developing trial stations. The first trial station, located in Al Kharj, is up and running while others are expected to follow next year.
Astra Nova (Astra Chem’s subsidiary in Turkey) succeeded in penetrating Turkish market and expanding its sales beyond the borders of Turkey.
Improvement processes were started within various production lines to increase the level of automation.
Continuous research and development efforts have resulted in the creation of a prototype product along with large number of products under pipeline, to be launched in the future.
"Research and development efforts have resulted in the creation of a prototype product "Image: Astrachem lab - Dammam
"The Company expanded its presence in several markets . . . while it maintaining its strong foothold in its major markets"
35
Power & Steel segmentat a glance
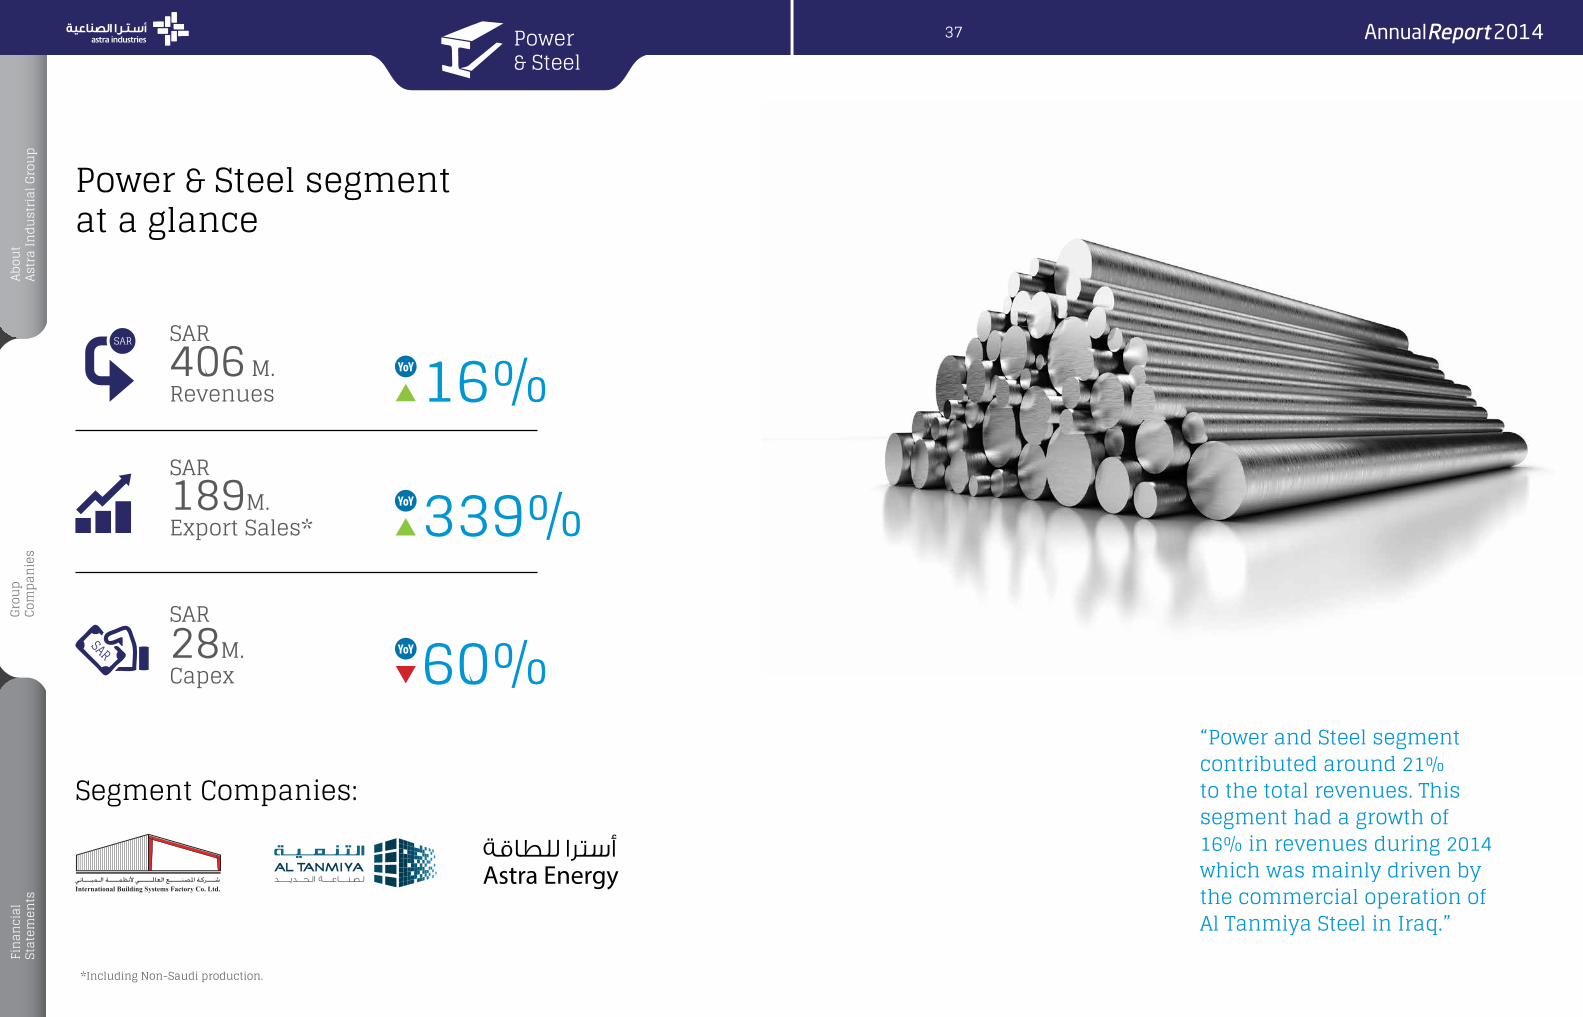
406 M.Revenues 16%
339%
60%
189M.Export Sales*
28M.Capex
Segment Companies:
*Including Non-Saudi production.
“Power and Steel segment contributed around 21% to the total revenues. This segment had a growth of 16% in revenues during 2014 which was mainly driven by the commercial operation of Al Tanmiya Steel in Iraq.”
SAR
SAR
SAR
37

International Building Systems Factory was established in 1993.
The Company created a one-stop shop for pre-engineered steel buildings and steel structures from design and manufacturing to erection.
Beside being a major player in the steel building industry in Saudi Arabia, the Company produced more than 10,000 buildings in 36 countries.
The Company has a successful track record in executing projects with unique complexity and necessary know-how in various industries.
Automaic Welding lineIBSF plant, Riyadh
IBSF plant - Jubail
Supply and Erection of:
Pre engineered buildings Steel structure Special projects
Overview Product segments: Global Business Clients:
Certification:
1
1
2
2
A reliable partner contributing to the Kingdom's infrastructure projects
Image: King Abdallah Sports City - Jeddah
39

2014 Developments
The Company completed one of the unique projects within King Abdullah Sport Facility in Jeddah, overcoming many obstacles that other local suppliers as well as some of the most experienced international suppliers found challenging.
The Company also successfully completed another landmark project in King Abdullah Financial District.
Tough competition, increase in labor cost coupled with the company’s existing commitments to its key customer have pressured the company’s profitability.
Its accreditation was renewed by:
American Institute of Steel Construction Inc. “AISC”
the American Society of Mechanical Engineering “ASME”
International Standard Organization “ISO”
Several initiatives have been launched to enhance company’s position in the market including comprehensive operational excellence program “ASPIRE”.
The Company registered Astra Heavy Industries as a subsidiary of the business to utilize Jubail plant for manufacturing heavy and complex steel.
"The company agility allowed it to respond to the Kingdom development plan, moving from developing Hydrocarbon industry to mobility and Sports facilities"
Image: Conference Center, King Abdallah Financial District - Riyadh.
41

The Company, located in the southern part of Iraq, started its commercial production in December, 2013.
Al Tanmia for steel is active in steel smelting, casting of steel billets and rolling rebar for construction industry.
Abundant supply of raw materials (scrap steel) in the country at competitive prices,
The Company is the only steel producer in the southern region of Iraq.
The steel plant consists of a state-of-the-art European equipment including electric arc furnace, a ladle furnace, a continuous billet caster and a rolling mill.
The plant is supported by an oxygen plant, a water treatment facility and a power plant.
Product segments:
Billets
Rebars
Overview
1
1 2
2
De-dusting system - Al Tanmiya Steel plant, Iraq
Image: Al Tanmiya Steel plant - Iraq
Finished product - Rebars
43
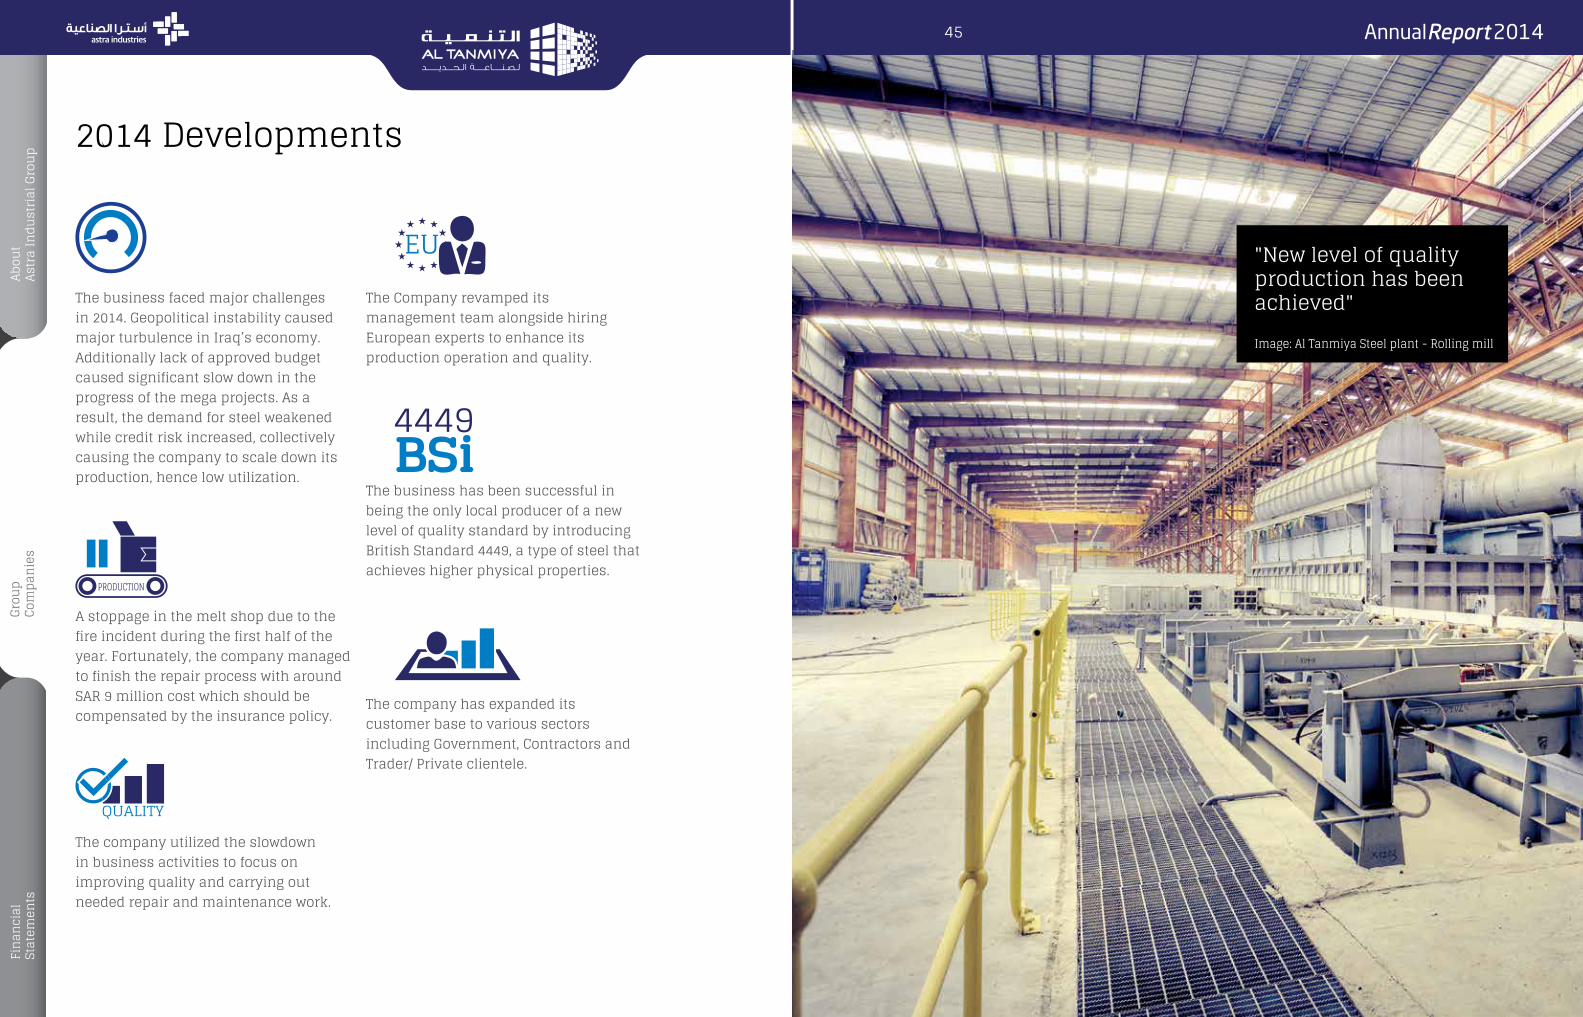
The company has expanded its customer base to various sectors including Government, Contractors and Trader/ Private clientele.
2014 Developments
The business faced major challenges in 2014. Geopolitical instability caused major turbulence in Iraq’s economy. Additionally lack of approved budget caused significant slow down in the progress of the mega projects. As a result, the demand for steel weakened while credit risk increased, collectively causing the company to scale down its production, hence low utilization.
The Company revamped its management team alongside hiring European experts to enhance its production operation and quality.
The business has been successful in being the only local producer of a new level of quality standard by introducing British Standard 4449, a type of steel that achieves higher physical properties.
A stoppage in the melt shop due to the fire incident during the first half of the year. Fortunately, the company managed to finish the repair process with around SAR 9 million cost which should be compensated by the insurance policy.
The company utilized the slowdown in business activities to focus on improving quality and carrying out needed repair and maintenance work.
"New level of quality production has been achieved"
Image: Al Tanmiya Steel plant - Rolling mill
45

Established in Jordan in 2010.
Astra Energy is a holding company that
invests in power generation projects
in Iraq. It is owned by both “Astra
Industrial Group” and “Al – Massira
International Group”, which own 76 %
and 24 % of its shares respectively.
Astra Energy has signed a contract
with “Al Tanmiya for Steel Industries”
to lease power generators for the
latter. This contract aims at providing
electrical energy for the Al Tanmiya for
Steel Industries.
Overview
21
2
Astra Energy power transformersAstra Energy power generators
1
47

Other Business segments
60% 40%
THARAWATMINING
Amid toward its continous efforts in exploring new investment frontiers coupled with Kingdom's support for the mining industry, the group has established Astra Mining Compnay (AMC) to be able to participate in such a promising segment. AMC is a joint venture between:
“Astra Mining Company's first project is the calcium carbonate facility in Al-Kharj.”
49
Segments
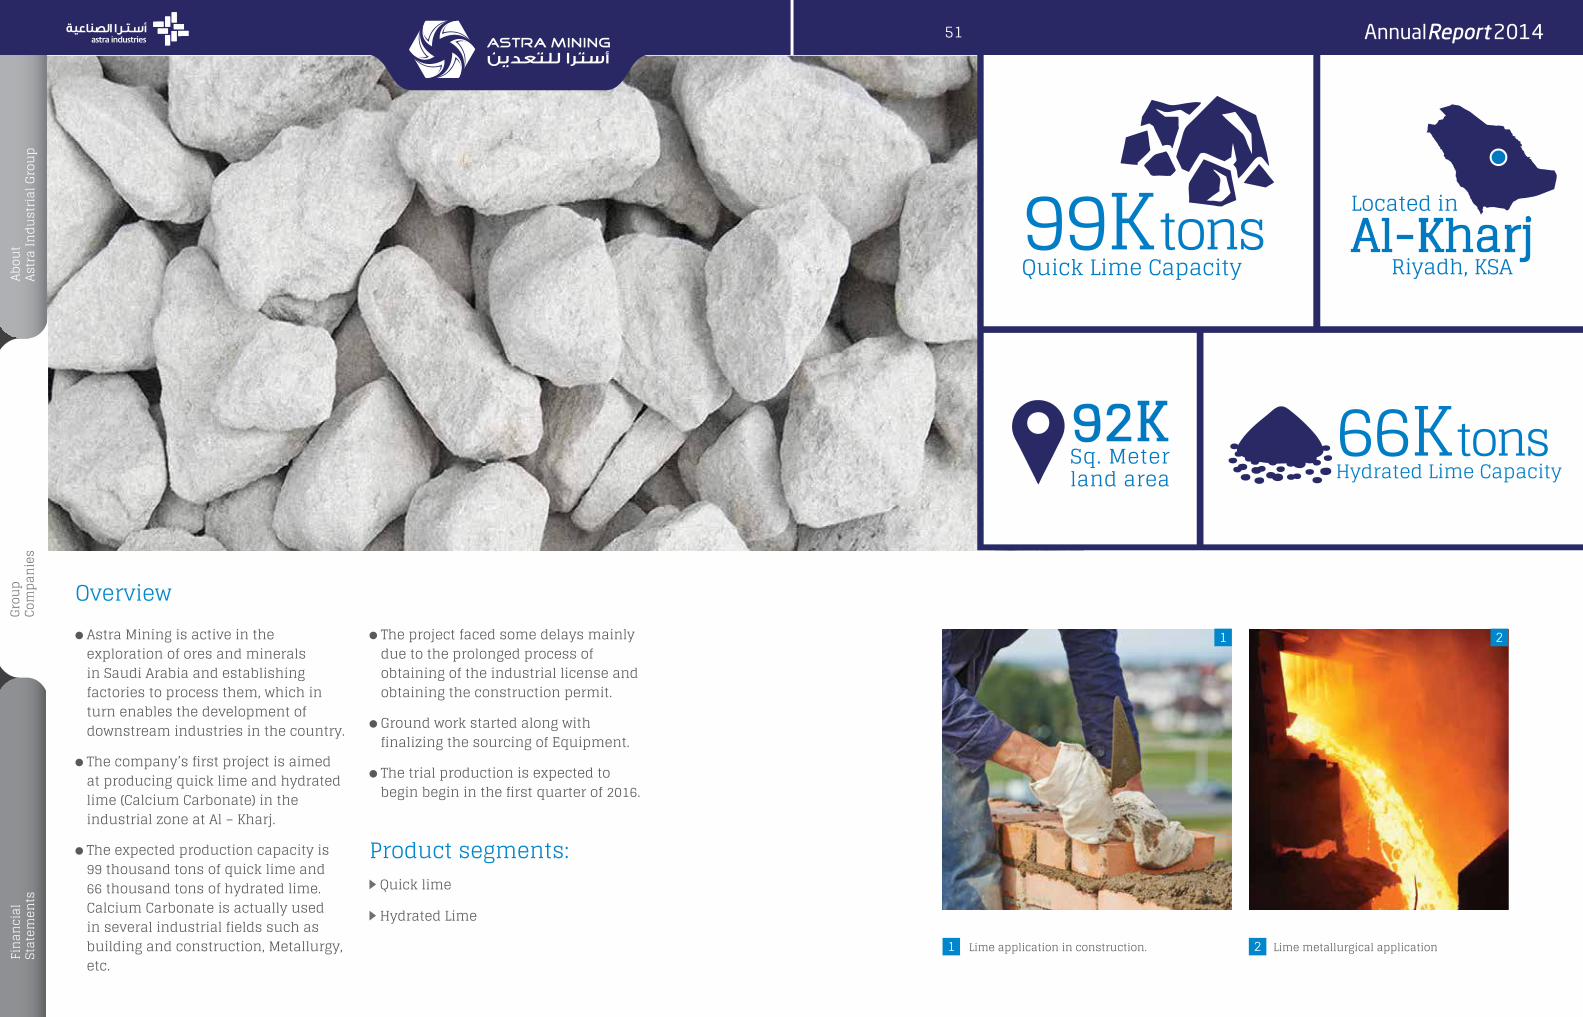
Astra Mining is active in the exploration of ores and minerals in Saudi Arabia and establishing factories to process them, which in turn enables the development of downstream industries in the country.
The company’s first project is aimed at producing quick lime and hydrated lime (Calcium Carbonate) in the industrial zone at Al – Kharj.
The expected production capacity is 99 thousand tons of quick lime and 66 thousand tons of hydrated lime. Calcium Carbonate is actually used in several industrial fields such as building and construction, Metallurgy, etc.
The project faced some delays mainly due to the prolonged process of obtaining of the industrial license and obtaining the construction permit.
Ground work started along with finalizing the sourcing of Equipment.
The trial production is expected to begin begin in the first quarter of 2016.
Product segments: Quick lime
Hydrated Lime
Overview
1
1 2
2
Lime application in construction. Lime metallurgical application
51

Consolidated Financial StatementsFor the year ended december 31, 2014
Pages
Independent auditors’ report 53
Consolidated balance sheet 54
Consolidated income statement 55
Consolidated cash flows statement 56
Consolidated statement of changes in shareholders’ equity 58
Notes to the consolidated financial statements 60 - 82
53

Assets Notes 2014 2013
Current assets
Cash and cash equivalents 4 207,707,829 197,320,536
Accounts receivable 5 1,046,132,070 1,005,706,022
Due from related parties 9 56,736,141 60,669,751
Inventories 6 719,066,716 788,177,878
Prepayments and other current assets 7 199,258,226 208,706,260
2,228,900,982 2,260,580,447
Non-current assets
Investment in unconsolidated subsidiaries andassociates 8 2,522,880 2,315,318
Property, plant and equipment 10 1,438,632,553 1,325,828,587
Goodwill 11 44,054,811 44,054,811
Intangible assets 12 15,279,018 12,737,519
1,500,489,262 1,384,936,235
Total assets 3,729,390,244 3,645,516,682
Liabilities
Current liabilities
Murabaha and tawaroq facilities 13 1,066,133,425 943,055,411
Notes payable 7,346,248 8,995,041
Accounts payable 159,712,451 132,965,967
Due to related parties 9 10,934,860 43,384,726
Accrued and other liabilities 14 215,710,536 198,275,269
Provision for zakat and income tax 15 36,945,716 34,893,270
1,496,783,236 1,361,569,684
Non-current liabilities
Due to related parties 9 366,214,443 329,106,832
End of service benefits 16 89,013,154 75,803,385
Long-term borrowing 17 50,165,976 -
Total liabilities 2,002,176,809 1,766,479,901
Equity
Shareholders of the Company:
Share capital 18 741,176,470 741,176,470
Statutory reserve 19 406,568,677 406,568,677
Retained earnings 780,368,442 829,734,060
Consolidated balance sheetAs at December 31
(All amounts in Saudi Riyals unless otherwise stated)
Effect of acquisition transaction with non-controlling interest without change in control (14,338,537) (14,338,537)
Foreign currency translation reserve (67,487,656) (68,506,943)
Total shareholders' equity 1,846,287,396 1,894,633,727
Non-controlling interest (119,073,961) (15,596,946)
Total equity 1,727,213,435 1,879,036,781
Total liabilities and equity 3,729,390,244 3,645,516,682
Contingencies and commitments 26
Consolidated income statementAs at December 31
Note 2014 2013
Revenues 1,918,806,481 1,771,426,340
Cost of revenues (1,314,173,348) (1,087,619,681)
Gross profit 604,633,133 683,806,659
Operating expenses
Selling and marketing 20 (346,276,521) (305,681,582)
General and administrative 21 (179,380,098) (187,240,494)
Research and development (19,080,104) (13,847,950)
Income from main operations 59,896,410 177,036,633
Other income (expenses)
Share in net income of unconsolidatedsubsidiaries and associates
8 207,562 319,117
Financial charges (42,476,734) (28,316,874)
Others, net 22 (7,840,926) 62,318,332
Income before non-controlling interest 9,786,312 211,357,208
Loss attributable to non-controlling interest 99,545,027 41,780,868
Net income for the year 109,331,339 253,138,076
Earnings per share: 23
Income from main operations 0.81 2.39
Net income for the year 1.48 3.42
Note: The notes on pages 54 to 82 form an integral part of these consolidated financial statements.
55

Cash flows from operating activities Note 2014 2013
Net income for the year 109,331,339 253,138,076
Adjustments for non-cash items
Depreciation 10 111,236,919 52,627,485
Amortization 12 5,845,927 6,054,029
Financial charges – due to related parties 16,840,530 15,244,088
Share in net income of unconsolidated subsidiariesand associates 8 (207,562) (319,117)
Loss attributable to non-controlling interest (99,545,027) (41,780,868)
Changes in working capital
Accounts receivable (40,426,048) (243,254,391)
Due from related parties 3,933,610 (5,561,326)
Inventories 69,111,162 28,285,392
Prepayments and other current assets 9,448,034 (30,982,937)
Accounts payable 26,746,484 (6,629,029)
Due to related parties (32,449,866) 40,616,039
Accrued and other current liabilities 17,435,267 30,090,789
End of service benefits, net 16 13,209,769 11,606,828
Net cash generated from operating activities 210,510,538 109,135,058
Cash flows from investing activities
Murabaha investments - 407,681,759
Purchases of property, plant and equipment 10 (247,664,064) (236,166,567)
Proceeds from sale of property, plant and equipment, net 23,623,179 4,499,795
Intangible assets, net 12 (8,387,426) (3,587,667)
Net cash (utilized in) generated from investing activities (232,428,311) 172,427,320
Consolidated cash flow statementFor the year ended December 31.
Cash flows from financing activities Note 2014 2013
Murabaha and tawaroq facilities 123,078,014 (73,468,842)
Long-term borrowing, net 17 50,165,976 -
Due to related party 20,267,081 27,726,608
Zakat and income tax paid 15 (25,138,629) (25,571,743)
Notes payable (1,648,793) (8,587,603)
Dividends paid 25 (129,705,882) (129,705,882)
Board members’ remuneration (1,800,000) (1,800,000)
Non-controlling interest, net (3,931,988) (3,003,807)
Net cash generated from (utilized in) financingactivities 31,285,779 (214,411,269)
Net increase in cash and cash equivalents 9,368,006 67,151,109
Cash and cash equivalents at beginning of year 197,320,536 155,310,007
Foreign currency translation reserve 1,019,287 (25,140,580)
Cash and cash equivalents at end of year 4 207,707,829 197,320,536
Supplemental non-cash information:
Due to related parties – financial charges 16,840,530 15,244,088
Provision for zakat and income tax charged toshareholders’ equity 15 27,191,075 29,932,500
Note: The notes on pages 54 to 82 form an integral part of these consolidated financial statements.
(All amounts in Saudi Riyals unless otherwise stated)
57

Note Sharecapital
Statutoryreserve Retained earnings
Effect of acquisition
transaction with non-controlling interest withoutchange in control
Foreign currency translation
reserve
Changes in fair value of cash flow
hedges Total
January 1, 2014 741,176,470 406,568,677 829,734,060 (14,338,537) (68,506,943) - 1,894,633,727
Net income for the year - - 109,331,339 - - - 109,331,339
Dividends 25 - - (129,705,882) - - - (129,705,882)
Board members’ remuneration - - (1,800,000) - - - (1,800,000)
Currency translation difference of consolidated subsidiaries - - - - 1,019,287 - 1,019,287
Zakat and income tax 15 - - (27,191,075) - - - (27,191,075)
December 31, 2014 741,176,470 406,568,677 780,368,442 (14,338,537) (67,487,656) - 1,846,287,396
January 1, 2013 741,176,470 406,568,677 738,034,366 - (43,366,363) (84,240) 1,842,328,910
Net income for the year - - 253,138,076 - - - 253,138,076
Dividends - - (129,705,882) - - - (129,705,882)
Board members’ remuneration - - (1,800,000) - - - (1,800,000)
Acquisition of non-controlling interest without change in control - - - (14,338,537) - - (14,338,537)
Currency translation difference of consolidated subsidiaries - - - - (25,140,580) - (25,140,580)
Changes in fair value of cash flow hedges - - - - - 84,240 84,240
Zakat and income tax 15 - - (29,932,500) - - - (29,932,500)
December 31, 2013 741,176,470 406,568,677 829,734,060 (14,338,537) (68,506,943) - 1,894,633,727
The notes on pages 54 to 82 form an integral part of these consolidated financial statements.
Consolidated statement of changes in shareholders’ equity(All amounts in Saudi Riyals unless otherwise stated)
59

1) General information
Astra Industrial Group Company (the “Company”) and its subsidiaries (collectively the “Group”) consist of the Company and its various Saudi Arabian and foreign subsidiaries listed below. The Company’s main objectives include establishment, management, operating and investment in industrial entities (subject to obtaining the Saudi Arabian General Investment Authority (“SAGIA”) approval for each project to be established).
The Company is a Saudi Joint Stock Company licensed under foreign investment license No. 03011498901- issued in Riyadh by SAGIA and operating under commercial registration No. 1010069607 issued in Riyadh on 9 Muharram 1409H (August 22, 1988). The registered address of the Company is P.O. Box 1560, Riyadh 11441, Kingdom of Saudi Arabia. The shares of Astra Industrial Group Company were listed on the Saudi Stock Market ("Tadawul") on 17 Shabaan 1429H (August 18, 2008) through subscription of 30% of the Company's shares by the public.
The accompanying consolidated financial statements include the accounts of the Company and its following subsidiaries, operating under individual commercial registrations:
Name of subsidiary Country ofincorporation
Effective ownership %at year end
Tabuk Pharmaceutical Manufacturing Company (“TPMC”)This Company has the following subsidiaries:
Saudi Arabia 100
Tabuk Pharmaceutical Research Company Jordan 100
Tabuk Pharmaceutical Company Limited Sudan 100
Tabuk Pharmaceutical Manufacturing Company Egypt 100
Tabuk Pharmaceutical Company Egypt 100
Tabuk Eurl Algeria Algeria 100
Astra Polymer Compounding Company Limited (“Polymer”)This Company has the following subsidiaries:
Saudi Arabia 100
Astra Polymers free zone Imalat Sanayi Ve Ticaret Anonim Sirketi. (Formerly named Constab Middle East Polimer A.S. (“CMEP”)
Turkey 100
Astra Polymer Pazarlama San. Ve Tic. A. * Turkey 100
Astra Specialty Compounds India Private Limited India 100
International Building Systems Factory Company Limited(“IBSF”)The Company has the following subsidiary:
Saudi Arabia 100
Astra Heavy Industries Factory Limited (“AHI”) Saudi Arabia 100
Notes to the consolidated financial statementsfor the year ended December 31, 2014(All amounts in Saudi Riyals unless otherwise stated)
Astra Industrial Complex Co. Ltd. for Fertilizer andAgrochemicals (“AstraChem”)
This Company has the following foreign subsidiaries:
Saudi Arabia 100
AstraChem Saudia Algeria 100
AstraChem Morocco Morocco 100
Aggis International Limited British VirginIslands
100
AstraChem Turkey Turkey 100
AstraChem Syria Syria 100
AstraChem Tashqand Uzbekistan 100
Astra Industrial Complex Co. Ltd. for Fertilizer andAgrochemicals, Jordan
Jordan 50
Astra Nova, Turkey Turkey 92.4
AstraChem Ukraine Ltd. Ukraine 100
AstraChem Saudi Jordan Co. Egypt 100
Astra Agricultural Saudi Jordan Co. Egypt 100
Astra Industrial Complex for Fertilizers and Agrochemicalsand Investments
Oman 99
Al-Tanmiya Company for Steel Manufacturing The Company has the following subsidiary:
Jordan 51
Al Inma’a Company Iraq 100
Astra Energy LLCThe Company has the following subsidiary:
Jordan 76
Fertile Crescent for Generate Electricity Company Iraq 100
Astra Mining Company Limited Saudi Arabia 60
*The company incorporated during 2014.
The principal activities of the subsidiaries are as follows:
• Production, marketing and distribution of medicine and pharmaceutical products.• Production of polymer compounds, plastic additives, color concentrates and other plastic products.• Metal based construction of industrial buildings and building frames.• Production of compounded fertilizers and agriculture pesticides and the wholesale
and retail trading of fertilizers, forages and insecticides. Also, execution of agricultural contracting projects.
• Production of steel pallets and rebar and generation of the required power of such activity.• Exploration of all ores and minerals in all regions of the Kingdom of Saudi Arabia except
for those land and marine areas beyond the scope of application of the mining investment law specified in Article No. 8 of the law.
61

During the year, Al Bareq Pharmaceutical Manufacturing Factory Company Limited (Al Bareq) has been merged into TPMC. Previously, Al Bareq was owned 95% and 5% by TPMC and Astra Industrial Group Company (AIG), respectively.
The Group has operation in Sudan through its subsidiary namely, Tabuk Pharmaceutical Company Limited. The cumulative three years inflation rate for Sudan exceeded 100% as of December 31, 2014, this, combined with other indicators, resulted Sudan being declared as hyperinflationary economy. The financial effect of hyperinflation as specified in International Accounting Standards IAS 29, Financial Reporting in Hyperinflationary Economies is not considered material in theses consolidated financial statements.
These consolidated financial statements were approved by the Board of Directors on 6 Jumada Al-Awal 1436H corresponding to 25 February 2015.
2) Summary of significant accounting policies
The principal accounting policies applied in the preparation of these consolidated financial statements are set out below. These policies have been consistently applied to all periods presented.
2. 1 Basis of preparation
The accompanying consolidated financial statements have been prepared under the historical cost convention on the accrual basis of accounting, and in compliance with accounting standards promulgated by Saudi Organization for Certified Public Accountants (“SOCPA”).
2. 2 Critical accounting estimates and judgments
The preparation of consolidated financial statements in conformity with generally accepted accounting principles requires the use of certain critical estimates and assumptions that affect the reported amounts of assets and liabilities and disclosure of contingent assets and liabilities at the reporting date and the reported amounts of revenues and expenses during the reporting period. Estimates and judgments are continually evaluated and are based on historical experience and other factors, including expectations of future events that are believed to be reasonable under the circumstances. The Group makes estimates and assumptions concerning the future. The resulting accounting estimates will, by definition, seldom equal the related actual results.
2. 3 Investments
(a) SubsidiariesSubsidiaries are entities over which the Group has the power to govern the financial and operating policies to obtain economic benefit generally accompanying a shareholding of more than one half of the voting rights. The existence and effect of potential voting rights that are currently exercisable or convertible are considered when assessing
whether the Group controls another entity. Subsidiaries are consolidated from the date on which control is transferred to the Group. They are de-consolidated from the date that control ceases. Investments in subsidiaries which are not considered as material to the consolidated financial statements are accounted for using the equity method of accounting and are initially recognized at cost.
The purchase method of accounting is used to account for the acquisition of subsidiaries. The cost of an acquisition is measured as the fair value of the assets given or liabilities incurred or assumed at the date of acquisition. The excess of the cost of acquisition over the fair value of the Group’s share of the identifiable net assets acquired is recorded as goodwill. Goodwill is tested annually for impairment and carried at cost, net of impairment losses, if any.
Where there is a change in the Company’s interest in a subsidiary without resulting in loss of control by the Company, the ownership percentage as of the date of preparation of the consolidated financial statements is used to compute the Company’s share and non-controlling interest share in the subsidiary's net assets, necessary reconciliations to determine the consolidated net income and the share of non-controlling interests in the subsidiary's net income, and no profit or loss is recognized as a result of the change in the controlling interest.
Inter-company transactions, balances and unrealized gains or losses on transactions between Group companies are eliminated. Accounting policies of subsidiaries have been changed where necessary to ensure consistency with the policies adopted by the Group.
(b) Associates and unconsolidated subsidiariesAssociates are entities over which the Group has significant influence, but not control, generally accompanying a shareholding of between 20% and 50% of the voting rights. Investments in associates and unconsolidated subsidiaries are accounted for using the equity method of accounting and are initially recognized at cost.
The Group’s share of its associates and unconsolidated subsidiaries’ post-acquisition income or losses is recognized in the consolidated income statement and its share of post-acquisition movements in reserves is recognized in reserves. The cumulative post-acquisition movements are adjusted against the carrying amount of the investment. When the Group’s share of losses in an associate equals or exceeds its interest in the associate, including any other unsecured receivables, the Group does not recognize further losses, unless it has incurred obligations or made payments on behalf of the associate.
Unrealized gains on transactions between the Group and its associates are eliminated to the extent of the Group’s interest in the associates.
2. 4 Segment reporting
(a) Business segmentA business segment is a group of assets, operations or entities:
(i) Engaged in revenue producing activities;
Notes to the consolidated financial statementsfor the year ended December 31, 2014(All amounts in Saudi Riyals unless otherwise stated)
63
(ii) Results of its operations are continuously analyzed by management in order to make decisions related to resource allocation and performance assessment; and
(iii) Financial information is separately available.
(b) Geographical segmentA geographical segment is a group of assets, operations or entities engaged in revenue producing activities within a particular economic environment that are subject to risks and returns different from those operating in other economic environments.
2. 5 Foreign currency translation
(a) Reporting currencyThese consolidated financial statements are presented in Saudi Riyals which is the reporting currency of the Company.
(b) Transactions and balancesForeign currency transactions are translated into Saudi Riyals using the exchange rates prevailing at the dates of the transactions. Foreign exchange gains and losses resulting from the settlement of such transactions and from the translation at the year-end exchange rates of monetary assets and liabilities denominated in foreign currencies are recognized in the consolidated income statement.
(c) Group companiesThe results and financial position of foreign subsidiaries and associates having reporting currencies other than Saudi Riyals are translated into Saudi Riyals as follows:
1. assets and liabilities for each balance sheet presented are translated at the closing exchange rate at the date of that balance sheet;
2. income and expenses for each income statement are translated at average exchange rates; and components of the equity accounts are translated at the exchange rates in effect at the dates the related items originated.
3. Cumulative adjustments resulting from the translations of the financial statements of foreign subsidiaries and associates into Saudi Riyals, if material, are reported as a separate component of equity.
Dividends received from an associate or a subsidiary is translated at the exchange rate in effect at the transaction date and related currency translation differences are realized in the consolidated income statement.
When an investment in a foreign subsidiary and an associate is partially disposed off or sold, currency translation differences that were recorded in equity are recognized in the consolidated income statement as part of gain or loss on disposal or sale.
2. 6 Cash and cash equivalents
Cash and cash equivalents include cash in hand and with banks and other short-term highly liquid investments with maturities of three months or less from the purchase date.
2. 7 Murabaha investments
Murabaha investments are short-term highly liquid investments with original maturities of three months or more but not more than one year from the purchase date. Commission income is recognized on an accrual basis using agreed commission rates.
2. 8 Accounts receivable
Accounts receivable are carried at original invoice amount less provision for doubtful debts. A provision against doubtful debts is established when there is objective evidence that the Group will not be able to collect all amounts due according to the original terms of the receivables. Such provisions are charged to the consolidated income statement, and reported under “Selling and marketing expenses”. When account receivable is uncollectible, it is written-off against the provision for doubtful debts. Any subsequent recoveries of amounts previously written-off are credited against “Selling and marketing expenses” in the consolidated income statement.
2. 9 Accrued revenue
Accrued revenue represents revenue earned but not yet billed at year-end. Such amounts will be billed in the subsequent period. These balances are currently included under accounts receivable.
2. 10 Inventories
Inventories are carried at the lower of cost or net realizable value. Cost is determined using the weighted average method. The cost of finished products include the cost of raw materials, labor and production overheads.
Net realizable value is the estimated selling price in the ordinary course of business, less the costs of completion and selling expenses.
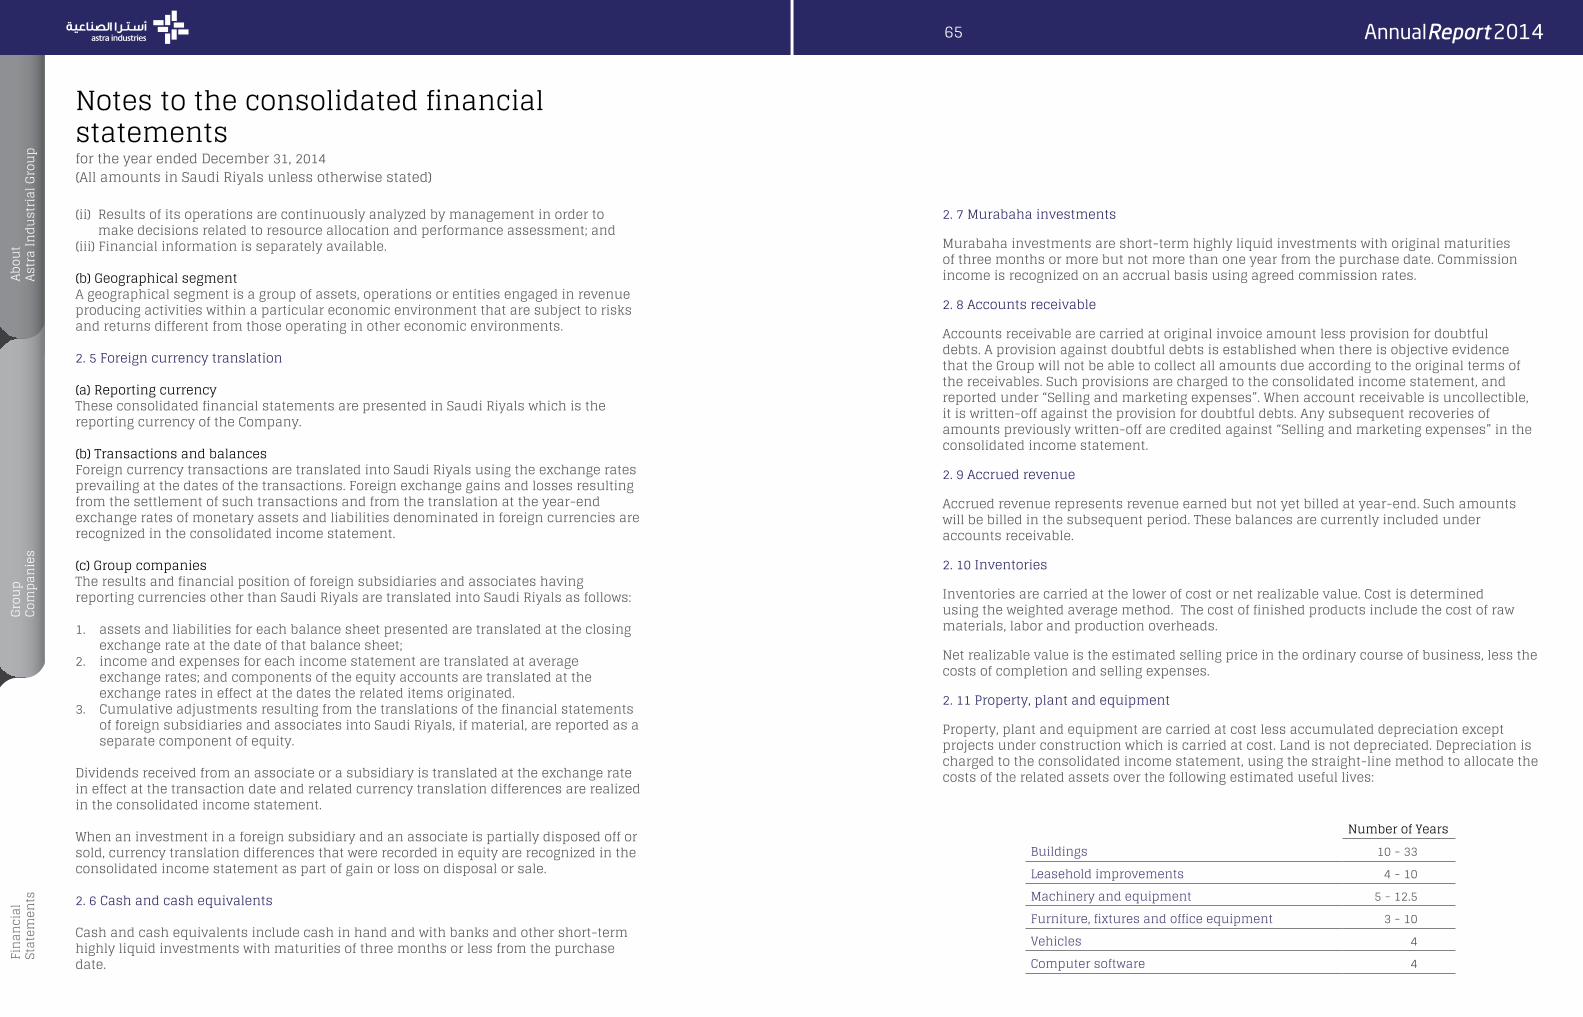
2. 11 Property, plant and equipment
Property, plant and equipment are carried at cost less accumulated depreciation except projects under construction which is carried at cost. Land is not depreciated. Depreciation is charged to the consolidated income statement, using the straight-line method to allocate the costs of the related assets over the following estimated useful lives:
Number of Years
Buildings 10 - 33
Leasehold improvements 4 - 10
Machinery and equipment 5 - 12.5
Furniture, fixtures and office equipment 3 - 10
Vehicles 4
Computer software 4
Notes to the consolidated financial statementsfor the year ended December 31, 2014(All amounts in Saudi Riyals unless otherwise stated)
65

Gains and losses on disposals are determined by comparing proceeds with carrying amount and are included in the consolidated income statement.
Maintenance and normal repairs which do not materially extend the estimated useful life of an asset are charged to the consolidated income statement, as and when incurred. Major renewals and improvements, if any, are capitalized and the assets so replaced are retired.
2. 12 Impairment of non-current assets
Non-current assets are reviewed for impairment whenever events or changes in circumstances indicate that the carrying amount may not be recoverable. An impairment loss is recognized for the amount by which the carrying amount of the asset exceeds its recoverable amount which is the higher of an asset’s fair value less cost to sell and value in use. For the purpose of assessing impairment, assets are grouped at lowest levels for which there are separately identifiable cash flows (cash-generating units). Goodwill is tested for impairment annually and other non-current assets that suffered impairment are reviewed for possible reversal of impairment at each reporting date. Where an impairment loss subsequently reverses other than of goodwill, the carrying amount of the asset or cash-generating unit is increased to the revised estimate of its recoverable amount, but the increased carrying amount should not exceed the carrying amount that would have been determined, had no impairment loss been recognized for the assets or cash-generating unit in prior years. A reversal of an impairment loss is recognized as income immediately in the consolidated income statement.
2. 13 Intangible assets
Intangible assets, apart from goodwill, represent registration and license fees and are amortized on a straight-line method over a period of 5 years.
2. 14 Borrowings
Borrowings are recognized at the proceeds received, net of transaction costs incurred, if any. Borrowing costs that are directly attributable to the acquisition, construction or production of qualifying assets are capitalized as part of those assets. Other borrowing costs are charged to the consolidated income statement.
2. 15 End of service benefits
End of service benefits required by Saudi Labor and Workman Law are accrued by the Group and its Saudi subsidiaries and charged to the consolidated income statement. The liability is calculated; at the current value of the vested benefits to which the employee is entitled, should the employee leave at the consolidated balance sheet date. Termination payments are based on employees’ final salaries and allowances and their cumulative years of service, as stated in the laws of Saudi Arabia.
The foreign subsidiaries provide currently for employee termination and other benefits as required under the laws of their respective countries of domicile. There are no funded or unfunded benefit plans established by the foreign subsidiaries.
2. 16 Accounts payable and accruals
Liabilities are recognized for amounts to be paid for goods and services received, whether or not billed to the Group.
2. 17 Zakat and taxes
In accordance with the regulations of the Department of Zakat and Income Tax (“DZIT”), the Group is subject to zakat attributable to the Saudi shareholders and to income tax attributable to the foreign shareholders. Provisions for zakat and income tax are charged to the equity accounts of the Saudi and the foreign shareholders, respectively. Additional amounts payable, if any, at the finalization of final assessments are accounted for when such amounts are determined. For subsidiaries outside the Kingdom of Saudi Arabia, provision for income tax is computed in accordance with tax regulations as applicable in the respective countries, if required, and charged to the consolidated income statement.
Deferred income taxes are recognized on all major temporary differences between financial income and taxable income during the year in which such differences arise, and are adjusted when related temporary differences are reversed. Deferred income tax assets on carry forward losses are recognized to the extent that it is probable that future taxable income will be available against which such carry-forward tax losses can be utilized. Deferred income taxes are determined using tax rates which have been enacted by the consolidated balance sheet date and are expected to apply when the related deferred income tax asset is realized or the deferred income tax liability is settled. Deferred income taxes arising out of such temporary differences were not significant and, accordingly, were not recorded at year end.
The Group and its Saudi Arabian subsidiaries withhold taxes on certain transactions with non-resident parties in the Kingdom of Saudi Arabia as required under Saudi Arabian Income Tax Law.
2. 18 Provisions
Provisions are recognized when; the Group has a present legal or constructive obligation as a result of a past event; it is probable that an outflow of resources will be required to settle the obligation; and the amount can be reliably estimated.
2. 19 Revenue recognition
Revenues are recognized upon delivery of products and customer acceptance, if any, or on the performance of services. Revenues are shown net of trade or quantity discounts, if any, and after eliminating sales within the Group. Royalty income is recognized on an accrual basis in accordance with the substance of agreements.
Contract revenues are recognized using the percentage of completion method. The percentage of completion is determined by comparison of contract cost incurred to date with the total estimated cost for the contract. Changes in cost estimates and losses on uncompleted contracts, if any, are recognized in the period they are determined. When it
Notes to the consolidated financial statementsfor the year ended December 31, 2014(All amounts in Saudi Riyals unless otherwise stated)
67

is probable that the total contract costs will exceed the total contract revenues, the expected loss is recognized immediately. Costs and estimated earnings in excess of billing, if any, are included in the current assets. However, billing in excess of costs incurred and estimated earnings, if any, are included in current liabilities.
2. 20 Selling, marketing, general and administrative expenses
Selling, marketing, general and administrative expenses include direct and indirect costs not specifically part of production costs as required under generally accepted accounting principles. Allocations between selling, marketing and general and administrative expenses and cost of revenues, when required, are made on a consistent basis.
2. 21 Research and development costs
Research and development costs are charged to the consolidated income statement in the period in which they are incurred.
2. 22 Operating leases
Rental expenses under operating leases are charged to the consolidated income statement over the period of the respective lease.
2. 23 Dividends
Dividends are recorded in the consolidated financial statements in the period in which they are approved by the shareholders of the Company.
2. 24 Earnings per share
Earnings per share for the year ended December 31, 2014 and 2013 have been computed by dividing the income from main operations and net income for each year by weighted average number of shares outstanding during such years.
2. 25 Reclassifications
Certain reclassifications have been made in the comparatives to confirm current year presentation.
3) Financial instruments and risk management
The Group’s activities expose it to a variety of financial risks: market risk (including currency risk, fair value and cash flows interest rate risks and price risk), credit risk and liquidity risk. The Group’s overall risk management program focuses on the unpredictability of financial markets and seeks to minimize potential adverse effects on the Group’s financial performance.
Risk management is carried out by senior management. The most important types of risks are summarized below.
Financial instruments carried on the consolidated balance sheet include cash and cash equivalents, accounts receivable, investments in unconsolidated subsidiaries and associates, murabaha and tawaroq facilities, long-term loan, notes payable and accounts payable. The particular recognition methods adopted are disclosed in the individual policy statements associated with each item.
Financial asset and liability is offset and net amounts reported in the consolidated financial statements, when the Group has a legally enforceable right to set off the recognized amounts and intends either to settle on a net basis, or to realize the asset and liability simultaneously.
3. 1 Currency risk
Currency risk is the risk that the value of a financial instrument will fluctuate due to changes in foreign exchange rates. The Group’s transactions are principally in Saudi Riyals, US dollars, Turkish Lyra, Euro, UAE Dirham, Jordanian Dinar, Egyptian Pound and Sudanese Pound.
The Group operates internationally and is exposed to foreign exchange risk arising from various currency exposures. The Group also has investments in foreign subsidiaries and associates, whose net assets are exposed to currency translation risk. Currently, such exposures are mainly related to exchange rate movements between Saudi Riyals against Sudanese Pound, Turkish Lyra, Jordanian Dinar and other. Such exposures are recorded as a separate component of shareholders’ equity in the accompanying consolidated financial statements.
3. 2 Fair value and cash flows interest rate risks
Fair value and cash flow interest rate risks are the exposures to various risks associated with the effect of fluctuations in the prevailing interest rates on the Group’s financial positions and cash flows. The Group’s interest rate risks arise mainly from its murabaha and tawaroq facilities and long term loans which are at floating rate of interest and are subject to repricing on a regular basis.
3. 3 Price risk
The risk that the value of a financial instrument will fluctuate as a result of changes in
Notes to the consolidated financial statementsfor the year ended December 31, 2014(All amounts in Saudi Riyals unless otherwise stated)
69

market prices, whether those changes are caused by factors specific to the individual instrument or its issuer or factors affecting all instruments traded in the market. The Group is currently not exposed to price risk.
3. 4 Credit risk
Credit risk is the risk that one party to a financial instrument will fail to discharge an obligation and cause the other party to incur a financial loss. Cash is placed with banks with sound credit ratings. Accounts receivable are carried net of provision for doubtful debts.
3. 5 Liquidity risk
Liquidity risk is the risk that an enterprise will encounter difficulty in raising funds to meet commitments associated with financial instruments. Liquidity risk may result from an inability to sell a financial asset quickly at an amount close to its fair value. Liquidity risk is managed by monitoring on a regular basis that sufficient funds are available through committed credit facilities to meet any future commitments.
3. 6 Fair value
Fair value is the amount for which an asset could be exchanged, or a liability settled between knowledgeable willing parties in an arm’s length transaction. As the Group's financial instruments are compiled under the historical cost convention, differences can arise between the book values and fair value estimates. Management believes that the fair values of the Group's financial assets and liabilities are not materially different from their carrying values.
4) Cash and cash equivalents
2014 2013
Cash at banks 205,282,002 195,891,454
Cash in hand 2,425,827 1,429,082
207,707,829 197,320,536
5) Accounts receivable
2014 2013
Accounts receivable – trade 1,064,205,658 979,576,548
Unbilled revenue 17,612,744 55,113,991
1,081,818,402 1,034,690,539
Less: Provision for doubtful debts (35,686,332) (28,984,517)
1,046,132,070 1,005,706,022
6) Inventories
2014 2013
Raw and packing materials 384,005,197 433,717,432
Finished goods 276,694,715 294,278,813
Work-in-process 26,514,193 22,870,222
Goods in transit 11,830,932 3,202,732
Spare parts and consumables (held not for sale) 40,091,573 42,511,634
739,136,610 796,580,833
Less: Provision for obsolete and slow moving inventories (20,069,894) (8,402,955)
719,066,716 788,177,878
7) Prepayments and other current assets
2014 2013
Advances to suppliers 103,480,407 130,702,789
Prepaid expenses 48,087,343 49,515,095
Employees' receivables 14,977,371 13,279,274
Refundable deposits and insurance claims 21,879,531 4,967,369
Value added tax and others 10,833,574 10,241,733
199,258,226 208,706,260
8) Investment in unconsolidated subsidiaries and associates
Ownership interest
2014 2013
Unconsolidated subsidiaries:
Tabuk Poland Limited - Poland 100% 100%
Tabugen France - France 100% 100%
Tabuk Czech s.r.o - Czech Republic 100% 100%
Ownership interest
2014 2013
Associates:
Mastra Agricultural Company - Egypt 49% 49%
Astra Agricultural Company Ltd. - Republic of Yemen 49% 49%
Notes to the consolidated financial statementsfor the year ended December 31, 2014(All amounts in Saudi Riyals unless otherwise stated)
71
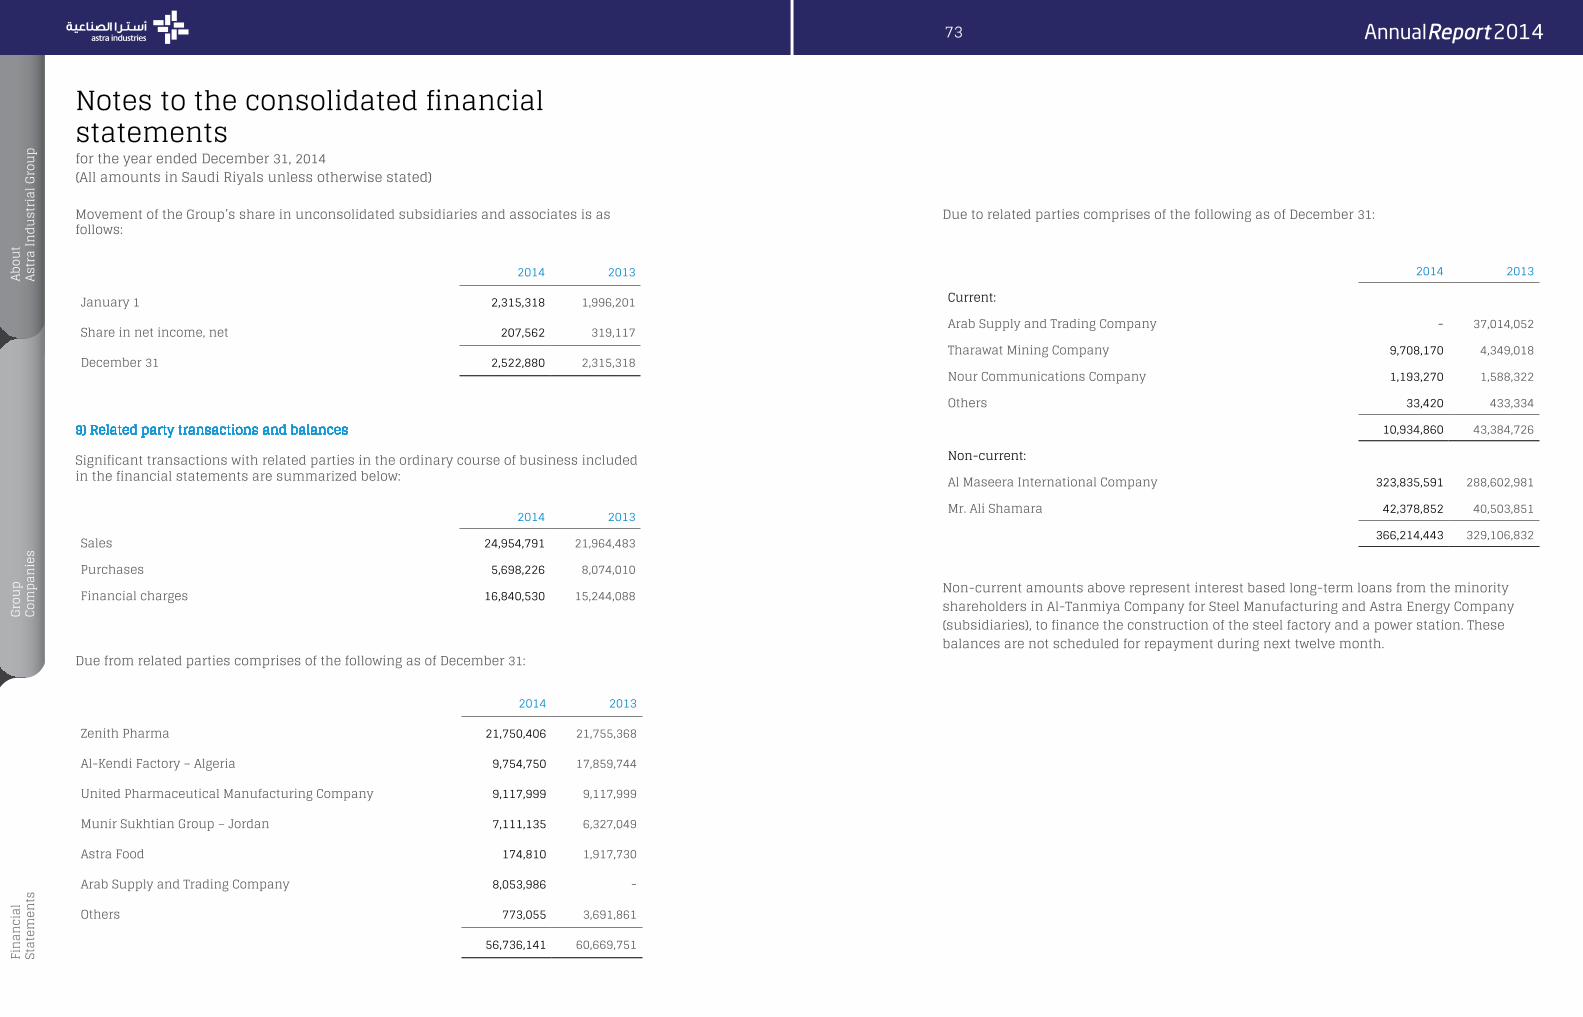
Movement of the Group’s share in unconsolidated subsidiaries and associates is as follows:
2014 2013
January 1 2,315,318 1,996,201
Share in net income, net 207,562 319,117
December 31 2,522,880 2,315,318
9) Related party transactions and balances
Significant transactions with related parties in the ordinary course of business included in the financial statements are summarized below:
2014 2013
Sales 24,954,791 21,964,483
Purchases 5,698,226 8,074,010
Financial charges 16,840,530 15,244,088
Due from related parties comprises of the following as of December 31:
2014 2013
Zenith Pharma 21,750,406 21,755,368
Al-Kendi Factory – Algeria 9,754,750 17,859,744
United Pharmaceutical Manufacturing Company 9,117,999 9,117,999
Munir Sukhtian Group – Jordan 7,111,135 6,327,049
Astra Food 174,810 1,917,730
Arab Supply and Trading Company 8,053,986 -
Others 773,055 3,691,861
56,736,141 60,669,751
Due to related parties comprises of the following as of December 31:
2014 2013
Current:
Arab Supply and Trading Company - 37,014,052
Tharawat Mining Company 9,708,170 4,349,018
Nour Communications Company 1,193,270 1,588,322
Others 33,420 433,334
10,934,860 43,384,726
Non-current:
Al Maseera International Company 323,835,591 288,602,981
Mr. Ali Shamara 42,378,852 40,503,851
366,214,443 329,106,832
Non-current amounts above represent interest based long-term loans from the minority shareholders in Al-Tanmiya Company for Steel Manufacturing and Astra Energy Company (subsidiaries), to finance the construction of the steel factory and a power station. These balances are not scheduled for repayment during next twelve month.
Notes to the consolidated financial statementsfor the year ended December 31, 2014(All amounts in Saudi Riyals unless otherwise stated)
73

10) Property, plant and equipment
Land andbuildings
Machinery andequipment
Furniture,fixtures
and officeequipment Vehicles
Projects underconstruction
Total2014
Total2013
Cost
January 1 342,271,857 1,009,620,609 52,421,360 33,407,790 222,062,900 1,659,784,516 1,429,209,733
Additions 20,144,807 87,811,842 7,762,015 8,516,534 123,428,866 247,664,064 236,166,567
Disposals / transfers - - (1,573,224) (1,262,846) (24,932,872) (27,768,942) (5,591,784)
December 31 362,416,664 1,097,432,451 58,610,151 40,661,478 320,558,894 1,879,679,638 1,659,784,516
Accumulated depreciation
January 1 68,940,364 208,399,159 33,829,641 22,786,765 - 333,955,929 282,420,433
Charge for the year 12,258,469 87,577,450 4,855,439 6,545,561 - 111,236,919 52,627,485
Disposals - (2,967,373) (387,534) (790,856) - (4,145,763) (1,091,989)
December 31 81,198,833 293,009,236 38,297,546 28,541,470 - 441,047,085 333,955,929
Net book value
December 31, 2014 281,217,831 804,423,215 20,312,605 12,120,008 320,558,894 1,438,632,553
December 31, 2013 273,331,493 801,221,450 18,591,719 10,621,025 222,062,900 1,325,828,587
Some of the buildings and plant facilities of the Company’s subsidiaries are constructed on land leased under various operating lease agreements at nominal annual rent under renewable operating leases. Projects under constructions mainly represents the expansion of existing plants and new projects.
Land and buildings include net book value of leasehold building improvements amounting to Saudi Riyal 2.8 million ( 2013: Saudi Riyal 3.9 million).
Last year, mainly in fourth quarter, buildings of Saudi Riyal 111 million and machinery and equipment of Saudi Riyal 586 million transferred from projects under constructions, which resulted additional depreciation charge for the current year.
Notes to the consolidated financial statementsfor the year ended December 31, 2014(All amounts in Saudi Riyals unless otherwise stated)
75

11) Goodwill
The recoverable amount of goodwill is determined based on fair value calculations. These calculations use cash flow projections based on financial budgets approved by management covering a five year period.
The key assumptions used for fair value calculations are as follows:
1. Budgeted gross margin.2. Weighted average growth rate 3. Discount rate applied to the cash flow projections.
Management determined budgeted gross margin and weighted average growth rates based on past performance and its expectations of market development. The discount rates used are pre-zakat and pre-income tax reflecting specific risks relating to the industry. The results of impairment test at year end indicated no impairment charge. Goodwill is primarily related to Power & Steel and Chemical business segments.
12) Intangible assets, net
2014 2013
Cost:
January 1 24,225,274 20,637,607
Additions 8,387,426 3,739,769
Disposals - (152,102)
December 31 32,612,700 24,225,274
Accumulated amortization:
January 1 11,487,755 5,433,726
Charge for the year 5,845,927 6,054,029
December 31 17,333,682 11,487,755
Net book value:
December 31 15,279,018 12,737,519
13) Murabaha and tawaroq facilities
The Group has bank facilities agreements in the form of murabaha, short-term tawaroq and other loans with banks to finance the Group companies’ ongoing funding needs of which Saudi Riyals 1.3 billion was utilized as of December 31, 2014 (December 31, 2013: Saudi Riyals 1.1 billion). The facilities are primarily denominated in Saudi Riyal, secured by corporate guarantees and bear to commission charges at agreed fixed rate plus Saudi Interbank Offered Rate (SIBOR). Borrowing cost of Saudi Riyals 5.9 million was capitalized during the year.
14) Accrued and other current liabilities
2014 2013
Accrued expenses 92,035,077 89,996,747
Employees’ benefits 52,599,666 60,532,847
Customers advances, retentions and sales commission 71,075,793 47,745,675
215,710,536 198,275,269
15) Provision for zakat and income tax
15.1 Components of zakat base
The Group’s Saudi Arabian subsidiaries file separate zakat and income tax declarations on an unconsolidated basis. The significant components of the zakat base of each company under zakat and income tax regulation are principally comprised of equity, provisions at the beginning of year and estimated taxable income, less deduction for the net book value of property, plant and equipment, investments and certain other items.
15.2 Provision for zakat and income tax
Movement for the year ended December 31, 2014: Zakat Income tax Total
January 1 30,719,484 4,173,786 34,893,270
Provision for the year, net 19,705,331 7,485,744 27,191,075
Payments (20,620,271) (4,518,358) (25,138,629)
December 31 29,804,544 7,141,172 36,945,716
Movement for the year ended December 31, 2013:
January 1 29,090,918 1,441,595 30,532,513
Provision for the year 19,424,914 10,507,586 29,932,500
Payments (17,796,348) (7,775,395) (25,571,743)
December 31 30,719,484 4,173,786 34,893,270
Notes to the consolidated financial statementsfor the year ended December 31, 2014(All amounts in Saudi Riyals unless otherwise stated)
77

15.3 Status of final assessments
The Company and its subsidiaries filed zakat/income tax returns for the years through December 31, 2013. The following are the final zakat and income tax assessments of the Company and its subsidiaries that have been agreed with the DZIT as of December 31, 2014:
Name of subsidiary/company Final zakat/ income tax
assessments up to
Astra Industrial Group Company 2004
Tabuk Pharmaceutical Manufacturing Company 2002
Astra Polymer Compounding Company Limited 2002
International Building Systems Factory Company Limited 2002
Astra Industrial Complex Ltd. for Fertilizers and Agrochemicals 2004
Astra Mining Company Limited Not yet issued
Astra Heavy Industries Factory Company Limited Not yet issued
16) End of service benefits
2014 2013
January 1 75,803,385 64,196,557
Provisions 20,571,598 22,012,467
Payments (7,361,829) (10,405,639)
December 31 89,013,154 75,803,385
17) Long-term borrowing
The Group has long-term Murabaha borrowings facility with bank to finance long term funding needs amounting to Saudi Riyal 800 million of which Saudi Riyal 50 million was utilized as of December 31, 2014 (2013: Nil).The facility is primarily denominated in Saudi Riyal, secured by corporate guarantees and bear to commission charges at agreed fixed rate plus SIBOR. The borrowings are repayable within six years by semi annual equal installments starting from the respective facility availed dates.
18) Share capital
The share capital of the Company as of December 31 was comprised of 74,117,647 shares stated at Saudi Riyals 10 per share owned as follows:
Shareholding
Shareholders 2014 2013
Saudi founding shareholders 57.57% 57.63%
Non-Saudi founding shareholders 11.11% 11.11%
Public 31.32% 31.26%
100.00% 100.00%
19) Statutory reserve
In accordance with the Regulations for Companies in Saudi Arabia and the Company’s By-laws, the Company has established a statutory reserve by the appropriation of 10% of net income until the reserve equals at least 50% of the share capital. The statutory reserve in the accompanying consolidated financial statements is the statutory reserve of the Company. This reserve is not available for dividend distribution.
20) Selling and marketing expenses
2014 2013
Employees' salaries and benefits 159,028,795 149,080,847
Marketing, advertising and promotions 97,508,778 78,263,655
Distribution, travel and freight charges 29,555,178 33,482,380
Doubtful receivables provision and written off 16,112,580 9,911,543
Expired and damaged inventory 16,690,475 5,809,291
Rent and utilities 7,658,654 7,810,845
Depreciation 4,217,838 3,444,929
Others 15,504,223 17,878,092
346,276,521 305,681,582
21) General and administrative expenses
2014 2013
Employees' salaries and benefits 105,165,979 104,988,600
Professional fees 18,983,953 22,081,962
Travel and transportation 8,510,149 14,682,359
Rent, Insurance and utilities 15,570,699 14,687,044
Depreciation and amortization 7,832,318 9,525,905
Repair and maintenance 3,478,746 2,610,960
Others 19,838,254 18,663,664
179,380,098 187,240,494
Notes to the consolidated financial statementsfor the year ended December 31, 2014(All amounts in Saudi Riyals unless otherwise stated)
79

22) Others, net
2014 2013
Toll manufacturing fee - 40,210,699
Investment income 3,391,908 14,676,420
Foreign exchange gain / loss (16,179,685) 2,685,212
Others, net 4,946,851 4,746,001
(7,840,926) 62,318,332
Others include net results of disposal of property, plant and equipment, sales of scrap materials and other miscellaneous items.
23) Earnings per share
Earnings per share for the years ended December 31, 2014 and 2013 have been computed by dividing the income from main operations and net income for each year by 74,117,647 shares outstanding during such years. 24) Segment information
The Group operates principally in the following major business segments:
• Pharmaceuticals; • Specialty Chemicals;• Steel Industries; and• Holding Company and other
Selected financial information of above segments is as follows:
2014 Pharmaceuticals Specialty
Chemicals Power and Steel
Industries
Holding Company and
other Total
Revenues:
Local 557,780,623 415,563,285 217,222,847 - 1,190,566,755
Export 368,213,870 171,243,993 188,781,863 - 728,239,726
Total 925,994,493 586,807,278 406,004,710 - 1,918,806,481
Gross profit(loss) 563,328,451 158,994,407 (117,689,725) - 604,633,133
Income (loss) from mainoperations 174,204,228 65,395,579 (160,452,476) (19,250,921) 59,896,410
2014 Pharmaceuticals Specialty
Chemicals Power and Steel
Industries
Holding Company and
other Total
Income (loss)before non-
controllinginterest 167,435,248 45,124,245 (177,969,719) (24,803,462) 9,786,312
Depreciation 17,255,844 14,967,979 77,622,373 1,390,723 111,236,919
Amortization 220,257 238,956 - 5,386,714 5,845,927
Property, plantand equipment 452,771,861 161,448,303 797,323,802 27,088,587 1,438,632,553
Capitalexpenditures 169,025,698 33,689,846 27,675,049 17,273,471 247,664,064
2013 Pharmaceuticals Specialty
Chemicals Power and Steel
Industries
Holding Company and
other Total
Revenues:
Local 577,315,852 384,989,140 307,282,014 - 1,269,587,006
Export 290,701,646 168,155,483 42,982,205 - 501,839,334
Total 868,017,498 553,144,623 350,264,219 - 1,771,426,340
Gross profit 517,838,811 139,061,788 26,906,060 - 683,806,659
Income (loss) from mainoperations 184,732,146 48,493,780 (35,427,527) (20,761,766) 177,036,633
Income (loss)before non-
controllinginterest 218,086,638 37,418,195 (34,940,891) (9,206,734) 211,357,208
Depreciation 13,666,334 15,726,014 21,826,013 1,409,124 52,627,485
Amortization 446,124 906,115 - 4,701,790 6,054,029
Property, plantand equipment 314,195,949 149,049,103 851,069,029 11,514,506 1,325,828,587
Capitalexpenditures 144,209,478 12,887,414 70,604,353 8,465,322 236,166,567
Notes to the consolidated financial statementsfor the year ended December 31, 2014(All amounts in Saudi Riyals unless otherwise stated)
81

The Group’s operations are conducted principally in Saudi Arabia, in addition to Iraq and other countries. Property, plant and equipment as at year end by geographic area, was as follows:
Saudi Arabia Iraq Other countries Total
2014 593,263,250 704,916,072 140,453,231 1,438,632,553
2013 465,413,738 754,720,281 105,694,568 1,325,828,587
More than 70% of the Group’s export sales are in the Middle East and North African (MENA) region.
Property, plant and equipment in Iraq is owned by the Group through its two subsidiaries, Al Inma’a Company and Astra Energy LLC., in which it holds 51% and 76% interest.
25) Dividends
The General Assembly of the shareholders approved in its meeting held on 29 Jumada’ II 1435H (April 29, 2014) the Company’s Board of Directors’ recommendation to distribute cash dividends amounting to Saudi Riyals 129,705,882 for the year ended December 31, 2013 of Saudi Riyals 1.75 for each outstanding share, which were fully paid during 2014.
26) Contingencies and commitments
At December 31, 2014, the Group had contingent liabilities arising in the normal course of business, in respect of letters of guarantee, amounting to Saudi Riyals 141 million (2013: Saudi Riyals 111 million) and letters of credit amounting to Saudi Riyals 80 million (2013: Saudi Riyals 56 million).
The Group in the normal course of business has entered into arrangements with suppliers for the purchase of machines and equipment and other services. The capital commitments at December 31, 2014 are amounting to Saudi Riyals 28 million (2013: Saudi Riyals 25 million).
DISCLAIMER:
The company has made every effort to ensure the accuracy of the information included in this annual report. However, the company does not guarantee the appropriateness, accuracy or usefulness regarding this information. The information in this annual report are not to solicit investors buy or sell the company’s securities The names and logos of the companies mentioned in the report are registered trademarks that are owned by the companies themselves. The use of these names and logos in this report should not be interpreted to mean that either Astra Industrial Group or its subsidiaries are affiliates of these companies or that these companies have endorsed or approved any statements made in this report.”
Notes to the consolidated financial statementsfor the year ended December 31, 2014(All amounts in Saudi Riyals unless otherwise stated)