2014-2015 Budget Presentation - Finance Committee - SD8 · 2014-2015 Budget School District No. 8...
38
2014-2015 Budget School District No. 8 (Kootenay Lake) By Kim Morris, Secretary Treasurer
Transcript of 2014-2015 Budget Presentation - Finance Committee - SD8 · 2014-2015 Budget School District No. 8...

2014-2015 BudgetSchool District No. 8 (Kootenay Lake)
By Kim Morris, Secretary Treasurer

Goals/Expectations
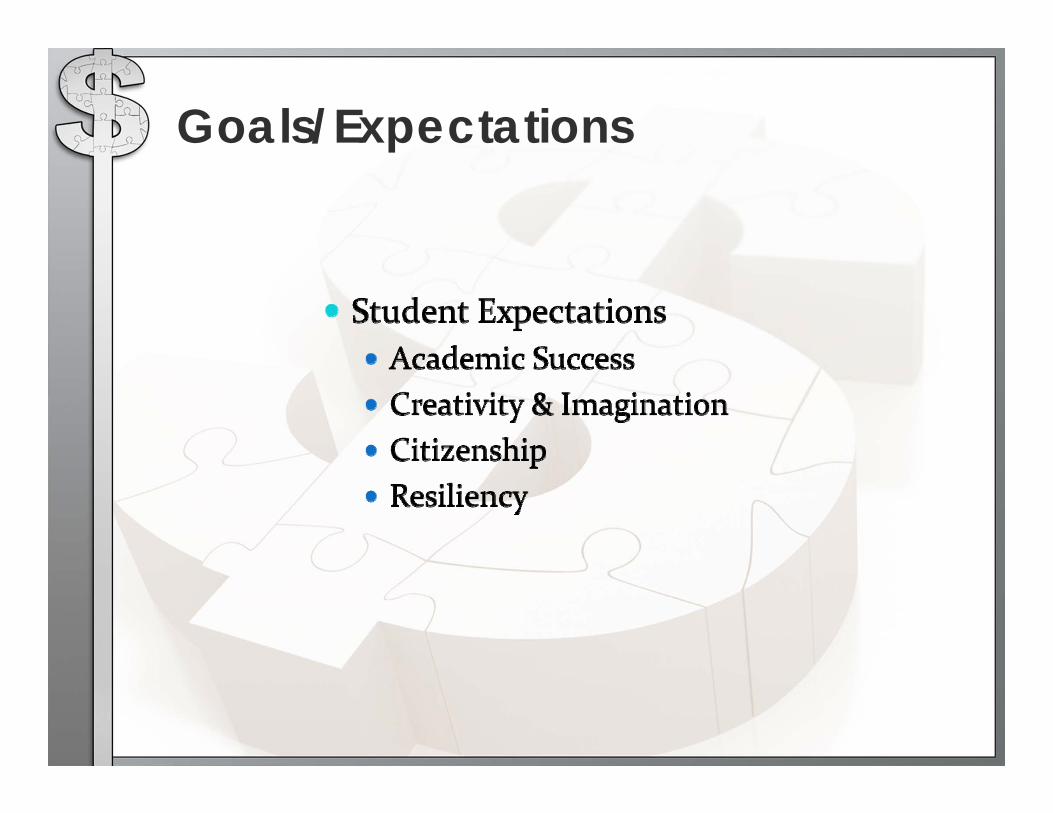
Goals/Expectations

Other Alignments
• District Goals
• Portfolio Strategic Plans
• Family of Schools Goals
• School Growth Plans
• Achievement Data Gaps

Process19‐Nov‐13 SBO 5:00 PM Regular Open Board Meeting Board
10‐Dec‐13 Creston 1:00 PM Finance Committee MeetingCommittee Members
10‐Dec‐13 Creston 5:00 PM Regular Open Board Meeting Board16‐Dec‐13 Invitations Distributed Partners/Public14‐Jan‐14 SBO 5:00 PM Regular Open Board Meeting Board28‐Jan‐14 Presentation Reminder Partners/Public
04‐Feb‐14 SBO 1:00 PM Finance Committee MeetingCommittee Members
04‐Feb‐14 SBO 5:00 PM Regular Open Board Meeting Board
Survey/Thought StreamPrincipals/Vice‐
Principals10‐Feb‐14 Enrolment Completed (all categories)11‐Feb‐14 SBO Principal/Vice‐Principal Meeting Staff/P‐VP's
11‐Feb‐14 TBA 4:30 PM Board Working Session ‐ Talking TablesPVP's/Sr
Mgmt/Trustees03‐Mar‐14 SBO 8:00 AM Senior Leadership Meeting Senior Staff04‐Mar‐14 Kaslo 11:00 AM Finance Committee Meeting04‐Mar‐14 Kaslo 5:00 PM Regular Open Board Meeting ‐ First Reading Board11‐Mar‐14 Principal/Vice‐Principal Meeting Staff/P‐VP's

Innovative Learning Services 2014/15 Achievement
Initiatives“The only way to improve learning is to improve instruction”
How the Best Performing School Systems Come out on TopMcKinsey et al, 2007

SD8 Model for Improving Student Learning
• Our model for adult learning is reflective of the dispersed nature of our district, and is based on the concept of building capacity over time and that the only way to improve learning is through educator professional learning. In our model, we:
• Base our learning initiatives on:• In‐depth analysis of our student learning data• Conversations with educators and others in our district• Current global and provincial trends in education• Trends in school growth plans• Expressions of interest by educators
• Set up learning networks that meet 4‐6 times per year, for .5 day at a time (generally afternoons).• Invest heavily in the development of our principals and vice principals as learning leaders.• Ask teachers to connect and share their learning (generally through the use of blogs) using SD8Learns.• Support teams of educators to events, such as FNESC or the Vulnerable Readers Summit, and then meet with them to debrief, pull out key learnings and find ways to share with the district.
• Support schools in such initiatives as book studies or other growth plan activities• Provide inquiry grants for teams of educators• Organize activities for professional development days

Where Are Our Kids Doing Well?
• Self Identified Aboriginal results continue to be very powerful (10‐40% higher than provincial average on some measures)
• Student results on Required Provincial Exams are at or above provincial average in almost all subjects.
• Apprenticeship and Workplace Math 10 results are exceptionally strong.
• We have very few true drop‐outs ‐‐many of the ones reported as non‐completers are international or exchange students
• Graduation Rates are high

What Can We Pay Attention To?
• Gender Gap –boys not performing as well as girls. • Higher order thinking skills • In language arts, our students struggle with reading and understanding Informational Text..
• Poverty – implications far beyond food and access to activities

More Things to Think About.
• Social/emotional issues –higher levels of anxiety, stress and depression among students.
• Aboriginal Learners – while our aboriginal learners are performing much better than their peers around the province, there is still a gap in many of our measures between aboriginal and non‐aboriginal learners.
• True non‐completers – drug/alcohol use, pregnancy, family dysfunction, transitions, low levels of school connectedness and lack of services for at‐risk youth.

How Do We Propose to Work on This?
Learning Networks
Leadership $24 500Inquiry/PBL $34 500Tech for Lng $36 500Capacity Bldg $44000Curriculum $47 000Total $186 500

Other Budget Allocations
• Ace It $20 000• District Pro‐D $20 000• Cultural Activities $27 500• Early Learning $300 000• Technology Evergreen $200 000• Innovative Practice Grants $30 000• Departmental Travel $10 000• Health Promoting Schools Coordinator $5000• SD8Learns Maintenance $10 000

CommunityLINK
• CommunityLINK is money that is targeted to support vulnerable learners, with the following taken into consideration:
• Money is targeted for nutrition, academic and behavioral/emotional support• It is expected that community partnerships be developed.
• Proposed Budget:•• School Meals $ 110 000• Read by Grade 3 $195 000• Reading Assessment (5/8) $20 000• Family of Schools (incl WEG) $240 685
• Total $565 685

Capacity Building & Training2014/15Independent Learning

2014/15 Initiatives
• Counsellors• EA training modules• PBS training and implementation for school teams

Counsellor Capacity Building
OVERVIEW• Kootenay Lake School district will continue to enhance the knowledge and expertise of our school counsellors with three Capacity Building Days during the 2014 – 2015 school year. This initiative will be a continuation of the three CBDs held during 2013 –2014.

Topics
• Attachment issues related to learning, school behavior and interpersonal relationships.• Attention Deficit Hyperactivity Disorder: Screening, support, and strategies for success.
• Difficult conversations: How to be empathetic and direct with students, parents and teachers

EA Training: Modules in Speech and Language
Overview• Module 1: Typical Sound Development and Strategies • Module 2: Complex Speech Disorders and Strategies • Module 3: Phonological Awareness Training and Strategies • Module 4: Language Support: Pronouns • Module 5: Language Support: Vocabulary Development • Module 6: Language Support: Basic Concepts and Following Directions

Positive Behavior Support Trainingfor School Teams
Overview• Understanding the essential elements of the three tiered approach and more in depth knowledge of tier ‐one the school wide system
• Understanding the relationship between RtI and PBS• Gaining the knowledge of benefits to the school, staff and students of implementing PBS.
• Developing the ability to use data for decision making in the area of social responsibility
• Understanding that the PBS approach is a framework and that many other evidence based and promising practices can be included within this framework.
• Understanding that PBS is a teaching approach to developing appropriate social skills and behavior. It is proactive, preventative and positive.
• Development of a tentative action plan to implement PBS

Research shows that PBS is associated with the following valued student outcomes:
• Decreases in externalizing problem behavior, such as defiance and impulsivity
• Decreases in internalizing behavior, such as anxiety and withdrawal • Increases in academic achievement scores *Increases in on‐task student behaviors
Mandt Training for School Teams
Overview• Mandt utilizes proactive, relational, and non‐physical and physical approaches, guided by a graded and gradual hierarchy of interventions to support the students, staff and the safety of the work environment.
• In order for people to be fully certified in Mandt staff are required to take two full days of training.
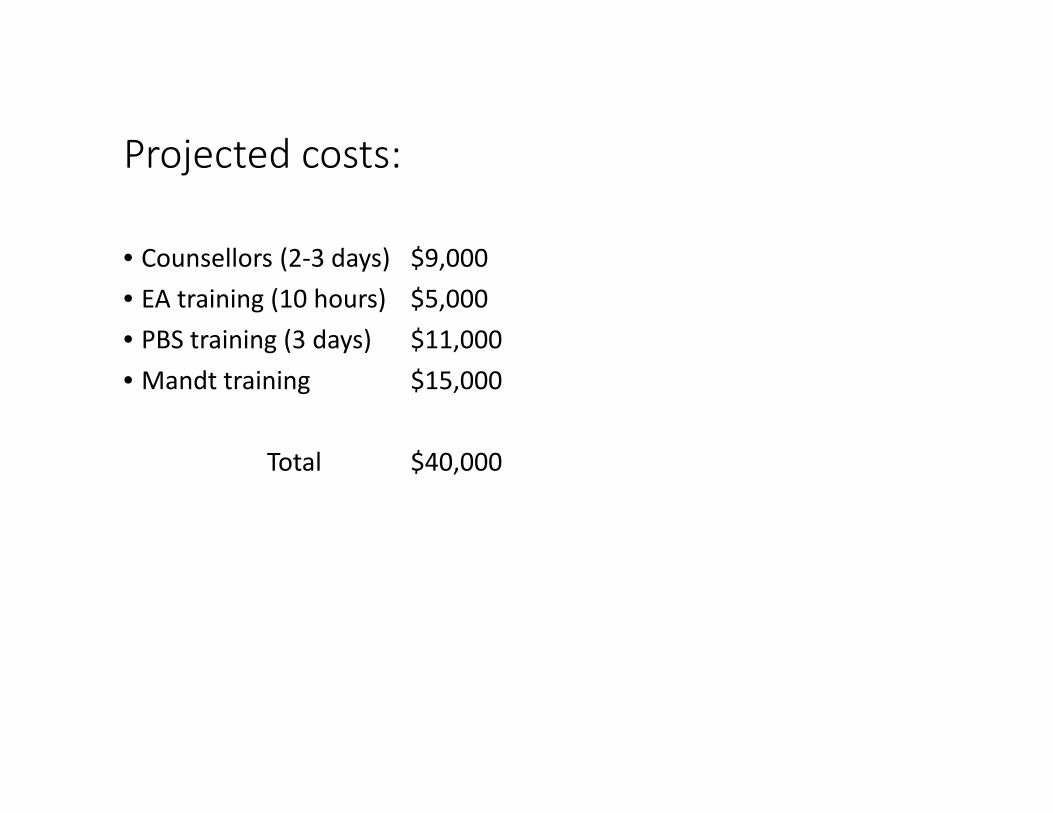
Projected costs:
• Counsellors (2‐3 days) $9,000• EA training (10 hours) $5,000• PBS training (3 days) $11,000• Mandt training $15,000
Total $40,000

• Thought Stream Process
• 289 people signed up
• 142 people shared a total of 1,168 individual “thoughts”
• 157 people assigned a total of 16,382 “stars”
Community & Stakeholder Input

2014-2015 Draft 2

• Based on February 15, 2014 enrolment submission to MOE
• Reduction of 155 student FTE as follows:
• 71.78 at traditional bricks and mortar schools• 83.38 in distributed learning
• Offset by projected adult FTE
Enrolment 2013-2014

• Operating Grant Estimated
• Minor Adjustments to Revenue; otherwise status quo
• Enrolment based on 3 Year Projection 14-15 Submitted February 2013
• Assumes Static MOE Funding Formula
• Expecting MOE Funding Announcement Mid-March
2014-2015 Draft 2Revenue

• Teacher Staffing: 245• +• 13-14 District Principal Converted • to Teacher Time (Independent Learning 1
• Total 246
• To be done:• Consult with PVP and Family of Schools around staffing needs• Will be team approach: Directors of HR, Innovative and Independent
Learning• Adjust FTE for decline in enrolment• Finalize returns from leave and leave requests
Staffing 2014-2015

• Education Assistants
• Based on Level 1/2/3 estimated enrolment
• Early learning EA’s moved from staffing to service & supplies
• Aboriginal Education Youth and Family workers 13-14 status quo
Staffing 2014-2015

• Principals / Vice-Principals
• Reduction of 1 District Principal (converted to teacher time)• Reduction of 1 VP (ARES)
• Reduction of FTE and $$ to reflect special purpose funding for some PVP time (status quo 13-14)
• In the wish list senior staff contemplates VP’s in each school to:• Build capacity• Potentially reduce costs (TIC/TOC)• Free up Principals to further lead learning• Succession planning
• Draft 3 will have detail
Staffing 2014-2015

• Clerical
• Formula applied to all schools:• Increases traditional/bricks and mortar which were reduced in 13-14• Significant decrease in DL staffing
• First time the formula has been applied to DL schools
• Needs more conversation to understand impacts• Gives us a starting point – a pool of clerical hours to allocate
• Status quo 13-14 for Finance, HR, Independent Learning & Maintenance
Staffing 2014-2015

• MSP Increase – 4% of previous premium
• PEBT CUPE Decrease in Group Life, Extended Health• PEBT CUPE Increase in Dental
• Overall increase due to correction to teacher benefits cost
Benefits 2014-2015
2014-2015

• Only includes change to:
• Aboriginal Education to match funding
• ELL to match funding
• School allocation budgets to reflect 13-14 Status quo school allocation calculated using 14-15 enrolment projections
• All other contemplations regarding increases or decreases are included on the “wish list”
Services & Supplies 2014-2015

• Independent Learning $152,000
• Benefits $172,000
• Maintains reserve of $500,000
Contingencies 2014-2015

• Status quo independent and innovative learning initiatives included
• Additions to initiatives included in wish list
• Stakeholder presentations in wish list
Other 2014-2015

• Enrolment Down 147 FTE
• Revenue Down $2,049,838
• Expenses Down $631,747
• Shortfall $1,418,091
Draft 2 Summary 2014-2015

Next Steps• Consultation with Family of Schools to organize for learning• 2013-2014 Investment in Learning Initiatives – A Year in Review• Thought Stream for further prioritization/engagement?• Funding announcement• Finalize staffing• Fine tune teacher average salary calculations• School Allocation Model Change• Continue to Monitor CUPE Savings plan• Superintendent’s Recommendations• Be aware of shifting sands: Stay of court ruling, potential
increase to wages, funding formula

Questions?

THANK YOU