
2013_bb_annual_report
102
-
Upload
brittany-hobson-gba -
Category
Documents
-
view
119 -
download
0
Transcript of 2013_bb_annual_report

Corporate Offices220 South Ridgewood AvenueDaytona Beach, Florida 32114(386) 252-9601
655 North Franklin StreetSuite 1900Tampa, Florida 33602(813) 222-4100
Outside CounselHolland & Knight LLP100 North Tampa StreetSuite 4100Tampa, Florida 33602
Corporate Information and Shareholder ServicesThe Company has included, as Exhibits 31.1 and 31.2,and 32.1 and 32.2 to its Annual Report on Form 10-K forthe fiscal year 2013 filed with the Securities andExchange Commission, certificates of the ChiefExecutive Officer and Chief Financial Officer of theCompany certifying the quality of the Company’spublic disclosure. The Company has also submitted tothe New York Stock Exchange a certificate from itsChief Executive Officer certifying that he is not awareof any violation by the Company of New York StockExchange corporate governance listing standards.
A copy of the Company’s 2013 Annual Report on Form 10-K will be furnished without charge to anyshareholder who directs a request in writing to:
Corporate SecretaryBrown & Brown, Inc.655 North Franklin StreetSuite 1900Tampa, Florida 33602
A reasonable charge will be made for copies of theexhibits to the Form 10-K.
Annual MeetingThe Annual Meeting of Shareholders of Brown & Brown, Inc. will be held:
May 7, 20149:00 a.m. (EDT)The Shores Resort2637 South Atlantic AvenueDaytona Beach, Florida 32118
Transfer Agent and RegistrarAmerican Stock Transfer & Trust Company6201 15th AvenueBrooklyn, New York 11219(800) 937-5449email: [email protected]
Independent Registered Public Accounting FirmDeloitte & Touche LLPOne Independent DriveSuite 2801Jacksonville, Florida 32202
Stock ListingThe New York Stock Exchange Symbol: BRO
Approximate number of shareholders of record as ofFebruary 19, 2014, was 1,204. Closing price per shareon that date was $29.78.
Additional InformationInformation concerning the services of Brown & Brown, Inc., as well as access to currentfinancial releases, is available on the Internet. Brown & Brown’s address is www.bbinsurance.com.
Stock Price Range CashDividends per
High Low Common Share
2013
1st Quarter $ 32.08 $ 25.31 $ 0.09
2nd Quarter $ 33.24 $ 30.00 $ 0.09
3rd Quarter $ 35.13 $ 30.55 $ 0.09
4th Quarter $ 33.69 $ 27.76 $ 0.10
2012
1st Quarter $ 25.00 $ 21.85 $ 0.085
2nd Quarter $ 27.32 $ 23.42 $ 0.085
3rd Quarter $ 28.17 $ 24.71 $ 0.085
4th Quarter $ 27.31 $ 24.88 $ 0.09
Market Price of Common Stock
BROWN & BROWN, INC.
Shareholder Information
BRO
WN
& BR
OW
N, IN
C.
2013 A
NN
UA
L REPORT
BB_OUTSIDE_COVERS2_Layout 1 3/20/14 11:33 AM Page 1

Can any wave be too big?
BROWN & BROWN, INC. Ten-Year Financial Summary
(in thousands, except per share data, percentages and other information)
Year Ended December 31
2013 2012 2011 2010 2009 2008 2007 2006 2005 2004
REVENUESCommissions and fees $ 1,355,503 $ 1,189,081 $ 1,005,962 $ 966,917 $ 964,863 $ 965,983 $ 914,650 $ 864,663 $ 775,543 $ 638,267Investment income 638 797 1,267 1,326 1,161 6,079 30,494(1) 11,479 6,578 2,715Other income, net 7,138 10,154 6,313 5,249 1,853 5,492 14,523 1,862 3,686 5,952
Total revenues 1,363,279 1,200,032 1,013,542 973,492 967,877 977,554 959,667 878,004 785,807 646,934
EXPENSESEmployee compensation and benefits 683,000 608,506 508,675 487,820 484,680 485,783 444,101 404,891 374,943 314,221Non-cash stock-based compensation 22,603 15,865 11,194 6,845 7,358 7,314 5,667 5,416 3,337 2,625Other operating expenses 195,677 174,389 144,079 135,851 143,389 137,352 131,371 126,492 105,622 84,927Amortization 67,932 63,573 54,755 51,442 49,857 46,631 40,436 36,498 33,245 22,146Depreciation 17,485 15,373 12,392 12,639 13,240 13,286 12,763 11,309 10,061 8,910Interest 16,440 16,097 14,132 14,471 14,599 14,690 13,802 13,357 14,469 7,156Change in estimated acquisition earn-out payables 2,533 1,418 (2,206) (1,674) –––– –––– –––– –––– –––– ––––
Total expenses 1,005,670 895,221 743,021 707,394 713,123 705,056 648,140 597,963 541,677 439,985Income before income taxes 357,609 304,811 270,521 266,098 254,754 272,498 311,527 280,041 244,130 206,949Income taxes 140,497 120,766 106,526 104,346 101,460 106,374 120,568 107,691 93,579 78,106
Net Income $ 217,112 $ 184,045 $ 163,995 $ 161,752 $ 153,294 $ 166,124 $ 190,959 $ 172,350 $ 150,551 $ 128,843
Employee compensation and benefits as % of total revenue 50.1% 50.7% 50.2% 50.1% 50.1% 49.7% 46.3% 46.1% 47.7% 48.6%Other operating expenses as % of total revenue 14.4% 14.5% 14.2% 14.0% 14.8% 14.1% 13.7% 14.4% 13.4% 13.1%
EARNINGS PER SHARE INFORMATIONNet income per share – diluted $ 1.48 $ 1.26 $ 1.13 $ 1.12 $ 1.08 $ 1.17 $ 1.35 $ 1.22 $ 1.08 $ 0.93Weighted average number of shares outstanding – diluted 142,624 142,010 140,264 139,318 137,507 136,884 136,357 135,886 135,033 133,994Dividends paid per share $ 0.3700 $ 0.3450 $ 0.3250 $ 0.3125 $ 0.3025 $ 0.2850 $ 0.2500 $ 0.2100 $ 0.1700 $ 0.1450
YEAR-END FINANCIALPOSITIONTotal assets $ 3,649,508 $ 3,128,058 $ 2,607,011 $ 2,400,814 $ 2,224,226 $ 2,119,580 $ 1,960,659 $ 1,807,952 $ 1,608,660 $ 1,249,517Long-term debt $ 380,000 $ 450,000 $ 250,033 $ 250,067 $ 250,209 $ 253,616 $ 227,707 $ 226,252 $ 214,179 $ 227,063Total shareholders’ equity $ 2,007,141 $ 1,807,333 $ 1,643,963 $ 1,506,344 $ 1,369,874 $ 1,241,741 $ 1,097,458 $ 929,345 $ 764,344 $ 624,325Total shares outstanding 145,419 143,878 143,352 142,795 142,076 141,544 140,673 140,016 139,383 138,318
OTHERINFORMATIONNumber of full-time equivalent employees at year-end 6,992 6,438 5,557 5,286 5,206 5,398 5,047 4,733 4,540 3,960Total revenues per average number of employees (2) $ 203,020 $ 191,729 (3) $ 186,949 $ 185,568 $ 182,549 $ 187,181 $ 196,251 $ 189,368 $ 184,896 $ 173,046Stock price at year-end $ 31.39 $ 25.46 $ 22.63 $ 23.94 $ 17.97 $ 20.90 $ 23.50 $ 28.21 $ 30.54 $ 21.78Stock price earnings multiple at year-end (4) 21.2 20.2 20.0 21.4 16.6 17.9 17.4 23.1 28.3 23.4Return on beginning shareholders’ equity (5) 12% 11% 11% 12% 12% 15% 21% 23% 24% 26%
(1) Includes an $18,664 gain on the sale of our investment in Rock-Tenn Company.
(2) Represents total revenues divided by the average of the number of full-time equivalent employees at the beginning of the year and the number of full-time equivalent employees at the end of the year.
(3) Of the 881 increase in the number of full-time equivalent employees from 2011 to 2012, 523 employees related to the January 9, 2012 acquisition of Arrowhead, and therefore, are considered to be full-time equivalent as of January 1, 2012. Thus, the average number of full-time equivalent employees for 2012 is considered to be 6,259.
(4) Stock price at year-end divided by net income per share-diluted.
(5) Represents net income divided by total shareholders’ equity as of the beginning of the year.
All share and per-share information has been adjusted to give effect to the 2-for-1 common stock split which became effective November 29, 2005.
Weighted average number of shares outstanding-diluted has been adjusted to give effect for the two-class method of calculating earnings pershare as described in Note 1 to the Consolidated Financial Statements.
BB_INSIDE_COVERS2_REV-FINAL_Layout 1 3/19/14 5:56 PM Page 1
Can any wave be too big?
BROWN & BROWN, INC. Ten-Year Financial Summary
(in thousands, except per share data, percentages and other information)
Year Ended December 31
2013 2012 2011 2010 2009 2008 2007 2006 2005 2004
REVENUES
Commissions and fees $ 1,355,503 $ 1,189,081 $ 1,005,962 $ 966,917 $ 964,863 $ 965,983 $ 914,650 $ 864,663 $ 775,543 $ 638,267
Investment income 638 797 1,267 1,326 1,161 6,079 30,494(1) 11,479 6,578
2,715
Other income, net 7,138 10,154 6,313 5,249 1,853 5,492 14,523 1,862 3,686
5,952
Total revenues 1,363,279 1,200,032 1,013,542 973,492 967,877 977,554 959,667 878,004 785,807 646,934
EXPENSES
Employee compensation and benefits 683,000 608,506 508,675 487,820 484,680 485,783 444,101 404,891 374,943 314,221
Non?cash stock?based compensation 22,603 15,865 11,194 6,845 7,358 7,314 5,667 5,416 3,337 2,625
Other operating expenses 195,677 174,389 144,079 135,851 143,389 137,352 131,371 126,492 105,622 84,927
Amortization 67,932 63,573 54,755 51,442 49,857 46,631 40,436 36,498 33,245 22,146
Depreciation 17,485 15,373 12,392 12,639 13,240 13,286 12,763 11,309 10,061 8,910
Interest 16,440 16,097 14,132 14,471 14,599 14,690 13,802 13,357 14,469
7,156
Change in estimated acquisition earn?out payables 2,533 1,418 (2,206) (1,674) ———— ———— ———— ———— ———— ————
Total expenses 1,005,670 895,221 743,021 707,394 713,123 705,056 648,140 597,963 541,677 439,985
Income before income taxes 357,609 304,811 270,521 266,098 254,754 272,498 311,527 280,041 244,130 206,949
Income taxes 140,497 120,766 106,526 104,346 101,460 106,374 120,568 107,691 93,579 78,106
Net Income $ 217,112 $ 184,045 $ 163,995 $ 161,752 $ 153,294 $ 166,124 $ 190,959 $ 172,350 $ 150,551 $ 128,843
Employee compensation and benefits as % of total revenue 50.1% 50.7% 50.2% 50.1% 50.1% 49.7% 46.3% 46.1% 47.7% 48.6%
Other operating expenses as % of total revenue 14.4% 14.5% 14.2% 14.0% 14.8% 14.1% 13.7% 14.4% 13.4% 13.1%
EARNINGS PER SHARE INFORMATION
Net income per share — diluted $ 1.48 $ 1.26 $ 1.13 $ 1.12 $ 1.08 $ 1.17 $ 1.35 $ 1.22 $ 1.08 $ 0.93
Weighted average number of shares outstanding — diluted 142,624 142,010 140,264 139,318 137,507 136,884 136,357 135,886 135,033 133,994
Dividends paid per share $ 0.3700 $ 0.3450 $ 0.3250 $ 0.3125 $ 0.3025 $ 0.2850 $ 0.2500 $ 0.2100 $ 0.1700 $ 0.1450
YEAR?END FINANCIAL?POSITION
Total assets $ 3,649,508 $ 3,128,058 $ 2,607,011 $2,400,814 $2,224,226 $2,119,580 $1,960,659 $1,807,952 $1,608,660 $1,249,517
Long?term debt $ 380,000 $ 450,000 $ 250,033 $ 250,067 $ 250,209 $ 253,616 $ 227,707 $ 226,252 $ 214,179 $
227,063
Total shareholders? equity $ 2,007,141 $ 1,807,333 $ 1,643,963 $1,506,344 $1,369,874 $1,241,741 $1,097,458 $ 929,345 $ 764,344 $ 624,325
Total shares outstanding 145,419 143,878 143,352 142,795 142,076 141,544 140,673 140,016 139,383 138,318
OTHER?INFORMATION
Number of full?time equivalent employees at year?end 6,992 6,438 5,557 5,286 5,206 5,398 5,047 4,733 4,540 3,960
Total revenues per average number of employees(2) $ 203,020 $ 191,729 (3) $ 186,949 $ 185,568 $ 182,549 $ 187,181 $ 196,251 $ 189,368 $ 184,896 $ 173,046
Stock price at year?end $ 31.39 $ 25.46 $ 22.63 $ 23.94 $ 17.97 $ 20.90 $ 23.50 $ 28.21 $ 30.54 $ 21.78
Stock price earnings multiple at year?end(4) 21.2 20.2 20.0 21.4 16.6 17.9 17.4 23.1 28.3 23.4
Return on beginning shareholders? equity(5) 12% 11% 11% 12% 12% 15% 21% 23% 24% 26%
(1) Includes an $18,664 gain on the sale of our investment in Rock-Tenn Company.
(2) Represents total revenues divided by the average of the number of full-time equivalent employees at the beginning of the year and the number of full-time equivalent employees at the end of the year.
(3) Of the 881 increase in the number of full-time equivalent employees from 2011 to 2012, 523 employees related to the January 9, 2012 acquisition of Arrowhead, and therefore, are considered to be full-time equivalent as of January 1, 2012. Thus, the average number of full-time equivalent employees for 2012 is considered to be 6,259.
(4) Stock price at year-end divided by net income per share-diluted.
(5) Represents net income divided by total shareholders’ equity as of the beginning of the year.
All share and per-share information has been adjusted to give effect to the 2-for-1 common stock split which became effective November 29, 2005.
Weighted average number of shares outstanding-diluted has been adjusted to give effect for the two-class method of calculating earnings pershare as described in Note 1 to the Consolidated Financial Statements.
Inside Cover_Layout 1 3/20/14 2:59 PM Page 1

Whenever we as humans have reached a new height of achievement in any endeavorand it appears as though a boundary has been drawn in the sand, always... always...
there is an intrepid explorer or artist or athlete or statesman or scientist who decides, at thatmoment, that he or she will break down that barrier and draw a new line in the sand.
Everything that has ever been done had never been done until somebody did it.
PAGE 3_Layout 1 3/20/14 3:00 PM Page 3

4
2013 was a barrier-breaking record year for our Company,with 13.6% revenue growth and 17.5% earnings per share(EPS) growth. We increased our dividends for thetwentieth consecutive year and our net income grew by$33.1 million to $217.1 million. We grew our corecommissions and fees revenue organically by 6.7% whichgenerated $75.6 million of new organic growth dollars - arecord for our firm and we believe a true testament to ourteam’s commitment to serving our clients.
None of this would be possible without our 6,992teammates across America and in Bermuda and London,who strive every day to deliver the best solutions for ourclients. To our teammates, I thank you for everything youdo for our team. Without your hard work and dedication,these results would be unattainable. I am very proud ofeach of you and am honored to work with you and for you.
This year witnessed the formation of the National RetailCouncil (NRC), a select group of 16 Retail Division leadersthrough whom all of our 104 retail offices report. Theintent of the NRC is to disperse oversight responsibilities
for Retail Division offices so that those in charge are fullyin touch with the enterprises they help to guide. Webelieve this leadership structure is the most conduciveto the enhancement of organic growth in our largestdivision. 2013 also marked significant growth in thisdivision, via our acquisition of Beecher Carlson Holdings,Inc., which brought us high-quality teammates, leadershipand business, and strengthened our large-accountcapabilities as well as adding to our programs managementand captive management operations in our NationalPrograms Division.
As we continue to evolve from a billion-dollar company toour next intermediate goal of “$2B,” we think aboutgrowing our business organically and profitably –increasing our free cash annually, recruiting, rewardingand protecting our teammates and investing in high-quality organizations that fit culturally. As we haveincreased revenues 35% over the past three years, wehave continued to focus on four operating principles thatwe believe are fundamental to our success:
MOUNT EVEREST
Dear Shareholders,
“I am very proud of each of you and am honored to work with you and for you.”
BB_2013AR_FINAL_3-98_Layout 1 3/18/14 2:26 PM Page 4

5
1) Strive to do what is in our clients’ best interestseach and every time;
2) Recruit, reward, and enhance the best people for the Brown & Brown team;
3) Work closely with our carrier partners to provide optimal solutions to our clients; and
4) Support the communities that we serve.
To our shareholders, although we are measured by a 13-week scorecard each quarter, we think about our cultureand investments long-term. We appreciate your supportand interest in Brown & Brown. Please know we arecommitted to delivering profitable growth and generatingmore free cash to reinvest in our business. We willcontinue to work tirelessly to “break barriers” on behalfof our clients, and for the sake of you, our shareholders,as we move toward our intermediate goals and beyond.
Regards,
J. Powell Brown, CPCUPresident and Chief Executive Officer
It is the highest point on the Earth's surface, and until May 29, 1953 it had never felt the footsteps of human beings. On that day
Sir Edmund Hillary and his Sherpa guide Tenzing Norgay (shown to the left) reached the summit utilizing equipment that may
have been state-of-the-art at the time, but extremely rudimentary when compared to today's high-tech gear. Most importantly,
they broke a barrier and proved that humans could reach the top of the world.
BB_2013AR_FINAL_3-98_Layout 1 3/18/14 2:26 PM Page 5

6
BB_2013AR_FINAL_3-98_Layout 1 3/18/14 2:26 PM Page 6

7
On May 6th 1954, Roger Bannister did what no
human had ever done before: ran a mile in less
than four minutes, barely beating his main rival
John Landry. This was a barrier that seemed
unbreakable, through a century of trying and
through more than a dozen Olympics and
thousands of competitive track meets worldwide.
It all begins with the individual; whensomeone decides,
“I’m going to do that!”
From the ground up.One teammate at a time.
“I didn’t even know what insurance was.I was planning to go into law, but sawthe earning potential in the insuranceindustry. So, I checked it out. I actuallylearned about Brown & Brown frominterviewing with the competition. Atleast two other companies said theydidn’t offer training like B&B does. Istill thank them for helping memake my decision!”
– Jeffrey Harrison,originally from Marlton, NJ, now working in theFt. Lauderdale office.
BB_2013AR_FINAL_3-98_Layout 1 3/18/14 2:26 PM Page 7

8
“I studied risk management and insurance incollege at Ole Miss and interviewed with Brown &Brown at a career fair. The training B&B providesreally attracted me to the company. They arecommitted to helping me become moreknowledgeable and successful in my craft.”
– Hannah Parker, originally from Mobile, AL, now working in the Tampa office.
Kevin SteeleRocco DeVito
Alan Mong
Hannah ParkerClint Miller
Matt MontgomeryJeff Beal
BB_2013AR_FINAL_3-98_Layout 1 3/18/14 2:26 PM Page 8

9
At the end of the day, it is the one-to-one interactions between ourindividual team members and their clients that make thedifference—the meetings, the phone calls, the Tweets, texts andemails that take place virtually every minute of the day in the farcorners of our enterprises.
These touchpoints—too numerous to mention—are where webuild our company. We know and understand that. That’s why werecruit, train, nurture and reward the best and brightest in ourindustry. We find those individuals with the unique mixture ofbrains, ambition, instincts, savvy, people skills and commitment tocustomer satisfaction that it takes to be on our team. Then wetrain them at “Brown & Brown University”, an institutionwe believe to be “best-in-class” in our industry.
Brown & BrownUniversity FL #23 Class
Spencer Ely Annabelle Perez
Dylan Burns Neil Charley
Michael Boyer
Ricky Schwarz
Jeff Harrison
BB_2013AR_FINAL_3-98_Layout 1 3/18/14 2:26 PM Page 9

10
“This class doesn’t create talent, itidentifies it. Then it gives this talentstructure. With structure, our agentsgain the confidence required to succeed!”
– Tom Finwall, P&C Instructor,Brown & Brown University
BB_2013AR_FINAL_3-98_Layout 1 3/18/14 2:26 PM Page 10

11
“I was in elementaryeducation, teaching school,and I needed a betteropportunity to make moneyand provide for my family. Ispoke with several recruiters,but chose Brown & Brownbecause being 34 andstarting a new career I knewthat the path through Brown& Brown University was thebest in the business.”
– Kyle Bloemers,graduate of Hope Collegein Holland, MI, now working in the West Palm Beach office.
BB_2013AR_FINAL_3-98_Layout 1 3/18/14 2:27 PM Page 11

12
No one was entirely sure what would happen if a flying object moved faster than the speed
of sound. Flying a Bell X-1 Jet, 1947 Airforce Captain Chuck Yeager put all of those fears to
rest when he reached a top recorded speed of Mach 0.997 (339 m/s, 1,221 km/h), which
many believed actually exceeded Mach 1, a feat known as breaking the sound barrier.
The decentralized operational model fostered by Brown & Brown allows each of our local profit centers to
chart its own course and build its own success. Corporate leaders are there to provide guidance and
knowledge when asked, but we realize that the local team members live in their communities, know the
decision-makers, and understand the unique characteristics of people and businesses who live and work
there. That’s why it is important that we support local efforts, but not dictate a rigid corporate structure that
inhibits the personalized approach critical to success in each territory.
BB_2013AR_FINAL_3-98_Layout 1 3/19/14 5:42 PM Page 12

13
“I came in here with a law degree andnot one day of experience in theinsurance industry. But I waswelcomed as a member of this greatteam and have learned—and continueto learn—so much.”
– Angela Lopez,Operations Manager,Brown & Brown Insurance Servicesof California, Inc., Orange County;Anaheim, California
Sales contests are one way notonly to increase books ofbusiness but also to buildmorale and camaraderie. Herethe B&B Nevada team of(pictured left to right) MichaelEnzenbacher, Vice President –Las Vegas Division; BrianCruden, Executive VicePresident; and Charles Litwin,Underwriter-MarketingManager, go over details fortheir 2013 incentive trip.
BB_2013AR_FINAL_3-98_Layout 1 3/18/14 2:27 PM Page 13

14
Brown & Brown of Florida, Inc.
Daytona Beach, FL
The Daytona Beach team broke a significant barrier in 2013 by posting nearly $5 million in new business. Thesuccesses were a combination of aggressive new sales efforts and, perhaps most importantly, transforminglong-term relationships into new business. "We had growth from clients we have been servicing for 20 ormore years," explains Brian Lindahl, Senior Vice President – Daytona Beach Division. "It is a testament to thepeople here who, year in and year out, have provided such outstanding service to these important clients thatthey entrusted their new business opportunities to our team."
"Everybody stepped up to the plate," adds Alan Florez, Executive Vice President – Daytona Beach Division."This was a year where everything came together. We are fortunate to have a multitude of professionals whohave cultivated relationships that allow us to build a reputation in the marketplace. This puts us in a greatposition to seize the opportunities when they arise."
Vice President – Daytona Beach Division Tim Soriano adds to those sentiments. "It was a combination ofhard work, opportunities, discipline, leadership, camaraderie and competition. We literally have salescontests inside of sales contests, and this year it all paid off."
BB_2013AR_FINAL_3-98_Layout 1 3/18/14 2:27 PM Page 14

15
"Simply, it was teamwork. Everybody pulled together. It's about finding the best program for the client and then
providing the highest level of service. And it takes everyone on the team to make that happen."
– Julie Freidus, Vice President – Daytona Beach Division
Pictured below (left to right):Julie Freidus, Vice President – Daytona Beach Division;Tim Soriano, Vice President – Daytona Beach Division;Julie Young, Vice President/Marketing Manager –Daytona Beach Division; Brian Lindahl, Senior VicePresident – Daytona Beach Division; and Pam Thompson,Senior Vice President – Daytona Beach Division
BB_2013AR_FINAL_3-98_Layout 1 3/18/14 2:27 PM Page 15

16
According to Tim Casey, Executive Vice President of B&B in Orange County, the Southern Californiamarketplace is by far the most competitive he has experienced during his 13 years with the company. Overthe last seven years, the profit center has built a “dynamic team” of people from diverse walks of life and hasfostered an environment of trust and collaboration internally between departments. As a result, the profitcenter was able to break several barriers in 2013: $8.9 million in revenues, a 30% operating profit and morethan $1.1 million in new business.
Brown & Brown Insurance Servicesof California, Inc., Orange County
Anaheim, CA
BB_2013AR_FINAL_3-98_Layout 1 3/19/14 5:42 PM Page 16

17
“Our model is geared towardsdeveloping a business plan witha client and then executing thatplan. We believe the key tosuccess in keeping clients long-term is to outline goals andexpectations on an annual basisand to deliver results.”
– Tim Casey,Executive Vice President of Brown & Brown Insurance Services of California, Inc., Orange County
“A lot of agencies are driven byquoting. We don’t do that.Through our affiliation withBrown & Brown we have greatrelationships with carriers andwe work with them to developstrategies and tactics that getthe job done for our clients.”
– Allison Magda,Sales Manager
Pictured above (left to right):Allison Magda, Sales Manager; Angela Lopez, Operations Manager; Tim Casey, Executive Vice President; Nicole Skvarca, Regional Operations Supervisor; andHelen Vits, Employee Benefits Department Head of Sales
BB_2013AR_FINAL_3-98_Layout 1 3/18/14 2:27 PM Page 17

18
Brown & Brown Insurance of Nevada, Inc.
Las Vegas, NV
“It was our market dominanceas the state’s largest broker inthe health and welfare spaceplus B&B’s top ten position inthe brokerage business that gotus in the door. A major playerlike Wynn is not going to gowith a local yokel. But ourinternal talent is what closedthe deal.”
– Brian Cruden,Executive Vice President, Brown & Brown Insurance of Nevada, Inc.
BB_2013AR_FINAL_3-98_Layout 1 3/18/14 2:27 PM Page 18

19
The leadership team of B&B Las Vegas has only been in place since May of 2012, but it didn’t take them longto break a huge barrier and write the benefits program for Wynn Resorts, one of the Strip’s most iconicfixtures. It took a combination of local knowledge and hard work plus the power of the Brown & Brown nameto seal the deal.
Brian Cruden, Executive Vice President of Brown & Brown Insurance of Nevada, Inc., went on to point out thattheir approach included a total recalibration of the way Wynn approaches their health and welfare issues andthe creation of a business plan that addressed these challenges in innovative ways.
“We helped them re-engineer the way to think about human capital.It is about solutions, not price.”
Pictured below (left to right):Georges Maalouf, Executive Vice President – Las Vegas Division; Susan Coles, Operations Manager; Dave Lester, Vice President; Clara Cruden, Vice President Client Services; and Brian Cruden, Executive Vice President
BB_2013AR_FINAL_3-98_Layout 1 3/18/14 2:27 PM Page 19

20
The Infinite Barrier
Operators of the Hubble telescope recently aimed its lens at a dark spot in space known as
Abell 2744 and held it there. Days later, photos began to arrive, depicting the deepest-ever
observations of space. Residing within these deep fields were thousands of galaxies from
3.5 billion to more than 12 billion light years from earth.
It was, perhaps, the first impossible dream of early
humans; the ability to become a bird, to spread wings
and take to the sky. Of course, first with the hot air
balloon and later with the airplane, we were able to
shake loose the chains of gravity. But even the most
audacious dreamer would struggle to conceive that
one day we would glimpse galaxies billions of light-
years away.
The Hubble telescope is an inspiring symbol of the
power of dreams and the astonishing teamwork that it takes to achieve them. The world-changing success
of the Hubble consumes the talents, vision and dedication of thousands of people: from the metallurgists
who designed the tiniest bolts that hold the telescope together, to the chemists who created materials that
could withstand the rigors of space, to the programmers who devised the software, to the engineers and
scientists whose collective genius lifted this awesome device into space, to the operators and analysts who
follow and interpret its discoveries.
BB_2013AR_FINAL_3-98_Layout 1 3/18/14 2:27 PM Page 20

21
What you believe in is what you become.
Brown & Brown is committed to achieving new levels of customized client solutions and exemplary
customer service. It is not about big ideas. It is about hundreds of small ideas, manifesting themselves
every day between those we serve and those who serve them. To innovate. To experiment. To
occasionally fail. To ultimately succeed and rewrite history. This is a drive that propels great companies
to greater heights, and it is embedded in the culture of Brown & Brown Insurance. We refuse to be
ordinary. We reject those who say, “It can’t be done.” We are an “intra-preneurial” company comprised
of people who have built their businesses from the ground up.
And we BREAK BARRIERS every day.
Coalescing the individual and company strengthswith a vibrant, driven corporate culture.
BB_2013AR_FINAL_3-98_Layout 1 3/18/14 2:27 PM Page 21

22
Brown & Brown of Garden City, Inc.dba Sobel Affiliates
Garden City, NY
In 2004, the Sobel Affiliates agency broke the century barrier and celebrated its 100th Anniversary. Threeyears later Alan and Michael Labadorf, the great grandsons of the founder, decided to sell to Brown & Brown.The result? Greater growth and higher profitability than at any time in the company’s history—indeed a win-win for the agency and for B&B.
“It couldn’t have been a better fit,” says Neil Unger, Senior Vice President. “Other than some changes in oursystems, we are still managed by the same team, and we are allowed to do things our way. You couldn’t askmore from a merger.”
“When I first learned of the merger my initialthought was disappointment. I mean, it had beenrun by five generations of the same family. ButBrown & Brown helps you focus on positivechanges without getting in your way. These havemade us much stronger.”
– Gigi CabassoSenior Vice President
BB_2013AR_FINAL_3-98_Layout 1 3/18/14 2:27 PM Page 22

23
“It took a long time to get me to come tothe table. I didn’t want to sell and thenjust go off to Florida and play golf. TheBrown & Brown decentralized modelwhich encourages entrepreneurialinitiative clinched the deal for me. Itcould not have worked out better.”
– Michael LabadorfExecutive Vice President
“We have benefited from the bestpractices, depth of experience andwider strengths with carriers thatBrown & Brown brought to us. Andthen there is the whole culture. It ispositive, innovative and dynamic. Itwas the best decision we ever made.”
– Alan LabadorfManaging Director
BB_2013AR_FINAL_3-98_Layout 1 3/18/14 2:27 PM Page 23

24
Corporate culture —the sharing of values, vision, ethics and best practices— is a cornerstone of Brown &Brown’s success. Our decentralized operations model requires special efforts when previously independentfirms combine their expertise, reputations and teams to form a new and stronger Brown & Brownorganization. And by its very nature, the merger process creates cultural barriers that need to be broken down.
In Seattle, five different teams embarked on a shared journey to break down these barriers and build aunified commitment to core values. It began with a wedding cake, the layers of which eachrepresented one of the five merging entities. It went on to open discussion forums where teammatescould sort through anxieties, unknowns and corporate differences.
From there the process evolved into the creation of artwork denoting the combining of our sharedcultural values, the development of Vision Maps to clearly define the common direction, and other officedécor to promote our B&B culture. The very space in which the teams would work was designed aroundthe idea of working as teams in open and fluid spaces: low walls, lots of light, common spaces forteammates to work and gather together. A modern, fresh look and feel, attractive to new generations.
Brown & Brown of Washington, Inc.
Seattle, WA
“Each company came from high-walled cubes andoffices that tended to isolate team members from oneanother. We decided to position people by teams ofspecialty—no more walls—where they could shareinformation. We literally broke down barriers.”
– Christina Buchholz, Employee Benefits Leader
Pictured below (left to right): Karen Blonden, Accounting Leader; Ronaldo Manalo, Sales Leader;Sharon Deuman, Operations Director; Kelly Chavez, Benefits Operations Leader; Melanie VanGelder, Tribal Leader; Jeff Ogard, Personal Lines Leader; Tracy Johnson, Leadership Development;Christina Buchholz, Employee Benefits Leader; and Alex Bogaard, Executive Vice President.
BB_2013AR_FINAL_3-98_Layout 1 3/18/14 2:27 PM Page 24

25
“We came together, all of us, as a team to identify notwhat made us different, but rather our common valuesand aspirations. We each understand that our combinedand individual successes are based on the merits of ourchoices, dedication, attitudes, and performances. Weplay to win. When we don't, we work hard to improve.When we win, we celebrate the ‘we’. ”
– Alex Bogaard Executive Vice President of Brown & Brown of Washington, Inc.
“To promote teamwork, when Brown & Brown initiated the “InterZone Sales Contest”,we developed an intra-office contest for our people. We wanted them to have anopportunity to be rewarded for their efforts – just as we reward the Sales Team.”
– Tracy Johnson, Leadership Development (HR) Leader
Pictured above (left to right): Alex Bogaard, Tracy Johnson and Christina Buchholz.
BB_2013AR_FINAL_3-98_Layout 1 3/18/14 2:27 PM Page 25

26
Total revenues for 2013 were $728.3 million,a 13.0% increase over 2012.
53.4%$728.3
The
RETAIL DIVISION
CONTRIBUTION TO TOTAL REVENUES(dollars in millions)
CONTRIBUTION TO INCOME BEFORE INCOME TAXES
(dollars in millions)
46.5%$166.3
DIVISION TOTAL REVENUES(dollars in millions)
2009 2010 2011 2012 2013
583.4 575.1 607.2 644.4 728.3
DIVISION TOTAL REVENUES(dollars in millions)
RETAIL DIVISION OFFICE LOCATIONS
ArizonaArkansasCaliforniaColoradoConnecticutDelawareFloridaGeorgiaHawaiiIllinoisIndianaKentuckyLouisiana
MassachusettsMichiganMinnesotaMississippiNevadaNew HampshireNew JerseyNew MexicoNew YorkOhioOklahomaOregonPennsylvania
Rhode IslandSouth CarolinaTennesseeTexasVermontVirginiaWashingtonWisconsin
Outside USBermudaCayman Islands
BB_2013AR_FINAL_3-98_Layout 1 3/19/14 5:43 PM Page 26

27
During 2013 our 104 Retail profit centers, with 150+ locationsspread across 36 states and staffed by 3,500 + insuranceprofessionals, were responsible for generating 53.4% of Brown& Brown’s total revenues. Our core organic commissions andfees revenue grew each quarter (1.5% annualized), operatingprofit margin(1) increased by 20 basis points to 32.5%, andprofit-sharing contingent commissions and guaranteedsupplemental commissions (GSC) grew by 23.6%.
The principal categories of insurance we sell include propertyinsurance relating to physical damage to property andresultant interruption of business or extra expense caused byfire, windstorm or other perils; casualty insurance relating tolegal liabilities, workers’ compensation, and commercial andprivate passenger automobile coverages; and fidelity andsurety bonds. Additionally, we sell and service group andindividual life, accident, disability, health, hospitalization,medical and dental insurance.
A landmark strategic change was instituted by Retail DivisionPresident Charlie Lydecker in 2013, with the creation of theNational Retail Council (“NRC”). This 16-member group ofRetail leaders oversees all facets of recruitment, training,retention, sales and operations of every Retail profit center.Each office is the responsibility of one of the NRC membersthus offering significantly increased contact and guidance.Meeting as needed, but not less often than every 60 days, theNRC provides a forum for the sharing of ideas and solutionsacross the entire retail space, while also ensuring we have the“right people in the right seats” throughout the country.
We continue to seek out and attract the highest qualityindividuals as evidenced by the successes of our 177 newlyhired producers in our Property & Casualty and EmployeeBenefits ranks (excludes those producers joining us viaacquisition). Our pipeline of talent principally comes fromour close relationships with professors and counselors atseveral major universities. That talent is then systematicallydeveloped within Brown & Brown through our comprehensiveeducational and training network of “B&B University.” Thisrigorous two-year training program prepares graduates toexcel in the technical world of insurance intermediaries.
On July 1, 2013, we completed the largest acquisition in ourhistory with the purchase of the $106 million-revenue BeecherCarlson operations, headquartered in Atlanta, Georgia. Our newteammates’ sophisticated large-account focus is expected toprovide an excellent adjunct to many of our existing clients’expanding insurance requirements. The combination of BeecherCarlson’s unique analytical tools in the hands of its experiencedstaff and our current retail market presence creates a compellingopportunity. Regional Vice President and Profit Center LeaderSteve Denton’s position on the NRC will facilitate a rapid andeffective coalescing of these resources.
Healthcare coverage issues continue to be in the forefront of ourclients’ minds. B&B’s National Employee Benefits Committee,headed by Pattysue Rauh, CPA, remains committed to educatingour insurance professionals on all aspects of current regulationswhile closely monitoring pending legislation. The Brown &Brown Insurance Employee Benefits MarketplaceSM is a fullyoperational and extremely valuable healthcare exchange facilityfor the thousands of employees of our clients. The third annualcompany-wide Benefits Symposium, another opportunity forthe sharing of creative ideas amongst our Benefits professionals,who currently handle $225 million, or 31% of our annual Retailrevenue, will be held in April 2014.
A heightened focus on our insurance carrier partners hasalready been fostered through the formation of the NRC. EachNRC member has a defined geographic concentration whichenhances the ability of regional and national insurance carriersto target specific, common client needs. With decentralizationcontinuing to be our overarching mantra, we are now able tobe better understood and compensated by the insurancecarrier community.
(1) Income before income taxes plus interest expense, amortization, and change in estimated acquisition earn-out payables; divided by total revenues.
BB_2013AR_FINAL_3-98_Layout 1 3/19/14 5:43 PM Page 27

28
21.4%$292.1
Total revenues for 2013 were $292.1 million,a 15.5% increase over 2012.
The
NATIONAL PROGRAMS DIVISION
16.3%$58.4
DIVISION TOTAL REVENUES(dollars in millions)
2009 2010 2011 2012 2013
178.5 176.1 164.4 252.9 292.1
DIVISION TOTAL REVENUES(dollars in millions)
CONTRIBUTION TO TOTAL REVENUES(dollars in millions)
CONTRIBUTION TO INCOME BEFORE INCOME TAXES
(dollars in millions)
NATIONAL PROGRAMS DIVISIONOFFICE LOCATIONS
ArizonaCaliforniaColoradoFloridaGeorgiaIllinoisIndiana
KansasMichiganMinnesotaMissouriNew JerseyNew YorkOklahoma
OregonPennsylvaniaTexasUtahWashington
BB_2013AR_FINAL_3-98_Layout 1 3/19/14 5:44 PM Page 28

29
Our National Programs Division can be viewed as two broadgroups: Professional Programs and Property/CasualtyPrograms. This Division manages or administers more than 50different programs that provide a broad spectrum of insuranceproducts and services to our clients.
In most cases, the insurance carriers that underwrite theprograms have delegated underwriting and, in many instances,claims-handling authority to our programs operations. Theseprograms are generally distributed through nationwidenetworks of independent agents and offer targeted productsand services designed for specific industries, trade groups,professions, public entities and market niches. Basically, theycan be broken down into four categories:
1. Professional Programs 2. Commercial Programs3. Public Entity-Related Programs4. Arrowhead Insurance Group Programs
Professional Programs provides professional liability andrelated package insurance products for certain professionals.Professional Programs tailors insurance products to the needsof a particular professional group; negotiates policy forms andcoverage with an insurance company; and, in certain cases,secures the formal or informal endorsement of the product bya professional association or sponsoring company.
Professional groups that Professional Programs services includedentists, lawyers, accountants, optometrists, opticians,insurance agents, financial advisors, registered representatives,securities broker-dealers, benefit administrators, real estatebrokers, real estate title agents and escrow agents.
Commercial Programs markets targeted products and servicesto specific industries, trade groups, public and quasi-publicentities and market niches. Most of our special programs aremarketed and sold through independent agents, howeversome are marketed and sold directly to insured customers.
Public Entity-Related Programs focus on providing variousinsurance programs specifically for cities, municipalities,school boards and quasi-governmental agencies. Theseinsurance coverages can range from providing fully insuredprograms to establishing risk retention insurance pools toexcess and facultative specific coverages.
Arrowhead General Insurance Agency, Inc. (“Arrowhead”) isa national insurance program manager and one of the largestgeneral agents in the property and casualty insurance industryin the United States. Based in San Diego, California, Arrowheadacts as a “virtual insurer” by providing outsourced productdevelopment, marketing, underwriting, actuarial, complianceand claims and other administrative services for more than 20insurance carrier partners. While Arrowhead has fullunderwriting authority from its carrier partners, it does notassume any underwriting risk. Arrowhead also provides third-party claims administration services through its subsidiary,American Claims Management, Inc.
Brown & Brown has been in the program business since the1970’s, and today we are one of the largest program operatorsin the United States. At the start of 2000, the NationalPrograms Division’s total revenues were approximately $32.6million, or 13.7% of our consolidated revenues, whereas today,the Division’s total revenues are $292.1 million, or 21.4% of ourconsolidated revenues. We steadily grew the ProgramsDivision since 2000, both organically, as well as throughacquisitions, by attracting at least one program operator to joinus in eight of the last twelve years. We acquired Cal-Surancein 2002, our Washington State public entity pool manager in2003, Proctor Financial in 2004, and American Specialty in2005, and with our January 2012 acquisition of Arrowhead,we have fortified our position.
Other outstanding programs in this Division provide insurancecoverages and insurance solutions for: coastal and inland high-value condominiums and apartments; dry cleaners, linensupply and uniform rental companies; commercial and privateshippers for small packages and parcels; and clients inprofessional sports, motor sports, amateur sports and theentertainment industry.
BB_2013AR_FINAL_3-98_Layout 1 3/19/14 5:45 PM Page 29

CONTRIBUTION TO TOTAL REVENUES(dollars in millions)
CONTRIBUTION TO INCOME BEFORE INCOME TAXES
(dollars in millions)
15.4%$209.9
Total revenues for 2013 were $209.9 million,a 14.4% increase over 2012.
The
WHOLESALE BROKERAGE DIVISION
30
15.1%$53.8
DIVISION TOTAL REVENUES(dollars in millions)
2009 2010 2011 2012 2013
170.4 171.8 174.2 183.6 209.9
DIVISION TOTAL REVENUES(dollars in millions)
WHOLESALE BROKERAGE DIVISIONOFFICE LOCATIONS
CaliforniaColoradoFloridaGeorgiaHawaiiIllinoisLouisianaMaryland
MinnesotaMissouriMontanaNew JerseyNorth CarolinaOklahomaOregonPennsylvania
TexasVirginiaWashingtonWest Virginia
Outside USLondon, England
BB_2013AR_FINAL_3-98_Layout 1 3/18/14 2:27 PM Page 30

31
Our Wholesale Brokerage Division markets excess and surpluscommercial and personal insurance products to retail insuranceagencies, and reinsurance products and services to insurancecompanies throughout the United States. Our WholesaleBrokerage Division can be categorized into two broad groups:(1) Brokerage operations and (2) Binding Authority operations.
BROKERAGE OPERATIONSOur Brokerage operations represent various U.S. and U.K.surplus lines insurance companies, and certain of our officesare also Lloyd’s of London correspondents. Generally, ourbrokers focus on either property coverages or casualtycoverages, such as general liability, product liability orprofessional liability coverages.
BINDING AUTHORITY OPERATIONSOur Binding Authority operations represent admittedinsurance companies for smaller agencies that do nototherwise have access to certain insurance companyrepresentation. Our Binding Authority teams have contractswith specialty lines companies that give us the authority todirectly quote and issue policies. To be successful in thisbusiness, over a long period of time, we have to think likeinsurance company underwriters by understanding the risksand determining the appropriate premiums to be charged forsuch risks. It is our combined market product, expertise andquick turnaround times that enable us to meet our goal ofefficiently binding accounts with the best coverages and at themost competitive prices available.
The newest addition to our Binding Authority team is TexasSecurity General Agency, Inc. (“Texas Security”), who joinedus in September 2012. Texas Security is located in San Antonioand provides insurance services for over 2500 agents in thestate of Texas. At the time of the acquisition, 85% of TexasSecurity’s business was focused on providing E&S personallines coverage through multiple binding authority contracts,primarily via small premium transactions.
Since joining Brown & Brown, Texas Security has foundmultiple synergies that have allowed them to grow thecommercial lines segment of their business. Using marketsthat were made available to them after joining B&B, thecommercial lines segment has grown from just under$400,000 in net revenue to over $1.1 million, with continuedgrowth expected in 2014. This growth has been fueled byincreased market presence in the commercial property,casualty, and transportation segments, despite moderatingrates. Texas Security has also found increased namerecognition in the insurance marketplace since joining B&B,which has helped with recruiting talented people as well asselling insurance.
Our Binding Authority operations have consistently brokenbarriers of growth and profitability, and for 2013, theseoperations represented 57% of the Division’s total revenues.The success of Binding Authority has been evident eventhrough years of rate volatility, market changes and economicdownturns, and is driven by a long history of strong carrierrelationships and some of the best retail agents nationwide.Binding Authority is high-volume, fast-paced business, so itis imperative to have underwriters and brokers with a strongwork ethic who are well-seasoned with experience andstrong relationships to quickly provide what is needed forthe retail agents on every single account. Our brokers striveto communicate constantly with their independent agentsto ensure there is full awareness of the markets andproducts available.
Our Binding Authority operations never settle for average. Weconstantly seek to have the best carriers with the bestproducts. We need to have more insurance underwritingcapacity and more products than our competitors. Our goalis to be the top performer with our insurance companypartners so that they can provide the best risk solutions forevery one of our clients.
BB_2013AR_FINAL_3-98_Layout 1 3/18/14 2:27 PM Page 31

9.6%$131.5
Total revenues for 2013 were $131.5 million,a 12.6% increase over 2012.
The
SERVICES DIVISION
32
6.9%$24.5
DIVISION TOTAL REVENUES(dollars in millions)
2009 2010 2011 2012 2013
32.7 46.4 66.0 116.7 131.5
DIVISION TOTAL REVENUES(dollars in millions)
SERVICES DIVISION OFFICE LOCATIONS
CaliforniaColoradoFlorida
GeorgiaKentuckyMassachusetts
North CarolinaTexas
CONTRIBUTION TO TOTAL REVENUES(dollars in millions)
CONTRIBUTION TO INCOME BEFORE INCOME TAXES
(dollars in millions)
BB_2013AR_FINAL_3-98_Layout 1 3/18/14 2:28 PM Page 32

33
Our continued focus is to provide high-quality back-officeservices to our ever expanding client base, primarily to many ofour insurance carrier partners.
The Services Division is comprised of: USIS, Inc. (“USIS®”);Preferred Governmental Claim Solutions, Inc. (“PGCS®”);AmeriSys®, a division of USIS.; NuQuest/Bridge Pointe® andProtocols®; The Advocator GroupSM; Colonial Claims Corporation(“Colonial Claims”); American Claims Management, Inc.(“ACM”); and ICA, LP (“ICA”). These operations provide clientswith third-party claims administration and comprehensivemedical utilization management services in both the workers’compensation and all-lines liability arenas, as well as Medicareset-aside services and Social Security disability and Medicareadvocacy services. Unlike our other three divisions, the ServicesDivision’s total revenues are primarily derived from fees.
Our newest acquisition in the Services Division is ICA, whichjoined us in December 2013. ICA provides comprehensiveclaims management solutions for both personal and commerciallines of insurance. ICA is a national service provider for daily andcatastrophe claims, vendor management, TPA operations andstaff augmentation. Their claims services also include firstnotice of loss, fast track, field appraisals, quality control andconsulting. ICA also offers training and educationalopportunities to independent adjusters nationwide in ourregional training facilities.
ACM, which accounts for 28.5% of the 2013 divisional totalrevenues and 9.5% of the 2013 divisional operating profits(1), is anational third-party administrator which provides insurance claimshandling and related services, primarily related to commercial andpersonal lines claims. ACM handles all aspects of the claimsadministration process including claims adjusting, administration,subrogation, litigation, and data management services. ACMcurrently provides claims administration services for all theprograms in which our Arrowhead operations are involved.
The Advocator Group accounts for 21.0% of the 2013 divisional totalrevenues and 20.7% of the 2013 divisional operating profits(1).Founded in 2002, The Advocator Group is dedicated to helpingindividuals apply for and obtain Social Security Disability Insurance(SSDI). Advocating for over 10,000 individuals each year, theorganization’s mission is to help preserve or improve the financialwell-being and quality of life of clients. The Advocator Grouppartners with long-term disability insurance carriers, employers andthird-party administrators to ensure a seamless transition andcoordination of ongoing disability benefits. Aevo Insurance Services,LLC, a subsidiary of The Advocator Group, provides health planselection and enrollment assistance for Medicare beneficiaries. Inaddition, Adeo Solutions, a division of The Advocator Group, offerssecond injury fund reimbursement and other services to theworkers’ compensation insurance market.
Colonial Claims, which accounts for 18.1% of the 2013 divisionaltotal revenues and 40.2% of the 2013 divisional operatingprofits(1), is one of the premier catastrophe adjusting companiesin the nation, with the ability to deal with losses associated withall perils and major catastrophes. For the last 20 years, ColonialClaims has led the nation yearly in volume of National FloodInsurance Program claims adjusted. Additionally, many ofColonial Claims’ cadre of adjusters have liability andenvironmental adjusting experience. In the course of its history,Colonial Claims has represented more than 100 property andcasualty and surplus lines insurance carriers.
USIS and PGCS, which account for 18.4% of the 2013 divisionaltotal revenues and 10.0% of the 2013 divisional operatingprofits(1), provides comprehensive risk management and third-party administration services for insurance entities and self-funded or fully-insured workers’ compensation and liability plans.
AmeriSys, a division of USIS, is a licensed and certified providerof medical management and managed care programsspecifically designed for workers’ compensation insuranceprograms and plans. Services provided as components of theseprograms include case management; utilization review andmanagement; client access to custom developed medicalprovider networks (PPOs); and return-to-work programs andinitiatives. AmeriSys works hard for and with their customersproviding the services and resources needed to best containmedical costs while preserving patient satisfaction, all in aneffort to assist occupationally ill or injured employees to stay orpromptly return to their work. In addition, beginning in the lastquarter of 2013 AmeriSys became the provider for the State ofFlorida medical management program.
NuQuest/Bridge Pointe and Protocols, which account for 14.0%of the 2013 divisional total revenues and 19.6% of the 2013divisional operating profits(1), provide a full suite of MedicareSecondary Payer compliance-related services, includingMedicare set-aside services, medical cost projection services,Medicare conditional payment resolution and professionaladministration of settlement funds, to more than 300 insurancecarriers, third-party administrators, self-insured employers andclaimants nationwide. These entities assist with enforcement ofthe Medicare Secondary Payer Statute (“MSP”), which isintended to ensure that Medicare does not make primarypayment to health care providers when another responsiblepayer exists. Medicare’s enforcement rights under the MSPcontinue to be strengthened, most recently by a new federal lawthat has resulted in increased opportunities with workers’compensation, liability insurance (including self-insurance) andno-fault claims.
(1) Income before income taxes plus interest expense, amortization, and changes in estimated acquisition earn-out payables.
BB_2013AR_FINAL_3-98_Layout 1 3/19/14 5:46 PM Page 33

34
J. Hyatt BrownCPCU, CLUChairmanBrown & Brown, Inc.
J. Powell BrownCPCUPresident & Chief Executive OfficerBrown & Brown, Inc.
Samuel P. Bell, III, Esq.Of Counsel to the law firm of Pennington,Moore, Wilkinson, Bell & Dunbar, P.A.Acquisition Committee; CompensationCommittee, Chairman
Board of Directors
Toni Jennings
H. Palmer Proctor, Jr.
Bradley Currey, Jr.
Samuel P. Bell, III, Esq.
J. Hyatt BrownWendell S. Reilly
BB_2013AR_FINAL_3-98_Layout 1 3/18/14 2:28 PM Page 34

35
Hugh M. BrownFounder and former President & Chief Executive Officer, BAMSI, Inc.Audit Committee; Nominating/CorporateGovernance Committee
Bradley Currey, Jr.Former Chairman & Chief Executive Officer, Rock-Tenn CompanyAcquisition Committee; Nominating/CorporateGovernance Committee
Theodore J. HoepnerFormer Vice Chairman, SunTrust Bank Holding CompanyAcquisition Committee; Audit Committee,Chairman; Compensation Committee
James S. HuntFormer Executive Vice President and Chief Financial Officer, Walt Disney Parks and Resorts WorldwideAudit Committee; Compensation Committee
Toni JenningsChairman, Jack Jennings & Sons; Former Lieutenant Governor, State of FloridaCompensation Committee; Nominating/CorporateGovernance Committee
Timothy R. M. MainManaging Director, Evercore Group LLCAcquisition Committee
H. Palmer Proctor, Jr.President/Director, Fidelity BankAcquisition Committee; Audit Committee
Wendell S. ReillyManaging Partner, Grapevine Partners, LLCAcquisition Committee, Chairman;Nominating/Corporate Governance Committee
Chilton D. VarnerPartner, King & Spalding LLPLead Director; Compensation Committee;Nominating/Corporate Governance Committee, Chairman
Theodore J. Hoepner
Hugh M. Brown
J. Powell Brown
James S. Hunt
Chilton D. VarnerTimothy R. M. Main
BB_2013AR_FINAL_3-98_Layout 1 3/18/14 2:28 PM Page 35

36
Executive Officers
J. Powell BrownCPCUPresident & ChiefExecutive Officer
Linda S. DownsCPCU, AIAChief Operating Officer & Regional President
C. Roy BridgesCICRegional President
Charles H. LydeckerCPCU, CIC, AIMRetail Division President
J. Scott PennyCICChief Acquisitions Officer& Regional President
Anthony T. StrianeseRegional President
Sam R. Boone, Jr.Regional Executive Vice President
Kenneth R. MastersRegional Executive Vice President
Chris L. WalkerRegional Executive Vice President
Cory T. WalkerCPCU, CIC, ARM, CRMSenior Vice President,Treasurer & ChiefFinancial Officer *
R. Andrew WattsExecutive Vice President,Treasurer & ChiefFinancial Officer **
Robert W. Lloyd, Esq.CICVice President andGeneral Counsel
Laurel L. Grammig, Esq.CIC, CRMVice President, Corporate Secretary &Chief Compliance and Regulatory Officer
Richard Freebourn, Sr.CPCU, CICVice President, Internal Operations
Linda S. DownsCPCU, AIA
Chief Operating Officer &Regional President
C. Roy BridgesCIC
Regional President
Charles H. LydeckerCPCU, CIC, AIM
Retail Division President
J. Scott PennyCIC
Chief Acquisitions Officer & Regional President
Anthony T. StrianeseRegional President
Sam R. Boone, Jr.Regional Executive
Vice President
Kenneth R. MastersRegional Executive
Vice President
Chris L. WalkerRegional Executive
Vice President
P. Barrett BrownRegional Vice President
Kathy ColangeloCIC, ASLI
Regional Vice President
Steve DentonRegional Vice President
Nicholas J. DereszynskiCEBS, CIC
Regional Vice President
Leadership Overview
Anthony M. GrippaRegional Vice President
Thomas K. HuvalCIC
Regional Vice President
Richard A. KnudsonCIC
Regional Vice President
* Until his retirement from the Company March 4, 2014** Since March 4, 2014
BB_2013AR_FINAL_3-98_Layout 1 3/19/14 5:46 PM Page 36

37
Index to Financials
38 Management’s Discussion and Analysis of Financial Condition and Results of Operations
62 Consolidated Statements of Income
63 Consolidated Balance Sheets
64 Consolidated Statements of Shareholders’ Equity
65 Consolidated Statements of Cash Flows
66 Notes to Consolidated Financial Statements
94 Reports of Independent Registered Public Accounting Firm
96 Management’s Report on Internal Control Over Financial Reporting
98 Performance Graph
BB_2013AR_FINAL_3-98_Layout 1 3/18/14 2:31 PM Page 37

38
Management’s Discussion and Analysis ofFinancial Condition and Results of Operations
GENERAL The following discussion should be read in conjunction
with our Consolidated Financial Statements and the relatedNotes to those Consolidated Financial Statements includedelsewhere in this Annual Report.
We are a diversified insurance agency, wholesalebrokerage, insurance programs and services organizationheadquartered in Daytona Beach and Tampa, Florida. As aninsurance intermediary, our principal sources of revenue arecommissions paid by insurance companies and, to a lesserextent, fees paid directly by customers. Commission revenuesgenerally represent a percentage of the premium paid by aninsured and are materially affected by fluctuations in bothpremium rate levels charged by insurance companies and theinsureds’ underlying “insurable exposure units,” which areunits that insurance companies use to measure or expressinsurance exposed to risk (such as property values, or salesand payroll levels) to determine what premium to charge theinsured. Insurance companies establish these premium ratesbased upon many factors, including reinsurance rates paid bysuch insurance companies, none of which we control.
The volume of business from new and existing customers,fluctuations in insurable exposure units and changes in generaleconomic and competitive conditions all affect our revenues. Forexample, level rates of inflation or a general decline in economicactivity could limit increases in the values of insurable exposureunits. Conversely, the increasing costs of litigation settlementsand awards have caused some customers to seek higher levels ofinsurance coverage. Historically, our revenues have typicallygrown as a result of our focus on net new business growth andacquisitions.
We attempt to foster a strong, decentralized sales culturewith a goal of consistent, sustained growth over the long term.
We increased revenues every year from 1993 to 2013, withthe exception of 2009, when our revenues dropped 1.0%. Ourrevenues grew from $95.6 million in 1993 to $1.4 billion in2013, reflecting a compound annual growth rate of 14.2%. Inthe same 20 year period, we increased net income from $8.0million to $217.1 million in 2013, a compound annual growthrate of 17.9%.
The years 2007 through 2011 posed significant challengesfor us and for our industry in the form of a prevailing decline ininsurance premium rates, commonly referred to as a “softmarket” and increased significant governmental involvementin the Florida insurance marketplace which resulted in asubstantial loss of revenues for us. Additionally, beginning inthe second half of 2008 and throughout 2011, there was ageneral decline in insurable exposure units as the consequenceof the general weakening of the economy in the United States.As a result, from the first quarter of 2007 through the fourthquarter of 2011 we experienced negative internal revenuegrowth each quarter. The continued declining exposure unitsduring 2011 and 2010 had a greater negative impact on ourcommissions and fees revenues than declining insurancepremium rates.
Beginning in the first quarter of 2012, many insurancepremium rates began to slightly increase. Additionally, in thesecond quarter of 2012, the general declines in insurableexposure units started to flatten and these exposure unitssubsequently began to gradually increase during the year. As aresult, we recorded positive internal revenue growth for eachquarter of 2012 for each of our four divisions with twoexceptions; the first quarter for the Retail Division and the thirdquarter for the National Programs Division, in which declines ofonly 0.7% and 3.3%, respectively, were experienced.
This growth trend has continued into 2013 with ourconsolidated internal revenue growth rate of 6.7%.Additionally, each of our four divisions recorded positiveinternal revenue growth for each quarter in 2013 except for theServices Division in the fourth quarter. The decline in the coreorganic commissions and fees revenues in the fourth quarterof 2013 for the Services Division was the result of thesignificant revenue recorded at our Colonial Claims operationin the fourth quarter of 2012 attributable to Superstorm Sandyfor which no comparable revenues occurred in the fourthquarter of 2013. In the event that the gradual increases ininsurance premium rates and insurable exposure units thatoccurred in 2013 continue into 2014, we expect to seecontinued positive quarterly internal revenue growth rates on ayear-over-year basis for 2014, excluding the impact relating toour Colonial Claims operation. In the first quarter of 2013,Colonial Claims earned claims fees of $17.2 million as a directresult of the continued significant claims activity fromSuperstorm Sandy. Absent another major flooding event, weestimate Colonial Claims revenues for the first quarter of 2014to be less than $1.0 million.
BB_2013AR_FINAL_3-98_Layout 1 3/19/14 6:01 PM Page 38

39
We also earn “profit-sharing contingent commissions,”which are profit-sharing commissions based primarily onunderwriting results, but which may also reflect considerationsfor volume, growth and/or retention. These commissions areprimarily received in the first and second quarters of each year,based on the aforementioned considerations for the prioryear(s). Over the last three years, profit-sharing contingentcommissions have averaged approximately 4.4% of the previousyear’s total commissions and fees revenue. Profit-sharingcontingent commissions are typically included in our totalcommissions and fees in the Consolidated Statements of Incomein the year received. The term “core commissions and fees”excludes profit-sharing contingent commissions and guaranteedsupplemental commissions, and therefore represents therevenues earned directly from specific insurance policies sold,and specific fee-based services rendered. In contrast, the term“core organic commissions and fees” is our core commissionsand fees less (i) the core commissions and fees earned for thefirst twelve months by newly-acquired operations and (ii)divested business (core commissions and fees generated fromoffices, books of business or niches sold or terminated during thecomparable period). “Core organic commissions and fees” arereported in this manner in order to express the current year’score commissions and fees on a comparable basis with the prioryear’s core commissions and fees. The resulting net changereflects the aggregate changes attributable to (i) net new andlost accounts, (ii) net changes in our clients’ exposure units, and(iii) net changes in insurance premium rates. The net changes ineach of these three components can be determined for each ofour customers. However, because our agency managementaccounting systems do not aggregate such data, it is notreportable. Core organic commissions and fees can reflect either“positive” growth with a net increase in revenues, or “negative”growth with a net decrease in revenues.
Beginning a few years ago, five to six national insurancecompanies replaced their loss-ratio based profit-sharingcontingent commission agreements with new guaranteedfixed-base agreements, referred to as “GuaranteedSupplemental Commissions” (“GSCs”). For 2013, only fournational insurance companies still used GSCs in lieu of loss-ratio based profit-sharing contingent commissions. SinceGSCs are not subject to the uncertainty of loss ratios, they areaccrued throughout the year based on actual premiumswritten. As of December 31, 2013, we accrued and earned $8.3million of GSCs during 2013, most of which will be collected inthe first quarter of 2014. For the twelve-month periods ended
December 31, 2013, 2012 and 2011, we earned $8.3 million,$9.1 million and $12.1 million, respectively, of GSCs.
Fee revenues relate to fees negotiated in lieu ofcommissions, which are recognized as services are rendered.Fee revenues have historically been generated primarily by: (1)our Services Division, which provides insurance-relatedservices, including third-party claims administration andcomprehensive medical utilization management services inboth the workers’ compensation and all-lines liability arenas,as well as Medicare set-aside services, Social Securitydisability and Medicare benefits advocacy services, andcatastrophe claims adjusting services, and (2) our NationalPrograms and Wholesale Brokerage Divisions, which earn feesprimarily for the issuance of insurance policies on behalf ofinsurance companies. These services are provided over aperiod of time, typically one year. However, in conjunction withour July 1, 2013 acquisition of Beecher Carlson, which has aprimary focus on large retail customers that generally pay usfees directly, the fee revenues in our Retail Division for 2013have increased by nearly $40.0 million to $73.0 million. For2014, we expect the total fees in our Retail Division to beapproximately $110.0 million. Fee revenues, on a consolidatedbasis, as a percentage of our total commissions and fees,represented 26.6% in 2013, 21.7% in 2012 and 16.4% in 2011.
Historically, investment income has consisted primarily ofinterest earnings on premiums and advance premiumscollected and held in a fiduciary capacity before being remittedto insurance companies. Our policy is to invest available fundsin high-quality, short-term fixed income investment securities.As a result of the bank liquidity and solvency issues in theUnited States in the last quarter of 2008, we movedsubstantial amounts of our cash into non-interest bearingchecking accounts so that they would be fully insured by theFederal Deposit Insurance Corporation (“FDIC”) or intomoney-market investment funds (a portion of which is FDICinsured) of SunTrust and Wells Fargo, two large national banks.Effective January 1, 2013, the FDIC ceased providing insuranceguarantees on non-interest bearing checking accounts andsince that time we have invested in both interest bearing andnon-interest bearing checking accounts. Investment incomealso includes gains and losses realized from the sale ofinvestments. Other income primarily reflects net gains onsales of customer accounts and fixed assets, but will alsoinclude sub-rental income, legal settlements and othermiscellaneous income.
BB_2013AR_FINAL_3-98_Layout 1 3/20/14 10:04 AM Page 39

40
Management’s Discussion and Analysis ofFinancial Condition and Results of Operations
CURRENT YEAR COMPANY OVERVIEW 2013 was a strong year for revenue growth and continued
the positive trends that began in 2012. After the five-yearperiod extending from 2007 to 2011, in which we experiencednegative internal growth in our core organic commissions andfees revenue which we believe was a direct result of thegeneral weakness of the economy, we achieved a positiveinternal revenue growth of 2.6% in 2012, and 6.7% in 2013.
The net growth in core organic commissions and fees in2013 of $75.6 million is a significant improvement over thecomparable growth in 2012 of $24.9 million and the net lostrevenues of $21.5 million in 2011. Of the $75.6 million growthin the 2013 core organic commissions and fees, $38.1 millionwas generated by two new programs at our Arrowheadoperation, the automobile aftermarket program and the non-standard auto program, and from our Colonial Claimsoperation as a result of the significant claims activityattributable to Superstorm Sandy. The remaining growth in thecore organic commissions and fees revenue is principallyattributable to rising insurance premium rates, and increasinginsurance exposure units as a result of a gradually improvingU. S. economy.
We continue to be successful in acquiring insuranceoperations that we believe are strategic in growing ourbusiness Divisions. In each of the last two years, we completedacquisitions with aggregate revenues in excess of $142.8million: nine acquisitions in 2013 with estimated revenues of$142.8 million, and 20 acquisitions in 2012 with estimatedrevenues of $149.6 million. For 2014, we are continuing thistrend with the announced acquisition of Wright InsuranceGroup, with estimated annualized revenues of $120.0 million,which is expected to close on or around April 1, 2014.
Income before income taxes in 2013 increased over 2012by 17.3%, or $52.8 million, to $357.6 million. However, that netincrease of $52.8 million includes $14.3 million of incomebefore income taxes related to new acquisitions that werestand-alone offices, and therefore, income before incometaxes from offices that existed in the same time periods of2013 and 2012 (including the new acquisitions that “folded in”to those offices) increased by $38.5 million. The net increaseof $38.5 million related primarily to: (1) net new business, (2)a $2.6 million benefit from a change in estimated acquisitionearn-out payables, and (3) a one-time $6.8 million bonusearned in 2012 by our Retail Division commissioned producersas a result of a special program for those whose 2012production exceeded their 2011 production by at least fivepercent. These net increases were partially off-set by a $6.6million increase in non-cash stock-based compensationprimarily due to new grants issued in July 2013. Therefore,excluding these items, income before income taxes from thoseoffices that existed in the same time periods of 2013 and 2012(including the new acquisitions that “folded in” to thoseoffices) increased by $37.7 million.
ACQUISITIONSApproximately 38,500 independent insurance agencies are
estimated to be operating currently in the United States. Part ofour continuing business strategy is to attract high-qualityinsurance intermediaries to join our operations. From 1993 through2013, we acquired 449 insurance intermediary operations,excluding acquired books of business (customer accounts).
A summary of our acquisitions over the last three years isas follows:
Number of Acquisitions
Asset Stock
EstimatedAnnual
RevenuesNet Cash
PaidNotesIssued
OtherPayable
LiabilitiesAssumed
RecordedEarn-outPayable
AggregatePurchase
Price
(in millions, except for number of acquisitions)
2013 8 1 $ 142.8 $ 408.1 $ –––– $ 0.5 $ 106.1 $ 5.1 $ 519.8
2012 19 1 $ 149.6 $ 483.9 $ 0.1 $ 25.4 $ 136.7 $ 21.5 $ 667.6
2011 37 1 $ 88.7 $ 167.4 $ 1.2 $ –––– $ 15.7 $ 30.5 $ 214.8
BB_2013AR_FINAL_3-98_Layout 1 3/18/14 2:31 PM Page 40

41
On July 1, 2013, we completed the acquisition of BeecherCarlson Holdings, Inc. (“Beecher Carlson”), an insurance andrisk management broker with operations that include retailbrokerage, program management and captive management.The aggregate purchase price for Beecher Carlson was $469.3million, including $364.3 million of cash payments and theassumption of $105.0 million of liabilities. Beecher Carlsonwas acquired primarily to expand Brown & Brown’s Retail andNational Programs businesses, and to attract and hire high-quality individuals.
On January 9, 2012, we completed the acquisition ofArrowhead General Insurance Agency SuperholdingCorporation (“Arrowhead”) pursuant to a merger agreementdated December 15, 2011 (the “Merger Agreement”). Underthe Merger Agreement, the total cash purchase price of$395.0 million was subject to adjustments for options topurchase shares of Arrowhead’s common stock, workingcapital, sharing of net operating tax losses, Arrowhead’spreferred stock units, transaction expenses, and closing debt.In addition, within 60 days following the third anniversary ofthe acquisition’s closing date, we will pay to certain personswho were Arrowhead equityholders as of the closing dateadditional earn-out payments equal, collectively, to $5.0million, subject to certain adjustments based on the“cumulative EBITDA” of Arrowhead and all of its subsidiaries,as calculated pursuant to the Merger Agreement, during thefinal year of the three-year period following the acquisition’sclosing date.
Arrowhead is a national insurance program manager andone of the largest managing general agents (“MGAs”) in theproperty and casualty insurance industry.
On January 15, 2014, as previously announced, we enteredinto an agreement to acquire The Wright Insurance Group, LLC(“Wright”), with estimated annualized revenues of $120.0million. This transaction is expected to close on or aroundApril 1, 2014. Wright’s operations include a national floodinsurance program, government-sponsored insuranceprograms and proprietary national and regional programs. Thetotal net consideration to be paid for the ownership interestsof Wright is $602.5 million in addition to contingentconsideration of up to $37.5 million if Wright completescertain agreed-upon acquisitions prior to closing. Thetransaction is subject to customary closing conditions,including Hart-Scott-Rodino approval and other relatedregulatory approvals.
CRITICAL ACCOUNTING POLICIES Our Consolidated Financial Statements are prepared in
accordance with U.S. GAAP. The preparation of these financialstatements requires us to make estimates and judgments thataffect the reported amounts of assets, liabilities, revenues andexpenses. We continually evaluate our estimates, which arebased on historical experience and on assumptions that webelieve to be reasonable under the circumstances. Theseestimates form the basis for our judgments about the carryingvalues of our assets and liabilities, which values are not readilyapparent from other sources. Actual results may differ fromthese estimates.
We believe that, of our significant accounting policies (see“Note 1—Summary of Significant Accounting Policies” of theNotes to Consolidated Financial Statements), the followingcritical accounting policies may involve a higher degree ofjudgment and complexity.
REVENUE RECOGNITION Commission revenues are recognized as of the effective date
of the insurance policy or the date on which the policy premium isbilled to the customer, whichever is later. Commission revenuesrelated to installment billings at the Company’s subsidiary,Arrowhead, are recorded on the later of the effective date of thepolicy or the first installment billing. At those dates, the earningsprocess has been completed, and we can reliably estimate theimpact of policy cancellations for refunds and establish reservesaccordingly. Management determines the policy cancellationreserve based upon historical cancellation experience adjusted inaccordance with known circumstances. Subsequent commissionadjustments are recognized upon our receipt of notification frominsurance companies concerning matters necessitating suchadjustments. Profit-sharing contingent commissions arerecognized when determinable, which is when such commissionsare received from insurance companies, or when we receive formalnotification of the amount of such payments. Fee revenues arerecognized as services are rendered.
BB_2013AR_FINAL_3-98_Layout 1 3/18/14 2:31 PM Page 41

42
Management’s Discussion and Analysis ofFinancial Condition and Results of Operations
BUSINESS COMBINATIONS AND PURCHASE PRICE ALLOCATIONS
We have acquired significant intangible assets throughbusiness acquisitions. These assets consist of purchasedcustomer accounts, non-compete agreements, and the excessof purchase prices over the fair value of identifiable net assetsacquired (Goodwill). The determination of estimated usefullives and the allocation of purchase price to intangible assetsrequires significant judgment and affects the amount of futureamortization and possible impairment charges.
All of our business combinations initiated after June 30,2001 have been accounted for using the purchase method. Inconnection with these acquisitions, we record the estimatedvalue of the net tangible assets purchased and the value of theidentifiable intangible assets purchased, which typicallyconsist of purchased customer accounts and non-competeagreements. Purchased customer accounts include thephysical records and files obtained from acquired businessesthat contain information about insurance policies, customersand other matters essential to policy renewals. However, theyprimarily represent the present value of the underlying cashflows expected to be received over the estimated futurerenewal periods of the insurance policies comprising thosepurchased customer accounts. The valuation of purchasedcustomer accounts involves significant estimates andassumptions concerning matters such as cancellationfrequency, expenses and discount rates. Any change in theseassumptions could affect the carrying value of purchasedcustomer accounts. Non-compete agreements are valuedbased on their duration and any unique features of particularagreements. Purchased customer accounts and non-competeagreements are amortized on a straight-line basis over therelated estimated lives and contract periods, which range fromfive to 15 years. The excess of the purchase price of anacquisition over the fair value of the identifiable tangible andintangible assets is assigned to goodwill and is not amortized.
Acquisition purchase prices are typically based on amultiple of average annual operating profit earned over a one-to three-year period within a minimum and maximum pricerange. The recorded purchase prices for all acquisitionsconsummated after January 1, 2009 include an estimation ofthe fair value of liabilities associated with any potential earn-out provisions. Subsequent changes in the fair value of earn-outobligations are recorded in the consolidated statement ofincome when incurred.
The fair value of earn-out obligations is based on thepresent value of the expected future payments to be made tothe sellers of the acquired businesses in accordance with theprovisions contained in the respective purchase agreements. Indetermining fair value, the acquired business’s futureperformance is estimated using financial projections developedby management for the acquired business and this estimatereflects market participant assumptions regarding revenuegrowth and/or profitability. The expected future payments areestimated on the basis of the earn-out formula andperformance targets specified in each purchase agreementcompared to the associated financial projections. Theseestimates are then discounted to present value using a risk-adjusted rate that takes into consideration the likelihood thatthe forecasted earn-out payments will be made.
INTANGIBLE ASSETS IMPAIRMENT Goodwill is subject to at least an annual assessment for
impairment measured by a fair-value-based test. Amortizableintangible assets are amortized over their useful lives and aresubject to an impairment review based on an estimate of theundiscounted future cash flows resulting from the use of theassets. To determine if there is potential impairment ofgoodwill, we compare the fair value of each reporting unit withits carrying value. If the fair value of the reporting unit is lessthan its carrying value, an impairment loss would be recordedto the extent that the fair value of the goodwill within thereporting unit is less than its carrying value. Fair value isestimated based on multiples of earnings before interest,income taxes, depreciation, amortization and change inestimated acquisition earn-out payables (“EBITDAC”), or on adiscounted cash flow basis.
BB_2013AR_FINAL_3-98_Layout 1 3/18/14 2:31 PM Page 42

43
Management assesses the recoverability of our goodwillon an annual basis, and assesses the recoverability of ouramortizable intangibles and other long-lived assets wheneverevents or changes in circumstances indicate that the carryingvalue of such assets may not be recoverable. The followingfactors, if present, may trigger an impairment review: (i)significant underperformance relative to historical or projectedfuture operating results; (ii) significant negative industry oreconomic trends; (iii) significant decline in our stock price fora sustained period; and (iv) significant decline in our marketcapitalization. If the recoverability of these assets is unlikelybecause of the existence of one or more of the above-referenced factors, an impairment analysis is performed.Management must make assumptions regarding estimatedfuture cash flows and other factors to determine the fair valueof these assets. If these estimates or related assumptionschange in the future, we may be required to revise theassessment and, if appropriate, record an impairment charge.We completed our most recent evaluation of impairment forgoodwill as of November 30, 2013 and determined that the fairvalue of goodwill exceeded the carrying value of such assets.Additionally, there have been no impairments recorded foramortizable intangible assets for the years ended December31, 2013, 2012 and 2011.
NON-CASH STOCK-BASED COMPENSATIONWe grant stock options and non-vested stock awards to
our employees, and the related compensation expense isrequired to be recognized in the financial statements basedupon the grant-date fair value of those awards.
LITIGATION CLAIMS We are subject to numerous litigation claims that arise in
the ordinary course of business. If it is probable that an assethas been impaired or a liability has been incurred at the date ofthe financial statements and the amount of the loss is estimable,an accrual for the costs to resolve these claims is recorded inaccrued expenses in the accompanying Consolidated BalanceSheets. Professional fees related to these claims are included inother operating expenses in the accompanying ConsolidatedStatements of Income. Management, with the assistance of in-house and outside counsel, determines whether it is probablethat a liability has been incurred and estimates the amount ofloss based upon analysis of individual issues. Newdevelopments or changes in settlement strategy in dealing withthese matters may significantly affect the required reserves andaffect our net income.
BB_2013AR_FINAL_3-98_Layout 1 3/18/14 2:31 PM Page 43

44
Management’s Discussion and Analysis ofFinancial Condition and Results of Operations
RESULTS OF OPERATIONS FOR THE YEARS ENDED DECEMBER 31, 2013, 2012 AND 2011
The following discussion and analysis regarding results of operations and liquidity and capital resources should be consideredin conjunction with the accompanying Consolidated Financial Statements and related Notes.
Financial information relating to our Consolidated Financial Results is as follows:
(1) NMF=Not a meaningful figure
Percent Percent(in thousands, except percentages) 2013 Change 2012 Change 2011
REVENUES
Core commissions and fees $ 1,295,977 14.1 % $ 1,136,252 19.5 % $ 950,685
Profit-sharing contingent commissions 51,251 17.3 % 43,683 1.1 % 43,198
Guaranteed supplemental commissions 8,275 (9.5)% 9,146 (24.3)% 12,079
Investment income 638 (19.9)% 797 (37.1)% 1,267
Other income, net 7,138 (29.7)% 10,154 60.8 % 6,313
Total revenues 1,363,279 13.6 % 1,200,032 18.4 % 1,013,542
EXPENSES
Employee compensation and benefits 683,000 12.2 % 608,506 19.6 % 508,675
Non-cash stock-based compensation 22,603 42.5 % 15,865 41.7 % 11,194
Other operating expenses 195,677 12.2 % 174,389 21.0 % 144,079
Amortization 67,932 6.9 % 63,573 16.1 % 54,755
Depreciation 17,485 13.7 % 15,373 24.1 % 12,392
Interest 16,440 2.1 % 16,097 13.9 % 14,132
Change in estimated acquisition earn-out payables 2,533 78.6 % 1,418 NMF(1) (2,206)
Total expenses 1,005,670 12.3 % 895,221 20.5 % 743,021
Income before income taxes $ 357,609 17.3 % $ 304,811 12.7 % $ 270,521
Net internal growth rate –core commissions and fees 6.7% 2.6% (2.4)%
Employee compensation and benefits ratio 50.1% 50.7% 50.2%
Other operating expenses ratio 14.4% 14.5% 14.2%
Capital expenditures $ 16,366 $ 24,028 $ 13,608
Total assets at December 31 $ 3,649,508 $ 3,128,058 $ 2,607,011
BB_2013AR_March20_FIN_Layout 1 3/20/14 3:38 PM Page 44

45
COMMISSIONS AND FEES Commissions and fees, including profit-sharing contingent
commissions and GSCs, increased $166.4 million, or 14.0% in2013. Profit-sharing contingent commissions and GSCsincreased $6.7 million or 12.7% in 2013 to $59.5 million, dueprimarily to $4.7 million, $0.6 million, and $1.3 millionincreases in profit-sharing contingent commissions and GSCsin our Retail, National Programs and Wholesale BrokerageDivisions, respectively. Core commissions and fees revenue in2013 increased $159.7 million, of which approximately $91.5million represented core commissions and fees fromacquisitions that had no comparable revenues in 2012. Aftertaking into account divested business of $7.4 million, theremaining net increase of $75.6 million, representing net newbusiness, reflects a 6.7% internal growth rate for core organiccommissions and fees.
Commissions and fees, including profit-sharing contingentcommissions and GSCs, increased $183.1 million, or 18.2% in2012. Profit-sharing contingent commissions and GSCsdecreased $2.4 million or 4.4% in 2012 to $52.8 million, dueprimarily to $4.1 million and $1.2 million reductions in profit-sharing contingent commissions and GSCs in our Retail andWholesale Brokerage Divisions, respectively; but thesereductions were partially offset by a $3.2 million increase inour National Programs Division. Core commissions and feesrevenue increased $185.6 million, of which approximately$171.4 million represented core commissions and fees fromacquisitions that had no comparable revenues in 2011. Aftertaking into account divested business of $10.7 million, theremaining net increase of $24.9 million, representing net newbusiness, reflects a 2.6% internal growth rate for core organiccommissions and fees.
INVESTMENT INCOME Investment income decreased to $0.6 million in 2013,
compared with $0.8 million in 2012, mainly due to loweraverage daily invested balances in 2013 than in 2012.Investment income of $0.8 million in 2012 was down $0.5million as compared with 2011, mainly due to lower averagedaily invested balances in 2012 than in 2011.
OTHER INCOME, NET Other income for 2013 reflected income of $7.1 million,
compared with $10.2 million in 2012 and $6.3 million in 2011.We recognized gains of $3.1 million, $4.3 million and $2.3million from sales of books of business (customer accounts) in2013, 2012, and 2011, respectively. Although we are not in thebusiness of selling books of business, we periodically will sellan office or a book of business because it does not producereasonable margins or demonstrate a potential for growth, orfor other reasons related to the particular assets in question.Other income also included $1.6 million, $3.6 million and $1.3million in 2013, 2012, and 2011, respectively, paid to us inconnection with settlements of litigation against formeremployees for violation of restrictive covenants contained intheir employment agreements with us. Additionally, werecognized non-recurring gains, rental income and sales ofsoftware services of $2.4 million, $2.3 million and $2.3 millionin 2013, 2012, and 2011, respectively.
EMPLOYEE COMPENSATION AND BENEFITS Employee compensation and benefits expense increased,
approximately 12.2% or $74.5 million in 2013. However, thatnet increase included $37.6 million of new compensation costsrelated to new acquisitions that were stand-alone offices.Therefore, employee compensation and benefits from thoseoffices that existed in the same time periods of 2013 and 2012(including the new acquisitions that “folded in” to thoseoffices) increased by $36.9 million. The employeecompensation and benefit increases from these offices wereprimarily related to increases in staff and management salariesof $16.6 million, new salaried producers of $4.7 million, profitcenter and other related bonuses of $3.4 million, compensationto our commissioned producers of $5.7 million, healthinsurance costs of $1.8 million, payroll-related taxes of $3.7million, and other net expenses of $1.0 million.
Employee compensation and benefits expense increased,on a net basis, approximately 19.6% or $99.8 million in 2012.However, that net increase included $80.9 million of newcompensation costs related to new acquisitions that werestand-alone offices, and therefore, employee compensation andbenefits from those offices that existed in the same time periodsof 2012 and 2011 (including the new acquisitions that “folded in”
BB_2013AR_FINAL_3-98_Layout 1 3/18/14 2:31 PM Page 45

46
Management’s Discussion and Analysis ofFinancial Condition and Results of Operations
to those offices) increased by $18.9 million. The employeecompensation and benefit increases from these offices wereprimarily related to increases in staff and management salariesof $3.2 million, new salaried producers of $1.3 million, profitcenter bonuses of $1.4 million, health insurance costs of $1.8million, employee 401(k)/profit-sharing contributions of $0.7million and bonus incentives of $8.1 million primarily due to $6.8million earned by our Retail Division commissioned producersas a result of a special one-time bonus program for those whose2012 production exceeded their 2011 production by at least 5%.
Employee compensation and benefits expense as apercentage of total revenues decreased in 2013 to 50.1% ascompared to 50.7% for 2012 and 50.2% for 2011. We had6,992 full-time equivalent employees at December 31, 2013,compared with 6,438 at December 31, 2012 and 5,557 atDecember 31, 2011. Of the net increase of 554 full-timeequivalent employees at December 31, 2013 over the prioryear-end, an increase of 374 was attributable to acquisitions,thus reflecting a net increase of 180 employees in the officesexisting at both year-ends.
NON-CASH STOCK-BASED COMPENSATION We have an employee stock purchase plan, and grant
stock options and non-vested stock awards to ouremployees. Compensation expense for all share-basedawards is recognized in the financial statements based uponthe grant-date fair value of those awards. For 2013, 2012 and2011, the non-cash stock-based compensation expenseincorporates the costs related to each of our four stock-based plans as explained in Note 11 of the Notes to theConsolidated Financial Statements.
Non-cash stock-based compensation increased 42.5%, or$6.7 million in 2013 over 2012, primarily as a result of new non-vested stock awards granted on July 1, 2013 under our StockIncentive Plan (“SIP”). Most of these SIP grants will typicallyvest in four to seven years, subject to the achievement ofcertain performance criteria by grantees, and the achievementof consolidated earnings per share growth at certain levels byus, over three-to five-year measurement periods. Some SIPgrants will vest after five years of service.
Non-cash stock-based compensation increased 41.7%, or$4.7 million in 2012 over 2011, as a result of new grants underour Stock Incentive Plan (“SIP”). These SIP grants will typicallyvest in four to ten years, subject to the achievement of certainperformance criteria by grantees, and the achievement ofconsolidated earnings per share growth at certain levels by us,over three-to five-year measurement periods.
OTHER OPERATING EXPENSESAs a percentage of total revenues, other operating
expenses represented 14.4% in 2013, 14.5% in 2012, and 14.2%in 2011.
Other operating expenses in 2013 increased $21.3 millionover 2012, of which $12.5 million was related to acquisitionsthat joined as stand-alone offices. Therefore, other operatingexpenses attributable to offices that existed in the sameperiods in both 2013 and 2012 (including the new acquisitionsthat “folded in” to those offices) increased by $8.8 million. Ofthe $8.8 million increase, $2.0 million related to increaseddata processing and software licensing expense, $2.0 millionrelated to increased inspection and consulting fees, $1.6million related to increased accounting and advisory fees, $0.9million related to increased employee sales meeting costs, and$2.9 million related to other various, net cost increases. Theseincreased costs were partially offset by a decrease of $0.6million for legal, claims and litigation expenses.
Other operating expenses in 2012 increased $30.3 millionover 2011, of which $33.3 million was related to acquisitionsthat joined as stand-alone offices. Therefore, other operatingexpenses attributable to offices that existed in the sameperiods in both 2012 and 2011 (including the new acquisitionsthat “folded in” to those offices) decreased by $3.0 million. Ofthe $3.0 million decrease, $2.7 million related to reductions inoffice rents and related expenses, $2.2 million related to areduction in legal expenses and $2.0 million related to lowerinsurance costs. These cost savings were partially offset byincreases of $1.3 million in consulting and inspection services,$1.1 million for litigation reserves, and $1.0 million in employeesales meetings.
AMORTIZATION Amortization expense increased $4.4 million, or 6.9%, in
2013, and $8.8 million, or 16.1%, in 2012. The increases in 2013and 2012 were due to the amortization of additional intangibleassets as a result of acquisitions completed in those years.
BB_2013AR_FINAL_3-98_Layout 1 3/18/14 2:31 PM Page 46

47
DEPRECIATIONDepreciation increased 13.7% in 2013, and 24.1% in 2012. The
increases in 2013 and 2012 were due primarily to the addition offixed assets as a result of recent acquisitions.
INTEREST EXPENSEInterest expense increased $0.3 million, or 2.1%, in 2013,
and $2.0 million, or 13.9%, in 2012. The 2013 and 2012increases were due primarily to the additional debt borrowedin connection with our acquisitions of Beecher Carlson in 2013and Arrowhead in 2012.
CHANGE IN ESTIMATED ACQUISITION EARN-OUT PAYABLES
Accounting Standards Codification (“ASC”) Topic 805—Business Combinations is the authoritative guidance requiringan acquirer to recognize 100% of the fair values of acquiredassets, including goodwill, and assumed liabilities (with onlylimited exceptions) upon initially obtaining control of anacquired entity. Additionally, the fair value of contingentconsideration arrangements (such as earn-out purchase
arrangements) at the acquisition date must be included in thepurchase price consideration. As a result, the recordedpurchase prices for all acquisitions consummated afterJanuary 1, 2009 include an estimation of the fair value ofliabilities associated with any potential earn-out provisions.Subsequent changes in these earn-out obligations are requiredto be recorded in the consolidated statement of income whenincurred. Estimations of potential earn-out obligations aretypically based upon future earnings of the acquired entities,usually for periods ranging from one to three years.
The net charge or credit to the Consolidated Statement ofIncome for the period is the combination of the net change in theestimated acquisition earn-out payables balance, and theinterest expense imputed on the outstanding balance of theestimated acquisition earn-out payables.
As of December 31, 2013, the fair values of the estimatedacquisition earn-out payables were re-evaluated and measured atfair value on a recurring basis using unobservable inputs (Level3). The resulting net changes, as well as the interest expenseaccretion on the estimated acquisition earn-out payables, for theyears ended December 31, 2013, 2012, and 2011 were as follows:
The fair values of the estimated earn-out payables wereincreased in 2013 since certain acquisitions performed at higherlevels than estimated on our original projections. The fair valuesof the estimated earn-out payables were reduced in 2012 and2011 since certain acquisitions did not perform at the levelestimated based on our original projections. An acquisition isconsidered to be performing well if its operating profit exceedsthe level needed to reach the minimum purchase price.However, a reduction in the estimated acquisition earn-outpayable can occur even though the acquisition is performingwell, if it is not performing at the level contemplated by ouroriginal estimate.
As of December 31, 2013, the estimated acquisition earn-out payables equaled $43,058,000, of which $6,312,000 wasrecorded as accounts payable and $36,746,000 was recordedas other non-current liability. As of December 31, 2012, theestimated acquisition earn-out payables equaled $52,987,000,of which $10,164,000 was recorded as accounts payable and$42,823,000 was recorded as other non-current liability.
INCOME TAXES The effective tax rate on income from operations was
39.3% in 2013, 39.6% in 2012, and 39.4% in 2011. The lowereffective annual tax rates are primarily the result of loweraverage effective state income tax rates.
(in thousands) 2013 2012 2011
Change in fair value on estimated acquisition earn-out payables $ 570 $ (1,051) $ (4,043)
Interest expense accretion 1,963 2,469 1,837
Net change in earnings from estimated acquisition earn-out payables $ 2,533 $ 1,418 $ (2,206)
BB_2013AR_March20_FIN_Layout 1 3/20/14 3:38 PM Page 47

48
Management’s Discussion and Analysis ofFinancial Condition and Results of Operations
RESULTS OF OPERATIONS — SEGMENT INFORMATION
As discussed in Note 15 of the Notes to ConsolidatedFinancial Statements, we operate four reportable segments ordivisions: the Retail, National Programs, Wholesale Brokerage,and Services Divisions. On a divisional basis, increases inamortization, depreciation and interest expenses result fromcompleted acquisitions within a given division in a particularyear. Likewise, other income in each division primarily reflectsnet gains on sales of customer accounts and fixed assets. Assuch, in evaluating the operational efficiency of a division,management emphasizes the net internal growth rate of corecommissions and fees revenue, the gradual improvement of theratio of total employee compensation and benefits to totalrevenues, and the gradual improvement of the ratio of otheroperating expenses to total revenues.
The term “core commissions and fees” excludes profit-sharing contingent commissions and GSCs, and thereforerepresents the revenues earned directly from specific insurancepolicies sold, and specific fee-based services rendered. Incontrast, the term “core organic commissions and fees” is our
core commissions and fees less (i) the core commissions andfees earned for the first twelve months by newly-acquiredoperations and (ii) divested business (core commissions andfees generated from offices, books of business or niches sold orterminated during the comparable period). Core organiccommissions and fees attempts to express the current year’score commissions and fees on a comparable basis with the prioryear’s core commissions and fees. The resulting net changereflects the aggregate changes attributable to (i) net new andlost accounts, (ii) net changes in our clients’ exposure units,and (iii) net changes in insurance premium rates. The netchanges in each of these three components can be determinedfor each of our customers. However, because our agencymanagement accounting systems do not aggregate such data, itis not reportable. Core organic commissions and fees reflecteither “positive” growth with a net increase in revenues, or“negative” growth with a net decrease in revenues.
The internal growth rates for our core organic commissionsand fees for the three years ended December 31, 2013, 2012 and2011, by Division, are as follows:
The reconciliation of the above internal growth schedule to the total Commissions and Fees included in the ConsolidatedStatements of Income for the years ended December 31, 2013 and 2012 is as follows:
Retail (1) $ 699,571 $ 611,156 $ 88,415 14.5% $ 79,455 $ 8,960 1.5%
National Programs 271,772 233,261 38,511 16.5% 7,099 31,412 13.5%
Wholesale Brokerage 193,601 168,151 25,450 15.1% 4,332 21,118 12.6%
Services 131,033 116,247 14,786 12.7% 657 14,129 12.2%
Total core commissions and fees $ 1,295,977 $1,128,815 $ 167,162 14.8% $ 91,543 $ 75,619 6.7%
(in thousands)
For the YearEnded December 31,
2013 2012Total Net
ChangeTotal Net
Growth %
LessAcquisition
RevenuesInternal Net
Growth $Internal Net
Growth %
(in thousands, except percentages)
2013
For the Year Ended December 31,
2013 2012
Total core commissions and fees $ 1,295,977 $1,128,815Profit-sharing contingent commissions 51,251 43,683Guaranteed supplemental commissions 8,275 9,146Divested business –––– 7,437
Total commissions and fees $ 1,355,503 $1,189,081
BB_2013AR_FINAL_3-98_Layout 1 3/18/14 2:31 PM Page 48

49
The reconciliation of the above internal growth schedule to the total Commissions and Fees included in the ConsolidatedStatements of Income for the years ended December 31, 2012 and 2011 is as follows:
The reconciliation of the above internal growth schedule to the total Commissions and Fees included in the ConsolidatedStatements of Income for the years ended December 31, 2011 and 2010 is as follows:
(1) The Retail Division figures include commissions and fees reported in the “Other” column of the Segment Information in Note 15 of the Notes to the Consolidated Financial Statements, which includes corporate and consolidation items.
Retail (1) $ 580,304 $ 544,004 $ 36,300 6.7 % $ 57,541 $ (21,241) (3.9)%
National Programs 148,842 152,209 (3,367) (2.2)% 1,140 (4,507) (3.0)%
Wholesale Brokerage 156,664 151,822 4,842 3.2 % 1,186 3,656 2.4 %
Services 64,875 46,486 18,389 39.6 % 17,773 616 1.3 %
Total core commissions and fees $ 950,685 $ 894,521 $ 56,164 6.3 % $ 77,640 $ (21,476) (2.4)%
For the YearEnded December 31,2011 2010
Total NetChange
Total NetGrowth %
LessAcquisition
RevenuesInternal Net
Growth $Internal Net
Growth %
(in thousands, except percentages)
2011
Retail (1) $ 618,562 $ 571,129 $ 47,433 8.3% $ 38,734 $ 8,699 1.5%
National Programs 233,261 148,841 84,420 56.7% 83,281 1,139 0.8%
Wholesale Brokerage 168,182 155,151 13,031 8.4% 3,598 9,433 6.1%
Services 116,247 64,875 51,372 79.2% 45,783 5,589 8.6%
Total core commissions and fees $ 1,136,252 $ 939,996 $ 196,256 20.9% $ 171,396 $ 24,860 2.6%
For the YearEnded December 31,
2012 2011Total Net
ChangeTotal Net
Growth %
LessAcquisition
RevenuesInternal Net
Growth $Internal Net
Growth %
(in thousands, except percentages)
2012
Total core commissions and fees $ 950,685 $ 894,521
Profit-sharing contingent commissions 43,198 54,732
Guaranteed supplemental commissions 12,079 13,352
Divested business –––– 4,312
Total commissions and fees $ 1,005,962 $ 966,917
For the Year Ended December 31,
2011 2010(in thousands)
Total core commissions and fees $ 1,136,252 $ 939,996
Profit-sharing contingent commissions 43,683 43,198
Guaranteed supplemental commissions 9,146 12,079
Divested business –––– 10,689
Total commissions and fees $ 1,189,081 $ 1,005,962
For the Year Ended December 31,
2012 2011(in thousands)
BB_2013AR_March20_FIN_Layout 1 3/20/14 3:38 PM Page 49

50
Management’s Discussion and Analysis ofFinancial Condition and Results of Operations
RETAIL DIVISION The Retail Division provides a broad range of insurance products and services to commercial, public and quasi-public,
professional and individual insured customers. Approximately 89.9% of the Retail Division’s commissions and fees revenue iscommission-based. Because most of our other operating expenses do not change as premiums fluctuate, we believe that most ofany fluctuation in the commissions, net of related compensation, which we receive will be reflected in our pre-tax income.
Financial information relating to Brown & Brown’s Retail Division is as follows:
Percent Percent(in thousands, except percentages) 2013 Change 2012 Change 2011
REVENUES
Core commissions and fees $ 700,767 13.0 % $ 619,975 6.7 % $ 581,125
Profit-sharing contingent commissions 17,543 36.6 % 12,843 (12.8)% 14,736
Guaranteed supplemental commissions 6,849 (0.6)% 6,890 (24.3)% 9,105
Investment income 82 (24.1)% 108 5.9 % 102
Other income, net 3,083 (33.2)% 4,613 116.5 % 2,131
Total revenues 728,324 13.0 % 644,429 6.1 % 607,199
EXPENSES
Employee compensation and benefits 363,332 11.3 % 326,574 7.5 % 303,841
Non-cash stock-based compensation 9,055 59.4 % 5,680 (7.1)% 6,114
Other operating expenses 113,159 14.8 % 98,532 (0.2)% 98,745
Amortization 38,052 9.9 % 34,639 3.8 % 33,373
Depreciation 5,847 12.9 % 5,181 2.7 % 5,046
Interest 34,407 29.2 % 26,641 (3.8)% 27,688
Change in estimated acquisition earn-out payables (1,844) NMF(1) 1,968 NMF(1) (5,415)
Total expenses 562,008 12.6 % 499,215 6.4 % 469,392
Income before income taxes $ 166,316 14.5 % $ 145,214 5.4 % $ 137,807
Net internal growth rate –core organic commissions and fees 1.5% 1.5% (3.9)%
Employee compensation and benefits ratio 49.9% 50.7% 50.0 %
Other operating expenses ratio 15.5% 15.3% 16.3 %
Capital expenditures $ 6,847 $ 5,732 $ 6,102
Total assets at December 31 $ 2,992,087 $ 2,420,759 $2,155,413
(1) NMF=Not a meaningful figure
BB_2013AR_March20_FIN_Layout 1 3/20/14 3:38 PM Page 50

51
The Retail Division’s total revenues in 2013 increased13.0%, or $83.9 million, over the same period in 2012, to $728.3million. Profit-sharing contingent commissions and GSCs in2013 increased $4.7 million, or 23.6%, over 2012, to $24.4million, primarily due to improved loss ratios resulting inincreased profitability for insurance companies in 2013. The$80.8 million net increase in core commissions and feesrevenue resulted from the following factors: (i) an increase ofapproximately $79.5 million related to core commissions andfees revenue from acquisitions that had no comparablerevenues in 2012; (ii) a decrease of $7.5 million related tocommissions and fees revenue recorded in 2012 from businessdivested during 2013; and (iii) the remaining net increase of$9.0 million primarily related to net new business. The RetailDivision’s internal growth rate for core organic commissions andfees revenue was 1.5% for 2013, and was driven by slightlyincreasing insurable exposure units in most areas of the UnitedStates, and slight increases in general insurance premium rates.
Income before income taxes for 2013 increased 14.5%, or$21.1 million, over the same period in 2012, to $166.3 million.This increase was primarily due to net new business, theincrease in profit-sharing contingent commissions, andcontinued improved efficiencies relating to compensation andemployee benefits and certain other operating expenses, butwhich was partially off-set by a $1.5 million reduction in otherincome primarily due to gains on the sale of books ofbusinesses in 2012. These increases were also enhanced bychanges in estimated acquisition earn-out payables of $3.8million, but partially offset by a net increase in the inter-company interest expense allocation of $7.8 million. Thecontinued improved efficiencies relating to compensation andemployee benefits, and certain other operating expensesresulted mainly from such costs increasing at a lower rate thanour growth in net new business. However, a portion of theimproved ratio of employee compensation and benefits tototal revenues was the result of the $6.8 million of bonuscompensation related to a special one-time bonus in 2012which was not repeated in 2013.
The Retail Division’s total revenues in 2012 increased6.1%, or $37.2 million, over the same period in 2011, to $644.4million. Profit-sharing contingent commissions and GSCs in2012 decreased $4.1 million, or 17.2%, from 2011, to $19.7million, primarily due to increased loss ratios resulting in lowerprofitability for insurance companies in 2011, and to the fact
that two national insurance carriers who provided us GSCcontracts in 2011 changed to profit-sharing contingencycontracts in 2012. The $38.9 million net increase in corecommissions and fees revenue resulted from the followingfactors: (i) an increase of approximately $38.7 million relatedto core commissions and fees revenue from acquisitions thathad no comparable revenues in 2011, (ii) a decrease of $8.5million related to commissions and fees revenue recorded in2011 from business divested or transferred to the WholesaleBrokerage Division during 2012, and (iii) the remaining netincrease of $8.7 million primarily related to net new business.The Retail Division’s internal growth rate for core organiccommissions and fees revenue was 1.5% for 2012, andresulted primarily from stabilizing insurable exposure unitswith slightly stronger upward pressure on general insurancepremium rates.
Income before income taxes for 2012 increased 5.4%, or$7.4 million, over the same period in 2011, to $145.2 million.Included in the $7.4 million net increase in income beforeincome taxes is another $7.4 million net expense increase inchange in estimated acquisition earn-out payables and a $0.3million net expense increase from amortization, depreciationand inter-company interest changes. Excluding these itemsand the $4.1 million decrease in profit-sharing contingentcommissions and GSCs, income before income taxes for 2012increased $19.2 million over 2011, of which $8.7 millionoriginated from new acquisitions that were stand-aloneoperations, and $10.5 million was generated by offices inexistence in both 2011 and 2012. Of the $10.5 million increasefrom existing offices, $8.7 million ($1.4 million of fold-inacquired revenues) was attributed to organic growth of corecommissions and fees, $5.6 million cost savings from otheroperating expenses, $0.5 reduction in non-cash stock-basedcompensation, but partially offset by $4.9 million increase incompensation and employee benefits. The $4.9 million netincrease in compensation and employee benefits was primarilydue to the one-time producer bonuses of $6.8 million paid tocommissioned producers whose 2012 production exceededtheir 2011 production by at least five percent, which waspartially offset by a reduction of approximately $2.0 millionless staff salaries. The $5.6 million reduction in other operatingexpenses was primarily related to reductions inoccupancy/office rents, legal and claims settlements,insurance expense, and data processing costs.
BB_2013AR_FINAL_3-98_Layout 1 3/18/14 2:31 PM Page 51

52
Management’s Discussion and Analysis ofFinancial Condition and Results of Operations
NATIONAL PROGRAMS DIVISION The National Programs Division provides professional liability and related package products for certain professionals delivered
through nationwide networks of independent agents, and markets targeted products and services designated for specificindustries, trade groups, public and quasi-public entities and market niches. Like the Retail Division and the Wholesale BrokerageDivision, the National Programs Division’s revenues are primarily commission-based.
Financial information relating to our National Programs Division is as follows:
REVENUES
Core commissions and fees $ 271,772 16.5 % $ 233,261 56.7 % $ 148,842
Profit-sharing contingent commissions 19,265 4.7 % 18,392 22.4 % 15,029
Guaranteed supplemental commissions (23) (108.3)% 276 (42.6)% 481
Investment income 19 (5.0)% 20 ––– % –––
Other income, net 1,097 10.4 % 994 NMF(1) 75
Total revenues 292,130 15.5 % 252,943 53.8 % 164,427
EXPENSES
Employee compensation and benefits 132,948 20.5 % 110,362 63.4 % 67,560
Non-cash stock-based compensation 4,604 24.2 % 3,707 177.5 % 1,336
Other operating expenses 53,001 19.8 % 44,248 88.4 % 23,486
Amortization 14,593 4.7 % 13,936 79.4 % 7,770
Depreciation 5,399 17.4 % 4,600 56.6 % 2,937
Interest 24,014 (6.5)% 25,674 NMF(1) 1,381
Change in estimated acquisition
earn-out payables (808) (24.8)% (1,075) 111.6 % (508)
Total expenses 233,751 16.0 % 201,452 93.8 % 103,962
Income before income taxes $ 58,379 13.4 % $ 51,491 (14.8)% $ 60,465
Net internal growth rate –
core organic commissions and fees 13.5% 0.8% (3.0)%
Employee compensation and benefits ratio 45.5% 43.6% 41.1%
Other operating expenses ratio 18.1% 17.5% 14.3%
Capital expenditures $ 4,473 $ 9,633 $ 1,968
Total assets at December 31 $ 1,335,911 $ 1,183,191 $ 680,251
(1) NMF=Not a meaningful figure
Percent Percent(in thousands, except percentages) 2013 Change 2012 Change 2011
BB_2013AR_March20_FIN_Layout 1 3/20/14 3:39 PM Page 52

53
The National Programs Division’s total revenues in 2013increased $39.2 million to $292.1 million, a 15.5% increase over2012. Profit-sharing contingent commissions and GSCs in 2013increased $0.6 million over 2012, due primarily to a $3.7 millionincrease in profit-sharing contingent commissions received byFlorida Intracoastal Underwriters, Limited Company (“FIU”), butwhich was partially offset by a decrease of $3.5 million atProctor Financial, Ins, (“Proctor”). The $38.5 million net increasein core commissions and fees resulted from the followingfactors: (i) an increase of approximately $7.1 million related tothe core commissions and fees revenue from acquisitions thathad no comparable revenues in 2012; and (ii) the remaining netincrease of $31.4 million primarily related to net new business.Therefore, the National Programs Division’s internal growth ratefor core organic commissions and fees revenue was 13.5% for2013. Of the $31.4 million of net new business, $27.7 millionrelated to a net increase in commissions and fees revenue fromour Arrowhead operations.
Income before income taxes for 2013 increased 13.4% or$6.9 million, over the same period in 2012, to $58.4 million.This net increase was primarily due to the new automobileaftermarket and the non-standard auto programs at ourArrowhead subsidiary. Even though these programs increasedthe total operating profit dollars for the Division, the ratios ofemployee compensation and benefits, and other operatingexpenses as a percentage to total revenues increased over theprior year was due to the fact that these programs operated ata higher cost factor than the average program operated in 2012.
The National Programs Division’s total revenues in 2012increased $88.5 million to $252.9 million, a 53.8% increaseover 2011. Profit-sharing contingent commissions and GSCs in2012 increased $3.2 million over 2011, due primarily to profit-sharing contingent commissions earned at our Arrowheadoperation. Of the $84.4 million net increase in corecommissions and fees for National Programs: (i) an increase ofapproximately $83.3 million related to the core commissionsand fees revenue from acquisitions that had no comparablerevenues in 2011; and (ii) a net increase of $1.1 million wasprimarily related to net new business. Therefore, the NationalPrograms Division’s internal growth rate for core organiccommissions and fees revenue was 0.8% for 2012. Of the $1.1million of net new business, $2.2 million related to a netincrease in commissions and fees revenue at Proctor, whichwas partially offset by $1.7 million of net lost business in ourfacultative reinsurance facility, and the remaining $0.6 millionof net new business was generated by various other programs.
Income before income taxes for 2012 decreased 14.8%,or $9.0 million, from the same period in 2011, to $51.5 million.This net decrease was due to: (i) a reduction of $5.6 millionfrom the offices that existed in both 2012 and 2011, primarilyas a result of reduced profit-sharing contingent commissionsand GSCs of $1.3 million and increased compensationexpense mainly related to increased staffing levels at Proctor,(ii) loss before income taxes and change in estimatedacquisition earn-out payables of ($4.8) million related tonew acquisitions that were stand-alone offices (primarily theArrowhead acquisition), and (iii) a $1.4 million income creditgenerated from the change in estimated acquisition earn-outpayables. Income before income taxes and inter-companyinterest expense related to new acquisitions that were stand-alone offices (primarily the Arrowhead acquisition) that hadno comparable earnings in the same period of 2011 wasapproximately $21.7 million for 2012; however those earningswere offset by $25.0 million of inter-company interestexpense allocation.
BB_2013AR_FINAL_3-98_Layout 1 3/18/14 2:31 PM Page 53

54
Management’s Discussion and Analysis ofFinancial Condition and Results of Operations
WHOLESALE BROKERAGE DIVISION The Wholesale Brokerage Division markets and sells excess and surplus commercial and personal lines insurance and
reinsurance, primarily through independent agents and brokers. Like the Retail and National Programs Divisions, the WholesaleBrokerage Division’s revenues are primarily commission-based.
Financial information relating to our Wholesale Brokerage Division is as follows:
REVENUES
Core commissions and fees $ 193,601 15.1 % $ 168,182 7.4 % $ 156,664
Profit-sharing contingent commissions 14,443 16.0 % 12,448 (7.3)% 13,433
Guaranteed supplemental commissions 1,449 (33.9)% 2,192 (10.5)% 2,450
Investment income 22 ––– % 22 (35.3)% 34
Other income, net 392 (45.6)% 721 (54.3)% 1,577
Total revenues 209,907 14.4 % 183,565 5.4 % 174,158
EXPENSES
Employee compensation and benefits 98,144 12.4 % 87,293 5.2 % 82,974
Non-cash stock-based compensation 2,039 53.5 % 1,328 (10.4)% 1,482
Other operating expenses 36,589 9.3 % 33,486 6.7 % 31,379
Amortization 11,550 2.4 % 11,280 2.2 % 11,032
Depreciation 2,794 2.8 % 2,718 4.8 % 2,594
Interest 2,565 (35.5)% 3,974 (47.0)% 7,495
Change in estimated acquisition earn-out payables 2,404 NMF(1) 131 (81.0)% 691
Total expenses 156,085 11.3 % 140,210 1.9 % 137,647
Income before income taxes $ 53,822 24.1 % $ 43,355 18.7 % $ 36,511
Net internal growth rate –core organic commissions and fees 12.6% 6.1% 2.4%
Employee compensation and benefits ratio 46.8% 47.6% 47.6%
Other operating expenses ratio 17.4% 18.2% 18.0%
Capital expenditures $ 1,931 $ 3,383 $ 2,658
Total assets at December 31 $ 927,825 $ 837,364 $ 712,212
(1) NMF=Not a meaningful figure
(in thousands, except percentages) Percent Percent2013 Change 2012 Change 2011
BB_2013AR_FINAL_3-98_Layout 1 3/18/14 2:31 PM Page 54

55
The Wholesale Brokerage Division’s total revenues for2013 increased 14.4%, or $26.3 million, over the same periodin 2012, to $209.9 million. Profit-sharing contingentcommissions and GSCs for 2013 increased $1.3 million overthe same period of 2012. The $25.4 million net increase in corecommissions and fees revenue resulted from the followingfactors: (i) an increase of approximately $4.3 million related tothe core commissions and fees revenue from acquisitions thathad no comparable revenues in the same period of 2012; and(ii) the remaining net increase of $21.1 million primarily relatedto net new business and continued increases in premium rateson many lines of insurance, but primarily on coastal property.As such, the Wholesale Brokerage Division’s internal growthrate for core organic commissions and fees revenue was 12.6%for 2013.
Income before income taxes for 2013 increased 24.1%, or$10.5 million over the same period in 2012 to $53.8 million,primarily due to net new business, an increase in profit-sharingcontingent commissions, and a net reduction in the inter-company interest expense allocation of $1.4 million, but thenpartially offset by a $2.3 million expense in the form of achange in estimated acquisition earn-out payables.
The Wholesale Brokerage Division’s total revenues for2012 increased 5.4%, or $9.4 million, over the same period in2011, to $183.6 million. Profit-sharing contingent commissionsand GSCs for 2012 decreased $1.2 million from the sameperiod of 2011, primarily due to developed losses andincreased loss ratios experienced by our insurance carrierpartners. Of the $11.5 million net increase in core commissionsand fees revenue: (i) an increase of approximately $3.6 millionrelated to the core commissions and fees revenue fromacquisitions that had no comparable revenues in the sameperiod of 2011; (ii) a decrease of $1.5 million related tocommissions and fees revenue recorded in 2011 from businessdivested or transferred from the Retail Division during 2012;and (iii) the remaining net increase of $9.4 million primarilyrelated to net new business and continued increases inpremium rates on many lines of insurance, but primarily oncoastal property. As such, the Wholesale Brokerage Division’sinternal growth rate for core organic commissions and feesrevenue was 6.1% for 2012.
Income before income taxes for 2012 increased 18.7%, or$6.8 million over the same period in 2011 to $43.4 million,primarily due to a net reduction in the inter-company interestexpense allocation of $3.5 million. Additionally, while totalrevenues increased by $9.4 million, employee compensationand benefits cost increased $4.3 million, and other operatingexpenses increased by $2.1 million. Employee compensationand benefit expense increased primarily due to higher bonusexpense as a result of the Division’s increased profitability, and$1.2 million in new producer salaries. Other operatingexpenses increased as a result of higher costs for dataprocessing, telephone and inter-company overhead charges.
BB_2013AR_FINAL_3-98_Layout 1 3/18/14 2:31 PM Page 55

56
Management’s Discussion and Analysis ofFinancial Condition and Results of Operations
SERVICES DIVISION The Services Division provides insurance-related services, including third-party claims administration (“TPA”) and comprehensive
medical utilization management services in both the workers’ compensation and all-lines liability arenas, as well as Medicare set-asideservices, Social Security disability and Medicare benefits advocacy services, and catastrophe claims adjusting services.
Unlike our other segments, nearly all of the Services Division’s 2013 commissions and fees revenue was generated from fees,which are not significantly affected by fluctuations in general insurance premiums.
Financial information relating to our Services Division is as follows:
REVENUES
Core commissions and fees $ 131,033 12.7 % $ 116,247 79.2 % $ 64,875
Profit-sharing contingent commissions ––– ––– % ––– ––– % –––
Guaranteed supplemental commissions ––– ––– % ––– ––– % –––
Investment income 1 ––– % 1 (99.2)% 128
Other income, net 455 (6.8)% 488 (49.6)% 969
Total revenues 131,489 12.6 % 116,736 76.9 % 65,972
EXPENSES
Employee compensation and benefits 62,908 6.2 % 59,235 71.7 % 34,494
Non-cash stock-based compensation 755 26.5 % 597 171.4 % 220
Other operating expenses 27,885 6.5 % 26,180 125.2 % 11,626
Amortization 3,698 0.5 % 3,680 44.8 % 2,541
Depreciation 1,623 27.0 % 1,278 116.6 % 590
Interest 7,321 (14.9)% 8,602 49.7 % 5,746
Change in estimated acquisition earn-out payables 2,781 605.8 % 394 (87.0)% 3,026
Total expenses 106,971 7.0 % 99,966 71.6 % 58,243
Income before income taxes $ 24,518 46.2 % $ 16,770 117.0 % $ 7,729
Net internal growth rate –core organic commissions and fees 12.2% 8.6% 1.3%
Employee compensation and benefits ratio 47.8% 50.7% 52.3%
Other operating expenses ratio 21.2% 22.4% 17.6%
Capital expenditures $ 1,811 $ 2,519 $ 689
Total assets at December 31 $ 277,652 $ 238,430 $ 166,060
Percent Percent(in thousands, except percentages) 2013 Change 2012 Change 2011
BB_2013AR_FINAL_3-98_Layout 1 3/18/14 2:31 PM Page 56

57
The Services Division’s total revenues for 2013 increased12.6%, or $14.8 million, over 2012, to $131.5 million. Of the$14.8 million net increase in core commissions and feesrevenue: (i) an increase of approximately $0.7 million relatedto the core commissions and fees revenue from the TPAbusiness acquired as part of the Arrowhead acquisition, thathad no comparable revenues in the same period of 2012; and(ii) net new business of $14.1 million, of which $13.0 millionwas due to our Colonial Claims operation and the impact ofthe significant flood claims resulting from the 2012Superstorm Sandy. As such, the Services Division’s internalgrowth rate for core organic commissions and fees revenuewas 12.2% for 2013.
Income before income taxes in 2013 increased 46.2%, or$7.7 million, over 2012, to $24.5 million, primarily due to netnew business from our Colonial Claims operation. Additionally,this net increase was enhanced by a $1.3 million reduction ininter-company interest expense, but partially offset by a $2.4million expense from changes in estimated earn-out payables.
The Services Division’s total revenues for 2012 increased76.9%, or $50.8 million, over 2011, to $116.7 million. Of the$51.4 million net increase in core commissions and feesrevenue: (i) an increase of approximately $45.8 million relatedto the core commissions and fees revenue from acquisitionsthat had no comparable revenues in the same period of 2011;and (ii) the remaining net increase $5.6 million primarilyrelated to net new business. As such, the Services Division’sinternal growth rate for core organic commissions and feesrevenue was 8.6% for 2012.
Income before income taxes in 2012 increased $9.0million over 2011. This net increase was due to: (i) a netincrease of $1.2 million from the offices that existed in both2012 and 2011, excluding the impact of the change inestimated acquisition earn-out payables, (ii) income beforeincome taxes and change in estimated acquisition earn-outpayables of $5.2 million related to new acquisitions that werestand-alone offices, and (iii) a $2.6 million income creditgenerated from the change in estimated acquisition earn-outpayables. Income before income taxes, and inter-companyinterest expense and change in estimated acquisition earn-outpayables, related to new acquisitions that were stand-aloneoffices that had no comparable earnings in the same period of2011 totaled approximately $8.8 million for 2012; however,those earnings were partially offset by $3.6 million of inter-company interest expense allocation.
OTHER As discussed in Note 15 of the Notes to Consolidated
Financial Statements, the “Other” column in the SegmentInformation table includes all income and expenses notallocated to reportable segments, as well as corporate-relateditems, including the inter-company interest expense chargesto reporting segments.
BB_2013AR_FINAL_3-98_Layout 1 3/18/14 2:31 PM Page 57
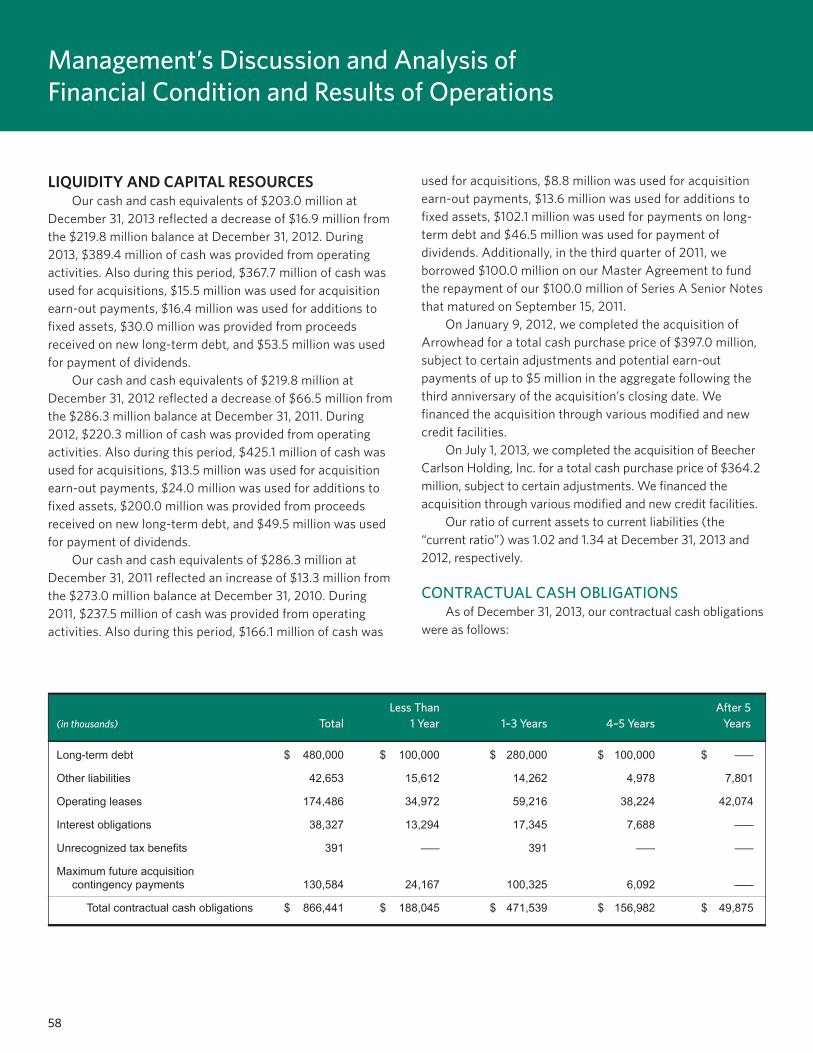
58
Management’s Discussion and Analysis ofFinancial Condition and Results of Operations
LIQUIDITY AND CAPITAL RESOURCES Our cash and cash equivalents of $203.0 million at
December 31, 2013 reflected a decrease of $16.9 million fromthe $219.8 million balance at December 31, 2012. During2013, $389.4 million of cash was provided from operatingactivities. Also during this period, $367.7 million of cash wasused for acquisitions, $15.5 million was used for acquisitionearn-out payments, $16.4 million was used for additions tofixed assets, $30.0 million was provided from proceedsreceived on new long-term debt, and $53.5 million was usedfor payment of dividends.
Our cash and cash equivalents of $219.8 million atDecember 31, 2012 reflected a decrease of $66.5 million fromthe $286.3 million balance at December 31, 2011. During2012, $220.3 million of cash was provided from operatingactivities. Also during this period, $425.1 million of cash wasused for acquisitions, $13.5 million was used for acquisitionearn-out payments, $24.0 million was used for additions tofixed assets, $200.0 million was provided from proceedsreceived on new long-term debt, and $49.5 million was usedfor payment of dividends.
Our cash and cash equivalents of $286.3 million atDecember 31, 2011 reflected an increase of $13.3 million fromthe $273.0 million balance at December 31, 2010. During2011, $237.5 million of cash was provided from operatingactivities. Also during this period, $166.1 million of cash was
used for acquisitions, $8.8 million was used for acquisitionearn-out payments, $13.6 million was used for additions tofixed assets, $102.1 million was used for payments on long-term debt and $46.5 million was used for payment ofdividends. Additionally, in the third quarter of 2011, weborrowed $100.0 million on our Master Agreement to fundthe repayment of our $100.0 million of Series A Senior Notesthat matured on September 15, 2011.
On January 9, 2012, we completed the acquisition ofArrowhead for a total cash purchase price of $397.0 million,subject to certain adjustments and potential earn-outpayments of up to $5 million in the aggregate following thethird anniversary of the acquisition’s closing date. Wefinanced the acquisition through various modified and newcredit facilities.
On July 1, 2013, we completed the acquisition of BeecherCarlson Holding, Inc. for a total cash purchase price of $364.2million, subject to certain adjustments. We financed theacquisition through various modified and new credit facilities.
Our ratio of current assets to current liabilities (the“current ratio”) was 1.02 and 1.34 at December 31, 2013 and2012, respectively.
CONTRACTUAL CASH OBLIGATIONS As of December 31, 2013, our contractual cash obligations
were as follows:
Less Than After 5(in thousands) Total 1 Year 1–3 Years 4–5 Years Years
Long-term debt $ 480,000 $ 100,000 $ 280,000 $ 100,000 $ –––
Other liabilities 42,653 15,612 14,262 4,978 7,801
Operating leases 174,486 34,972 59,216 38,224 42,074
Interest obligations 38,327 13,294 17,345 7,688 –––
Unrecognized tax benefits 391 ––– 391 ––– –––
Maximum future acquisitioncontingency payments 130,584 24,167 100,325 6,092 –––
Total contractual cash obligations $ 866,441 $ 188,045 $ 471,539 $ 156,982 $ 49,875
BB_2013AR_FINAL_3-98_Layout 1 3/18/14 2:31 PM Page 58

59
DEBT In July 2004, we completed a private placement of
$200.0 million of unsecured senior notes (the “Notes”). The$200.0 million was divided into two series: (1) Series A, whichclosed on September 15, 2004, for $100.0 million due in 2011and bore interest at 5.57% per year; and (2) Series B, whichclosed on July 15, 2004, for $100.0 million due in 2014 andbearing interest at 6.08% per year. We have used theproceeds from the Notes for general corporate purposes,including acquisitions and repayment of existing debt. OnSeptember 15, 2011, the $100.0 million of Series A Notes wereredeemed on their normal maturity date. As of December 31,2013 and December 31, 2012, there was an outstandingbalance on the Notes of $100.0 million.
On December 22, 2006, we entered into a Master Shelfand Note Purchase Agreement (the “Master Agreement”)with a national insurance company (the “Purchaser”). OnSeptember 30, 2009, we and the Purchaser amended theMaster Agreement to extend the term of the agreement untilAugust 20, 2012. The Purchaser also purchased Notes issuedby us in 2004. The Master Agreement provides for a $200.0million private uncommitted “shelf” facility for the issuance ofsenior unsecured notes over a three-year period, with interestrates that may be fixed or floating and with such maturitydates, not to exceed ten years, as the parties may determine.The Master Agreement includes various covenants, limitationsand events of default similar to the Notes issued in 2004. Theinitial issuance of notes under the Master Agreement occurredon December 22, 2006, through the issuance of $25.0 millionin Series C Senior Notes due December 22, 2016, with a fixedinterest rate of 5.66% per year. On February 1, 2008, $25.0million in Series D Senior Notes due January 15, 2015, with afixed interest rate of 5.37% per year, were issued. OnSeptember 15, 2011, and pursuant to a Confirmation ofAcceptance, dated January 21, 2011 (the “Confirmation”), inconnection with the Master Agreement, $100.0 million inSeries E Senior Notes due September 15, 2018, with a fixedinterest rate of 4.50% per year, were issued. The Series ESenior Notes were issued for the sole purpose of retiring theSeries A Senior Notes. As of December 31, 2013 andDecember 31, 2012, there was an outstanding debt balance of$150.0 million attributable to notes issued under theprovisions of the Master Agreement. The Master Agreementexpired on September 30, 2012 and was not extended.
On October 12, 2012, we entered into a Master NoteFacility Agreement (the “New Master Agreement”) withanother national insurance company (the “New Purchaser”).The New Purchaser also purchased Notes issued by us in2004. The New Master Agreement provides for a $125.0million private uncommitted “shelf” facility for the issuance ofunsecured senior notes over a three-year period, with interestrates that may be fixed or floating and with such maturitydates, not to exceed ten years, as the parties may determine.The New Master Agreement includes various covenants,limitations and events of default similar to the MasterAgreement. At December 31, 2013 and December 31, 2012,there were no borrowings against this facility.
On June 12, 2008, we entered into an Amended andRestated Revolving Loan Agreement dated as of June 3, 2008(the “Prior Loan Agreement”), with a national bankinginstitution, amending and restating the Revolving LoanAgreement dated September 29, 2003, as amended (the“Revolving Agreement”), to, among other things, increase thelending commitment to $50.0 million (subject to potentialincreases up to $100.0 million) and to extend the maturitydate from December 20, 2011, to June 3, 2013. The RevolvingAgreement initially provided for a revolving credit facility in themaximum principal amount of $75.0 million. After a series ofamendments that provided covenant exceptions for additionalnotes issued or to be issued under the Master Agreement andrelaxed or deleted certain other covenants, the maximumprincipal amount was reduced to $20.0 million. The RevolvingAgreement was amended and restated by the SunTrustRevolver (as defined in the below paragraph).
BB_2013AR_FINAL_3-98_Layout 1 3/18/14 2:31 PM Page 59
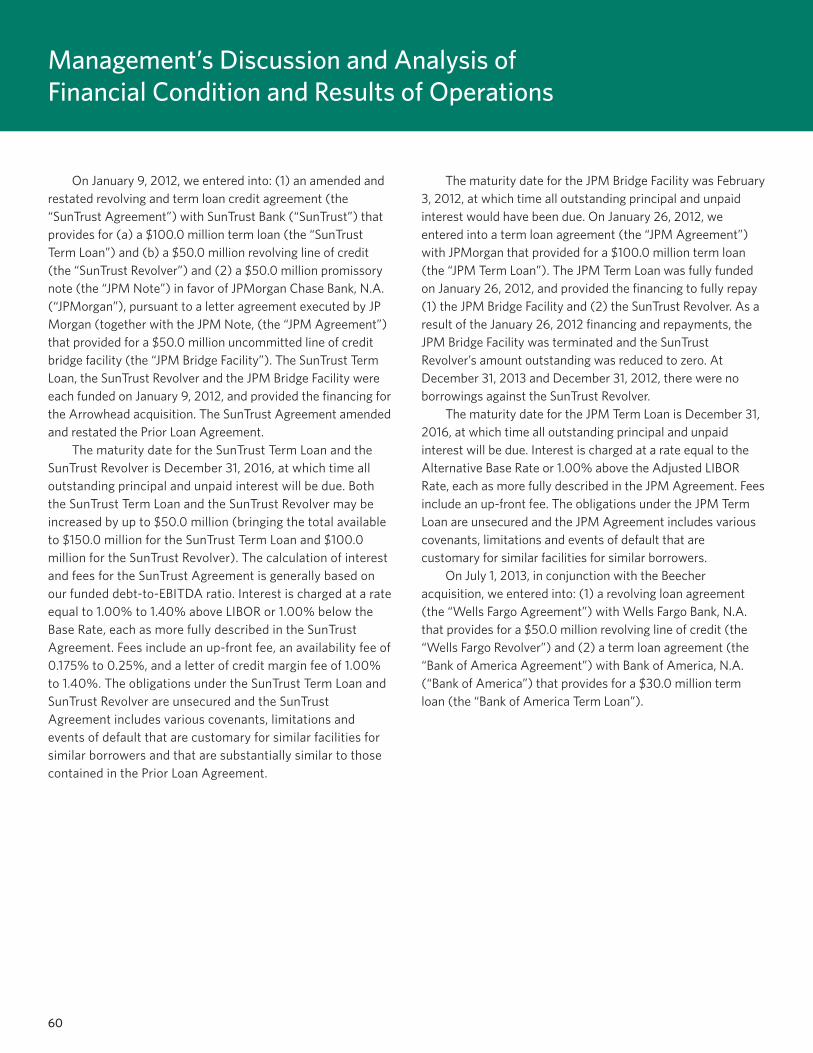
60
Management’s Discussion and Analysis ofFinancial Condition and Results of Operations
On January 9, 2012, we entered into: (1) an amended andrestated revolving and term loan credit agreement (the“SunTrust Agreement”) with SunTrust Bank (“SunTrust”) thatprovides for (a) a $100.0 million term loan (the “SunTrustTerm Loan”) and (b) a $50.0 million revolving line of credit(the “SunTrust Revolver”) and (2) a $50.0 million promissorynote (the “JPM Note”) in favor of JPMorgan Chase Bank, N.A.(“JPMorgan”), pursuant to a letter agreement executed by JPMorgan (together with the JPM Note, (the “JPM Agreement”)that provided for a $50.0 million uncommitted line of creditbridge facility (the “JPM Bridge Facility”). The SunTrust TermLoan, the SunTrust Revolver and the JPM Bridge Facility wereeach funded on January 9, 2012, and provided the financing forthe Arrowhead acquisition. The SunTrust Agreement amendedand restated the Prior Loan Agreement.
The maturity date for the SunTrust Term Loan and theSunTrust Revolver is December 31, 2016, at which time alloutstanding principal and unpaid interest will be due. Boththe SunTrust Term Loan and the SunTrust Revolver may beincreased by up to $50.0 million (bringing the total availableto $150.0 million for the SunTrust Term Loan and $100.0million for the SunTrust Revolver). The calculation of interestand fees for the SunTrust Agreement is generally based onour funded debt-to-EBITDA ratio. Interest is charged at a rateequal to 1.00% to 1.40% above LIBOR or 1.00% below theBase Rate, each as more fully described in the SunTrustAgreement. Fees include an up-front fee, an availability fee of0.175% to 0.25%, and a letter of credit margin fee of 1.00%to 1.40%. The obligations under the SunTrust Term Loan andSunTrust Revolver are unsecured and the SunTrustAgreement includes various covenants, limitations andevents of default that are customary for similar facilities forsimilar borrowers and that are substantially similar to thosecontained in the Prior Loan Agreement.
The maturity date for the JPM Bridge Facility was February3, 2012, at which time all outstanding principal and unpaidinterest would have been due. On January 26, 2012, weentered into a term loan agreement (the “JPM Agreement”)with JPMorgan that provided for a $100.0 million term loan(the “JPM Term Loan”). The JPM Term Loan was fully fundedon January 26, 2012, and provided the financing to fully repay(1) the JPM Bridge Facility and (2) the SunTrust Revolver. As aresult of the January 26, 2012 financing and repayments, theJPM Bridge Facility was terminated and the SunTrustRevolver’s amount outstanding was reduced to zero. AtDecember 31, 2013 and December 31, 2012, there were noborrowings against the SunTrust Revolver.
The maturity date for the JPM Term Loan is December 31,2016, at which time all outstanding principal and unpaidinterest will be due. Interest is charged at a rate equal to theAlternative Base Rate or 1.00% above the Adjusted LIBORRate, each as more fully described in the JPM Agreement. Feesinclude an up-front fee. The obligations under the JPM TermLoan are unsecured and the JPM Agreement includes variouscovenants, limitations and events of default that arecustomary for similar facilities for similar borrowers.
On July 1, 2013, in conjunction with the Beecheracquisition, we entered into: (1) a revolving loan agreement(the “Wells Fargo Agreement”) with Wells Fargo Bank, N.A.that provides for a $50.0 million revolving line of credit (the“Wells Fargo Revolver”) and (2) a term loan agreement (the“Bank of America Agreement”) with Bank of America, N.A.(“Bank of America”) that provides for a $30.0 million termloan (the “Bank of America Term Loan”).
BB_2013AR_FINAL_3-98_Layout 1 3/18/14 2:31 PM Page 60

61
The maturity date for the Wells Fargo Revolver isDecember 31, 2016, at which time all outstanding principal andunpaid interest will be due. The Wells Fargo Revolver may beincreased by up to $50.0 million (bringing the total available to$100.0 million). The calculation of interest and fees for theWells Fargo Agreement is generally based on our funded debt-to-EBITDA ratio. Interest is charged at a rate equal to 1.00% to1.40% above LIBOR or 1.00% below the Base Rate, each asmore fully described in the Wells Fargo Agreement. Feesinclude an up-front fee, an availability fee of 0.175% to 0.25%,and a letter of credit margin fee of 1.00% to 1.40%. Theobligations under the Wells Fargo Revolver are unsecured andthe Wells Fargo Agreement includes various covenants,limitations and events of default that are customary for similarfacilities for similar borrowers. The Wells Fargo Revolver wasdrawn down in the amount of $30.0 million on July 1, 2013.There were no borrowings against the Wells Fargo Revolver asof December 31, 2013.
The maturity date for the Bank of America Term Loan isDecember 31, 2016, at which time all outstanding principaland unpaid interest will be due. The calculation of interest forthe Bank of America Agreement is generally based on ourfixed charge coverage ratio. Interest is charged at a rate equalto the Alternative Base Rate or 1.00% to 1.40% above theAdjusted LIBOR Rate, each as more fully described in theBank of America Agreement. Fees include an up-front fee.Initially, until Bank of America received our September 30,2013 quarter end financial statements, the applicable marginfor Adjusted LIBOR Rate advances was 1.50%. Theobligations under the Bank of America Term Loan areunsecured and the Bank of America Agreement includesvarious covenants, limitations and events of default that arecustomary for similar facilities for similar borrowers. TheBank of America Term Loan was funded in the amount of$30.0 million on July 1, 2013. As of December 31, 2013 therewas an outstanding balance of $30.0 million.
The 30-day LIBOR and Adjusted LIBOR Rate as ofDecember 31, 2013 were 0.16% and 0.19%, respectively.
The Notes, the Master Agreement, the SunTrustAgreement, the JPM Agreement and the Bank of AmericaAgreement require that we maintain certain financial ratiosand comply with certain other covenants. We were incompliance with all such covenants as of December 31, 2013and December 31, 2012.
Neither we nor our subsidiaries has ever incurred off-balance sheet obligations through the use of, or investment in,off-balance sheet derivative financial instruments or structuredfinance or special purpose entities organized as corporations,partnerships or limited liability companies or trusts.
We believe that our existing cash, cash equivalents, short-term investment portfolio and funds generated fromoperations, together with the SunTrust Revolver, the NewMaster Agreement, and the Wells Fargo Revolver will besufficient to satisfy our normal liquidity needs through at leastthe end of 2014. These liquidity needs include the total netconsideration of $602.5 million to be paid for the ownershipinterests of Wright (in addition, contingent consideration of upto $37.5 million may be payable if Wright completes certainagreed-upon acquisitions prior to closing). We currentlyanticipate financing this transaction with a combination ofcash and proceeds from one or more existing or new creditfacilities. We may seek to raise additional capital througheither the private or public debt markets to increase our cashand debt capacity. Additionally, we believe that fundsgenerated from future operations will be sufficient to satisfyour normal liquidity needs, including the required annualprincipal payments on our long-term debt.
Historically, much of our cash has been used foracquisitions. If additional acquisition opportunities shouldbecome available that exceed our current cash flow, we believethat given our relatively low debt-to-total-capitalization ratio,we would be able to raise additional capital through either theprivate or public debt markets. This incurrence of additionaldebt, however, could negatively impact our capital structureand liquidity. In addition, if we are unable to raise as muchadditional debt as we want, or at all, we could issue additionalequity to finance an acquisition which could have a dilutiveeffect on our current shareholders.
BB_2013AR_FINAL_3-98_Layout 1 3/18/14 2:31 PM Page 61

62
Consolidated Statements of Income
See accompanying notes to consolidated financial statements.
REVENUES
Commissions and fees $ 1,355,503 $ 1,189,081 $ 1,005,962
Investment income 638 797 1,267
Other income, net 7,138 10,154 6,313
Total revenues 1,363,279 1,200,032 1,013,542
EXPENSES
Employee compensation and benefits 683,000 608,506 508,675
Non-cash stock-based compensation 22,603 15,865 11,194
Other operating expenses 195,677 174,389 144,079
Amortization 67,932 63,573 54,755
Depreciation 17,485 15,373 12,392
Interest 16,440 16,097 14,132
Change in estimated acquisition earn-out payables 2,533 1,418 (2,206)
Total expenses 1,005,670 895,221 743,021
Income before income taxes 357,609 304,811 270,521
Income taxes 140,497 120,766 106,526
Net income $ 217,112 $ 184,045 $ 163,995
Net income per share:
Basic $ 1.50 $ 1.28 $ 1.15
Diluted $ 1.48 $ 1.26 $ 1.13
Weighted average number of shares outstanding:
Basic 141,033 139,364 138,582
Diluted 142,624 142,010 140,264
Dividends declared per share $ 0.3700 $ 0.3450 $ 0.3250
Year Ended December 31,(in thousands, except per share data) 2013 2012 2011
BB_2013AR_FINAL_3-98_Layout 1 3/18/14 2:31 PM Page 62

63
Consolidated Balance Sheets
See accompanying notes to consolidated financial statements.
ASSETS
Current Assets:
Cash and cash equivalents $ 202,952 $ 219,821
Restricted cash and investments 250,009 164,564
Short-term investments 10,624 8,183
Premiums, commissions and fees receivable 395,915 302,725
Deferred income taxes 29,276 24,408
Other current assets 39,260 39,811
Total current assets 928,036 759,512
Fixed assets, net 74,733 74,337
Goodwill 2,006,173 1,711,514
Amortizable intangible assets, net 618,888 566,538
Other assets 21,678 16,157
Total assets $ 3,649,508 $ 3,128,058
LIABILITIES AND SHAREHOLDERS’ EQUITY
Current Liabilities:
Premiums payable to insurance companies $ 534,360 $ 406,704
Premium deposits and credits due customers 80,959 32,867
Accounts payable 34,158 48,524
Accrued expenses and other liabilities 157,400 79,593
Current portion of long-term debt 100,000 93
Total current liabilities 906,877 567,781
Long-term debt 380,000 450,000
Deferred income taxes, net 291,704 237,630
Other liabilities 63,786 65,314
Commitments and contingencies (Note 13)
Shareholders’ Equity:
Common stock, par value $0.10 per share; authorized 280,000 shares;issued and outstanding 145,419 at 2013 and 143,878 at 2012 14,542 14,388
Additional paid-in capital 371,960 335,872
Retained earnings 1,620,639 1,457,073
Total shareholders’ equity 2,007,141 1,807,333
Total liabilities and shareholders’ equity $ 3,649,508 $ 3,128,058
At December 31,
(in thousands, except per share data) 2013 2012
BB_2013AR_FINAL_3-98_Layout 1 3/18/14 2:31 PM Page 63

64
Consolidated Statements of Shareholders’ Equity
See accompanying notes to consolidated financial statements.
Common Stock
Shares ParOutstanding Value
AdditionalPaid-InCapital
RetainedEarnings
Accumulated Other
ComprehensiveIncome Total(in thousands, except per share data)
Balance at January 1, 2011 142,795 $ 14,279 $ 286,997 $ 1,205,061 $ 7 $ 1,506,344
Net income 163,995 163,995
Common stock issued foremployee stock benefit plans 545 55 18,859 18,914
Income tax benefit from exerciseof stock benefit plans 916 916
Common stock issued to directors 12 1 287 288
Cash dividends paid ($0.3250 per share) (46,494) (46,494)
Balance at December 31, 2011 143,352 14,335 307,059 1,322,562 7 1,643,963
Net income and comprehensive income 184,045 184,045
Net unrealized holding gain onavailable-for-sale securities (7) (7)
Common stock issued foremployee stock benefit plans 501 50 19,549 19,599
Income tax benefit from exerciseof stock benefit plans 8,659 8,659
Common stock issued to directors 25 3 605 608
Cash dividends paid ($0.3450 per share) (49,534) (49,534)
Balance at December 31, 2012 143,878 14,388 335,872 1,457,073 ––– 1,807,333
Net income 217,112 217,112
Common stock issued foremployee stock benefit plans 1,541 154 33,730 33,884
Income tax benefit from exerciseof stock benefit plans 2,358 2,358
Cash dividends paid ($0.37 per share) (53,546) (53,546)
Balance at December 31, 2013 145,419 $ 14,542 $ 371,960 $ 1,620,639 $ ––– $ 2,007,141
BB_2013AR_FINAL_3-98_Layout 1 3/18/14 2:31 PM Page 64

65
Consolidated Statements of Cash Flows
See accompanying notes to consolidated financial statements.
CASH FLOWS FROM OPERATING ACTIVITIES:Net income $ 217,112 $ 184,045 $ 163,995Adjustments to reconcile net income to net cash provided by operating activities:
Amortization 67,932 63,573 54,755Depreciation 17,485 15,373 12,392Non-cash stock-based compensation 22,603 15,865 11,194Change in estimated acquisition earn-out payables 2,533 1,418 (2,206)Deferred income taxes 32,247 32,723 30,328Income tax benefit from exercise of shares from the stock benefit plans (2,358) (8,659) (916)Net gain on sales of investments, fixed assets and customer accounts (2,806) (4,105) (1,890)Payments on acquisition earn-outs in excess of original estimated payables (2,788) (4,086) (1,369)Changes in operating assets and liabilities, net of effect from
acquisitions and divestitures:Restricted cash and investments (increase) (85,445) (34,029) (6,941)Premiums, commissions and fees receivable (increase) (40,729) (11,312) (20,570)Other assets (increase) decrease (2,583) 2,145 (7,322)Premiums payable to insurance companies increase (decrease) 61,624 (4,651) 9,447Premium deposits and credits due customers increase 41,049 2,506 1,277Accounts payable increase (decrease) 5,180 36,505 (2,807)Accrued expenses and other liabilities increase (decrease) 70,872 (43,059) 3,975Other liabilities (decrease) (12,554) (23,937) (5,811)
Net cash provided by operating activities 389,374 220,315 237,531CASH FLOWS FROM INVESTING ACTIVITIES:Additions to fixed assets (16,366) (24,028) (13,608)Payments for businesses acquired, net of cash acquired (367,712) (425,054) (166,055)Proceeds from sales of fixed assets and customer accounts 5,886 14,095 3,686Purchase of investments (18,102) (11,167) (12,698)Proceeds from sales of investments 15,662 10,654 12,950
Net cash used in investing activities (380,632) (435,500) (175,725)CASH FLOWS FROM FINANCING ACTIVITIES:Payments on acquisition earn-outs (15,491) (13,539) (8,843)Proceeds from long-term debt 30,000 200,000 100,000Payments on long-term debt (93) (1,227) (102,072)Borrowings on revolving credit facilities 31,863 100,000 –––Payments on revolving credit facilities (31,863) (100,000) –––Income tax benefit from exercise of shares from the stock benefit plans 2,358 8,659 916Issuances of common stock for employee stock benefit plans 12,445 13,305 8,667Repurchase of stock benefit plan shares for employee to fund tax withholdings (1,284) (8,963) (659)Cash dividends paid (53,546) (49,534) (46,494)
Net cash (used in) provided by financing activities (25,611) 148,701 (48,485)Net (decrease) increase in cash and cash equivalents (16,869) (66,484) 13,321
Cash and cash equivalents at beginning of year 219,821 286,305 272,984Cash and cash equivalents at end of year $ 202,952 $ 219,821 $ 286,305
(in thousands) 2013 2012 2011
Year Ended December 31,
BB_2013AR_FINAL_3-98_Layout 1 3/19/14 5:47 PM Page 65

66
Notes to Consolidated Financial Statements
NOTE 1 SUMMARY OF SIGNIFICANT ACCOUNTING POLICIES
NATURE OF OPERATIONS Brown & Brown, Inc., a Florida corporation, and its subsidiaries (collectively, “Brown & Brown” or the “Company”) is a
diversified insurance agency, wholesale brokerage, insurance programs and services organization that markets and sells to itscustomers insurance products and services, primarily in the property and casualty area. Brown & Brown’s business is divided intofour reportable segments: the Retail Division, which provides a broad range of insurance products and services to commercial,public entity, professional and individual customers; the Wholesale Brokerage Division, which markets and sells excess and surpluscommercial insurance and reinsurance, primarily through independent agents and brokers; the National Programs Division, whichprovides professional liability and related package products for certain professionals delivered through nationwide networks ofindependent agents, and markets targeted products and services designated for specific industries, trade groups, governmentalentities and market niches; and the Services Division, which provides insurance-related services, including third-party claimsadministration and comprehensive medical utilization management services in both the workers’ compensation and all-linesliability arenas, as well as Medicare set-aside services, Social Security disability and Medicare benefits advocacy services, andcatastrophe claims adjusting services.
PRINCIPLES OF CONSOLIDATION The accompanying Consolidated Financial Statements include the accounts of Brown & Brown, Inc. and its subsidiaries. All
significant intercompany account balances and transactions have been eliminated in the Consolidated Financial Statements.
REVENUE RECOGNITION Commission revenues are recognized as of the effective date of the insurance policy or the date on which the policy premium
is billed to the customer, whichever is later. Commission revenues related to installment billings at the Company’s subsidiary,Arrowhead General Insurance Agency, Inc. (“Arrowhead”), are recorded on the later of the effective date of the policy or the firstinstallment billing. At those dates, the earnings process has been completed, and Brown & Brown can reliably estimate the impactof policy cancellations for refunds and establish reserves accordingly. The reserve for policy cancellations is based upon historicalcancellation experience adjusted for known circumstances. The policy cancellation reserve was $8,010,000 and $7,174,000 atDecember 31, 2013 and 2012, respectively, and it is periodically evaluated and adjusted as necessary. Subsequent commissionadjustments are recognized upon receipt of notification from the insurance companies. Commission revenues are reported net ofcommissions paid to sub-brokers or co-brokers. Profit-sharing contingent commissions from insurance companies are recognizedwhen determinable, which is when such commissions, or official notification of the amount of such commissions is received. Feeincome is recognized as services are rendered.
USE OF ESTIMATES The preparation of Consolidated Financial Statements in conformity with accounting principles generally accepted in the United
States of America (“U.S. GAAP”) requires management to make estimates and assumptions that affect the reported amounts ofassets and liabilities, as well as disclosures of contingent assets and liabilities, at the date of the Consolidated Financial Statements,and the reported amounts of revenues and expenses during the reporting period. Actual results may differ from those estimates.
CASH AND CASH EQUIVALENTS Cash and cash equivalents principally consist of demand deposits with financial institutions and highly liquid investments with
quoted market prices having maturities of three months or less when purchased.
BB_2013AR_FINAL_3-98_Layout 1 3/18/14 2:31 PM Page 66
67
RESTRICTED CASH AND INVESTMENTS, AND PREMIUMS, COMMISSIONS AND FEES RECEIVABLE In its capacity as an insurance agent or broker, Brown & Brown typically collects premiums from insureds and, after
deducting its authorized commissions, remits the net premiums to the appropriate insurance company or companies.Accordingly, as reported in the Consolidated Balance Sheets, “premiums” are receivable from insureds. Unremitted netinsurance premiums are held in a fiduciary capacity until Brown & Brown disburses them. Brown & Brown invests theseunremitted funds only in cash, money market accounts, tax-free variable-rate demand bonds and commercial paper held for ashort term. In certain states in which Brown & Brown operates, the use and investment alternatives for these funds areregulated and restricted by various state laws and agencies. These restricted funds are reported as restricted cash andinvestments on the Consolidated Balance Sheets. The interest income earned on these unremitted funds is reported asinvestment income in the Consolidated Statements of Income.
In other circumstances, the insurance companies collect the premiums directly from the insureds and remit the applicablecommissions to Brown & Brown. Accordingly, as reported in the Consolidated Balance Sheets, “commissions” are receivables frominsurance companies. “Fees” are primarily receivables due from customers.
INVESTMENTSCertificates of deposit and other securities having maturities of more than three months when purchased are reported at cost
and are adjusted for other-than-temporary market value declines.
FIXED ASSETS Fixed assets, including leasehold improvements, are carried at cost, less accumulated depreciation and amortization.
Expenditures for improvements are capitalized, and expenditures for maintenance and repairs are expensed to operations asincurred. Upon sale or retirement, the cost and related accumulated depreciation and amortization are removed from the accountsand the resulting gain or loss, if any, is reflected in other income. Depreciation has been determined using the straight-line methodover the estimated useful lives of the related assets, which range from three to 15 years. Leasehold improvements are amortized onthe straight-line method over the shorter of the useful life of the improvement or the term of the related lease.
GOODWILL AND AMORTIZABLE INTANGIBLE ASSETS The excess of the purchase price of an acquisition over the fair value of the identifiable tangible and amortizable intangible assets
is assigned to goodwill. While goodwill is not amortizable, it is subject to assessment at least annually, and more frequently in thepresence of certain circumstances, for impairment by application of a fair value-based test. The Company compares the fair value ofeach reporting unit with its carrying amount to determine if there is potential impairment of goodwill. If the fair value of the reportingunit is less than its carrying value, an impairment loss is recorded to the extent that the fair value of the goodwill within the reportingunit is less than its carrying value. Fair value is estimated based on multiples of earnings before interest, income taxes, depreciation,amortization and change in estimated acquisition earn-out payables (“EBITDAC”), or on a discounted cash flow basis. Brown & Browncompleted its most recent annual assessment as of November 30, 2013 and determined that the fair value of goodwill exceeded thecarrying value of such assets. In addition, as of December 31, 2013, there are no accumulated impairment losses.
Amortizable intangible assets are stated at cost, less accumulated amortization, and consist of purchased customer accountsand non-compete agreements. Purchased customer accounts and non-compete agreements are amortized on a straight-line basisover the related estimated lives and contract periods, which range from five to 15 years. Purchased customer accounts primarilyconsist of records and files that contain information about insurance policies and the related insured parties that are essential topolicy renewals.
BB_2013AR_FINAL_3-98_Layout 1 3/18/14 2:31 PM Page 67

68
Notes to Consolidated Financial Statements
The carrying value of amortizable intangible assets attributable to each business or asset group comprising Brown & Brown isperiodically reviewed by management to determine if there are events or changes in circumstances that would indicate that itscarrying amount may not be recoverable. Accordingly, if there are any such changes in circumstances during the year, Brown & Brownassesses the carrying value of its amortizable intangible assets by considering the estimated future undiscounted cash flowsgenerated by the corresponding business or asset group. Any impairment identified through this assessment may require that thecarrying value of related amortizable intangible assets be adjusted; however, no impairments were recorded for the years endedDecember 31, 2013, 2012 and 2011.
INCOME TAXES Brown & Brown records income tax expense using the asset-and-liability method of accounting for deferred income taxes.
Under this method, deferred tax assets and liabilities are recognized for the expected future tax consequences of temporarydifferences between the financial statement carrying values and the income tax bases of Brown & Brown’s assets and liabilities.
Brown & Brown files a consolidated federal income tax return and has elected to file consolidated returns in certain states.Deferred income taxes are provided for in the Consolidated Financial Statements and relate principally to expenses charged toincome for financial reporting purposes in one period and deducted for income tax purposes in other periods.
NET INCOME PER SHARE Effective in 2009, the Company adopted new Financial Accounting Standards Board (“FASB”) authoritative guidance that
states that unvested share-based payment awards that contain non-forfeitable rights to dividends or dividend equivalents areparticipating securities and, therefore, are included in computing earnings per share (“EPS”) pursuant to the two-class method. Thetwo-class method determines EPS for each class of common stock and participating securities according to dividends or dividendequivalents and their respective participation rights in undistributed earnings. Performance stock shares granted to employeesunder the Company’s Performance Stock Plan and under the Company’s Stock Incentive Plan are considered participatingsecurities as they receive non-forfeitable dividend equivalents at the same rate as common stock.
Basic EPS is computed based on the weighted average number of common shares (including participating securities) issuedand outstanding during the period. Diluted EPS is computed based on the weighted average number of common shares issued andoutstanding plus equivalent shares, assuming the exercise of stock options. The dilutive effect of stock options is computed byapplication of the treasury-stock method. The following is a reconciliation between basic and diluted weighted average sharesoutstanding for the years ended December 31:
Net income $ 217,112 $ 184,045 $ 163,995
Net income attributable to unvested awarded performance stock (5,446) (5,313) (5,099)
Net income attributable to common shares $ 211,666 $ 178,732 $ 158,896
Weighted average basic number of common shares outstanding 144,662 143,507 143,029
Less unvested awarded performance stock included inweighted average basic share outstanding (3,629) (4,143) (4,447)
Weighted average number of common sharesoutstanding for basic earnings per common share 141,033 139,364 138,582
Dilutive effect of stock options 1,591 2,646 1,682
Weighted average number of shares outstanding 142,624 142,010 140,264
Net income per share:
Basic $ 1.50 $ 1.28 $ 1.15
Diluted $ 1.48 $ 1.26 $ 1.13
(in thousands, except per share data) 2013 2012 2011
BB_2013AR_FINAL_3-98_Layout 1 3/18/14 2:31 PM Page 68

69
FAIR VALUE OF FINANCIAL INSTRUMENTSThe carrying amounts of Brown & Brown’s financial assets and liabilities, including cash and cash equivalents, restricted cash
and investments, investments, premiums, commissions and fees receivable, premiums payable to insurance companies, premiumdeposits and credits due customers and accounts payable, at December 31, 2013 and 2012, approximate fair value because of theshort-term maturity of these instruments. The carrying amount of Brown & Brown’s long-term debt approximates fair value atDecember 31, 2013 and 2012 because the related coupon rate approximates the current market rate.
STOCK-BASED COMPENSATION The Company grants stock options and non-vested stock awards to its employees, officers and directors. The Company uses the
modified-prospective method to account for share-based payments. Under the modified-prospective method, compensation cost isrecognized for all share-based payments granted on or after January 1, 2006 and for all awards granted to employees prior to January 1,2006 that remained unvested on that date. The Company uses the alternative-transition method to account for the income tax effects ofpayments made related to stock-based compensation.
The Company uses the Black-Scholes valuation model for valuing all stock options and shares purchased under the EmployeeStock Purchase Plan (the “ESPP”). Compensation for non-vested stock awards is measured at fair value on the grant date basedupon the number of shares expected to vest. Compensation cost for all awards is recognized in earnings, net of estimatedforfeitures, on a straight-line basis over the requisite service period.
NOTE 2 BUSINESS COMBINATIONS
ACQUISITIONS IN 2013 During 2013, Brown & Brown acquired the assets and assumed certain liabilities of ten insurance intermediaries, all of the
stock of one insurance intermediary and a book of business (customer accounts). The aggregate purchase price of theseacquisitions was $519,794,000, including $408,072,000 of cash payments, the issuance of $552,000 in other payables, theassumption of $106,079,000 of liabilities and $5,091,000 of recorded earn-out payables. All of these acquisitions were acquiredprimarily to expand Brown & Brown’s core businesses and to attract high-quality personnel. Acquisition purchase prices aretypically based on a multiple of average annual operating profit earned over a one—to three-year period within a minimum andmaximum price range. The recorded purchase price for all acquisitions consummated after January 1, 2009 included an estimationof the fair value of liabilities associated with any potential earn-out provisions. Subsequent changes in the fair value of earn-outobligations will be recorded in the consolidated statement of income when incurred.
The fair value of earn-out obligations is based on the present value of the expected future payments to be made to the sellersof the acquired businesses in accordance with the provisions outlined in the respective purchase agreements. In determining fairvalue, the acquired business’s future performance is estimated using financial projections developed by management for theacquired business and reflects market participant assumptions regarding revenue growth and/or profitability. The expected futurepayments are estimated on the basis of the earn-out formula and performance targets specified in each purchase agreementcompared to the associated financial projections. These payments are then discounted to present value using a risk-adjusted ratethat takes into consideration the likelihood that the forecasted earn-out payments will be made.
Based on the acquisition date and the complexity of the underlying valuation work, certain amounts included in the Company’sCondensed Consolidated Financial Statements may be provisional and thus subject to further adjustments within the permittedmeasurement period, as defined in Accounting Standards Codification (“ASC”) Topic 805—Business Combinations.
For 2013, several adjustments were made within the permitted measurement period that resulted in a reduction to theaggregate purchase price of the applicable acquisition of $504,000, including $18,000 of cash payments, an increase of $117,000in other payables, the assumption of $82,000 of liabilities and the reduction of $721,000 in recorded earn-out payables.
BB_2013AR_FINAL_3-98_Layout 1 3/18/14 2:31 PM Page 69

70
The following table summarizes the aggregate purchase price allocation made as of the date of each acquisition for currentyear acquisitions and adjustment made during the measurement period for prior year acquisitions:
Notes to Consolidated Financial Statements
The following table summarizes the estimated fair values of the aggregate assets and liabilities acquired as of the date ofeach acquisition:
MaximumPotential Earn-outPayable
(in thousands)
NameBusinessSegment
2013Date of
AcquisitionCashPaid
OtherPayable
RecordedEarn-outPayable
Net AssetsAcquired
The Rollins Agency, Inc. Retail June 1 $ 13,792 $ 50 $ 2,321 $ 16,163 $ 4,300
Retail;National
Beecher Carlson Holdings, Inc. Programs July 1 364,256 ––– ––– 364,256 –––
ICA, Inc. Services December 31 19,770 ––– 727 20,497 5,000
Other Various Various 10,254 502 2,043 12,799 7,468
Total $ 408,072 $ 552 $ 5,091 $ 413,715 $ 16,768
Rollins Beecher ICA Other Total
Cash $ ––– $ 40,360 $ ––– $ ––– $ 40,360
Other current assets 393 57,632 ––– 1,573 59,598
Fixed assets 30 1,786 75 24 1,915
Goodwill 12,697 265,174 12,377 5,696 295,944
Purchased customer accounts 3,878 101,565 7,917 5,623 118,983
Non-compete agreements 31 2,758 21 76 2,886
Other assets ––– ––– 107 1 108
Total assets acquired 17,029 469,275 20,497 12,993 519,794
Other current liabilities (866) (80,090) ––– (194) (81,150)
Deferred income taxes, net ––– (22,764) ––– ––– (22,764)
Other liabilities ––– (2,165) ––– ––– (2,165)
Total liabilities assumed (866) (105,019) ––– (194) (106,079)
Net assets acquired $ 16,163 $ 364,256 $ 20,497 $ 12,799 $ 413,715
(in thousands)
BB_2013AR_FINAL_3-98_Layout 1 3/18/14 2:31 PM Page 70

71
(UNAUDITED)
(in thousands, except per share data)
The weighted average useful lives for the acquired amortizable intangible assets are as follows: purchased customer accounts,15.0 years; and non-compete agreements, 5.0 years.
Goodwill of $295,944,000 was allocated to the Retail, National Programs, Wholesale Brokerage and Services Divisions in theamounts of $257,196,000, $27,091,000, ($812,000) and $12,469,000, respectively. Of the total goodwill of $295,944,000,$41,663,000 is currently deductible for income tax purposes and $249,190,000 is non-deductible. The remaining $5,091,000relates to the recorded earn-out payables and will not be deductible until it is earned and paid.
The results of operations for the acquisitions completed during 2013 have been combined with those of the Company sincetheir respective acquisition dates. The total revenues and income before income taxes from the acquisitions completed throughDecember 31, 2013, included in the Condensed Consolidated Statement of Income for the twelve months ended December 31,2013, were $63,797,000 and $872,000, respectively. If the acquisitions had occurred as of the beginning of the period, theCompany’s results of operations would be as shown in the following table. These unaudited pro forma results are not necessarilyindicative of the actual results of operations that would have occurred had the acquisitions actually been made at the beginning ofthe respective periods.
For the Year Ended December 31,
2013 2012
Total revenues $ 1,439,918 $ 1,329,262
Income before income taxes $ 373,175 $ 329,291
Net income $ 226,562 $ 198,826
Net income per share:
Basic $ 1.57 $ 1.39
Diluted $ 1.55 $ 1.36
Weighted average number of shares outstanding:
Basic 141,033 139,634
Diluted 142,624 142,010
BB_2013AR_FINAL_3-98_Layout 1 3/18/14 2:31 PM Page 71

72
Notes to Consolidated Financial Statements
Arrowhead GeneralInsurance Agency NationalSuperholding Programs; January 9 $ 396,952 $ ––– $ 22,061 $ 3,290 $ 422,303 $ 5,000Corporation Services
Insurcorp & GGMInvestments LLC(d/b/a Maalouf Retail May 1 15,500 ––– 900 4,944 21,344 17,000Benefit Resources)
Richard W. EndlarInsurance Agency, Inc. Retail May 1 10,825 ––– ––– 2,598 13,423 5,500
Texas Security General WholesaleInsurance Agency, Inc. Brokerage September 1 14,506 ––– 2,182 2,124 18,812 7,200
Behnke & Associates, Inc. Retail December 1 9,213 ––– ––– 1,126 10,339 3,321
Rowlands & BarrancaAgency, Inc. Retail December 1 8,745 ––– ––– 2,401 11,146 4,000
Other Various Various 28,192 59 296 4,996 33,543 14,149
Total $ 483,933 $ 59 $ 25,439 $ 21,479 $ 530,910 $ 56,170
CashPaid
BusinessSegment
OtherPayable
RecordedEarn-outPayable
Net AssetsAcquired
MaximumPotentialEarn-outPayable
(in thousands)
Name
2012Date of
AcquisitionNote
Payable
ACQUISITIONS IN 2012 During 2012, Brown & Brown acquired the assets and assumed certain liabilities of 19 insurance intermediaries, all of the stock
of one insurance intermediary and a book of business (customer accounts). The aggregate purchase price of these acquisitionswas $667,586,000, including $483,933,000 of cash payments, the issuance of notes payable of $59,000, the issuance of$25,439,000 in other payables, the assumption of $136,676,000 of liabilities and $21,479,000 of recorded earn-out payables. The‘other payables’ amount includes $22,061,000 that the Company is obligated to pay all shareholders of Arrowhead on a pro ratabasis for certain pre-merger corporate tax refunds and certain estimated potential future income tax credits that were created bynet operating loss carryforwards originating from transaction-related tax benefit items. All of these acquisitions were acquiredprimarily to expand Brown & Brown’s core businesses and to attract high-quality personnel. Acquisition purchase prices aretypically based on a multiple of average annual operating profit earned over a one—to three-year period within a minimum andmaximum price range. The recorded purchase price for all acquisitions consummated after January 1, 2009 included an estimationof the fair value of liabilities associated with any potential earn-out provisions. Subsequent changes in the fair value of earn-outobligations will be recorded in the consolidated statement of income when incurred.
The fair value of earn-out obligations is based on the present value of the expected future payments to be made to the sellersof the acquired businesses in accordance with the provisions outlined in the respective purchase agreements. In determining fairvalue, the acquired business’s future performance is estimated using financial projections developed by management for theacquired business and reflects market participant assumptions regarding revenue growth and/or profitability. The expected futurepayments are estimated on the basis of the earn-out formula and performance targets specified in each purchase agreementcompared to the associated financial projections. These payments are then discounted to present value using a risk-adjusted ratethat takes into consideration the likelihood that the forecasted earn-out payments will be made.
The acquisitions made in 2012 have been accounted for as business combinations and are as follows:
BB_2013AR_FINAL_3-98_Layout 1 3/18/14 2:31 PM Page 72

73
The following table summarizes the estimated fair values of the aggregate assets and liabilities acquired as of the date ofeach acquisition:
Cash $ 61,786 $ ––– $ ––– $ ––– $ ––– $ ––– $ ––– $ 61,786
Other current assets 69,051 180 305 1,866 ––– ––– 422 71,824
Fixed assets 4,629 25 25 45 25 30 158 4,937
Goodwill 321,128 14,745 8,044 10,845 6,430 8,363 21,085 390,640
Purchased customer accounts 99,675 6,490 5,230 6,229 3,843 3,367 13,112 137,946
Non-compete agreements 100 22 11 14 41 21 243 452
Other assets 1 ––– ––– ––– ––– ––– ––– 1
Total assets acquired 556,370 21,462 13,615 18,999 10,339 11,781 35,020 667,586
Other current liabilities (107,579) (118) (192) (187) ––– (635) (1,477) (110,188)
Deferred income taxes, net (26,488) ––– ––– -–– ––– ––– ––– (26,488)
Total liabilitiesassumed (134,067) (118) (192) (187) ––– (635) (1,477) (136,676)
Net assets acquired $ 422,303 $ 21,344 $ 13,423 $ 18,812 $ 10,339 $ 11,146 $ 33,543 $530,910
EndlarArrowhead Behnke Rowlands Other Total(in thousands)
InsurcorpTexas
Security
The weighted average useful lives for the acquired amortizable intangible assets are as follows: purchased customer accounts,15.0 years; and non-compete agreements, 5.0 years.
Goodwill of $390,640,000, was allocated to the Retail, National Programs, Wholesale Brokerage and Services Divisions in theamounts of $57,856,000, $289,378,000, $11,656,000 and $31,750,000, respectively. Of the total goodwill of $390,640,000,$52,730,000 is currently deductible for income tax purposes and $316,431,000 is non-deductible. The remaining $21,479,000relates to the recorded earn-out payables and will not be deductible until it is earned and paid.
The results of operations for the acquisitions completed during 2012 have been combined with those of the Company sincetheir respective acquisition dates. The total revenues and income before income taxes from the acquisitions completed throughDecember 31, 2012, included in the Condensed Consolidated Statement of Income for the twelve months ended December 31,2012, were $129,472,000 and $898,000, respectively. If the acquisitions had occurred as of the beginning of the period, theCompany’s results of operations would be as shown in the following table. These unaudited pro forma results are not necessarilyindicative of the actual results of operations that would have occurred had the acquisitions actually been made at the beginning ofthe respective periods.
Total revenues $ 1,230,408 $ 1,163,341Income before income taxes $ 315,051 $ 313,706Net income $ 190,228 $ 190,174Net income per share:
Basic $ 1.33 $ 1.33Diluted $ 1.30 $ 1.31
Weighted average number of shares outstanding:Basic 139,364 138,582Diluted 142,010 140,264
For the Year Ended December 31,2012 2011
(UNAUDITED)(in thousands, except per share data)
BB_2013AR_FINAL_3-98_Layout 1 3/18/14 2:31 PM Page 73

74
Notes to Consolidated Financial Statements
ACQUISITIONS IN 2011 During 2011, Brown & Brown acquired the assets and assumed certain liabilities of 37 insurance intermediaries, all of the stock
of one insurance intermediary and several books of business (customer accounts). The aggregate purchase price of theseacquisitions was $214,822,000, including $167,444,000 of cash payments, the issuance of $1,194,000 in notes payable, theassumption of $15,659,000 of liabilities and $30,525,000 of recorded earn-out payables. All of these acquisitions were acquiredprimarily to expand Brown & Brown’s core businesses and to attract high-quality personnel. Acquisition purchase prices aretypically based on a multiple of average annual operating profit earned over a one-to three-year period within a minimum andmaximum price range. The recorded purchase price for all acquisitions consummated after January 1, 2009 included an estimationof the fair value of liabilities associated with any potential earn-out provisions. Subsequent changes in the fair value of earn-outobligations will be recorded in the consolidated statement of income when incurred.
The fair value of earn-out obligations is based on the present value of the expected future payments to be made to the sellersof the acquired businesses in accordance with the provisions outlined in the respective purchase agreements. In determining fairvalue, the acquired business’s future performance is estimated using financial projections developed by management for theacquired business and reflects market participant assumptions regarding revenue growth and/or profitability. The expected futurepayments are estimated on the basis of the earn-out formula and performance targets specified in each purchase agreementcompared to the associated financial projections. These payments are then discounted to present value using a risk-adjusted ratethat takes into consideration the likelihood that the forecasted earn-out payments will be made.
The acquisitions made in 2011 have been accounted for as business combinations and are as follows:
Balcos Insurance, Inc. Retail January 1 $ 8,611 $ ––– $ 1,595 $ 10,206 $ 5,766
Associated InsuranceService, Inc. et al. Retail January 1 12,000 ––– 1,575 13,575 6,000
United Benefit ServicesInsurance Agency LLC et al. Retail February 1 14,283 ––– 2,590 16,873 8,442
First Horizon InsuranceGroup, Inc. et al. Retail April 30 25,060 ––– ––– 25,060 –––
Fitzharris Agency, Inc. et al. Retail May 1 6,159 ––– 888 7,047 3,832
Corporate Benefit Consultants, LLC Retail June 1 9,000 ––– 2,038 11,038 4,520
Sitzmann, Morris & LavisInsurance Agency, Inc. et al. Retail November 1 40,460 ––– 6,228 46,688 19,000
Snapper Shuler Kenner, Inc. et al. Retail November 1 7,493 ––– 1,318 8,811 3,988
NationalIndustry Consulting Group, Inc. Programs November 1 9,133 ––– 3,877 13,010 5,794
Colonial Claims Corporationet al. Services December 23 9,950 ––– 4,248 14,198 8,000
Other Various Various 25,295 1,194 6,168 32,657 12,865
Total $ 167,444 $ 1,194 $ 30,525 $ 199,163 $ 78,207
CashPaid
BusinessSegment
NotePayable
RecordedEarn-outPayable
Net AssetsAcquired
MaximumPotential Earn-outPayable
(in thousands)
Name
2011Date of
Acquisition
BB_2013AR_March20_FIN_Layout 1 3/20/14 3:39 PM Page 74

75
The following table summarizes the estimated fair values of the aggregate assets and liabilities acquired as of the date ofeach acquisition:
Cash $ ––– $ ––– $ ––– $ 5,170 $ ––– $ –––
Other current assets 187 252 438 1,640 77 227
Fixed assets 20 100 20 134 60 6
Goodwill 6,486 9,055 10,049 15,254 7,244 6,738
Purchased customer accounts 3,530 4,086 7,045 8,088 3,351 4,046
Non-compete agreements 42 92 45 10 21 21
Other assets ––– ––– 4 9 ––– –––
Total assets acquired 10,265 13,585 17,601 30,305 10,753 11,038
Other current liabilities (59) (10) (728) (3,790) (3,706) –––
Deferred income taxes, net ––– ––– ––– (1,455) ––– –––
Other liabilities ––– ––– ––– ––– ––– –––
Total liabilities assumed (59) (10) (728) (5,245) (3,706) –––
Net assets acquired $ 10,206 $ 13,575 $ 16,873 $ 25,060 $ 7,047 $ 11,038
(in thousands) Balcos AIS United FHI FA CBC
Cash $ ––– $ ––– $ ––– $ ––– $ ––– $ 5,170
Other current assets 1,372 247 336 ––– 1,059 5,835
Fixed assets 465 45 100 60 65 1,075
Goodwill 31,601 5,818 9,564 8,070 18,465 128,344
Purchased customer accounts 13,995 2,726 7,161 6,094 13,746 73,868
Non-compete agreements 42 12 11 23 187 506
Other assets 4 ––– 5 ––– 2 24
Total assets acquired 47,479 8,848 17,177 14,247 33,524 214,822
Other current liabilities (791) (37) (1,096) (49) (867) (11,133)
Deferred income taxes, net ––– ––– ––– ––– ––– (1,455)
Other liabilities ––– ––– (3,071) ––– ––– (3,071)
Total liabilities assumed (791) (37) (4,167) (49) (867) (15,659)
Net assets acquired $ 46,688 $ 8,811 $ 13,010 $ 14,198 $ 32,657 $ 199,163
(in thousands) SML SSK ICG CC Other Total
The weighted average useful lives for the above acquired amortizable intangible assets are as follows: purchased customeraccounts, 15.0 years; noncompete agreements, 5.0 years.
BB_2013AR_FINAL_3-98_Layout 1 3/18/14 2:31 PM Page 75

76
Notes to Consolidated Financial Statements
Goodwill of $128,344,000, was assigned to the Retail, National Programs and Services Divisions in the amounts of$108,420,000, $11,853,000 and $8,071,000, respectively. Of the total goodwill of $128,344,000, $84,105,000 is currentlydeductible for income tax purposes and $13,714,000 is non-deductible. The remaining $30,525,000 relates to the recordedacquisition earn-out payables and will not be deductible until it is earned and paid.
The results of operations for the acquisitions completed during 2011 have been combined with those of the Company sincetheir respective acquisition dates. The total revenues and income before income taxes from the acquisitions completed throughDecember 31, 2011 included in the Condensed Consolidated Statement of Income for the twelve months ended December 31, 2011were $40,291,000 and $7,223,000, respectively. If the acquisitions had occurred as of the beginning of the comparable priorannual reporting period, the Company’s estimated results of operations would be as shown in the following table. These unauditedpro forma results are not necessarily indicative of the actual results of operations that would have occurred had the acquisitionsactually been made at the beginning of the respective periods.
For acquisitions consummated prior to January 1, 2009, additional consideration paid to sellers as a result of purchase priceearn-out provisions are recorded as adjustments to intangible assets when the contingencies are settled. The net additionalconsideration paid by the Company in 2013 as a result of these adjustments totaled $873,000, all of which was allocated togoodwill. Of the $873,000 net additional consideration paid, $873,000 was issued in other payables. The net additionalconsideration paid by the Company in 2012 as a result of these adjustments totaled $2,907,000, all of which was allocated togoodwill. Of the $2,907,000 net additional consideration paid, $2,907,000 was paid in cash.
As of December 31, 2013, the maximum future contingency payments related to all acquisitions totaled $130,584,000, all ofwhich relates to acquisitions consummated subsequent to January 1, 2009.
ASC Topic 805—Business Combinations is the authoritative guidance requiring an acquirer to recognize 100% of the fair valuesof acquired assets, including goodwill, and assumed liabilities (with only limited exceptions) upon initially obtaining control of anacquired entity. Additionally, the fair value of contingent consideration arrangements (such as earn-out purchase arrangements) atthe acquisition date must be included in the purchase price consideration. As a result, the recorded purchase prices for allacquisitions consummated after January 1, 2009 include an estimation of the fair value of liabilities associated with any potentialearn-out provisions. Subsequent changes in these earn-out obligations will be recorded in the consolidated statement of incomewhen incurred. Potential earn-out obligations are typically based upon future earnings of the acquired entities, usually between oneand three years.
Total revenues $ 1,058,142 $ 1,059,857
Income before income taxes $ 283,404 $ 291,944
Net income $ 171,805 $ 177,464
Net income per share:
Basic $ 1.20 $ 1.25
Diluted $ 1.19 $ 1.23
Weighted average number of shares outstanding:
Basic 138,582 137,924
Diluted 140,264 139,318
For the Year Ended December 31,2011 2010
(UNAUDITED)(in thousands, except per share data)
BB_2013AR_FINAL_3-98_Layout 1 3/18/14 2:31 PM Page 76

77
As of December 31, 2013, the fair values of the estimated acquisition earn-out payables were re-evaluated and measured atfair value on a recurring basis using unobservable inputs (Level 3). The resulting additions, payments, and net changes, as well asthe interest expense accretion on the estimated acquisition earn-out payables, for the years ended December 31, were as follows:
Of the $43,058,000 estimated acquisition earn-out payables as of December 31, 2013, $6,312,000 was recorded as accountspayable and $36,746,000 was recorded as other non-current liabilities. Of the $52,987,000 in estimated acquisition earn-outpayables as of December 31, 2012, $10,164,000 was recorded as accounts payable and $42,823,000 was recorded as other non-current liabilities.
NOTE 3 GOODWILL
The changes in the carrying value of goodwill by reportable segment for the years ended December 31, are as follows:
Balance as of the beginning of the period $ 52,987 $ 47,715 $ 29,608
Additions to estimated acquisition earn-out payables 5,816 21,479 30,525
Payments for estimated acquisition earn-out payables (18,278) (17,625) (10,212)
Subtotal 40,525 51,569 49,921
Net change in earnings from estimated acquisition earn-out payables:
Change in fair value on estimated acquisition earn-out payables 570 (1,051) (4,043)
Interest expense accretion 1,963 2,469 1,837
Net change in earnings from estimated acquisition earn-out payables 2,533 1,418 (2,206)
Balance as of December 31 $ 43,058 $ 52,987 $ 47,715
(in thousands)
National WholesaleRetail Programs Brokerage Services Total
Balance as of January 1, 2012 $ 823,573 $ 149,802 $ 273,783 $ 76,311 $1,323,469
Goodwill of acquired businesses 58,148 289,378 14,271 31,750 393,547
Goodwill disposed of relating to sales of businesses (5,502) ––– ––– ––– (5,502)
Balance as of December 31, 2012 876,219 439,180 288,054 108,061 1,711,514
Goodwill of acquired businesses 257,196 27,964 (812) 12,469 296,817
Goodwill disposed of relating to sales of businesses (2,158) ––– ––– ––– (2,158)
Balance as of December 31, 2013 $ 1,131,257 $ 467,144 $ 287,242 $ 120,530 $2,006,173
(in thousands)For the Year Ended December 31,
2013 2012 2011
BB_2013AR_FINAL_3-98_Layout 1 3/18/14 2:31 PM Page 77

78
Notes to Consolidated Financial Statements
NOTE 4 AMORTIZABLE INTANGIBLE ASSETS
Amortizable intangible assets at December 31 consisted of the following:
NOTE 5 INVESTMENTS
Investments at December 31 consisted of the following:
Amortization expense recorded for amortizable intangible assets for the years ended December 31, 2013, 2012 and 2011 was$67,932,000, $63,573,000 and $54,755,000, respectively.
Amortization expense for amortizable intangible assets for the years ending December 31, 2014, 2015, 2016, 2017 and 2018 isestimated to be $71,306,000, $70,017,000, $65,479,000, $62,767,000, and $57,442,000, respectively.
The following table summarizes the proceeds and realized gains/(losses) on equity securities and certificates of deposit forthe years ended December 31:
Gross Gross
Realized Realized
Proceeds Gains Losses
2013Weighted
Gross Net AverageCarrying Accumulated Carrying Life
Value Amortization Value (Years)
2012Weighted
Gross Net AverageCarrying Accumulated Carrying Life
Value Amortization Value (Years)(in thousands)
Purchased customer accounts
Non-compete agreements
Total
$ 1,120,719 $ (505,137) $ 615,582 14.9
28,115 (24,809) 3,306 7.0
$ 1,148,834 $ (529,946) $ 618,888
$1,005,031 $ (439,623) $ 565,408 14.9
25,320 (24,190) 1,130 7.2
$1,030,351 $ (463,813) $ 566,538
2013 2012Carrying Value Carrying Value
Current Non-Current Current Non-Current
Certificates of deposit and other securities $ 10,624 $ 16 $ 8,183 $ 16
2013 $ 15,662 $ –––– $ ––––
2012 $ 10,654 $ 13 $ ––––
2011 $ 12,950 $ 124 $ ––––
(in thousands)
(in thousands)
BB_2013AR_FINAL_3-98_Layout 1 3/19/14 5:52 PM Page 78

79
NOTE 6 FIXED ASSETS
Fixed assets at December 31 consisted of the following:
Depreciation and amortization expense for fixed assets amounted to $17,485,000 in 2013, $15,373,000 in 2012, and$12,392,000 in 2011.
NOTE 7 ACCRUED EXPENSES AND OTHER LIABILITIES
Accrued expenses and other liabilities at December 31 consisted of the following:
NOTE 8 LONG-TERM DEBT
Long-term debt at December 31 consisted of the following:
(in thousands) 2013 2012
Furniture, fixtures and equipment $ 149,170 $ 141,844
Leasehold improvements 21,231 18,889
Land, buildings and improvements 3,815 3,902
Total cost 174,216 164,635
Less accumulated depreciation and amortization (99,483) (90,298)
Total $ 74,733 $ 74,337
(in thousands) 2013 2012
Unsecured senior notes $ 480,000 $ 450,000
Acquisition notes payable –––– 93
Revolving credit facility –––– ––––
Total debt 480,000 450,093
Less current portion (100,000) (93)
Long-term debt $ 380,000 $ 450,000
(in thousands) 2013 2012
Accrued bonuses $ 70,272 $ 12,668
Accrued compensation and benefits 35,145 19,943
Accrued rent and vendor expenses 19,235 16,972
Reserve for policy cancellations 8,010 7,174
Accrued interest 3,324 3,295
Other 21,414 19,541
Total $ 157,400 $ 79,593
BB_2013AR_March20_FIN_Layout 1 3/20/14 3:39 PM Page 79

80
In July 2004, the Company completed a private placement of $200.0 million of unsecured senior notes (the “Notes”). The$200.0 million was divided into two series: (1) Series A, which closed on September 15, 2004, for $100.0 million due in 2011 andbore interest at 5.57% per year; and (2) Series B, which closed on July 15, 2004, for $100.0 million due in 2014 and bearing interestat 6.08% per year. The Company has used the proceeds from the Notes for general corporate purposes, including acquisitions andrepayment of existing debt. On September 15, 2011, the $100.0 million of Series A Notes were redeemed on their normal maturitydate. As of December 31, 2013 and December 31, 2012, there was an outstanding balance on the Notes of $100.0 million.
On December 22, 2006, the Company entered into a Master Shelf and Note Purchase Agreement (the “Master Agreement”)with a national insurance company (the “Purchaser”). On September 30, 2009, the Company and the Purchaser amended theMaster Agreement to extend the term of the agreement until August 20, 2012. The Purchaser also purchased Notes issued by theCompany in 2004. The Master Agreement provides for a $200.0 million private uncommitted “shelf” facility for the issuance ofsenior unsecured notes over a three-year period, with interest rates that may be fixed or floating and with such maturity dates, notto exceed ten years, as the parties may determine. The Master Agreement includes various covenants, limitations and events ofdefault similar to the Notes issued in 2004. The initial issuance of notes under the Master Agreement occurred on December 22,2006, through the issuance of $25.0 million in Series C Senior Notes due December 22, 2016, with a fixed interest rate of 5.66%per year. On February 1, 2008, $25.0 million in Series D Senior Notes due January 15, 2015, with a fixed interest rate of 5.37% peryear, were issued. On September 15, 2011, and pursuant to a Confirmation of Acceptance, dated January 21, 2011 (the“Confirmation”), in connection with the Master Agreement, $100.0 million in Series E Senior Notes due September 15, 2018, with afixed interest rate of 4.50% per year, were issued. The Series E Senior Notes were issued for the sole purpose of retiring the SeriesA Senior Notes. As of December 31, 2013 and December 31, 2012, there was an outstanding debt balance of $150.0 millionattributable to notes issued under the provisions of the Master Agreement. The Master Agreement expired on September 30, 2012and was not extended.
On October 12, 2012, the Company entered into a Master Note Facility Agreement (the “New Master Agreement”) withanother national insurance company (the “New Purchaser”). The New Purchaser also purchased Notes issued by us in 2004. TheNew Master Agreement provides for a $125.0 million private uncommitted “shelf” facility for the issuance of unsecured seniornotes over a three-year period, with interest rates that may be fixed or floating and with such maturity dates, not to exceed tenyears, as the parties may determine. The New Master Agreement includes various covenants, limitations and events of defaultsimilar to the Master Agreement. At December 31, 2013 and December 31, 2012, there were no borrowings against this facility.
On June 12, 2008, the Company entered into an Amended and Restated Revolving Loan Agreement dated as of June 3, 2008(the “Prior Loan Agreement”), with a national banking institution, amending and restating the Revolving Loan Agreement datedSeptember 29, 2003, as amended (the “Revolving Agreement”), to, among other things, increase the lending commitment to$50.0 million (subject to potential increases up to $100.0 million) and to extend the maturity date from December 20, 2011, toJune 3, 2013. The Revolving Agreement initially provided for a revolving credit facility in the maximum principal amount of $75.0million. After a series of amendments that provided covenant exceptions for additional notes issued or to be issued under theMaster Agreement and relaxed or deleted certain other covenants, the maximum principal amount was reduced to $20.0 million.The Revolving Agreement was amended and restated by the SunTrust Revolver (as defined in the below paragraph).
On January 9, 2012, the Company entered into: (1) an amended and restated revolving and term loan credit agreement (the“SunTrust Agreement”) with SunTrust Bank (“SunTrust”) that provides for (a) a $100.0 million term loan (the “SunTrust TermLoan”) and (b) a $50.0 million revolving line of credit (the “SunTrust Revolver”) and (2) a $50.0 million promissory note (the “JPMNote”) in favor of JPMorgan Chase Bank, N.A. (“JPMorgan”), pursuant to a letter agreement executed by JP Morgan (together withthe JPM Note, (the “JPM Agreement”) that provided for a $50.0 million uncommitted line of credit bridge facility (the “JPM BridgeFacility”). The SunTrust Term Loan, the SunTrust Revolver and the JPM Bridge Facility were each funded on January 9, 2012, andprovided the financing for the Arrowhead acquisition. The SunTrust Agreement amended and restated the Prior Loan Agreement.
The maturity date for the SunTrust Term Loan and the SunTrust Revolver is December 31, 2016, at which time all outstandingprincipal and unpaid interest will be due. Both the SunTrust Term Loan and the SunTrust Revolver may be increased by up to $50.0million (bringing the total available to $150.0 million for the SunTrust Term Loan and $100.0 million for the SunTrust Revolver). Thecalculation of interest and fees for the SunTrust Agreement is generally based on the Company’s funded debt-to-EBITDA ratio.
Notes to Consolidated Financial Statements
BB_2013AR_FINAL_3-98_Layout 1 3/18/14 2:31 PM Page 80

81
Interest is charged at a rate equal to 1.00% to 1.40% above LIBOR or 1.00% below the Base Rate, each as more fully described inthe SunTrust Agreement. Fees include an up-front fee, an availability fee of 0.175% to 0.25%, and a letter of credit margin fee of1.00% to 1.40%. The obligations under the SunTrust Term Loan and SunTrust Revolver are unsecured and the SunTrust Agreementincludes various covenants, limitations and events of default that are customary for similar facilities for similar borrowers and thatare substantially similar to those contained in the Prior Loan Agreement.
The maturity date for the JPM Bridge Facility was February 3, 2012, at which time all outstanding principal and unpaid interestwould have been due. On January 26, 2012, the Company entered into a term loan agreement (the “JPM Agreement”) withJPMorgan that provided for a $100.0 million term loan (the “JPM Term Loan”). The JPM Term Loan was fully funded on January 26,2012, and provided the financing to fully repay (1) the JPM Bridge Facility and (2) the SunTrust Revolver. As a result of the January26, 2012 financing and repayments, the JPM Bridge Facility was terminated and the SunTrust Revolver’s amount outstanding wasreduced to zero. At December 31, 2013 and December 31, 2012, there were no borrowings against the SunTrust Revolver.
The maturity date for the JPM Term Loan is December 31, 2016, at which time all outstanding principal and unpaid interestwill be due. Interest is charged at a rate equal to the Alternative Base Rate or 1.00% above the Adjusted LIBOR Rate, each asmore fully described in the JPM Agreement. Fees include an up-front fee. The obligations under the JPM Term Loan areunsecured and the JPM Agreement includes various covenants, limitations and events of default that are customary for similarfacilities for similar borrowers.
On July 1, 2013, in conjunction with the acquisition of Beecher Carlson Holdings, Inc., the Company entered into: (1) a revolvingloan agreement (the “Wells Fargo Agreement”) with Wells Fargo Bank, N.A. that provides for a $50.0 million revolving line of credit(the “Wells Fargo Revolver”) and (2) a term loan agreement (the “Bank of America Agreement”) with Bank of America, N.A.(“Bank of America”) that provides for a $30.0 million term loan (the “Bank of America Term Loan”).
The maturity date for the Wells Fargo Revolver is December 31, 2016, at which time all outstanding principal and unpaidinterest will be due. The Wells Fargo Revolver may be increased by up to $50.0 million (bringing the total available to $100.0million). The calculation of interest and fees for the Wells Fargo Agreement is generally based on our funded debt-to-EBITDA ratio.Interest is charged at a rate equal to 1.00% to 1.40% above LIBOR or 1.00% below the Base Rate, each as more fully described inthe Wells Fargo Agreement. Fees include an up-front fee, an availability fee of 0.175% to 0.25%, and a letter of credit margin fee of1.00% to 1.40%. The obligations under the Wells Fargo Revolver are unsecured and the Wells Fargo Agreement includes variouscovenants, limitations and events of default that are customary for similar facilities for similar borrowers. The Wells Fargo Revolverwas drawn down in the amount of $30.0 million on July 1, 2013. There were no borrowings against the Wells Fargo Revolver as ofDecember 31, 2013.
The maturity date for the Bank of America Term Loan is December 31, 2016, at which time all outstanding principal and unpaidinterest will be due. The calculation of interest for the Bank of America Agreement is generally based on our fixed charge coverageratio. Interest is charged at a rate equal to the Alternative Base Rate or 1.00% to 1.40% above the Adjusted LIBOR Rate, each asmore fully described in the Bank of America Agreement. Fees include an up-front fee. Initially, until Bank of America received ourSeptember 30, 2013 quarter end financial statements, the applicable margin for Adjusted LIBOR Rate advances was 1.50%. Theobligations under the Bank of America Term Loan are unsecured and the Bank of America Agreement includes various covenants,limitations and events of default that are customary for similar facilities for similar borrowers. The Bank of America Term Loan wasfunded in the amount of $30.0 million on July 1, 2013. As of December 31, 2013 there was an outstanding balance of $30.0 million.
The 30-day LIBOR and Adjusted LIBOR Rate as of December 31, 2013 were 0.16% and 0.19%, respectively. The Notes, the Master Agreement, the SunTrust Agreement and the JPM Agreement require the Company to maintain certain
financial ratios and comply with certain other covenants. The Company was in compliance with all such covenants as of December31, 2013 and 2012.
Acquisition notes payable represent debt incurred to former owners of certain insurance operations acquired by Brown &Brown. These notes and future contingent payments were payable in monthly, quarterly and annual installments through July 2013.
Interest paid in 2013, 2012 and 2011 was $16,501,000, $16,090,000 and $15,571,000, respectively.At December 31, 2013, maturities of long-term debt were $100,000,000 in 2014, $25,000,000 in 2015, $255,000,000 in
2016, $0 in 2017 and $100,000,000 in 2018.
BB_2013AR_FINAL_3-98_Layout 1 3/18/14 2:31 PM Page 81

82
Notes to Consolidated Financial Statements
(in thousands)
NOTE 9 INCOME TAXES
Significant components of the provision for income taxes for the years ended December 31 are as follows:
A reconciliation of the differences between the effective tax rate and the federal statutory tax rate for the years endedDecember 31 is as follows:
Federal statutory tax rate 35.0% 35.0% 35.0%
State income taxes, net of federal income tax benefit 3.5 4.3 3.5
Non-deductible employee stock purchase plan expense 0.3 0.3 0.3
Non-deductible meals and entertainment 0.3 0.3 0.3
Other, net 0.2 (0.3) 0.3
Effective tax rate 39.3% 39.6% 39.4%
Deferred income taxes reflect the net tax effects of temporary differences between the carrying amounts of assets andliabilities for financial reporting purposes and the corresponding amounts used for income tax reporting purposes.
Significant components of Brown & Brown’s current deferred tax assets as of December 31 are as follows:
Current deferred tax assets:
Deferred profit-sharing contingent commissions $ 9,713 $ 9,490
Net operating loss carryforwards 8,408 5,786
Accruals and reserves 11,155 9,132
Total current deferred tax assets $ 29,276 $ 24,408
2013 2012 2011
Current:
Federal $ 94,007 $ 75,522 $ 65,461
State 13,438 11,852 10,084
Foreign 805 669 638
Total current provision 108,250 88,043 76,183
Deferred:
Federal 28,469 27,348 27,212
State 3,723 5,375 3,131
Foreign 55 –––– ––––
Total deferred provision 32,247 32,723 30,343
Total tax provision $ 140,497 $ 120,766 $ 106,526
2013 2012 2011
(in thousands) 2013 2012
BB_2013AR_March20_FIN_Layout 1 3/20/14 3:39 PM Page 82

83
Significant components of Brown & Brown’s non-current deferred tax liabilities and assets as of December 31 are as follows:
Income taxes paid in 2013, 2012 and 2011 were $110,191,000, $80,622,000, and $75,403,000, respectively.
At December 31, 2013, Brown & Brown had net operating loss carryforwards of $22,135,000 and $94,561,000 for federal andstate income tax reporting purposes, respectively, portions of which expire in the years 2014 through 2033. The federalcarryforward is derived from insurance operations acquired by Brown & Brown in 2001 and 2013. The majority of the federal netoperating loss carryforward resulted from the 2013 stock acquisition of Beecher Carlson Holdings, Inc. The state carryforwardamount is derived from the operating results of certain subsidiaries and from the 2012 and 2013 stock acquisitions of ArrowheadGeneral Insurance Agency Superholding Corp and Beecher Carlson Holdings, Inc.
A reconciliation of the beginning and ending amount of unrecognized tax benefits is as follows:
Non-current deferred tax liabilities:
Fixed assets $ 11,651 $ 12,427
Intangible assets 306,009 245,020
Total non-current deferred tax liabilities 317,660 257,447
Non-current deferred tax assets:
Deferred compensation 22,598 13,576
Net operating loss carryforwards 3,843 6,658
Valuation allowance for deferred tax assets (485) (417)
Total non-current deferred tax assets 25,956 19,817
Net non-current deferred tax liability $ 291,704 $ 237,630
(in thousands)
The Company recognizes interest and penalties related to uncertain tax positions in income tax expense. As of December 31,2013 and 2012, the Company had approximately $121,000 and $79,000 of accrued interest and penalties related to uncertain taxpositions, respectively.
The total amount of unrecognized tax benefits that would affect the Company’s effective tax rate if recognized was $391,000as of December 31, 2013 and $294,000 as of December 31, 2012. The Company does not expect its unrecognized tax benefits tochange significantly over the next 12 months.
2013 2012 2011
Unrecognized tax benefits balance at January 1 $ 294 $ 806 $ 656
Gross increases for tax positions of prior years 232 222 257
Gross decreases for tax positions of prior years ––– (409) –––
Settlements (135) (325) (107)
Unrecognized tax benefits balance at December 31 $ 391 $ 294 $ 806
(in thousands) 2013 2012
BB_2013AR_March20_FIN_Layout 1 3/20/14 3:40 PM Page 83

Notes to Consolidated Financial Statements
84
As a result of a 2006 Internal Revenue Service (“IRS”) audit, the Company agreed to accrue at each December 31, for taxpurposes only, a known amount of profit-sharing contingent commissions represented by the actual amount of profit-sharingcontingent commissions received in the first quarter of the related year, with a true-up adjustment to the actual amount receivedby the end of the following March. Since this method for tax purposes differs from the method used for book purposes, it will resultin a current deferred tax asset as of December 31 each year which will reverse by the following March 31 when the related profit-sharing contingent commissions are recognized for financial accounting purposes.
The Company is subject to taxation in the United States and various state jurisdictions. The Company is also subject totaxation in the United Kingdom. In the United States, federal returns for fiscal years 2011 through 2013 remain open and subject toexamination by the Internal Revenue Service. The Company files and remits state income taxes in various states where theCompany has determined it is required to file state income taxes. The Company’s filings with those states remain open for audit forthe fiscal years 2008 through 2013. In the United Kingdom, the Company’s filings remain open for audit for the fiscal years 2012and 2013.
The Company’s wholly owned subsidiary, Arrowhead General Insurance Agency Superholding Corp, is currently undergoing anInternal Revenue Service review of its federal corporate income tax filings for the tax years ended December 31, 2010, December31, 2011 and the short period ended January 9, 2012. The Company’s 2008 through 2011 State of Colorado tax returns are currentlyunder audit. In addition the Company has been notified by the State of Oregon regarding audits of all Oregon state tax returns forthe period 2009 through 2012. Additionally, the Company has been notified by the State of Michigan regarding a review and auditof state tax returns for the period 2009 through 2011.
NOTE 10 EMPLOYEE SAVINGS PLAN
The Company has an Employee Savings Plan (401(k)) in which substantially all employees with more than 30 days of serviceare eligible to participate. Under this plan, Brown & Brown makes matching contributions, of up to 2.5% of each participant’sannual compensation. Further, the Plan authorizes the Company to make a discretionary profit-sharing contribution each year,which equaled 1.5% of each eligible employee’s compensation in each of the past three years. The Company’s contributions to theplan totaled $14,819,000 in 2013, $14,266,000 in 2012, and $11,866,000 in 2011.
NOTE 11 STOCK-BASED COMPENSATION
PERFORMANCE STOCK PLAN In 1996, Brown & Brown adopted and the shareholders approved a performance stock plan, under which until the suspension
of the plan in 2010, up to 14,400,000 Performance Stock Plan (“PSP”) shares could be granted to key employees contingent on theemployees’ future years of service with Brown & Brown and other performance-based criteria established by the CompensationCommittee of the Company’s Board of Directors. Before participants may take full title to Performance Stock, two vestingconditions must be met. Of the grants currently outstanding, specified portions will satisfy the first condition for vesting based on20% incremental increases in the 20-trading-day average stock price of Brown & Brown’s common stock from the price on thebusiness day prior to date of grant. Performance Stock that has satisfied the first vesting condition is considered “awarded shares.”Awarded shares are included as issued and outstanding common stock shares and are included in the calculation of basic anddiluted EPS. Dividends are paid on awarded shares and participants may exercise voting privileges on such shares. Awarded sharessatisfy the second condition for vesting on the earlier of a participant’s: (i) 15 years of continuous employment with Brown & Brownfrom the date shares are granted to the participants (or, in the case of the July 2009 grant to Powell Brown, 20 years); (ii)attainment of age 64 (on a prorated basis corresponding to the number of years since the date of grant); or (iii) death or disability.On April 28, 2010, the PSP was suspended and any remaining authorized but unissued shares, as well as any shares forfeited in thefuture, will be reserved for issuance under the 2010 Stock Incentive Plan (the “SIP”).
BB_2013AR_FINAL_3-98_Layout 1 3/18/14 2:31 PM Page 84

85
The total fair value of PSP grants that vested during each of the years ended December 31, 2013, 2012 and 2011 was$3,729,000, $23,034,000 and $2,384,000, respectively.
At December 31, 2013, 5,549,882 shares had been granted under the PSP. As of December 31, 2013, 75,435 shares had notmet the first condition for vesting, 2,295,852 shares had met the first condition of vesting and had been awarded, and 3,178,595shares had satisfied both conditions of vesting and had been distributed to participants. Of the shares that have not vested as ofDecember 31, 2013, the initial stock prices ranged from $4.25 to $25.68.
The Company uses a path-dependent lattice model to estimate the fair value of PSP grants on the grant date. A summary of PSP activity for the years ended December 31, 2013, 2012 and 2011 is as follows:
Weighted- Average
Grant Date Fair Value
GrantedShares
AwardedShares
SharesNot Yet
Awarded
Outstanding at January 1, 2011 $ 7.32 5,791,854 3,391,519 2,400,335
Granted $ –––– –––– –––– ––––
Awarded $ 9.56 –––– 447,154 (447,154)
Vested $ 6.01 (106,490) (106,490) ––––
Forfeited $ 9.48 (753,552) (386,914) (366,638)
Outstanding at December 31, 2011 $ 8.08 4,931,812 3,345,269 1,586,543
Granted $ –––– –––– –––– ––––
Awarded $ 8.09 –––– 7,743 (7,743)
Vested $ 3.29 (877,224) (877,224) ––––
Forfeited $ 13.06 (363,566) (81,283) (282,283)
Outstanding at December 31, 2012 $ 8.72 3,691,022 2,394,505 1,296,517
Granted $ –––– –––– –––– ––––
Awarded $ 10.25 –––– 122,021 (122,021)
Vested $ 4.01 (119,364) (119,364) ––––
Forfeited $ 8.73 (1,200,371) (101,310) (1,099,061)
Outstanding at December 31, 2013 $ 8.62 2,371,287 2,295,852 75,435
BB_2013AR_FINAL_3-98_Layout 1 3/19/14 5:52 PM Page 85

86
Notes to Consolidated Financial Statements
STOCK INCENTIVE PLAN On April 28, 2010, the shareholders of Brown & Brown, Inc. approved the Stock Incentive Plan (“SIP”) that provides for the
granting of stock options, stock and/or stock appreciation rights to employees and directors contingent on criteria established bythe Compensation Committee of the Company’s Board of Directors. The principal purpose of the SIP is to attract, incentivize andretain key employees by offering those persons an opportunity to acquire or increase a direct proprietary interest in the Company’soperations and future success. The SIP includes a sub-plan applicable to Decus Insurance Brokers Limited (“Decus”) which,together with its parent company, Decus Holdings (U.K.) Limited, are the Company’s only foreign subsidiaries. The shares of stockreserved for issuance under the SIP are any shares that are authorized for issuance under the PSP and not already subject to grantsunder the PSP, and that were outstanding as of April 28, 2010, the date of suspension of the PSP, together with PSP shares and SIPshares forfeited after that date. As of April 28, 2010, 6,046,768 shares were available for issuance under the PSP, which were thentransferred to the SIP. To date stock grants to employees under the SIP generally vest in four-to-ten years, subject to theachievement of certain performance criteria by grantees, and the achievement of consolidated EPS growth at certain levels by theCompany, over three-to-five-year measurement periods.
In 2010, 187,040 shares were granted under the SIP. This grant was conditioned upon the surrender of 187,040 sharespreviously granted under the PSP in 2009, which were accordingly treated as forfeited PSP shares. The vesting conditions of thisgrant were identical to those provided for in connection with the 2009 PSP grant; thus the target stock prices and the periodsassociated with satisfaction of the first and second conditions of vesting were unchanged. Additionally, grants totaling 5,205shares were made in 2010 to Decus employees under the SIP sub-plan applicable to Decus.
In 2011, 2,375,892 shares were granted under the SIP. Of this total, 24,670 shares were granted to Decus employees under theSIP sub-plan applicable to Decus. As of December 31, 2012, 37,408 of the granted shares had satisfied the first condition of vestingand had been “awarded”, meaning that dividends are paid on awarded shares and participants may exercise voting privileges onsuch shares.
In 2012, 814,545 shares were granted under the SIP, primarily related to the Arrowhead acquisition. As of December 31, 2012,no shares had met the first condition for vesting.
In 2013, 3,719,974 shares were granted under the SIP. Of the shares granted in 2013, 891,399 shares will vest upon thegrantees’ completion of between three and seven years of service with the Company, and because grantees have the right to votethe shares and receive dividends immediately after the date of grant these shares are considered awarded and outstanding underthe two-class method. As of December 31, 2013, no shares had met the first condition for vesting.
Additionally, non-employee members of the Board of Directors received shares annually issued pursuant to the SIP as part oftheir annual compensation. A total of 36,919 SIP shares were issued to these directors in 2011 and 2012, of which 11,682 wereissued in January 2011, 12,627 in January 2012, and 12,610 in December 2012. The shares issued in December 2012 were issued atthat earlier time rather than in January 2013 pursuant to action of the Board of Directors. No additional shares were granted orissued to the non-employee members of the Board of Directors in 2013.
At December 31, 2013, 2,207,098 shares were available for future grants, of which 318,134 are reserved for grants with PSP-type vesting conditions.
The Company uses the closing stock price on the day prior to the grant date to determine the fair value of SIP grants and thenapplies an estimated forfeiture factor to estimate the annual expense. Additionally, the Company uses the path-dependent latticemodel to estimate the fair value of grants with PSP-type vesting conditions as of the grant date. SIP shares that satisfied the firstvesting condition for PSP-like grants or the established performance criteria are considered awarded shares. Awarded shares areincluded as issued and outstanding common stock shares and are included in the calculation of basic and diluted EPS.
BB_2013AR_FINAL_3-98_Layout 1 3/18/14 2:31 PM Page 86

87
A summary of SIP activity for the years ended December 31, 2013, 2012 and 2011 is as follows:
EMPLOYEE STOCK PURCHASE PLANThe Company has a shareholder-approved Employee Stock Purchase Plan (“ESPP”) with a total of 12,000,000 authorized shares
of which 1,246,838 were available for future subscriptions as of December 31, 2013. Employees of the Company who regularly workmore than 20 hours per week are eligible to participate in the ESPP. Participants, through payroll deductions, may allot up to 10% oftheir compensation, to a maximum of $25,000, to purchase Company stock between August 1st of each year and the following July31st (the “Subscription Period”) at a cost of 85% of the lower of the stock price as of the beginning or end of the Subscription Period.
The Company estimates the fair value of an ESPP share option as of the beginning of the Subscription Period as the sum of: (1)15% of the quoted market price of the Company’s stock on the day prior to the beginning of the Subscription Period, and (2) 85% ofthe value of a one-year stock option on the Company stock using the Black-Scholes option-pricing model. The estimated fair value ofan ESPP share option as of the Subscription Period beginning in August 2013 was $8.36. The fair values of an ESPP share option as ofthe Subscription Periods beginning in August 2012 and 2011, were $5.84 and $4.27, respectively.
For the ESPP plan years ended July 31, 2013, 2012 and 2011, the Company issued 487,672, 562,748 and 488,052 shares ofcommon stock, respectively. These shares were issued at an aggregate purchase price of $10,456,000, or $21.44 per share, in 2013,$9,302,000, or $16.53 per share, in 2012, and $8,048,000, or $16.49 per share, in 2011.
For the five months ended December 31, 2013, 2012 and 2011 (portions of the 2013-2014, 2012-2013 and 2011-2012 plan years),222,526, 246,164, and 230,481 shares of common stock (from authorized but unissued shares), respectively, were subscribed to byESPP participants for proceeds of approximately $5,937,000, $5,278,000 and $3,810,000, respectively.
Weighted- Average
Grant Date Fair Value
GrantedShares
AwardedShares
SharesNot Yet
Awarded
Outstanding at January 1, 2011 $ 12.62 192,245 38,449 153,796
Granted $ 23.94 2,375,892 –––– 2,375,892
Awarded $ 11.41 –––– (1,041) 1,041
Vested $ –––– –––– –––– ––––
Forfeited $ 23.94 (90,080) –––– (90,080)
Outstanding at December 31, 2011 $ 23.06 2,478,057 37,408 2,440,649
Granted $ 22.59 814,545 –––– 814,545
Awarded $ –––– –––– –––– ––––
Vested $ –––– –––– –––– ––––
Forfeited $ 23.62 (135,291) –––– (135,291)
Outstanding at December 31, 2012 $ 22.91 3,157,311 37,408 3,119,903
Granted $ 31.95 3,719,974 –––– 3,719,974
Awarded $ 30.71 –––– 966,215 (966,215)
Vested $ –––– –––– –––– ––––
Forfeited $ 23.88 (271,184) (7,906) (263,278)
Outstanding at December 31, 2013 $ 27.96 6,606,101 995,717 5,610,384
BB_2013AR_FINAL_3-98_Layout 1 3/19/14 5:52 PM Page 87

88
Notes to Consolidated Financial Statements
INCENTIVE STOCK OPTION PLANOn April 21, 2000, Brown & Brown adopted, and the shareholders approved, a qualified incentive stock option plan (the
“ISOP”) that provides for the granting of stock options to certain key employees for up to 4,800,000 shares of common stock. OnDecember 31, 2008, the ISOP expired. The objective of the ISOP was to provide additional performance incentives to grow Brown& Brown’s pre-tax income in excess of 15% annually. The options were granted at the most recent trading day’s closing marketprice and vest over a one-to-10-year period, with a potential acceleration of the vesting period to three-to-six years based uponachievement of certain performance goals. All of the options expire 10 years after the grant date.
The Company uses the Black-Scholes option-pricing model to estimate the fair value of stock options on the grant date. Therisk-free interest rate is based upon the U.S. Treasury yield curve on the date of grant with a remaining term approximating theexpected term of the option granted. The expected term of the options granted is derived from historical data; grantees are dividedinto two groups based upon expected exercise behavior and are considered separately for valuation purposes. The expectedvolatility is based upon the historical volatility of the Company’s common stock over the period of time equivalent to the expectedterm of the options granted. The dividend yield is based upon the Company’s best estimate of future dividend yield.
A summary of stock option activity for the years ended December 31, 2013, 2012 and 2011 is as follows:
SharesUnder Option
Weighted-Average
Exercise Price
Weighted-AverageRemaining
Contractual Term(in years)
AggregateIntrinsic Value(in thousands)
Outstanding at January 1, 2011 1,875,170 $ 17.53 5.4 $ 17,147
Granted –––– $ ––––
Exercised (52,589) $ 18.48
Forfeited (438,044) $ 17.28
Expired –––– $ ––––
Outstanding at December 31, 2011 1,384,537 $ 17.58 4.4 $ 14,587
Granted –––– $ ––––
Exercised (645,745) $ 16.64
Forfeited –––– $ ––––
Expired –––– $ ––––
Outstanding at December 31, 2012 738,792 $ 18.39 4.9 $ 8,891
Granted –––– $ ––––
Exercised (115,847) $ 17.56
Forfeited –––– $ ––––
Expired –––– $ ––––
Outstanding at December 31, 2013 622,945 $ 18.55 4.1 $ 7,289
Ending vested and expected to vest at December 31, 2013 622,945 $ 18.55 4.1 $ 7,289
Exercisable at December 31, 2013 422,945 $ 18.48 4.2 $ 5,460
Exercisable at December 31, 2012 162,792 $ 17.82 4.0 $ 1,243
Exercisable at December 31, 2011 396,985 $ 18.16 5.4 $ 1,774
Stock Options
BB_2013AR_March20_FIN_Layout 1 3/20/14 3:40 PM Page 88

89
The following table summarizes information about stock options outstanding at December 31, 2013:
The total intrinsic value of options exercised, determined as of the date of exercise, during the years ended December 31, 2013,2012 and 2011 was $1,558,000, $5,780,000 and $333,000, respectively. The total intrinsic value is calculated as the differencebetween the exercise price of all underlying awards and the quoted market price of the Company’s stock for all in-the-money stockoptions at December 31, 2013, 2012 and 2011, respectively.
There are no option shares available for future grant under the ISOP since this plan expired as of December 31, 2008.
SUMMARY OF NON-CASH STOCK-BASED COMPENSATION EXPENSEThe non-cash stock-based compensation expense for the years ended December 31 is as follows:
SUMMARY OF UNRECOGNIZED COMPENSATION EXPENSE As of December 31, 2013, there was approximately $133.9 million of unrecognized compensation expense related to all non-
vested share-based compensation arrangements granted under the Company’s stock-based compensation plans. That expense isexpected to be recognized over a weighted-average period of 6.9 years.
ExercisePrice
NumberOutstanding
Weighted-Average
RemainingContractualLife (years)
Weighted-Average
Exercise PriceNumber
Exercisable
Weighted-Average
Exercise Price
Options Outstanding Options Exercisable
$22.06 12,000 1.0 $ 22.06 –––– $ 22.06
$18.48 610,945 4.2 $ 18.48 422,945 $ 18.48
Total 622,945 4.1 $ 18.55 422,945 $ 18.48
NOTE 12 SUPPLEMENTAL DISCLOSURES OF CASH FLOW INFORMATION
Brown & Brown’s significant non-cash investing and financing activities for the years ended December 31 are summarized as follows:
Stock Incentive Plan $ 15,934 $ 9,288 $ 5,320
Employee Stock Purchase Plan 3,538 2,856 2,126
Performance Stock Plan 2,310 2,612 2,661
Incentive Stock Option Plan 821 1,109 1,087
Total $ 22,603 $ 15,865 $ 11,194
(in thousands)
Other payable issued for purchased customer accounts $ 1,425 $ 25,439 $ ––––
Notes payable issued or assumed for purchased customer accounts $ –––– $ 59 $ 1,603
Estimated acquisition earn-out payables and related charges $ 5,091 $ 21,479 $ 30,525
Notes received on the sale of fixed assets and customer accounts $ 1,108 $ 967 $ 8,166
(in thousands)
2013 2012 2011
2013 2012 2011
BB_2013AR_March20_FIN_Layout 1 3/20/14 3:40 PM Page 89

90
Notes to Consolidated Financial Statements
NOTE 13 COMMITMENTS AND CONTINGENCIES
OPERATING LEASESBrown & Brown leases facilities and certain items of office equipment under non-cancelable operating lease arrangements
expiring on various dates through 2042. The facility leases generally contain renewal options and escalation clauses based uponincreases in the lessors’ operating expenses and other charges. Brown & Brown anticipates that most of these leases will berenewed or replaced upon expiration. At December 31, 2013, the aggregate future minimum lease payments under all non-cancelable lease agreements were as follows:
(in thousands)
Rental expense in 2013, 2012 and 2011 for operating leases totaled $42,992,000, $39,810,000, and $34,951,000, respectively.
LEGAL PROCEEDINGS The Company records losses for claims in excess of the limits of, or outside the coverage of, applicable insurance at the time
and to the extent they are probable and estimable. In accordance with ASC Topic 450—Contingencies, the Company accruesanticipated costs of settlement, damages, losses for liability claims and, under certain conditions, costs of defense, based onhistorical experience or to the extent specific losses are probable and estimable. Otherwise, the Company expenses these costs asincurred. If the best estimate of a probable loss is a range rather than a specific amount, the Company accrues the amount at thelower end of the range.
The Company’s accruals for legal matters that were probable and estimable were not material at December 31, 2013 and 2012.We continue to assess certain litigation and claims to determine the amounts, if any, that management believes will be paid as aresult of such claims and litigation and, therefore, additional losses may be accrued and paid in the future, which could adverselyimpact the Company’s operating results, cash flows and overall liquidity. The Company maintains third-party insurance policies toprovide coverage for certain legal claims, in an effort to mitigate its overall exposure to unanticipated claims or adverse decisions.However, as (i) one or more of the Company’s insurance carriers could take the position that portions of these claims are notcovered by the Company’s insurance, (ii) to the extent that payments are made to resolve claims and lawsuits, applicable insurancepolicy limits are eroded and (iii) the claims and lawsuits relating to these matters are continuing to develop, it is possible thatfuture results of operations or cash flows for any particular quarterly or annual period could be materially affected by unfavorableresolutions of these matters. Based on the A. M. Best ratings of these third-party insurers, management does not believe there is asubstantial risk of an insurer’s material nonperformance related to any current insured claims.
On the basis of current information, the availability of insurance and legal advice, in management’s opinion, the Company isnot currently involved in any legal proceedings which, individually or in the aggregate, would have a material adverse effect on itsfinancial condition, operations and/or cash flows.
2014 $ 34,972
2015 31,386
2016 27,830
2017 22,209
2018 16,015
Thereafter 42,074
Total minimum future lease payments $ 174,486
BB_2013AR_FINAL_3-98_Layout 1 3/18/14 2:31 PM Page 90

91
NOTE 14 QUARTERLY OPERATING RESULTS (UNAUDITED)
Quarterly operating results for 2013 and 2012 were as follows:
Quarterly financial results are affected by seasonal variations. The timing of the Company’s receipt of profit-sharing contingentcommissions, policy renewals and acquisitions may cause revenues, expenses and net income to vary significantly between quarters.
NOTE 15 SEGMENT INFORMATION
Brown & Brown’s business is divided into four reportable segments: the Retail Division, which provides a broad range of insuranceproducts and services to commercial, public and quasi-public entities, and to professional and individual customers; the NationalPrograms Division, which provides professional liability and related package products for certain professionals delivered throughnationwide networks of independent agents, and markets targeted products and services designed for specific industries, trade groups,public and quasi-public entities, and market niches; the Wholesale Brokerage Division, which markets and sells excess and surpluscommercial and personal lines insurance, and reinsurance, primarily through independent agents and brokers; and the ServicesDivision, which provides insurance-related services, including third-party claims administration and comprehensive medical utilizationmanagement services in both the workers’ compensation and all-lines liability arenas, as well as Medicare set-aside services, SocialSecurity disability and Medicare benefits advocacy services and catastrophe claims adjusting services.
Brown & Brown conducts all of its operations within the United States of America, except for one wholesale brokerage operationbased in London, England, and retail operations in Bermuda and the Cayman Islands. These operations earned $12.2 million, $9.7million and $9.1 million of total revenues for the years ended December 31, 2013, 2012 and 2011, respectively. Long-lived assets heldoutside of the United States during each of these three years were not material.
The accounting policies of the reportable segments are the same as those described in Note 1. Brown & Brown evaluates theperformance of its segments based upon revenues and income before income taxes. Inter-segment revenues are eliminated.
FirstQuarter(in thousands, except per share data)
2013
Total revenues $ 335,012 $ 325,792 $ 359,310 $ 343,165
Total expenses $ 235,521 $ 239,571 $ 263,855 $ 266,723
Income before income taxes $ 99,491 $ 86,221 $ 95,455 $ 76,442
Net income $ 60,131 $ 52,007 $ 57,749 $ 47,225
Net income per share:
Basic $ 0.42 $ 0.36 $ 0.40 $ 0.32
Diluted $ 0.41 $ 0.36 $ 0.39 $ 0.32
2012
Total revenues $ 302,486 $ 290,916 $ 303,800 $ 302,830
Total expenses $ 219,696 $ 219,771 $ 222,151 $ 233,603
Income before income taxes $ 82,790 $ 71,145 $ 81,649 $ 69,227
Net income $ 49,433 $ 42,471 $ 49,504 $ 42,637
Net income per share:
Basic $ 0.34 $ 0.30 $ 0.34 $ 0.30
Diluted $ 0.34 $ 0.29 $ 0.34 $ 0.29
ThirdQuarter
FourthQuarter
SecondQuarter
BB_2013AR_March20_FIN_Layout 1 3/20/14 3:40 PM Page 91

92
Notes to Consolidated Financial Statements
Summarized financial information concerning Brown & Brown’s reportable segments is shown in the following table. The “Other”column includes any income and expenses not allocated to reportable segments and corporate-related items, including the inter-company interest expense charge to the reporting segment.
Total revenues $ 728,324 $ 292,130 $ 209,907 $ 131,489 $ 1,429 $ 1,363,279
Investment income $ 82 $ 19 $ 22 $ 1 $ 514 $ 638
Amortization $ 38,052 $ 14,593 $ 11,550 $ 3,698 $ 39 $ 67,932
Depreciation $ 5,847 $ 5,399 $ 2,794 $ 1,623 $ 1,822 $ 17,485
Interest expense $ 34,407 $ 24,014 $ 2,565 $ 7,321 $ (51,867) $ 16,440
Income before income taxes $ 166,316 $ 58,379 $ 53,822 $ 24,518 $ 54,574 $ 357,609
Total assets $ 2,992,087 $ 1,335,911 $ 927,825 $ 277,652 $ (1,883,967) $ 3,649,508
Capital expenditures $ 6,847 $ 4,743 $ 1,931 $ 1,811 $ 1,034 $ 16,366
Year Ended December 31, 2013
RetailNational
ProgramsWholesaleBrokerage Services Other Total(in thousands)
Total revenues $ 644,429 $ 252,943 $ 183,565 $ 116,736 $ 2,359 $ 1,200,032
Investment income $ 108 $ 20 $ 22 $ 1 $ 646 $ 797
Amortization $ 34,639 $ 13,936 $ 11,280 $ 3,680 $ 38 $ 63,573
Depreciation $ 5,181 $ 4,600 $ 2,718 $ 1,278 $ 1,596 $ 15,373
Interest expense $ 26,641 $ 25,674 $ 3,974 $ 8,602 $ (48,794) $ 16,097
Income before income taxes $ 145,214 $ 51,491 $ 43,355 $ 16,770 $ 47,981 $ 304,811
Total assets $ 2,420,759 $ 1,183,191 $ 837,364 $ 238,430 $ (1,551,686) $ 3,128,058
Capital expenditures $ 5,732 $ 9,633 $ 3,383 $ 2,519 $ 2,761 $ 24,028
Year Ended December 31, 2012
RetailNational
ProgramsWholesaleBrokerage Services Other Total(in thousands)
Total revenues $ 607,199 $ 164,427 $ 174,158 $ 65,972 $ 1,786 $ 1,013,542
Investment income $ 102 $ –––– $ 34 $ 128 $ 1,003 $ 1,267
Amortization $ 33,373 $ 7,770 $ 11,032 $ 2,541 $ 39 $ 54,755
Depreciation $ 5,046 $ 2,937 $ 2,594 $ 590 $ 1,225 $ 12,392
Interest expense $ 27,688 $ 1,381 $ 7,495 $ 5,746 $ (28,178) $ 14,132
Income before income taxes $ 137,807 $ 60,465 $ 36,511 $ 7,729 $ 28,009 $ 270,521
Total assets $ 2,155,413 $ 680,251 $ 712,212 $ 166,060 $ (1,106,925) $ 2,607,011
Capital expenditures $ 6,102 $ 1,968 $ 2,658 $ 689 $ 2,191 $ 13,608
Year Ended December 31, 2011
RetailNational
ProgramsWholesaleBrokerage Services Other Total(in thousands)
BB_2013AR_FINAL_3-98_Layout 1 3/18/14 2:31 PM Page 92

93
NOTE 16 SUBSEQUENT EVENT
On January 15, 2014, Brown & Brown entered into a merger agreement (the “Agreement”) to acquire The Wright InsuranceGroup, LLC (“Wright”). Immediately upon the consummation of the merger, Wright’s equity interests will be converted into therights to receive cash equal, collectively, to $602.5 million. This amount is composed of cash payments of $587.5 million for thePrograms Business, $7.5 million for Wright National Flood Insurance Company (“WNFIC”) and $7.5 million for WNFIC statutorysurplus. In addition, Wright’s equityholders may receive additional consideration of up to $37.5 million in cash in the event of theclosing of certain acquisition transactions by Wright and its affiliates (or, after the closing of the acquisition of Wright, by theCompany and its affiliates) prior to July 15, 2015.
Under the Agreement, the merger is subject to certain closing conditions including the receipt of required regulatory approvalsfor the transaction (including the approval of antitrust authorities necessary to complete the acquisition). If the merger is notclosed by July 15, 2014 (which may potentially be extended to October 15, 2014 if the only then-outstanding conditions areobtaining regulatory approvals), either party may terminate the agreement.
BB_2013AR_FINAL_3-98_Layout 1 3/18/14 2:31 PM Page 93

94
Report of Independent Registered Public Accounting Firm
To the Board of Directors and Shareholders of Brown & Brown, Inc. Daytona Beach, Florida
We have audited the accompanying consolidated balance sheets of Brown & Brown, Inc. and subsidiaries (the “Company”) asof December 31, 2013 and 2012, and the related consolidated statements of income, shareholders’ equity, and cash flows for eachof the three years in the period ended December 31, 2013. These financial statements are the responsibility of the Company’smanagement. Our responsibility is to express an opinion on the financial statements based on our audits.
We conducted our audits in accordance with the standards of the Public Company Accounting Oversight Board (UnitedStates). Those standards require that we plan and perform the audit to obtain reasonable assurance about whether the financialstatements are free of material misstatement. An audit includes examining, on a test basis, evidence supporting the amounts anddisclosures in the financial statements. An audit also includes assessing the accounting principles used and significant estimatesmade by management, as well as evaluating the overall financial statement presentation. We believe that our audits provide areasonable basis for our opinion.
In our opinion, such consolidated financial statements present fairly, in all material respects, the financial position of Brown &Brown, Inc. and subsidiaries as of December 31, 2013 and 2012, and the results of their operations and their cash flows for each ofthe three years in the period ended December 31, 2013, in conformity with accounting principles generally accepted in the UnitedStates of America.
We have also audited, in accordance with the standards of the Public Company Accounting Oversight Board (United States),the Company’s internal control over financial reporting as of December 31, 2013, based on the criteria established in InternalControl—Integrated Framework (1992) issued by the Committee of Sponsoring Organizations of the Treadway Commission and ourreport dated February 28, 2014 expressed an unqualified opinion on the Company’s internal control over financial reporting.
Certified Public AccountantsJacksonville, FloridaFebruary 28, 2014
BB_2013AR_FINAL_3-98_Layout 1 3/19/14 5:54 PM Page 94

95
Report of Independent Registered Public Accounting Firm
To the Board of Directors and Shareholders of Brown & Brown, Inc. Daytona Beach, Florida
We have audited the internal control over financial reporting of Brown & Brown, Inc. and subsidiaries (the “Company”) as ofDecember 31, 2013, based on criteria established in Internal Control—Integrated Framework (1992) issued by the Committee ofSponsoring Organizations of the Treadway Commission. As described in Management’s Report on Internal Control over FinancialReporting, management excluded from its assessment the internal control over financial reporting at Beecher Carlson Holdings,Inc. and ICA, Inc. (collectively the “2013 Excluded Acquisitions”), which were acquired during 2013 and whose financial statementsconstitute 2.6% and 10.8% of net and total assets, respectively, 3.4% of revenues, and 2.2% of net income of the consolidatedfinancial statement amounts as of and for the year ended December 31, 2013. Accordingly, our audit did not include the internalcontrol over financial reporting of the 2013 Excluded Acquisitions. The Company’s management is responsible for maintainingeffective internal control over financial reporting and for its assessment of the effectiveness of internal control over financialreporting, included in the accompanying Management’s Report on Internal Control Over Financial Reporting. Our responsibility isto express an opinion on the Company’s internal control over financial reporting based on our audit.
We conducted our audit in accordance with the standards of the Public Company Accounting Oversight Board (United States).Those standards require that we plan and perform the audit to obtain reasonable assurance about whether effective internalcontrol over financial reporting was maintained in all material respects. Our audit included obtaining an understanding of internalcontrol over financial reporting, assessing the risk that a material weakness exists, testing and evaluating the design and operatingeffectiveness of internal control based on the assessed risk, and performing such other procedures as we considered necessary inthe circumstances. We believe that our audit provides a reasonable basis for our opinion.
A company’s internal control over financial reporting is a process designed by, or under the supervision of, the company’sprincipal executive and principal financial officers, or persons performing similar functions, and effected by the company’s board ofdirectors, management, and other personnel to provide reasonable assurance regarding the reliability of financial reporting and thepreparation of financial statements for external purposes in accordance with generally accepted accounting principles. Acompany’s internal control over financial reporting includes those policies and procedures that (1) pertain to the maintenance ofrecords that, in reasonable detail, accurately and fairly reflect the transactions and dispositions of the assets of the company; (2)provide reasonable assurance that transactions are recorded as necessary to permit preparation of financial statements inaccordance with generally accepted accounting principles, and that receipts and expenditures of the company are being made onlyin accordance with authorizations of management and directors of the company; and (3) provide reasonable assurance regardingprevention or timely detection of unauthorized acquisition, use, or disposition of the company’s assets that could have a materialeffect on the financial statements.
Because of the inherent limitations of internal control over financial reporting, including the possibility of collusion or impropermanagement override of controls, material misstatements due to error or fraud may not be prevented or detected on a timelybasis. Also, projections of any evaluation of the effectiveness of the internal control over financial reporting to future periods aresubject to the risk that the controls may become inadequate because of changes in conditions, or that the degree of compliancewith the policies or procedures may deteriorate.
In our opinion, the Company maintained, in all material respects, effective internal control over financial reporting as ofDecember 31, 2013, based on the criteria established in Internal Control—Integrated Framework (1992) issued by the Committee ofSponsoring Organizations of the Treadway Commission.
We have also audited, in accordance with the standards of the Public Company Accounting Oversight Board (United States),the consolidated financial statements as of and for the year ended December 31, 2013 of the Company and our report datedFebruary 28, 2014 expressed an unqualified opinion on those financial statements.
Certified Public AccountantsJacksonville, FloridaFebruary 28, 2014
BB_2013AR_FINAL_3-98_Layout 1 3/19/14 5:54 PM Page 95

Management’s Report on Internal Control Over Financial Reporting
The management of Brown & Brown, Inc. and its subsidiaries (“Brown & Brown”) is responsible for establishing andmaintaining adequate internal control over financial reporting, as such term is defined in Securities Exchange Act Rule 13a-15(f).Under the supervision and with the participation of management, including Brown & Brown’s principal executive officer andprincipal financial officer, Brown & Brown conducted an evaluation of the effectiveness of internal control over financial reportingbased on the framework in Internal Control—Integrated Framework (1992) issued by the Committee of Sponsoring Organizations ofthe Treadway Commission.
In conducting Brown & Brown’s evaluation of the effectiveness of its internal control over financial reporting, Brown & Brownhas excluded the following acquisitions completed by Brown & Brown during 2013: Beecher Carlson Holdings, Inc. and ICA, Inc.(collectively the “2013 Excluded Acquisitions”), which were acquired during 2013 and whose financial statements constitute 2.6%and 10.8% of net and total assets, respectively, 3.4% of revenues, and 2.2% of net income of the consolidated financial statementamounts as of and for the year ended December 31, 2013. Refer to Note 2 to the Consolidated Financial Statements for furtherdiscussion of these acquisitions and their impact on Brown & Brown’s Consolidated Financial Statements.
Based on Brown & Brown’s evaluation under the framework in Internal Control—Integrated Framework (1992) issued by theCommittee of Sponsoring Organizations of the Treadway Commission, management concluded that internal control over financialreporting was effective as of December 31, 2013. Management’s internal control over financial reporting as of December 31, 2013has been audited by Deloitte & Touche LLP, an independent registered public accounting firm, as stated in their report which isincluded herein.
Brown & Brown, Inc. Daytona Beach, Florida February 28, 2014
J. Powell Brown
Chief Executive Officer
Cory T. Walker
Chief Financial Officer
96
BB_2013AR_FINAL_3-98_Layout 1 3/18/14 2:31 PM Page 96

97
BB_2013AR_FINAL_3-98_Layout 1 3/18/14 2:31 PM Page 97

Performance Graph
The following graph is a comparison of five-year cumulative total stockholder returns for our common stock as compared withthe cumulative total stockholder return for the NYSE Composite Index, and a group of peer insurance broker and agencycompanies (Aon plc, Arthur J. Gallagher & Co, Marsh & McLennan Companies, and Willis Group Holdings plc). The returns of eachcompany have been weighted according to such companies’ respective stock market capitalizations as of December 31, 2008 forthe purposes of arriving at a peer group average. The total return calculations are based upon an assumed $100 investment onDecember 31, 2008, with all dividends reinvested.
Comparison of 5 Year Cumulative Total ReturnAmong Brown & Brown, Inc., the NYSE Composite Index, and a Peer Group
We caution that the stock price performance shown in the graph should not be considered indicative of potential future stockprice performance.
Company/Index/Market 12/31/2008 12/31/2009 12/31/2010 12/31/2011 12/31/2012 12/31/2013
Brown & Brown, Inc. $ 100.00 $ 87.36 $ 118.22 $ 113.39 $ 129.32 $ 161.37
NYSE Composite Index $ 100.00 $ 128.28 $ 145.46 $ 139.87 $ 162.23 $ 204.87
Peer Group $ 100.00 $ 92.45 $ 117.98 $ 132.65 $ 147.18 $ 214.75
Year Ending
98
BB_2013AR_FINAL_3-98_Layout 1 3/18/14 2:31 PM Page 98

Can any wave be too big?
BROWN & BROWN, INC. Ten-Year Financial Summary
(in thousands, except per share data, percentages and other information)
Year Ended December 31
2013 2012 2011 2010 2009 2008 2007 2006 2005 2004
REVENUESCommissions and fees $ 1,355,503 $ 1,189,081 $ 1,005,962 $ 966,917 $ 964,863 $ 965,983 $ 914,650 $ 864,663 $ 775,543 $ 638,267Investment income 638 797 1,267 1,326 1,161 6,079 30,494(1) 11,479 6,578 2,715Other income, net 7,138 10,154 6,313 5,249 1,853 5,492 14,523 1,862 3,686 5,952
Total revenues 1,363,279 1,200,032 1,013,542 973,492 967,877 977,554 959,667 878,004 785,807 646,934
EXPENSESEmployee compensation and benefits 683,000 608,506 508,675 487,820 484,680 485,783 444,101 404,891 374,943 314,221Non-cash stock-based compensation 22,603 15,865 11,194 6,845 7,358 7,314 5,667 5,416 3,337 2,625Other operating expenses 195,677 174,389 144,079 135,851 143,389 137,352 131,371 126,492 105,622 84,927Amortization 67,932 63,573 54,755 51,442 49,857 46,631 40,436 36,498 33,245 22,146Depreciation 17,485 15,373 12,392 12,639 13,240 13,286 12,763 11,309 10,061 8,910Interest 16,440 16,097 14,132 14,471 14,599 14,690 13,802 13,357 14,469 7,156Change in estimated acquisition earn-out payables 2,533 1,418 (2,206) (1,674) –––– –––– –––– –––– –––– ––––
Total expenses 1,005,670 895,221 743,021 707,394 713,123 705,056 648,140 597,963 541,677 439,985Income before income taxes 357,609 304,811 270,521 266,098 254,754 272,498 311,527 280,041 244,130 206,949Income taxes 140,497 120,766 106,526 104,346 101,460 106,374 120,568 107,691 93,579 78,106
Net Income $ 217,112 $ 184,045 $ 163,995 $ 161,752 $ 153,294 $ 166,124 $ 190,959 $ 172,350 $ 150,551 $ 128,843
Employee compensation and benefits as % of total revenue 50.1% 50.7% 50.2% 50.1% 50.1% 49.7% 46.3% 46.1% 47.7% 48.6%Other operating expenses as % of total revenue 14.4% 14.5% 14.2% 14.0% 14.8% 14.1% 13.7% 14.4% 13.4% 13.1%
EARNINGS PER SHARE INFORMATIONNet income per share – diluted $ 1.48 $ 1.26 $ 1.13 $ 1.12 $ 1.08 $ 1.17 $ 1.35 $ 1.22 $ 1.08 $ 0.93Weighted average number of shares outstanding – diluted 142,624 142,010 140,264 139,318 137,507 136,884 136,357 135,886 135,033 133,994Dividends paid per share $ 0.3700 $ 0.3450 $ 0.3250 $ 0.3125 $ 0.3025 $ 0.2850 $ 0.2500 $ 0.2100 $ 0.1700 $ 0.1450
YEAR-END FINANCIALPOSITIONTotal assets $ 3,649,508 $ 3,128,058 $ 2,607,011 $ 2,400,814 $ 2,224,226 $ 2,119,580 $ 1,960,659 $ 1,807,952 $ 1,608,660 $ 1,249,517Long-term debt $ 380,000 $ 450,000 $ 250,033 $ 250,067 $ 250,209 $ 253,616 $ 227,707 $ 226,252 $ 214,179 $ 227,063Total shareholders’ equity $ 2,007,141 $ 1,807,333 $ 1,643,963 $ 1,506,344 $ 1,369,874 $ 1,241,741 $ 1,097,458 $ 929,345 $ 764,344 $ 624,325Total shares outstanding 145,419 143,878 143,352 142,795 142,076 141,544 140,673 140,016 139,383 138,318
OTHERINFORMATIONNumber of full-time equivalent employees at year-end 6,992 6,438 5,557 5,286 5,206 5,398 5,047 4,733 4,540 3,960Total revenues per average number of employees (2) $ 203,020 $ 191,729 (3) $ 186,949 $ 185,568 $ 182,549 $ 187,181 $ 196,251 $ 189,368 $ 184,896 $ 173,046Stock price at year-end $ 31.39 $ 25.46 $ 22.63 $ 23.94 $ 17.97 $ 20.90 $ 23.50 $ 28.21 $ 30.54 $ 21.78Stock price earnings multiple at year-end (4) 21.2 20.2 20.0 21.4 16.6 17.9 17.4 23.1 28.3 23.4Return on beginning shareholders’ equity (5) 12% 11% 11% 12% 12% 15% 21% 23% 24% 26%
(1) Includes an $18,664 gain on the sale of our investment in Rock-Tenn Company.
(2) Represents total revenues divided by the average of the number of full-time equivalent employees at the beginning of the year and the number of full-time equivalent employees at the end of the year.
(3) Of the 881 increase in the number of full-time equivalent employees from 2011 to 2012, 523 employees related to the January 9, 2012 acquisition of Arrowhead, and therefore, are considered to be full-time equivalent as of January 1, 2012. Thus, the average number of full-time equivalent employees for 2012 is considered to be 6,259.
(4) Stock price at year-end divided by net income per share-diluted.
(5) Represents net income divided by total shareholders’ equity as of the beginning of the year.
All share and per-share information has been adjusted to give effect to the 2-for-1 common stock split which became effective November 29, 2005.
Weighted average number of shares outstanding-diluted has been adjusted to give effect for the two-class method of calculating earnings pershare as described in Note 1 to the Consolidated Financial Statements.
BB_INSIDE_COVERS2_REV-FINAL_Layout 1 3/19/14 5:56 PM Page 1
Can any wave be too big?
BROWN & BROWN, INC. Ten-Year Financial Summary
(in thousands, except per share data, percentages and other information)
Year Ended December 31
2013 2012 2011 2010 2009 2008 2007 2006 2005 2004
REVENUES
Commissions and fees $ 1,355,503 $ 1,189,081 $ 1,005,962 $ 966,917 $ 964,863 $ 965,983 $ 914,650 $ 864,663 $ 775,543 $ 638,267
Investment income 638 797 1,267 1,326 1,161 6,079 30,494(1) 11,479 6,578
2,715
Other income, net 7,138 10,154 6,313 5,249 1,853 5,492 14,523 1,862 3,686
5,952
Total revenues 1,363,279 1,200,032 1,013,542 973,492 967,877 977,554 959,667 878,004 785,807 646,934
EXPENSES
Employee compensation and benefits 683,000 608,506 508,675 487,820 484,680 485,783 444,101 404,891 374,943 314,221
Non?cash stock?based compensation 22,603 15,865 11,194 6,845 7,358 7,314 5,667 5,416 3,337 2,625
Other operating expenses 195,677 174,389 144,079 135,851 143,389 137,352 131,371 126,492 105,622 84,927
Amortization 67,932 63,573 54,755 51,442 49,857 46,631 40,436 36,498 33,245 22,146
Depreciation 17,485 15,373 12,392 12,639 13,240 13,286 12,763 11,309 10,061 8,910
Interest 16,440 16,097 14,132 14,471 14,599 14,690 13,802 13,357 14,469
7,156
Change in estimated acquisition earn?out payables 2,533 1,418 (2,206) (1,674) ———— ———— ———— ———— ———— ————
Total expenses 1,005,670 895,221 743,021 707,394 713,123 705,056 648,140 597,963 541,677 439,985
Income before income taxes 357,609 304,811 270,521 266,098 254,754 272,498 311,527 280,041 244,130 206,949
Income taxes 140,497 120,766 106,526 104,346 101,460 106,374 120,568 107,691 93,579 78,106
Net Income $ 217,112 $ 184,045 $ 163,995 $ 161,752 $ 153,294 $ 166,124 $ 190,959 $ 172,350 $ 150,551 $ 128,843
Employee compensation and benefits as % of total revenue 50.1% 50.7% 50.2% 50.1% 50.1% 49.7% 46.3% 46.1% 47.7% 48.6%
Other operating expenses as % of total revenue 14.4% 14.5% 14.2% 14.0% 14.8% 14.1% 13.7% 14.4% 13.4% 13.1%
EARNINGS PER SHARE INFORMATION
Net income per share — diluted $ 1.48 $ 1.26 $ 1.13 $ 1.12 $ 1.08 $ 1.17 $ 1.35 $ 1.22 $ 1.08 $ 0.93
Weighted average number of shares outstanding — diluted 142,624 142,010 140,264 139,318 137,507 136,884 136,357 135,886 135,033 133,994
Dividends paid per share $ 0.3700 $ 0.3450 $ 0.3250 $ 0.3125 $ 0.3025 $ 0.2850 $ 0.2500 $ 0.2100 $ 0.1700 $ 0.1450
YEAR?END FINANCIAL?POSITION
Total assets $ 3,649,508 $ 3,128,058 $ 2,607,011 $2,400,814 $2,224,226 $2,119,580 $1,960,659 $1,807,952 $1,608,660 $1,249,517
Long?term debt $ 380,000 $ 450,000 $ 250,033 $ 250,067 $ 250,209 $ 253,616 $ 227,707 $ 226,252 $ 214,179 $
227,063
Total shareholders? equity $ 2,007,141 $ 1,807,333 $ 1,643,963 $1,506,344 $1,369,874 $1,241,741 $1,097,458 $ 929,345 $ 764,344 $ 624,325
Total shares outstanding 145,419 143,878 143,352 142,795 142,076 141,544 140,673 140,016 139,383 138,318
OTHER?INFORMATION
Number of full?time equivalent employees at year?end 6,992 6,438 5,557 5,286 5,206 5,398 5,047 4,733 4,540 3,960
Total revenues per average number of employees(2) $ 203,020 $ 191,729 (3) $ 186,949 $ 185,568 $ 182,549 $ 187,181 $ 196,251 $ 189,368 $ 184,896 $ 173,046
Stock price at year?end $ 31.39 $ 25.46 $ 22.63 $ 23.94 $ 17.97 $ 20.90 $ 23.50 $ 28.21 $ 30.54 $ 21.78
Stock price earnings multiple at year?end(4) 21.2 20.2 20.0 21.4 16.6 17.9 17.4 23.1 28.3 23.4
Return on beginning shareholders? equity(5) 12% 11% 11% 12% 12% 15% 21% 23% 24% 26%
(1) Includes an $18,664 gain on the sale of our investment in Rock-Tenn Company.
(2) Represents total revenues divided by the average of the number of full-time equivalent employees at the beginning of the year and the number of full-time equivalent employees at the end of the year.
(3) Of the 881 increase in the number of full-time equivalent employees from 2011 to 2012, 523 employees related to the January 9, 2012 acquisition of Arrowhead, and therefore, are considered to be full-time equivalent as of January 1, 2012. Thus, the average number of full-time equivalent employees for 2012 is considered to be 6,259.
(4) Stock price at year-end divided by net income per share-diluted.
(5) Represents net income divided by total shareholders’ equity as of the beginning of the year.
All share and per-share information has been adjusted to give effect to the 2-for-1 common stock split which became effective November 29, 2005.
Weighted average number of shares outstanding-diluted has been adjusted to give effect for the two-class method of calculating earnings pershare as described in Note 1 to the Consolidated Financial Statements.
Inside Cover_Layout 1 3/20/14 2:59 PM Page 1

Can any wave be too big?
BROWN & BROWN, INC. Ten-Year Financial Summary
(in thousands, except per share data, percentages and other information)
Year Ended December 31
2013 2012 2011 2010 2009 2008 2007 2006 2005 2004
REVENUESCommissions and fees $ 1,355,503 $ 1,189,081 $ 1,005,962 $ 966,917 $ 964,863 $ 965,983 $ 914,650 $ 864,663 $ 775,543 $ 638,267Investment income 638 797 1,267 1,326 1,161 6,079 30,494(1) 11,479 6,578 2,715Other income, net 7,138 10,154 6,313 5,249 1,853 5,492 14,523 1,862 3,686 5,952
Total revenues 1,363,279 1,200,032 1,013,542 973,492 967,877 977,554 959,667 878,004 785,807 646,934
EXPENSESEmployee compensation and benefits 683,000 608,506 508,675 487,820 484,680 485,783 444,101 404,891 374,943 314,221Non-cash stock-based compensation 22,603 15,865 11,194 6,845 7,358 7,314 5,667 5,416 3,337 2,625Other operating expenses 195,677 174,389 144,079 135,851 143,389 137,352 131,371 126,492 105,622 84,927Amortization 67,932 63,573 54,755 51,442 49,857 46,631 40,436 36,498 33,245 22,146Depreciation 17,485 15,373 12,392 12,639 13,240 13,286 12,763 11,309 10,061 8,910Interest 16,440 16,097 14,132 14,471 14,599 14,690 13,802 13,357 14,469 7,156Change in estimated acquisition earn-out payables 2,533 1,418 (2,206) (1,674) –––– –––– –––– –––– –––– ––––
Total expenses 1,005,670 895,221 743,021 707,394 713,123 705,056 648,140 597,963 541,677 439,985Income before income taxes 357,609 304,811 270,521 266,098 254,754 272,498 311,527 280,041 244,130 206,949Income taxes 140,497 120,766 106,526 104,346 101,460 106,374 120,568 107,691 93,579 78,106
Net Income $ 217,112 $ 184,045 $ 163,995 $ 161,752 $ 153,294 $ 166,124 $ 190,959 $ 172,350 $ 150,551 $ 128,843
Employee compensation and benefits as % of total revenue 50.1% 50.7% 50.2% 50.1% 50.1% 49.7% 46.3% 46.1% 47.7% 48.6%Other operating expenses as % of total revenue 14.4% 14.5% 14.2% 14.0% 14.8% 14.1% 13.7% 14.4% 13.4% 13.1%
EARNINGS PER SHARE INFORMATIONNet income per share – diluted $ 1.48 $ 1.26 $ 1.13 $ 1.12 $ 1.08 $ 1.17 $ 1.35 $ 1.22 $ 1.08 $ 0.93Weighted average number of shares outstanding – diluted 142,624 142,010 140,264 139,318 137,507 136,884 136,357 135,886 135,033 133,994Dividends paid per share $ 0.3700 $ 0.3450 $ 0.3250 $ 0.3125 $ 0.3025 $ 0.2850 $ 0.2500 $ 0.2100 $ 0.1700 $ 0.1450
YEAR-END FINANCIALPOSITIONTotal assets $ 3,649,508 $ 3,128,058 $ 2,607,011 $ 2,400,814 $ 2,224,226 $ 2,119,580 $ 1,960,659 $ 1,807,952 $ 1,608,660 $ 1,249,517Long-term debt $ 380,000 $ 450,000 $ 250,033 $ 250,067 $ 250,209 $ 253,616 $ 227,707 $ 226,252 $ 214,179 $ 227,063Total shareholders’ equity $ 2,007,141 $ 1,807,333 $ 1,643,963 $ 1,506,344 $ 1,369,874 $ 1,241,741 $ 1,097,458 $ 929,345 $ 764,344 $ 624,325Total shares outstanding 145,419 143,878 143,352 142,795 142,076 141,544 140,673 140,016 139,383 138,318
OTHERINFORMATIONNumber of full-time equivalent employees at year-end 6,992 6,438 5,557 5,286 5,206 5,398 5,047 4,733 4,540 3,960Total revenues per average number of employees (2) $ 203,020 $ 191,729 (3) $ 186,949 $ 185,568 $ 182,549 $ 187,181 $ 196,251 $ 189,368 $ 184,896 $ 173,046Stock price at year-end $ 31.39 $ 25.46 $ 22.63 $ 23.94 $ 17.97 $ 20.90 $ 23.50 $ 28.21 $ 30.54 $ 21.78Stock price earnings multiple at year-end (4) 21.2 20.2 20.0 21.4 16.6 17.9 17.4 23.1 28.3 23.4Return on beginning shareholders’ equity (5) 12% 11% 11% 12% 12% 15% 21% 23% 24% 26%
(1) Includes an $18,664 gain on the sale of our investment in Rock-Tenn Company.
(2) Represents total revenues divided by the average of the number of full-time equivalent employees at the beginning of the year and the number of full-time equivalent employees at the end of the year.
(3) Of the 881 increase in the number of full-time equivalent employees from 2011 to 2012, 523 employees related to the January 9, 2012 acquisition of Arrowhead, and therefore, are considered to be full-time equivalent as of January 1, 2012. Thus, the average number of full-time equivalent employees for 2012 is considered to be 6,259.
(4) Stock price at year-end divided by net income per share-diluted.
(5) Represents net income divided by total shareholders’ equity as of the beginning of the year.
All share and per-share information has been adjusted to give effect to the 2-for-1 common stock split which became effective November 29, 2005.
Weighted average number of shares outstanding-diluted has been adjusted to give effect for the two-class method of calculating earnings pershare as described in Note 1 to the Consolidated Financial Statements.
BB_INSIDE_COVERS2_REV-FINAL_Layout 1 3/19/14 5:56 PM Page 1
Can any wave be too big?
BROWN & BROWN, INC. Ten-Year Financial Summary
(in thousands, except per share data, percentages and other information)
Year Ended December 31
2013 2012 2011 2010 2009 2008 2007 2006 2005 2004
REVENUES
Commissions and fees $ 1,355,503 $ 1,189,081 $ 1,005,962 $ 966,917 $ 964,863 $ 965,983 $ 914,650 $ 864,663 $ 775,543 $ 638,267
Investment income 638 797 1,267 1,326 1,161 6,079 30,494(1) 11,479 6,578
2,715
Other income, net 7,138 10,154 6,313 5,249 1,853 5,492 14,523 1,862 3,686
5,952
Total revenues 1,363,279 1,200,032 1,013,542 973,492 967,877 977,554 959,667 878,004 785,807 646,934
EXPENSES
Employee compensation and benefits 683,000 608,506 508,675 487,820 484,680 485,783 444,101 404,891 374,943 314,221
Non?cash stock?based compensation 22,603 15,865 11,194 6,845 7,358 7,314 5,667 5,416 3,337 2,625
Other operating expenses 195,677 174,389 144,079 135,851 143,389 137,352 131,371 126,492 105,622 84,927
Amortization 67,932 63,573 54,755 51,442 49,857 46,631 40,436 36,498 33,245 22,146
Depreciation 17,485 15,373 12,392 12,639 13,240 13,286 12,763 11,309 10,061 8,910
Interest 16,440 16,097 14,132 14,471 14,599 14,690 13,802 13,357 14,469
7,156
Change in estimated acquisition earn?out payables 2,533 1,418 (2,206) (1,674) ———— ———— ———— ———— ———— ————
Total expenses 1,005,670 895,221 743,021 707,394 713,123 705,056 648,140 597,963 541,677 439,985
Income before income taxes 357,609 304,811 270,521 266,098 254,754 272,498 311,527 280,041 244,130 206,949
Income taxes 140,497 120,766 106,526 104,346 101,460 106,374 120,568 107,691 93,579 78,106
Net Income $ 217,112 $ 184,045 $ 163,995 $ 161,752 $ 153,294 $ 166,124 $ 190,959 $ 172,350 $ 150,551 $ 128,843
Employee compensation and benefits as % of total revenue 50.1% 50.7% 50.2% 50.1% 50.1% 49.7% 46.3% 46.1% 47.7% 48.6%
Other operating expenses as % of total revenue 14.4% 14.5% 14.2% 14.0% 14.8% 14.1% 13.7% 14.4% 13.4% 13.1%
EARNINGS PER SHARE INFORMATION
Net income per share — diluted $ 1.48 $ 1.26 $ 1.13 $ 1.12 $ 1.08 $ 1.17 $ 1.35 $ 1.22 $ 1.08 $ 0.93
Weighted average number of shares outstanding — diluted 142,624 142,010 140,264 139,318 137,507 136,884 136,357 135,886 135,033 133,994
Dividends paid per share $ 0.3700 $ 0.3450 $ 0.3250 $ 0.3125 $ 0.3025 $ 0.2850 $ 0.2500 $ 0.2100 $ 0.1700 $ 0.1450
YEAR?END FINANCIAL?POSITION
Total assets $ 3,649,508 $ 3,128,058 $ 2,607,011 $2,400,814 $2,224,226 $2,119,580 $1,960,659 $1,807,952 $1,608,660 $1,249,517
Long?term debt $ 380,000 $ 450,000 $ 250,033 $ 250,067 $ 250,209 $ 253,616 $ 227,707 $ 226,252 $ 214,179 $
227,063
Total shareholders? equity $ 2,007,141 $ 1,807,333 $ 1,643,963 $1,506,344 $1,369,874 $1,241,741 $1,097,458 $ 929,345 $ 764,344 $ 624,325
Total shares outstanding 145,419 143,878 143,352 142,795 142,076 141,544 140,673 140,016 139,383 138,318
OTHER?INFORMATION
Number of full?time equivalent employees at year?end 6,992 6,438 5,557 5,286 5,206 5,398 5,047 4,733 4,540 3,960
Total revenues per average number of employees(2) $ 203,020 $ 191,729 (3) $ 186,949 $ 185,568 $ 182,549 $ 187,181 $ 196,251 $ 189,368 $ 184,896 $ 173,046
Stock price at year?end $ 31.39 $ 25.46 $ 22.63 $ 23.94 $ 17.97 $ 20.90 $ 23.50 $ 28.21 $ 30.54 $ 21.78
Stock price earnings multiple at year?end(4) 21.2 20.2 20.0 21.4 16.6 17.9 17.4 23.1 28.3 23.4
Return on beginning shareholders? equity(5) 12% 11% 11% 12% 12% 15% 21% 23% 24% 26%
(1) Includes an $18,664 gain on the sale of our investment in Rock-Tenn Company.
(2) Represents total revenues divided by the average of the number of full-time equivalent employees at the beginning of the year and the number of full-time equivalent employees at the end of the year.
(3) Of the 881 increase in the number of full-time equivalent employees from 2011 to 2012, 523 employees related to the January 9, 2012 acquisition of Arrowhead, and therefore, are considered to be full-time equivalent as of January 1, 2012. Thus, the average number of full-time equivalent employees for 2012 is considered to be 6,259.
(4) Stock price at year-end divided by net income per share-diluted.
(5) Represents net income divided by total shareholders’ equity as of the beginning of the year.
All share and per-share information has been adjusted to give effect to the 2-for-1 common stock split which became effective November 29, 2005.
Weighted average number of shares outstanding-diluted has been adjusted to give effect for the two-class method of calculating earnings pershare as described in Note 1 to the Consolidated Financial Statements.
Inside Cover_Layout 1 3/20/14 2:59 PM Page 1

Corporate Offices220 South Ridgewood AvenueDaytona Beach, Florida 32114(386) 252-9601
655 North Franklin StreetSuite 1900Tampa, Florida 33602(813) 222-4100
Outside CounselHolland & Knight LLP100 North Tampa StreetSuite 4100Tampa, Florida 33602
Corporate Information and Shareholder ServicesThe Company has included, as Exhibits 31.1 and 31.2,and 32.1 and 32.2 to its Annual Report on Form 10-K forthe fiscal year 2013 filed with the Securities andExchange Commission, certificates of the ChiefExecutive Officer and Chief Financial Officer of theCompany certifying the quality of the Company’spublic disclosure. The Company has also submitted tothe New York Stock Exchange a certificate from itsChief Executive Officer certifying that he is not awareof any violation by the Company of New York StockExchange corporate governance listing standards.
A copy of the Company’s 2013 Annual Report on Form 10-K will be furnished without charge to anyshareholder who directs a request in writing to:
Corporate SecretaryBrown & Brown, Inc.655 North Franklin StreetSuite 1900Tampa, Florida 33602
A reasonable charge will be made for copies of theexhibits to the Form 10-K.
Annual MeetingThe Annual Meeting of Shareholders of Brown & Brown, Inc. will be held:
May 7, 20149:00 a.m. (EDT)The Shores Resort2637 South Atlantic AvenueDaytona Beach, Florida 32118
Transfer Agent and RegistrarAmerican Stock Transfer & Trust Company6201 15th AvenueBrooklyn, New York 11219(800) 937-5449email: [email protected]
Independent Registered Public Accounting FirmDeloitte & Touche LLPOne Independent DriveSuite 2801Jacksonville, Florida 32202
Stock ListingThe New York Stock Exchange Symbol: BRO
Approximate number of shareholders of record as ofFebruary 19, 2014, was 1,204. Closing price per shareon that date was $29.78.
Additional InformationInformation concerning the services of Brown & Brown, Inc., as well as access to currentfinancial releases, is available on the Internet. Brown & Brown’s address is www.bbinsurance.com.
Stock Price Range CashDividends per
High Low Common Share
2013
1st Quarter $ 32.08 $ 25.31 $ 0.09
2nd Quarter $ 33.24 $ 30.00 $ 0.09
3rd Quarter $ 35.13 $ 30.55 $ 0.09
4th Quarter $ 33.69 $ 27.76 $ 0.10
2012
1st Quarter $ 25.00 $ 21.85 $ 0.085
2nd Quarter $ 27.32 $ 23.42 $ 0.085
3rd Quarter $ 28.17 $ 24.71 $ 0.085
4th Quarter $ 27.31 $ 24.88 $ 0.09
Market Price of Common Stock
BROWN & BROWN, INC.
Shareholder Information
BRO
WN
& BR
OW
N, IN
C.
2013 A
NN
UA
L REPORT
BB_OUTSIDE_COVERS2_Layout 1 3/20/14 11:33 AM Page 1


