2013 Vanderbilt MBA Employment Report
6
employment report 2013 Vanderbilt MBA
-
Upload
vanderbilt-owen-graduate-school-of-management -
Category
Documents
-
view
218 -
download
2
description
2013 Vanderbilt MBA Employment Report
Transcript of 2013 Vanderbilt MBA Employment Report

employmentreport
2013
Vanderbilt MBA

To Friends and Associates of Owen,
We are pleased to present the Vanderbilt MBA Employment Report for the Classes of 2013 and 2014. For the fourth consecutive year, we experienced gains in the key performance metrics we use to gauge success. I am delighted to report that the important measurements of offers, acceptances and salaries, now stand at all-time highs. The percentage of students with at least one offer 90 days after graduation advanced significantly to 96 percent, while accepted
offers surged a full five points to 93 percent, setting new records for the program. Median salary for the Class of 2013 registered a sharp increase from $92,000 to $100,000.
Our Strategic Plan imperatives are being met and exceeded. • OurCareerManagementCenterisdeliveringrobust,constantlyevolving
programming that results in better-prepared job seekers. We are moving the needle by ensuring that our students receive highly individualized attention from a committed, veteran staff; the personal coaching our students receive is complemented by more than 60 workshops on timely job search tactics.
• WeareseeingasteadyincreaseinthenumberoffirmsdesignatingVanderbilt as a core school for MBA recruiting. This is a result of a vigorous employer relations effort that stresses on-campus recruiting by premier employers that have structured full-time track internships—companies capable of making multiple offers to our talented students.
Case in point: On-campus recruiting is up 15 percent since the 2010-2011 academic year and the number of companies making multiple offers has grown significantly. Most notable is the rapid rise of Amazon to its position as the most active employer with 13 accepted internship and full-time offers last year. Other firms with multiple accepted offers include Deloitte (8), ExxonMobil (8), DaVita (8), Mattel (8), Nissan North America (6), The North Highland Company (6), Capgemini (5) and Goldman, Sachs & Company (5).
As I enter my fourth year at Owen, I do so more convinced than ever that the Vanderbilt MBA Program is on a path to preeminence. Highly talented students, a team of career coaches and support staff who are committed to excellence, and premier employers that recognize the value of our programs and our students, all bode well for the future. Our Career Management Center team is steadfast in its determination to play a pivotal role in the sustained drive to first-tier recognition. The results reflected in this report give us confidence that this is indeed a very special place.
Sincerely,
Read D. McNamara, Managing DirectorCareer Management Center and Corporate AffairsVanderbilt UniversityOwen Graduate School of Management
This report conforms to the MBA Career Services Council Standards for reporting MBA employment statistics.
1
RecruitAtOwen.comVisit our website for useful recruiting tools•ViewandorderMBAResumeBooks•PostMBAinternorfull-timepositions•Postexecutivejobs(afreeservice)

Class of 2014 Profile Number PercentTotal Number of Students 176 100%Number of Students Not Seeking an Internship 13 7%Number of Students Seeking an Internship 163 93%Number of Students Accepting an Internship 163 100%
Class of 2014 Internship Statistics
“We find that Owen students have a ‘roll up your sleeves’ attitude and the discipline to tackle today’s tough business challenges. It’s the school that we look forward to visiting the most. The students, faculty and staff are the strongest resources we have for recruiting top MBA talent.”
— Shawn Henderson Sr. Specialist, College Relations, Cardinal Health
Internship Salary DataMean Monthly Salary $5,962Median Monthly Salary $6,000Monthly Salary Range $1,700-$11,250
Monthly Monthly Monthly Salary Job Function Percent Mean Salary Median Salary Low HighConsulting 4% $9,000 $11,250 $4,000 $11,250Finance/Accounting 33% $5,995 $6,423 $1,750 $8,333General Management 15% $5,571 $6,520 $2,340 $7,500Human Resources 10% $6,218 $6,300 $4,800 $7,692Management Information Systems 1% Insufficient data Marketing 26% $4,975 $5,573 $1,700 $7,000Operations 9% $6,840 $8,000 $2,400 $8,600Other 3% $4,500 $4,500 $5,000 $4,000
Industry Consulting 6% $7,688 $8,125 $3,000 $11,250Consumer Products 18% $5,547 $5,880 $3,173 $8,000Financial Services 19% $6,132 $7,050 $1,750 $8,333Government 1% Insufficient data Health Care Services / Providers 16% $5,585 $6,520 $1,700 $6,800Manufacturing 5% $3,417 $4,000 $1,750 $4,500Media/Entertainment/Hospitality 1% Insufficient data Non-Profit 2% Insufficient data Other 6% $5,460 $5,000 $4,000 $7,500Petroluem/Energy 6% $6,283 $7,250 $2,800 $7,800Pharma/Biotech/Health Care Devices 4% $6,084 $6,160 $5,416 $6,600Real Estate 2% Insufficient data Technology 13% $6,398 $6,050 $3,000 $8,600
Geographic RegionInternational 1% Insufficient data Mid-Atlantic 4% $7,058 $7,792 $4,500 $8,000Midwest 13% $6,404 $6,150 $3,000 $11,250Northeast 16% $6,425 $6,400 $1,750 $8,333South 42% $5,493 $5,000 $1,750 $11,250Southwest 9% $6,715 $6,800 $3,640 $8,333West 15% $5,749 $6,000 $1,700 $8,000U.S. Possessions na na na na na
Nashville Metro 26% $4,459 $4,000 $2,400 $5,000
Internships That Were Paid 90%Percent of Seeking Students with an Internship 100%
2
Source of InternshipsSchool-Facilitated Activities PercentScheduled Interviews on Campus 33%Resume Drop/Job Posting 23%Owen Interview Event such as Day in the Bay, South X Southeast, New York Interview Day 7%Alumni Referral 6%Job Fair such as NBMBA or NSHMBA 6%Faculty Referral 2%Total 77%
Student-Facilitated Activities PercentPersonal Network - Family and Friends 9%Internet Job Posting 2%Previous Employer 1%Other Student-Initiated Activities 4%Total 16%
No Information 7%Total 100%
Top Hiring CompaniesAmazon 7Nissan North America 6Deloitte Consulting 5McKesson 5Mattel 5Mars Petcare 4
Top Metro AreasNashville 42New York 14Atlanta 13San Francisco 11Houston 9Los Angeles 8
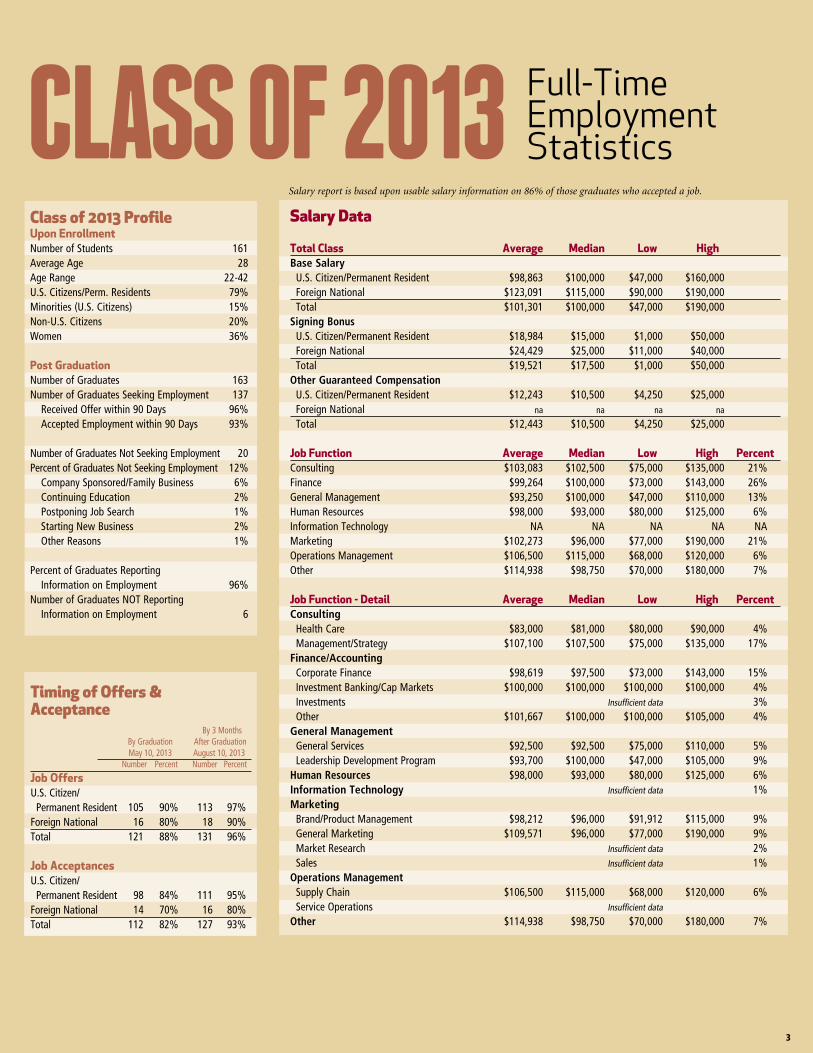
Salary Data
Total Class Average Median Low HighBase Salary U.S. Citizen/Permanent Resident $98,863 $100,000 $47,000 $160,000 Foreign National $123,091 $115,000 $90,000 $190,000 Total $101,301 $100,000 $47,000 $190,000Signing Bonus U.S. Citizen/Permanent Resident $18,984 $15,000 $1,000 $50,000 Foreign National $24,429 $25,000 $11,000 $40,000 Total $19,521 $17,500 $1,000 $50,000Other Guaranteed Compensation U.S. Citizen/Permanent Resident $12,243 $10,500 $4,250 $25,000 Foreign National na na na na
Total $12,443 $10,500 $4,250 $25,000
Job Function Average Median Low High PercentConsulting $103,083 $102,500 $75,000 $135,000 21%Finance $99,264 $100,000 $73,000 $143,000 26%General Management $93,250 $100,000 $47,000 $110,000 13%Human Resources $98,000 $93,000 $80,000 $125,000 6%Information Technology NA NA NA NA NAMarketing $102,273 $96,000 $77,000 $190,000 21%Operations Management $106,500 $115,000 $68,000 $120,000 6%Other $114,938 $98,750 $70,000 $180,000 7%
Job Function - Detail Average Median Low High PercentConsulting Health Care $83,000 $81,000 $80,000 $90,000 4% Management/Strategy $107,100 $107,500 $75,000 $135,000 17%Finance/Accounting Corporate Finance $98,619 $97,500 $73,000 $143,000 15% Investment Banking/Cap Markets $100,000 $100,000 $100,000 $100,000 4% Investments Insufficient data 3% Other $101,667 $100,000 $100,000 $105,000 4%General Management General Services $92,500 $92,500 $75,000 $110,000 5% Leadership Development Program $93,700 $100,000 $47,000 $105,000 9%Human Resources $98,000 $93,000 $80,000 $125,000 6%Information Technology Insufficient data 1%Marketing Brand/Product Management $98,212 $96,000 $91,912 $115,000 9% General Marketing $109,571 $96,000 $77,000 $190,000 9% Market Research Insufficient data 2% Sales Insufficient data 1% Operations Management Supply Chain $106,500 $115,000 $68,000 $120,000 6% Service Operations Insufficient data Other $114,938 $98,750 $70,000 $180,000 7%
3
Timing of Offers &Acceptance By 3 Months By Graduation After Graduation May 10, 2013 August 10, 2013 Number Percent Number Percent
Job OffersU.S. Citizen/ Permanent Resident 105 90% 113 97%Foreign National 16 80% 18 90%Total 121 88% 131 96%
Job AcceptancesU.S. Citizen/ Permanent Resident 98 84% 111 95%Foreign National 14 70% 16 80%Total 112 82% 127 93%
Salary report is based upon usable salary information on 86% of those graduates who accepted a job.
Class of 2013 ProfileUpon EnrollmentNumber of Students 161Average Age 28Age Range 22-42U.S. Citizens/Perm. Residents 79%Minorities (U.S. Citizens) 15%Non-U.S. Citizens 20%Women 36%
Post GraduationNumber of Graduates 163Number of Graduates Seeking Employment 137 Received Offer within 90 Days 96% Accepted Employment within 90 Days 93%
Number of Graduates Not Seeking Employment 20Percent of Graduates Not Seeking Employment 12% Company Sponsored/Family Business 6% Continuing Education 2% Postponing Job Search 1% Starting New Business 2% Other Reasons 1%
Percent of Graduates Reporting Information on Employment 96%Number of Graduates NOT Reporting Information on Employment 6
Class of 2013Full-Time Employment Statistics

Northeast 11%
Mid-Atlantic 6%
South 35%
Southwest 16%
Geographic Placement
World RegionNorth America 96%
Asia 4%
Source of Accepted OfferSchool-Facilitated Activities Scheduled Interviews On-campus 20% Internship - Originally Through School-Facilitated Activity 17%Job Posting/Resume Drop 12%Alumni Referral 6%Job Fair such as NBMBA, NSHMBA 6%Other School-Related Recruiting Activity 7%Faculty Referral 3%Resume Book Referral 1%Total 70%
Graduate Facilitated ActivitiesPersonal Network - Family and Friends 6%Internet Job Posting 4%Other Student-Initiated Activities 2%Graduate - Facilitated Internship at Company 6%Previous Employer 3%Third Party Sources/Executive Recruiters 2%Total 24%
No Information Reported 6%Total 100%
Top Hiring Companies
4
Class of 2013 Employment by Job Function
Finance 26%Consulting 21%Marketing 21%General Management 13%Other 7%Operations Management 6%Human Resources 6%
Class of 2013 Employment by Industry
Consulting 21%Technology 17%Financial Services 14% Consumer Products 14%Health Care Services/Providers 9%Petroleum/Energy 8%Other 8%Pharma/Biotech/Health Care 5%Media/Entertainment/Lodging 2%Real Estate 2%Manufacturing 1%
Midwest 5%
West 23%
North America
Salary Data
Industry Average Median Low High PercentConsulting $104,160 $105,000 $75,000 $135,000 21%Consumer Products $96,647 $95,000 $77,000 $143,000 14%Financial Services $98,667 $100,000 $90,000 $100,000 14%Government na na na na na
Health Care Services/Providers $92,400 $102,500 $47,000 $105,000 9%Manufacturing Insufficient data 1%Media/Entertainment/Lodging Insufficient data 2%Non-Profit na na na na na
Petroleum/Energy $99,504 $110,000 $70,000 $115,000 8%Pharma/Biotech/Health Care Devices $107,517 $98,300 $68,000 $190,000 5%Real Estate Insufficient data 2%Technology $99,425 $95,500 $68,000 $120,000 17%Other $118,625 $96,000 $75,000 $190,000 8%
North American Geographic Region Average Median Low High PercentMid-Atlantic (PA, MD, VA, WV, DE, DC) $89,571 $82,000 $75,000 $115,000 6%Midwest (WI, MO, KS, IA, MN, NE, MI, OH, IN, ND, SD, IL) $99,833 $97,500 $75,000 $135,000 5%Northeast (ME, VT, NY, NH, CT, MA, NJ, RI) $111,821 $100,000 $80,000 $180,000 11%South (NC, SC, KY, TN, GA, FL, AL, AR) $89,927 $90,000 $47,000 $135,000 35%Southwest (CO, AZ, TX, OK, NM) $102,250 $98,000 $82,500 $125,000 16%West (CA, HI, WA, OR, AK, MT, ID, UT, NV, WY) $108,150 $108,500 $77,000 $140,000 23% Nashville Metro $87,180 $83,500 $68,000 $115,000 20%
Undergraduate Major Average Median Low High PercentBusiness $100,855 $98,000 $75,000 $190,000 45%Technical $107,000 $115,000 $75,000 $135,000 13%Other $100,161 $100,000 $47,000 $180,000 42%
Professional Experience Average Median Low High PercentOne Year or Less $97,541 $93,456 $78,000 $135,000 10%More than one year, up to three years $96,000 $95,000 $73,000 $140,000 24%More than three years, up to five years $105,959 $100,000 $68,000 $180,000 43%More than five years $100,792 $100,000 $47,000 $190,000 23%
Top Metros #Nashville 26
New York 13
San Francisco 10
Dallas/Ft. Worth 9
Seattle 7
Houston 6
Washington, DC 6
Amazon 6The North Highland Company 6Capgemini Consulting 5DaVita 5ExxonMobil 5American Airlines 4
Employers Hiring Members of the Classes of 2013 and 201421st Century Oncology3MA.O. SmithAdobe SystemsAllConnectAllianz Real Estate of AmericaAlvarez & MarsalAmazonAmerican AirlinesAmerican ExpressAmgenAmplionAmyrisAppleArryve ConsultingASCAPAscension HealthAsurionAT&TAvondale PartnersBain & CompanyBank of America Merrill LynchBeyond YogaBoyle Investment CompanyBrown-FormanCampbell Soup CompanyCapgemini ConsultingCaption CallCardinal HealthCarMaxChevronCIGNACiscoCitigroupCogent HMGCognizantConocoPhillipsContigo FinancialCovenant Capital Group
Covenant Capital ManagementCracker Barrel (CBRL Group)Credit SuisseDaewooDairy Farmers of AmericaDannonDarden RestaurantsDaVitaDell Deloitte ConsultingDelta Air LinesDr.Pepper Snapple GroupDSI RenalE&J Gallo WineryEastman Chemical CompanyECG Management ConsultantsElectronic Funds SourceEMMAEmdeonEnvironmental Defense FundExxonMobilFedExFEV ConsultingFreepoint CommoditiesFTI ConsultingGE (General Electric)GE CapitalGeneral MillsGoldman, Sachs & ComapnyH.J. Heinz HasbroHCAHealthwaysHewlett-Packard (HP)Hilton WorldwideHoneywellHospice CompassusHumanaHuron Consulting Group
IBMInsight GeneticsIntelInVivoLinkIvantage HealthJefferies & CompanyJohnson & JohnsonJP MorganJP Morgan ChaseKaufman HallKimberly-ClarkLiberty Mutual GroupLowe’s CompaniesMars PetcareMattelMcKessonMcKinsey & CompanyMcLemoreMcMaster Carr SupplyMedtronicMicrosoftMid-Con Energy PartnersMillerCoorsMitsuiNASDAQNashville Capital NetworkNestle USANissan North AmericaNovartisOchsner Health SystemProcter & GambleRandall-Reilly PublishingRegionalCare HospitalRegions BankRJ Reynolds TobaccoRoth StaffingSam’s ClubSamsung Telecommunications
America
SC JohnsonSEC (Securities & Exchange
Commission)Shell OilSilicon RanchSimpson, Thacher & BartlettSony/ATV Music PublishingSouthern CompanySprint NextelStone Creek Private Wealth
AdvisorsSunTrust BankTennessee Consolidated
Retirement System (TCRS)Tennessee Valley AuthorityTexas Children’s HospitalThe Gallup OrganizationThe Hershey CompanyThe Home DepotThe Methodist HospitalThe North Highland CompanyThe Sustainability GroupUBS Investment BankVanderbilt Children’s HospitalVanderbilt Owen Graduate
School of ManagementVanderbilt University Medical
CenterVelocityHealth SecuritiesVerizonVital CheckWalmartWealth AccessWellNow Urgent CareWells FargoWestern & Southern Financial
Group
RecruitAtOwen.com
©2013 Vanderbilt and the Vanderbilt logo are registered trademarks and service marks of Vanderbilt University. REV. 10/13Vanderbilt University is committed to principles of equal opportunity and affirmative action. Visit owen.vanderbilt.edu for Vanderbilt University’s complete EEO and affirmative action statement.
Career Management CenterVanderbilt University | Owen Graduate School of Management
401 21st Avenue South | Nashville, TN 37203-2422Hours: 8:00 AM to 5:00 PM CT
Telephone: 615.322.4069 | Fax: 615.343.4661 Email: [email protected]