2013 Tri-J Homeless Census Report - Final
47
-
Upload
thomaswheatley -
Category
Documents
-
view
9.566 -
download
0
description
Atlanta, DeKalb County, and Fulton County homeless census found 6,664 men, women, and children living on streets, in shelters, and in supportive housing
Transcript of 2013 Tri-J Homeless Census Report - Final

Acknowledgements
The Metro Atlanta Tri-Jurisdictional Collaborative (Tri-J) on Homelessness (City of Atlanta,
Fulton County and DeKalb County) and Pathways Community Network Institute acknowledge the
time and effort of the numerous individuals and organizations that assisted in the successful 2013
Tri-J homeless census. First and foremost, we want to thank the funders of this project – City of
Atlanta, Fulton County, and DeKalb County. In addition, we wish to recognize the Pathways
research team, led by Josie Parker, Ph.D., in coordinating the planning, data collection, data
analysis and report writing for the 2013 Tri-J homeless count. We express appreciation to members
of the Tri-J executive community and Tri-J homeless census working group for their guidance
regarding methodology and implementation. We extend our gratitude to the deployment captains
who made the count successful through their hard work and dedication. We also are grateful to the
host sites for providing a safe place to deploy enumeration teams.
The 2013 Tri-J homeless census was successful because over 400 volunteers joined forces to count
the homeless persons in our community. Although it is not possible to list each by name, the Tri-
J and Pathways wish to express our gratitude to each of you who contributed your time and effort.
We recognize the efforts of the special coverage enumeration teams, including the U.S.
Department of Veterans Affairs (VA) - Health Care for Homeless Veterans Program, the St.
Joseph’s Mercy Care Services – Community Homeless Outreach Program (CHOP), the DeKalb
County Community Development Department – homeless outreach team, and the Latin American
Association, whose knowledge of the homeless population and geographic areas were instrumental
in the data collection process. We also appreciate the local police departments - Atlanta
Community Liaison Unit, Atlanta Homeless Outreach Prevention Emergency Services (HOPE)
team, Hartsfield-Jackson Atlanta International Airport Police Section’s Crisis Intervention Team
(CIT), DeKalb County Precincts, City of Dunwoody, and City of Alpharetta - for providing
additional support to the enumeration teams on count night.
Finally, we acknowledge the Atlanta Regional Commission Geographic Information Systems
Department (GIS) and David Giguere for the customized, user-friendly maps. We give special
thanks to Aero Surveys of Georgia, Inc. for allowing us to use their detailed street information for
the census maps. We are grateful to Druid Hills United Methodist Church for allowing the
deployment captains to meet at the church on a regular basis and to Cliff Richards of Decatur
Cooperative Ministries for arranging the meeting site at the church. Together we are collecting the
data necessary to track our progress in the fight against homelessness.

Table of Contents
Executive Summary i
Section 1: Introduction 1
Section 2: Project Purpose, Coordination and Oversight 2
2.1 Project Purpose 2
2.2 Project Coordination 2
2.3 Project Oversight 2
Section 3: Methodology 3
3.1 Background 3
3.2 Date and Time 3
3.3 Operational Definition and Components 4
3.4 Unsheltered Count Method 5
3.5 Sheltered Count Method 10
Section 4: Results 13
4.1 2013 Tri-J Homeless Census 13
4.2 Unsheltered Count 15
4.3 Sheltered Count (Emergency Shelters and Transitional Housing) 17
4.4 Permanent Supportive Housing Count 19
Section 5: Atlanta, DeKalb County and Fulton County 22
5.1 City of Atlanta Homeless Numbers 23
5.2 DeKalb County Homeless Numbers 25
5.3 Fulton County Homeless Numbers 28
Section 6: Trend Analysis 31
Section 7: Annualized Projection 36
Section 8: Conclusion 37
Section 9: References 38
Special Thanks 39


i
Executive Summary
On the night of January 28, 2013, the Metro Atlanta Tri-Jurisdictional (Tri-J) Collaborative (City
of Atlanta, Fulton County and DeKalb County) on Homelessness and Pathways Community
Network Institute, along with over 400 community volunteers, conducted the sixth point-in-time
count of homeless persons in our community. The homeless census consisted of two types of
enumerations, an unsheltered count and a sheltered count, which together result in a
comprehensive picture of homelessness in the Tri-J. Overall, a total of 6,664 homeless people
were counted in the Tri-J area on count night.
Five times as many individuals as family members were counted on census night. Of the total
number of homeless people counted, unaccompanied adults staying in emergency shelters
comprised the largest group (33 percent) with unaccompanied adults sleeping in unsheltered
locations second (30 percent). The largest number (39 percent) of individuals was staying in
emergency shelters with the majority (50 percent) of family members also found in emergency
shelters.
2013 Tri-J Homeless Census by Sleeping Location and Household Type
The bed capacity on count night was three times greater for emergency shelters than transitional
housing programs. Overall, the occupancy rate for emergency shelter beds was higher (92
percent) than the occupancy rate for transitional housing beds (83 percent). This means that on
the night of the count 253 emergency beds were available (114 individual and 139 family beds).
Additionally, there were 383 transitional housing beds available (245 individual and 132 family
beds). If all available beds were occupied for the census, there would still be 1,669 people
sleeping outside on the night of the count.
Sheltered Occupancy and Capacity
Individuals Family Members
Sheltered
Count
Emergency
Shelters
Transitional
Housing Total
Emergency
Shelters
Transitional
Housing Total
Occupancy 2,188 1,348 3,536 548 503 1,051
Capacity 2,302 1,593 3,895 687 635 1,322
Occupancy
Percent 95% 85% 91% 80% 79% 80%
Sleeping Location Individuals Family Members
(Number of Families)
Total Number of Homeless
People (Percent)
Emergency Shelters 2,188 548 (176 Families) 2,736 (41%)
Unsheltered 2,028 49 (15 Families) 2,077 (31%)
Transitional Housing 1,348 503 (166 Families) 1,851 (28%)
Totals 5,564 1,100 (357 Families) 6,664
Percent 83% 17%
ii
2013 Tri-J Homeless Census Executive Summary
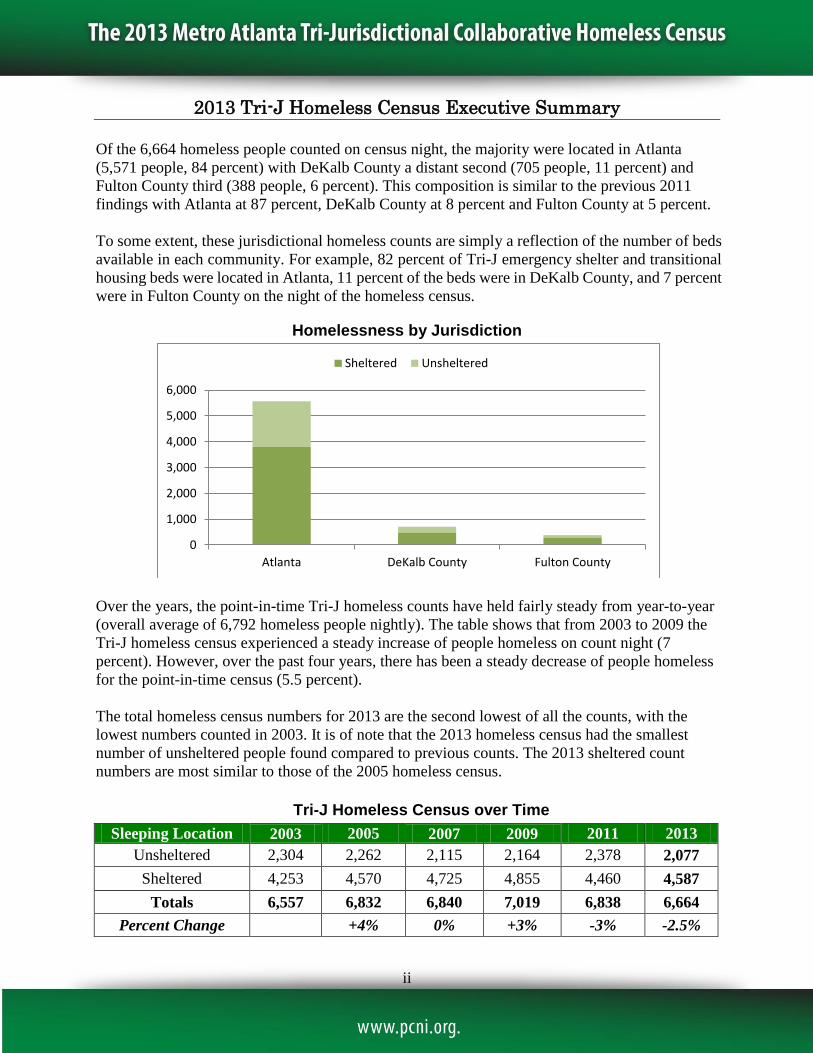
Of the 6,664 homeless people counted on census night, the majority were located in Atlanta
(5,571 people, 84 percent) with DeKalb County a distant second (705 people, 11 percent) and
Fulton County third (388 people, 6 percent). This composition is similar to the previous 2011
findings with Atlanta at 87 percent, DeKalb County at 8 percent and Fulton County at 5 percent.
To some extent, these jurisdictional homeless counts are simply a reflection of the number of beds
available in each community. For example, 82 percent of Tri-J emergency shelter and transitional
housing beds were located in Atlanta, 11 percent of the beds were in DeKalb County, and 7 percent
were in Fulton County on the night of the homeless census.
Homelessness by Jurisdiction
Over the years, the point-in-time Tri-J homeless counts have held fairly steady from year-to-year
(overall average of 6,792 homeless people nightly). The table shows that from 2003 to 2009 the
Tri-J homeless census experienced a steady increase of people homeless on count night (7
percent). However, over the past four years, there has been a steady decrease of people homeless
for the point-in-time census (5.5 percent).
The total homeless census numbers for 2013 are the second lowest of all the counts, with the
lowest numbers counted in 2003. It is of note that the 2013 homeless census had the smallest
number of unsheltered people found compared to previous counts. The 2013 sheltered count
numbers are most similar to those of the 2005 homeless census.
Tri-J Homeless Census over Time
0
1,000
2,000
3,000
4,000
5,000
6,000
Atlanta DeKalb County Fulton County
Sheltered Unsheltered
Sleeping Location 2003 2005 2007 2009 2011 2013
Unsheltered 2,304 2,262 2,115 2,164 2,378 2,077
Sheltered 4,253 4,570 4,725 4,855 4,460 4,587
Totals 6,557 6,832 6,840 7,019 6,838 6,664
Percent Change +4% 0% +3% -3% -2.5%

1
Section 1: Introduction
This is the sixth census for the Metro Atlanta Tri-Jurisdictional (Tri-J) Collaborative on
Homelessness. The Tri-J is a working partnership of government representatives, community
members and service providers within the City of Atlanta, Fulton County and DeKalb County.
The partnership works collaboratively to address issues of homelessness through planning, policy
development, service delivery and resource allocation.
In 2002, the Tri-J decided that collecting objective and accurate data on the number of homeless
persons residing in the community was a top priority. The homeless census was to identify the
number of homeless persons in each local community on the basis of sleeping location and basic
demographic characteristics: male vs. female, adult vs. youth, and family vs. individual.
Pathways Community Network Institute was asked to undertake the point-in-time homeless count
on behalf of the Tri-J. While the 2003 Tri-J homeless census was in its early planning stages, the
U. S. Congress passed legislation requiring state and local governments that receive funding
under the McKinney-Vento Homeless Assistance Act (now the Homeless Emergency Assistance
and Rapid Transition to Housing [HEARTH] Act of 2009) to conduct point-in-time homeless
counts at least once every two years beginning no later than 2004.
In March 2003, the Tri-J and Pathways conducted the first successful homeless census. The
census was designed as a full coverage count to assess the number of homeless people sleeping in
unsheltered locations, emergency shelters and transitional housing programs throughout the Tri-J.
Because the homeless census covered the City of Atlanta and its two counties, the Tri-J relied on
the efforts of hundreds of people from service providers, government agencies, faith-based
providers, local universities and community volunteers to conduct the count. The U.S.
Department of Housing and Urban Development (HUD) recognized the 2003 Tri-J homeless
census as a national “best practice.”
The 2005, 2007, 2009, 2011, and 2013 Tri-J homeless census followed the successful
methodology used in the 2003 count. Improvements were made to the model for each successive
count based upon feedback from Pathways research team, Tri-J working group (Atlanta, Fulton
County and DeKalb County), deployment captains, community volunteers and community needs.
Each count was followed by an in-depth survey which gathered data on demographics, homeless
history, disabling conditions and two additional topics related to community concerns regarding
the local homeless population.
The planning of the 2013 Tri-J homeless census began in October 2012 with the actual
enumeration occurring on the night of Tuesday, January 28, 2013. This report describes the
purpose, methodology and results of the count effort.
2
Section 2: Project Purpose, Coordination and Oversight
2.1 Project Purpose
With the initiation of the first homeless census, several important goals were identified:
Provide the number and characteristics of people sleeping in transitional programs,
shelters and places not meant for human habitation;
Provide the local community with data to use in planning, funding, and implementing
services that meets the needs of homeless persons;
Provide a measurement of the changes in the homeless population over time;
Provide a report that increases awareness of the local homeless issue; and
Provide data to use in updating the Tri-J’s Housing Inventory for the annual HUD
Notification of Funding Availability (NOFA) Exhibit 1 report.
2.2 Project Coordination
To meet these objectives and have a successful homeless count, the Tri-J asked Pathways Community
Network Institute to undertake the homeless census. Pathways is a nonprofit organization that
supports communities with tools – information systems, research and data analysis, and technical
assistance and training - to help human service providers work together, reduce costs and increase
impact. Since 2003, Pathways has been asked by the Tri-J to manage the homeless point-in-time
counts. Pathways has coordinated, staffed, written the reports and presented the findings for the Tri-J
homeless census. Beginning in 2007, the Pathways research and data analysis team has also provided
expertise in the areas of methodology, data collection, and data analysis. The research team consisted
of the research manager and one research assistant.
2.3 Project Oversight
As with the previous Tri-J homeless census, oversight was provided by a working group (WG) of
leaders in the Tri-J government agencies and university professors. The functions of the WG
included assisting the Pathways research team with refining the count methodology and
instruments, logistical planning and providing input regarding compliance with HUD regulations.
With few exceptions, the working group met on a monthly basis.
3
Section 3: Methodology 3.1 Background
Research Atlanta (1984) provided the earliest estimates of the number of people homeless in
metropolitan Atlanta based on comparative studies from other U.S. cities and interviews with
local homeless service providers. They estimated that around 3,000 people would be homeless
on any given night in 1984. A decade later, a point-in-time estimate was again calculated for the
number of people homeless in metropolitan Atlanta. Georgia State University researchers
estimated that around 11,000 people were homeless on an average night in 1997 within the ten
county Atlanta Regional Commission (ARC) area (Jaret and Adelman 1997). The 1997 estimate
was calculated from the results of a national study with adjustments made for the City of Atlanta
population and its neighboring suburban counties.
In 2002, the Tri-J decided that an actual systematic and comprehensive count of homeless people
needed to occur for the City of Atlanta, Fulton County and DeKalb County. This decision
coincided with the requirement of state and local governments that receive federal funding under
the McKinney-Vento Homeless Assistance Act (now the Homeless Emergency Assistance and
Rapid Transition to Housing [HEARTH] Act of 2009) to conduct point-in-time homeless counts
at least once every two years beginning no later than 2004. The first actual homeless count
conducted by the Tri-J was in 2003. The 2003 Tri-J homeless census established the baseline
data with subsequent counts providing useful tracking for the changes in the homeless population
over time.
3.2 Date and Time
HUD also mandated the time of year for the homeless census. HUD chose for Continuum of Care
(CoC) communities such as the Tri-J to conduct their homeless census during the last ten days in
January. One reason for that timeframe is that homeless people are more likely to sleep indoors at
shelters and in transitional housing during cold weather months thus making it easier to locate
people who might otherwise be outdoors at other times of the year. In addition, cold weather and
overflow shelters open for only a few months each year during the winter. Also, by using the
mandated time frame set by HUD, the Tri-J homeless numbers are comparable to other CoC
homeless populations across the U.S.
For the 2013 Tri-J homeless census, the working group selected Tuesday, January 28th as the
count date, with a bad weather back-up date of Thursday, January 31st. The working group chose
both homeless count dates to be mid-week to represent a typical weekday morning and to avoid
the higher number of non-homeless persons on the streets during weekends. In addition, several
large shelters in the City of Atlanta discharge residents in the early morning hours (5:00 a.m. to
6:00 a.m.). To avoid double counting people as sheltered and unsheltered, the working group
decided to begin enumeration around 1 a.m. prior to the shelter early morning release times.

4
3.3 Operational Definition and Components In order to calculate the size of the homeless population in our community, a definition of
homelessness is necessary. The U.S. Census that occurs every decade counts people on the basis
of their customary place of residence. However, since homeless people do not have permanent
residence, they are instead enumerated based on their temporary sleeping locations such as on
the street, in shelters or in transitional housing programs.
The Tri-J homeless count methodology has two components based on sleeping location:
unsheltered count and sheltered count. These two counts follow the HUD guides for counting
homeless people in a CoC (HUD’s Homeless Assistance Programs: A Guide to Counting
Unsheltered Homeless People 2008 and A Guide to Counting Sheltered Homeless People 2012).
Together, the two enumerations create a comprehensive picture of homelessness in the City of
Atlanta, Fulton County and DeKalb County. For the purpose of this study, the Homeless
Emergency Assistance and Rapid Transition to Housing (HEARTH) Act of 2009, Section 103,
definition of homelessness was used:
Unsheltered homeless people reside in places not meant for human habitation, such as on
the streets, in vehicles, parks, abandoned buildings, makeshift shelters, and airports.
Sheltered homeless people occupy emergency shelters, transitional housing, treatment
programs, and motels if motel vouchers are provided by service agencies or federal, state,
or local government programs for low-income individuals.
Emergency Shelter: According to HUD, an emergency shelter is defined as any facility with
sleeping accommodations that provide temporary shelter for homeless persons with the length of
stay ranging from one night to three months.
Transitional housing is defined by HUD as a facility that provides housing and supportive
services such as case management and life skills for homeless persons to facilitate movement to
independent living within 24 months.
Permanent Supportive Housing
In addition, HUD began requiring an enumeration of permanent supportive housing (PSH)
programs for each community starting in 2009. The Tri-J community first collected PSH
numbers in 2003 and then again in 2009 and 2011 and for the latest count in 2013. The PSH
figures are not included in the homeless count totals but are described in this report as they
needed to be collected on the same night as the Tri-J homeless census.
The definition of permanent supportive housing for HUD is a long-term, community-based
program with supportive services for homeless individuals with disabilities. A person with a
disability is determined to 1) have a physical, mental, or emotional impairment that is expected to
be of continued and indefinite duration, substantially impedes his or her ability to live
independently, and is of such a nature that the ability could be improved by more suitable
housing conditions; or 2) have a developmental disability, as defined in the Developmental
5
Disabilities Assistance and Bill of Rights Act (McKinney-Vento Homeless Assistance Act of
1987, Title IV, Subtitle C).
This type of supportive housing enables special needs populations to live as independently as
possible in a permanent setting. There is no definite length of stay. Tenants of permanent housing
sign legal lease documents. Services are available but the tenant is not obligated to participate.
The supportive services may be provided by the organization managing the housing or
coordinated by the applicant and provided by other public or private services agencies. Permanent
supportive housing can be provided in one or several structures at one locations or scattered sites.
Not Counted
In 2009, the U.S. Congress amended the McKinney-Vento Homeless Assistance Act of 1987 as
the HEARTH Act. This expanded the Act to include people who are at imminent risk of
homelessness and families or unaccompanied youth who are living unstably. Imminent risk of
homelessness is defined as people who must leave their current housing situation within the next
14 days with no other place to stay and no resources or support network to obtain housing.
“Unstably housed” families or unaccompanied youth are those who 1) meet the definition of
homelessness under other federal programs such as the Department of Education, 2) have not
lived for a long period independently in permanent housing, 3) have moved frequently, and 4)
will continue to experience housing instability due to chronic disabilities, history of domestic
violence or multiple barriers to employment. The “at risk of homelessness” and “unstably
housed” populations are often labeled as precariously housed. For the 2013 homeless census,
HUD again only wanted CoCs to count people who were literally homeless in their point-in-time
counts and not those who were precariously housed.
3.4 Unsheltered Count Method
The methodology for the Tri-J unsheltered homeless census was recognized by HUD as a “best
practice” in 2003. The Tri-J unsheltered count uses a combination of different methods to
determine the number of people homeless on one night. The direct methods include canvassing
and hotspot counts, along with an indirect method of estimations. These methods were applied to
the first systematic count of homeless people in Chicago in 1985 (Rossi 1989).
The canvassing method entails enumerators covering areas in a community where they observe
people, typically at night or in the early morning hours, and either identify them as homeless or
housed. This method is best used in urban areas where enumerators can walk the streets of
concentrated areas or drive the streets in suburban or sparser areas. The hotspot count is
conducted in areas where homeless people are thought to be heavily concentrated and hidden
from street view. Typically, enumerators who are experienced working with street homeless
populations are sent to cover these areas. Hotspot counts offer data collection opportunities of a
subpopulation that might not otherwise be included in a count.
A benefit to conducting a canvassing method is that once the unsheltered numbers are collected,
they can be adjusted for the hidden homeless (Rossi 1989). Homeless families tend to be difficult
to find because they seek out secluded locations such as abandoned buildings or vehicles where
they are shielded from the elements and hidden from view. The 2003 advisory group determined

6
that unsheltered families should be estimated using an algebraic equation based on the number of
sheltered and unsheltered families found on census night and the geographic distribution of those
families.
Planning
Planning for the 2013 Tri-J homeless census unsheltered count began in October 2012. The first
month involved setting up the working group and, most importantly, setting the date for the
count. In addition, as with previous homeless counts, a deployment captain’s (DC) committee
was formed to assist Pathways in planning and managing deployment sites for the unsheltered
count. The DC was staffed by homeless service providers, non-profit agencies, community
volunteers and government agencies. Beginning in December 2012, the deployment captains met
on a regular basis to prepare for the upcoming homeless count.
To develop a logistics plan for the Tri-J homeless census, the City of Atlanta, Fulton County and
DeKalb County had to be divided into manageable areas for counting. The Tri-J covers over 800
square miles and comprises 771 U.S. Census block groups. In 2003, 134 enumeration areas were
created by grouping the U.S. Census blocks into manageable areas for data collection and
organization. The enumeration areas varied in size and number of block groups depending on the
anticipated concentration of unsheltered homeless persons. For example, in areas with high
concentrations of unsheltered homeless people, fewer block groups were allocated to an
enumeration area.
The 2013 Tri-J homeless census used the same enumeration areas as previous counts. The
enumeration areas were divided among 11 deployment sites (see SPECIAL THANKS). These sites
were spaced throughout the Tri-J and appropriately geo-located to provide convenient access for
enumerators to their assigned enumeration areas. They served as staging areas for the unsheltered
count by providing adequate well-lit parking and a large meeting area.
Once the deployment sites were confirmed, a planning map was developed. The Atlanta
Regional Commission’s Geographic Information Systems (GIS) Department created the 2013
planning map for the unsheltered count. The large planning map aided Pathways in the
assignment of enumeration areas to each deployment site and the deployment captains in
orienting enumerators during training on census night.
The enumeration area maps created by GIS in 2010 for the 2011 homeless census were again
used for the 2013 homeless count. The enumeration maps included one main enumeration area
clearly outlined in bold black in the center of the map with the block groups for each EA outlined
in purple within the EA. The enumeration maps had been improved from the 2005 homeless
census with Aero Atlas street overlays, which detailed street information, defined block group
boundaries and distinguished landmarks. The colors of the maps had been changed slightly from
the 2007 Tri-J homeless count. In 2007, the maps were updated to one light pastel color for cities
and no color for the county areas.
The enumeration areas were stratified into four categories – high, medium, low and zero count
areas – based on the numbers from previous Tri-J homeless census. The WG decided in 2002
that high count areas such as downtown Atlanta would receive enumerators with expertise or

7
experience with the street homeless population. These high count areas can typically have a
concentration of sixty or more people. In 2007, the WG determined that enumeration areas where
no homeless people had been found in the previous counts would not be counted. This would
allow efforts to be focused on areas where homeless people were thought to be located. For 2009,
the WG concluded that low count enumeration areas, where twelve or fewer homeless people had
been found on previous counts, would not be assisted by enumerator guides due to the lack of
need for their expertise. Finally, the other areas had enumeration teams comprised of community
volunteers and homeless enumerator guides.
Conducting a count of this magnitude required community collaboration. Over 400 community
volunteers were needed to carry out the count in the City of Atlanta and its two counties. The Tri-
J relied on the efforts of homeless service provider staff, personnel from government agencies,
members of faith-based organizations, college students and hundreds of community volunteers to
conduct the unsheltered count. Volunteers were recruited using a number of methods including
direct recruitment, public announcements, recruitment fliers and postings on websites. Soliciting
the help of local stakeholders was accomplished by letting them know that the numbers can be
used for planning, funding and implementing services for people who are homeless. Volunteers
were assigned to deployment sites based on their preferences and on the minimum requirement of
volunteers needed at each site.
As with previous Tri-J homeless counts, enumerator guides assisted the community volunteers
with identifying homeless persons, in pointing out locations likely to have homeless persons
present and in recognizing potentially dangerous situations to avoid. The guides were recruited
from various transitional housing programs in the Tri-J area. They were required to have lived in
the Tri-J area for at least six months and to have been a participant in the transitional program for
at least three months. The guides were only used at six of the ten deployment sites due to low
numbers of homeless people found in the other four sites during the past census.
One area of the Tri-J where community volunteers and enumerator guides did not count was
downtown Atlanta. The downtown area was covered by veterans participating in the U.S.
Department of Veterans Affairs (VA), Health Care for Homeless Veterans Program. Along with
the 22 current program participants, VA staff also worked in the downtown enumeration teams
on census night. The VA enumerators were assigned enumeration areas in downtown Atlanta due
to their experience living on the streets or working with clients on the streets. These areas were
walked and involved counting in gulleys and other hidden locations. Typically, downtown
Atlanta has the highest number of unsheltered homeless people on count night.
Identifying other areas where concentrated numbers of homeless people were sleeping was
critical. Several months prior to census night, law enforcement agencies throughout the Tri-J
were sent packets that included a survey on the probable location of unsheltered homeless
persons. In addition to information about homeless persons’ locations, law enforcement officers
were also asked to identify areas that were unsafe for volunteers and areas that needed police
escorts. With the feedback from law enforcement, Pathways was able to compile a detailed list of
special coverage areas or hotspot locations.
8
Enumerators who work with clients on the streets or have specialized knowledge of the street
homeless population counted in the hot spot locations. These areas were primarily walked
because they involved counting in wooded areas and other hidden locations. Special coverage
enumeration teams were comprised of outreach workers and other knowledgeable personnel
from St. Joseph’s Mercy Care Services – Community Homeless Outreach Program (CHOP),
DeKalb County Community Development Department, and the Latin American Association –
homeless outreach team and homeless service provider agencies. The teams were grouped into
several geographic coverage areas: City of Atlanta, south Fulton County, the Hartsfield-Jackson
Atlanta International Airport, Decatur, Tucker, north DeKalb County, east DeKalb County and
south DeKalb County. These teams were stationed at three deployment sites: Crossroads
Community Ministries, Center for Pan Asian Community Services and the Maloof Center.
In the weeks prior to the census, Pathways research staff put together count night boxes for the
captains to use at the deployment sites. Planning and enumeration maps were printed, supplies
such as clipboards, flashlights and pens were purchased and count night forms from previous
census were updated and printed. The forms included: sign-in sheet, hold harmless agreement,
enumerator roles description, map reading guide instruction, street tally form instructions,
verification letter, deployment log, block group log and certificate of participation. Pathways
research staff passed out the boxes to the DC the week prior to the count. At the meeting, the
Pathways research manager reviewed with the DC all the materials that were included in the
boxes and the census night process such as setting up the deployment sites, training the
volunteers and calling in the homeless count numbers. This meeting also provided the DCs an
opportunity to meet with their fellow deployment site co-captains.
Two other training sessions also occurred in January. At the first January DC meeting, the
captains were trained on how to read the planning and enumeration maps. In addition to the DC,
both the veteran and special coverage enumeration teams received special training on how to read
the maps, to identify people who are homeless and to fill out the count form. The teams were also
taught safety procedures to follow. Data Collection
On count night, January 28, 2013, the Pathways research team was available during the day to
answer any last questions regarding the upcoming count and to assign new volunteers as needed.
Deployment captains arrived at the deployment sites around 10:30 p.m. to set up for the count.
For each deployment site, three DCs coordinated the site on census night. During the count night,
Pathways research staff was located at the Jefferson Place deployment site.
The deployment captains had been provided with an instructions and checklist form to assist with
the count night process. The DC count night checklist provided instructions on what to do prior to
count night such as organizing supplies and documents and purchasing food. The instructions for
count night focused on a process for setting up and organizing the deployment site, training the
enumerators, and forming and equipping enumeration teams. Also, on the checklist were
procedures for what to do after deploying the teams and when the teams return.
Around 11:30 p.m., 318 community volunteers, 46 enumerator guides, 31 VA enumerators and
21 special coverage team enumerators arrived at the deployment sites to participate in the

9
homeless count. The WG decided that, for accuracy and safety, enumeration teams not covering
downtown Atlanta or hotspot locations would be comprised of at least three to four members,
ideally at least two community volunteers and one enumerator guide. The number of teams
required at each deployment site depended on the number of enumeration areas assigned to the
site with one enumeration team generally covering one enumeration area.
Training for the community volunteers and homeless enumerator guides occurred at midnight.
They received training on enumerator roles, how to read the maps and enumeration process and
safety tips. The tips were provided to the enumerators on what to do while at the deployment
site, such as reviewing their enumeration area map and, while in the field counting, to spend
most of their time in high-probability areas including commercial zones, industrial corridors,
shut-down businesses and 24-hour businesses. The tips also focused on safety practices, such as
driving only in well-lit parking lots and side streets.
Enumerators were instructed to travel all streets in their enumeration area, to drive at speeds of
10-15 miles per hour in areas where homeless people are likely to be, not to count in abandoned
buildings due to safety concerns and not to make contact with or disturb any homeless persons
found on the street. The enumerators were also requested to stop at 24 hour businesses to ask
store clerks if they are aware of where homeless people might be in that area. Another request
was that enumerators stop at hospitals in their area and count homeless people in the emergency
room.
Proper completion of tally sheets was an important training topic. The tally sheets helped to
collect an accurate count of the number of unsheltered homeless people observed. These forms
reported the number of homeless individuals by gender and adult vs. youth (under age 18) or
undetermined gender/age and the number of homeless family units by adult male, adult female
and children under age 18. The street tally forms were pre-printed with an assigned enumeration
area number and a block group number. The forms contained directions on how to record the data
and how to call in the counts. Enumerators were instructed to call in count results on each block
group as it was completed.
On census night, police officers throughout the Tri-J stopped by the deployment sites to provide
safety and to identify the location of homeless people and unsafe areas. In addition, the officers
were available to provide police escorts as needed.
The enumerators deployed around 1:00 a.m. on census morning with instructions to return to their
deployment sites by 5 a.m. The weather conditions on the morning of January 29th were clear
with a morning low temperature in the forties. In an effort to ensure accuracy of the count,
prevent the loss of data and to get “real time” reporting of the count, a call-in reporting method
was used. Enumeration teams reported the tallies for each block group in their assigned
enumeration area to their deployment captains as they completed the count for the block group.
After an enumeration area was complete, deployment captains provided data to Pathways staff for
entry into an online computer application.

10
Challenges and Suggested Modifications
After enumerators returned from their enumeration areas, they received a continental breakfast
and a standardized debriefing questionnaire to fill out. Based on the feedback, volunteers
indicated that they liked several things about participating in the count. First, volunteers liked that
they could help homeless people and serve the community for a worthwhile cause. The
volunteers felt that they were making a difference. Also, they enjoyed working as a team with
their follow volunteers and meeting new people.
The main problem with the homeless census that the volunteers expressed was the time that the
count occurred. Volunteers did not like staying up late to conduct the census. Another major
concern for several volunteers was not finding any or many homeless people in their enumeration
area. It is important to understand that lower count numbers will occur in the outer areas of the
Tri-J where there are more residential neighborhoods such as in north Fulton County.
All in all, most volunteers were glad to participate and found the process to be easy (85 percent).
The volunteers stated that they appreciated the experience and would be willing to volunteer
again (96 percent). For many, it raised their awareness of situations faced by people who sleep on
the street.
3.5 Sheltered Count Method
Emergency Shelters (ES) and Transitional Housing Programs (TH)
In December 2012, a master list of sheltered agencies (emergency shelters and transitional
housing programs, along with permanent supportive housing programs) located in the City of
Atlanta, Fulton County and DeKalb County was created based on the previous Tri-J Housing
Inventory Charts (HIC) and other agency lists such as providers participating in the Homeless
Management Information System (HMIS) and Tri-J grantee organizations. According to HUD,
the HIC is a complete inventory of emergency shelter, transitional housing, permanent supportive
housing and rapid rehousing beds available in the CoC on a particular night (HUD 2007). HUD
requires that the HIC and point-in-time count data be collected for the same night.
Tri-J HMIS staff contacted emergency shelter, transitional housing and permanent supportive
housing agencies via email or phone and notified them of the upcoming Tri-J homeless census. In
addition, announcements were made at local public meetings, via flyers and via postings on
websites. Soliciting the help of local stakeholders was accomplished by letting them know that
the numbers can be used for planning, funding and implementing services for people who are
homeless.
As agency staff was contacted, current information was verified or corrected as needed to update
the master list. If a phone number was no longer in service, Tri-J HMIS staff researched the
situation to determine if the facility was no longer open or if the number had changed. Staff also
investigated any new agencies that were provided by the advisory council, deployment captains,
Tri-J representatives or the community. Throughout the process, contact persons were identified
who would provide the number of homeless people staying at the sheltered agencies on count
night.

11
Several days prior to the homeless census, Tri-J HMIS staff again emailed, called or faxed each
agency on the master list to remind them of the upcoming homeless count, the need for their bed
occupancy and capacity information for census night, and to provide the agency staff with the
sheltered count tally form and instructions. The email or fax included a notification letter,
sheltered count tally form and instructions for filling out the count form.
The sheltered count tally form requested the following information:
Agency/Contact information
Program information, including jurisdiction, program type, target population, number of
beds, number of units, HMIS beds
Point-in-time count, focusing on the number of households with and without children by
gender and age (adult age 18-24, adult over age 24 or child under age 18)
Special needs information
The contact person for each provider agency was instructed to fill out the form for all clients on
site from 6 p.m. January 28th to 6 a.m. January 29th, 2013. The contact person was requested to
return the sheltered count tally form to the Tri-J HMIS staff by 6 p.m. January 30th.
Unfortunately, many agencies did not return their forms back by the set deadline. Therefore, the
submission deadline was extended to February 5, 2013.
On February 20, the Pathways research project manager met with the Tri-J representatives to
discuss the process for collecting data on non-reporting agencies and for verifying the numbers
that agencies had provided. A decision was made that each jurisdiction would be responsible for
contacting the non-reporting agencies within their communities. The City of Atlanta
representative who had compiled the HIC data in previous years took responsibility for
maintaining the sheltered count master spreadsheet which includes all the numbers for the
sheltered count. With City of Atlanta having the largest number of provider agencies in their
jurisdiction, two additional city personnel were provided to assist with the collection and
verification of sheltered count numbers in Atlanta.
Additional meetings were held in March and April to discuss the progress for contacting non-
reporting agencies and for verifying numbers reported. Any issues such as determining what is
considered a unit and recording street addresses were resolved at the meetings with people
coming to a consensus. For the April meeting, the master spreadsheet was reviewed line by line.
At that meeting it was determined that for difficult to reach agencies, an individual would visit
the program site to confirm its existence and report the number of participants on census night.
In the end, the Tri-J was able to obtain 93 percent return rate on the sheltered count tally forms.
Estimations were made for the agencies that did not provide their homeless count numbers. These
estimates, conducted by the Pathways research project manager, were derived using a covariate
model that had been developed originally for the 2003 Tri-J homeless census. This model
predicted occupancies based on the reporting sites and used housing type, bed capacity and
demographic information.
12
Institutions
Pathways has previously had difficulty obtaining the number of homeless persons staying at
institutions on count night. Therefore, estimations were conducted on the ratio of homeless
individuals in the City of Atlanta from 2009 to 2011 to the actual number of homeless individuals
in the institutions in 20011. The estimated numbers were allocated by gender and sheltered vs.
unsheltered status based on parameters developed from the 2005 Tri-J homeless census and
survey.
In 2011, packets similar to the police requests for information were created to send out to the jails
and hospitals. For the 2013 Tri-J homeless census, Pathways used the same methodology for
contacting hospitals and jails in the communities. Several months prior to the 2013 homeless
census, jails and hospitals received packets that included a letter notifying jail and hospital staff
of the upcoming homeless count, a survey on homeless people who use the facility and a request
that the institutions provide a contact person who can give the number of people homeless at the
facility on count night. The response rate for this census was low with only a few institutions
providing their homeless numbers. For institutions that did not report numbers, the previous
estimation formulas were used.
Challenges and Suggested Modifications
A continuous challenge for the sheltered homeless counts has been the relatively lengthy return
time for some of the Tri-J agencies regarding the number of homeless people at their facilities on
census night. This census was no exception with Tri-J representatives verifying sheltered count
numbers until the middle of April. The best possible solution to this problem appears to be that
used in 2011 where one staff member was dedicated primarily to the accurate collection of the
sheltered count data.
Another major issue was verifying the homeless census numbers provided by sheltered agencies.
First, the numbers provided were compared to other Tri-J reports, i.e. past HICs, previous
sheltered counts and recent grant applications. A second step of count night number verification
was to speak with agency staff directly about specific data anomalies. Confirmation of numbers
was a three-month process.
13
Section 4: Results
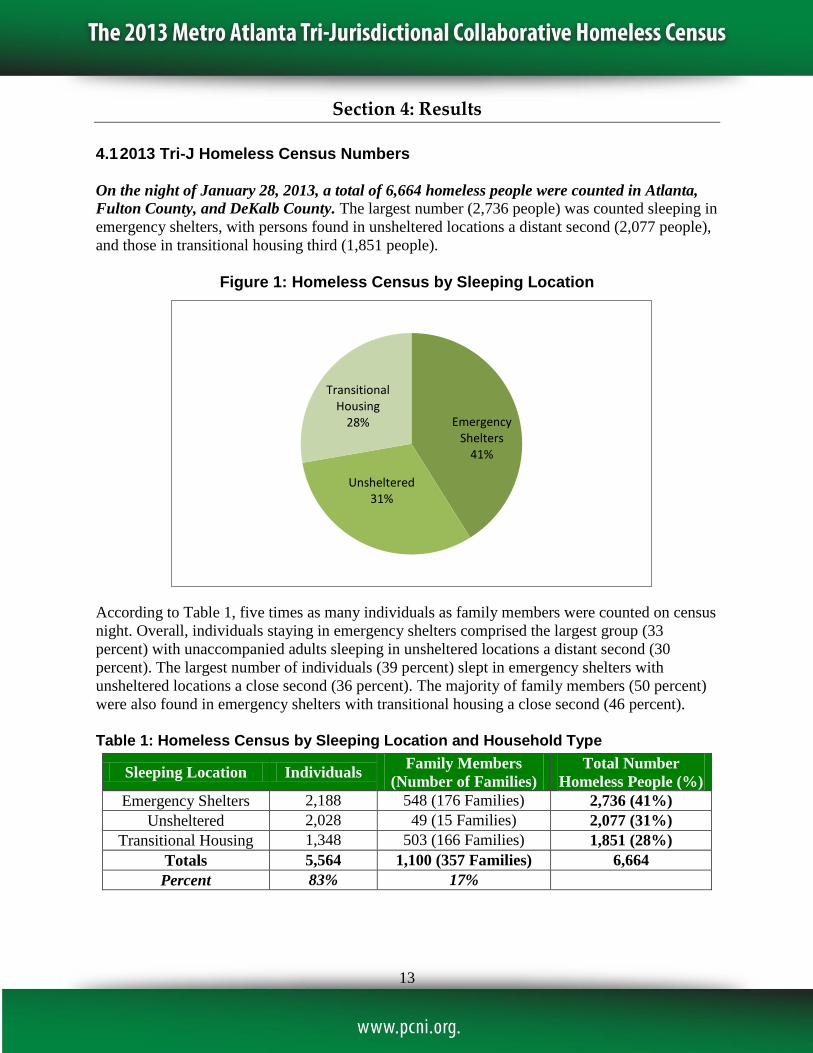
4.1 2013 Tri-J Homeless Census Numbers On the night of January 28, 2013, a total of 6,664 homeless people were counted in Atlanta,
Fulton County, and DeKalb County. The largest number (2,736 people) was counted sleeping in
emergency shelters, with persons found in unsheltered locations a distant second (2,077 people),
and those in transitional housing third (1,851 people).
Figure 1: Homeless Census by Sleeping Location
According to Table 1, five times as many individuals as family members were counted on census
night. Overall, individuals staying in emergency shelters comprised the largest group (33
percent) with unaccompanied adults sleeping in unsheltered locations a distant second (30
percent). The largest number of individuals (39 percent) slept in emergency shelters with
unsheltered locations a close second (36 percent). The majority of family members (50 percent)
were also found in emergency shelters with transitional housing a close second (46 percent).
Table 1: Homeless Census by Sleeping Location and Household Type
Sleeping Location Individuals Family Members
(Number of Families)
Total Number
Homeless People (%)
Emergency Shelters 2,188 548 (176 Families) 2,736 (41%)
Unsheltered 2,028 49 (15 Families) 2,077 (31%)
Transitional Housing 1,348 503 (166 Families) 1,851 (28%)
Totals 5,564 1,100 (357 Families) 6,664
Percent 83% 17%
Emergency Shelters
41%
Unsheltered31%
Transitional Housing
28%
14
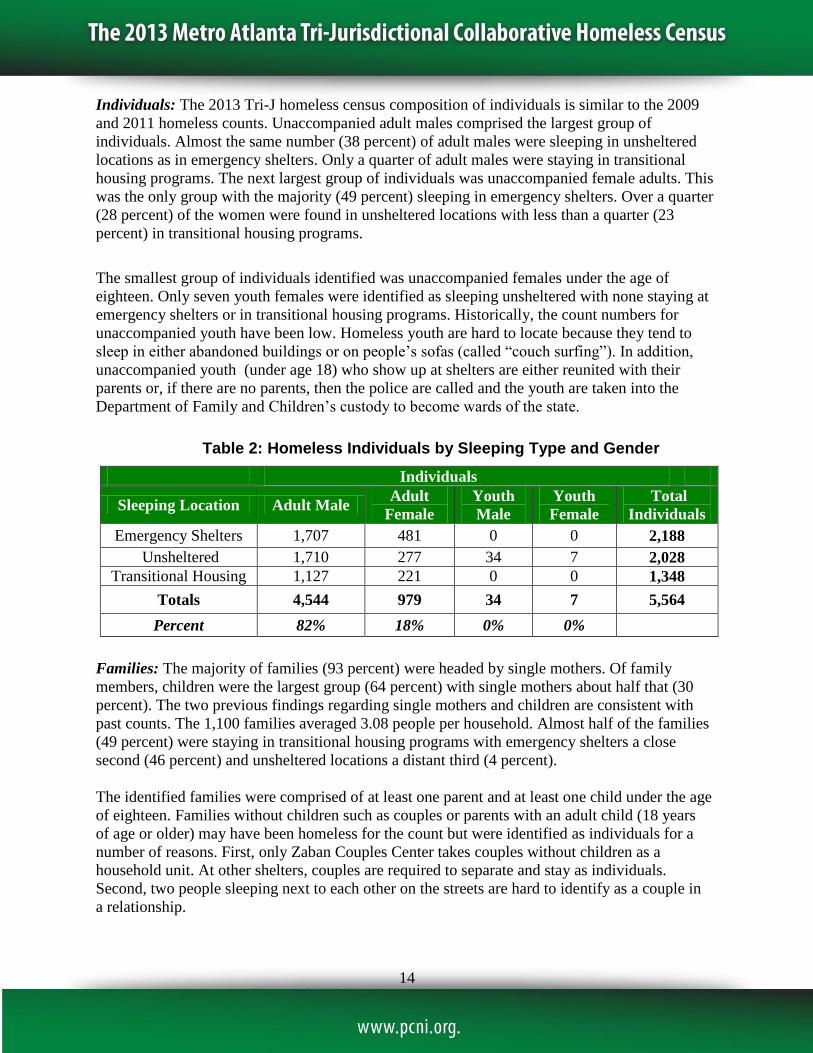
Individuals: The 2013 Tri-J homeless census composition of individuals is similar to the 2009
and 2011 homeless counts. Unaccompanied adult males comprised the largest group of
individuals. Almost the same number (38 percent) of adult males were sleeping in unsheltered
locations as in emergency shelters. Only a quarter of adult males were staying in transitional
housing programs. The next largest group of individuals was unaccompanied female adults. This
was the only group with the majority (49 percent) sleeping in emergency shelters. Over a quarter
(28 percent) of the women were found in unsheltered locations with less than a quarter (23
percent) in transitional housing programs.
The smallest group of individuals identified was unaccompanied females under the age of
eighteen. Only seven youth females were identified as sleeping unsheltered with none staying at
emergency shelters or in transitional housing programs. Historically, the count numbers for
unaccompanied youth have been low. Homeless youth are hard to locate because they tend to
sleep in either abandoned buildings or on people’s sofas (called “couch surfing”). In addition,
unaccompanied youth (under age 18) who show up at shelters are either reunited with their
parents or, if there are no parents, then the police are called and the youth are taken into the
Department of Family and Children’s custody to become wards of the state.
Table 2: Homeless Individuals by Sleeping Type and Gender
Families: The majority of families (93 percent) were headed by single mothers. Of family
members, children were the largest group (64 percent) with single mothers about half that (30
percent). The two previous findings regarding single mothers and children are consistent with
past counts. The 1,100 families averaged 3.08 people per household. Almost half of the families
(49 percent) were staying in transitional housing programs with emergency shelters a close
second (46 percent) and unsheltered locations a distant third (4 percent).
The identified families were comprised of at least one parent and at least one child under the age
of eighteen. Families without children such as couples or parents with an adult child (18 years
of age or older) may have been homeless for the count but were identified as individuals for a
number of reasons. First, only Zaban Couples Center takes couples without children as a
household unit. At other shelters, couples are required to separate and stay as individuals.
Second, two people sleeping next to each other on the streets are hard to identify as a couple in
a relationship.
Individuals
Sleeping Location Adult Male Adult
Female
Youth
Male
Youth
Female
Total
Individuals
Emergency Shelters 1,707 481 0 0 2,188
Unsheltered 1,710 277 34 7 2,028
Transitional Housing 1,127 221 0 0 1,348
Totals 4,544 979 34 7 5,564
Percent 82% 18% 0% 0%

15
Table 3: Homeless Families by Sleeping Type and Gender
Overall: Of the total number of homeless people counted, unaccompanied adult males comprised
the largest group (68 percent) with unaccompanied adult females a distant second (15 percent).
Children and single mothers were the third (10 percent) and fourth (5 percent) largest groups.
The remaining groups of homeless people by household type, age and gender included two
parent heads of households, youth males, non-head of household adults such as adult children or
grandmothers, youth females and single fathers.
4.2 Unsheltered Count
On census night, 2,077 homeless persons were counted in unsheltered locations in the City of
Atlanta, Fulton County and DeKalb County. Individuals comprised almost all of the people (98
percent) sleeping unsheltered.
Overall: Of the total number of homeless people counted as unsheltered, unaccompanied adult
males comprised the largest group (82 percent) with unaccompanied adult females a distant
second (13 percent). The remaining groups of unsheltered homeless people by household type,
age and gender included youth males (2 percent), children (2 percent), single mothers (1 percent)
and youth females.
Table 4: Unsheltered Count Individuals
Family Members
Sleeping
Location
Male
Head
of
Family
Female
Head
of
Family
Two
Parent
Family
(Number
of Adults)
Non-
Head
Adult
Children
Under
Age 18
in
Family
Total Family
Members
(Number of
Families)
Emergency
Shelters 2 168
6 (12
Adults) 15 351 548 (176 Families)
Transitional
Housing 1 148
17 (34
Adults) 8 312 503 (166 Families)
Unsheltered 0 15 0 0 34 49 (15 Families)
Totals 3 331 23 (46
Adults) 23 697
1,100 (357
Families)
Percent 0% 30% 4% 2% 64%
Individuals
Unsheltered Adult
Male
Adult
Female
Youth
Male
Youth
Female Total Individuals
Totals 1,710 277 34 7 2,028
Percent 84% 14% 2% 0%

16
Families: No families were found sleeping unsheltered on the night of the count. Unsheltered
homeless families tend to be difficult to find because they seek out secluded locations such as
abandoned buildings or vehicles where they are shielded from the elements and hidden from
view. Pathways and the working group believed that homeless families should have been found
based upon data from the 2011 Tri-J homeless survey indicating that 4.5 percent of the total
number of families usually slept in unsheltered locations. Therefore, it was determined that
unsheltered families should be estimated using an algebraic equation based on the number of
sheltered and unsheltered families found on census night and the geographic distribution of those
families. The results of the estimation determined that 49 people in 15 families were sleeping in
unsheltered locations on the night of January 28th.
Table 5: Unsheltered Count Families
Geographic Areas: As with previous Tri-J homeless counts, the highest concentration (458
people, 23 percent) of unsheltered homeless people were counted in downtown Atlanta. A likely
cause of the large number is the high concentration of emergency shelters and transitional
housing programs in the area. The downtown area measures approximately four square miles and
is roughly bound by North Avenue to the north, Northside Drive to the west, Boulevard to the
east and Interstate 20 to the south.
A high concentration of unsheltered homeless people (55 people, 3 percent) was also found at the
Hartsfield-Jackson Atlanta International Airport. Typically, people who are homeless arrive at
the Airport on the last MARTA train of the night and leave out the next morning on the first
train. Homeless people are usually left alone by the Hartsfield-Jackson Atlanta International
Airport Police to sleep overnight.
The lowest number of unsheltered homeless people (16 people, less than 1 percent) was counted
in north Fulton County above the City of Atlanta. A possible reason for the low homeless
numbers in north Fulton County is that households in that area earn annual incomes far above the
U.S. poverty level ($23,550 annual income for a family of four; U.S. Department of Health and
Human Services 2013). For example, Sandy Springs households earn a median annual income
of $76,477 with Roswell households at $79,733 yearly, and Alpharetta households having a
median yearly income of $95,888 (U.S. Census Bureau, 2005-2009 American Community
Survey 5-Year Estimates).
Family Members
Unsheltered
Male Adult
Head of
Family
Female
Adult
Head of
Family
Two Parent
Family
(Number of
Adults)
Non-
Head
Adult
Children
Under Age
18 in
Family
Total
Family
Members
(Number of
Families)
Totals 0 15 0 0 34 49 (15)
Percent 0% 31% 5% 0% 64%

17
Hidden Homeless: On count night, there were two groups of unsheltered homeless people that
were not counted. First, enumerators did not enter abandoned buildings to count the number of
people sleeping due to safety reasons. These buildings were dark, often in disrepair and could
have had drug activity occurring. Second, enumerators were asked not to get out of their cars to
walk around unless escorted by police officers or as part of special teams due to safety concerns.
This rule made it difficult to count people sleeping in cars because community volunteers were
unable to approach parked cars and look inside. Another issue with counting people sleeping in
cars is that car owners, business owners and police officers do not appreciate people looking in
cars and may suspect the enumerators of theft. Unfortunately, there is no current estimation
formula for calculating the numbers for this hidden homeless population.
4.3 Sheltered Count (Emergency Shelters and Transitional Housing)
A total of 4,587 homeless persons resided in emergency shelter (ES) and transitional housing
(TH) facilities on census night. For the sheltered count, over half of the people (60 percent) were
sleeping at emergency shelters (2,736 people) with the remaining at transitional housing
programs (1,851 people). Additionally, more individuals (77 percent) were staying at sheltered
locations on count night than family members (23 percent).
Estimated Group: Occupancy figures for the six non-reporting emergency shelter and transitional
housing agencies were estimated. These estimates were derived using a covariate model that had
been developed originally for the 2003 census, which predicted occupancies based on the
reporting sites and using housing type, bed capacity, and demographic information.
Individuals: Of the individuals in the sheltered count, adult males comprised the largest group
with adult females a distant second. Adult males in emergency shelters were almost half (48
percent) of the individuals with nearly a third of individuals (32 percent) adult males staying in
transitional housing. Adult females sleeping in emergency shelters were 14 percent and those in
transitional housing programs were 5 percent of individuals in sheltered locations. This
composition of individuals is similar the 2011 sheltered homeless count.
On census night, over half (60 percent) of individual adult males were sleeping in emergency
shelters with the rest staying at transitional housing programs. The majority of individual women
(69 percent) were also sleeping in emergency shelters.
Table 6: Sheltered Count Individuals
Individuals
Sleeping Locations Adult
Male
Adult
Female
Youth
Male
Youth
Female
Total
Individuals
Emergency Shelters 1,707 481 0 0 2,188
Transitional Housing 1,127 221 0 0 1,348
Totals 2,834 702 0 0 3,536
Percent 80% 20% 0% 0%

18
Families: The majority of families (92 percent) were headed by single mothers. Of family
members, children were the largest group with single mothers half that. The remaining family
members were comprised of two parent heads of households, non-head of household adults and
single fathers. The 342 families averaged 3.07 people per household. Unlike the 2011 sheltered
homeless census, the majority of the families (51 percent) were staying in emergency shelters.
Table 7: Sheltered Count Families
Overall, unaccompanied male adults comprised the largest group (62 percent) of the total number
of people staying in sheltered locations (ES and TH). The next largest groups were
unaccompanied female adults (15 percent) and children in families (14 percent). The other groups
included single mothers (7 percent), two parent heads of households (1 percent), non-head adults
such as adult children (1 percent) and single fathers.
Occupancy and Capacity: Bed capacity on census night was 5,217. The bed capacity was higher
for emergency shelters (2,989 beds) than transitional housing programs (2,228 beds). Overall, the
occupancy rate for individual emergency beds was the highest (95 percent). There were 359
emergency shelter and transitional housing individual beds not occupied for the count. Even if all
these beds had been filled, there still would have been 1,669 individuals that were sleeping
outside on count night. Beds may go vacant for a number of reasons including eligibility
standards that exclude some unsheltered people such as being drug free or because homeless
people are unwillingly to adhere to the shelters’ policies such as completing chores.
Table 8: Sheltered Count Occupancy and Capacity Individuals
Individuals
Sheltered Count Emergency Shelters Transitional Housing Total Individual
Occupancy # 2,188 1,348 3,536
Capacity 2,302 1,593 3,895
Occupancy
Percent 95% 85% 91%
Family Members
Sleeping
Location
Male
Adult
Head of
Family
Female
Adult
Head of
Family
Two
Parent
Family
(Number
of Adults)
Non-
Head
Adult
Children
Under Age
18 in Family
Total Family
Members
(Number of
Families)
Emergency
Shelters 2 168
6 (12
Adults) 15 351
548 (176
Families)
Transitional
Housing 1 148
17 (34
Adults) 8 312
503 (166
Families)
Totals 3 316 23 (46
Adults) 23 663
1,051 (342
Families)
Percent 0% 30% 4% 2% 64%

19
The lowest occupancy rate was for families in transitional housing programs (79%). One reason
for the lower occupancy rate for family beds is that families with children are less likely to be
asked to leave where they are staying on an extremely cold night, especially if living doubled up
with other family members.
Another factor is that programs that serve families are often organized into units rather than beds.
A unit may have several beds that go unoccupied depending on the size of the family. For
example, a bedroom unit with four beds housing a single mother and two children will appear to
have a 75% occupancy rate, but in fact the empty bed is not actually available to anyone else.
Therefore, it is better to compare family unit capacity and the number of families homeless on
census night. If all emergency shelter and transitional housing family units were filled, there
would still be 12 families sleeping in unsheltered locations.
Table 9: Sheltered Count Occupancy and Capacity Families
Family Members
Sheltered Count Emergency Shelters Transitional Housing Total Individual
Occupancy # 548 503 1,051
Capacity 687 635 1,322
Occupancy
Percent 80% 79% 80%
4.4 Permanent Supportive Housing
HUD began requiring an enumeration of permanent supportive housing (PSH) programs for each
CoC starting in 2009. The Tri-J community first collected PSH numbers in 2003 and then again
in 2009, 2011 and for the latest count in 2013. The PSH figures are not included in the homeless
count totals but are described in this report as they needed to be collected on the same night as
the Tri-J homeless count.
A total of 3,319 persons were residing in permanent supportive housing (PSH) on census
night. The majority of the PSH beds were occupied by individuals (61 percent) rather than family
members (39 percent). Most people in PSH were sleeping in Atlanta (1,590 people, 48 percent)
with DeKalb County a close second (1,387 people, 42 percent) and Fulton County third (342
people, 10 percent).
Of the total number of people counted, unaccompanied adult males comprised the largest group
(39 percent) with children in families a distant second (22 percent) and individual women third
(21 percent). These were followed by single mothers (9 percent) and heads of two parent families
(7 percent).
Individuals: By jurisdiction on census night, the majority of individuals (52 percent) were
staying in permanent supportive housing in Atlanta, with those in DeKalb County a close second
(41 percent) and persons in Fulton County third (7 percent). The largest group of individuals was
unaccompanied men staying in Atlanta (34 percent) with the individual men in DeKalb County a

20
close second (27 percent). Adult women in Atlanta comprised the third largest group (19 percent)
with those in DeKalb County fourth (14 percent).
Among unaccompanied men, those in Atlanta were the largest (43 percent) with individuals in
DeKalb County a close second (42 percent) and persons in Fulton County third (6 percent).
Unaccompanied women demonstrated a similar pattern to the men. The majority of adult females
slept in Atlanta (55 percent) with those in DeKalb County a close second (39 percent) and
individuals in Fulton County third (9 percent).
Table 8: Permanent Supportive Housing Occupancy by Jurisdiction for Individuals
Individuals
Jurisdiction Adult Male Adult Female Total
Individuals
Atlanta 678 373 1,051
DeKalb 542 280 822
Fulton 82 58 140
Totals 1,302 711 2,013
Percent 65% 35%
Families: As with the sheltered count, the majority of families (72 percent) were headed by
single mothers. Of family members, children were the largest group (55 percent). The 420
families with children averaged 3.1 people per household. Unlike individuals living in PSH, most
of family members were staying in DeKalb County on census night (43 percent) with people in
Atlanta a close second (41 percent) and those in Fulton County third (16 percent).
Table 9: Permanent Supportive Housing Occupancy by Jurisdiction for Family Members
Family Members
Jurisdiction
Male
Head of
Family
Female
Head of
Family
Two Parent
Family
(Number of
Adults)
Non-
Head
Adult
in
Family
Children
in
Family
Total Family
Members
(Number of
Families)
DeKalb 6 144 42 (84) 33 298 565 (192)
Atlanta 1 97 58 (116) 11 314 539 (156)
Fulton 2 61 9 (18) 10 111 202 (72)
Totals 9 302 109 (218) 54 723 1,306 (420)
Percent 1% 23% 17% 4% 55%
Table 10: PSH Occupancy and Capacity by Jurisdiction
PSH Atlanta DeKalb County Fulton County Total
Occupancy 1,590 1,387 342 3,319
Capacity 1,695 1,435 376 3,506
Occupancy
Percent 94% 97% 91% 95%

21
Figure 2: PSH Occupancy and Capacity by Household Type
Trend Analysis: The total permanent supportive housing occupancy numbers have increased
dramatically from 2003 to present (by 2,908 people). The main reason for the rise in occupancy
can be seen by the increase in PSH bed capacity over the years.
Table 11: PSH Occupancy over Time
Comparing Emergency Shelter, Transitional Housing and Permanent Supportive Housing Beds:
On census night, there was a capacity of 8,723 emergency shelter, transitional housing and
permanent supportive housing beds for homeless people. A total of 7,906 beds in occupancy (91
percent). Permanent supportive housing programs had the highest capacity of beds (3,506 beds)
with emergency shelters second (2,989 beds) and transitional housing programs third (2,228
beds). This is a change from the previous census when the order was emergency shelter,
transitional housing and permanent supportive housing. As for the number of available beds,
permanent supportive housing programs had the highest occupancy rate (95 percent) with
emergency shelters a close second (92 percent) and transitional housing programs a distant third
(83 percent).
0
500
1,000
1,500
2,000
2,500
Individuals Familiy Members
Avaiable Beds
Occupancy
PSH 2003 2009 2011 2013
Individuals 386 876 1,335 2,013
Family
Members 25 577 920 1,306
Totals 411 1,453 2,255 3,319
Percent
Change +252% +55% +47%

22
Section 5: Atlanta, DeKalb County and Fulton County
Of the 6,664 homeless people counted in the Tri-J on census night, the majority were located in
the City of Atlanta (5,571 people, 84 percent) with DeKalb County being a distant second (705
people, 11 percent) and Fulton County third (388 people, 6 percent). This composition is similar
to the previous 2011 Tri-J homeless census with Atlanta at 87 percent, DeKalb County at 8
percent and Fulton County at 5 percent.
Figure 3: Homelessness by Jurisdiction
To some extent, these jurisdictional homeless counts are simply a reflection of the number of beds
available in each jurisdiction. For example, 82 percent of Tri-J emergency shelter and transitional
housing beds were located in Atlanta, 11 percent of the beds were in DeKalb County, and 7 percent
were in Fulton County on the night of the homeless census.
Table 12: Housing Bed Inventory by Jurisdiction
Jurisdiction Individual
Emergency Beds
Family Emergency
Beds
Individual Transitional
Beds
Family Transitional
Beds
Total
Atlanta 2,282 512 1,284 185 4,263
DeKalb 8 131 231 225 595
Fulton 12 44 78 225 359
Totals 2,302 687 1,593 635 5,217
Percent 44% 13% 31% 12%
0
1,000
2,000
3,000
4,000
5,000
6,000
Atlanta DeKalb County Fulton County
Sheltered Unsheltered
23
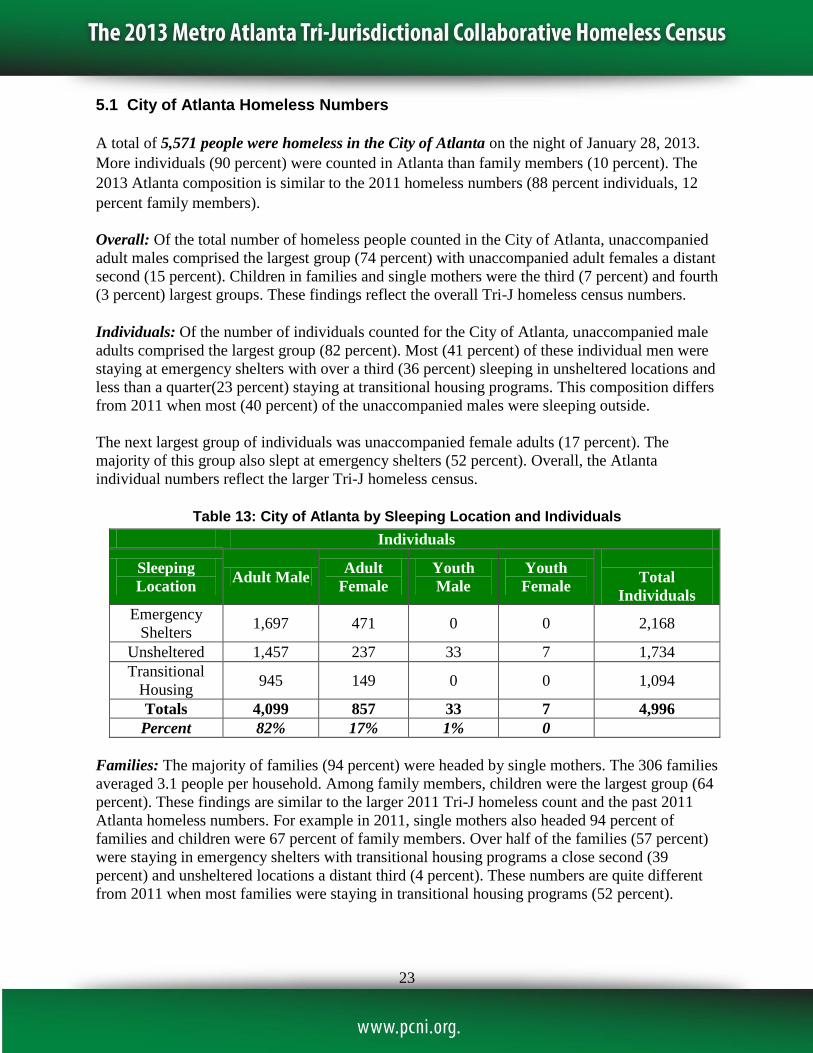
5.1 City of Atlanta Homeless Numbers
A total of 5,571 people were homeless in the City of Atlanta on the night of January 28, 2013.
More individuals (90 percent) were counted in Atlanta than family members (10 percent). The
2013 Atlanta composition is similar to the 2011 homeless numbers (88 percent individuals, 12
percent family members).
Overall: Of the total number of homeless people counted in the City of Atlanta, unaccompanied
adult males comprised the largest group (74 percent) with unaccompanied adult females a distant
second (15 percent). Children in families and single mothers were the third (7 percent) and fourth
(3 percent) largest groups. These findings reflect the overall Tri-J homeless census numbers.
Individuals: Of the number of individuals counted for the City of Atlanta, unaccompanied male
adults comprised the largest group (82 percent). Most (41 percent) of these individual men were
staying at emergency shelters with over a third (36 percent) sleeping in unsheltered locations and
less than a quarter(23 percent) staying at transitional housing programs. This composition differs
from 2011 when most (40 percent) of the unaccompanied males were sleeping outside.
The next largest group of individuals was unaccompanied female adults (17 percent). The
majority of this group also slept at emergency shelters (52 percent). Overall, the Atlanta
individual numbers reflect the larger Tri-J homeless census.
Table 13: City of Atlanta by Sleeping Location and Individuals
Individuals
Sleeping
Location Adult Male
Adult
Female
Youth
Male
Youth
Female
Total
Individuals
Emergency
Shelters 1,697 471 0 0 2,168
Unsheltered 1,457 237 33 7 1,734
Transitional
Housing 945 149 0 0 1,094
Totals 4,099 857 33 7 4,996
Percent 82% 17% 1% 0
Families: The majority of families (94 percent) were headed by single mothers. The 306 families
averaged 3.1 people per household. Among family members, children were the largest group (64
percent). These findings are similar to the larger 2011 Tri-J homeless count and the past 2011
Atlanta homeless numbers. For example in 2011, single mothers also headed 94 percent of
families and children were 67 percent of family members. Over half of the families (57 percent)
were staying in emergency shelters with transitional housing programs a close second (39
percent) and unsheltered locations a distant third (4 percent). These numbers are quite different
from 2011 when most families were staying in transitional housing programs (52 percent).

24
Table 14: City of Atlanta by Sleeping Location and Family Members
Family Members
Sleeping
Location
Male Head
of Family
Female
Head of
Family
2 Parent
Families
(Number
of Parents)
Non-
Head
Adults
Children
in Family
Total Family
Members
(Number of
Families)
Emergency
Shelters 2 119 6 (12) 11 247 391 (127)
Transitional
Housing 1 43 4 (8) 1 92 145 (48)
Unsheltered 0 12 0 0 27 39 (12)
Totals 3 174 10 (20) 12 366 575 (187)
Percent 1% 30% 3% 2% 64%
Sleeping Location: On census night in Atlanta, most people (2,559 people, 46 percent) were
sleeping at emergency shelters with unsheltered locations a distant second (1,773 people, 32
percent) and transitional housing programs third (1,239 people, 22 percent).
For 2013, downtown Atlanta had the highest concentration of unsheltered people in the city. The
area comprised over a quarter (26 percent) of the Atlanta homeless unsheltered count numbers.
This is similar to the 2011 Tri-J homeless census downtown Atlanta findings (24 percent).
Interestingly, the downtown Atlanta homeless numbers are similar from the first census in 2003
to the latest count. This trend shows a comparable pattern to the overall Atlanta homeless
numbers. Specifically from 2003 to 2007, downtown Atlanta experienced a steady decrease (by
32 percent) in homeless people on count night. However from 2007 to 2011, there was a
dramatic increase (by 89 percent). The good news is that the downtown Atlanta area saw a
decrease (by 132 people, 22 percent) for this census.
Table 15: Downtown Atlanta Unsheltered Homeless Numbers
Trend Analysis: The 2013 total Atlanta homeless census numbers are the second lowest with
2003 being the lowest. From 2003 to 2009, the City of Atlanta experienced a steady increase (by
25 percent). However, over the past four years there has been a steady decrease (by 9 percent).
The Atlanta unsheltered numbers experienced a steady decrease from 2003 to 2009 (by 92
people, 5 percent) with an increase in 2011 (by 254 people, 14 percent) followed by a decrease
for this census (by 332 people, 16 percent). These are the lowest number of unsheltered homeless
people that Atlanta has experienced since the count began. From 2003 to present, the emergency
shelter numbers have been steadily increasing (by 644 people, 13 percent).
2003 2005 2007 2009 2011 2013
Totals 460 373 312 440 590 458
Percent Change -18% -16% +57% +34% -22%

25
Atlanta experienced a tremendous increase in people (by 952 people, 89 percent) sleeping at
transitional housing programs from 2003 to 2009. However, over the last four years, Atlanta has
been experiencing a decrease (560 people, 9 percent) in the transitional housing numbers. These
changes in numbers are more than likely a reflection of the change in bed capacity in Atlanta
over the years.
Table 16: Atlanta Homeless Census for 2003 to 2013
Figure 4: Atlanta by Sleeping Location Over Time
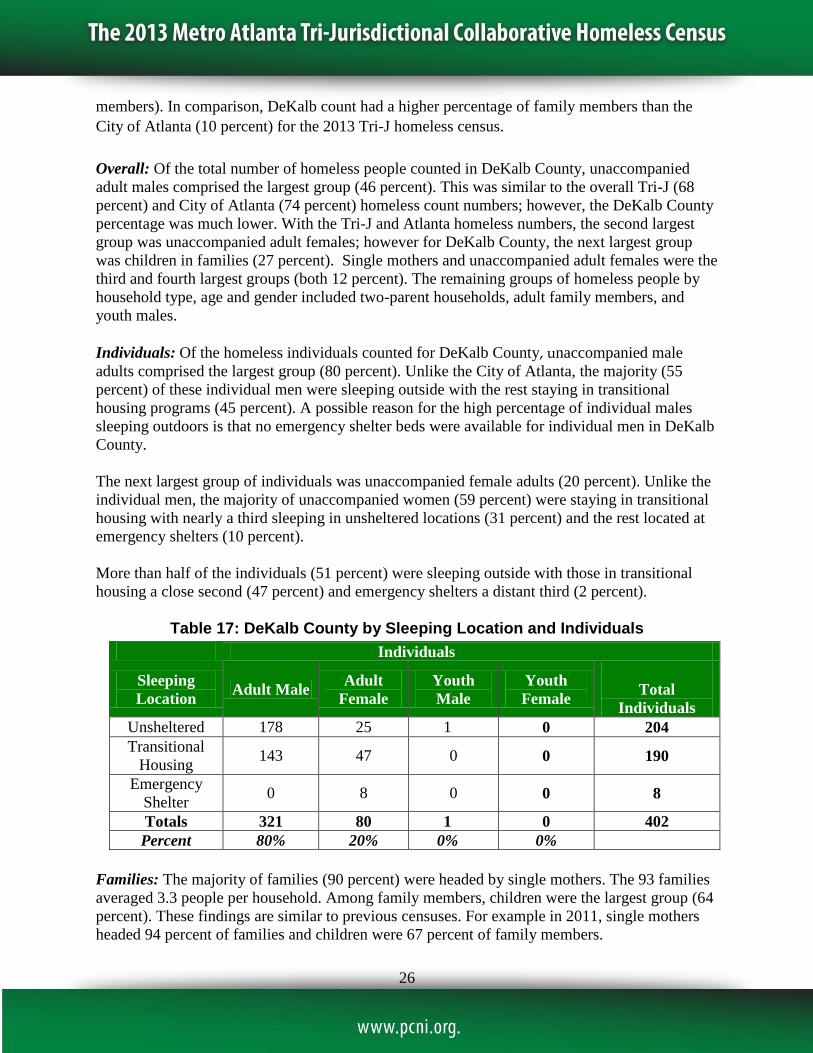
5.2 DeKalb County Homeless Numbers
A total of 705 people were homeless in DeKalb County (not including City of Atlanta) on the
night of January 28, 2013. This is the second largest number of homeless people counted among
the three jurisdictions on that night. The majority of the homeless people (57 percent) found in
DeKalb County were individuals. This composition of more individuals than families is similar
to the 2011 DeKalb County homeless numbers (60 percent individuals, 40 percent family
0
500
1,000
1,500
2,000
2,500
3,000
2003 2005 2007 2009 2011 2013
Unsheltered Emergency Shelter Transitional Housing
Sleeping
Location
2003
2005
2007
2009
2011
2013
Emergency
Shelter 1,915 2,177 2,172 2,269 2,340 2,559
Unsheltered 1,943 1,888 1,861 1,851 2,105 1,773
Transitional
Housing 1,059 1,687 1,712 2,011 1,542 1,239
Totals 4,917 5,752 5,745 6,131 5,987 5,571
Percent
Change +17% 0% +6.5% -2% -7%
26
members). In comparison, DeKalb count had a higher percentage of family members than the
City of Atlanta (10 percent) for the 2013 Tri-J homeless census.
Overall: Of the total number of homeless people counted in DeKalb County, unaccompanied
adult males comprised the largest group (46 percent). This was similar to the overall Tri-J (68
percent) and City of Atlanta (74 percent) homeless count numbers; however, the DeKalb County
percentage was much lower. With the Tri-J and Atlanta homeless numbers, the second largest
group was unaccompanied adult females; however for DeKalb County, the next largest group
was children in families (27 percent). Single mothers and unaccompanied adult females were the
third and fourth largest groups (both 12 percent). The remaining groups of homeless people by
household type, age and gender included two-parent households, adult family members, and
youth males.
Individuals: Of the homeless individuals counted for DeKalb County, unaccompanied male
adults comprised the largest group (80 percent). Unlike the City of Atlanta, the majority (55
percent) of these individual men were sleeping outside with the rest staying in transitional
housing programs (45 percent). A possible reason for the high percentage of individual males
sleeping outdoors is that no emergency shelter beds were available for individual men in DeKalb
County.
The next largest group of individuals was unaccompanied female adults (20 percent). Unlike the
individual men, the majority of unaccompanied women (59 percent) were staying in transitional
housing with nearly a third sleeping in unsheltered locations (31 percent) and the rest located at
emergency shelters (10 percent).
More than half of the individuals (51 percent) were sleeping outside with those in transitional
housing a close second (47 percent) and emergency shelters a distant third (2 percent).
Table 17: DeKalb County by Sleeping Location and Individuals
Individuals
Sleeping
Location Adult Male
Adult
Female
Youth
Male
Youth
Female
Total
Individuals
Unsheltered 178 25 1 0 204
Transitional
Housing 143 47 0 0 190
Emergency
Shelter 0 8 0 0 8
Totals 321 80 1 0 402
Percent 80% 20% 0% 0%
Families: The majority of families (90 percent) were headed by single mothers. The 93 families
averaged 3.3 people per household. Among family members, children were the largest group (64
percent). These findings are similar to previous censuses. For example in 2011, single mothers
headed 94 percent of families and children were 67 percent of family members.

27
Over half of the families (59 percent) were staying in transitional housing programs with
emergency shelters a close second (38 percent) and unsheltered locations a distant third (3
percent).
Table 18: DeKalb County by Sleeping Location and Family Member
Family Members
Sleeping
Location
Male Head
of Family
Female
Head of
Family
2 Parent
Families
(Number
of Parents)
Non-
Head
Adults
Children in
Family
Total
Family
Members
(Number of
Families)
Transitional
Housing 0 46 9 (18) 4 111 179 (55)
Emergency
Shelter 0 35 0 4 75 114 (35)
Unsheltered 0 3 0 0 7 10 (3)
Totals 0 84 9 (18) 8 193 303 (93)
Percent 0% 28% 6% 2% 64%
Sleeping Location: On count night, the largest number of DeKalb County homeless people (369
people, 52 percent) were sleeping in transitional housing programs with unsheltered locations a
distant second (214 people, 30 percent) and emergency shelters third (122 people, 17 percent).
These findings are in reverse of Atlanta were the majority of homeless people were sleeping in
emergency shelters with unsheltered locations a distant second and transitional housing third. An
interesting finding was that more people were staying in permanent supportive housing (1,435
people) in DeKalb County than in transitional housing, emergency shelters and unsheltered
locations combined. These findings indicate a DeKalb County homeless population that is
mainly housed in programs that provide supporting services.
Trend Analysis: The DeKalb County homeless census numbers have experienced increases and
decreases since 2003. From 2003 to 2005, there was an increase of 265 people. Then in 2007,
there was a dramatic decrease of 422 people, followed by another increase (by 214 people) in
2009. Again in 2011, DeKalb County experienced a decrease in the homeless numbers (by 59
people). This census saw the third increase in numbers for DeKalb County (by 179 people). The
largest number of homeless people was counted in DeKalb County in 2005 with the least number
of people found in 2007.
Over the years, the largest number of people in DeKalb County was found staying in transitional
housing programs with emergency shelters showing the least number of people. Specifically, the
numbers for each of the sleeping location counts has varied over the years. From the first count
to the latest, people sleeping in unsheltered locations have increased dramatically (by 70 percent)
with emergency shelters experiencing the largest increase (by 101 percent). People staying in
transitional housing programs also experienced an increase but only slightly compared to the
other two types of sleeping locations (by 7 percent).

28
Table 19: DeKalb County Homeless Census for 2003 to 2013
Figure 5: DeKalb County by Sleeping Location Over Time
5.3 Fulton County Homeless Numbers
A total of 388 people were homeless in Fulton County (not including the City of Atlanta) on census
night. Of the three jurisdictions, Fulton County found the smallest number of people homeless.
Slightly more than half of the homeless people counted in Fulton County were family members (57
percent) rather than individuals. This composition is in contrast to the 2011 Fulton County homeless
numbers where more individuals (170 people, 52 percent) were counted than family members (155
people, 48 percent).
Overall: Of the total number of homeless people counted in Fulton County, children in families
comprised the largest group (36 percent) with unaccompanied adult males a close second (32
percent). Typically, individual adult males are the largest group. This is the first time, however,
that children in families have been the largest number.
Single mothers were the third largest group of homeless people (19 people) with unaccompanied
adult females as the fourth group (11 percent). The remaining groups of homeless people by
household type, age and gender included two parent heads of households and a non-head adult
member of household.
0
50
100
150
200
250
300
350
400
450
2003 2005 2007 2009 2011 2013
Unsheltered Emergency Shelter Transitional Housing
Sleeping Location 2003 2005 2007 2009 2011 2013
Transitional Housing 344 401 241 319 315 369
Unsheltered 126 276 99 205 132 214
Emergency Shelter 58 116 31 61 79 122
Totals 528 793 371 585 526 705
Percent Change +50% -53% +58% -10% +34%
29
Individuals: Of the homeless individuals counted for Fulton County, unaccompanied male adults
comprised the largest group (75 percent). Similarly to DeKalb County, the majority of these
individual men (60 percent) were sleeping in unsheltered locations with transitional housing
programs second (31 percent) and emergency shelters third (8 percent). As for unaccompanied
women, over half (60 percent) were staying in transitional housing programs with those sleeping
outside a distant second (36 percent). Only two women were sleeping at an emergency shelter on
count night.
Table 20: Fulton County by Sleeping Location and Individual
Individuals
Sleeping Location Adult Male Adult Female Youth Total Individual
Unsheltered 75 15 0 90
Transitional Housing 39 25 0 64
Emergency Shelters 10 2 0 12
Totals 124 42 0 166
Percent 75% 25% 0%
Families: Of the 77 families, almost all (95 percent) were headed by a single mother with four
families headed by two parents. The families averaged 2.9 people per household. Children
comprised the largest number of family members (62 percent). The majority of families (82
percent) were staying in transitional housing. These figures are similar to DeKalb County.
Table 21: Fulton County by Sleeping Location and Family Members
Family Members
Sleeping
Location
Male
Head
of
Family
Female
Head
of
Family
2 Parent
Families
(Number
of Parents)
Non-
Head
Adult
Children
in Family
Total Family
Members (Number
of Families)
Transitional
Housing 0 59 4 (8) 3 109 179 (63)
Emergency
Shelters 0 14 0 0 29 43 (14)
Unsheltered 0 0 0 0 0 0 (0)
Totals 0 73 4 (8) 3 138 222 (77)
Percent 0% 33% 4% 1% 62%
Sleeping Locations: On census night in Fulton County, the majority of homeless people (243
people, 63 percent) were living in transitional housing with individuals sleeping outside a distant
second (143 people, 23 percent). The smallest number of people (55 people, 14%) were staying
in emergency shelters. Similarly to DeKalb County, more people (342 people) were staying in
permanent supportive housing in Fulton County than in transitional housing, emergency shelters
or unsheltered locations.

30
North and South Fulton County: Of the people counted as homeless in Fulton County (not
including Atlanta), the majority of people were found in North Fulton County above the Atlanta
city limits (251 people, 65 percent) with the remaining located in South Fulton County below
Atlanta (137 people, 35 percent). This finding is different than the last census when most
homeless people were counted in South Fulton County. In North Fulton, the majority of people
(76 percent) were staying in transitional housing programs. On the other hand, the majority of
homeless people (54 percent) were sleeping in unsheltered locations in South Fulton County.
Trend Analysis: Overall, the Fulton County numbers have experienced an increase from the first
count to the latest (by 80 people, 26 percent). Specifically, figures are unique in that they have
fallen and risen from count to count. From 2003 to 2005, there was a slight decrease (21 people),
followed by the greatest increase (by 84 people) from 2005 to 2007. Then there was another
decrease (by 68 people) from 2007 to 2009, ending this year with another increase (by 85 people,
28%). The largest number of homeless people was counted in Fulton County in 2013 with the
least number of people found in 2005.
The Fulton County unsheltered numbers saw a steady increase from the first count to the 2011
(57 people, 68 percent). However, this homeless census experienced a decrease (by 36 percent).
From 2003 to 2005, the emergency shelter numbers decreased to zero. Over the past eight years,
however, the numbers have doubled. The transitional housing figures have fallen (by 10 percent),
risen (by 28 percent), fallen (by 41 percent) and then risen again over time (by 45 percent).
Table 22: Fulton County Homeless Census for 2003 to 2013
Figure 6: Fulton County by Sleeping Location over Time
Sleeping Location 2003 2005 2007 2009 2011 2013
Unsheltered 84 98 99 108 141 90
Emergency Shelter 13 0 31 27 41 55
Transitional Housing 211 189 241 168 143 243
Totals 308 287 371 303 325 388
Percent Change -7% +29% -18% +7% +19%
0
50
100
150
200
250
300
2003 2005 2007 2009 2011 2013
Unsheltered Emergency Shelter Transitional Housing

31
Section 6: Trend Analysis
Overall: The point-in-time Tri-J homeless census have held fairly steady from year to year
(average of 6,800 people homeless nightly). Only an additional 107 people were found homeless
on a particular night from the first count in 2003 to the latest (2 percent). The trend shows that
from 2003 to 2009 the Tri-J homeless census experienced a steady increase of people homeless
(by 462 people, 7 percent) on a particular night. However, over the past four years, there has
been a decrease of people homeless (355 people, 5 percent) for the point-in-time census. The
2003 Tri-J homeless census experienced the lowest numbers of all the counts, with this latest
census having the second lowest.
Sleeping Location: Over the years, both the unsheltered and sheltered counts have held fairly
steady within a particular range. The unsheltered number has averaged 2,217 people. The
sheltered count is typically double the unsheltered numbers with an average over the years of
4,575 persons.
For people sleeping in sheltered locations, there was a steady increase (by 602 people, 14
percent) on census night for both individuals and families from 2003 to 2009. However, over the
past two years, the sheltered numbers saw a decrease in people (395 people, 8 people) staying in
emergency shelters and transitional housing programs. With the 2013 homeless census, there was
another increase in numbers (by 127 people, 3 people).
From 2003 to 2007, there was a steady decrease (by 189 people, 8 percent) in the number of
people sleeping in unsheltered locations on the night of the census for both individuals and
family members. However, there was an increase (by 263 people, 12 percent) from 2007 to 2011
to an all time high of homeless people sleeping outdoors. The good news is that there was a
decrease for the most recent homeless census (by 301, 13 percent) with the numbers being the
lowest for all the counts.
It is important to note that as the number of people in emergency shelter and transitional housing
beds rose in the Tri-J, the number of people sleeping outdoors fell. On the other hand, as the
number of people in emergency shelter and transitional housing beds decreased, the number of
people sleeping in unsheltered locations increased. This finding indicates a relationship between
the number of people in unsheltered locations and those in sheltered facilities.
Table 23: 2003 to 2013 Homeless Counts by Sleeping Location
Sleeping
Locations
2003
2005
2007
2009
2011
2013
Sheltered 4,253 4,570 4,725 4,855 4,460 4,587
Unsheltered 2,304 2,262 2,115 2,164 2,378 2,077
Totals 6,557 6,832 6,840 7,019 6,838 6,664
Percent +4% 0% +3% -3% -3%

32
Figure 7: Tri-J Homeless Census by Sleeping Location Over Time
Individuals: The Tri-J individual numbers have held steady over the years (around 5,600 persons
per night). From 2003 to 2009, there was a steady increase in the number of individuals (by 492
individuals, 6 percent). However, over the past four years, there has been a decrease (by 217
individuals, 4 percent). The lowest number of individuals was counted in 2003 with the highest
numbers found in 2009.
Sheltered individuals experienced a steady increase from 2003 to 2005 (by 415 family members,
13 percent) with a slight decrease from 2005 to 2007 (by 37 persons, 1 percent). This is followed
by another increase (by 162 people, 5 percent) and decrease (by 284 people, 8 percent). With this
homeless census, there has been a third increase in the number of people sleeping in emergency
shelters and transitional housing programs (by 107 people, 3 percent). On the other hand, from
2003 to 2009 there was a slight decrease of unsheltered individuals (by 48 people, 2 percent)
with a dramatic increase from 2009 to 2011 (by 268 persons, 13 percent). This has been followed
by a significant decrease over the last two years (by 308 individuals, 13 percent).
Overall, the unsheltered individual homeless numbers have decreased slightly (by 88 individuals,
4 percent) from 2003 to 2013. On the other hand, the sheltered numbers have increased (by 363
persons, 11 percent) during that time period. As the sheltered numbers increased, the unsheltered
numbers decreased for individuals. The average for the unsheltered numbers has been 2,117
individuals with a sheltered average of 3,498 persons.
Table 24: Homeless Census by Sleeping Location and Household Type Over Time
Individuals
2003 2005 2007 2009 2011 2013
Sheltered 3,173 3,588 3,551 3,713 3,429 3,536
Unsheltered 2,116 2,085 2,071 2,068 2,336 2,028
Totals 5,289 5,673 5,622 5,781 5,765 5,564
Percent +7% -1% +3% -.3% -3
0
1,000
2,000
3,000
4,000
5,000
6,000
2003 2005 2007 2009 2011 2013
Sheltered
Unsheltered

33
Families: Similarly to homeless individuals, the number of family members homeless in the Tri-J
has also held steady (averaging 1,177 people per night). For family members, there was a decrease
from 2003 to 2005 (by 109 people, 9%) with a steady increase from 2005 to 2009 (by 79 people,
7%). This is followed by a second decrease from 2009 to 2011 (by 165 people, 13%) with an
increase over the past two years (by 27 people, 2.5%). The 2011 Tri-J family member numbers
were the lowest of all the family counts with the highest numbers found in 2003.
Overall, the sheltered family homeless numbers have decreased slightly (by 29 persons, 3%)
from 2003 to 2013. The unsheltered numbers also decreased (by 139 family members, 70%)
during that time period but more dramatically. The average for the sheltered numbers has been
1,077 family members with the unsheltered average at 99 persons.
Table 25: Homeless Census by Sleeping Location and Household Type Over Time
Family Members
2003 2005 2007 2009 2011 2013
Sheltered 1,080 982 1,174 1,142 1,031 1,051
Unsheltered 188 177 44 96 42 49
Totals 1,268 1,159 1,224 1,238 1,073 1,100
Percent -9% +6% +1% -13% +2.5
Figure 8: Homeless Census by Household Type and Sleeping Location Over Time
Bed Capacity and Occupancy Rate: The number of people homeless on each census night is
typically a reflection of the number of beds available. For each count, about two thirds of
homeless people are sleeping in sheltered locations. From 2005 to 2009, there was a steady
increase in beds for both individuals (3,722 to 4,082 beds) and family members (1,449 to 1,511
beds).
Since 2007, there has been a steady decrease (235 beds, 15 percent) in the bed capacity for
family members. With bed type, an interesting finding is that in 2007 and 2009 there was a
0
500
1,000
1,500
2,000
2,500
3,000
3,500
4,000
2003 2005 2007 2009 2011 2013
Sheltered Individuals
UnshelteredIndividuals
Sheltered FamilyMembers
Unsheltered FamilyMembers

34
greater number of transitional housing beds than emergency shelter beds. However, for 2011 and
2013, the reverse is true.
The overall point-in-time Tri-J homeless census occupancy rate has held fairly steady over the years
(87 percent average). Typically the occupancy rate for individuals is higher (92 percent average) than
for family members (76 percent average). Family beds often are unoccupied because the size of a
family can be less than number of beds in the room. Additionally, emergency shelters have a higher
occupancy rate (94 percent average) than transitional housing programs (81 percent average).
Table 26: 2003 to 2013 Bed Capacity and Occupancy for Tri-J
Table 27: 2005 to 2013 Bed Capacity and Occupancy for Individuals
Table 28: 2007 to 2013 Bed Capacity and Occupancy for Families
Figure 9: 2007 to 2011 Bed Capacity by Household Type
0
500
1,000
1,500
2,000
2,500
3,000
3,500
4,000
4,500
2007 2009 2011 2013
Individuals
Family Members
Total Tri-J Homeless Counts
2005 2007 2009 2011 2013
Occupancy 4,570 4,725 4,855 4,460 4,587
Capacity 5,171 5,298 5,653 5,282 5,217
Occupancy Percent 88% 89% 86% 84% 88%
Individuals
2005 2007 2009 2011 2013
Occupancy 3,588 3,551 3,713 3,429 3,536
Capacity 3,722 3,741 4,082 3,840 3,895
Occupancy Percent 96% 95% 91% 89% 91%
Families
2007 2009 2011 2013
Occupancy 1,174 1,142 1,031 1,051
Capacity 1,557 1,511 1,442 1,322
Occupancy Percent 75% 76% 72% 80%

35
Table 29: 2007 to 2013 Bed Capacity and Occupancy for Emergency Shelters
Table 30: 2007 to 2013 Bed Capacity and Occupancy for Transitional Housing
Figure 10: 2007 to 2011 Bed Capacity by Sleeping Location
0
500
1,000
1,500
2,000
2,500
3,000
3,500
2007 2009 2011 2013
Transitional Housing
Emergency Shelters
Emergency Shelters
2007 2009 2011 2013
Occupancy 2,386 2,357 2,460 2,736
Capacity 2,481 2,460 2,729 2,989
Occupancy (%) 96% 96% 90% 92%
Transitional Housing
2007 2009 2011 2013
Occupancy 2,339 2,498 2,000 1,851
Capacity 2,817 3,133 2,553 2,228
Occupancy (%) 83% 80% 78% 83%

36
Section 7: Annualized Projection
For the 2013 Tri-J homeless census, the community collected information on persons who were
homeless on a single night. This provides only a snap shot of people who are homeless on a
given night in winter. Over the course of a year, individuals and families will cycle in and out of
homelessness. People who are homeless for a short period will be in the situation briefly as they
find a permanent place to stay usually within a few weeks or months. On the other hand, people
who are homeless for the long-term will remain without housing for a year or longer. The long
term homeless tend to be chronic indicating that they experience a disabling condition such as a
mental illness or addiction.
To estimate how many people will be homeless over the course of an entire year, Pathways
projected an annualized count of homeless people based on turnover rates (also called
multipliers). Multipliers have been calculated for the 2013 Tri-J homeless population to estimate
the number of individuals and family members who will experience homelessness this year.
Three factors were used to determine categorically specific turnover rates:
Length of homelessness as reported by the 2011 Tri-J homeless survey respondents
Percent of respondents indicating each length
Minimum turnover rate for each length category
A weighted average was then calculated based on the relative proportion of respondents who fell
within each length category. The net result of this approach suggested an annual multiplier of 2.5
for family members (2.5 x 1,100 = 2,750) and a multiplier of 3.3 for individuals (3.3 x 5,564 =
18,361). On a regular basis, families are homeless a shorter time period than individuals.
According to the 2011 Tri-J homeless survey for length of time homeless, the mode for family
members was 4-6 months while the mode for individuals was 10-12 months.
Approximately 21,111 people will experience homelessness in the Tri-J area sometime during
2013. From the 2003 to 2009 Tri-J homeless counts, there was a steady increase of people
homeless over the years (by 4,816 people, 22.5 percent). However from 2009 to 2011, there was
a decrease of people homeless annually (by 1,670 people). Unfortunately, another annualized
increase has occurred from the last homeless census (by 1,340 people). A reason for the increase
is that the turnover rate for 2013 Tri-J homeless census is higher than the 2011 count (family
members at 2.2, individuals at 3).
Table 31: Annualized Projections for Each Homeless Census
2003 2005 2007 2009 2011 2013
Totals 16,625 20,086 20,110 21,441 19,771 21,111
Percent Change +21% 0% +7% -8% +7%

37
Section 8: Conclusion
The 2013 Tri-J homeless census is the sixth count for our community. These findings reflect a
homeless population that predominately lives in metropolitan areas and is literally homeless. The
good news is that the homeless numbers have been steadily decreasing since 2009 when the
census was found to be at its highest due to the recent economic crisis.
Over the years, the biggest finding is the relationship between bed capacity / occupancy and the
number of unsheltered people in the community. Thus, as the emergency shelter and transitional
housing bed capacity increases, the number of persons on the streets decrease. On the other hand,
if the capacity is reduced for a particular year, the number of unsheltered people rises. This same
result is also a reflection of occupancy whereby as the occupancy rate increases, the number of
people sleeping unsheltered decreases.
The total Tri-J homeless numbers have held fairly steady over the years even though there has
been a steady increase in the bed capacity, especially for permanent supportive housing
programs. This finding indicates that adding beds to the Tri-J community does not necessarily
reduce the overall number of people homeless. It merely shifts where homeless persons are
sleeping at night. Instead, efforts must be made to solve the causes of homelessness, such as
addiction and mental health problems.
The majority of people homeless in the Tri-J are individual. Predominately they are sleeping at
emergency shelters and on the streets. The majority of these individuals are located in Atlanta.
These results indicate that Atlanta must focus its efforts on tackling the issues experienced by
homeless individuals.
Finally, one of the biggest concerns is the large number of children who are homeless on a
nightly basis in our community. Primarily, the heads of homeless families are single mothers.
Single women with children are at a greater risk of poverty than two-parent families. For single
mothers, 41 percent make an annual income below the U.S. poverty level (U.S. Census Bureau
2011).
38
Section 9: References
Jaret, C. and R. Adelman. 1997. Homelessness in Metro Atlanta.
Rossi, Peter. 1989. Down and Out in America: Origins of Homelessness. Chicago: University of
Chicago Press.
U.S. Census Bureau. American Community Survey 2005-2009. American Fact Finder. (http://
http://factfinder2.census.gov/faces/nav/jsf/pages/index.xhtml)
U.S. Census Bureau. American Community Survey. 2011. (http://www.census.gov/acs/www)
U.S. Department of Health and Human Services. Office of the Assistant Secretary for Planning
and Evaluation. 2013 Poverty Guidelines. (http://http://aspe.hhs.gov/poverty/13poverty.cfm)
U.S. Department of Housing and Urban Development. Homelessness Resource Exchange. The
McKinney-Vento Homeless Assistance Act As amended by S. 896 The Homeless Emergency
Assistance and Rapid Transition to Housing (HEARTH) Act of 2009. (http://www.hudhre.info/
documents/HomelessAssistanceActAmendedbyHEARTH.pdf)
U.S. Department of Housing and Urban Development. Office of Community Planning and
Development. HUD’s Homeless Assistance Programs: A Guide to Counting Sheltered Homeless
People, Third Revision. January 2012. (https://www.onecpd.info/resources/documents/
counting_sheltered.pdf)
U.S. Department of Housing and Urban Development. Office of Community Planning and
Development. HUD’s Homeless Assistance Programs: A Guide to Counting Unsheltered
Homeless People, Second Revision. January 2008. (http://www.hudhre.info/documents/
counting_unsheltered.pdf)
U.S. Department of Housing and Urban Development. Questions & Answers for the 2007 Housing
Inventory Chart (HIC). (archives.hud.gov/offices/cpd/homeless/library/hicqa.pdf)

39
SPECIAL THANKS
Sponsors
Metro Atlanta Tri-Jurisdictional (Tri-J) Collaborative on Homelessness
Atlanta ∙ Fulton County ∙ DeKalb County
Tri-J Executive Group
Susan Lampley
Office of Mayor Reed, Atlanta
Chris Morris
Community Development Department,
DeKalb County
Mike Rowicki
Housing and Human Development,
Fulton County
Pathways Community Network Institute
Josie Parker
Project Manager, Research and Data
Analysis
Mike Bolds
Research Assistant
Tri-J Homeless Census Report
Report prepared by Josie Parker, Project Manager, Research and Data Analysis, Pathways
Working Group
Lorie Burnett
Community Development Department,
DeKalb County
Braunwinn Camp
Community Development Department,
DeKalb County
Quentin Eleby
Tri-J HMIS Database Specialist, Fulton
County
Mark Henderson
Office of Human Services, Atlanta
Paul Kagundu
Andrew Young School of Policy Studies,
GSU
William Matson
Pathways Community Network Institute
Tommy Phillips
Pathways Community Network Institute
Melvia Richards
Community Development Department,
DeKalb County
Glen Ross
Andrew Young School of Policy Studies, GSU
Gbolade Soneyn
Tri-J HMIS Database Specialist, Fulton
County
Shalise Steele-Young
Office of Human Services, Atlanta
Deployment Sites
Atlanta
Chapel of Christian Love Church
Crossroads Community Ministries
Jefferson Place
Project Community Connections
St. Jude’s Recovery Center
Urban Residential Development Center
DeKalb County
Center for Pan Asian Community Services
Maloof Auditorium
Salvation Army - Peachcrest
Fulton County
North Fulton Community Charities
Zion Hill Community Development
Corporation

40
Deployment Captains
Leonard Adams
Quest 35
Melinda Allen
The Salvation Army
Megan Anderson
Furniture Bank of Metro-Atlanta
Michelle Anderson
Housing and Human Services Dept., Fulton
County
Robin Bledsoe
Community Advanced Practice Nurses
Beverly Bolton
Gateway Center
Dennis Bowman
Nicholas House
Lorie Burnett
Community Development Dept., DeKalb
County
Braunwin Camp
Community Development Dept., DeKalb
County
Alisha Clements
Furniture Bank
Arthur Cole
Office of Human Services, Atlanta
Melanie Conner
Zion Hill Community Development
Corporation
Carrie DuBose
Buckhead Christian Ministry
Cassandra Edmonds
Office of Human Services, Atlanta
Jimiyu Evans
Project Community Concerns
Thomas Fuller
Latin American Association
Molly Heacock
Gateway Center
Mark Henderson
Office of Human Services, Atlanta
Matthew Hurd
DeKalb Community Services Board
Shundra Jackson
The Salvation Army
Dexter Landfair
The Salvation Army
Stephen Lee
Center for Pan Asian Community Services
Melvia Richards
Community Development Dept., DeKalb
County
Gerry Richardson
Jefferson Place
Claude Sandiford
U.S. Department of Veterans Affairs (VA),
Health Care for Homeless Veterans
Program Margaret Schuelke
Project Community Concerns
Brad Schweers
Intown Collaborative Ministries
Joyce Sloan
Families First
Gbolade Soneyin
Tri-J HMIS, Fulton County
Shalise Steele-Young
Office of Human Services, Atlanta
Sonia Stinson
Gateway Center
Stan Sullivan
St. Joseph’s Mercy Care Services,
Community Homeless Outreach Program
(CHOP)
Jason Tatum
Gateway Center
Todd Wilcher
Covenant House
Mary Watson
St. Joseph’s Mercy Care Services,
Community Homeless Outreach Program
(CHOP)
Amy Zaremba
Community Volunteer

41
Special Coverage Teams
DeKalb County, Community Development
Department, Homeless Outreach Team
Latin American Association
St. Joseph’s Mercy Care Services, Community
Homeless Outreach Program (CHOP)
U.S. Department of Veterans Affairs
(VA), Healthcare for the Homeless
Veterans Program