2013 TIF Annual Report - Vermont · 2020-01-29 · TIF District Annual Report 2016 Page 6 Public...
29
TIF District Annual Report 2016 Annual Report on Tax Increment Financing Districts in Vermont (July 1, 2014 - June 30, 2015) Prepared in accordance with 32 VSA §5404a(i) and submitted by the Vermont Economic Progress Council and Vermont Department of Taxes
Transcript of 2013 TIF Annual Report - Vermont · 2020-01-29 · TIF District Annual Report 2016 Page 6 Public...

TIF District Annual Report 2016
Page
Annual Report on
Tax Increment Financing Districts in Vermont
(July 1, 2014 - June 30, 2015)
Prepared in accordance with 32 VSA §5404a(i)
and submitted by the
Vermont Economic Progress Council and
Vermont Department of Taxes
TIF District Annual Report 2016
Page 2
This page left blank intentionally.

TIF District Annual Report 2016
Page 3
STATUTORY CHARGE ............................................................................................................... 4
INTRODUCTION ......................................................................................................................... 5
SUMMARY TABLES ................................................................................................................... 7
I. PRE-ACT 60 TIF DISTRICTS:
Burlington Waterfront TIF District .............................................................................. 9
Data Summary Table and Map ................................................................................. 10
City Center Industrial Park TIF District, Newport City ........................................ 11
Data Summary Table and Map ................................................................................. 12
II. TIF DISTRICTS CREATED BY SPECIAL LEGISLATION:
Winooski TIF District................................................................................................... 13
Data Summary Table and Map ................................................................................. 14
III. EATI TIF DISTRICTS:
Milton North/South TIF Districts .............................................................................. 15
Data Summary Table and Map ................................................................................. 16
IV. ACT 184 TIF DISTRICTS
Milton Town Core TIF District .................................................................................. 17
Data Summary Table and Map ................................................................................ 18
Burlington Downtown TIF District ........................................................................... 19
Data Summary Table and Map ................................................................................. 20
Hartford TIF District, Hartford .................................................................................. 21
Data Summary Table and Map ................................................................................. 22
St. Albans City Downtown TIF District ................................................................... 23
Data Summary Table and Map ................................................................................. 24
Barre City Downtown TIF District ............................................................................ 25
Data Summary Table and Map ................................................................................. 26
South Burlington City Center TIF District .............................................................. 27
Data Summary Table and Map ................................................................................. 28
TABLE OF CONTENTS

TIF District Annual Report 2016
Page 4
TITLE 32
Taxation and Finance
PART II
Property Taxation
CHAPTER 135. EDUCATION PROPERTY TAX
§ 5404a. Tax stabilization agreements; tax increment financing districts
-------- (i) The Vermont Economic Progress Council and the Department of Taxes shall make an
annual report to the Senate Committees on Economic Development, Housing and Gen-
eral Affairs and on Finance and the House Committees on Commerce and Economic De-
velopment and on Ways and Means of the General Assembly on or before April 1. The
report shall include, in regard to each existing tax increment financing district, the date
of creation, a profile of the district, a map of the district, the original taxable value, the
scope and value of projected and actual improvements and developments, projected and
actual incremental revenue amounts and division of the increment revenue between dis-
trict debt, the Education Fund, the special account required by 24 V.S.A. § 1896 and the
municipal General Fund, projected and actual financing, and a set of performance indi-
cators developed by the Vermont Economic Progress Council, which shall include the
number of jobs created in the district, what sectors experienced job growth, and the
amount of infrastructure work performed by Vermont firms.
[As amended through 2015 Legislative session]
STATUTORY CHARGE

TIF District Annual Report 2016
Page 5
Introduction
Many changes and requirements were introduced to
Vermont’s Tax Increment Financing (TIF) District
program during the 2013-2015 legislative sessions,
including the requirement to promulgate rules for
the program. A working group was formed in 2013
and the rules were adopted in May 2015. Click here
to view the adopted rule.
Implementation of the statutory amendments and
implementation of the rules has caused a transition-
ary period, including changes to municipal report-
ing to the State which are incorporated into this an-
nual report to the General Assembly. Part of that
transition includes moving from a calendar year to
fiscal year (ending June 30) which better coincides
with the fiscal year of the municipalities that have
TIF Districts.
Following are the steps that have been taken by
VEPC and PVR to carry out the requirements of Act
80 (2013):
Track and ensure payments by municipalities to
Education Fund and transfers required. All re-
quired payments and transfers have been made
to date.
Promulgate TIF District Rule. Final Rule adopted
May 6, 2015.
Require “reconciliation” reports from municipal-
ities with pre-2006 TIF Districts. Two of the three
required reports have been filed.
With the State Auditor, develop and distribute
“Agreed Upon Procedure” (AUP) for independ-
ent municipal auditors to ensure consistent an-
nual auditing of TIF Funds. The AUP was dis-
tributed April 18, 2016. These procedures are to
be incorporated into the municipal audits for
fiscal year ending June 30, 2016.
Certification of municipal and education Origi-
nal Taxable Value by municipality, VEPC, and
PVR. This is ongoing and expected to be com-
pleted by September 2016.
This annual report represents an interim method of
reporting as VEPC and the Department of Taxes
modify and improve reporting processes and for-
mats to comply with current law. The report is
meant to report on the minimal requirements of stat-
ute for this year only. In the 2017 annual report, the
format and data presented will revert to the more
robust reporting seen in past years, which provides
information beyond the requirements of statute.
TIF Districts in Vermont
Currently, nine of the original eleven TIF Districts in
Vermont are active. Each applied to VEPC or had
been approved directly by the General Assembly to
utilize incremental education property tax revenue
to help finance public infrastructure that will in turn
cause private sector development or redevelopment
to occur. The Districts were approved as follows:
Grandfathered in by Act 60:
Burlington Waterfront—Active
Newport City—Retired
Created by Special Legislation:
Winooski—Active
Approved by VEPC Under EATI Program:
Milton North/South– Active
Approved by VEPC under Act 184 (2006):
Milton Town Core – Active
Colchester Severance Corners—Dissolved
Burlington Downtown—Active
Hartford Downtown—Active
Barre City Downtown—Active
St Albans City Downtown—Active
So. Burlington New Town Center—Active
INTRODUCTION

TIF District Annual Report 2016
Page 6
Public Improvements
The nine active Districts plan to build public infra-
structure valued at over $275 million. The public
infrastructure improvements include roads, side-
walks, lighting, water systems, waste and storm wa-
ter systems, utility improvements, parking facilities,
public transit, civic facilities, and brownfield reme-
diation. The approved municipalities are author-
ized to incur debt that will be repaid, in part, using
the incremental municipal and education property
tax revenues that will be generated by private sector
development and redevelopment. Through 2015,
about $103 million in TIF debt has been incurred by
the authorized municipalities.
Private Development
These public improvements are directly related to
and will encourage desired private sector develop-
ment and redevelopment in these communities, pri-
marily in designated downtowns and growth cen-
ters. After all public infrastructure is built and all
redevelopment occurs, grand list values will in-
crease by an estimated $778 million. Through 2015,
grand list values have increased by $266 million.
Incremental Revenues
The grand list value increase will generate estimated
incremental revenues totaling $377 million ($272M
education and $105M municipal), of which $296M
will go to the TIF Districts to finance infrastructure
and $81M will go to the taxing authorities ($60M to
the education fund and $21M to the municipalities).
These incremental revenues are in addition to the
revenues from the original taxable value going to
the taxing authorities.
Through 2015, the active Districts have generated
about $43 million in incremental property tax reve-
nue, of which $39M has gone to finance TIF District
infrastructure and $3.3M has gone to the taxing au-
thorities.
After the periods end during which the Districts can
keep a portion of increment, the estimated amount
of additional property tax revenue that will go to the
education fund would be increased by $17 million
annually.
Performance Indicators
VEPC is working through a process of developing
performance indicators appropriate for each active
District and has begun collecting and aggregating
data from each District. Reporting on these indica-
tors will start with the next reporting period.
We began collecting data on the two specific
performance indicators required by statute (32 VSA
§ 5404a(i)) during the reporting period that occurred
immediately after the requirement was enacted in
2013. The cumulative and aggregated data reported
by the municipalities for the fiscal years ending June
2014 and June 2015 show:
Jobs Created in the Districts: 1,162
Sectors Experiencing Growth: Construction, Manu-
facturing, Wholesale and Retail Trade, Transporta-
tion, FIRE, Professional and Technical Services,
Administration and Support, Health Care and So-
cial Services, Arts/Entertainment, Accommodation
and Food Service, and Public and Other Adminis-
trative Services.
Amount of Work Performed by Vermont Firms:
$27.5 million
Tables 1, 2 and 3 on Pages 7 and 8 contain summary
and aggregated information and data on the active
TIF Districts .
Following the Tables are reports on each District
which include an overview, a profile, and a map.

TIF District Annual Report 2016
Page 7
TA
BLE
1
SUMMARY TABLES TA
BLE
2
615,177,531$ 881,133,785$ 1,392,966,559$
103,251,538$ 212,829,957$
265,956,254$ 777,789,028$
26,350,518$ 213,338,816$
1,742,005$ 59,420,827$
17,057,530$
42,528,582$ 377,427,241$
14,436,060$ 105,016,147$
28,092,523$ 272,411,095$
3,265,662$ 81,453,840$
1,523,658$ 22,381,561$
1,742,005$ 59,072,279$
39,262,920$ 295,973,401$
12,912,402$ 82,634,586$
26,350,518$ 213,338,816$
Original Taxable
Value
Actual Through
June 30, 2015
Projected by End
of all TIFS
Municipal General Fund
SUMMARY TIF DISTRICT DATA
(AS OF JUNE 30, 2015)
Increase in Annual State Education Property Tax Revenue After TIFs
Total Taxable Value of Property In TIF Districts
Total Public Infrastructure Financed with TIF Revenue (Principal Only)
Projected Increase in Taxable Value by End of TIF Life
Incremental State Education Property Tax Revenues Utilized for TIF Infrastructure Debt and
Related Costs
Education Property Tax Revenue to Education Fund During Life of TIFs
Total Incremental Revenues Generated by TIF Districts
Municipal
Education
Total Incremental Revenues to TIF District:
Municipal
Education
Distribution of Incremental Revenues:
Education Fund
Total Incremental Revenues to Taxing Authorities:
YEAR DT, GC DEBT RETENTION ESTIMATED
DISTRICT CREATED TYPE STATUS OR NTC* PERIOD PERIOD ACRES PARCELS OTV TOTAL TIF DEBT
Burlington Waterfront 1997 1 1 NA 1997-2020 2001-2025 70 50 42,412,900$ 37,139,160$
Newport City 1998 1 3 NA 1998-2008 1998-2015 47 19 48,500$ 406,395$
Milton North/South 1998 2 1 NA 1999-2009 1999-2018 1029 63 26,911,151$ 9,608,849$
Winooski Downtown 2000 3 1 DT 881 2000-Debt paid 176 58 24,822,900$ 71,248,000$
Milton Town Core 2008 4 1 NA 2008-2018 2011-2031 903 668 124,186,560$ 36,958,742$
Burlington Downtown 2011 4 1 DT 2011-2021 2015-2035 263 123 170,006,600$ 10,324,000$
Hartford Downtown 2011 4 1 DT/GC 2011-2021 2014-2034 114 96 31,799,200$ 14,855,059$
St. Albans Downtown 2012 4 1 DT/GC 2012-2022 2013-2033 195 468 107,909,150$ 43,019,896$
Barre City Downtown 2012 4 1 DT 2012-2022 2014-2034 73 223 50,851,870$ 13,095,981$
South Burlington New Town Center 2012 4 2 NTC 2012-2017 2016-2036w 106 57 36,228,700$ 115,562,841$
TOTALS 2976 1825 615,177,531$ 352,218,923$
* DT = Downtown; GC = Growth Center; and NTC = New Town Center
These Debt Periods will automatically extend by five years if debt is incurred before the end date indicated or if no debt is incurred but an extention is requested and granted.
wEstimated period based on projected year debt will be incurred.
TYPE STATUS
1. Pre Act 60; Use of Educ Property Tax grandfathered; No State approval 1. Active; debt incurred; improvements made/being made
2. Approval by VEPC as part of Economic Advancement Tax Incentive Program 2. TIF Plan and Finance Plan approved by VEPC; no debt incurred yet
3. Approved by General Assembly 3. Life of TIF ended
4. Approval by application to VEPC post Act 184 (2006)
VERMONT TIF DISTRICT SUMMARY INFORMATION (AS OF JUNE 30, 2015)

TIF District Annual Report 2016
Page 8
TA
BLE
3
YEAR MUNICIPAL EDUCATION TOTAL MUNICIPAL EDUCATION TOTAL
1998 $124,028 $0 $124,028 $0 $0 $124,028 $0 $124,028
1999 $173,873 $237,572 $411,445 $0 $0 $173,873 $237,572 $411,445
2000 $167,294 $369,825 $537,119 $0 $0 $167,294 $369,825 $537,119
2001 $167,717 $401,505 $569,222 $0 $0 $167,717 $401,505 $569,222
2002 $255,737 $424,501 $680,238 $0 $0 $255,737 $424,501 $680,238
2003 $359,513 $487,286 $846,799 $0 $0 $359,513 $487,286 $846,799
2004 $415,911 $1,136,260 $1,552,171 $0 $0 $415,911 $1,136,260 $1,552,171
2005 $537,403 $1,333,445 $1,870,848 $0 $0 $537,403 $1,333,445 $1,870,848
2006 $497,033 $1,123,714 $1,620,747 $0 $0 $497,033 $1,123,714 $1,620,747
2007 $523,147 $1,157,810 $1,680,957 $0 $0 $523,147 $1,157,810 $1,680,957
2008 $883,726 $1,865,177 $2,748,902 $34,423 $127,338 $849,303 $1,737,838 $2,587,141
2009 $941,303 $2,052,115 $2,993,417 $30,400 $129,642 $910,903 $1,922,473 $2,833,375
2010 $1,139,034 $2,225,108 $3,364,142 $20,481 $84,555 $1,118,553 $2,140,553 $3,259,106
2011 $1,230,398 $2,463,198 $3,693,596 $177,623 $133,759 $1,052,776 $2,329,439 $3,382,215
2012 $1,296,887 $2,533,758 $3,830,645 $192,046 $157,301 $1,104,841 $2,376,457 $3,481,298
2013 $1,469,091 $2,845,062 $4,314,153 $241,438 $260,544 $1,227,653 $2,584,518 $3,812,171
2014 $1,728,905 $3,208,134 $4,937,039 $281,134 $245,827 $1,447,770 $2,962,307 $4,410,077
2015 $2,525,061 $4,228,053 $6,753,114 $546,112 $603,040 $1,978,948 $3,625,014 $5,603,962
SUBTOTALS $14,436,060 $28,092,523 $42,528,582 $1,523,658 $1,742,005 $12,912,402 $26,350,518 $39,262,920
2016 $2,351,070 $5,268,194 $7,619,264 $409,056 $942,111 $1,942,014 $4,326,082 $6,268,096
2017 $2,711,218 $6,113,008 $8,824,226 $499,093 $1,153,315 $2,212,125 $4,959,693 $7,171,818
2018 $3,284,271 $7,551,540 $10,835,811 $642,356 $1,512,948 $2,641,915 $6,038,592 $8,680,507
2019 $3,569,707 $8,491,409 $12,061,116 $713,715 $1,747,915 $2,855,992 $6,743,494 $9,599,486
2020 $4,147,753 $10,321,233 $14,468,986 $858,226 $2,205,371 $3,289,527 $8,115,861 $11,405,388
2021 $5,043,811 $12,964,609 $18,008,420 $1,082,241 $2,866,215 $3,961,570 $10,098,394 $14,059,964
2022 $5,265,480 $13,546,279 $18,811,759 $1,137,658 $3,011,633 $4,127,822 $10,534,646 $14,662,468
2023 $5,491,596 $14,230,809 $19,722,406 $1,194,187 $3,182,765 $4,297,409 $11,048,044 $15,345,453
2024 $5,764,507 $15,034,615 $20,799,122 $1,262,415 $3,383,717 $4,502,092 $11,650,898 $16,152,991
2025 $5,919,570 $15,669,899 $21,589,469 $1,301,181 $3,542,538 $4,618,390 $12,127,361 $16,745,751
2026 $5,350,070 $14,297,764 $19,647,834 $1,337,517 $3,574,441 $4,012,552 $10,723,323 $14,735,876
2027 $5,486,462 $14,673,942 $20,160,404 $1,371,615 $3,668,486 $4,114,846 $11,005,457 $15,120,303
2028 $5,629,130 $15,062,060 $20,691,190 $1,407,283 $3,765,515 $4,221,848 $11,296,545 $15,518,393
2029 $5,776,914 $15,462,549 $21,239,463 $1,444,228 $3,865,637 $4,332,685 $11,596,911 $15,929,597
2030 $5,930,037 $15,875,854 $21,805,890 $1,482,509 $3,968,963 $4,447,528 $11,906,890 $16,354,418
2031 $5,353,571 $13,209,801 $18,563,372 $1,338,393 $3,302,450 $4,015,179 $9,907,350 $13,922,529
2032 $5,503,299 $13,530,323 $19,033,622 $1,375,825 $3,382,581 $4,127,474 $10,147,742 $14,275,216
2033 $1,977,893 $10,887,643 $12,865,536 $494,473 $2,721,911 $1,483,420 $8,165,732 $9,649,152
2034 $1,973,373 $7,230,114 $9,203,487 $493,343 $1,807,529 $1,480,030 $5,422,586 $6,902,615
2035 $2,007,710 $7,374,716 $9,382,426 $501,928 $1,843,679 $1,505,783 $5,531,037 $7,036,820
2036 $2,042,644 $7,522,211 $9,564,855 $510,661 $1,880,553 $1,531,983 $5,641,658 $7,173,641
SUBTOTALS $90,580,087 $244,318,572 $334,898,659 $20,857,903 $57,330,274 $69,722,184 $186,988,298 $256,710,481
TOTALS $105,016,147 $272,411,095 $377,427,241 $22,381,561 $59,072,279 $82,634,586 $213,338,816 $295,973,401
ANNUAL REVENUE GENERATION AND DISTRIBUTION, ALL TIFS
INCREMENTAL REVENUES TO :
MUNICIPAL
GENERAL
FUND
EDUCATION
FUND
INCREMENTAL REVENUES GENERATED
INCREMENTAL REVENUES TO TIF DISTRICT DEBT
FROM:
SUMMARY TABLES
TIF District Annual Report 2016
Page 9
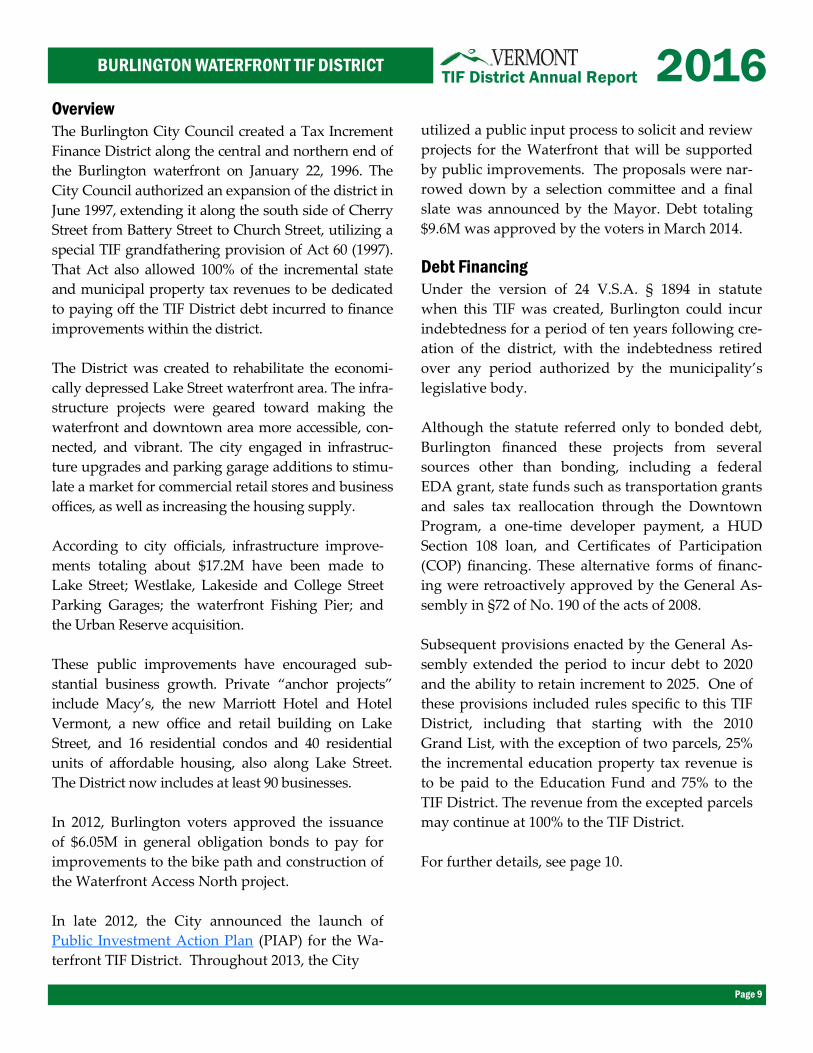
Overview
The Burlington City Council created a Tax Increment
Finance District along the central and northern end of
the Burlington waterfront on January 22, 1996. The
City Council authorized an expansion of the district in
June 1997, extending it along the south side of Cherry
Street from Battery Street to Church Street, utilizing a
special TIF grandfathering provision of Act 60 (1997).
That Act also allowed 100% of the incremental state
and municipal property tax revenues to be dedicated
to paying off the TIF District debt incurred to finance
improvements within the district.
The District was created to rehabilitate the economi-
cally depressed Lake Street waterfront area. The infra-
structure projects were geared toward making the
waterfront and downtown area more accessible, con-
nected, and vibrant. The city engaged in infrastruc-
ture upgrades and parking garage additions to stimu-
late a market for commercial retail stores and business
offices, as well as increasing the housing supply.
According to city officials, infrastructure improve-
ments totaling about $17.2M have been made to
Lake Street; Westlake, Lakeside and College Street
Parking Garages; the waterfront Fishing Pier; and
the Urban Reserve acquisition.
These public improvements have encouraged sub-
stantial business growth. Private “anchor projects”
include Macy’s, the new Marriott Hotel and Hotel
Vermont, a new office and retail building on Lake
Street, and 16 residential condos and 40 residential
units of affordable housing, also along Lake Street.
The District now includes at least 90 businesses.
In 2012, Burlington voters approved the issuance
of $6.05M in general obligation bonds to pay for
improvements to the bike path and construction of
the Waterfront Access North project.
In late 2012, the City announced the launch of
Public Investment Action Plan (PIAP) for the Wa-
terfront TIF District. Throughout 2013, the City
utilized a public input process to solicit and review
projects for the Waterfront that will be supported
by public improvements. The proposals were nar-
rowed down by a selection committee and a final
slate was announced by the Mayor. Debt totaling
$9.6M was approved by the voters in March 2014.
Debt Financing
Under the version of 24 V.S.A. § 1894 in statute
when this TIF was created, Burlington could incur
indebtedness for a period of ten years following cre-
ation of the district, with the indebtedness retired
over any period authorized by the municipality’s
legislative body.
Although the statute referred only to bonded debt,
Burlington financed these projects from several
sources other than bonding, including a federal
EDA grant, state funds such as transportation grants
and sales tax reallocation through the Downtown
Program, a one-time developer payment, a HUD
Section 108 loan, and Certificates of Participation
(COP) financing. These alternative forms of financ-
ing were retroactively approved by the General As-
sembly in §72 of No. 190 of the acts of 2008.
Subsequent provisions enacted by the General As-
sembly extended the period to incur debt to 2020
and the ability to retain increment to 2025. One of
these provisions included rules specific to this TIF
District, including that starting with the 2010
Grand List, with the exception of two parcels, 25%
the incremental education property tax revenue is
to be paid to the Education Fund and 75% to the
TIF District. The revenue from the excepted parcels
may continue at 100% to the TIF District.
For further details, see page 10.
BURLINGTON WATERFRONT TIF DISTRICT

TIF District Annual Report 2016
Page 10
BURLINGTON WATERFRONT TIF DISTRICT
Data Summary Table
Year Created: 1997
Base (OTV) Year 1997
Duration: Orig. 2007; Extended by General Assembly to 2025
Type: Pre Act 60; Use of Ed. Prop. Tax Grandfathered by Act 60
Date of Initial Indebtedness: 1999
First Year Increment Retained: 2002
Split of Increment: TIF/Ed Fund; TIF/Municipal General Fund (%): Pre 2010: 100/0; 100/0
2010 and beyond: 75/25 (Except 2 parcels 100/0); 100/0
COMPARISON TO ENTIRE MUNICIPALITY TIF Municipality % of Municipality
Acres 73 7,058 1.03%
Parcels 50 10,070 0.50%
Base Taxable Value (OTV) $42,412,900 $1,627,443,400 2.61%
PROFILE: BURLINGTON WATERFRONT
TIF District Annual Report 2016
Page 11
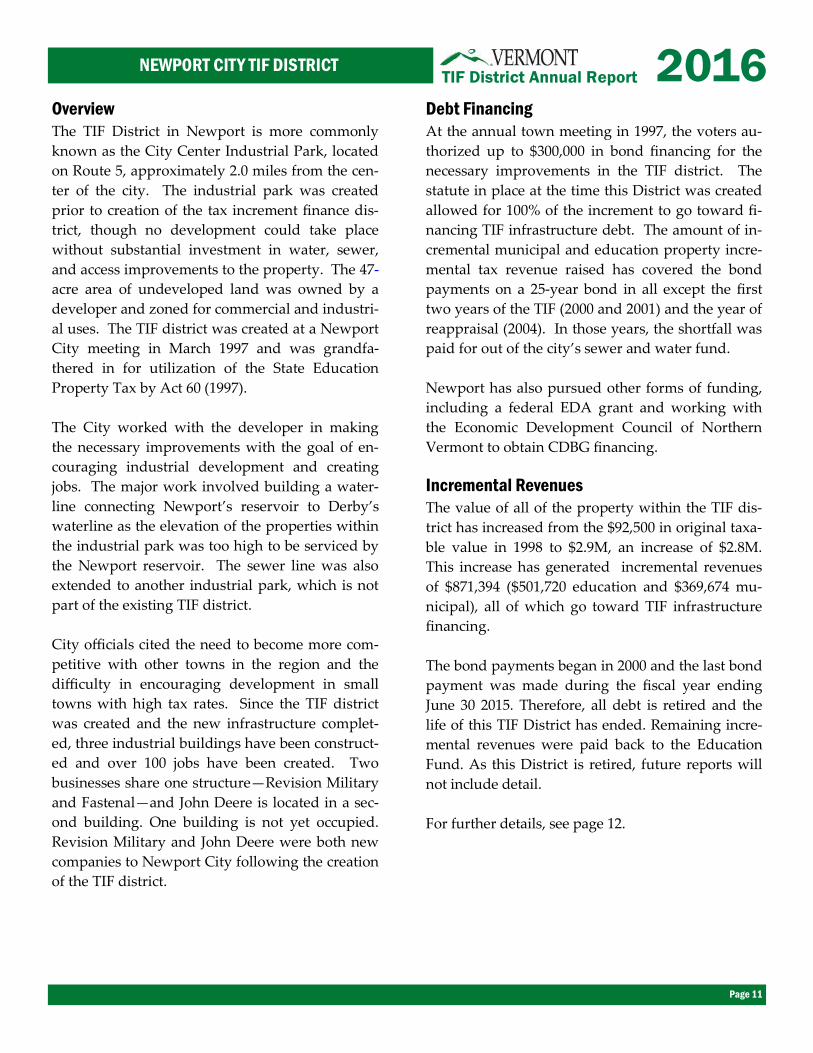
Overview
The TIF District in Newport is more commonly
known as the City Center Industrial Park, located
on Route 5, approximately 2.0 miles from the cen-
ter of the city. The industrial park was created
prior to creation of the tax increment finance dis-
trict, though no development could take place
without substantial investment in water, sewer,
and access improvements to the property. The 47-
acre area of undeveloped land was owned by a
developer and zoned for commercial and industri-
al uses. The TIF district was created at a Newport
City meeting in March 1997 and was grandfa-
thered in for utilization of the State Education
Property Tax by Act 60 (1997).
The City worked with the developer in making
the necessary improvements with the goal of en-
couraging industrial development and creating
jobs. The major work involved building a water-
line connecting Newport’s reservoir to Derby’s
waterline as the elevation of the properties within
the industrial park was too high to be serviced by
the Newport reservoir. The sewer line was also
extended to another industrial park, which is not
part of the existing TIF district.
City officials cited the need to become more com-
petitive with other towns in the region and the
difficulty in encouraging development in small
towns with high tax rates. Since the TIF district
was created and the new infrastructure complet-
ed, three industrial buildings have been construct-
ed and over 100 jobs have been created. Two
businesses share one structure—Revision Military
and Fastenal—and John Deere is located in a sec-
ond building. One building is not yet occupied.
Revision Military and John Deere were both new
companies to Newport City following the creation
of the TIF district.
Debt Financing
At the annual town meeting in 1997, the voters au-
thorized up to $300,000 in bond financing for the
necessary improvements in the TIF district. The
statute in place at the time this District was created
allowed for 100% of the increment to go toward fi-
nancing TIF infrastructure debt. The amount of in-
cremental municipal and education property incre-
mental tax revenue raised has covered the bond
payments on a 25-year bond in all except the first
two years of the TIF (2000 and 2001) and the year of
reappraisal (2004). In those years, the shortfall was
paid for out of the city’s sewer and water fund.
Newport has also pursued other forms of funding,
including a federal EDA grant and working with
the Economic Development Council of Northern
Vermont to obtain CDBG financing.
Incremental Revenues
The value of all of the property within the TIF dis-
trict has increased from the $92,500 in original taxa-
ble value in 1998 to $2.9M, an increase of $2.8M.
This increase has generated incremental revenues
of $871,394 ($501,720 education and $369,674 mu-
nicipal), all of which go toward TIF infrastructure
financing.
The bond payments began in 2000 and the last bond
payment was made during the fiscal year ending
June 30 2015. Therefore, all debt is retired and the
life of this TIF District has ended. Remaining incre-
mental revenues were paid back to the Education
Fund. As this District is retired, future reports will
not include detail.
For further details, see page 12.
NEWPORT CITY TIF DISTRICT

TIF District Annual Report 2016
Page 12
NEWPORT CITY TIF DISTRICT
Data Summary Table
Year Created: 1998
Base (OTV) Year 1998
Duration: Until Debt Paid - 2015
Type: Pre Act 60; Use of Ed. Prop. Tax Grandfathered by Act 60
Date of Initial Indebtedness: 1999
First Year Increment Retained: 2001Split of Increment: TIF/Ed Fund and TIF/Municipal General Fund (%): 100/0 100/0
COMPARISON TO ENTIRE MUNICIPALITY TIF Municipality % of Municipality
Acres 47 38,400 0.12%
Parcels 19 1,973 0.96%
Base Taxable Value (OTV) $48,500 $172,984,300 0.028%
PROFILE: NEWPORT

TIF District Annual Report 2016
Page 13
Overview
Winooski had worked on a variety of redevelop-
ment plans, and in 1999, the city began to outline a
downtown revitalization plan that envisioned
mixed use development in the historic downtown
area, which incorporated principles of smart
growth. The Winooski TIF District was authorized
in special legislation, which deemed that the rede-
velopment and rehabilitation of the Champlain
Mill area had significant public benefits and there-
fore should be granted the means to finance vari-
ous improvements (Act 159, 2000).
Winooski voters approved the creation of the dis-
trict in November 2000, but the entire project was
delayed the following year by the events of 9/11,
which made it difficult to find developers to part-
ner with the project. Work did not begin in earnest
until 2004, when the City began working with an
out-of state developer.
In order to carry out its plans after receiving legis-
lative authorization, the city, in partnership with
Winooski Community Development Corporation,
purchased some property and acquired other par-
cels through condemnation. Improvements were
made both within the district and outside the area,
including expansion of sewer and water, rebuild-
ing roads and sidewalks, work on the electrical
substation and removing all overhead wires, in-
stalling traffic control devices, and reconfiguring
the Main Street/E. Allen Street intersection.
At the center of the downtown revitalization plan
are several housing projects—Keen’s Crossing, The
Cascades riverfront condominiums, and Spinner
Place, which contains student housing for UVM
and Champlain College. The repositioning of the
Champlain Mill away from a retail focus to the
new headquarters of digital solutions provider
MyWebGrocer was intended to spur new growth,
and a new building for the Vermont Student Assis-
tance Corporation retained an important employer.
In addition, a large municipal parking garage was
built, which also houses commercial and retail
space. More than 100 acres of public open space are
also retained. The results to-date have been modi-
fied significantly from what was originally envi-
sioned because of the changing economic situation
and the need for private developers to assist in a
portion of the plan.
Debt Financing
The legislation specified the types and terms of
debt, citing only bonding and the use of incremen-
tal education tax revenues for a maximum of 20
years. It also specified that 100% of municipal in-
cremental taxes on parcels within the district be
“pledged and appropriated solely for debt service
on the bonds.” Another provision of Act 159 re-
quired that “5 percent of the education taxes im-
posed annually on the excess valuation of the resi-
dential property within the district” be paid to the
Education Fund, but this was amended in 2008 to
be 2% of the total value.
Winooski has incurred TIF debt totaling $30M
(principal only) and began making debt service
payments in 2006, when a HUD Section 108 loan
for $24.3M was retired through refinancing. About
$21M in principal debt remains. The city also re-
ceived state funds granted through the sales tax re-
allocation program administered by the Downtown
Board, although not as much as initially anticipat-
ed.
For further details, see page 14.
WINOOSKI TIF DISTRICT
TIF District Annual Report 2016
Page 14
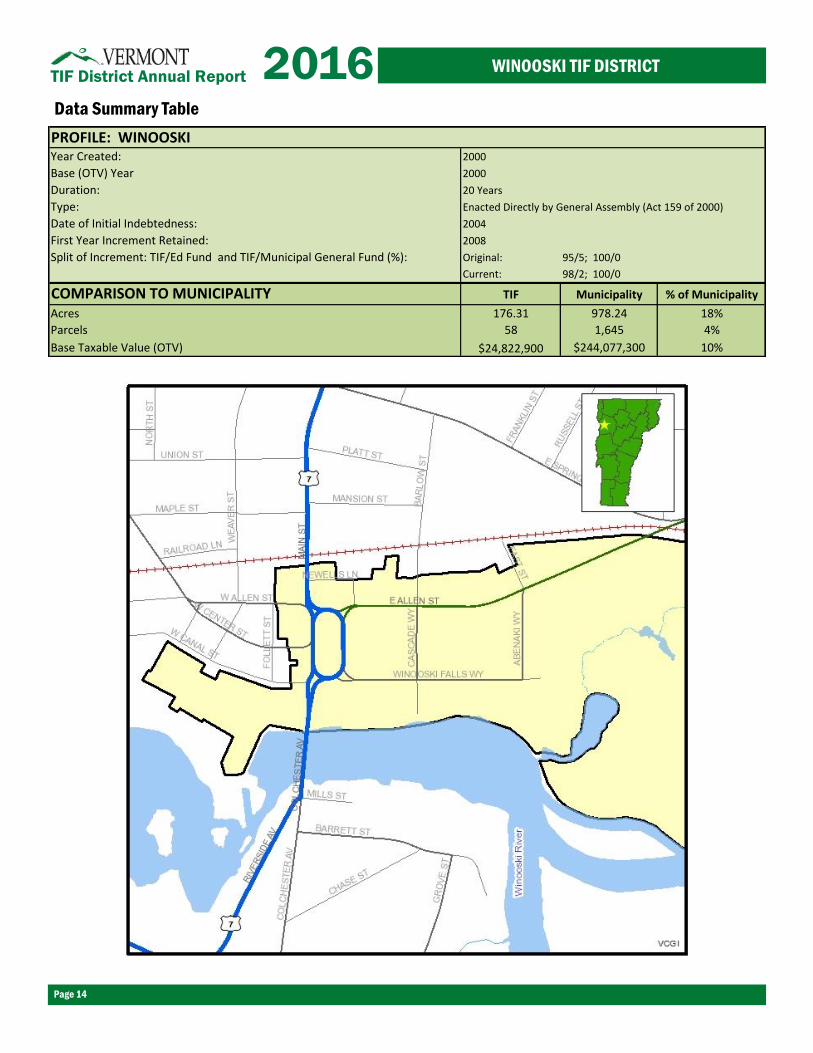
WINOOSKI TIF DISTRICT
Data Summary Table
Year Created: 2000
Base (OTV) Year 2000
Duration: 20 Years
Type: Enacted Directly by General Assembly (Act 159 of 2000)
Date of Initial Indebtedness: 2004
First Year Increment Retained: 2008
Split of Increment: TIF/Ed Fund and TIF/Municipal General Fund (%): Original: 95/5; 100/0
Current: 98/2; 100/0
COMPARISON TO MUNICIPALITY TIF Municipality % of Municipality
Acres 176.31 978.24 18%
Parcels 58 1,645 4%
Base Taxable Value (OTV) $24,822,900 $244,077,300 10%
PROFILE: WINOOSKI

TIF District Annual Report 2016
Page 15
Overview
The Milton North/South TIF Districts were the first
and only Districts authorized by the Vermont Eco-
nomic Progress Council (VEPC) as part of the Eco-
nomic Advancement Tax Incentive (EATI) program
(Act 71). Approved by the Milton select board in
March 1998 and VEPC in November 1998, the Mil-
ton North/South TIF Districts actually represent
two separate, non-contiguous areas: the Catamount
TIF (South) was created around the existing Cata-
mount Industrial Park with TIF financing intended
to improve the infrastructure so that additional
growth could take place within the industrial park;
and the Husky TIF (North), created to encourage
Husky Injection Molding Systems to develop a cor-
porate campus at the north end of Milton. The two
TIF Districts were approved through one applica-
tion to VEPC. Since the creation of the Districts, the
municipality has treated the Districts as one, and in
2011, the General Assembly enacted a retroactive
provision that allowed Milton to treat the two Dis-
tricts as a single district for purposes of accounting
and reporting requirements (§15b, Act 45,, 2011).
The statute in force at the time allowed Milton to
retain 100% of the incremental education tax reve-
nues to pay for improvements for a period of ten
years.
Debt Financing
The original plan for these TIF Districts anticipated
public infrastructure totaling $27.3M, including
$9.5M for wastewater treatment capacity and col-
lection expansion, $14M in highway improvements,
and $3.8M for water system and fire safety. The
town anticipated that about $12M of the infrastruc-
ture costs would be financed with TIF revenues.
The town planned to pursue state and federal
grants and payments from Husky for the balance.
The town encountered a number of difficulties that
delayed projects and increased costs, including de-
mands for a wastewater plant rather than a smaller
impact decentralized system, increased wastewater
connection fees, and permitting delays. Total cost
for the wastewater project alone grew to an estimat-
ed $17.3M. Because of these delays and the eco-
nomic downturn that caused a smaller-than-
planned build-out by Husky, infrastructure pro-
jects started very late, some infrastructure projects
were cancelled, and expected increments were not
realized.
Nearing the end of the original TIF revenue reten-
tion period, the wastewater treatment project was
completed, but had over $15M in outstanding debt,
the water connections were completed, some of the
transportation projects were completed and about
$6M in debt remained. All fire and safety improve-
ments were made with no remaining debt.
The value of the properties within the TIF Districts
had increased by only $36M compared to the
$100M increase expected.
In 2006, the legislature enacted special provisions
(§2j, Act 184, 2006; amended by §68, Act 190, 2008)
allowing the Milton North/South TIF Districts to be
extended for an additional ten years.
Among other changes, this legislation limited the
utilization of education property taxes to 75% of
the incremental revenues generated to finance
improvements that serve the District and required
that an equal or greater proportion of the municipal
increment go to finance the TIF debt. The applica-
tion was submitted on March 26, 2009, extending
the ability for Milton to incur debt and retain incre-
mental property tax revenue for the Milton North/
South TIF Districts until March 31, 2019.
Further details, see Page 16.
MILTON NORTH/SOUTH TIF DISTRICT

TIF District Annual Report 2016
Page 16
MILTON NORTH/SOUTH TIF DISTRICT
Data Summary Table
Year Created By Municipality: 1998
Base (OTV) Year 1998
Duration:
Type:
Date of Initial Indebtedness: 1999
First Year Increment Retained: 1999
Split of Increment: TIF/Ed Fund; TIF/Mun. Gen. Fund (%): Original: 100/0; 100/0
As of 2010: 75/25; 75/25
COMPARISON TO ENTIRE MUNICIPALITY TIF Municipality % of Municipality
Acres 1,029 38,976 2.640%
Parcels 63 3,788 1.663%
Base Taxable Value (OTV) $26,911,151 $441,647,484 6.093%
PROFILE: MILTON NORTH/SOUTH
Education Property Tax Utilization Authorized by VEPC under EATI
Program (32 VSA 5401(10)(E))
Original 10 Years (1999-2009); Extended by General Assembly to
20 Years (1999-2019)

TIF District Annual Report 2016
Page 17
Overview
In April 2008, the Town of Milton created a Tax
Increment Financing District, known as the
“Milton Town Core TIF District,” that is essential-
ly a corridor along Route 7 starting from the area
east of the south end of Lake Arrowhead, west
along Main Street, south along Route 7 through
the downtown area, west along Route 7 to Inter-
state 89 and to include an area on the east side of
Interstate 89. In December 2008, Milton submitted
the first application to the Vermont Economic Pro-
gress Council pursuant to the new statutory
changes for TIF District approvals enacted in 2006
(Act 184). In April 2009, VEPC gave conditional
approval to the Milton Town Core TIF District
Plan.
In 2009, the General Assembly enacted several
amendments to the TIF District statute that ap-
plied to only the Milton Town Core TIF District
(See §82 of Act 54, 2009). Under these provisions,
this TIF district operates under slightly different
rules than the other Districts created after 2006.
In March 2011 Milton submitted, and in April
2011 VEPC gave final approval to, the TIF District
Plan, and approved a TIF Financing Plan, for the
Milton Town Core TIF District.
As given final approval, the District includes ap-
proximately 668 parcels (15.5% of Milton total)
encompassing about 903 acres (2.3% of Milton to-
tal land acreage). The total base taxable value
(OTV) of the District was $124M. This value rep-
resents about 13% of the total municipal taxable
value.
The infrastructure improvements, started in 2011,
will total about $23.7M and include: the expansion
of a wastewater collection system ($3.7M); a water
system loop ($150,000); and various transportation
improvements ($20M), including new roads, inter-
section improvements, street reconstruction, new
sidewalks, street lighting, and transportation im-
provements to enhance vehicular and pedestrian
safety.
Milton expects to secure about $4M in federal
highway grants. Because VEPC set the propor-
tionality of certain transportation projects below
100%, the town will also need to find non-TIF rev-
enue to cover about $808,000 in infrastructure
costs. Therefore, the total infrastructure costs to
be financed by TIF revenue, including the cost of
financing, is estimated to be $32.1M.
The projected real property development included
all types of residential units, commercial develop-
ment including an ice rink, retail storefronts, a
small amount of light industrial, and some indus-
trial development.
Debt Financing
The base value of the TIF District (OTV) was
$124M. The projected value after the infrastructure
improvements and redevelopment is $251M, for a
$126M incremental value. Milton estimates the
generation of $45.7M in incremental property taxes
during the 20 year TIF District retention period
(2011-2031): $10M in municipal property taxes, with
$2.5M (25%) going to the Milton municipal general
fund and $7.4M (75%) going to TIF debt; and
$35.8M in education property tax revenues, with
$9M (25%) going to the education fund and $26.8M
(75%) to the TIF debt. This raises an estimated total
of $34.3M in TIF revenues to retire the TIF debt.
At the end of the retention period, an estimated
$1.9M in additional tax revenue will be generated
each year because of the new development.
For more detail, see page 18.
MILTON TOWN CORE TIF DISTRICT

TIF District Annual Report 2016
Page 18
MILTON TOWN CORE TIF DISTRICT
Data Summary Table
Date Created By Municipality: September 15, 2008
Effective TIF District Creation Date: April 1, 2008
Base (OTV) Year: 2009
Duration: Until All Debt Retired
Type:
Date TIF District Plan Approved by VEPC: April 30, 2009
Date TIF Financing Plan Approved by VEPC: May 25, 2011
Date of Initial Indebtedness: March 2011
First Year Incremental Revenue Retained: 2011
20 Year Increment Retention Period: 2011-2031
Split of Increment: TIF/Ed Fund and TIF/Municipal General Fund (%): Ed Fund: 75/25 Municipal: 75/25
COMPARISON TO ENTIRE MUNICIPALITY TIF Municipality % of Municipality
Acres 903 38,976 2%
Parcels 668 4,308 16%
Base Taxable Value (OTV) $124,186,560 950,893,000$ 13%
PROFILE: MILTON TOWN CORE
VEPC under TIF Authority 32 VSA 5404a(h)

TIF District Annual Report 2016
Page 19
Overview On February 7, 2011, the City of Burlington created
a Tax Increment Financing District that roughly
corresponds to, and is completely within, the
boundaries of a Designated Downtown that was
originally approved by the State of Vermont in
1998.
The TIF District is approximately 63 acres (0.9% of
Burlington total), includes 245 parcels (2.27% of to-
tal Burlington parcels), and represents $309,672,300
in total appraised value (2011), of which 204 parcels
with a value of $170,781,400 are taxable (about 5%
of total Burlington taxable value).
On March 4, 2011 Burlington submitted and on
June 23, 2011, VEPC approved a TIF District Plan
and conditionally-approved a TIF Financing Plan
for the Burlington Downtown TIF District.
Depending on the timing of the expected private
sector developments, the potential public infra-
structure improvements that would serve the TIF
District could include structured parking, utility
upgrades and renovations, side street improve-
ments, and streetscape improvements.
Total infrastructure costs are estimated at $33.4M.
Total debt is estimated at $47M, including financing
and related costs.
Several projected private sector development
projects, in varying stages of permitting, develop-
ment, and conceptual design, address the core
purposes of Burlington’s TIF District Plan, and are
consistent with and further the goals of City and
regional plans. In addition to these anticipated
projects there may be other projects yet to be iden-
tified that may also be appropriate for public fi-
nancial participation.
Debt Financing The base value of the properties in the TIF District
is $170M. The estimated assessed value after the
infrastructure improvements and development is
$252M, for an $82M incremental value. Burlington
estimates the generation of $62M in incremental
property taxes during the 20-year retention period.
The applicant proposed and VEPC approved a
75%/25% share of the incremental revenues. This
split will allow $11.8M of the increment to accrue to
the Education Fund and $3.6M of the increment to
go to the municipal general fund. A total of $46.5M
would go to finance the TIF District debt ($35.4M
from incremental education revenues and $11.1M
from incremental municipal revenues).
During the TIF retention period, a total of $64M in
education property tax revenue (from the base and
25% of the increment) will accrue to the Education
Fund. At the end of the retention period, an esti-
mated $1.7M in additional tax revenue will be gen-
erated each year because of the new development.
Incremental Revenues Under the statute in effect for this TIF District, the
city will retain incremental property tax revenues
for 20 years beginning with the year in which the
first TIF infrastructure debt is incurred. The City
anticipates incurring first debt in 2016.
For more detail, see page 20.
BURLINGTON DOWNTOWN TIF DISTRICT

TIF District Annual Report 2016
Page 20
BURLINGTON DOWNTOWN TIF DISTRICT
Data Summary Table
Date Created By Municipality: February 7, 2011
Effective TIF District Creation Date: April 1, 2011
Base (OTV) Year: 2011
Duration: Until All Debt Retired
Type:
Date TIF District Plan Approved by VEPC: June 23, 2011
Date TIF Financing Plan Approved by VEPC: June 23, 2011
Date of Initial Indebtedness: No Debt Yet Incurred (expected in early 2016)
First Year Increment Retained: No Increment Retained Until Debt Incurred
20 Year Increment Retention Period Not Yet Determined
Split of Increment: TIF/Ed Fund; TIF/Municipal General Fund (%): Education Fund: 75/25; Municipal General Fund: 75/25
COMPARISON TO ENTIRE MUNICIPALITY TIF Municipality % of Municipality
Acres 63 6,874 0.92%
Parcels 245 10,785 2.27%
Base Taxable Value (OTV) $170,006,600 $3,393,140,000 5.01%
PROFILE: BURLINGTON DOWNTOWN
VEPC under TIF Authority 32 VSA 5404a(h)
TIF District Annual Report 2016
Page 21
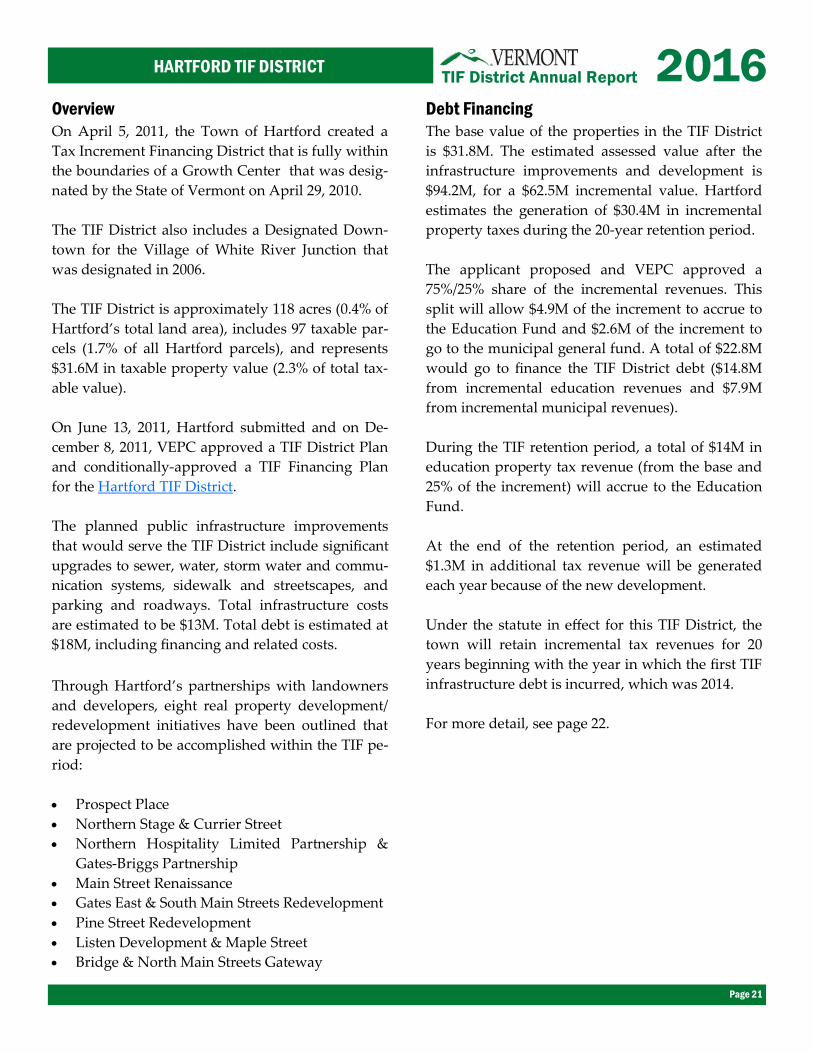
Overview
On April 5, 2011, the Town of Hartford created a
Tax Increment Financing District that is fully within
the boundaries of a Growth Center that was desig-
nated by the State of Vermont on April 29, 2010.
The TIF District also includes a Designated Down-
town for the Village of White River Junction that
was designated in 2006.
The TIF District is approximately 118 acres (0.4% of
Hartford’s total land area), includes 97 taxable par-
cels (1.7% of all Hartford parcels), and represents
$31.6M in taxable property value (2.3% of total tax-
able value).
On June 13, 2011, Hartford submitted and on De-
cember 8, 2011, VEPC approved a TIF District Plan
and conditionally-approved a TIF Financing Plan
for the Hartford TIF District.
The planned public infrastructure improvements
that would serve the TIF District include significant
upgrades to sewer, water, storm water and commu-
nication systems, sidewalk and streetscapes, and
parking and roadways. Total infrastructure costs
are estimated to be $13M. Total debt is estimated at
$18M, including financing and related costs.
Through Hartford’s partnerships with landowners
and developers, eight real property development/
redevelopment initiatives have been outlined that
are projected to be accomplished within the TIF pe-
riod:
Prospect Place
Northern Stage & Currier Street
Northern Hospitality Limited Partnership &
Gates-Briggs Partnership
Main Street Renaissance
Pine Street Redevelopment
Listen Development & Maple Street
Bridge & North Main Streets Gateway
Debt Financing
The base value of the properties in the TIF District
is $31.8M. The estimated assessed value after the
infrastructure improvements and development is
$94.2M, for a $62.5M incremental value. Hartford
estimates the generation of $30.4M in incremental
property taxes during the 20-year retention period.
The applicant proposed and VEPC approved a
75%/25% share of the incremental revenues. This
split will allow $4.9M of the increment to accrue to
the Education Fund and $2.6M of the increment to
go to the municipal general fund. A total of $22.8M
would go to finance the TIF District debt ($14.8M
from incremental education revenues and $7.9M
from incremental municipal revenues).
During the TIF retention period, a total of $14M in
education property tax revenue (from the base and
25% of the increment) will accrue to the Education
Fund.
At the end of the retention period, an estimated
$1.3M in additional tax revenue will be generated
each year because of the new development.
Under the statute in effect for this TIF District, the
town will retain incremental tax revenues for 20
years beginning with the year in which the first TIF
infrastructure debt is incurred, which was 2014.
For more detail, see page 22.
HARTFORD TIF DISTRICT

TIF District Annual Report 2016
Page 22
HARTFORD TIF DISTRICT
Data Summary Table
Date Created By Municipality: April 5, 2011
Effective TIF District Creation Date: April 1, 2011
Base (OTV) Year: 2011
Duration: Until AlL Debt Retired
Type:
Date TIF District Plan Approved by VEPC: December 8, 2011
Date TIF Financing Plan Approved by VEPC: December 8, 2011
Date of Initial Indebtedness: July 31, 2014
First Year Increment Retained: April 1, 2014
20 Year Increment Retention Period 2014-2034
Split of Increment: TIF/Municipal General Fund; TIF/Ed Fund (%): Education Fund:75/25; Municipal General Fund: 75/25
COMPARISON TO ENTIRE MUNICIPALITY TIF Municipality % of Municipality
Acres 118.45 29,434 0.40%
Parcels 97 5,449 1.78%
Base Taxable Value (OTV) $31,799,200 $1,381,367,300 2.30%
PROFILE: HARTFORD
VEPC under TIF Authority 32 VSA 5404a(h) Effective July 2006
TIF District Annual Report 2016
Page 23
ST. ALBANS CITY DOWNTOWN TIF DISTRICT
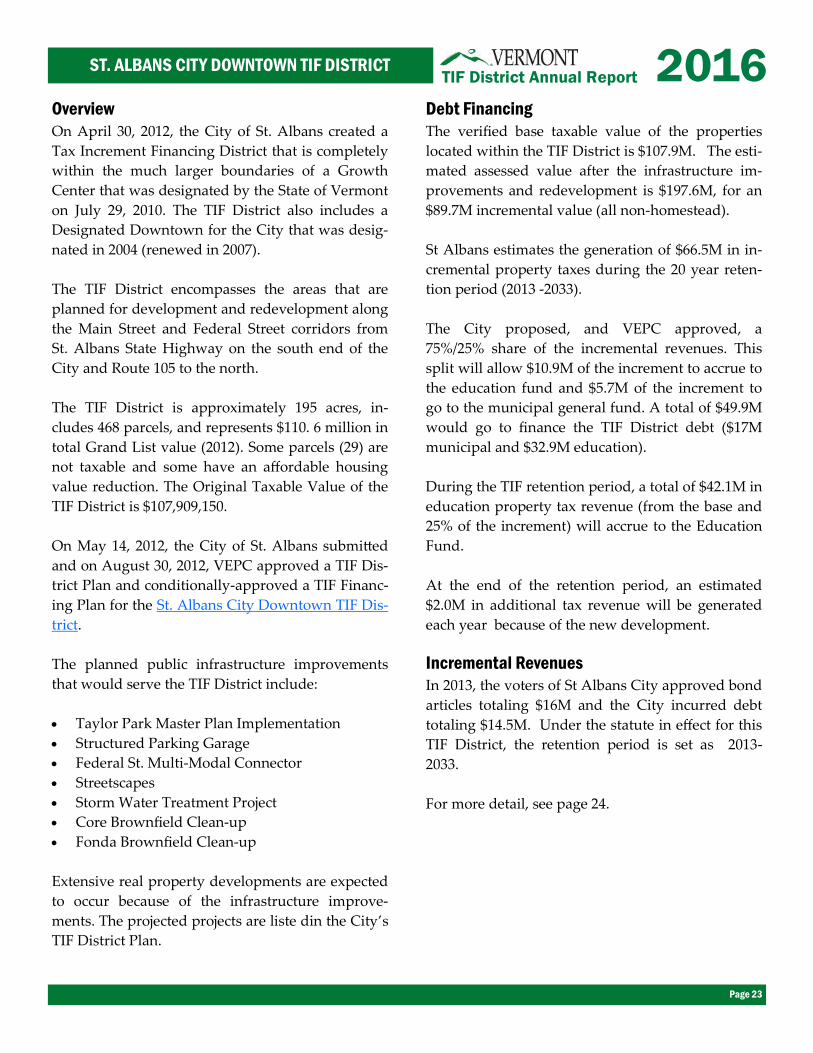
Overview
On April 30, 2012, the City of St. Albans created a
Tax Increment Financing District that is completely
within the much larger boundaries of a Growth
Center that was designated by the State of Vermont
on July 29, 2010. The TIF District also includes a
Designated Downtown for the City that was desig-
nated in 2004 (renewed in 2007).
The TIF District encompasses the areas that are
planned for development and redevelopment along
the Main Street and Federal Street corridors from
St. Albans State Highway on the south end of the
City and Route 105 to the north.
The TIF District is approximately 195 acres, in-
cludes 468 parcels, and represents $110. 6 million in
total Grand List value (2012). Some parcels (29) are
not taxable and some have an affordable housing
value reduction. The Original Taxable Value of the
TIF District is $107,909,150.
On May 14, 2012, the City of St. Albans submitted
and on August 30, 2012, VEPC approved a TIF Dis-
trict Plan and conditionally-approved a TIF Financ-
ing Plan for the St. Albans City Downtown TIF Dis-
trict.
The planned public infrastructure improvements
that would serve the TIF District include:
Taylor Park Master Plan Implementation
Structured Parking Garage Federal St. Multi-Modal Connector
Streetscapes
Storm Water Treatment Project
Core Brownfield Clean-up
Fonda Brownfield Clean-up
Extensive real property developments are expected
to occur because of the infrastructure improve-
ments. The projected projects are liste din the City’s
TIF District Plan.
Debt Financing
The verified base taxable value of the properties
located within the TIF District is $107.9M. The esti-
mated assessed value after the infrastructure im-
provements and redevelopment is $197.6M, for an
$89.7M incremental value (all non-homestead).
St Albans estimates the generation of $66.5M in in-
cremental property taxes during the 20 year reten-
tion period (2013 -2033).
The City proposed, and VEPC approved, a
75%/25% share of the incremental revenues. This
split will allow $10.9M of the increment to accrue to
the education fund and $5.7M of the increment to
go to the municipal general fund. A total of $49.9M
would go to finance the TIF District debt ($17M
municipal and $32.9M education).
During the TIF retention period, a total of $42.1M in
education property tax revenue (from the base and
25% of the increment) will accrue to the Education
Fund.
At the end of the retention period, an estimated
$2.0M in additional tax revenue will be generated
each year because of the new development.
Incremental Revenues
In 2013, the voters of St Albans City approved bond
articles totaling $16M and the City incurred debt
totaling $14.5M. Under the statute in effect for this
TIF District, the retention period is set as 2013-
2033.
For more detail, see page 24.
TIF District Annual Report 2016
Page 24
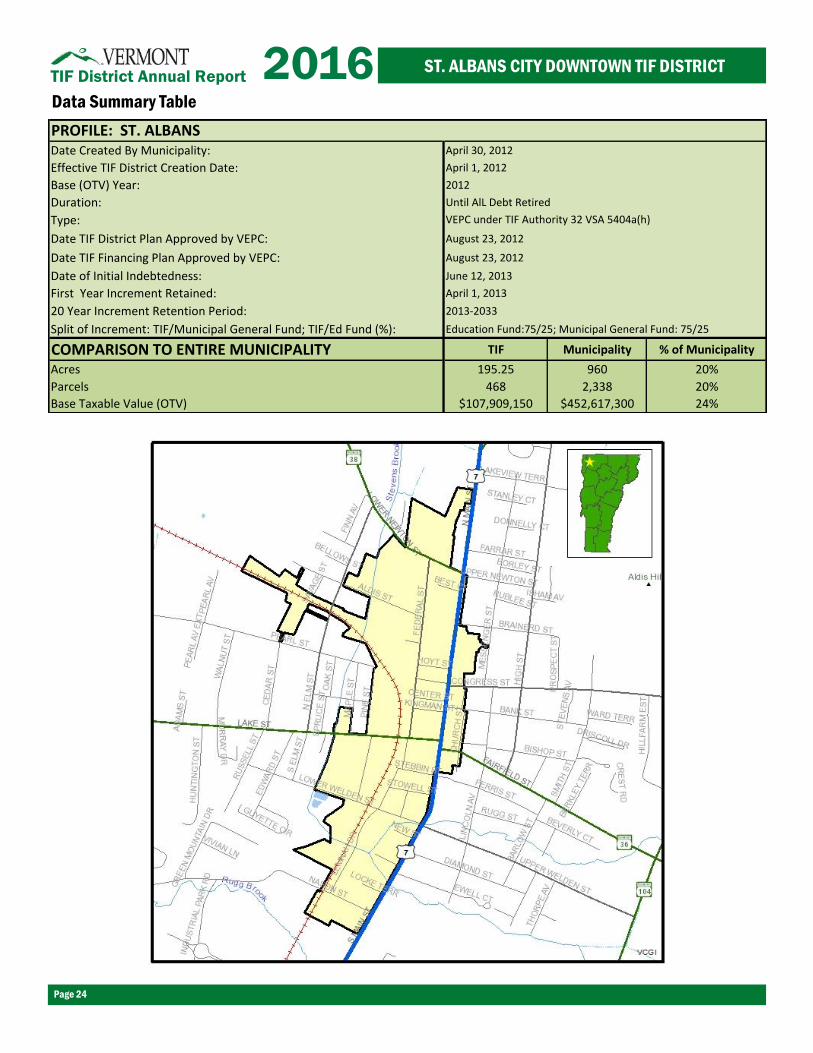
ST. ALBANS CITY DOWNTOWN TIF DISTRICT
Data Summary Table
Date Created By Municipality: April 30, 2012
Effective TIF District Creation Date: April 1, 2012
Base (OTV) Year: 2012
Duration: Until AlL Debt Retired
Type:
Date TIF District Plan Approved by VEPC: August 23, 2012
Date TIF Financing Plan Approved by VEPC: August 23, 2012
Date of Initial Indebtedness: June 12, 2013
First Year Increment Retained: April 1, 2013
20 Year Increment Retention Period: 2013-2033
Split of Increment: TIF/Municipal General Fund; TIF/Ed Fund (%): Education Fund:75/25; Municipal General Fund: 75/25
COMPARISON TO ENTIRE MUNICIPALITY TIF Municipality % of Municipality
Acres 195.25 960 20%
Parcels 468 2,338 20%
Base Taxable Value (OTV) $107,909,150 $452,617,300 24%
PROFILE: ST. ALBANS
VEPC under TIF Authority 32 VSA 5404a(h)
TIF District Annual Report 2016
Page 25
BARRE CITY DOWNTOWN TIF DISTRICT
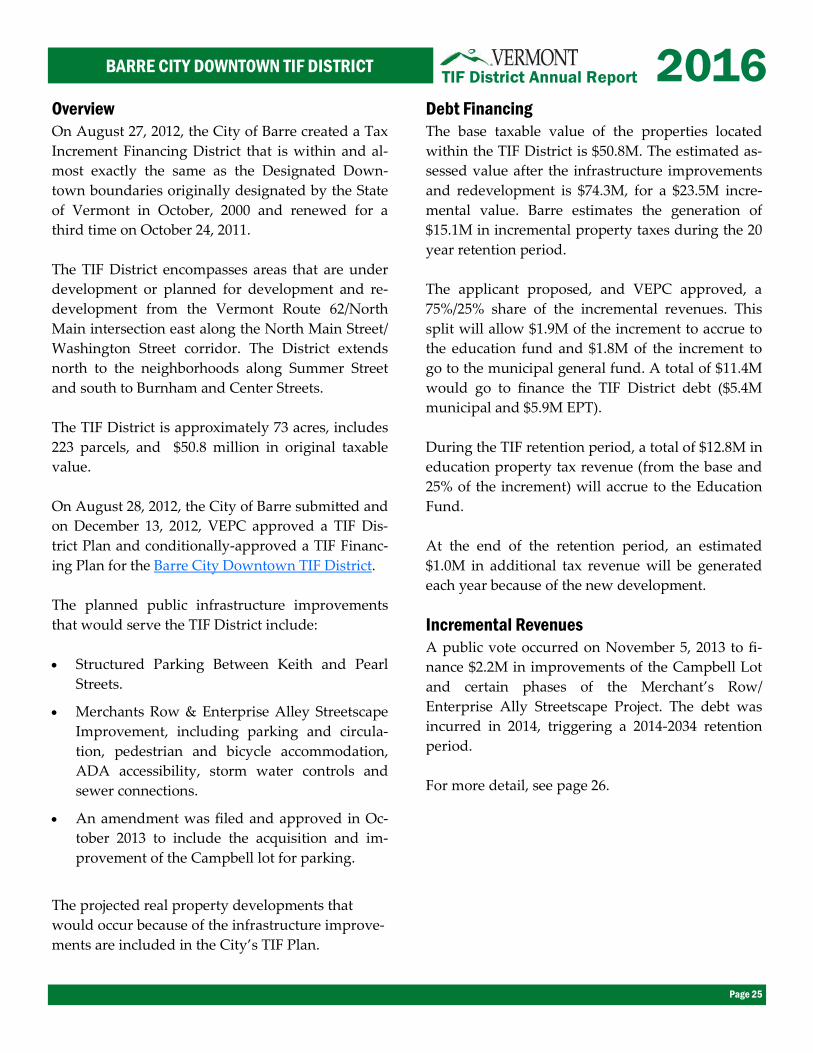
Overview
On August 27, 2012, the City of Barre created a Tax
Increment Financing District that is within and al-
most exactly the same as the Designated Down-
town boundaries originally designated by the State
of Vermont in October, 2000 and renewed for a
third time on October 24, 2011.
The TIF District encompasses areas that are under
development or planned for development and re-
development from the Vermont Route 62/North
Main intersection east along the North Main Street/
Washington Street corridor. The District extends
north to the neighborhoods along Summer Street
and south to Burnham and Center Streets.
The TIF District is approximately 73 acres, includes
223 parcels, and $50.8 million in original taxable
value.
The planned public infrastructure improvements
that would serve the TIF District include:
Structured Parking Between Keith and Pearl
Streets.
Merchants Row & Enterprise Alley Streetscape
Improvement, including parking and circula-
tion, pedestrian and bicycle accommodation,
ADA accessibility, storm water controls and
sewer connections.
An amendment was filed and approved in Oc-
tober 2013 to include the acquisition and im-
provement of the Campbell lot for parking.
The projected real property developments that
would occur because of the infrastructure improve-
ments are included in the City’s TIF Plan.
Debt Financing
The base taxable value of the properties located
within the TIF District is $50.8M. The estimated as-
sessed value after the infrastructure improvements
and redevelopment is $74.3M, for a $23.5M incre-
mental value. Barre estimates the generation of
$15.1M in incremental property taxes during the 20
year retention period.
The applicant proposed, and VEPC approved, a
75%/25% share of the incremental revenues. This
split will allow $1.9M of the increment to accrue to
the education fund and $1.8M of the increment to
go to the municipal general fund. A total of $11.4M
would go to finance the TIF District debt ($5.4M
municipal and $5.9M EPT).
During the TIF retention period, a total of $12.8M in
education property tax revenue (from the base and
25% of the increment) will accrue to the Education
Fund.
At the end of the retention period, an estimated
$1.0M in additional tax revenue will be generated
each year because of the new development.
Incremental Revenues
A public vote occurred on November 5, 2013 to fi-
nance $2.2M in improvements of the Campbell Lot
and certain phases of the Merchant’s Row/
Enterprise Ally Streetscape Project. The debt was
incurred in 2014, triggering a 2014-2034 retention
period.
For more detail, see page 26.
TIF District Annual Report 2016
Page 26
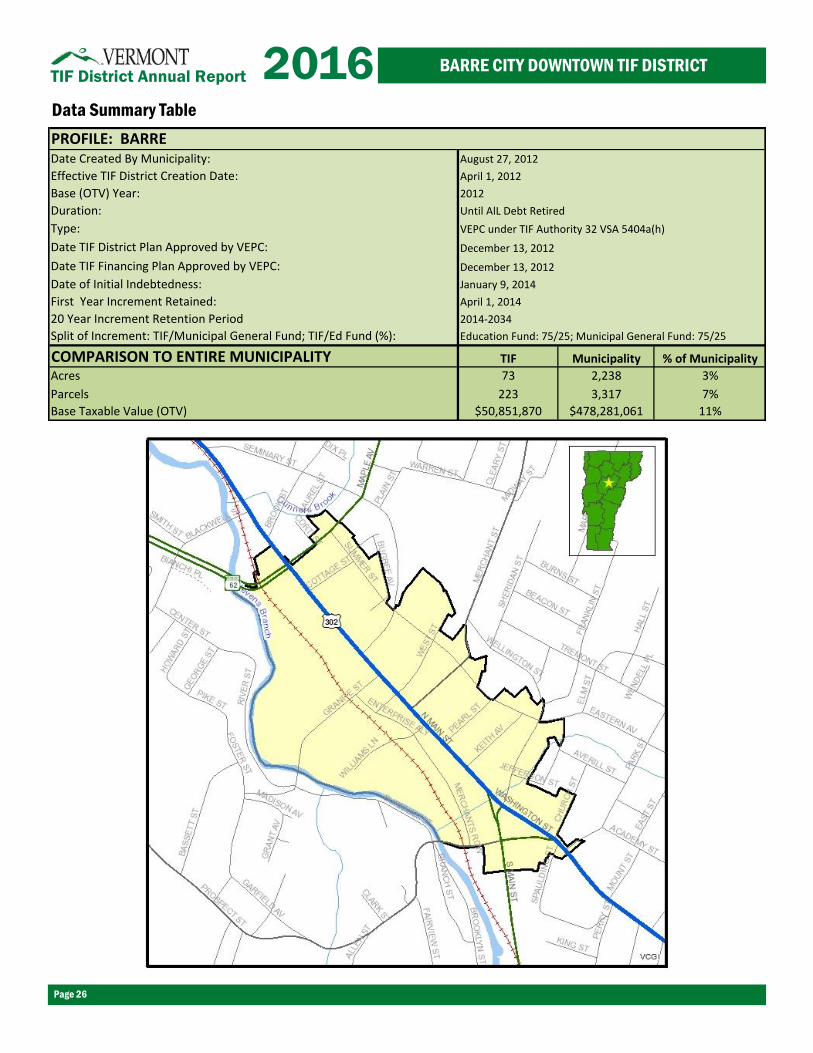
BARRE CITY DOWNTOWN TIF DISTRICT
Data Summary Table
Date Created By Municipality: August 27, 2012
Effective TIF District Creation Date: April 1, 2012
Base (OTV) Year: 2012
Duration: Until AlL Debt Retired
Type:
Date TIF District Plan Approved by VEPC: December 13, 2012
Date TIF Financing Plan Approved by VEPC: December 13, 2012
Date of Initial Indebtedness: January 9, 2014
First Year Increment Retained: April 1, 2014
20 Year Increment Retention Period 2014-2034
Split of Increment: TIF/Municipal General Fund; TIF/Ed Fund (%): Education Fund: 75/25; Municipal General Fund: 75/25
COMPARISON TO ENTIRE MUNICIPALITY TIF Municipality % of Municipality
Acres 73 2,238 3%
Parcels 223 3,317 7%
Base Taxable Value (OTV) $50,851,870 $478,281,061 11%
PROFILE: BARRE
VEPC under TIF Authority 32 VSA 5404a(h)

TIF District Annual Report 2016
Page 27
SOUTH BURLINGTON CITY CENTER TIF DISTRICT
Overview
On August 27, 2012, the City of South Burlington
created a Tax Increment Financing District that is
within and almost exactly the same as the New
Town Center boundaries originally designated by
the State of Vermont in January, 2010.
The TIF District encompasses areas that are under
development or planned for development and re-
development from Williston Road to the bottom of
San Remo Drive and from Dorset Street to Hines-
burg Road. The District includes the land expected
to be developed into the New Town Center and in-
cludes San Remo Drive.
The TIF District is approximately 106 acres, in-
cludes 57 parcels, and represents $36.3 million in
total assessed value (2013). The total original taxa-
ble value (2013) for the 55 taxable parcels is $36.2
million.
The South Burlington TIF District Plan was ap-
proved on July 25, 2013. South Burlington must file
a TIF District Finance Plan for consideration and
approval prior to a public vote to incur TIF District
Debt.
The planned public infrastructure improvements
that would serve the TIF District include:
Environmental Improvements
Place-making Improvements
Circulation Improvements
Transportation Improvements
The projected real property developments that
would occur because of the infrastructure improve-
ments are include in the City’s TIF Plan.
Debt Financing
The base taxable value of the properties located
within the TIF District is $36.2M. The estimated
assessed value after the infrastructure improve-
ments and redevelopment is $202M, for a $165.8M
incremental value. South Burlington estimates the
generation of $75M in incremental property taxes
during the 20 year retention period.
The applicant proposed, and VEPC approved, a
75%/25% share of the incremental revenues. This
split will allow $14.7M of the increment to accrue to
the education fund and $4M of the increment to go
to the municipal general fund. A total of $56.3M
would go to finance the TIF District debt ($12M
municipal and $44.2M EPT).
During the TIF retention period, a total of $25M in
education property tax revenue (from the base and
25% of the increment) will accrue to the Education
Fund. At the end of the retention period, an esti-
mated $3.0M in additional tax revenue will be gen-
erated each year because of the new development.
Incremental Revenues
Under the statute in effect for this TIF District, the
city can retain incremental tax revenues for 20 years
beginning with the year in which the first TIF infra-
structure debt is incurred. Debt cannot be incurred
until a public vote is held; and a public vote cannot
be held until a TIF District Finance Plan is sub-
mitted, considered, and approved by VEPC. The
deadline to submit a TIF District Finance Plan is
March 31, 2017.
For more detail, see page 28.

TIF District Annual Report 2016
Page 28
SOUTH BURLINGTON CITY CENTER TIF DISTRICT
Data Summary Table
Date Created By Municipality: August 27, 2012
Effective TIF District Creation Date: April 1, 2012
Base (OTV) Year: 2012
Duration: Until AlL Debt Retired
Type:
Date TIF District Plan Approved by VEPC: June 27, 2013
Date TIF Financing Plan Approved by VEPC: Has not Yet Occurred
Date of Initial Indebtedness: No Debt Yet Incurred
First Year Increment Retained: No Increment Retained Until Debt Incurred
20 Year Increment Retention Period Not Yet Determined
Split of Increment: TIF/Municipal General Fund; TIF/Ed Fund (%): Education Fund: 75/25; Municipal General Fund: 75/25
COMPARISON TO ENTIRE MUNICIPALITY TIF Municipality % of Municipality
Acres 106 10,600 1%
Parcels 57 7,359 1%
Base Taxable Value (OTV) $36,228,700 $2,798,310,471 1%
PROFILE: SOUTH BURLINGTON
VEPC under TIF Authority 32 VSA 5404a(h)

TIF District Annual Report 2016
Page 29
Fred Kenney, Executive Director
Vermont Economic Progress Council
(802) 777-8192
Contact Us:
Douglas Farnham, Director
Property Valuation and Review
Department of Taxes
(802) 828-6829
Produced in-house by the staff of the
Vermont Economic Progress Council
And Vermont Department of Taxes
Published April 2016
c. 2016 State of Vermont