Air Quality Technical Report Pellissippi Parkway Extension ...
{
2014 Survey Results Summary
Community College Survey of Student Engagement
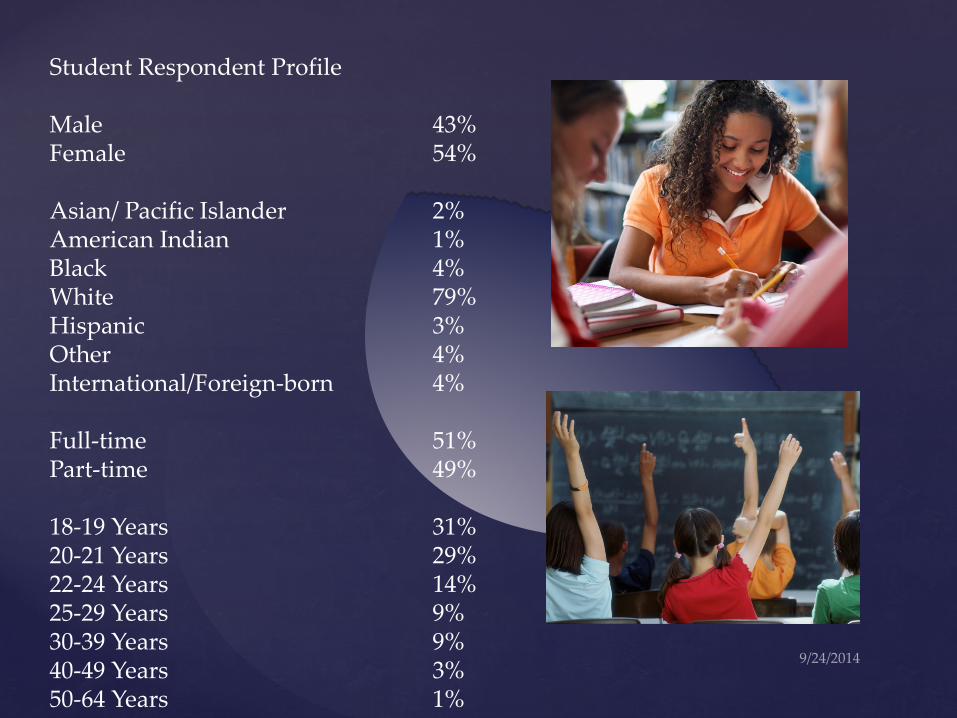
Student Respondent Profile Male 43% Female 54% Asian/ Pacific Islander 2% American Indian 1% Black 4% White 79% Hispanic 3% Other 4% International/Foreign-born 4% Full-time 51% Part-time 49% 18-19 Years 31% 20-21 Years 29% 22-24 Years 14% 25-29 Years 9% 30-39 Years 9% 40-49 Years 3% 50-64 Years 1%
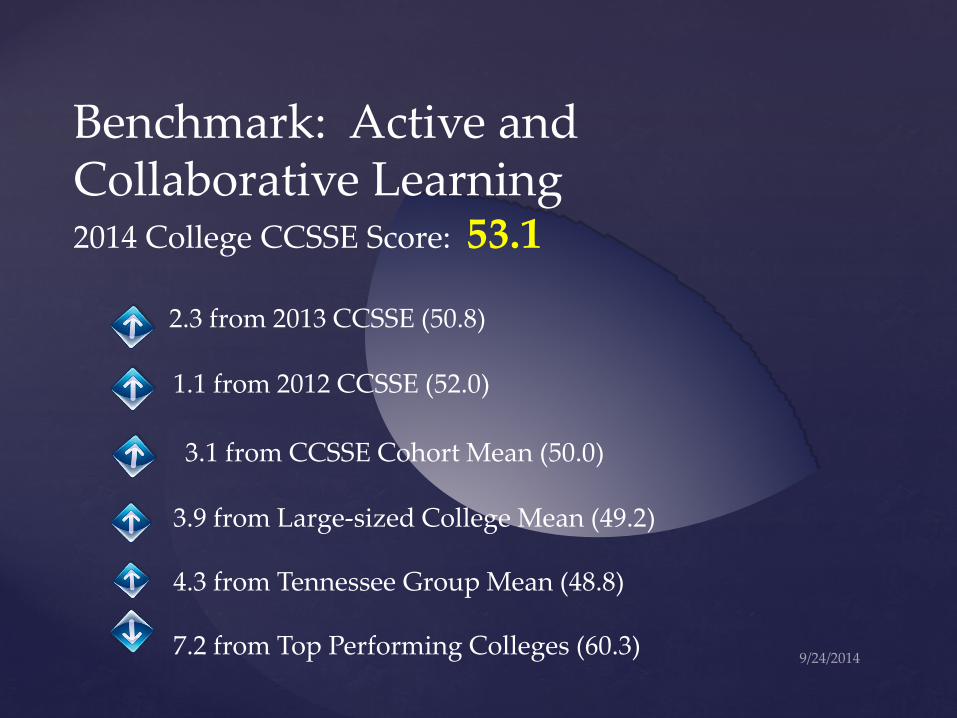
Benchmark: Active and Collaborative Learning 2014 College CCSSE Score: 53.1 2.3 from 2013 CCSSE (50.8) 1.1 from 2012 CCSSE (52.0) 3.1 from CCSSE Cohort Mean (50.0) 3.9 from Large-sized College Mean (49.2) 4.3 from Tennessee Group Mean (48.8) 7.2 from Top Performing Colleges (60.3)
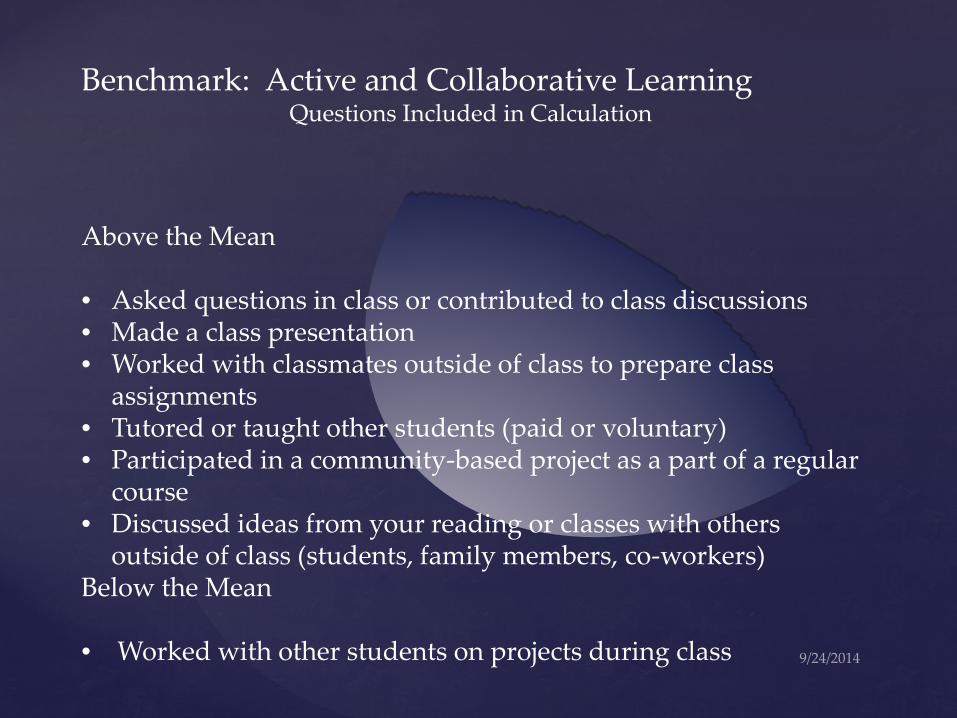
Benchmark: Active and Collaborative Learning Questions Included in Calculation
Above the Mean • Asked questions in class or contributed to class discussions • Made a class presentation • Worked with classmates outside of class to prepare class
assignments • Tutored or taught other students (paid or voluntary) • Participated in a community-based project as a part of a regular
course • Discussed ideas from your reading or classes with others
outside of class (students, family members, co-workers) Below the Mean • Worked with other students on projects during class
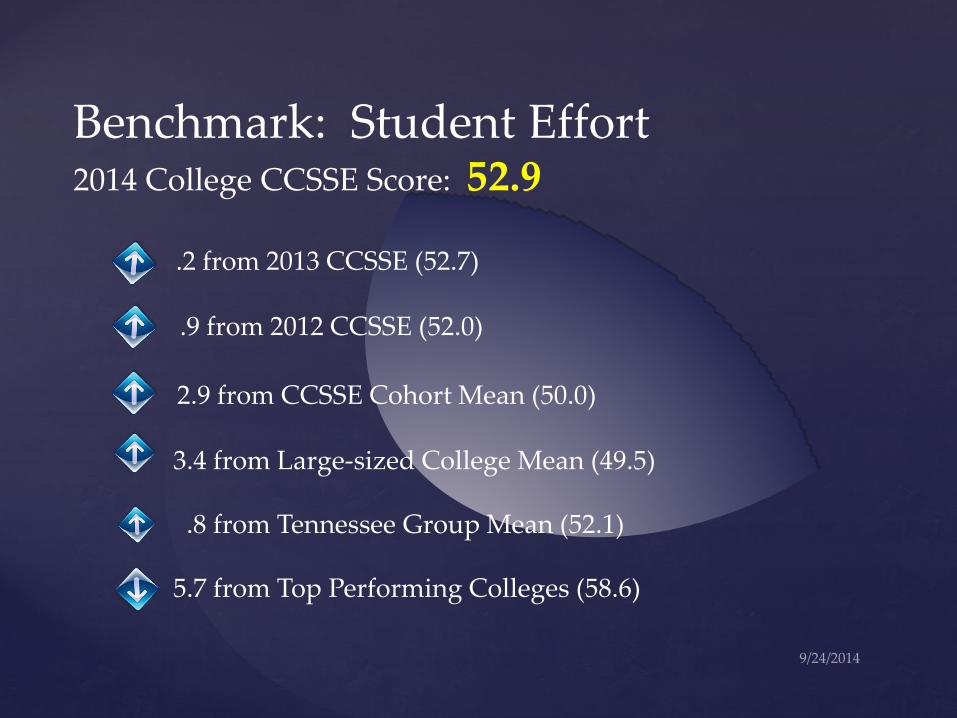
Benchmark: Student Effort 2014 College CCSSE Score: 52.9 .2 from 2013 CCSSE (52.7) .9 from 2012 CCSSE (52.0) 2.9 from CCSSE Cohort Mean (50.0) 3.4 from Large-sized College Mean (49.5) .8 from Tennessee Group Mean (52.1) 5.7 from Top Performing Colleges (58.6)
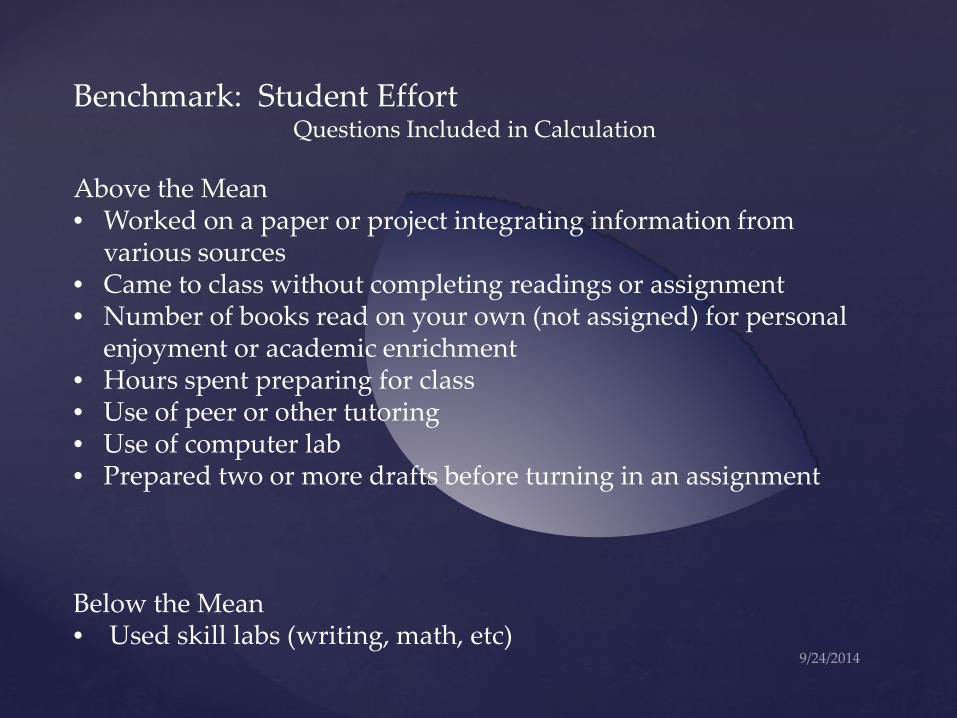
Benchmark: Student Effort Questions Included in Calculation
Above the Mean • Worked on a paper or project integrating information from
various sources • Came to class without completing readings or assignment • Number of books read on your own (not assigned) for personal
enjoyment or academic enrichment • Hours spent preparing for class • Use of peer or other tutoring • Use of computer lab • Prepared two or more drafts before turning in an assignment
Below the Mean • Used skill labs (writing, math, etc)

Benchmark: Academic Challenge 2014 College CCSSE Score: 53.2 3.5 from 2013 CCSSE (49.7) .1 from 2012 CCSSE (53.3) 3.2 from CCSSE Cohort Mean (50.0) 3.4 over Large-sized College Mean (49.8) 3.0 from Tennessee Group Mean (50.2) 4.2 from Top Performing Colleges (57.4)
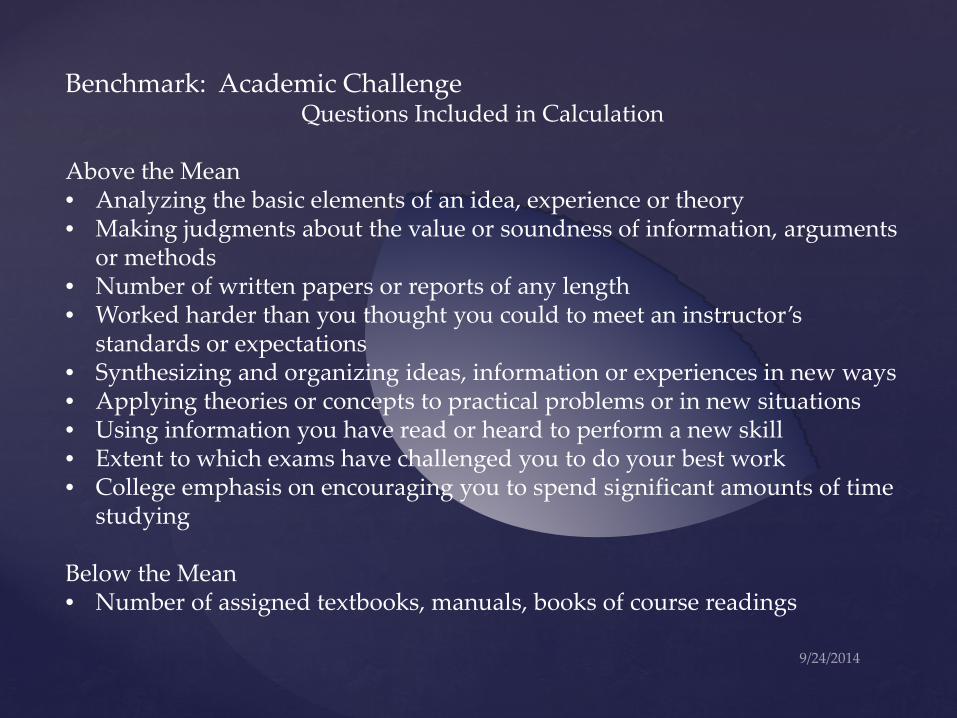
Benchmark: Academic Challenge Questions Included in Calculation
Above the Mean • Analyzing the basic elements of an idea, experience or theory • Making judgments about the value or soundness of information, arguments
or methods • Number of written papers or reports of any length • Worked harder than you thought you could to meet an instructor’s
standards or expectations • Synthesizing and organizing ideas, information or experiences in new ways • Applying theories or concepts to practical problems or in new situations • Using information you have read or heard to perform a new skill • Extent to which exams have challenged you to do your best work • College emphasis on encouraging you to spend significant amounts of time
studying Below the Mean • Number of assigned textbooks, manuals, books of course readings
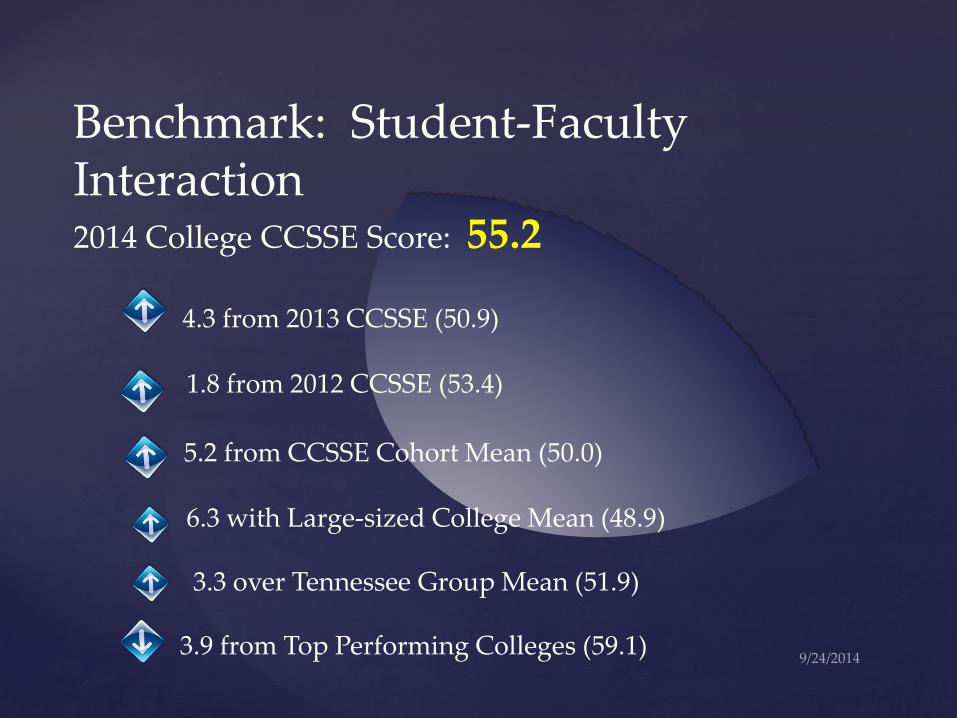
Benchmark: Student-Faculty Interaction 2014 College CCSSE Score: 55.2 4.3 from 2013 CCSSE (50.9) 1.8 from 2012 CCSSE (53.4) 5.2 from CCSSE Cohort Mean (50.0) 6.3 with Large-sized College Mean (48.9) 3.3 over Tennessee Group Mean (51.9) 3.9 from Top Performing Colleges (59.1)

Benchmark: Student-Faculty Interaction Questions Included in Calculation
Above the Mean • Used email to communicate with an instructor • Discussed grades or assignments with instructor • Discussed ideas from your readings or classes with instructors outside of class • Received prompt feedback (written or oral) from instructors on your
performance • Worked with instructors on activities other than coursework Below the Mean • Talked about career plans with an instructor or advisor
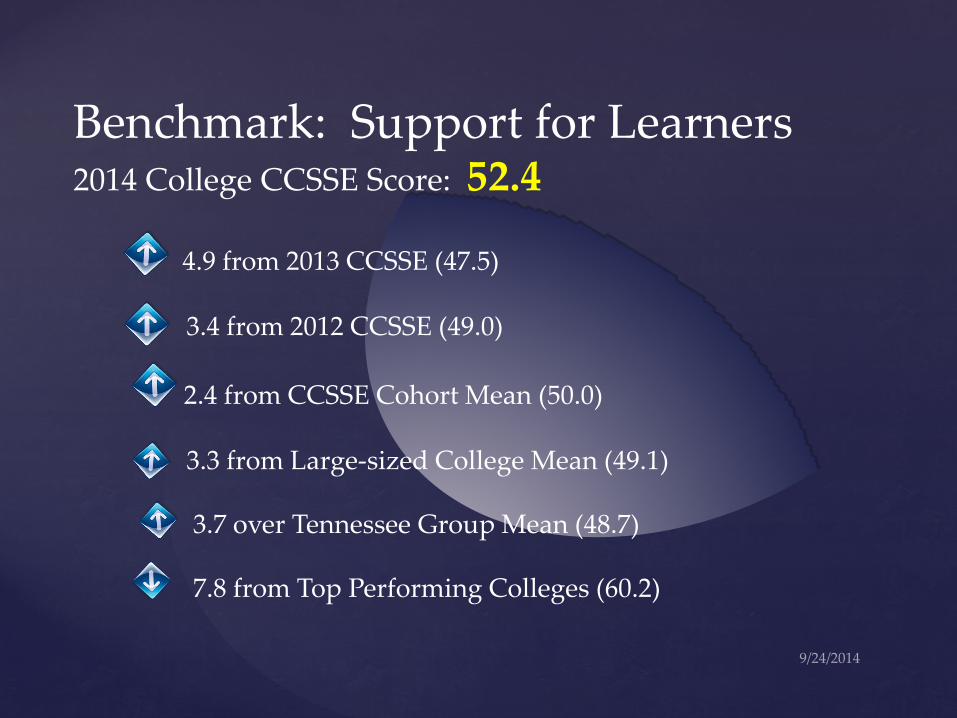
Benchmark: Support for Learners 2014 College CCSSE Score: 52.4 4.9 from 2013 CCSSE (47.5) 3.4 from 2012 CCSSE (49.0) 2.4 from CCSSE Cohort Mean (50.0) 3.3 from Large-sized College Mean (49.1) 3.7 over Tennessee Group Mean (48.7) 7.8 from Top Performing Colleges (60.2)
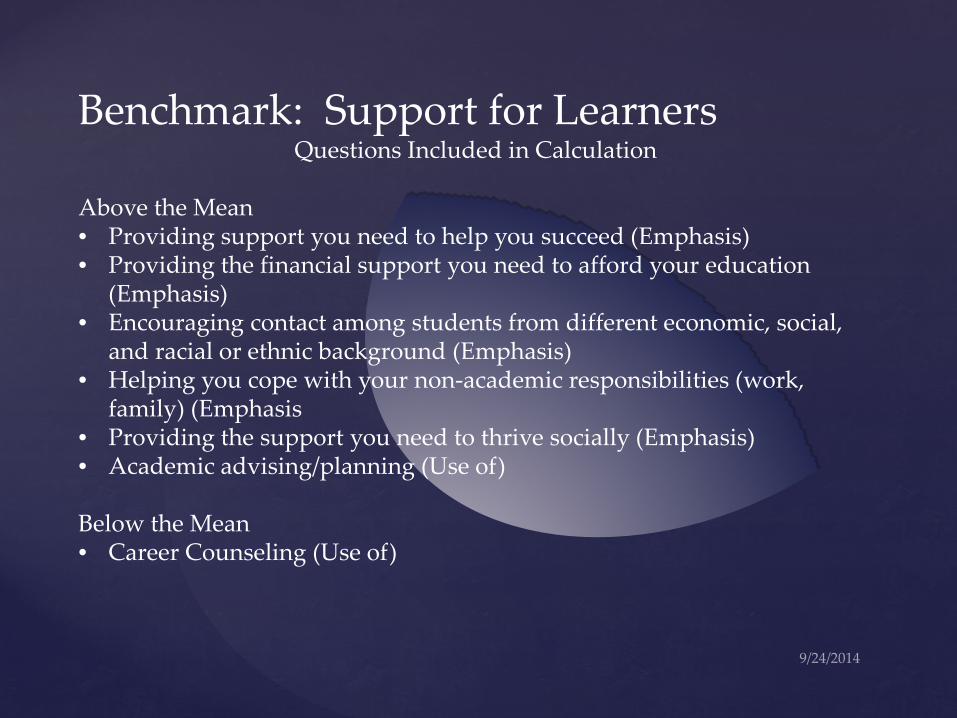
Benchmark: Support for Learners Questions Included in Calculation
Above the Mean • Providing support you need to help you succeed (Emphasis) • Providing the financial support you need to afford your education
(Emphasis) • Encouraging contact among students from different economic, social,
and racial or ethnic background (Emphasis) • Helping you cope with your non-academic responsibilities (work,
family) (Emphasis • Providing the support you need to thrive socially (Emphasis) • Academic advising/planning (Use of) Below the Mean • Career Counseling (Use of)
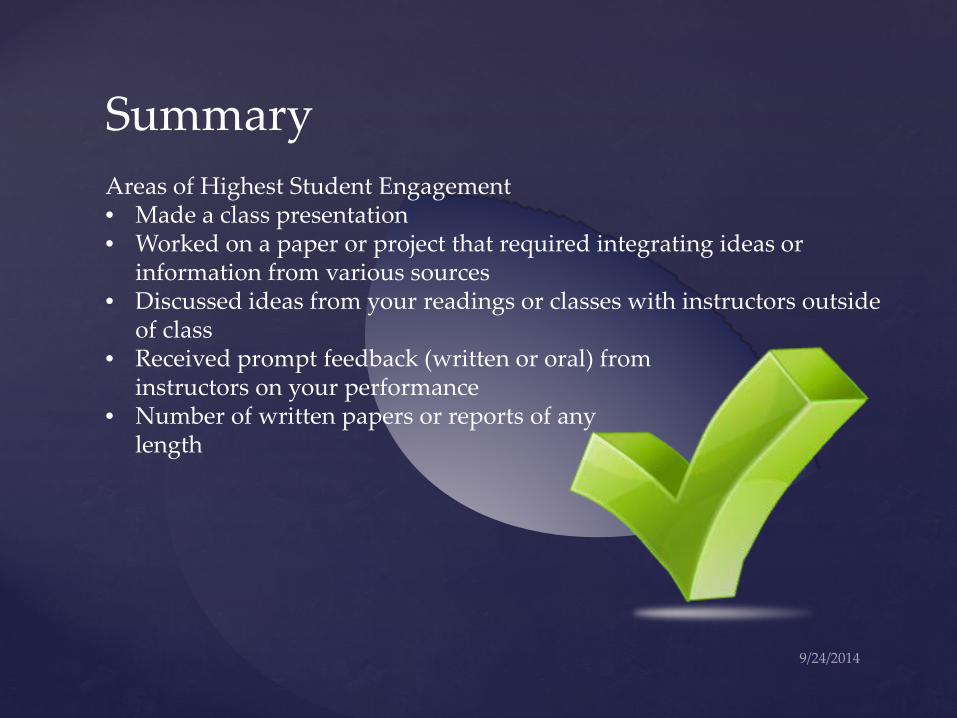
Summary Areas of Highest Student Engagement • Made a class presentation • Worked on a paper or project that required integrating ideas or
information from various sources • Discussed ideas from your readings or classes with instructors outside
of class • Received prompt feedback (written or oral) from instructors on your performance • Number of written papers or reports of any length
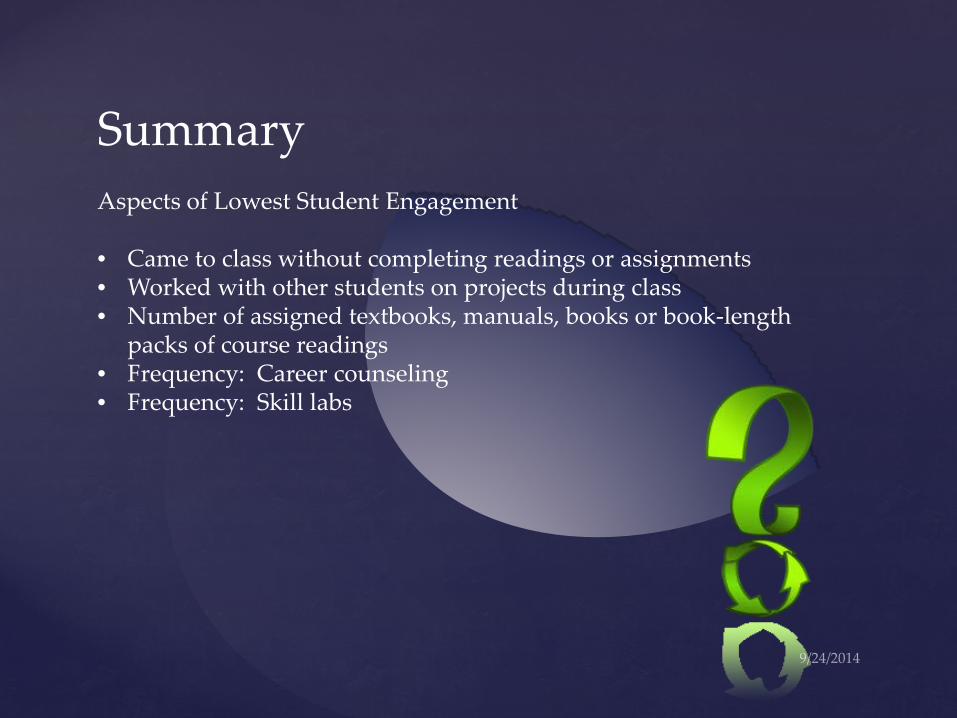
Summary Aspects of Lowest Student Engagement • Came to class without completing readings or assignments • Worked with other students on projects during class • Number of assigned textbooks, manuals, books or book-length
packs of course readings • Frequency: Career counseling • Frequency: Skill labs
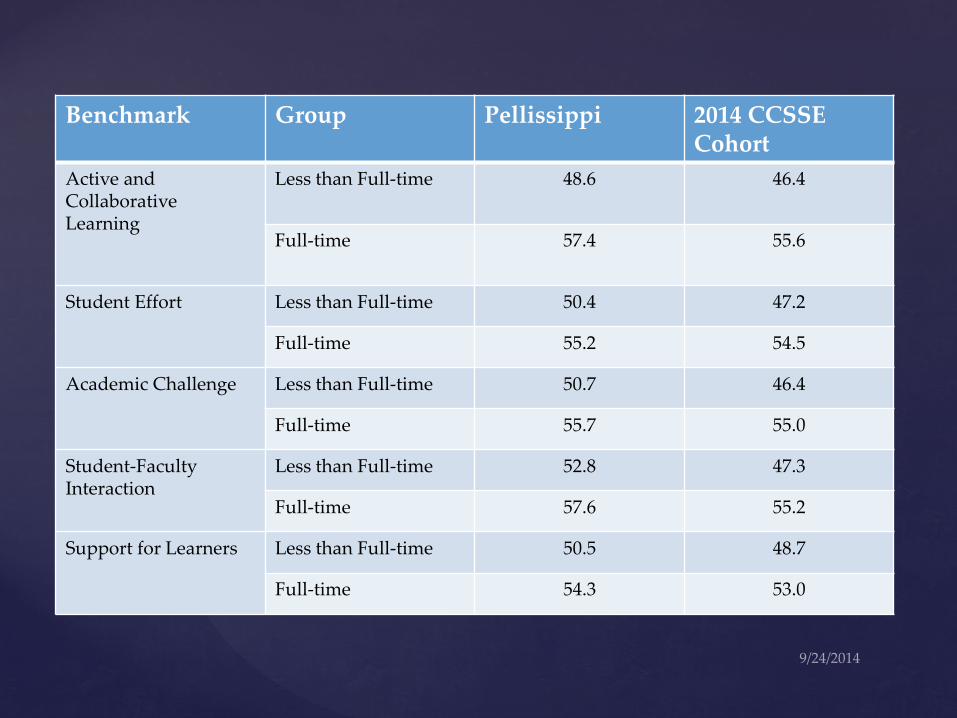
Benchmark Group Pellissippi 2014 CCSSE Cohort
Active and Collaborative Learning
Less than Full-time 48.6 46.4
Full-time 57.4 55.6
Student Effort Less than Full-time 50.4 47.2
Full-time 55.2 54.5
Academic Challenge Less than Full-time 50.7 46.4
Full-time 55.7 55.0
Student-Faculty Interaction
Less than Full-time 52.8 47.3
Full-time 57.6 55.2
Support for Learners Less than Full-time 50.5 48.7
Full-time 54.3 53.0
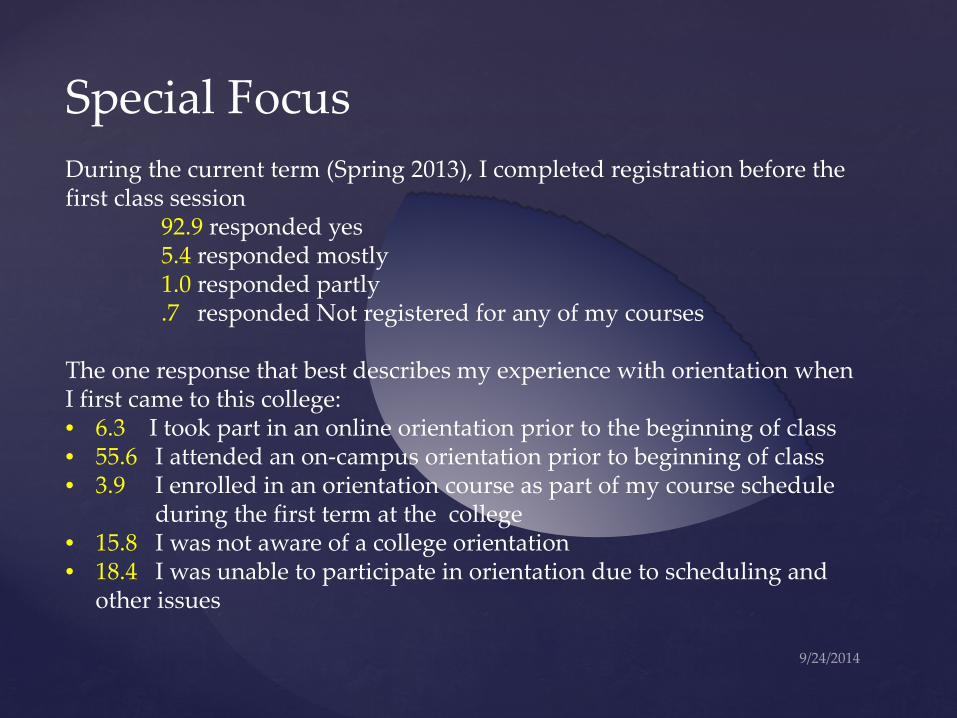
Special Focus During the current term (Spring 2013), I completed registration before the first class session 92.9 responded yes 5.4 responded mostly 1.0 responded partly .7 responded Not registered for any of my courses The one response that best describes my experience with orientation when I first came to this college: • 6.3 I took part in an online orientation prior to the beginning of class • 55.6 I attended an on-campus orientation prior to beginning of class • 3.9 I enrolled in an orientation course as part of my course schedule during the first term at the college • 15.8 I was not aware of a college orientation • 18.4 I was unable to participate in orientation due to scheduling and
other issues
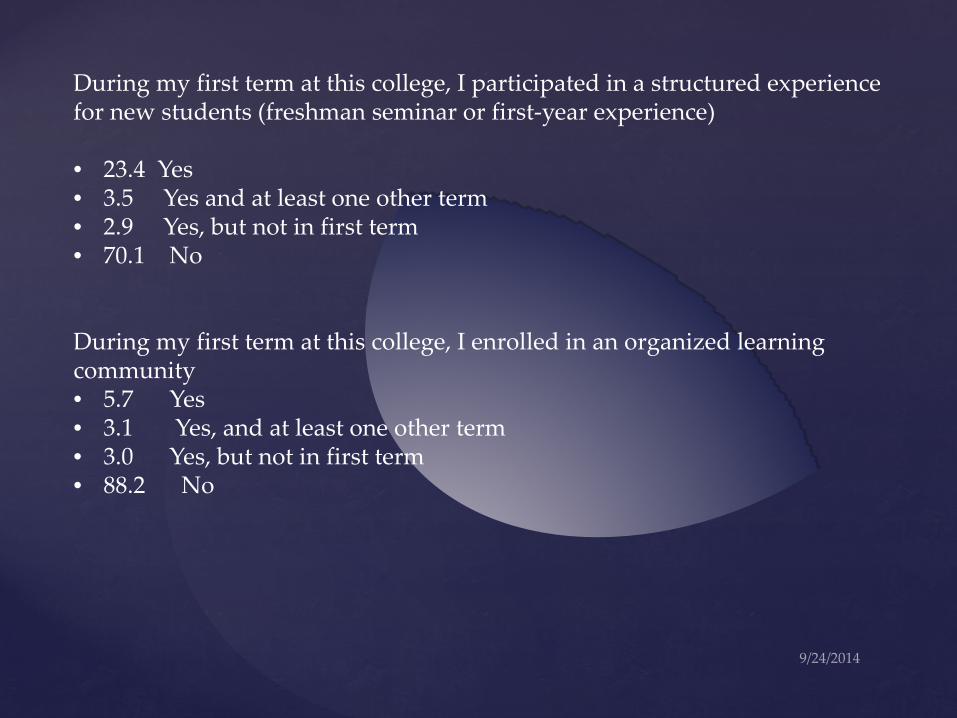
During my first term at this college, I participated in a structured experience for new students (freshman seminar or first-year experience) • 23.4 Yes • 3.5 Yes and at least one other term • 2.9 Yes, but not in first term • 70.1 No During my first term at this college, I enrolled in an organized learning community • 5.7 Yes • 3.1 Yes, and at least one other term • 3.0 Yes, but not in first term • 88.2 No
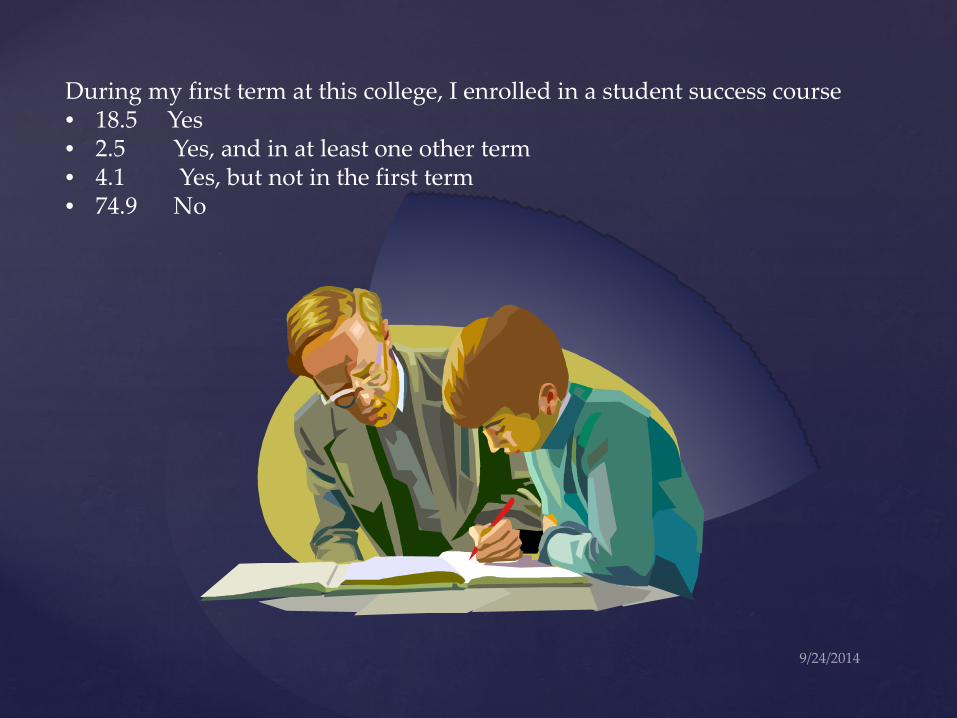
During my first term at this college, I enrolled in a student success course • 18.5 Yes • 2.5 Yes, and in at least one other term • 4.1 Yes, but not in the first term • 74.9 No
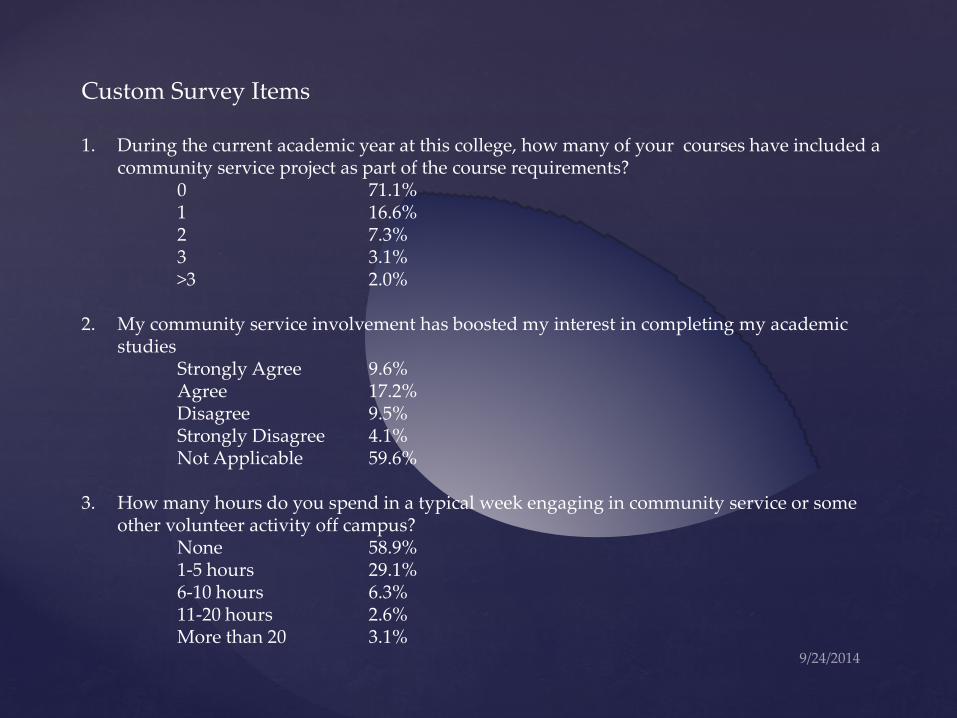
Custom Survey Items 1. During the current academic year at this college, how many of your courses have included a
community service project as part of the course requirements? 0 71.1% 1 16.6% 2 7.3% 3 3.1% >3 2.0% 2. My community service involvement has boosted my interest in completing my academic
studies Strongly Agree 9.6% Agree 17.2% Disagree 9.5% Strongly Disagree 4.1% Not Applicable 59.6% 3. How many hours do you spend in a typical week engaging in community service or some
other volunteer activity off campus? None 58.9% 1-5 hours 29.1% 6-10 hours 6.3% 11-20 hours 2.6% More than 20 3.1%

4. While attending, what has been your best source of academic advising Academic advisor (not faculty) 10.1% Academic advisor (faculty) 54.4% Friends, family or other students 18.8% Online college resources 9.7% Have received no academic advising 7.0% 5. If you participated in an academic support service, to what extent did the experience improve
your understanding of the material? A Great Deal 25.2% Somewhat 34.4% Not at All 40.4% 6. How many of your courses have included instructional methods other than lecture? Most 24.1% Many 32.3% Few 34.5% None 9.1% 7. The non-lecture instructional methods used in my courses boosted my ability to learn. Strongly Agree 33.4% Agree 49.4% Disagree 12.8% Strongly Disagree 4.4%
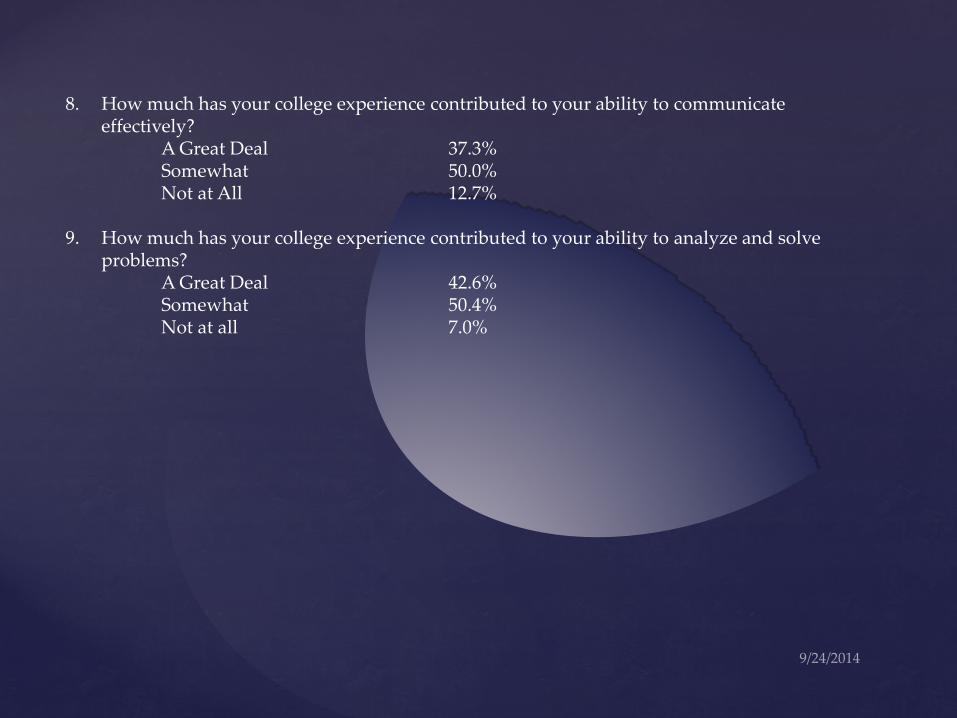
8. How much has your college experience contributed to your ability to communicate effectively?
A Great Deal 37.3% Somewhat 50.0% Not at All 12.7% 9. How much has your college experience contributed to your ability to analyze and solve
problems? A Great Deal 42.6% Somewhat 50.4% Not at all 7.0%

CCSSE Tools: College Connections Inventory; Faculty Prediction Exercise; Student Services Prediction Exercise; Focus Group Toolkit CCSSE Publications: Highlights (Best Practices and Research Findings Academic Advising: The Key to Student Success by O’Banion
Possible Ideas


![PELLISSIPPI PARKWAY EXTENSION (State Route 162) · 2017-10-19 · Parkway (State Route [SR] 162) in Blount County, Tennessee. The project begins at the current terminus of Pellissippi](https://static.fdocuments.in/doc/165x107/5f52f4f637e1436be01ba203/pellissippi-parkway-extension-state-route-162-2017-10-19-parkway-state-route.jpg)