2013 Results Presentation - Astra International | Beranda laporan keuangan/AI... · Strong results...
34
PT Astra International Tbk 2013 Results Presentation
Transcript of 2013 Results Presentation - Astra International | Beranda laporan keuangan/AI... · Strong results...

PT Astra International Tbk2013 Results Presentation

This report has been prepared by PT Astra International Tbk independently and is circulated for thepurpose of general information only. It is not intended for the specific person who may receive this report.The information in this report has been obtained from sources which we deem reliable. No warranty(expressed or implied) is made as to the accuracy or completeness of the information. All opinions andestimations included in this report constitute our judgment as of this date and are subject to changewithout prior notice.
We disclaim any responsibility or liability whatsoever arising which may be brought or suffered by anyperson as a result of acting in reliance upon the whole or any part of the contents of this report andneither PT Astra International Tbk and/or its affiliated companies and/or their respective employeesand/or agents accepts liability for any errors, omissions, negligent or otherwise, in this report and anyinaccuracy herein or omission here from which might otherwise arise.
Cautionary note on forward-looking statements: This report may contain statements regarding thebusiness of PT Astra International Tbk and its subsidiaries that are of a forward-looking nature and aretherefore based on management's assumptions about future developments. Forward-looking statementsinvolve certain risks and uncertainties because they relate to future events. Actual results may varymaterially from those targeted, expected or projected due to several factors. Potential risks anduncertainties includes such factors as general economic conditions, foreign exchange fluctuations, interestrate changes, commodity price fluctuations and regulatory developments. The reader and/or listener iscautioned to not unduly rely on these forward-looking statements. We do not undertake any duty topublish any update or revision of any forward-looking statements.
Disclaimer

2
Indonesia economic growth slowed moderately to 5.78% in2013 (2012: 6.23%), driven by slowdown in investment whileconsumption remained strong
Strong results from the Group’s financial services and miningcontracting businesses were offset by a decline in earnings fromthe Group’s heavy equipment and palm oil businesses.
While automotive demand remained favourable, increasedcompetition coupled with higher labour costs led to the earningscontribution from the car sector being little changed.
Overview

Highlights
3
Period ended 31st December
2013 2012 Change
Net Revenue (Rp bn) 193,880 188,053 3%
Net Income (Rp bn)* 19,417 19,421 0%
Net earnings per share (Rp) 480 480 0%
As at 31st
December 2013As at 31st
December 2012Change
Shareholders’ Funds (Rp bn)** 83,938 71,201 18%
Net asset value per share (Rp)** 2,073 1,759 18%
* Net income is profit attributable to owners of the parent. ** Shareholders' funds and Net asset value per share are based on equity attributable to owners of the parent.
• Indonesia economic growth slowed moderately to 5.78% in 2013 (2012: 6.23%),driven by slowdown in investment while consumption remained strong
• Strong results from the Group’s financial services and mining contractingbusinesses were offset by a decline in earnings from the Group’s heavyequipment and palm oil businesses.
• While automotive demand remained favourable, increased competition coupledwith higher labour costs led to the earnings contribution from the car sectorbeing little changed.

Business structure
4
Automotive
Automobile
•Toyota•Daihatsu• Isuzu•BMW•Peugeot•UD Trucks
Motorcycle
Honda
Component
Astra Otoparts
Others
Astraworld
Financial Services
•Astra Credit Companies
•Toyota Astra Finance
Motorcycle
Federal Intl. Finance
Heavy Equipment
Banking
•SAN Finance•Komatsu Astra
Finance
Bank Permata
Insurance
Asuransi Astra Buana
Heavy Equipment & Mining
Construction Machinery
•United Tractors•Traktor
Nusantara
Mining Contractor
PAMA PersadaNusantara
Coal Mining
•PMM• TTA• ABP• BEE• ABB / ABJ• DS / DN• PJU
Agribusiness
Palm Oil
Astra Agro Lestari
Infrastructure& Logistics
Toll Road
•MMS : 72km•MTN : 11km•MHI : 41km
Water Utility
Palyja
Fuel Logistic
Gresik Terminal
InformationTechnology
Document Solution
Astra Graphia
IT Solution
Astra GraphiaInformation Technology
Logistics
•SERA / TRAC•Mobil 88 (used)•SELOG•TFLI
Automobile
Sea Port
Eastkal

• Astra’s car market share declined from 54% to 53%, while Astra’s motorcycle market share increased from 58% to 61%.
• Komatsu’s market share was 41% and maintained it’s leading market position despite tight competition and weaker demand for heavy equipment due to lower commodity prices.
Market position at 31 December 2013
5
Toyota35%
Daihatsu15%
Isuzu3%
Mitsubishi13%
Suzuki13%
Nissan5%
Honda7%
Others9%
Car
Source : Gaikindo
Honda61%
Yamaha32%
Suzuki5%
Kawasaki2%
Motorcycle
Source : AISI
Komatsu 41%
Caterpillar 19%
Hitachi 21%
Kobelco17%
Others2%
Source: United Tractors – Internal Market Research
Heavy Equipment

Corporate actions
6
March ‘13
Jan ‘13• Astratel acquired 100% share of PT Pelabuhan Penajam Banua
Taka (Eastkal Seaport) in Balikpapan, East Kalimantan for Rp442 billion, to provide an integrated logistic hub for Astra group.
• Pama Persada completed final payment of USD 80m to increase its ownership to 75.40% in Asmin Bara Bronang/Jaan coal mines.
May ‘13 • AOP completed right issue of Rp 3.0 trillion, with AI participation of Rp 2.9 trillion.
April ‘13• AOP acquired 51% share of PT Pakoakuina (Pako), a wheel rim
manufacturer, for Rp 700 billion.
May ‘13 • AI placed 15.7% of AOP shares at a price of Rp 3,750 per share to increase the liquidity of the stock, generating Rp 2.8 trillion in gross proceeds.

Corporate actions
7
Aug ‘13 • AAL established a joint venture in Singapore (Astra – KLK Pte. Ltd), to market its palm oil products. AAL holds a 49% stake and Malaysian partner KL-Kepong Plantation Holdings owns 51%.
Sep ‘13 • Astra commercially launched the Low Cost Green Cars Astra-Toyota Agya and the Astra-Daihatsu Ayla.
Dec ‘13
Oct ‘13 • AI announced agreements to develop 2.4 hectares of land for an office tower and residential apartment complex in central Jakarta.
• Bank Permata completed a Rp 2.2 trillion senior and subordinated debt issuance.
Jan ‘14 • Bank Permata completed a Rp 1.5 trillion rights issue.
• JV Agreement signed with Aviva plc to form Astra Aviva Life.

Financial Performance

Consolidated income statement
9
In Billion Rupiah 2013 2012 Change
USD / IDR, average 10,563 9,419 12%
Revenue 193,880 188,053 3%
Gross Profit 35,311 36,200 (2%)
Operating Expenses (16,708) (16,330) 2%
Other Income 2,623 2,352 12%
Equity Income 6,297 5,676 11%
Income Tax Expense (5,226) (5,156) 1%
Non-controlling interest (2,880) (3,321) (13%)
Net Income 19,417 19,421 0%
“The Group produced satisfactory results in 2013, particularly as a number of ourbusinesses faced challenging conditions. The outlook for 2014 remains sound, although itis expected that there will continue to be heightened competition in the car market andweakness in coal prices, while concerns remain about increases in interest rates andrupiah volatility.”
- Prijono Sugiarto, President Director

Ownership %
Share of NI %
2013 2012
Auto Non-Auto Auto Non-Auto
4W AutomotiveSO – Toyota, Daihatsu, IsuzuToyota Astra MotorAstra Daihatsu MotorIsuzu Astra Motor Indonesia
100513245
31 30
2W AutomotiveAstra Honda MotorHonda SO
50100
15 14
ComponentAstra Otoparts 80 5 5
Financial ServicesAstra Sedaya FinanceFederal International FinanceToyota Astra Financial ServicesKomatsu Astra FinanceSAN FinanceAsuransi Astra BuanaPermata Bank
1001005050609645
17 5 15 4
Heavy Equipment & MiningUnited TractorsPamapersada Nusantara
6060
15 18
AgribusinessAstra Agro Lestari 80 7 10
Infrastructure, Logistics, ITSERAPalyjaMarga MandalasaktiAstra Graphia
100497977
5 4
10
2001 2011 2012 2013
Auto (Incl. autorelated Financial Services)
89% 61% 64% 68%
Non-Auto 11% 39% 36% 32%
Astra portfolio as at 31 December 2013
Net income contribution Auto vs. Non-Auto segments:

• Astra’s net asset value of Rp 2,073 per share at 31st December 2013 was 18% higher than at the end of 2012.
• Net debt at 31st December 2013, exclusive of the Group’s financial services subsidiaries, was Rp 3.7 trillion, mainly due to the sell down of 15.7% stake in Astra Otoparts and a reduction in working capital in the Group’s heavy equipment businesses.
Consolidated balance sheet
11
In Billion Rupiah 31-Dec-13 31-Dec-12 Change
Cash and Cash Equivalents 18,557 11,055 68%
Trade Receivables 19,843 16,443 21%
Inventories 14,433 15,285 (6%)
Financing Receivables 54,677 48,631 12%
Investments in Associates and Jointly Controlled Entities 23,870 19,801 21%
Fixed Assets 37,862 34,326 10%
Other Assets 44,752 36,733 22%
Total Assets 213,994 182,274 17%
Short-term Borrowings 12,854 7,202 78%
Trade Payables 17,275 12,685 36%
Long-term Debt 51,669 49,555 4%
Other Liabilities 26,008 23,018 13%
Total Liabilities 107,806 92,460 17%
Equity Attributable to The Owners of The Parent 83,938 71,201 18%
Non – controlling Interest 22,250 18,613 20%
Total Equity 106,188 89,814 18%
Net Debt (45,966) (45,702) 1%
Net Debt (Excl. Financial Services) (3,687) (8,918) (59%)

Consolidated cash flow
12
In Billion Rupiah 2013 2012 Change
Cash from operations 26,690 13,943 12,747
Tax Payments (6,382) (5,688) (694)
Interest received 942 675 267
Dividends Received 3,336 4,064 (728)
Cash flow from Operating Activities + Dividends Received 24,586 12,994 11,592
Net Capex (9,998) (10,576) 578
Net Investment (1,321) (2,534) 1,213
Other Investing (323) (391) 68
Cash flow for Investing Activities (11,642) (13,501) 1,859
Net proceed of Debt 2,080 9,163 (7,083)
Interest Payment (1,105) (990) (115)
Dividend Payment (10,017) (9,768) (249)
Other Financing 2,377 (332) 2,709
Cash flow from Financing Activities (6,665) (1,927) (4,738)
Increase/(Decrease) in Cash 6,279 (2,434) 8,713
Opening Cash Balance 10,815 13,071 (2,256)
Exchange Rate Adjustment 1,461 178 1,283
Closing Cash Balance 18,555* 10,815* 7,740
The Group’s cash balance at 31 December 2013 increased by Rp 7.7 trillion, mainly driven by stronger working capital inflows.
* Inclusive of bank overdraft

Business Updates

136 147 218 259 175 223318 281
426 483605 655
182 207266
275
144211
290205
338411
511575
2002 2003 2004 2005 2006 2007 2008 2009 2010 2011 2012 2013
Astra OthersLehman Crisis
(↓20%)
Segment 2002 2003 2004 2005 2006 2007 2008 2009 2010 2011 2012 2013
Sedan 8% 11% 8% 7% 6% 6% 6% 5% 4% 3% 3% 3%
4x2 & 4x4 55% 53% 56% 62% 63% 66% 64% 69% 67% 64% 67% 69%
Commercial 37% 36% 36% 31% 31% 28% 30% 26% 29% 33% 30% 28%
Historical domestic car sales
In thousand unitsFuel price increase
(↓40%)
The wholesale market for cars grew by 10% in 2013, benefitting from rising incomes and increased domestic capacity
14
318
1,116
894
764
486
608
434319
534484
354
Source: Gaikindo
1,230

Astra 605,19154.2%
Astra 654,55853.2%
Others 511,03945.8%
Others575,34346.8%
4x2 & 4x479.4%
4x2 & 4x480.4%
Commercial17.4%
Commercial 16.6%
Toyota36.4%
Toyota35.4%
Daihatsu14.6%
Daihatsu 15.1%
Isuzu 3.0%Isuzu 2.6%
Mitsubishi13.3%
Mitsubishi12.8%
Suzuki 11.3%
Suzuki 13.3% Honda 6.2%
Honda 7.4%Nissan 6.0%
Nissan 5.0% Others 9.2%
Others 8.4%
Sedan 3.1% Sedan 2.8%
4x2 & 4x4746,37366.9%
4x2 & 4x4845,54168.7%
Commercial335,135 30.0%
Commercial349,61628.4 %
Sedan 56.6% Sedan 43.1%
4x2 & 4x464.4%
4x2 & 4x462.3%
Commercial 31.4%
Commercial31.1%
M/S2012
AI Product Segment
Brand Segment AI Product M/S
M/S2013
AI Product Segment
Brand Segment AI Product M/S
Sedan 3.%
Source: Gaikindo
Automotive – car & wholesale market
15
2012 2013
Astra’s car sales rose by 8%, leading to a decline in market share from 54% to 53%
1,229,901
Sedan 3.0%
1,116,230
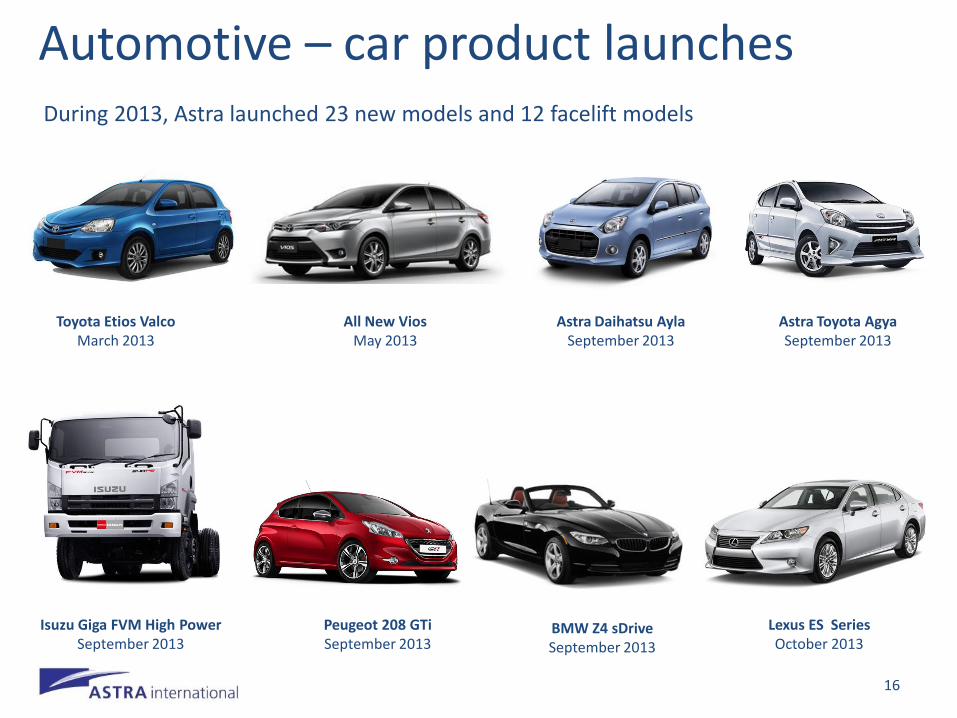
Automotive – car product launchesDuring 2013, Astra launched 23 new models and 12 facelift models
Astra Daihatsu AylaSeptember 2013
16
Astra Toyota AgyaSeptember 2013
Toyota Etios ValcoMarch 2013
Lexus ES SeriesOctober 2013
All New ViosMay 2013
Isuzu Giga FVM High PowerSeptember 2013
Peugeot 208 GTiSeptember 2013
BMW Z4 sDriveSeptember 2013

1,437 1,577 2,036 2,648 2,340 2,141 2,875 2,701
3,416 4,274 4,089 4,697
850 1,233
1,852
2,426 2,087 2,547
3,341 3,151
3,957 3,739
2,975 3,047
2002 2003 2004 2005 2006 2007 2008 2009 2010 2011 2012 2013
Astra Others
In thousand units
Segment 2002 2003 2004 2005 2006 2007 2008 2009 2010 2011 2012 2013
Cub 90% 90% 89% 88% 84% 73% 63% 52% 45% 38% 26% 19%
Scooter 0% 0% 2% 4% 8% 18% 26% 39% 46% 52% 60% 63%
Sport 10% 10% 9% 8% 8% 9% 11% 9% 9% 11% 14% 18%
Historical domestic motorcycle sales• The wholesale market for motorcycles grew by 10% in 2013 to 7.7 million• Shifting consumer demand from cub to automatic scooter type, and improved
contribution from sport type
17
2,287
4,6884,4275,074
3,888
2,810
7,373
5,8526,216
8,013
7,064Fuel price increase
(↓13%)
Lehman Crisis( ↓6%)
Min. DP requirement
Source: AISI
7,744

Honda, 4,088,888
57.9%
Honda, 4,696,999
60.7%
Yamaha,2,423,854
34.3%
Yamaha, 2,492,596
32.2%
Suzuki, 5.9%
Suzuki, 5.1%Others 1.9%
Others 2.0%
Cub1,058,281
25.9%
Cub874,75718.6%
Scooter2,859,989
69.9%
Scooter3,425,075
72.9%
Sport/Others4.2%
Sport/Others8.5%
Cub1,058,281
57.1%
Cub874,75758.5%
Scooter2,859,989
68%
Scooter3,425,075
70%
Sport/Others17.0 %
Sport/Others29.3%
Cub1,852,792
26.2%
Cub1,495,209
19.3%
Scooter4,208,219
59.6%
Scooter4,893,647
63.2%
Sport & Others 14.2%
Sport & Others 17.5%
Brand2012
Honda Segment Honda Product M/S
Segment Brand2013
Honda Segment Honda Product M/S
Segment
Automotive – motorcycle & wholesale market
Source: AISI
2012 2013
Astra Honda Motor’s sales increased by 15%, with it’s market share increasing from 58% to 61%
18
7,064,457 7,743,879

Automotive – motorcycle product launches
19
During 2013, Astra Honda Motor launched 2 new models and 9 revamped models
Honda CBR 150 ROctober 2013
Honda CB 150 RDecember 2013
Honda Verza January 2013
Honda Scoopy FIFebruary 2013
Honda Vario 125 CBS Idling Stop March 2013
Supra X 125 Helm-In FIJuly 2013

OEM68%
After Market
23%
Export9%
268401
785605
Equity Income Consolidated
51%51%
41%
39%8%
10%
Export After Market OEM
Automotive - components
20
Net Income (IDR billion)
Astra Otoparts, the Group’s 80%-owned automotive components business, reported net income of Rp 1 trillion, a decrease of 4%. The decline in earnings was largely due to higher raw material and labour costs that could not be passed on fully to customers.
1,0531,006
Revenue (IDR billion)
8,277
29%
(4%)
2012 2013 2012 2013
10,702
OEM56%
After Market
37%
Export7%

Amount Financed (Rp bio) 2013 2012 %
Auto
ACC (Incl.HE) 26,141 23,165 13
TAFS 9,368 8,255 13
Total 4W 35,510 31,420 13
FIF 21,419 18,877 13
Total Auto 56,929 50,297 13
HE
SANF 3,277 4,610 (29)
KAF 1,722 2,486 (31)
Total HE 4,999 7,096 (30)
Financial services
21
• 2013 consolidated net income increased by
26% to Rp 1.7 trillion
• Loan book grew by 26% to Rp 120 trillion
• LDR 89% & CAR 14%
• Gross-NPL ratio were down from 1.4% to
1.0%
Asuransi Astra Buana
• 2013 Gross Written Premium up by 23%year on year to Rp 3.8 trillion
• RBC : 157%, requirement 120%
Bank Permata
Net income from the Group’s financial services businesses grew by 15% to Rp 4.3 trillion, driven by loan book growth in the automotive focused finance companies and Bank Permata
Unit Financed 2013 2012 %
Auto
ACC (new & used cars) 192,364 164,605 17
TAFS 61,640 54,777 13
Total 4W 254,004 219,382 16
FIF (Incl.Electronics) 2,609,925 2,295,915 14
HE
SANF 2,655 3,715 (29)
KAF 341 377 (10)
Total HE 2,996 4,092 (27)
* Incl. Joint Financing

Historical heavy equipment market
825 916 1,619 2,406 2,250 3,454 4,345
3,111 5,404
8,467 6,202
4,203 868 1,331
2,3452,587 2,437
3,584
5,339
3,533
6,377
8,893
8,219
6,049
2002 2003 2004 2005 2006 2007 2008 2009 2010 2011 2012 2013
Others Komatsu
1,693 2,247
3,9644,993 4,687
7,038
9,684
6,644
11,781
17,360
14,421
Market Share 2002 2003 2004 2005 2006 2007 2008 2009 2010 2011 2012 2013
Komatsu 49% 41% 41% 48% 48% 49% 45% 47% 46% 49% 43% 41%
Caterpillar 26% 34% 29% 28% 23% 22% 23% 21% 16% 18% 19% 19%
Hitachi 16% 13% 16% 13% 16% 16% 17% 17% 19% 15% 21% 21%
Others 9% 11% 14% 11% 13% 13% 15% 15% 19% 18% 17% 19%
22
Weaker heavy equipment market in 2013 driven by a decline in mining sector demand due to a fall in commodity prices.
In Unit
Source: UT’s internal research
10,252

94.4 105.1
Coal Production (mn tonnes)
855.5 844.9
Overburden Removal (mn bcm)
2,779 1,629
2,848
2,554
5,627
4,183
PMM & Asmin TTA & DN (all in thousand tonnes)
22,15815,644
27,99431,554
5,8023,814
Construction Machinery Mining Contracting Mining
54%43%
5%
8%
25%
26%
16%
23%
Mining Forestry Agro Construction
United Tractors, 59.5%-owned, reported net income down 16% to Rp 4.8 trillion, due to lower heavy equipment sales, partly offset by strong results from Pama, its mining contracting business.
Mining Contracting
Coal Mines: Reserves and SalesKomatsu Unit Sales
4,203
Revenue (Rp bio)
2012 2013 2012 2013
Heavy equipment & mining
23
6,202Est. Combined Coal Reserves (Mio Tons)
TTA 30
PMM 3
ABP 9
ABB/ABJ 100
DS/DN 45
BEE 177
PJU 45
Total 409
55,954
2012 2013 2012 2013
51,012

14.1 16.1 17.3
19.4 21.0 22.1 24.3
26.9 28.3
2005 2006 2007 2008 2009 2010 2011 2012 2013
In million tonnes
Historical national palm oil production
24
Palm Oil Area 2005 2006 2007 2008 2009 2010 2011 2012 2013F
Mature (Million hectare)
3.69 4.11 4.54 4.95 5.37 5.74 6.08 6.50 6.90
Yields (T/Ha) 3.82 3.91 3.80 3.92 3.91 3.85 4.00 4.14 4.10
• Indonesia is the world largest palm oil producer
• Demand for CPO remains strong, largely driven by emerging markets
Source : Oil World

5.23 4.63
234 247
39 37
Immature
Mature
11,231
12,558 333
117
Export
Local
Area Maturity (‘K Ha) *
Revenue (Rp bio)
CPO Production & Sales (‘K tonnes)
284273
Astra Agro Lestari, 79.7%-owned, reported net income of Rp 1.8 trillion, a decline of 25%, due to declining nucleus FFB yield, higher labour costs and foreign exchange translation loss on US dollar borrowings, despite increased CPO sales by 11%.
* Incl. plasma plantation
CPO Yield (tonne/Ha)
Agribusiness
25
11,564
12,675
1,476 1,5391,424 1,577
Production Sales
2012 2013 2012 2013
2012 2013 2012 2013

159.8 158.5
31,339 30,956
Infrastructure, logistics and others
26
• Marga Mandalasakti, the Tangerang – Merak72.5km toll road operator, reported a 9% increase in traffic volumes to 41 million vehicles
• PAM Lyonnaise Jaya, which operates the western Jakarta water utility system, experienced lower sales volume by 1% to 159million cubic metres
• Serasi Autoraya’s revenue improved, despite lower number of vehicles under contract at its TRAC car rental business by 1% to 31,000
TRAC Rental Car (unit)
37,482 40,760
MMS Vehicle Traffic Volume (‘K unit) Palyja Water Sales Volume (Mn m3)
2012 2013
2012 20132012 2013

Appendices

Divisional Revenue
Divisional revenue and net income
28
In Billion Rupiah 2013 2012 % Chg
Automotive 108,039 99,639 8%
Financial Services 13,615 12,712 7%
Heavy Equipment 50,920 55,800 (9%)
Agribusiness 12,675 11,564 10%
Infrastructure, Logistics & Others 6,585 6,489 1%
Information Technology 2,046 1,849 11%
Total 193,880 188,053 3%
Divisional Net Income
In Billion Rupiah 2013 2012 % Chg
Automotive 9,829 9,472 4%
Financial Services 4,273 3,714 15%
Heavy Equipment 2,971 3,500 (15%)
Agribusiness 1,435 1,920 (25%)
Infrastructure, Logistics & Others 748 683 10%
Information Technology 161 132 22%
Total 19,417 19,421 0%

Car products launched in 2013
29
Models Launched Launching Time Engine Capacity Prices (IDR mn)
Car
Lexus LS 460 L Jan-13 4,600cc 2,300
Lexus LS 600 HL Jan-13 5,000cc 2,900
BMW X1 sDrive18i Business Jan-13 2,000cc 499*
BMW X1 sDrive18i xLine Jan-13 2,000cc 559*
BMW X1 sDrive20d Sport Jan-13 2,000cc 649*
Isuzu NQR 71 Feb-13 125ps 287.5
BMW M 135i Feb-13 3,000cc 888*
Toyota Etios Valco Mar-13 1,200cc 139.5-169.5
Toyota New Avanza Airbag May-13 1,300cc-1,500cc 155.5-193
Toyota All New Vios May-13 1,500cc 242.5-272.5
Daihatsu New Xenia Airbag May-13 1,000cc-1,300cc 133.1-185.8
Peugeot New RCZ May-13 1,600cc 689.1*
Isuzu Giga FVZ Jun-13 7,800cc 788.5
BMW 320d Jun-13 2,000cc 659*
BMW M6 Gran Coupe Jul-13 4,400cc 2,598*
Lexus IS Series Jul-13 2,500cc 850-950
*Off the road

Car products launched in 2013
30
Models Launched Launching Time Engine Capacity Prices (IDR mn)
Car Toyota New Innova Aug-13 2,000cc-2,500cc 197.3-316.5Toyota New Rush Aug-13 1,500cc 205.5-232.7
Daihatsu New Terios Aug-13 1,500cc 169.5-220.3Toyota New Fortuner Sep-13 2,500cc-2,700cc 396-506.5
BMW 435i Coupe M Sport Sep-13 3,000cc 998*BMW Z4 sDrive20i Sep-13 2,000cc 929*
BMW Z4 sDrive35i Sep-13 3,000cc 1,409*Peugeot 208 Gti Sep-13 1,600cc 565.2*Astra Toyota Agya Sep-13 1,000cc 99.9-120.75
Astra Daihatsu Ayla Sep-13 1,000cc 76.5-107Isuzu D-Max Sep-13 2,500cc 266
Isuzu D-Max Sep-13 3,000cc 399Isuzu Giga FVM High Power Sep-13 285ps n/a
Isuzu Giga FTR Tractor Head Sep-13 210ps 487Isuzu GIGA FVZ MX 34 P Mixer Sep-13 285ps 802Isuzu GIGA FVZ 34T Long wheel base Sep-13 285ps n/a
Isuzu Elf NKR 55 Long Wheel Base Sep-13 101ps 221Isuzu Elf NKR 71 Econo Sep-13 125ps 274
Lexus ES Series Oct-13 2,500cc 810-915*Off the road

Motorcycle products launched in 2013
31
Models Launched Launching Time Engine Capacity Prices (IDR mn)*
Motorcycle
Honda Verza Jan-13 150cc 16.1 – 16.9
Honda Revo Series Jan-13 110cc 13
Honda Vario Feb-13 110cc 14.6
Honda Scoopy FI Feb-13 110cc 13.9
Honda Spacy FI Mar-13 110cc 13.2
Honda Vario 125 CBS Idling Stop Mar-13 125cc 16.4
Honda Supra X 125 R Apr-13 125cc 14.9-15.9
Honda Supra X 125 Helm-In FI Jul-13 125cc 16.5
Honda Scoopy FI Sep-13 110cc 14.3
Honda CBR 150R Oct-13 150cc 41.8-42.5
Honda CB 150 R Dec-13 150cc 23.5

32
2013 2012Major Brands
Wholesale Astra Wholesale Astra
Car
Sedan 34,744 55.6% 34,722 56.6%Toyota - Vios/Limo, Camry, Altis ; Honda - City,Civic, Accord; Mercedes - E Series, C Series
4X2 & 4X4 845,541 62.2% 746,373 64.3%
Toyota - Avanza, Innova, Rush, AgyaDaihatsu - Xenia, Terios, Ayla; Nissan - Grand Livina,March, Evalia; Suzuki - Ertiga, APV, Splash; Honda -Jazz, CR-V, Freed; Mitsubishi – Pajero Sport, Mirage, Outlander Sport
Pick Up/ Trucks/ Bus 334,501 30.9% 316,476 30.9%Mitsubishi – Canter, L-300, Strada; Daihatsu – Gran Max; Suzuki – Carry, APV; Isuzu – Elf, Panther, Giga; Toyota – Dyna ,Hi-Lux, Hi-Ace
Double Cabin 15,115 37.1% 18,659 38.6%Toyota – Hilux; Mitsubishi – Strada; Ford – Ranger; Isuzu – D-Max
Total 1,229,901 1,116,230
Mo
torc
ycle
Cub 1,495,209 58.5% 1,852,792 57.1%Honda - Supra X 125, Revo Series, Blade; Yamaha -Jupiter MX, Vega RR, Jupiter Z; Suzuki – SmashTitan, Shooter, Shogun Axello 125
Scooter 4,893,647 70.0% 4,208,219 68.0%Honda - BeAT, Vario, Scoopy; Yamaha - Mio, Xeon, X-Ride; Suzuki – Nex, Hayate, Let’s
Sport & Others 1,355,023 29.3% 1,003,446 17.0%Yamaha - V-ixion, Byson, Scorpio Z; Honda - CB 150 R, Verza, New Mega Pro; Suzuki - Satria F 150, Thunder 125
Total 7,743,879 60.7% 7,064,457 57.9%
Source: Gaikindo & AISI
National market data (summary)

For further information please contact:
Investor Relations of PT Astra International Tbk - Attn:
Iwan Hadiantoro / Tira Ardianti / Inneke Soendoro / Christian
P: (+62 21) 652 2555
F: (+62 21) 6530 4953
E: [email protected] / [email protected] /
[email protected] / [email protected]
33