Professionalism in the Workplace. Is it the role or the behavior?

2013 NATIONAL PROFESSIONALISM SURVEY
Workplace Report
Polk-Lepson Research Group January 2013 York, Pennsylvania Page 2
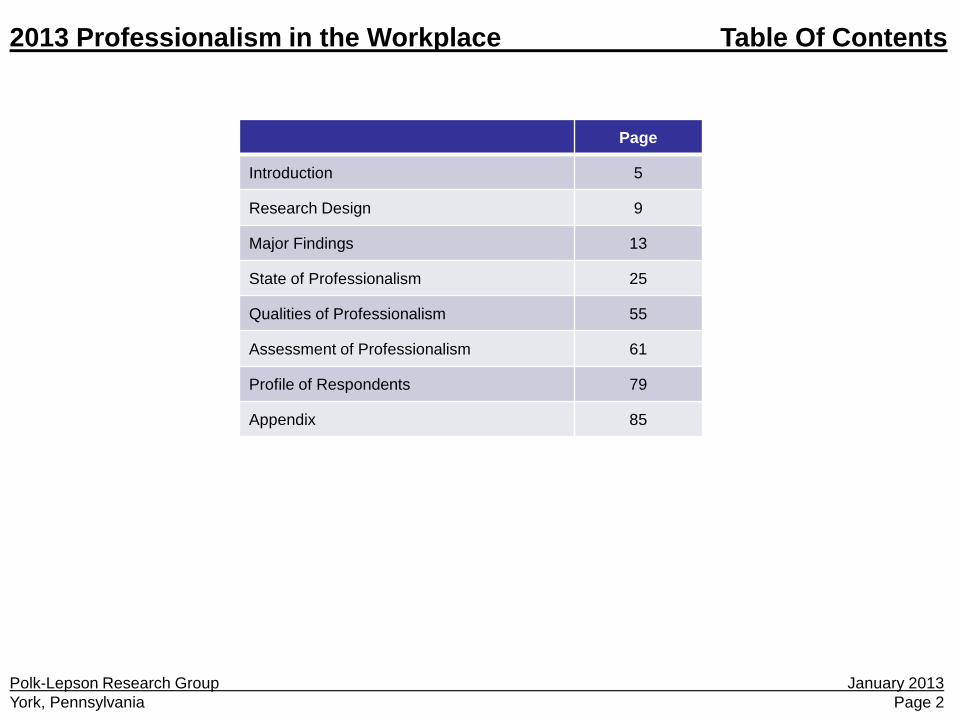
2013 Professionalism in the Workplace Table Of Contents
Page
Introduction 5
Research Design 9
Major Findings 13
State of Professionalism 25
Qualities of Professionalism 55
Assessment of Professionalism 61
Profile of Respondents 79
Appendix 85
Polk-Lepson Research Group January 2013 York, Pennsylvania Page 3
2013 Professionalism in the Workplace Introduction
Introduction
Polk-Lepson Research Group January 2013 York, Pennsylvania Page 4
Project Purpose Report Format
Each year, York College of Pennsylvania’s Center for Professional Excellence conducts a nationwide study on the state of professionalism in the workplace. This is the fourth year for the study. The focus is on employers’ experiences with recent college graduates. Persons who are responsible for hiring decisions involving new college graduates are surveyed on a variety of topics related to the professionalism exhibited by these employees. Findings from the study are used to track changes in the state of workplace professionalism. They are also used to direct the content of professionalism seminars that the Center for Professional Excellence sponsors every year for York College’s students, faculty, and administrators. In addition to human resource professionals, this year a national sample of college professors was surveyed on the state of professionalism among upper classmen. The findings from that survey are presented in a separate report. The first three sections of the report constitute an executive summary. These sections are Introduction, Research Design, and Major Findings. The sections following the executive summary present the detailed findings. These findings are reported in both graphic and narrative forms.
2013 Professionalism in the Workplace Introduction
Polk-Lepson Research Group January 2013 York, Pennsylvania Page 5
2013 Professionalism in the Workplace Research Design
Research Design
Polk-Lepson Research Group January 2013 York, Pennsylvania Page 6
Sample Data Collection Research Instrument Data Analysis
A nationwide random sample of 401 human resource professionals was surveyed. Detailed information on the composition of the sample is presented in the section of the report titled Profile of Respondents. The maximum margin of error associated with the sample is +/– 4.9% at the 95% confidence level. This means the answers that would be obtained from the population of all employment decision-makers would be within this range of the samples’ answers 95% of the time. The data was collected using an online survey. An e-mail introduced the study and contained a link to the survey.
The survey was developed using input from the Center for Professional Excellence’s Advisory Board and previous year’s research. Prior to being administered, the survey was reviewed and approved by the Advisory Board and the Center for Professional Excellence. Statistical analyses were conducted to discover any significant differences involving respondent characteristics and answers to the survey. Any differences are reported in the text. Where possible, comparisons are made to previous years. These are shown in the graphs. Open-ended responses were coded into descriptive categories for presentation purposes. The report shows the predominant categories. The data tables should be consulted for a complete review of all the coded responses.
2013 Professionalism in the Workplace Research Design
Polk-Lepson Research Group January 2013 York, Pennsylvania Page 7
2013 Professionalism in the Workplace Major Findings
Major Findings
Polk-Lepson Research Group January 2013 York, Pennsylvania Page 8
Annual Survey of Professionalism State of Professionalism
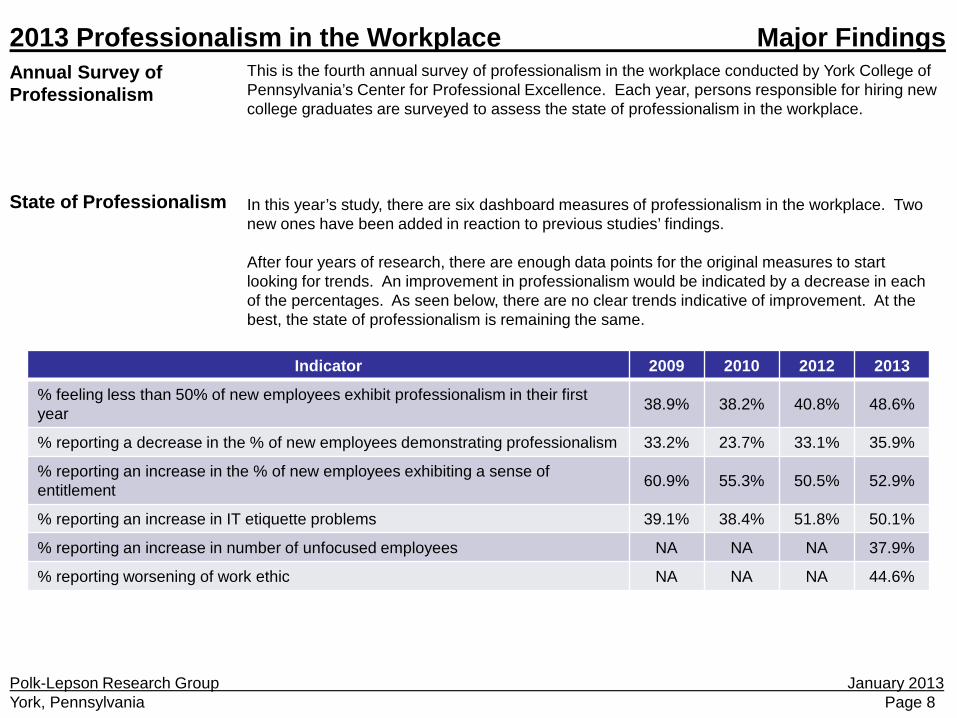
This is the fourth annual survey of professionalism in the workplace conducted by York College of Pennsylvania’s Center for Professional Excellence. Each year, persons responsible for hiring new college graduates are surveyed to assess the state of professionalism in the workplace. In this year’s study, there are six dashboard measures of professionalism in the workplace. Two new ones have been added in reaction to previous studies’ findings. After four years of research, there are enough data points for the original measures to start looking for trends. An improvement in professionalism would be indicated by a decrease in each of the percentages. As seen below, there are no clear trends indicative of improvement. At the best, the state of professionalism is remaining the same.
2013 Professionalism in the Workplace Major Findings
Indicator 2009 2010 2012 2013
% feeling less than 50% of new employees exhibit professionalism in their first year 38.9% 38.2% 40.8% 48.6%
% reporting a decrease in the % of new employees demonstrating professionalism 33.2% 23.7% 33.1% 35.9%
% reporting an increase in the % of new employees exhibiting a sense of entitlement 60.9% 55.3% 50.5% 52.9%
% reporting an increase in IT etiquette problems 39.1% 38.4% 51.8% 50.1%
% reporting an increase in number of unfocused employees NA NA NA 37.9%
% reporting worsening of work ethic NA NA NA 44.6%
Polk-Lepson Research Group January 2013 York, Pennsylvania Page 9
Benefits of a Recession Entitlement
IT Abuses
If there is a silver lining to the poor economic times experienced over the past several years, it is there is a larger pool of job applicants from which to choose. Over half of the respondents (52.5%) who feel there has been an increase in the professionalism of new college graduates point to more competition for the job openings that exist. As a result, they are able to be more discriminating in who they hire. A reoccurring theme in the research is the sense of entitlement which new hires demonstrate. When asked why they believe professionalism has decreased, over a fourth of the respondents (27.5%) feeling this way refer to a sense of entitlement. Reinforcing this, over half of all respondents (52.9%) say there has been an increase in the percentage of new employees who exhibit a sense of entitlement. The way parents raised their children is most often seen as the reason for new employees feeling entitled (34.5%). Probably related to this, another 16.2% of the respondents believe new employees exhibiting a sense of entitlement have been coddled. Abuses of information technology continue to plague the workplace. Half of the respondents (50.1%) report that IT abuses have increased over the past five years. It is estimated that, on the average, half of all new college graduate employees (48.8%) abuse IT in some way. The types of IT abuse encountered in the workplace are numerous. The common types are: • Text messaging at inappropriate times (74.3%) • Inappropriate use of the Internet (65.7%) • Excessive twittering/use of Facebook (65.2%) • Excessive cell phone usage for personal calls (59.7%) • Text messaging/e-mailing when direct conversation is more appropriate (56.1%).
2013 Professionalism in the Workplace Major Findings
Polk-Lepson Research Group January 2013 York, Pennsylvania Page 10
Unfocused
Work Ethic
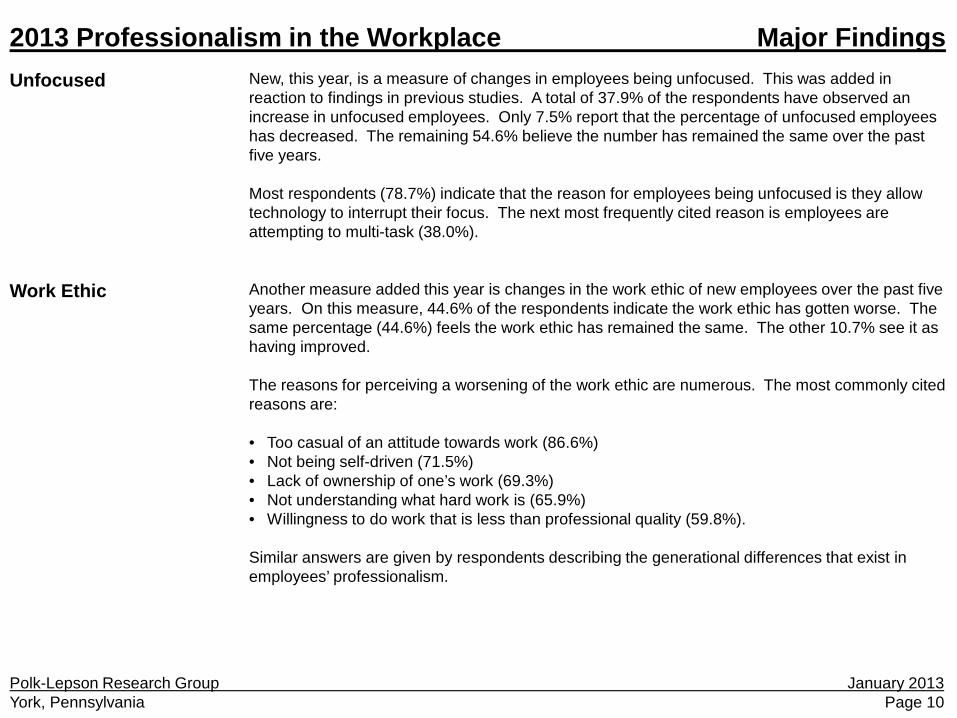
New, this year, is a measure of changes in employees being unfocused. This was added in reaction to findings in previous studies. A total of 37.9% of the respondents have observed an increase in unfocused employees. Only 7.5% report that the percentage of unfocused employees has decreased. The remaining 54.6% believe the number has remained the same over the past five years. Most respondents (78.7%) indicate that the reason for employees being unfocused is they allow technology to interrupt their focus. The next most frequently cited reason is employees are attempting to multi-task (38.0%). Another measure added this year is changes in the work ethic of new employees over the past five years. On this measure, 44.6% of the respondents indicate the work ethic has gotten worse. The same percentage (44.6%) feels the work ethic has remained the same. The other 10.7% see it as having improved. The reasons for perceiving a worsening of the work ethic are numerous. The most commonly cited reasons are: • Too casual of an attitude towards work (86.6%) • Not being self-driven (71.5%) • Lack of ownership of one’s work (69.3%) • Not understanding what hard work is (65.9%) • Willingness to do work that is less than professional quality (59.8%).
Similar answers are given by respondents describing the generational differences that exist in employees’ professionalism.
2013 Professionalism in the Workplace Major Findings
Polk-Lepson Research Group January 2013 York, Pennsylvania Page 11
Qualities of the Professional
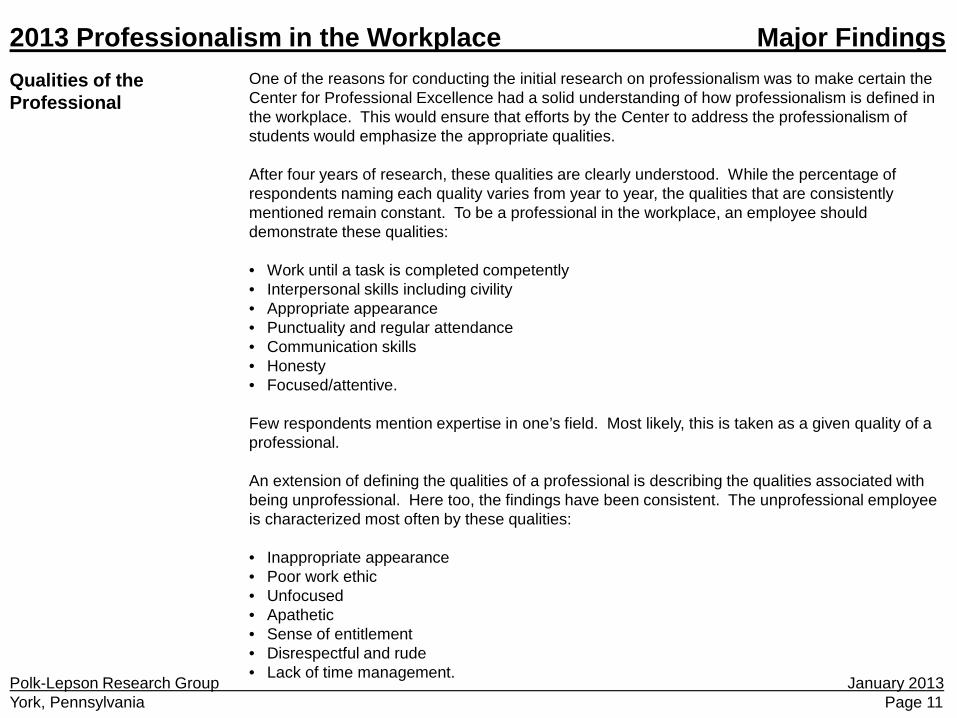
One of the reasons for conducting the initial research on professionalism was to make certain the Center for Professional Excellence had a solid understanding of how professionalism is defined in the workplace. This would ensure that efforts by the Center to address the professionalism of students would emphasize the appropriate qualities. After four years of research, these qualities are clearly understood. While the percentage of respondents naming each quality varies from year to year, the qualities that are consistently mentioned remain constant. To be a professional in the workplace, an employee should demonstrate these qualities: • Work until a task is completed competently • Interpersonal skills including civility • Appropriate appearance • Punctuality and regular attendance • Communication skills • Honesty • Focused/attentive. Few respondents mention expertise in one’s field. Most likely, this is taken as a given quality of a professional. An extension of defining the qualities of a professional is describing the qualities associated with being unprofessional. Here too, the findings have been consistent. The unprofessional employee is characterized most often by these qualities: • Inappropriate appearance • Poor work ethic • Unfocused • Apathetic • Sense of entitlement • Disrespectful and rude • Lack of time management.
2013 Professionalism in the Workplace Major Findings
Polk-Lepson Research Group January 2013 York, Pennsylvania Page 12
Generational Differences and Professionalism
How Not to Get Hired
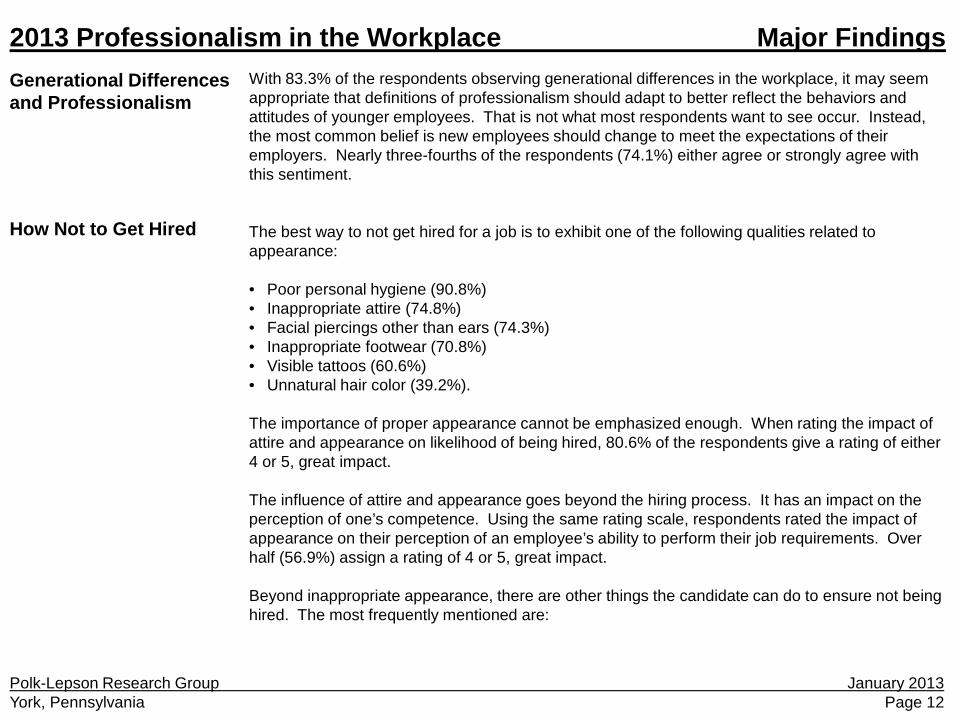
With 83.3% of the respondents observing generational differences in the workplace, it may seem appropriate that definitions of professionalism should adapt to better reflect the behaviors and attitudes of younger employees. That is not what most respondents want to see occur. Instead, the most common belief is new employees should change to meet the expectations of their employers. Nearly three-fourths of the respondents (74.1%) either agree or strongly agree with this sentiment. The best way to not get hired for a job is to exhibit one of the following qualities related to appearance: • Poor personal hygiene (90.8%) • Inappropriate attire (74.8%) • Facial piercings other than ears (74.3%) • Inappropriate footwear (70.8%) • Visible tattoos (60.6%) • Unnatural hair color (39.2%). The importance of proper appearance cannot be emphasized enough. When rating the impact of attire and appearance on likelihood of being hired, 80.6% of the respondents give a rating of either 4 or 5, great impact. The influence of attire and appearance goes beyond the hiring process. It has an impact on the perception of one’s competence. Using the same rating scale, respondents rated the impact of appearance on their perception of an employee’s ability to perform their job requirements. Over half (56.9%) assign a rating of 4 or 5, great impact. Beyond inappropriate appearance, there are other things the candidate can do to ensure not being hired. The most frequently mentioned are:
2013 Professionalism in the Workplace Major Findings
Polk-Lepson Research Group January 2013 York, Pennsylvania Page 13
How Not to Get Hired (continued) Best Ways to Get Fired
Age Differences
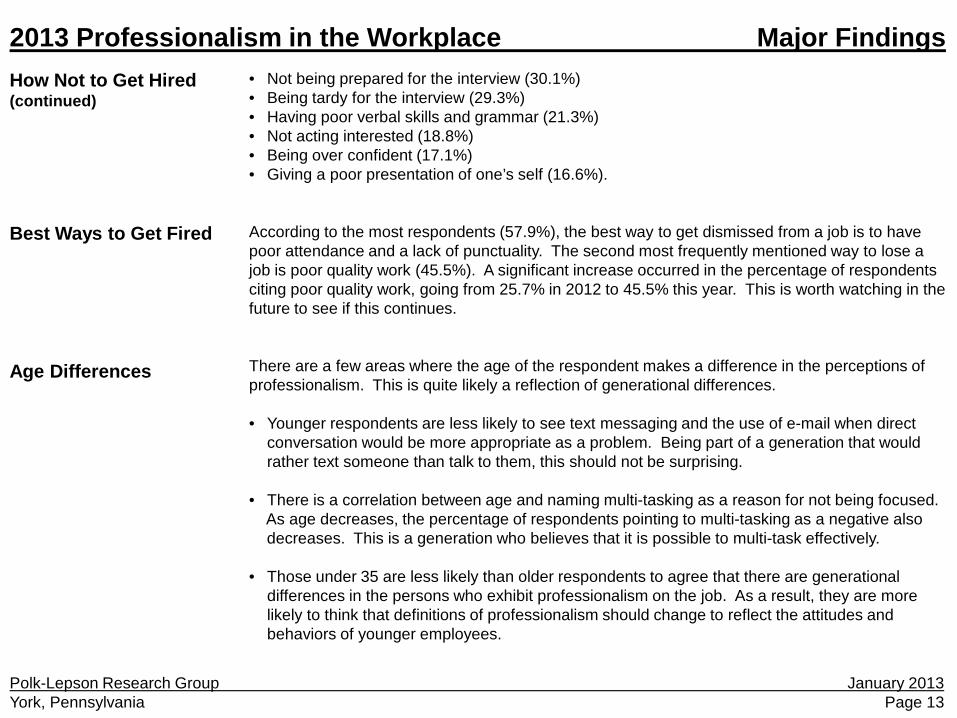
• Not being prepared for the interview (30.1%) • Being tardy for the interview (29.3%) • Having poor verbal skills and grammar (21.3%) • Not acting interested (18.8%) • Being over confident (17.1%) • Giving a poor presentation of one’s self (16.6%). According to the most respondents (57.9%), the best way to get dismissed from a job is to have poor attendance and a lack of punctuality. The second most frequently mentioned way to lose a job is poor quality work (45.5%). A significant increase occurred in the percentage of respondents citing poor quality work, going from 25.7% in 2012 to 45.5% this year. This is worth watching in the future to see if this continues. There are a few areas where the age of the respondent makes a difference in the perceptions of professionalism. This is quite likely a reflection of generational differences. • Younger respondents are less likely to see text messaging and the use of e-mail when direct
conversation would be more appropriate as a problem. Being part of a generation that would rather text someone than talk to them, this should not be surprising.
• There is a correlation between age and naming multi-tasking as a reason for not being focused. As age decreases, the percentage of respondents pointing to multi-tasking as a negative also decreases. This is a generation who believes that it is possible to multi-task effectively. • Those under 35 are less likely than older respondents to agree that there are generational
differences in the persons who exhibit professionalism on the job. As a result, they are more likely to think that definitions of professionalism should change to reflect the attitudes and behaviors of younger employees.
2013 Professionalism in the Workplace Major Findings
Polk-Lepson Research Group January 2013 York, Pennsylvania Page 14
Observations – How to Succeed on the Job with Professionalism
With the state of professionalism in the workplace not improving, job candidates understanding professionalism will have a significant advantage over those who do not. The demonstration of the qualities of professionalism will give the candidate an edge in getting hired. Once hired, professionalism on the job will help distinguish the new employee from other recent hires. The qualities that characterize the professional are straightforward. The challenge is many of the behaviors and attitudes that epitomize being unprofessional are a part of our culture and, in some cases, daily lives. An argument that could be made is standards of professionalism should change with time to reflect these cultural values and behaviors. There is evidence that younger respondents view professionalism somewhat differently than older ones. However, today’s job applicants do not have the luxury of waiting for the older respondents, who find professionalism lacking in new employees, to retire. Based on the research findings from the past four years, here is the advice that will differentiate applicants from one another. • Do not demonstrate a sense of entitlement
Comments are made by respondents that job applicants feel they have paid their dues by graduating from college. Students have the right to feel joyous about graduating from college. It is an accomplishment about which one should be proud. However, students would be wise to refer to the event as commencement rather than graduation. The undergraduate degree is only a start. It is a prerequisite for eligibility for many of today’s jobs. The degree does not entitle the recipient to anything. When sharing the research findings, a discussion inevitably occurs on what factors have led to this sense of entitlement. Respondents in the surveys point to parents, privileged childhoods, the political climate, and our culture as being responsible for the sense of entitlement. The education system should be added to this list. As one example, students have learned that they can receive acceptable grades without necessarily putting in the effort that should be required to those grades. Anyone who has given students the opportunity to get extra credit to improve a
2013 Professionalism in the Workplace Major Findings
Polk-Lepson Research Group January 2013 York, Pennsylvania Page 15
Observations (continued)
grade has contributed to a sense that one can receive a reward without putting in the effort. Whatever the culprits are that contributed to this sense of entitlement, being aware of it and not demonstrating it will reward the job applicant. An attitude that cannot fail is “no one owes you anything.” • Control your on-the-job use of technology
One of the best things a new employee can do is lock away their cell phone and disable access to the Internet when on the job. Abuse of technology has become common in the office. Other studies have found that persons feel lost without their cell phones. This research has discovered situations in which job applicants either have their cell phones on or have actually used their cell phones during an interview. The sad fact is some of these persons probably do not understand what is wrong with this. It is time for employees to wean themselves from the addiction of constantly having to be in contact with others via technology. Twittering or checking Facebook are activities that do not belong on the job. With job related activities, when you are sending an e-mail or text, ask yourself if a direct conversation with the person would not be more appropriate. The convenience of technology can prompt us to use it when other means of communication would be better or more effective. An additional benefit of disciplining oneself in the use of technology is becoming more focused. Over a third of the respondents observed that there has been an increase in new employees who are unfocused. The number one cause of a lack of focus is identified by respondents as allowing technology to interrupt one’s activities. Remember that the ability to multi-task effectively is a myth.
2013 Professionalism in the Workplace Major Findings
Polk-Lepson Research Group January 2013 York, Pennsylvania Page 16
Observations (continued)
• Be committed to doing quality work Close to half of the respondents feel the work ethic in new employees has gotten worse. When asked why they believe this, respondents reply that employees take a casual attitude towards their work and are willing to do work that is less than professional quality. The education system can take some credit for this. Giving students extensions on deadlines for assignments and not taking the time and effort to demand quality work promotes the mistaken belief that this is acceptable behavior. When students receive good grades for mediocre work, they can develop an inflated image of their abilities and talents. It is too easy to transfer these learned behaviors to the job. • Learn what is means to be professional The qualities associated with being professional and unprofessional are now clearly understood. The new employee should never assume that there is not something new to learn about themselves. Of course, the perception of oneself can be distorted by subjectivity. This is why being open to criticism and feedback is a professional quality that should be emphasized. It cannot be assumed that the employer will offer the new employee professionalism training. Less than half of the companies in the 2012 survey reported that their company has programs on professionalism. Until more colleges take on the task of exposing students to professionalism, it is incumbent upon the individual to learn how to behave professionally. • Remember appearance matters It is important to recognize that what was acceptable or the norm in college does not necessarily apply to the workplace. Dressing appropriately for an interview is a given. Poor personal hygiene will negatively impact one’s chances of being hired. Visible tattoos will limit the odds of getting the job. The impact of appearance goes beyond affecting the likelihood of getting hired. Respondents also indicate that it has an impact on the perception of one’s competence on the job.
2013 Professionalism in the Workplace Major Findings
Polk-Lepson Research Group January 2013 York, Pennsylvania Page 17
Observations (continued)
• Be prepared for the interview
The final piece of advice to maximize one’s probability of being hired is to be prepared for the interview. Know what works and does not work during an interview. Learn about the company prior to the interview. During the interview, be engaging by asking questions and showing interest. Avoid asking about benefits and opportunities for advancement. Those topics should be addressed later. Have a realistic assessment of your current abilities and talents. Lastly, be certain to turn off your cell phone when in walk in the door.
2013 Professionalism in the Workplace Major Findings
Polk-Lepson Research Group January 2013 York, Pennsylvania Page 18
2013 Professionalism in the Workplace State of Professionalism
State of Professionalism
Polk-Lepson Research Group January 2013 York, Pennsylvania Page 19
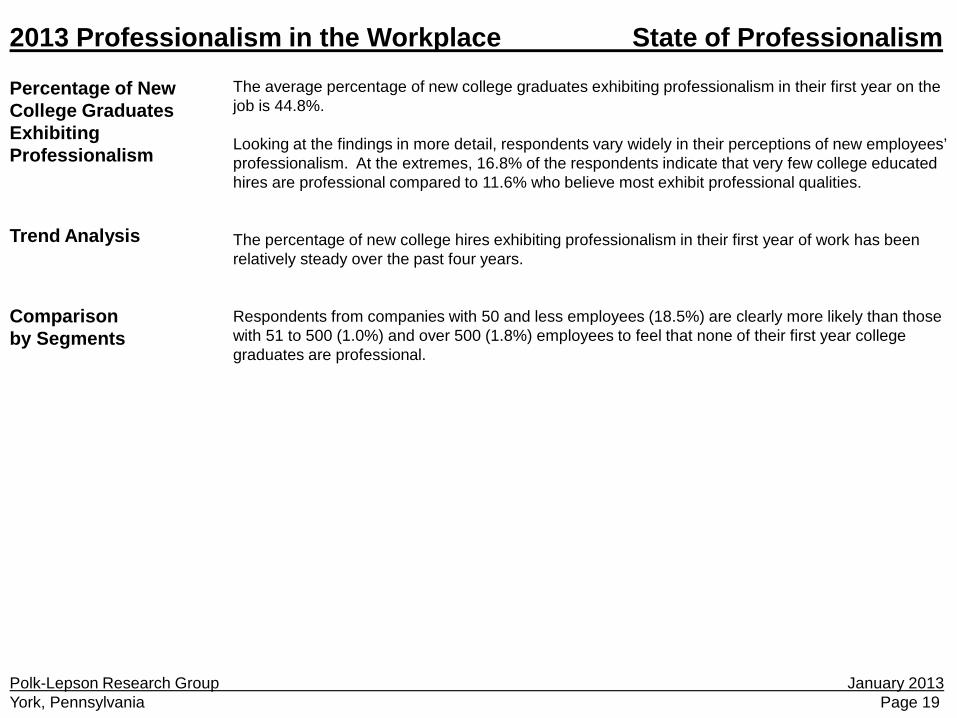
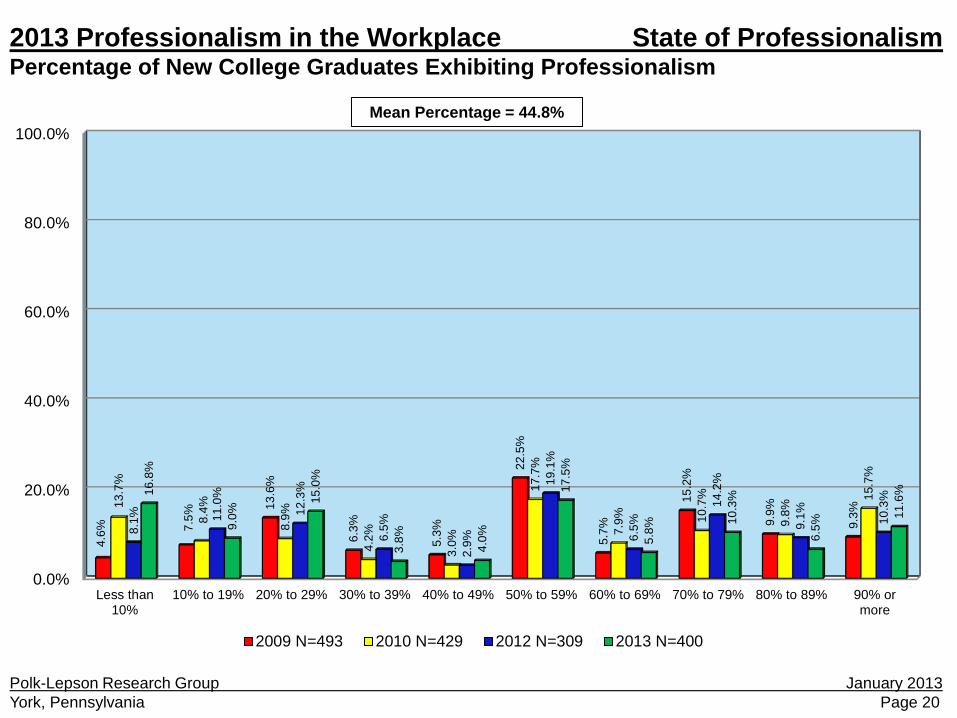
Percentage of New College Graduates Exhibiting Professionalism Trend Analysis Comparison by Segments
The average percentage of new college graduates exhibiting professionalism in their first year on the job is 44.8%. Looking at the findings in more detail, respondents vary widely in their perceptions of new employees’ professionalism. At the extremes, 16.8% of the respondents indicate that very few college educated hires are professional compared to 11.6% who believe most exhibit professional qualities. The percentage of new college hires exhibiting professionalism in their first year of work has been relatively steady over the past four years. Respondents from companies with 50 and less employees (18.5%) are clearly more likely than those with 51 to 500 (1.0%) and over 500 (1.8%) employees to feel that none of their first year college graduates are professional.
2013 Professionalism in the Workplace State of Professionalism
Polk-Lepson Research Group January 2013 York, Pennsylvania Page 20
2013 Professionalism in the Workplace State of Professionalism Percentage of New College Graduates Exhibiting Professionalism
0.0%
20.0%
40.0%
60.0%
80.0%
100.0%
Less than10%
10% to 19% 20% to 29% 30% to 39% 40% to 49% 50% to 59% 60% to 69% 70% to 79% 80% to 89% 90% ormore
4.6%
7.5%
13.6
%
6.3%
5.3%
22.5
%
5.7%
15.2
%
9.9%
9.3%
13.7
%
8.4%
8.9%
4.2%
3.0%
17.7
%
7.9%
10.7
%
9.8%
15.7
%
8.1%
11.0
%
12.3
%
6.5%
2.9%
19.1
%
6.5%
14.2
%
9.1%
10.3
% 16
.8%
9.0%
15.0
%
3.8%
4.0%
17.5
%
5.8%
10.3
%
6.5%
11.6
%
2009 N=493 2010 N=429 2012 N=309 2013 N=400
Mean Percentage = 44.8%
Changes in Exhibiting Professionalism Trend Analysis
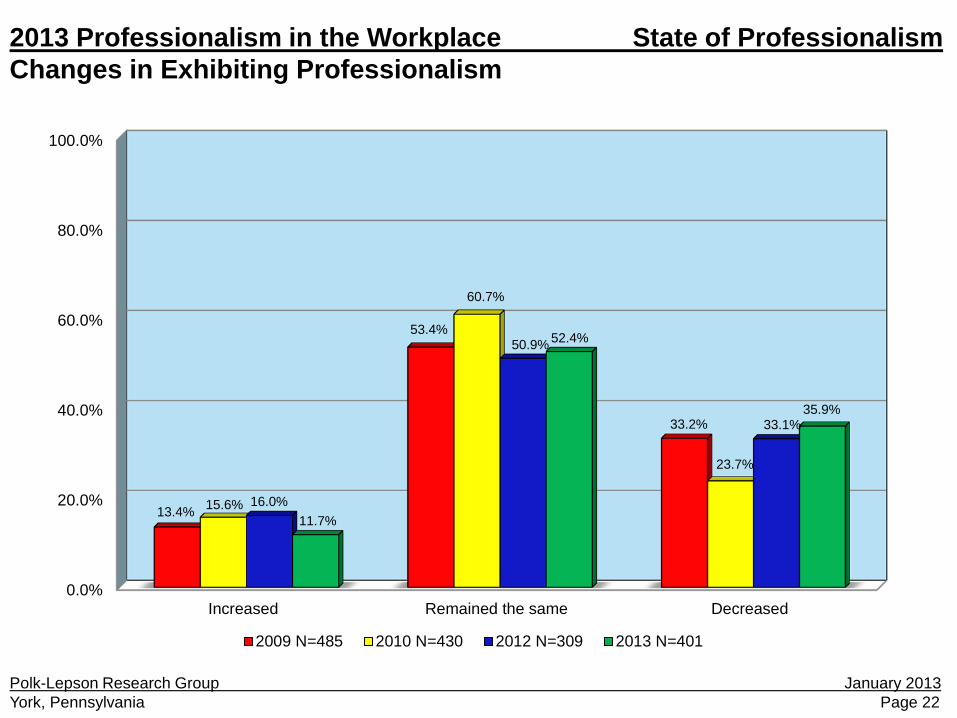
More than a third of the respondents (35.9%) feel the percentage of new college graduates exhibiting professionalism over the past five years has decreased. In contrast, 11.7% indicate that professionalism has increased. This leaves 52.4% who believe it has remained the same over this time period. With the exception of 2010, these percentages have remained the same.
Polk-Lepson Research Group January 2013 York, Pennsylvania Page 21
2013 Professionalism in the Workplace State of Professionalism
Polk-Lepson Research Group January 2013 York, Pennsylvania Page 22
2013 Professionalism in the Workplace State of Professionalism Changes in Exhibiting Professionalism
0.0%
20.0%
40.0%
60.0%
80.0%
100.0%
Increased Remained the same Decreased
13.4%
53.4%
33.2%
15.6%
60.7%
23.7%
16.0%
50.9%
33.1%
11.7%
52.4%
35.9%
2009 N=485 2010 N=430 2012 N=309 2013 N=401
Reasons for Increases in Professionalism Reasons for Decreases in Professionalism Trend Analysis
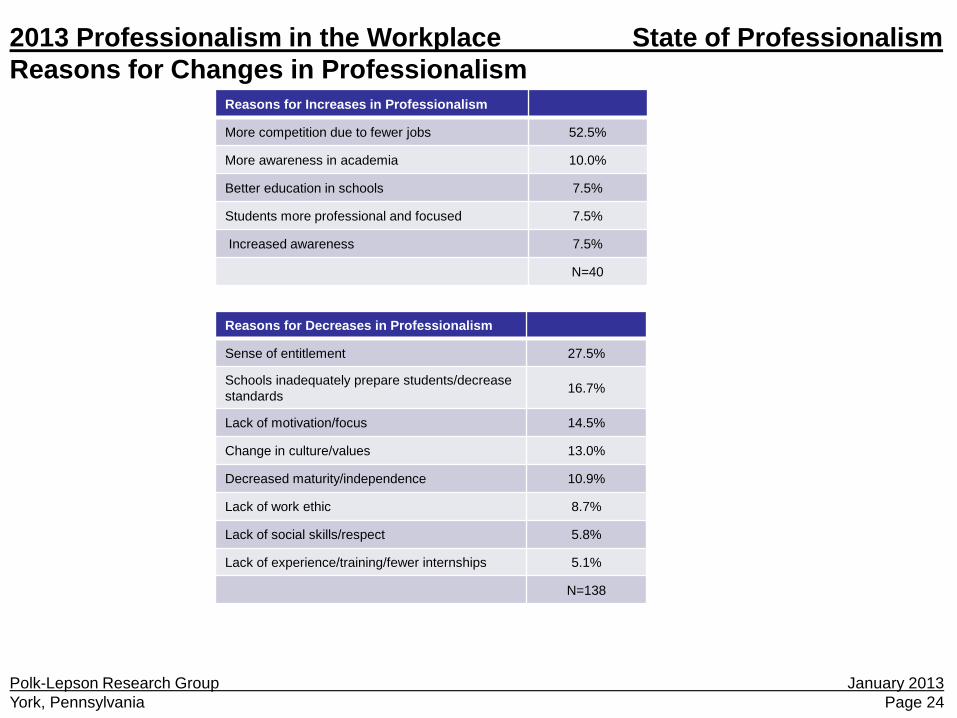
The most common reason cited for an increase in professionalism is more competition due to fewer jobs being available (52.5%). The same was found last year. This is one positive outcome of the economic recession. With more persons looking for work, companies have a larger pool of applicants from which to hire. Over a fourth of the respondents (27.5%) point to a sense of entitlement as the reason for a decrease in the percentage of new employees exhibiting professionalism in their first year of work. This is followed by the belief that schools are not adequately preparing students for the work world (16.7%), a lack of motivation and focus (14.5%), and a change in cultural values (13.0%). Reasons given for increases and decreases in professionalism parallel those seen last year.
Polk-Lepson Research Group January 2013 York, Pennsylvania Page 23
2013 Professionalism in the Workplace State of Professionalism
Polk-Lepson Research Group January 2013 York, Pennsylvania Page 24
2013 Professionalism in the Workplace State of Professionalism Reasons for Changes in Professionalism
Reasons for Increases in Professionalism
More competition due to fewer jobs 52.5%
More awareness in academia 10.0%
Better education in schools 7.5%
Students more professional and focused 7.5%
Increased awareness 7.5%
N=40
Reasons for Decreases in Professionalism
Sense of entitlement 27.5%
Schools inadequately prepare students/decrease standards 16.7%
Lack of motivation/focus 14.5%
Change in culture/values 13.0%
Decreased maturity/independence 10.9%
Lack of work ethic 8.7%
Lack of social skills/respect 5.8%
Lack of experience/training/fewer internships 5.1%
N=138
Polk-Lepson Research Group January 2013 York, Pennsylvania Page 25
Changes in Sense of Entitlement
Trend Analysis
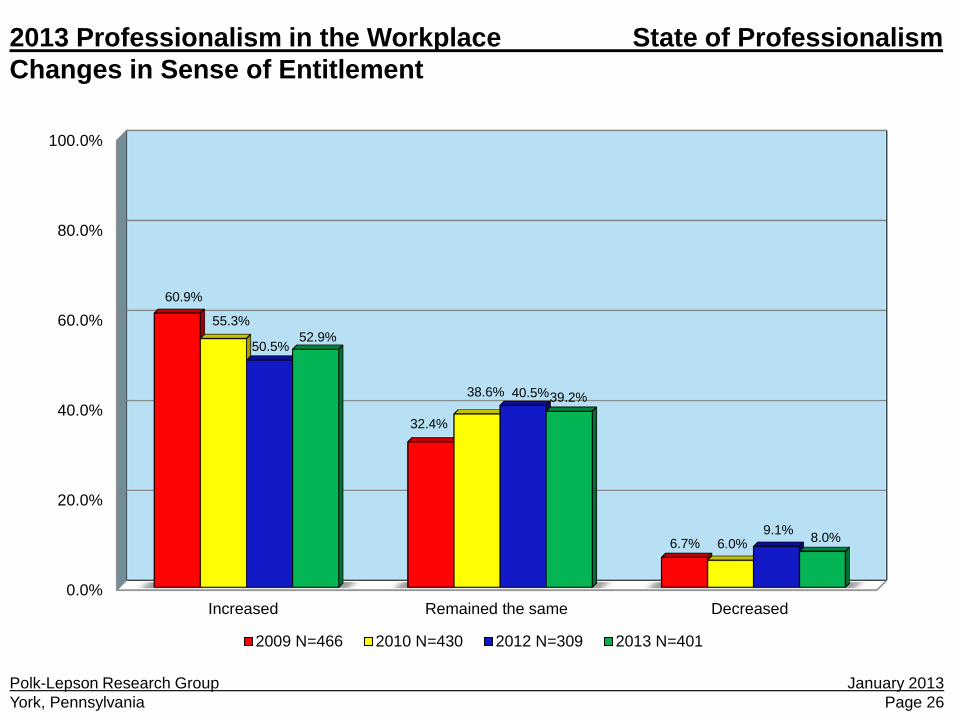
Comments on entitlement as a reason for the decline in professionalism foreshadowed a question on changes seen in a sense of entitlement. The question asked about the sense of entitlement exhibited by first year college educated employees over the past five years. Entitlement was defined as expecting rewards without putting in the work or effort to merit the rewards. Over half of the respondents (52.9%) feel a sense of entitlement has increased during the past five years. Only 8.0% believe it has decreased. This leaves 39.2% stating it has remained the same over this time period.
For the last three studies, these percentages have been similar.
2013 Professionalism in the Workplace State of Professionalism
Polk-Lepson Research Group January 2013 York, Pennsylvania Page 26
2013 Professionalism in the Workplace State of Professionalism Changes in Sense of Entitlement
0.0%
20.0%
40.0%
60.0%
80.0%
100.0%
Increased Remained the same Decreased
60.9%
32.4%
6.7%
55.3%
38.6%
6.0%
50.5%
40.5%
9.1%
52.9%
39.2%
8.0%
2009 N=466 2010 N=430 2012 N=309 2013 N=401
Factors Contributing to Sense of Entitlement
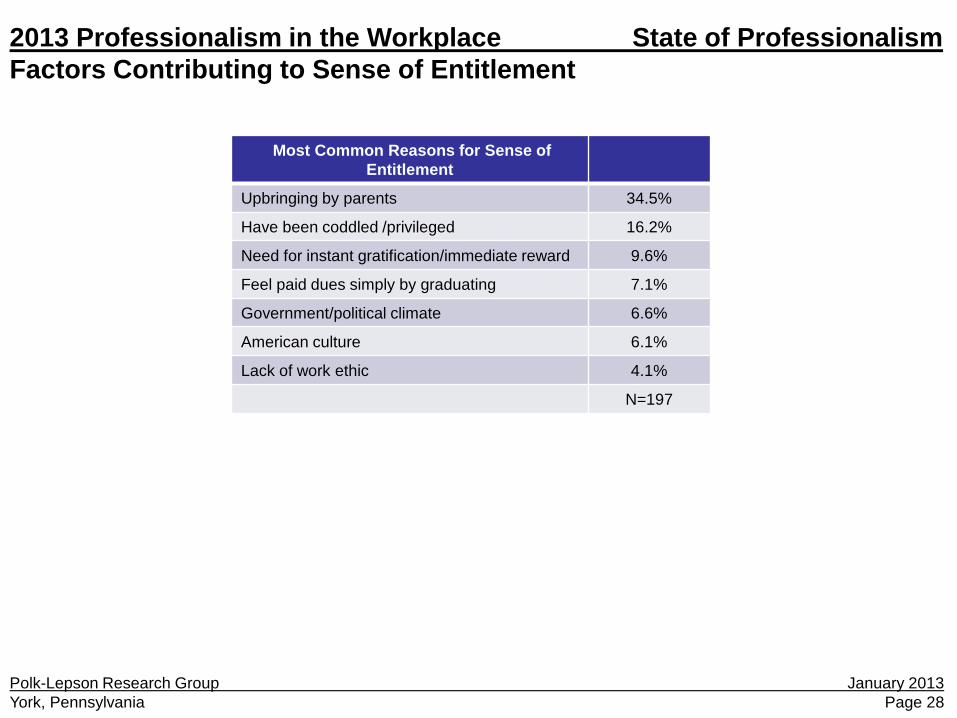
Respondents who see an increase in the sense of entitlement most often point to the way parents have raised their children as the factor responsible for this (34.5%). Related to this, 16.2% believe these employees have been coddled.
Polk-Lepson Research Group January 2013 York, Pennsylvania Page 27
2013 Professionalism in the Workplace State of Professionalism
Polk-Lepson Research Group January 2013 York, Pennsylvania Page 28
2013 Professionalism in the Workplace State of Professionalism Factors Contributing to Sense of Entitlement
Most Common Reasons for Sense of Entitlement
Upbringing by parents 34.5%
Have been coddled /privileged 16.2%
Need for instant gratification/immediate reward 9.6%
Feel paid dues simply by graduating 7.1%
Government/political climate 6.6%
American culture 6.1%
Lack of work ethic 4.1%
N=197
Polk-Lepson Research Group January 2013 York, Pennsylvania Page 29
Changes in IT Etiquette/Abuses Trend Analysis
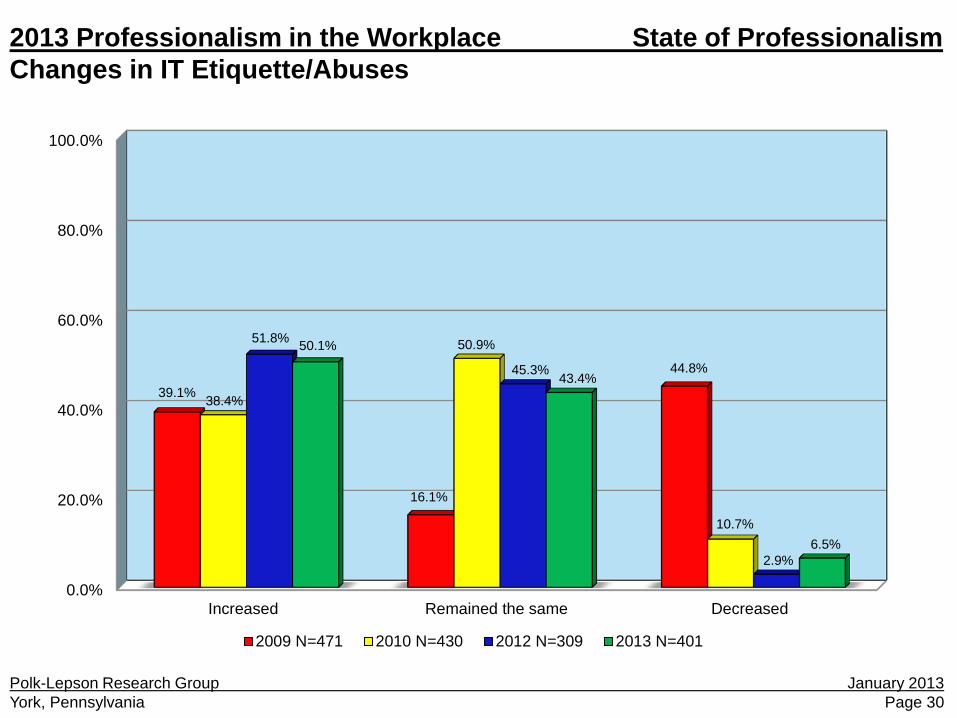
Half of the respondents (50.1%) indicate that problems with IT abuses or etiquette among new employees have increased over the last five years. Few respondents (6.5%) believe these types of problems have decreased during this time period. From 2010 to 2012, there was a notable increase in the percentage of respondents reporting more problems with IT abuses. This increase has been sustained this year.
2013 Professionalism in the Workplace State of Professionalism
Polk-Lepson Research Group January 2013 York, Pennsylvania Page 30
2013 Professionalism in the Workplace State of Professionalism Changes in IT Etiquette/Abuses
0.0%
20.0%
40.0%
60.0%
80.0%
100.0%
Increased Remained the same Decreased
39.1%
16.1%
44.8%
38.4%
50.9%
10.7%
51.8%
45.3%
2.9%
50.1%
43.4%
6.5%
2009 N=471 2010 N=430 2012 N=309 2013 N=401
Polk-Lepson Research Group January 2013 York, Pennsylvania Page 31
Percentage of New College Graduates Engaging in IT Abuses
Comparison by Segments
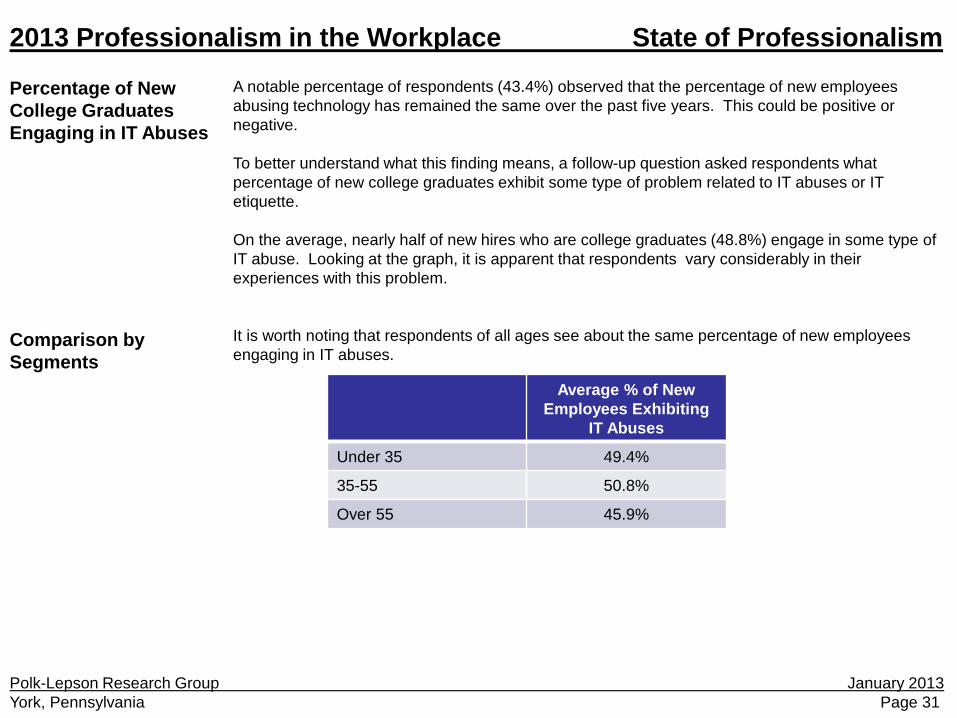
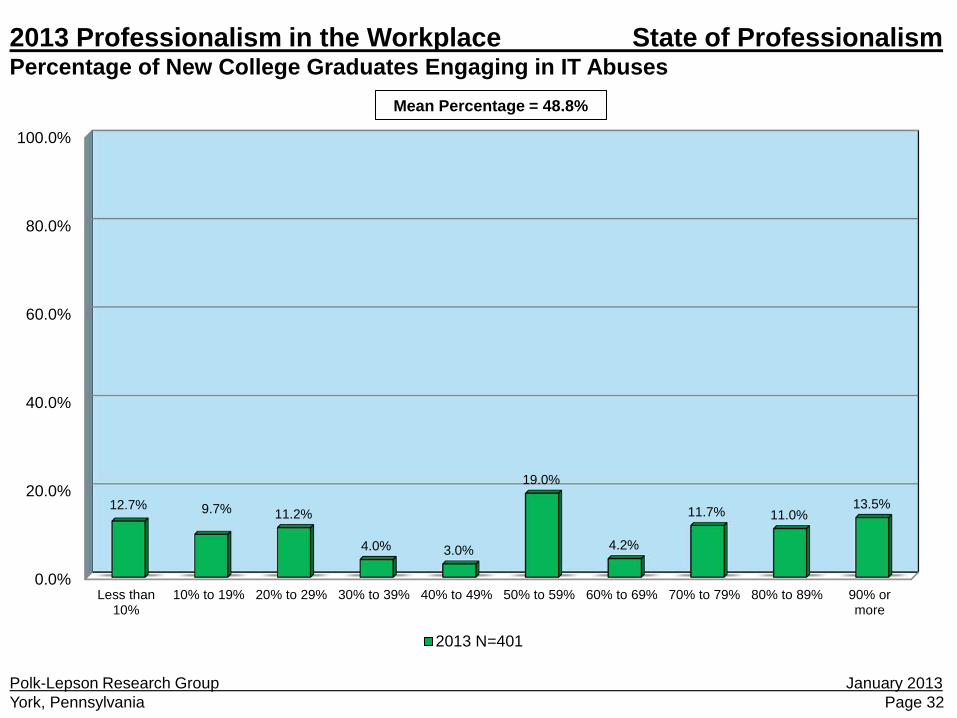
A notable percentage of respondents (43.4%) observed that the percentage of new employees abusing technology has remained the same over the past five years. This could be positive or negative. To better understand what this finding means, a follow-up question asked respondents what percentage of new college graduates exhibit some type of problem related to IT abuses or IT etiquette. On the average, nearly half of new hires who are college graduates (48.8%) engage in some type of IT abuse. Looking at the graph, it is apparent that respondents vary considerably in their experiences with this problem. It is worth noting that respondents of all ages see about the same percentage of new employees engaging in IT abuses.
2013 Professionalism in the Workplace State of Professionalism
Average % of New Employees Exhibiting
IT Abuses
Under 35 49.4%
35-55 50.8%
Over 55 45.9%
Polk-Lepson Research Group January 2013 York, Pennsylvania Page 32
2013 Professionalism in the Workplace State of Professionalism Percentage of New College Graduates Engaging in IT Abuses
0.0%
20.0%
40.0%
60.0%
80.0%
100.0%
Less than10%
10% to 19% 20% to 29% 30% to 39% 40% to 49% 50% to 59% 60% to 69% 70% to 79% 80% to 89% 90% ormore
12.7% 9.7% 11.2%
4.0% 3.0%
19.0%
4.2%
11.7% 11.0% 13.5%
2013 N=401
Mean Percentage = 48.8%
Polk-Lepson Research Group January 2013 York, Pennsylvania Page 33
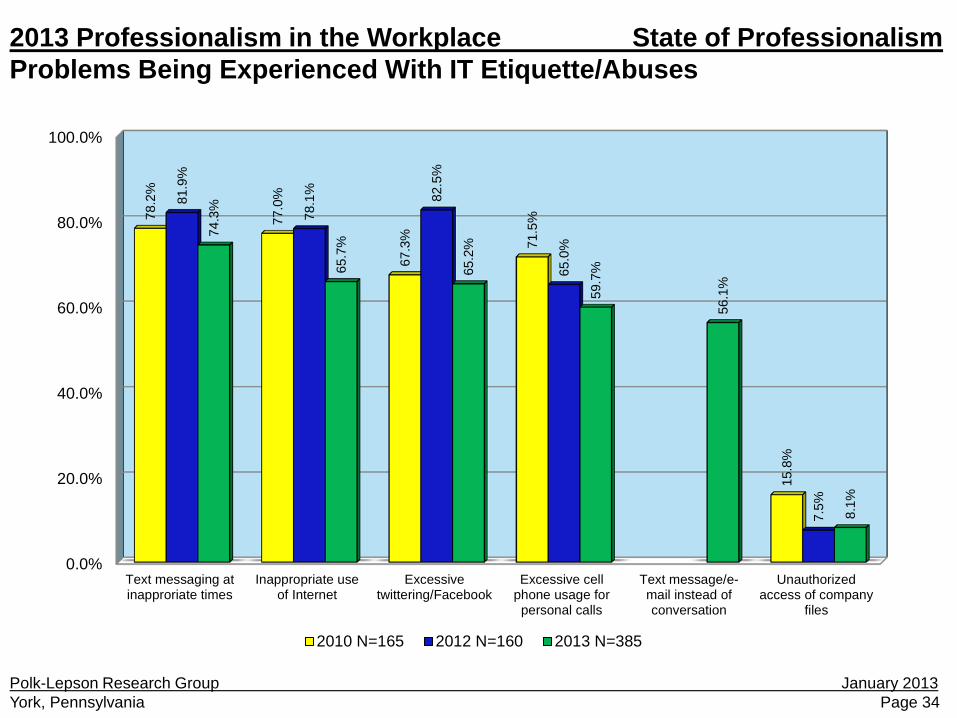
Problems Being Experienced With IT Etiquette/Abuses Trend Analysis Comparison by Segments
To better understand what abuses are being experienced, respondents were presented a list of possible abuses or etiquette problems and asked what are the major problems they encounter. As seen in the graph, the problems are numerous. The most common one is text messaging at inappropriate times (74.3%). This is followed by inappropriate use of the Internet (65.7%) and excessive twittering and use of Facebook (65.2%). This year, text messaging or e-mailing when direct conversation would have been more appropriate was added to the list. Over half of the respondents (56.1%) report that this is a problem they see in the workplace. Over the three years that IT problems have been identified, the problems most often experienced have remained the same. A correlation exists between age of the respondent and the likelihood of reporting text messaging or e-mail when direct conversation would have been more appropriate. As age increases, the percentage of respondents indicating this is a problem also increases. It is possible that younger respondents do this themselves and, as a result, do not see it as a problem. While younger respondents may not see texting or e-mails instead of direct conversation as a problem, it should be recalled that they are no less likely than older respondents to report employees are engaging in IT abuses.
2013 Professionalism in the Workplace State of Professionalism
Polk-Lepson Research Group January 2013 York, Pennsylvania Page 34
2013 Professionalism in the Workplace State of Professionalism Problems Being Experienced With IT Etiquette/Abuses
0.0%
20.0%
40.0%
60.0%
80.0%
100.0%
Text messaging atinapproriate times
Inappropriate useof Internet
Excessivetwittering/Facebook
Excessive cellphone usage forpersonal calls
Text message/e-mail instead ofconversation
Unauthorizedaccess of company
files
78.2
%
77.0
%
67.3
%
71.5
%
15.8
%
81.9
%
78.1
%
82.5
%
65.0
%
7.5%
74.3
%
65.7
%
65.2
%
59.7
%
56.1
%
8.1%
2010 N=165 2012 N=160 2013 N=385
Polk-Lepson Research Group January 2013 York, Pennsylvania Page 35
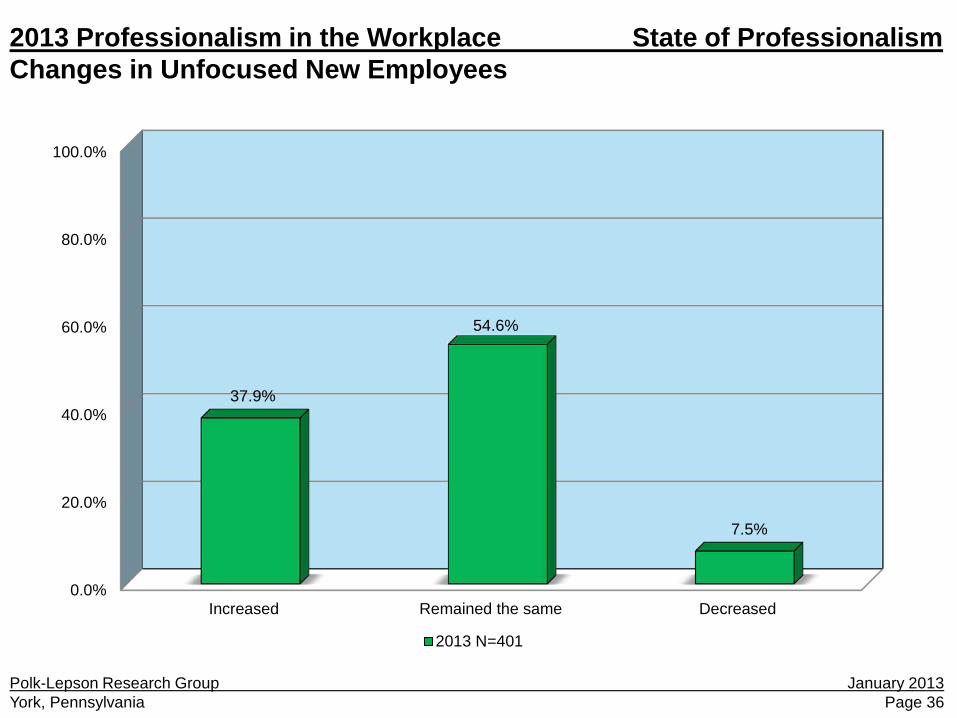
Changes in Unfocused New Employees
In 2010, the percentage of respondents reporting employees being unfocused increased dramatically to 20.5% from 6.1% in 2009. In response to this, respondents in this year’s study rated whether the number of new employees who are unfocused decreased, remained the same, or increased over the past five years. The most notable finding is 37.9% of the respondents report the number of unfocused employees has increased.
2013 Professionalism in the Workplace State of Professionalism
Polk-Lepson Research Group January 2013 York, Pennsylvania Page 36
2013 Professionalism in the Workplace State of Professionalism Changes in Unfocused New Employees
0.0%
20.0%
40.0%
60.0%
80.0%
100.0%
Increased Remained the same Decreased
37.9%
54.6%
7.5%
2013 N=401
Polk-Lepson Research Group January 2013 York, Pennsylvania Page 37
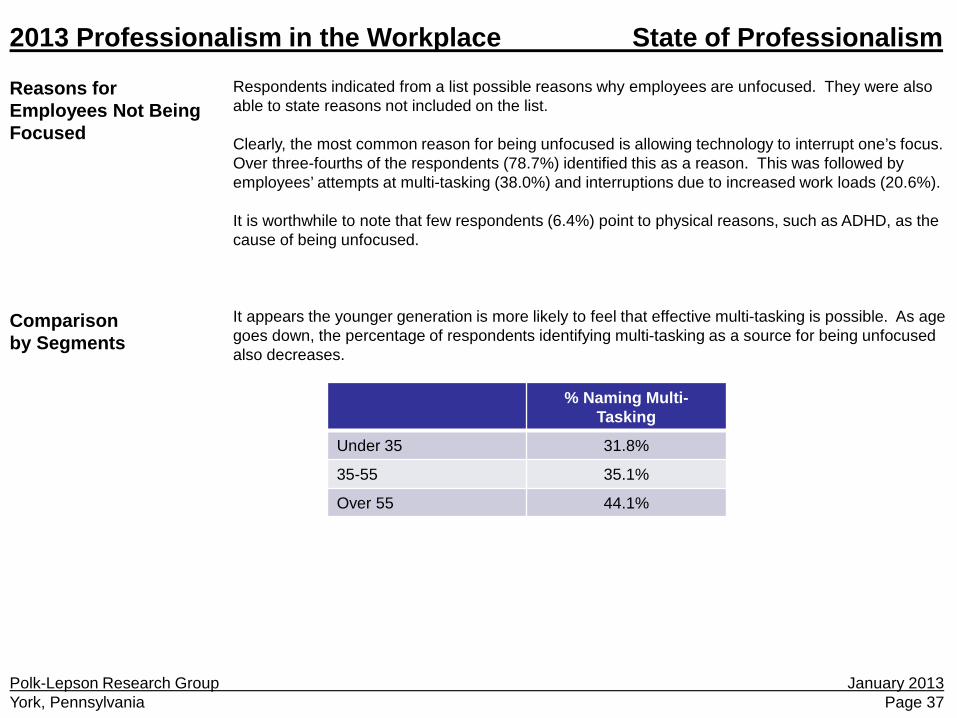
Reasons for Employees Not Being Focused Comparison by Segments
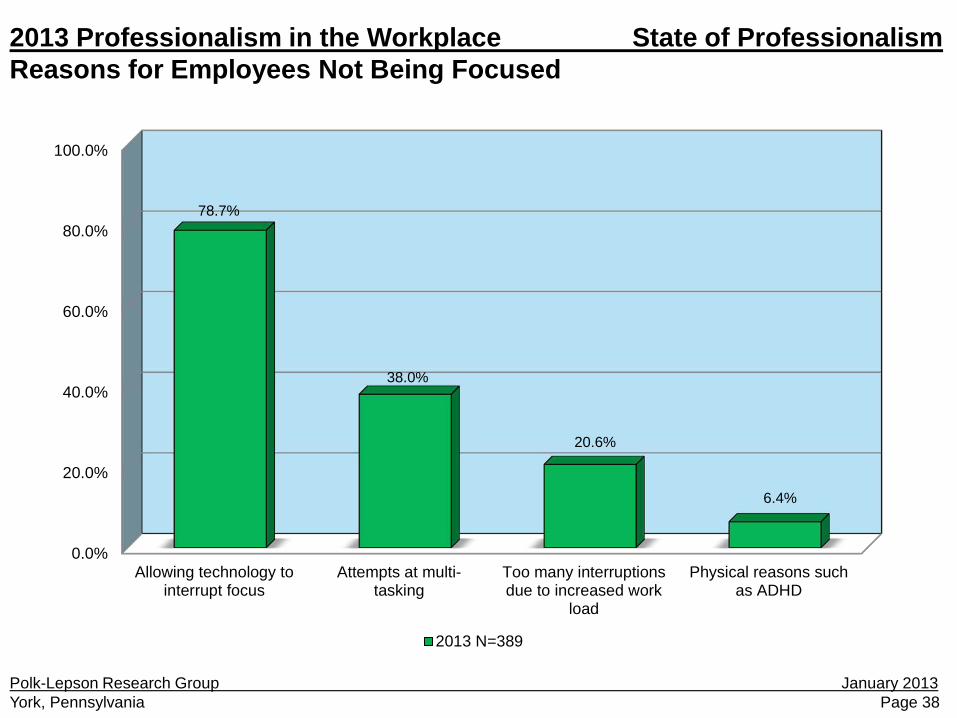
Respondents indicated from a list possible reasons why employees are unfocused. They were also able to state reasons not included on the list. Clearly, the most common reason for being unfocused is allowing technology to interrupt one’s focus. Over three-fourths of the respondents (78.7%) identified this as a reason. This was followed by employees’ attempts at multi-tasking (38.0%) and interruptions due to increased work loads (20.6%). It is worthwhile to note that few respondents (6.4%) point to physical reasons, such as ADHD, as the cause of being unfocused. It appears the younger generation is more likely to feel that effective multi-tasking is possible. As age goes down, the percentage of respondents identifying multi-tasking as a source for being unfocused also decreases.
2013 Professionalism in the Workplace State of Professionalism
% Naming Multi-Tasking
Under 35 31.8%
35-55 35.1%
Over 55 44.1%
Polk-Lepson Research Group January 2013 York, Pennsylvania Page 38
2013 Professionalism in the Workplace State of Professionalism Reasons for Employees Not Being Focused
0.0%
20.0%
40.0%
60.0%
80.0%
100.0%
Allowing technology tointerrupt focus
Attempts at multi-tasking
Too many interruptionsdue to increased work
load
Physical reasons suchas ADHD
78.7%
38.0%
20.6%
6.4%
2013 N=389
Polk-Lepson Research Group January 2013 York, Pennsylvania Page 39
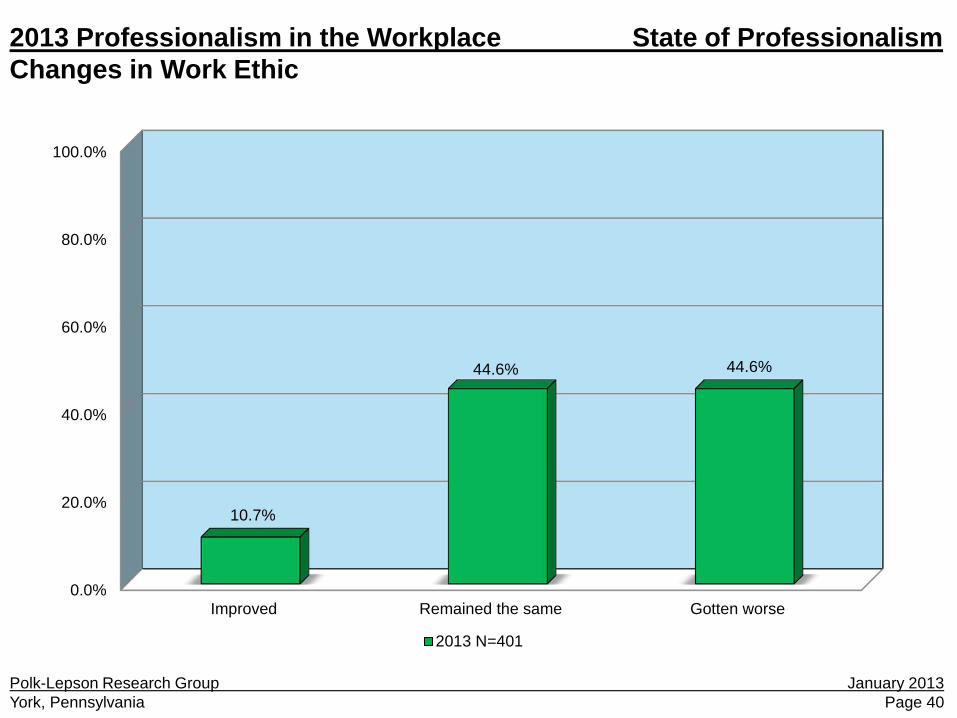
Changes in Work Ethic
Previous research found respondents complaining about the work ethic of new college educated employees. To quantify the extent to which this is experienced as a problem, a new question was added to this year’s survey. The question asked respondents if the work ethic of new employees has improved, remained the same, or gotten worse over the past five years. The most striking finding is the percentage reporting that the work ethic has declined. This percentage is 44.6%. The same percentage feels it has remained the same. This leaves 10.7% who believe the work ethic has improved.
2013 Professionalism in the Workplace State of Professionalism
Polk-Lepson Research Group January 2013 York, Pennsylvania Page 40
2013 Professionalism in the Workplace State of Professionalism Changes in Work Ethic
0.0%
20.0%
40.0%
60.0%
80.0%
100.0%
Improved Remained the same Gotten worse
10.7%
44.6% 44.6%
2013 N=401
Polk-Lepson Research Group January 2013 York, Pennsylvania Page 41
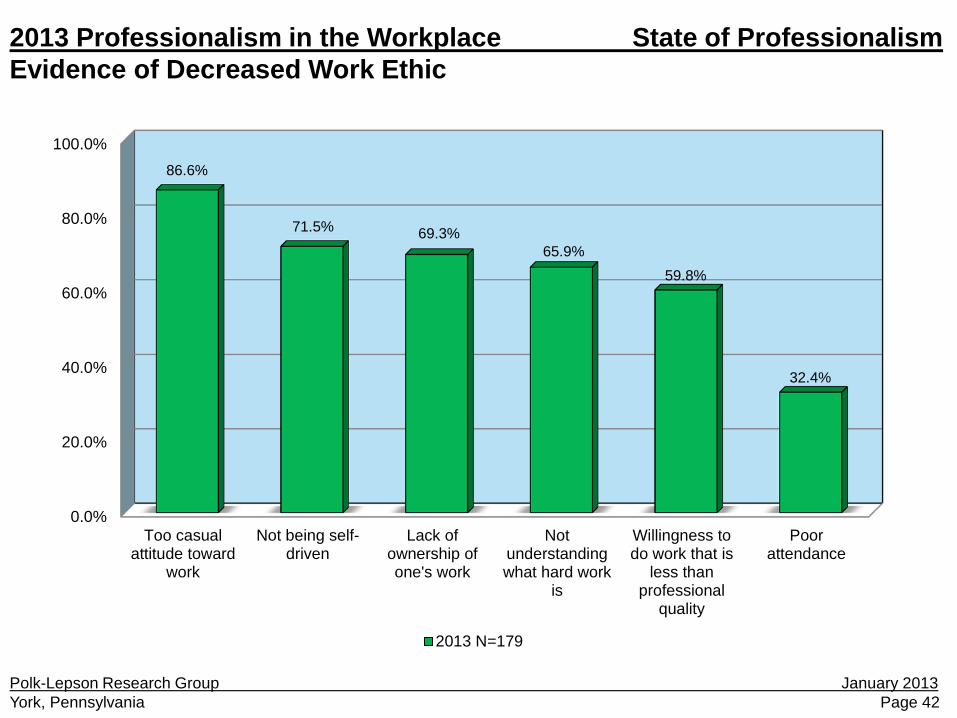
Evidence of Decreased Work Ethic
Respondents who feel the work ethic has gotten worse were asked for evidence that this has occurred. They could either select answers from a list or provide their own response. Numerous reasons were given for a decline in the work ethic. The most frequently cited reason was having too causal of an attitude towards work (86.6%). Four other behaviors were commonly identified as evidence of a decrease in the work ethic. These were not being self-driven (71.5%), lack of ownership of one’s work (69.3%), not understanding what hard work is (65.9%), and willingness to do work that is less than professional quality (59.8%).
2013 Professionalism in the Workplace State of Professionalism
Polk-Lepson Research Group January 2013 York, Pennsylvania Page 42
2013 Professionalism in the Workplace State of Professionalism Evidence of Decreased Work Ethic
0.0%
20.0%
40.0%
60.0%
80.0%
100.0%
Too casualattitude toward
work
Not being self-driven
Lack ofownership ofone's work
Notunderstandingwhat hard work
is
Willingness todo work that is
less thanprofessional
quality
Poorattendance
86.6%
71.5% 69.3% 65.9%
59.8%
32.4%
2013 N=179
Polk-Lepson Research Group January 2013 York, Pennsylvania Page 43
Generational Differences in Professionalism Comparison by Segments
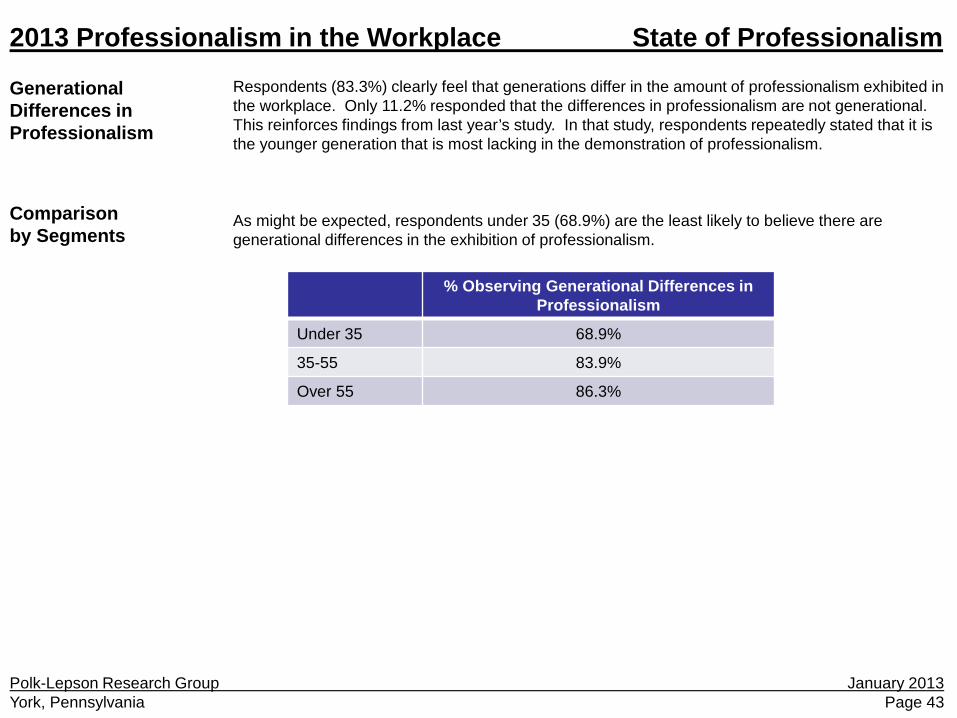
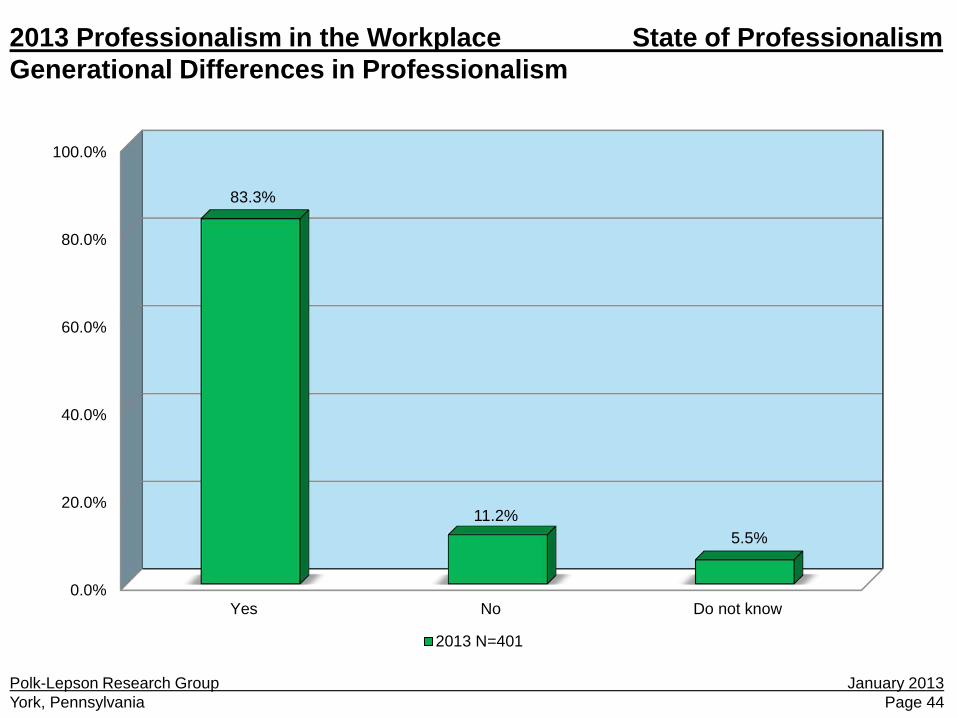
Respondents (83.3%) clearly feel that generations differ in the amount of professionalism exhibited in the workplace. Only 11.2% responded that the differences in professionalism are not generational. This reinforces findings from last year’s study. In that study, respondents repeatedly stated that it is the younger generation that is most lacking in the demonstration of professionalism. As might be expected, respondents under 35 (68.9%) are the least likely to believe there are generational differences in the exhibition of professionalism.
2013 Professionalism in the Workplace State of Professionalism
% Observing Generational Differences in Professionalism
Under 35 68.9%
35-55 83.9%
Over 55 86.3%
Polk-Lepson Research Group January 2013 York, Pennsylvania Page 44
2013 Professionalism in the Workplace State of Professionalism Generational Differences in Professionalism
0.0%
20.0%
40.0%
60.0%
80.0%
100.0%
Yes No Do not know
83.3%
11.2% 5.5%
2013 N=401
Polk-Lepson Research Group January 2013 York, Pennsylvania Page 45
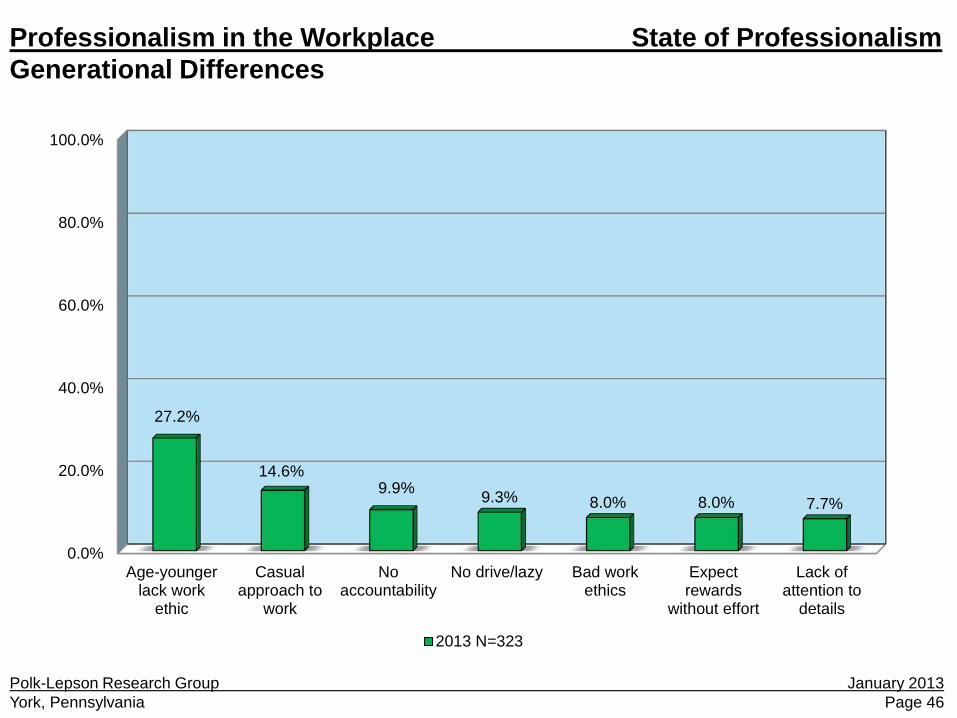
Generational Differences Reasons Differences Exist
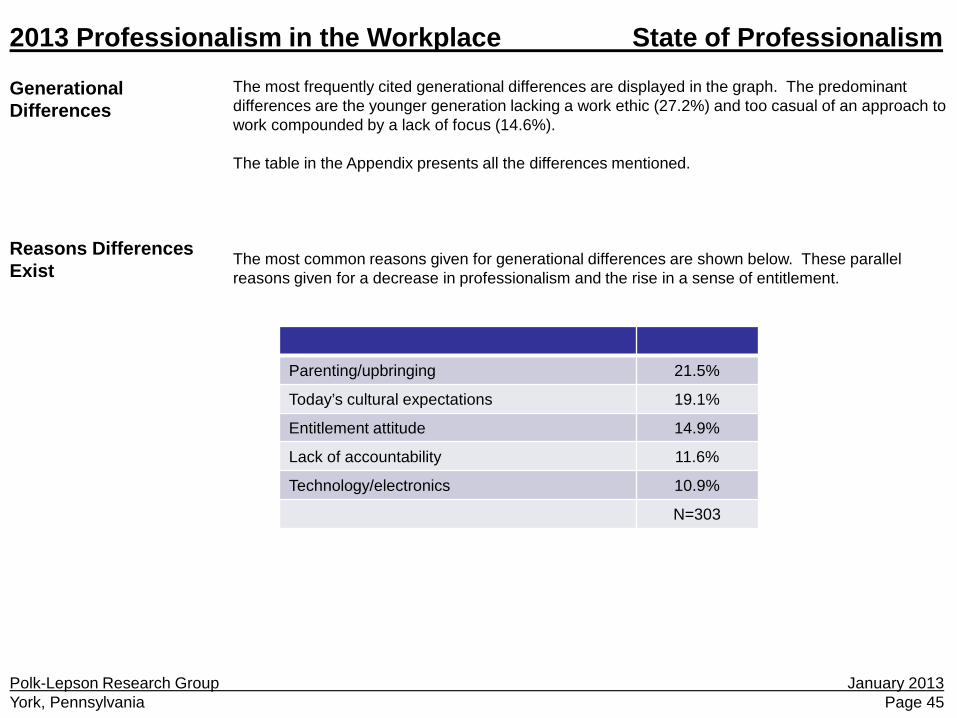
The most frequently cited generational differences are displayed in the graph. The predominant differences are the younger generation lacking a work ethic (27.2%) and too casual of an approach to work compounded by a lack of focus (14.6%). The table in the Appendix presents all the differences mentioned. The most common reasons given for generational differences are shown below. These parallel reasons given for a decrease in professionalism and the rise in a sense of entitlement.
2013 Professionalism in the Workplace State of Professionalism
Parenting/upbringing 21.5%
Today’s cultural expectations 19.1%
Entitlement attitude 14.9%
Lack of accountability 11.6%
Technology/electronics 10.9%
N=303
Polk-Lepson Research Group January 2013 York, Pennsylvania Page 46
Professionalism in the Workplace State of Professionalism Generational Differences
0.0%
20.0%
40.0%
60.0%
80.0%
100.0%
Age-youngerlack work
ethic
Casualapproach to
work
Noaccountability
No drive/lazy Bad workethics
Expectrewards
without effort
Lack ofattention to
details
27.2%
14.6% 9.9% 9.3% 8.0% 8.0% 7.7%
2013 N=323
Polk-Lepson Research Group January 2013 York, Pennsylvania Page 47
2013 Professionalism in the Workplace Qualities of Professionalism
Qualities of Professionalism
Polk-Lepson Research Group January 2013 York, Pennsylvania Page 48
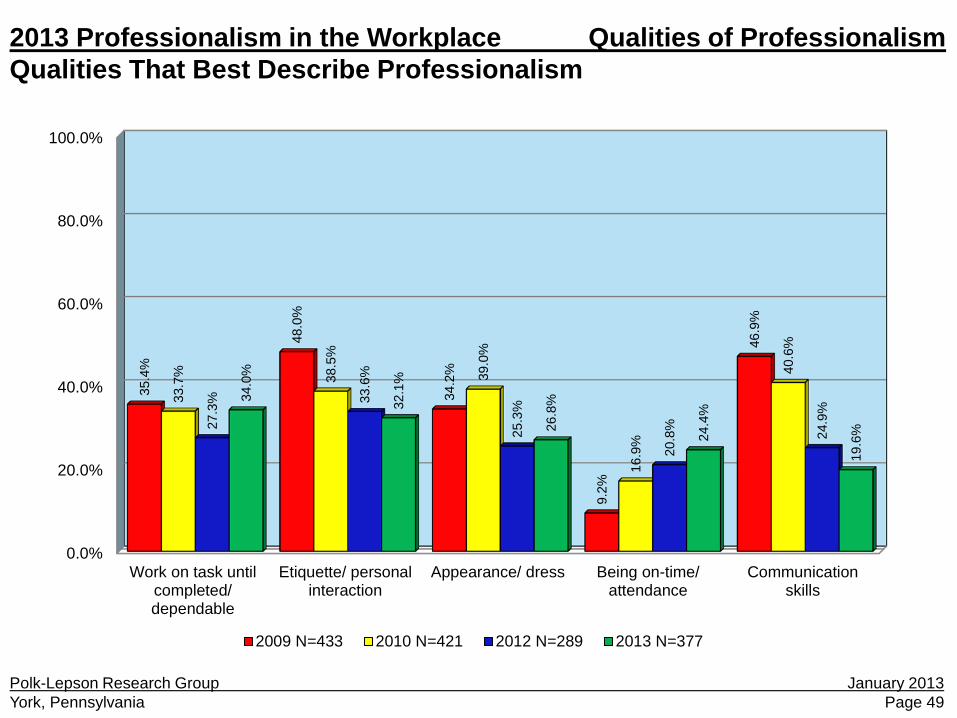
Qualities That Best Describe Professionalism Trend Analysis
Each year, respondents name three qualities that they feel best describe an employee who they consider to be professional. This permits a tracking of how professionalism is defined over time. The graph displays the most commonly cited qualities. The table in the Appendix contains all the qualities that were mentioned. Displaying a work ethic by working until a task is completed competently (34.0%) is the most commonly mentioned quality. Close behind this is interpersonal skills with 32.1% of the respondents naming this. As seen in previous years, being knowledgeable in one’s field is not among the top qualities (13.3%). It is likely that this quality is considered to be a given component of professionalism. While the percentage of respondents citing a quality changes from study to study, the same qualities have been named over time. There does appear to be several trends when looking at the past four studies. The percentage of respondents referring to interpersonal skills and communication skills has declined since 2009. The opposite is found for being on-time and attendance. Future research will discover if these are, indeed, trends or yearly fluctuations.
2013 Professionalism in the Workplace Qualities of Professionalism
Polk-Lepson Research Group January 2013 York, Pennsylvania Page 49
2013 Professionalism in the Workplace Qualities of Professionalism Qualities That Best Describe Professionalism
0.0%
20.0%
40.0%
60.0%
80.0%
100.0%
Work on task untilcompleted/dependable
Etiquette/ personalinteraction
Appearance/ dress Being on-time/attendance
Communicationskills
35.4
%
48.0
%
34.2
%
9.2%
46.9
%
33.7
%
38.5
%
39.0
%
16.9
%
40.6
%
27.3
%
33.6
%
25.3
%
20.8
%
24.9
% 34
.0%
32.1
%
26.8
%
24.4
%
19.6
%
2009 N=433 2010 N=421 2012 N=289 2013 N=377
Polk-Lepson Research Group January 2013 York, Pennsylvania Page 50
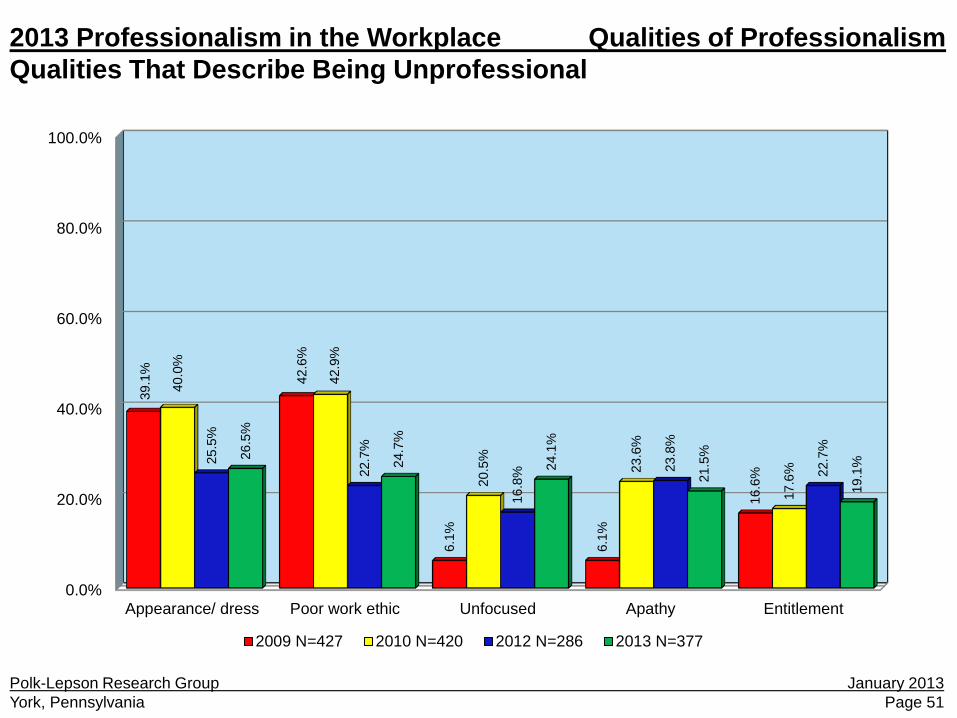
Qualities That Describe Being Unprofessional
Trend Analysis Gaps Between Importance and Prevalence
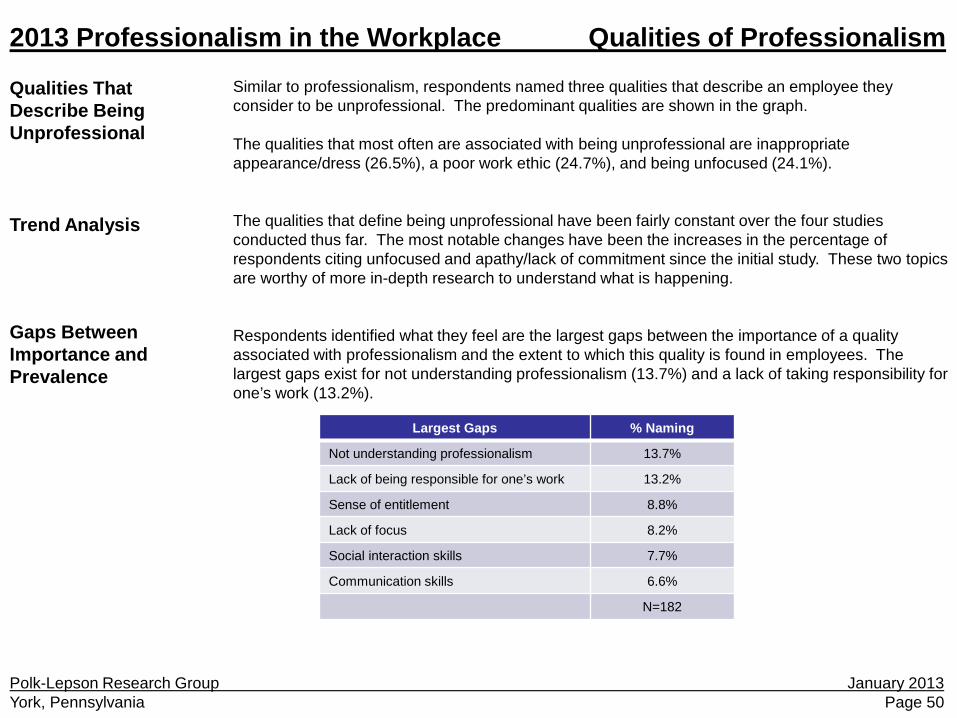
Similar to professionalism, respondents named three qualities that describe an employee they consider to be unprofessional. The predominant qualities are shown in the graph. The qualities that most often are associated with being unprofessional are inappropriate appearance/dress (26.5%), a poor work ethic (24.7%), and being unfocused (24.1%). The qualities that define being unprofessional have been fairly constant over the four studies conducted thus far. The most notable changes have been the increases in the percentage of respondents citing unfocused and apathy/lack of commitment since the initial study. These two topics are worthy of more in-depth research to understand what is happening. Respondents identified what they feel are the largest gaps between the importance of a quality associated with professionalism and the extent to which this quality is found in employees. The largest gaps exist for not understanding professionalism (13.7%) and a lack of taking responsibility for one’s work (13.2%).
2013 Professionalism in the Workplace Qualities of Professionalism
Largest Gaps % Naming
Not understanding professionalism 13.7%
Lack of being responsible for one’s work 13.2%
Sense of entitlement 8.8%
Lack of focus 8.2%
Social interaction skills 7.7%
Communication skills 6.6%
N=182
Polk-Lepson Research Group January 2013 York, Pennsylvania Page 51
2013 Professionalism in the Workplace Qualities of Professionalism Qualities That Describe Being Unprofessional
0.0%
20.0%
40.0%
60.0%
80.0%
100.0%
Appearance/ dress Poor work ethic Unfocused Apathy Entitlement
39.1
%
42.6
%
6.1%
6.1%
16.6
%
40.0
%
42.9
%
20.5
%
23.6
%
17.6
% 25
.5%
22.7
%
16.8
% 23
.8%
22.7
%
26.5
%
24.7
%
24.1
%
21.5
%
19.1
%
2009 N=427 2010 N=420 2012 N=286 2013 N=377
Polk-Lepson Research Group January 2013 York, Pennsylvania Page 52
2013 Professionalism in the Workplace Assessment of Professionalism
Assessment of Professionalism
Polk-Lepson Research Group January 2013 York, Pennsylvania Page 53
Changing Definitions of Professionalism
Comparison by Segments Trend Analysis
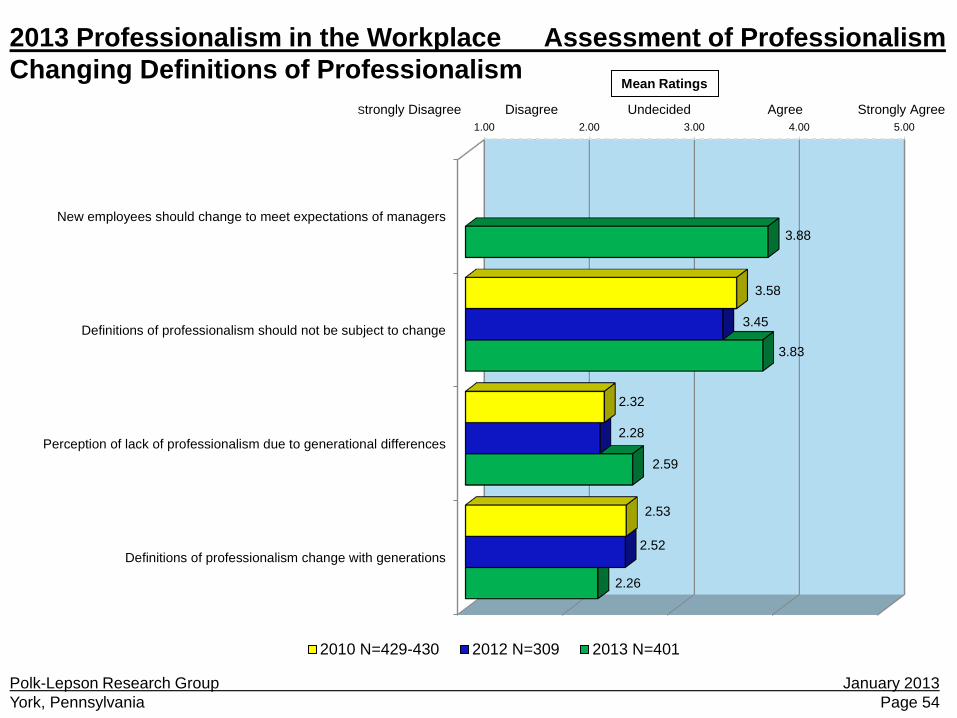
With changes in professionalism most often being associated with the younger generation, it is possible that what is considered to be professional should evolve to stay current with the newest generation of employees. To test this, respondents were presented four statements each dealing with some aspect of changing definitions. Respondents indicated the extent to which they disagree or agree with each statement. Ratings ranged from 1, strongly disagree, to 5, strongly agree. An examination of the mean ratings shows that respondents mainly disagree that definitions of professionalism should change with each generation. As would be expected, respondents under 35 are more likely than older ones to feel definitions should change to conform to younger generations of employees. There has been general agreement in respondents’ ratings of the three statements included in the past three studies. The statement about new employees changing to meet the expectations of their managers was added this year.
2013 Professionalism in the Workplace Assessment of Professionalism
Polk-Lepson Research Group January 2013 York, Pennsylvania Page 54
2013 Professionalism in the Workplace Assessment of Professionalism Changing Definitions of Professionalism
1.00 2.00 3.00 4.00 5.00
New employees should change to meet expectations of managers
Definitions of professionalism should not be subject to change
Perception of lack of professionalism due to generational differences
Definitions of professionalism change with generations
3.58
2.32
2.53
3.45
2.28
2.52
3.88
3.83
2.59
2.26
2010 N=429-430 2012 N=309 2013 N=401
Strongly Disagree Disagree Undecided Agree Strongly Agree
Mean Ratings
Polk-Lepson Research Group January 2013 York, Pennsylvania Page 55
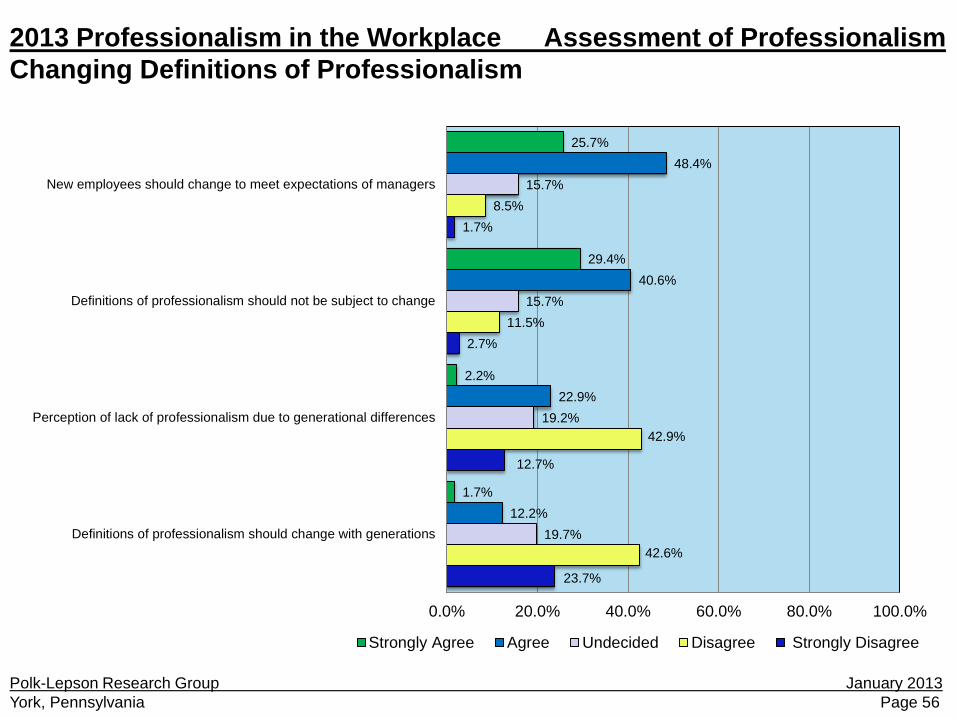
Changing Definitions of Professionalism
This graph gives perspective to the mean ratings in the previous graph by showing the percentage of respondents assigning each rating. The statement with which the most respondents agree is “Instead of managers changing to meet the expectations of new employees, it is the new employees who should be changing to meet the expectations of their managers.” Nearly three-fourths of the respondents (74.1%) either agree or strongly agree with this statement. The statement with which the fewest respondents are in consensus deals with the perception of new college graduates lacking professionalism being due to a generation gap. The argument is older employees have always found younger ones somehow lacking. Over half of the respondents (55.6%) either disagree or strongly disagree with this statement. About a fifth (19.2%) are undecided. The remaining 25.1% agree or strongly agree that this perception is the result of a generation gap.
2013 Professionalism in the Workplace Assessment of Professionalism
Polk-Lepson Research Group January 2013 York, Pennsylvania Page 56
2013 Professionalism in the Workplace Assessment of Professionalism Changing Definitions of Professionalism
23.7%
12.7%
2.7%
1.7%
42.6%
42.9%
11.5%
8.5%
19.7%
19.2%
15.7%
15.7%
12.2%
22.9%
40.6%
48.4%
1.7%
2.2%
29.4%
25.7%
0.0% 20.0% 40.0% 60.0% 80.0% 100.0%
Definitions of professionalism should change with generations
Perception of lack of professionalism due to generational differences
Definitions of professionalism should not be subject to change
New employees should change to meet expectations of managers
Strongly Agree Agree Undecided Disagree Strongly Disagree
Polk-Lepson Research Group January 2013 York, Pennsylvania Page 57
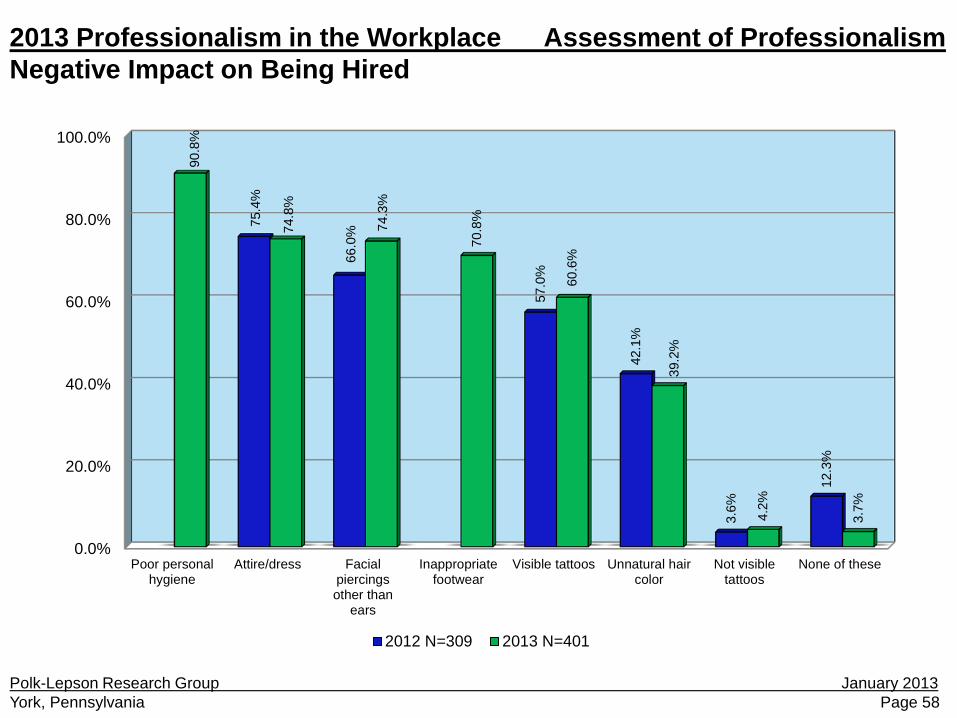
Negative Impact on Being Hired Trend Analysis Comparison by Segments Other Factors
From a list of seven items, respondents indicated which ones have a negative impact on being hired. The vast majority of respondents (90.8%) report that poor personal hygiene will negatively impact hiring opportunities. Three-fourths point to attire (74.8%) and facial piercings other than ears (74.3%) as having an adverse effect on the prospects of being hired. Looking at the findings from the 2012 and 2013 studies, there is general agreement on what will have a negative effect on the likelihood of being hired. Poor personal hygiene and inappropriate footwear were added to this year’s survey in response to findings from last year. As age of the respondent increases, so does the likelihood of citing facial piercings other than ears and visible and nonvisible tattoos as having a negative impact on hiring. It appears younger respondents are more comfortable with these features than are older ones. In addition to the list, respondents were able to name other factors that have a negative effect on being hired. Cited most often was one’s body language (50.0% out of 62 respondents). The data table should be consulted for a complete review of these other factors.
2013 Professionalism in the Workplace Assessment of Professionalism
Polk-Lepson Research Group January 2013 York, Pennsylvania Page 58
2013 Professionalism in the Workplace Assessment of Professionalism Negative Impact on Being Hired
0.0%
20.0%
40.0%
60.0%
80.0%
100.0%
Poor personalhygiene
Attire/dress Facialpiercingsother than
ears
Inappropriatefootwear
Visible tattoos Unnatural haircolor
Not visibletattoos
None of these
75.4
%
66.0
%
57.0
%
42.1
%
3.6%
12.3
%
90.8
%
74.8
%
74.3
%
70.8
%
60.6
%
39.2
%
4.2%
3.7%
2012 N=309 2013 N=401
Polk-Lepson Research Group January 2013 York, Pennsylvania Page 59
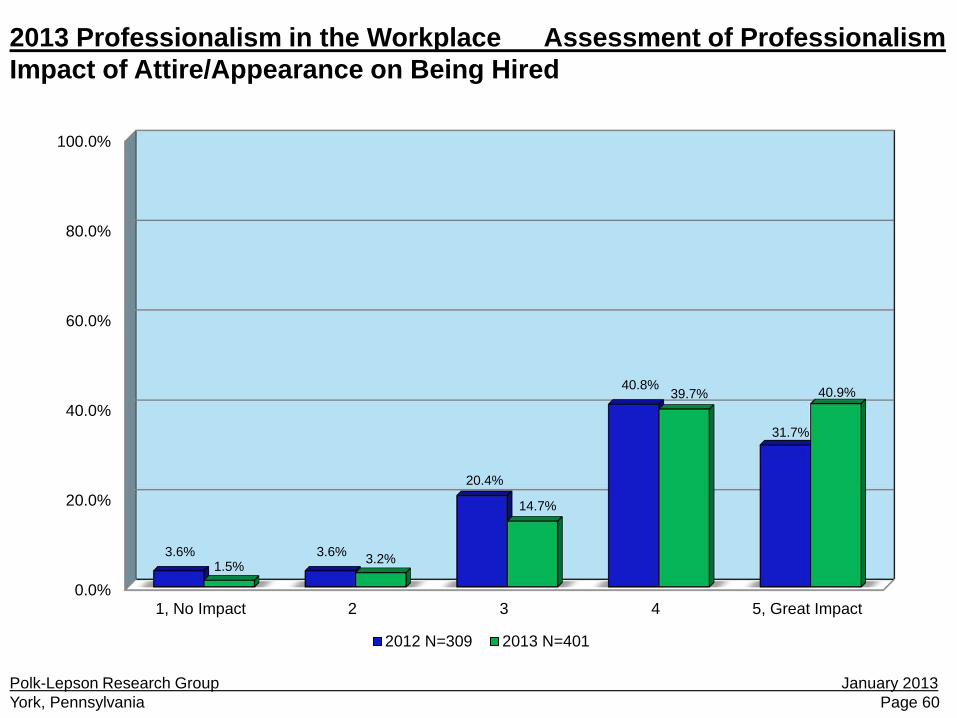
Impact of Attire/Appearance on Being Hired Trend Analysis Comparison by Segments
Respondents rated the impact which attire and appearance have on the likelihood of being hired. Possible ratings went from 1, no impact, to 5, great impact. A total of 80.6% of the respondents give a rating of 4 (39.7%) or 5 (40.9%) indicating that appearance does matter. From 2012 to 2013, there has been a notable increase in the ratings of 5, great impact. Future studies will monitor this to see if this increase is sustained. Consistent with previous findings, there is a correlation between age of respondent and the ratings given to the impact of appearance. As ages increases, so does the perceived impact of appearance.
2013 Professionalism in the Workplace Assessment of Professionalism
Polk-Lepson Research Group January 2013 York, Pennsylvania Page 60
2013 Professionalism in the Workplace Assessment of Professionalism Impact of Attire/Appearance on Being Hired
0.0%
20.0%
40.0%
60.0%
80.0%
100.0%
1, No Impact 2 3 4 5, Great Impact
3.6% 3.6%
20.4%
40.8%
31.7%
1.5% 3.2%
14.7%
39.7% 40.9%
2012 N=309 2013 N=401
Polk-Lepson Research Group January 2013 York, Pennsylvania Page 61
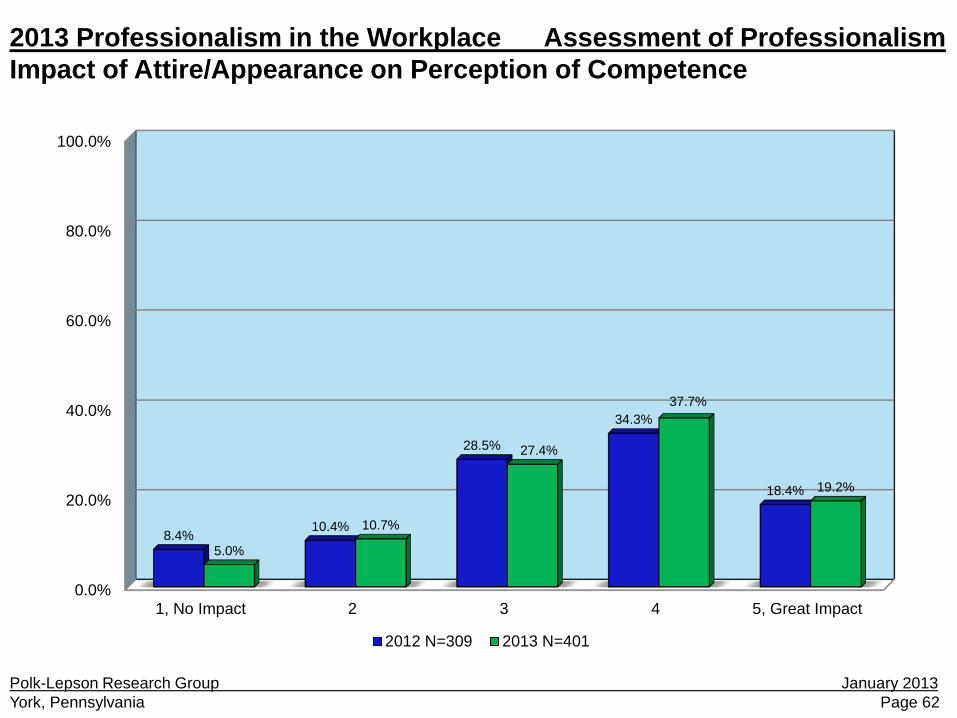
Impact of Attire/Appearance on Perception of Competence Trend Analysis Comparison By Segments
If appearance can have an impact on hiring prospects, it could also have an effect on the perception of an employee’s ability to perform their job requirements. To measure this, the same five point rating scale was used. While the impact is not as great as it is for being hired, appearance still has an effect on the perception of one’s competence. Over half of the respondents (56.9%) assign a rating of 4 (37.7%) or 5 (19.2%). This year’s findings are similar to last year’s. Once again, the younger the respondent, the less likely they are to consider appearance to be a detriment to the perception of one’s ability.
2013 Professionalism in the Workplace Assessment of Professionalism
Polk-Lepson Research Group January 2013 York, Pennsylvania Page 62
2013 Professionalism in the Workplace Assessment of Professionalism Impact of Attire/Appearance on Perception of Competence
0.0%
20.0%
40.0%
60.0%
80.0%
100.0%
1, No Impact 2 3 4 5, Great Impact
8.4% 10.4%
28.5%
34.3%
18.4%
5.0%
10.7%
27.4%
37.7%
19.2%
2012 N=309 2013 N=401
Polk-Lepson Research Group January 2013 York, Pennsylvania Page 63
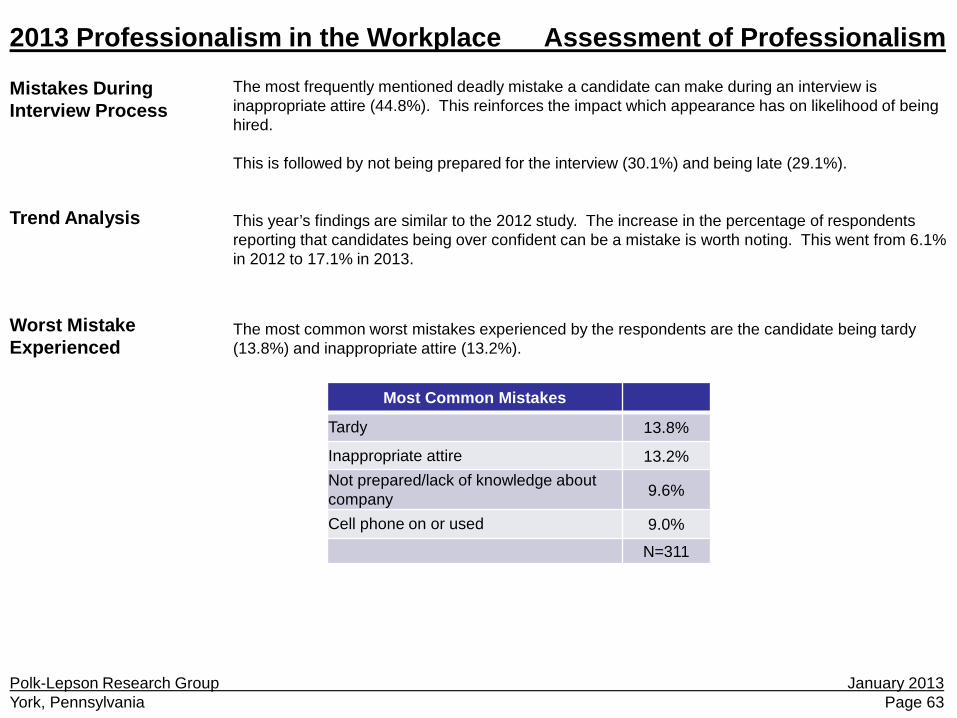
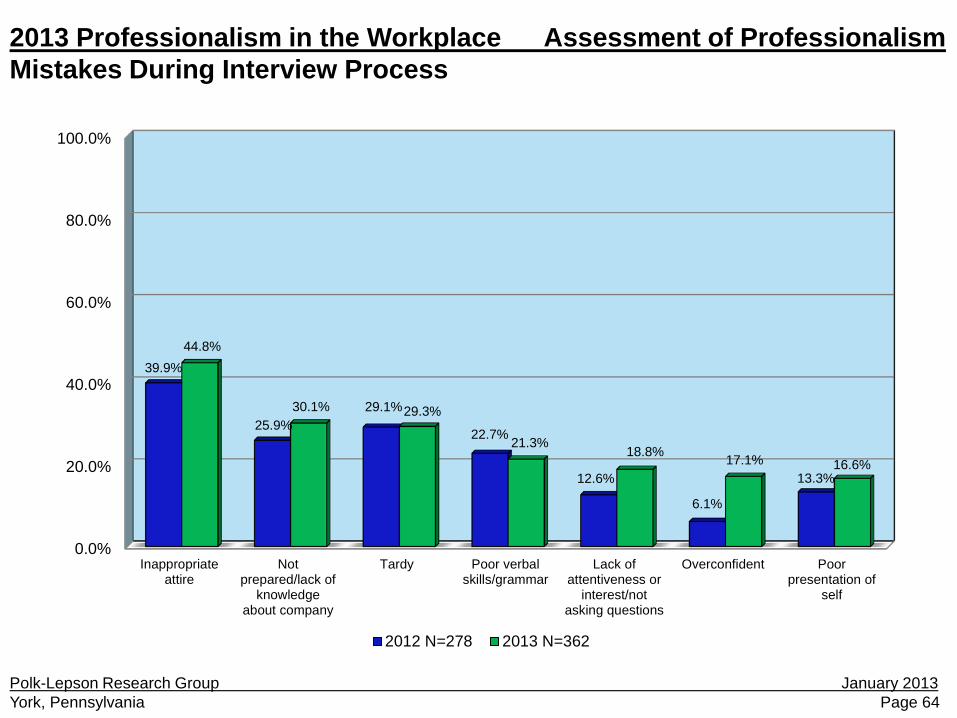
Mistakes During Interview Process Trend Analysis Worst Mistake Experienced
The most frequently mentioned deadly mistake a candidate can make during an interview is inappropriate attire (44.8%). This reinforces the impact which appearance has on likelihood of being hired. This is followed by not being prepared for the interview (30.1%) and being late (29.1%). This year’s findings are similar to the 2012 study. The increase in the percentage of respondents reporting that candidates being over confident can be a mistake is worth noting. This went from 6.1% in 2012 to 17.1% in 2013.
The most common worst mistakes experienced by the respondents are the candidate being tardy (13.8%) and inappropriate attire (13.2%).
2013 Professionalism in the Workplace Assessment of Professionalism
Most Common Mistakes
Tardy 13.8%
Inappropriate attire 13.2% Not prepared/lack of knowledge about company 9.6%
Cell phone on or used 9.0%
N=311
Polk-Lepson Research Group January 2013 York, Pennsylvania Page 64
2013 Professionalism in the Workplace Assessment of Professionalism Mistakes During Interview Process
0.0%
20.0%
40.0%
60.0%
80.0%
100.0%
Inappropriateattire
Notprepared/lack of
knowledgeabout company
Tardy Poor verbalskills/grammar
Lack ofattentiveness or
interest/notasking questions
Overconfident Poorpresentation of
self
39.9%
25.9% 29.1%
22.7%
12.6%
6.1%
13.3%
44.8%
30.1% 29.3%
21.3% 18.8% 17.1% 16.6%
2012 N=278 2013 N=362
Polk-Lepson Research Group January 2013 York, Pennsylvania Page 65
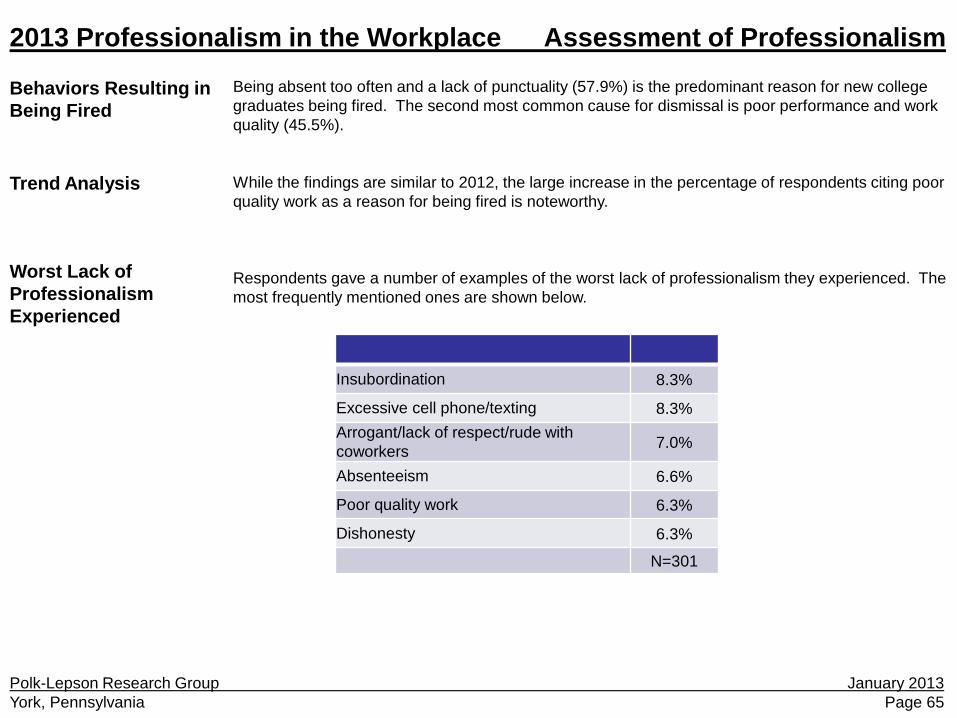
Behaviors Resulting in Being Fired
Trend Analysis
Worst Lack of Professionalism Experienced
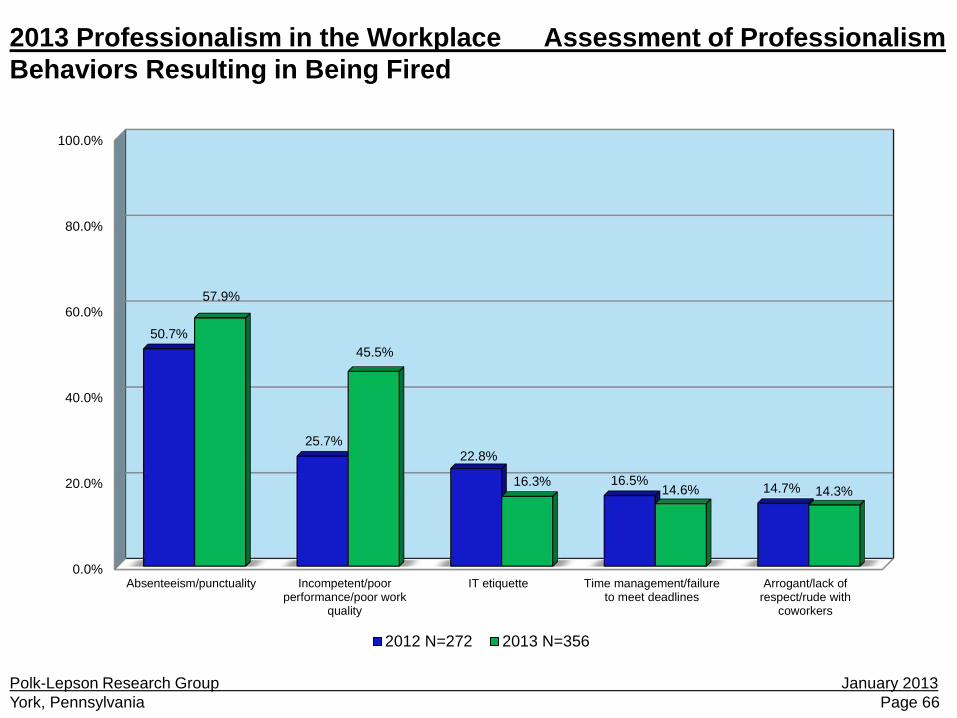
Being absent too often and a lack of punctuality (57.9%) is the predominant reason for new college graduates being fired. The second most common cause for dismissal is poor performance and work quality (45.5%). While the findings are similar to 2012, the large increase in the percentage of respondents citing poor quality work as a reason for being fired is noteworthy. Respondents gave a number of examples of the worst lack of professionalism they experienced. The most frequently mentioned ones are shown below.
2013 Professionalism in the Workplace Assessment of Professionalism
Insubordination 8.3%
Excessive cell phone/texting 8.3% Arrogant/lack of respect/rude with coworkers 7.0%
Absenteeism 6.6%
Poor quality work 6.3%
Dishonesty 6.3%
N=301
Polk-Lepson Research Group January 2013 York, Pennsylvania Page 66
2013 Professionalism in the Workplace Assessment of Professionalism Behaviors Resulting in Being Fired
0.0%
20.0%
40.0%
60.0%
80.0%
100.0%
Absenteeism/punctuality Incompetent/poorperformance/poor work
quality
IT etiquette Time management/failureto meet deadlines
Arrogant/lack ofrespect/rude with
coworkers
50.7%
25.7% 22.8%
16.5% 14.7%
57.9%
45.5%
16.3% 14.6% 14.3%
2012 N=272 2013 N=356
Polk-Lepson Research Group January 2013 York, Pennsylvania Page 67
Responsibility to Expose Graduates to Professionalism
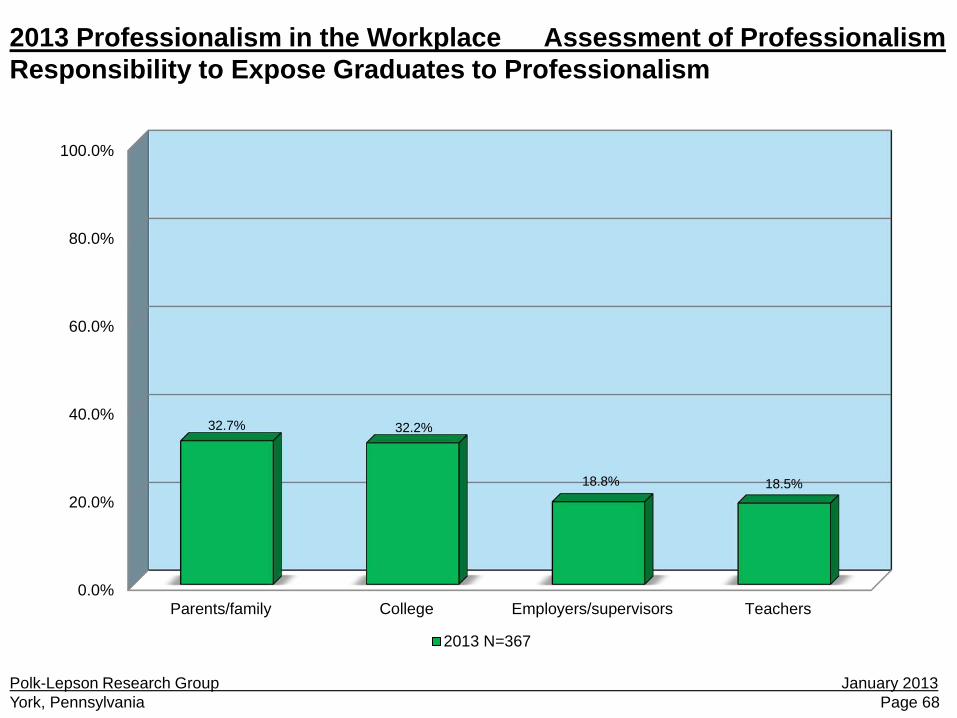
Respondents most often point to parents (32.7%) and college (32.2%) when asked who should expose new college graduates to the meaning of professionalism. The percentage mentioning educational institutions is higher when responses of teachers (18.5%), internships (6.5%), and high schools (3.8%) are included with the answer of college. This reinforces the 2012 study in which 91.9% of the human resource respondents felt colleges should play a role in preparing students to be professional.
2013 Professionalism in the Workplace Assessment of Professionalism
Polk-Lepson Research Group January 2013 York, Pennsylvania Page 68
2013 Professionalism in the Workplace Assessment of Professionalism Responsibility to Expose Graduates to Professionalism
0.0%
20.0%
40.0%
60.0%
80.0%
100.0%
Parents/family College Employers/supervisors Teachers
32.7% 32.2%
18.8% 18.5%
2013 N=367
Polk-Lepson Research Group January 2013 York, Pennsylvania Page 69
2013 Professionalism in the Workplace Profile of Respondents
Profile of Respondents
Introduction Number Of Employees At All Locations Number Of Employees In HR Department
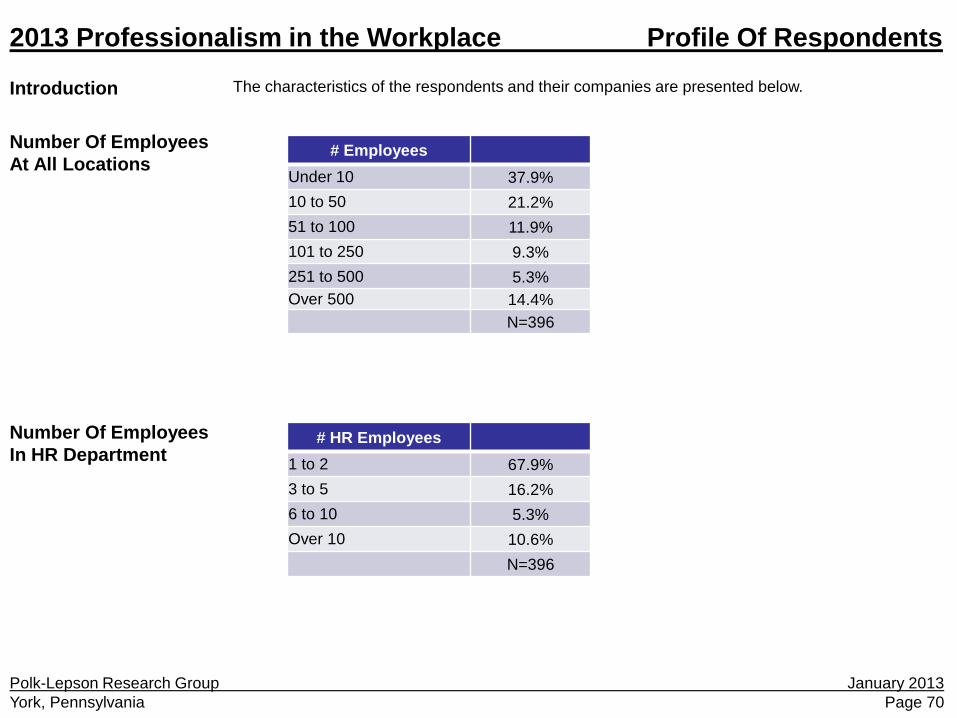
The characteristics of the respondents and their companies are presented below.
Polk-Lepson Research Group January 2013 York, Pennsylvania Page 70
2013 Professionalism in the Workplace Profile Of Respondents
# Employees Under 10 37.9% 10 to 50 21.2% 51 to 100 11.9% 101 to 250 9.3% 251 to 500 5.3% Over 500 14.4%
N=396
# HR Employees 1 to 2 67.9% 3 to 5 16.2% 6 to 10 5.3% Over 10 10.6%
N=396
Polk-Lepson Research Group January 2013 York, Pennsylvania Page 71
Type Of Industry Respondent’s Age
2013 Professionalism in the Workplace Profile of Respondents
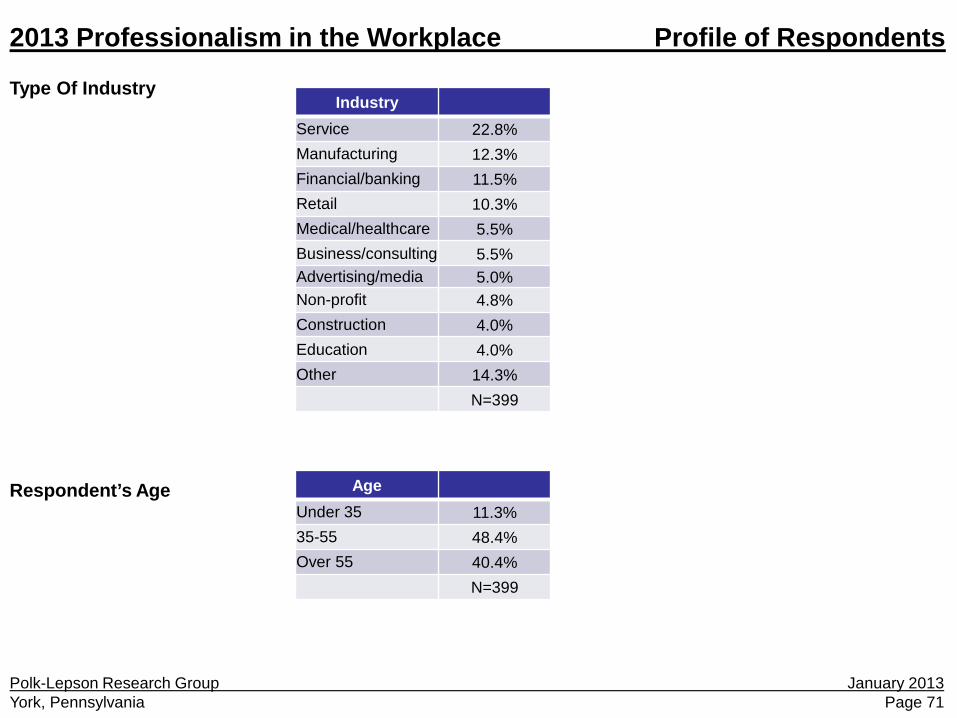
Industry Service 22.8% Manufacturing 12.3% Financial/banking 11.5% Retail 10.3% Medical/healthcare 5.5% Business/consulting 5.5% Advertising/media 5.0% Non-profit 4.8% Construction 4.0% Education 4.0% Other 14.3%
N=399
Age Under 35 11.3% 35-55 48.4% Over 55 40.4%
N=399
Polk-Lepson Research Group January 2013 York, Pennsylvania Page 72
Respondent’s Level Of Education Respondent’s Position
2013 Professionalism in the Workplace Profile of Respondents
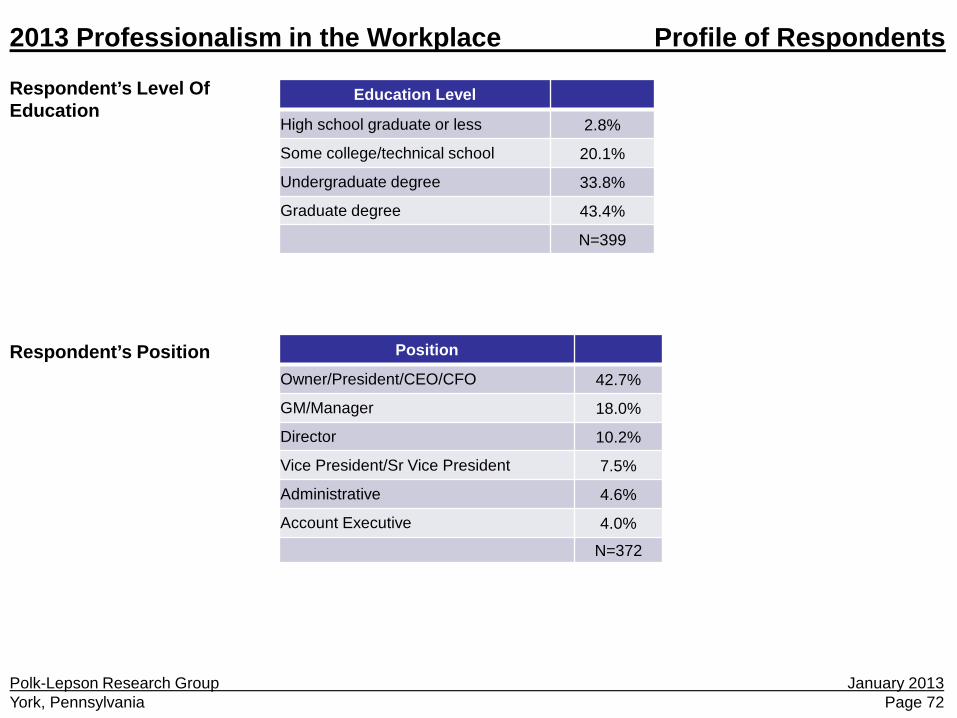
Education Level
High school graduate or less 2.8%
Some college/technical school 20.1%
Undergraduate degree 33.8%
Graduate degree 43.4%
N=399
Position
Owner/President/CEO/CFO 42.7%
GM/Manager 18.0%
Director 10.2%
Vice President/Sr Vice President 7.5%
Administrative 4.6%
Account Executive 4.0%
N=372
Polk-Lepson Research Group January 2013 York, Pennsylvania Page 73
Position Of Person To Whom Report
2013 Professionalism in the Workplace Profile of Respondents
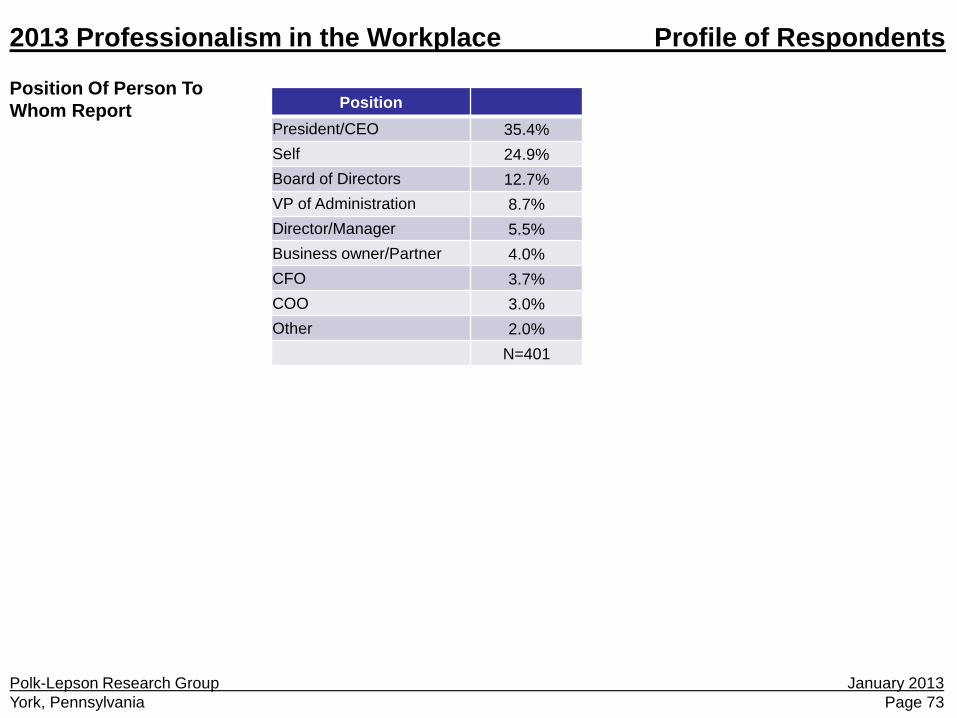
Position President/CEO 35.4% Self 24.9% Board of Directors 12.7% VP of Administration 8.7% Director/Manager 5.5% Business owner/Partner 4.0% CFO 3.7% COO 3.0% Other 2.0%
N=401

To learn more go to: www.ycp.edu\cpe