Thesis Application of fast pyrolysis biochar to a loamy soil
Upload
jean-carlos-gonzalez-hernandezCategory
view
23download
0description

Production and characterization of slow pyrolysisbiochar: influence of feedstock type and pyrolysisconditionsFREDER IK RONSSE * , SVEN VAN HECKE * , DANE D ICK INSON* and WOLTER PRINS*
*Biosystems Engineering, Ghent University, Coupure Links 653, Gent, B-9000, Belgium
Abstract
Biochar was produced by fixed-bed slow pyrolysis from various feedstock biomasses under a range of processconditions. Feedstocks used were pine wood, wheat straw, green waste and dried algae. Process conditions var-
ied were the highest treatment temperature (HTT) and residence time. The produced chars were characterized
by proximate analysis, CHN-elemental analysis, pH in solution, bomb calorimetry for higher heating value, N2
adsorption for BET surface area and two biological degradation assays (oxygen demand, carbon mineralization
in soil). In proximate analysis, it was found that the fixed carbon content (expressed in wt% of dry and ash-free
biochar) in the biochar samples strongly depended on the intensity of the thermal treatment (i.e. higher tempera-
tures and longer residence times in the pyrolysis process). The actual yield in fixed carbon (i.e. the biochar fixed
carbon content expressed as wt% of the dry and ash-free original feedstock biomass weight) was practicallyinsensitive to the highest treatment temperature or residence time. The pH in solution, higher heating value and
BET surface positively correlated with pyrolysis temperature. Finally, soil incubation tests showed that the addi-
tion of biochar to the soil initially marginally reduced the C-mineralization rate compared against the control
soil samples, for which a possible explanation could be that the soil microbial community needs to adapt to the
new conditions. This effect was more pronounced when adding chars with high fixed carbon content (resulting
from more severe thermal treatment), as chars with low fixed carbon content (produced through mild thermal
treatment) had a larger amount of volatile, more easily biodegradable, carbon compounds.
Keywords: biochar, biological degradation, characterization, feedstock, packed bed reactor, pyrolysis, pyrolysis conditions,
slow pyrolysis
Received 29 June 2012; revised version received 6 September 2012 and accepted 7 September 2012
Introduction
Rising energy costs, concerns over greenhouse gas emis-
sions and the nonrenewable nature of fossil fuels have
prompted significant research into the conversion of
biomass into biofuels and other value-added renewable
products (Hossain et al., 2011). Among the array of bio-
mass conversion technologies, pyrolysis is a relatively
simple technique in which organic material is heated in
the absence of oxygen. During the pyrolysis process, the
natural polymeric constituents (i.e. lignin, cellulose, fats
and starches) are thermally broken down into three dif-
ferent fractions: bio-oil (condensed vapours), char (solid
fraction) and noncondensable gases (Mohan et al., 2006).
Depending on the heating rate and temperature, differ-
ent distributions and yields of the aforementioned frac-
tions can be obtained (Bridgwater & Peacocke, 2000; Lu
et al., 2009). To date, most biomass pyrolysis research
has focused on selecting process conditions to maximize
the yield of the bio-oil fraction, as it is a crude liquid
biofuel that can be used without modification in station-
ary heat and power applications, or can be further
upgraded to a drop-in biofuel (Czernik & Bridgwater,
2004; Balat et al., 2009; Bridgwater, 2012). Conversely,
the solid or char fraction obtained from biomass pyroly-
sis is often considered a waste product and conse-
quently combusted to provide the necessary heat for the
pyrolysis process. However, recent research suggests
that char from pyrolysis can be used as a soil amend-
ment, hence termed biochar, to substantially increase
soil fertility (Chan et al., 2007; Laird et al., 2009; Novak
et al., 2009; Major et al., 2010; Jeffery et al., 2011).
At present, the mechanisms by which biochar
increases soil fertility are not fully understood. Research
has demonstrated that biochar application to soil
increases the soil organic carbon, improves water hold-
ing capacity and soil aeration, increases the cation
exchange capacity, neutralizes the pH of acidic soils
and improves the soil microbial ecology (Sohi et al.,Correspondence: Frederik Ronsse, tel. + 32 9 264 62 00,
fax + 32 9 264 62 35, e-mail: [email protected]
104 © 2012 Blackwell Publishing Ltd
GCB Bioenergy (2013) 5, 104–115, doi: 10.1111/gcbb.12018

2010). In addition to these purported benefits, biochar
largely consists of a recalcitrant carbon fraction which
has been demonstrated to be very stable, with a half-life
of over 1000 years in the soil (Lehmann et al., 2006;
Kuzyakov et al., 2009; Lehmann & Joseph, 2009; Zimm-
erman, 2010). Consequently, biochar production by
pyrolysis of biomass effectively removes carbon from
the atmospheric carbon cycle, transferring it to long-
term storage in soils. Biochar therefore could help in the
global challenge of carbon dioxide (CO2) mitigation, as
it results in a net removal of carbon from the atmo-
sphere (Lehmann et al., 2006; Lehmann & Joseph, 2009;
Roberts et al., 2010; Matovic, 2011).
Biochar can be produced from various types of
processes including slow and fast pyrolysis, and gasifi-
cation. Each type of process is distinguished by differ-
ent ranges of temperatures, heating rates, biomass and
vapour residence times. Given this variability in
pyrolysis processes and their accompanying process
conditions, in combination with a wide range of avail-
able biomass feedstocks for biochar production (includ-
ing wood, energy crops, agricultural waste residues,
sewage sludge, anaerobic digestate, municipal wastes,
etc.), large variability is to be expected in the physico-
chemical properties of the biochars, and ultimately, in
their performance as a soil amendment and/or in their
ability to store carbon permanently in the soil (Antal &
Gronli, 2003). Consequently, the challenge for biochar
science is to predict and assure product quality, agro-
nomic benefits and environmental effects of any given
biochar produced from any given feedstock by any
given pyrolysis technology and process conditions
(Masek et al., 2011).
To produce high-quality biochars intended for
agricultural use with reliable and consistent product
qualities, slow pyrolysis is often considered as the most
feasible production process (Song & Guo, 2012). In
slow pyrolysis, the biomass is heated in an oxygen lim-
ited or oxygen free environment, with typical heating
rates between 1 and 30 °C min�1 (Lua et al., 2004).
Slow pyrolysis is usually carried out at atmospheric
pressure, and the process heat is typically supplied
from an external energy source – generally from com-
bustion of the produced gases or by partial combustion
of the biomass feedstock (Laird et al., 2009). Under
these circumstances biochar yields are usually up to 30
wt%, on dry feedstock weight basis. However, yield
and the properties of the resulting biochar are depen-
dent on several factors including the biomass
feedstock, heating rate, pyrolysis temperature and
vapour residence time. Of these parameters, it has been
established that the highest treatment temperature
(HTT; the maximum temperature which the biomass is
subjected to in the pyrolysis reactor) has the greatest
overall influence on the final product characteristics
(Antal & Gronli, 2003; Lua et al., 2004; Ozcimen &
Ersoy-Mericboyu, 2008).
To address the variability in biochar production
techniques (other than slow pyrolysis), the wide selec-
tion of process parameters within each production
technique, and the variability in feedstock selection – all
of which may affect biochar performance in soils – a
large number of biochar quality parameters have been
described (Schimmelpfennig & Glaser, 2012; Song &
Guo, 2012; Sun et al., 2012). More recently, attempts
have been made to define a set of assays and relevant
characteristics for assessing and comparing the quality
of biochars (International Biochar Initiative (IBI), 2012;
Schmidt et al., 2012). These parameters include (apart
from toxicity testing): biochar particle size distribution,
elemental and proximate analysis, pH and liming effect,
as well as more analytically advanced properties includ-
ing BET surface area, porosity and plant available nutri-
ent content (IBI, 2012). However, it should be noted that
the identification of the ranges or values of these param-
eters which classify biochars according to their quality
is still ongoing. Furthermore, these quality parameters
alone do not warrant the agronomic benefits of biochar
by themselves, as soil type and climate properties also
determine the net effect of biochar use.
This study is an experimental investigation of the
production of biochar by slow pyrolysis and aims to
relate the various feedstock and process parameters to
the yield and physicochemical characteristics of biochar.
Once the relationships between feedstock, production
process and biochar properties are known, this knowl-
edge will permit the production of tailor-made biochar.
More specifically, an appropriate selection of biomass
feedstock and pyrolysis parameters could be made that
yields a biochar optimized for a specific behaviour
within the soil both in terms of soil fertility improvement
and enlarging the pool of stable carbon within the soil.
Materials and methods
Feedstock materials
Four biomass input materials were selected for this study:
wood (pine), green waste, wheat straw, and spray-dried algae.
To ensure more comparable conditions (i.e. biomass heating
rate) in the pyrolysis reactor for the used different feedstocks,
the materials were all pelletized.
Both the pine wood (Stelmet, Poland) and straw (Strovan,
Belgium) were acquired commercially in a pelletized form
(6 mm pellet diameter). Prior to the pyrolysis experiments,
pine wood and straw pellets were stored at ambient tempera-
ture and ambient air humidity.
Green waste was obtained from a local garden contractor
and consisted of shredded leaves, twigs and branches of
© 2012 Blackwell Publishing Ltd, GCB Bioenergy, 5, 104–115
SLOW PYROLYSIS BIOCHAR CHARACTERIZATION 105

mainly coniferous trees and shrubs. Green waste feedstock
material was ground in a cutting mill passing over a 2 mm
screen and then cold pelletized in a laboratory pellet press
(6 mm diameter). The green waste pellets were then air dried
at 105 °C for 1 h, before finally being stored at �18 °C due to
their sensitivity to microbial decay. Spray-dried algae were
acquired commercially (SBAE Industries, Sleidinge, Belgium),
and manually pelletized to a diameter of 15 mm.
Slow pyrolysis set-up
The slow pyrolysis reactions were carried out in a vertical,
tubular, stainless steel reactor (d 9 L = 3.8 9 30 cm) which
was heated by an electric furnace (schematic in Fig. 1).
The maximum temperature ramp rate for the reactor was ca.
17 °C min�1 and the reactor was continuously swept with
nitrogen (800 ml min�1) to remove the produced gases and tars
produced during pyrolysis.
For each slow pyrolysis experiment, biomass pellets were
loosely packed in the reactor to form a bed height of 25 cm.
Because of the differences in bulk density between feedstocks,
the actual mass of biomass in the reactor differed: ca. 135, 100,
70, and 70 g of wood, straw, green waste and algae were
respectively used in each pyrolysis experiment. Each pyrolysis
experiment consisted of heating the reactor at the maximum
heating rate (17 °C min�1) until the HTT was reached, which
ranged between 300 and 750 °C depending on the experiment.
The reactor was then kept at the nominated HTT for a specific
duration (residence time), before the furnace was shut off and
the reactor ambiently cooled. The nitrogen flow was continued
during cooling to purge the reactor of any remaining pyrolysis
gases and to prevent any oxygen exposure to the char while
still above ignition temperature. In total 32 experiments were
performed, testing combinations of four highest treatment
temperatures (HTT = 300, 450, 600, and 750 °C) and two
different residence times (10 and 60 min). An overview of all
experiments, including used feedstock and pyrolysis condi-
tions, is given in Table 1.
Biochar characterization
Biochar yield. The yields (g) of the recovered biochar were
expressed as weight percentages of dry ash-free biochar recov-
ered to dry ash-free initial biomass. Dry ash-free (daf) basis for
yield expression was chosen to avoid positive bias in yield in
case of using biomass samples with a high mineral (ash) con-
tent. The yields were calculated by Eqn (1):
g ¼ Mc �Mash;c
Mdry;b �Mash;b� 100% ð1Þ
where Mc is the weight of the char recovered from the
pyrolysis reactor (kg) which after the pyrolysis process was
considered to be oven dry (see below), Mdry,b is the oven-dry
mass of raw biomass material, and Mash,c and Mash,b represent
the respective ash contents (i.e. weight in kg) in the biochar
and raw biomass samples. More details regarding ash content
determination are given in the section below.
Proximate analysis. Moisture, volatile matter and ash con-
tent were determined according to D1762-84 (ASTM, 2007). In
brief, biochar samples of ca. 1 g – in duplicate – were heated in
porcelain crucibles and the sample weight differences before
and after heating were determined. For moisture content, sam-
ples were dried at 105 °C for 2 h (i.e. oven dry); for volatile
matter samples were heated to 950 °C for 11 min (covered cru-
cible) and for ash content 750 °C for a minimum of 2 h (uncov-
ered crucible). The weight of the original sample, subtracted by
its moisture content, ash content and volatile matter content (as
determined by the aforementioned proximate analysis) corre-
sponds to the stable carbon fraction of that sample and hence,
this fraction is termed ‘fixed carbon or fixed-C fraction’. In this
study, the fixed carbon fraction is expressed on dry ash-free
basis, or:
%Mfc ¼ 100 �Mdry �Mvm �Mash
Mdry �Mashð2Þ
where %Mfc is the fraction of fixed carbon (in wt%), Mvm is the
weight of volatile matter in the sample (kg), Mdry is the oven
dry weight of the sample (kg) and Mash is the weight of the ash
residue of the sample (kg).
In this study, ratio (in wt%) of weight of fixed carbon in a
biomass sample to the weight of the original biomass feedstock
on a dry and ash-free basis is defined as the fixed carbon yield,
or
%Yfc ¼%Mfc;c � Mdry;c �Mash;c
� �
Mdry;b �Mash;bð3Þ
where %Yfc is the fixed carbon yield (in wt%), Mdry,c and Mdry,b
are the dry weights (kg) of the biochar and the biomass feed-
stock respectively. Furthermore, Mash,c and Mash,b and are the
weights (kg) of the ash in the biochar and in the original
biomass feedstock out of which the biochar was produced,
respectively.
Elemental analysis. The elemental (CHN) analysis was per-
formed in duplicate using a Flash 2000 Elemental Analyser
1 3
2
4
6
5
7
89
10
14
11
12
13
Fig. 1 Slow pyrolysis set-up for the batch production of bio-
char: (1) nitrogen gas supply, (2) flow control, (3) gas preheater,
(4) electric tube furnace, (5) pyrolysis reactor, (6) sintered base
plate, (7) packed biomass bed, (8) biomass lock hopper, (9) con-
denser, (10) condensate/gas separator, (11) cotton filter,
(12) diaphragm gas flow meter, (13) gas vent and (14) bio-oil
recovery.
© 2012 Blackwell Publishing Ltd, GCB Bioenergy, 5, 104–115
106 F. RONSSE et al.

Tab
le1
Overview
ofthetested
properties
ofthebioch
arsfrom
differentfeed
stocks,an
dusingdifferentHTTsan
dresiden
cetimes
inthepyrolysisprocess
Process
conditions
Proxim
atean
alysis
Elemen
talan
alysis
Biological
tests
HTT
(°C)*
Residen
ce
time(m
in)
Bioch
ar
yield
(wt%
)†
Volatile
matter
(wt%
)†
Fixed
carbon
(wt%
)†
Ash
content
(wt%
)‡
Fixed
carbon
yield
(wt%
)§
TotalC
content
(wt%
)†
TotalH
content
(wt%
)†H/C-ratio
HVV
(MJkg�1db)
pH
in
solution
BET
surface
area
(m²g�1)
BOD
14
(mgO
2l�
1)*
Soil
incu
bation
perform
ed?
Wood
300
1089.8
78.0
22.0
0.3
19.8
54.1
5.9
1.30
n.d.¶
4.5
n.d.
n.d.
6043.7
42.6
57.4
0.5
25.1
71.3
4.7
0.79
n.d.
5.7
6n.d.
xk
450
1029.2
21.4
78.6
1.0
23.0
82.5
3.8
0.56
32.5
6.6
479.3
6027.0
16.8
83.2
1.2
22.5
86.3
3.5
0.49
32.9
6.7
2354.8
x
600
1024.4
8.2
91.8
1.2
22.4
90.0
2.6
0.35
34.4
6.7
196
40.5
6023.3
6.4
93.6
1.3
21.8
92.3
2.3
0.30
34.4
9.1
127
25.9
x
750
1023.0
2.6
97.4
1.1
22.4
92.5
1.4
0.19
n.d.
10.2
128
n.d.
6022.7
2.6
97.4
1.1
22.1
92.5
1.1
0.15
n.d.
10.4
n.d.
n.d.
x
Straw 300
1094.8
76.3
23.7
8.0
22.5
50.3
6.2
1.47
n.d.
6.1
n.d.
n.d.
6036.8
33.5
66.5
19.1
24.5
76.2
5.0
0.79
n.d.
9.4
n.d.
n.d.
450
1028.5
19.4
80.6
22.4
23.0
84.1
3.6
0.51
25.1
9.8
n.d.
41.6
6027.5
15.9
84.1
22.9
23.1
86.4
3.5
0.49
25.5
10.1
1642.0
x
600
1025.4
8.8
91.2
24.5
23.2
90.1
2.4
0.32
25.6
10.9
n.d.
32.4
6025.2
7.4
92.6
24.5
23.3
90.3
2.1
0.28
25.5
11.3
2265.1
750
1023.7
4.2
95.8
26.2
22.7
92.2
1.6
0.20
n.d.
12.1
n.d.
n.d.
6024.4
4.1
95.9
25.8
23.4
93.7
1.2
0.16
n.d.
11.9
n.d.
n.d.
Green
waste
300
1098.4
74.3
25.7
3.6
25.3
53.2
6.2
1.41
n.d.¶
7.4
n.d.
n.d.
6048.6
48.6
51.4
6.8
25.0
69.3
5.4
0.94
n.d.
8.1
n.d.
n.d.
450
1031.3
25.3
74.7
11.1
23.4
78.8
4.2
0.63
27.5
9.6
n.d.
65.1
6027.8
18.5
81.5
12.0
22.7
82.9
3.5
0.51
27.9
10.0
1760.8
xk
600
1024.9
11.5
88.5
13.2
22.0
87.7
2.3
0.32
27.9
10.4
n.d.
57.4
6024.4
8.8
91.2
13.4
22.3
88.4
2.0
0.27
28.0
11.3
4631.4
750
1026.4
3.5
96.5
13.9
25.5
87.5
1.5
0.21
n.d.
11.4
n.d.
n.d.
6023.7
1.9
98.1
13.4
23.2
93.2
1.3
0.16
n.d.
11.6
n.d.
n.d.
Dry
algae
300
1072.8
70.0
30.0
46.3
21.8
62.7
7.2
1.38
n.d.
4.9
n.d.
n.d.
6050.1
55.2
44.8
55.8
22.4
69.5
6.9
1.19
n.d.
7.7
n.d.
n.d.
450
1028.4
27.5
72.5
68.6
20.6
74.5
4.5
0.72
9.22
9.1
n.d.
97.0
6025.0
19.1
80.9
71.8
20.2
78.7
4.0
0.61
8.68
9.3
1470.8
x
600
1024.1
18.9
81.1
72.2
19.5
80.1
2.7
0.41
8.29
11.1
n.d.
71.5
6022.9
15.7
84.3
73.0
19.3
83.4
2.0
0.29
8.17
11.9
1965.2
750
1021.0
10.1
89.9
74.8
18.9
86.4
1.5
0.21
n.d.
12.4
n.d.
n.d.
6019.3
3.9
96.1
76.4
18.5
90.6
1.4
0.19
n.d.
12.5
n.d.
n.d.
*HTT,Highesttreatm
enttemperature;BOD,Biological
oxygen
dem
and.
†Bioch
arondry
andash-freebasis.
‡Bioch
arondry
basis.
§Expressed
ondry
andash-freefeed
stock
weightbasis.
¶ ForHVV
(higher
heatingvalue),BETsu
rfacearea
andbiological
tests,only
selected
samplesweresu
bjected
toan
alysis(n.d.=notdetermined
).k Indicates
that
forthesesamplesasoilincu
bationtest
was
perform
ed.
© 2012 Blackwell Publishing Ltd, GCB Bioenergy, 5, 104–115
SLOW PYROLYSIS BIOCHAR CHARACTERIZATION 107

(Thermo Fisher Scientific, Waltham, MA, USA). Oxygen con-
tent was not measured or calculated because of the interference
of inorganic oxides in the ash, especially as the ash contents in
the biochar varied from less than 1 to more than 40 wt%
depending on the feedstock material used (see also Table 1).
Higher heating value. The HHV (higher heating value) of
chars and input materials were determined by bomb calorimetry,
in duplicate (Parr model 6200 calorimeter with a model 1108
oxygen bomb, Parr Instrument Company, Moline, IL) according
to the instructions of Parr sheet no. 205M, 207M, and 442M.
pH in solution. Biochar samples were suspended in a 0.1 N
KCl solution in a 1 : 10 (wt/wt) ratio. After 10 min of stirring,
the pH of the biochar suspension was measured using a Model
420 Thermo Orion (Thermo Fisher Scientific). The analyses of
pH were performed in duplicate.
BET surface area. The BET specific surface area of the
biochars were calculated by measuring nitrogen gas adsorption
at -196 °C using a Strohlein Areameter II (CIS Ingenieurburo
Seifert, Dresden, Germany) according to the single-point method
DIN66132 (Deutsches Institut fur Normung, 1975). Samples
were degassed at 100 °C under continuous nitrogen flow for
24 h prior to analysis. Analyses were performed in duplicate.
Biological degradation experiments. Two short-term biolog-
ical degradation tests were performed: a biological oxygen
demand (BOD) test and a soil incubation test. In the first, the
BOD of each biochar sample was measured over 14 days in a
2.6 g l�1 dispersion containing a microbial inoculum obtained
from a soil sample. The soil sample from which the microbial
inoculum was prepared was the same as the one used in the
soil incubation test (see below). The dispersion was incubated
at 20 °C and buffered at a pH of 7.2. The amount of oxygen
consumed by biological oxidation of each biochar sample was
measured using an Oxitop Respirometer (WTW Gmbh, Weil-
heim, Germany). The oxygen consumption metering principle
is based on absorbing evolved CO2 by soda lime pellets – the
consumption of oxygen (biological demand) is then calculated
from measuring the headspace pressure drop in the container
of the biochar dispersion (Veeken et al., 2003). Apart from the
14-day measuring period and the use of a soil-derived
microbial inoculum, the procedure was similar to ISO (1999).
The second biological degradation test consisted of measur-
ing the respired CO2 from incubated biochar–soil mixtures
using a method adapted from Anderson & Ineson (1982).
A sandy loam soil, retrieved from the area of Lendelede (Bel-
gium) was used in the incubations. The soil sample contained
7.1 g organic carbon per kg of soil and had a pH-H2O of 5.33.
The soil was sampled from an arable farming plot and its
average composition was 50 wt% sand, 43 wt% silt and 7 wt%
clay. To prepare the incubations, the soil was thoroughly
mixed, passed through a 2 mm sieve, and for each individual
experiment 3.5 g of biochar was mixed with 250 g of soil (dry
basis) and placed in a 6.9 cm diameter PVC tube. Next, water
was added to achieve a moisture content of 50% water filled
pore space. The biochar–soil preparations were then incubated
for 42 days at 25 °C within sealed glass jars. The CO2, evolved
from each incubation, was trapped by a 15 ml 0.5 N NaOH
solution. Periodically the lye solutions were replaced and
titrated with 0.5 N HCl to a pH of 8.24 (702 SM Titrino,
Metrohm, Herisau, Switzerland). Evolved CO2 was therefore
determined by subtracting the amount of titrant used in a solu-
tion from a given biochar treatment from the average amount
required to neutralize the solution of the blank control; the dif-
ference being attributable to soil respired CO2 reacting with
OH� in solution to form CO32�. Although it has to be
remarked that a part of the evolved CO2 could be attributed to
abiotic processes. The time elapsed between titrations (and
replacement of the NaOH solutions) was varied during the
incubation period according to the expected respiration rate.
Measurements were taken on days 2, 4, 6, 10, 14, 18, 25, 36, and
42.
Results
A summary of all tests performed on the different types
of biochar produced along with the results is given in
Table 1. A more detailed analysis of each physicochemi-
cal or biological test is given below.
Biochar yield
The effects of pyrolysis residence time and HTT on
biochar yield are illustrated in Fig. 2. The char yields
(daf basis) are negatively correlated with increasing
pyrolysis severity (i.e. increased HTT and longer
residence times). Of the various feedstocks tested, algae
had the lowest biochar yield (daf basis), with the excep-
tion for the treatment at 300 °C and with a residence
time of 60 min. This could be due to a different compo-
sition in terms of extractives and cell wall components
in comparison with terrestrial biomass. Also, the algae
sample used had a high ash content (38.4 wt% daf)
which may act catalytically during the pyrolysis process
and alter the product distribution in terms of yield of
gas, char and bio-oil (Patwardhan et al., 2010).
Generally, the yields in this study were lower than
results reported in literature (e.g. Ozcimen &
Ersoy-Mericboyu, 2008; Masek et al., 2011), where
biochar yield above 30 wt% are reported. The low biochar
yields in this study can be attributed to the high nitro-
gen sweeping rate used in our production experiments
(800 ml min�1). The sweep gas reduces the vapour resi-
dence time and therefore partially inhibits secondary
char forming reactions (Ozcimen & Ersoy-Mericboyu,
2008).
Proximate analysis
Proximate analysis was performed to measure the
moisture, volatile matter, fixed carbon and ash contained
© 2012 Blackwell Publishing Ltd, GCB Bioenergy, 5, 104–115
108 F. RONSSE et al.

within the produced biochars and raw biomasses. The
moisture contents of the input materials were 5.84,
7.99, 31.64, and 5.32 wt% for wood, straw, green waste
and algae respectively. The relative ash content of the
biochar samples shows an important increase with
increasing pyrolysis severity (i.e. residence time and
HTT), which is expected as ash remains in the solid
fraction whereas the organic matter undergoes thermal
decomposition, resulting in weight loss in the C-con-
taining fraction. The calculated ash yields – i.e. the
ratio (in per cent) of the weight of ash in the biochar
to the weight of ash in the original biomass feedstock
sample – were >98% for wood, green waste and algae
and >95% for straw biochar. The minor losses in ash
content after the pyrolysis process are likely due to lost
potassium, which can volatilize at pyrolysis tempera-
tures (Long et al., 2012). In Fig. 3, the fixed carbon
content is plotted against HTT for two different resi-
dence times (10 and 60 min). To allow comparison and
to exclude bias from the ash content figures, the fixed
carbon results are expressed on a dry ash-free basis.
As the severity of pyrolysis increases, the fixed carbon
content in the produced biochars similarly increases,
with HTT having a more notable impact than residence
time in these experiments. However, the overall fixed
carbon yield – the total fixed carbon content expressed
as wt% of the original feedstock biomass used to pro-
duce the biochar (daf basis) – was seen to be independent
of both process variations as well as of the feedstocks
used. The increase in the fixed carbon content is thus a
result of the reduction in the overall biochar mass rather
than additional ‘carbon-fixing’ reactions. Conceptually,
this is unsurprising as the method used to measure fixed
carbon is itself also a pyrolytic process (devolatilization
0
20
40
60
80
100
250 350 450 550 650 750
Bio
char
yie
ld (w
t%, d
af b
asis
)
HTT (°C)
0
20
40
60
80
100
250 350 450 550 650 750
Bio
char
yie
ld (w
t%, d
af b
asis
)
HTT (°C)
(a)
(b)
Fig. 2 The effect of HTT on biochar yield, expressed in wt% of
biomass feedstock, on dry and ash-free basis (daf), for two dif-
ferent residence times: (a) 10 min and (b) 60 min. Biochar sam-
ples prepared from wood (♦), straw (□), green waste (▲) and
algae (○).
0
20
40
60
80
100
250 350 450 550 650 750
wt%
, daf
bas
is
HTT (°C)
fixed C content
fixed C yield
0
20
40
60
80
100
250 350 450 550 650 750
wt%
, daf
bas
is
HTT (°C)
fixed C content
fixed C yield
(a)
(b)
Fig. 3 The effect of HTT on fixed carbon content and on the
fixed carbon yield, both expressed in wt% of biomass feedstock
on dry and ash-free basis (daf), for two different residence
times: (a) 10 min and (b) 60 min. Biochar samples prepared
from wood (♦), straw (□), green waste (▲) and algae (○).
© 2012 Blackwell Publishing Ltd, GCB Bioenergy, 5, 104–115
SLOW PYROLYSIS BIOCHAR CHARACTERIZATION 109

at 950 °C). Considering the consistency of the fixed
carbon yields and the fact that all the biochar produc-
tion experiments in this study were subject to HTTs
much lower than 950 °C, we conclude that the proxi-
mate analysis had the overall net effect of subjecting all
the biochars to the same pyrolysis process – 950 °Ctreatment for 6 min – in essence overriding the lower
temperature pyrolysis that previously occurred in the
actual biochar production process. This observation fur-
ther supports the notion that HTT is the fundamental
process parameter in slow pyrolysis. Slow pyrolysis can
therefore be understood as a series of devolatilization
reactions that progressively leave behind an increas-
ingly condensed carbonaceous matrix.
Elemental analysis
The elemental composition of the produced biochars
shift from that of the feedstock biomass to high-carbon,
low-hydrogen compounds as a function of pyrolysis
process intensity (HTT, residence time). These results
are summarized in Fig. 4, where the H/C ratio is plotted
against the HTT of production. Although large differ-
ences in elemental composition were observed between
the biochars produced from the different feedstocks at
lower HTTs, there was a convergence of the H/C ratio
to 0.18 for all biomass types at a HTT of 750 °C.The H/C ratios measured in this research, as demon-
strated in Fig. 5, are similar to the values published by
Brown et al. (2005), Keiluweit et al. (2010), Schimmelp-
fennig & Glaser (2012) and Sun et al. (2012). The H/C
ratio can be considered a basic proxy for the average
number of H–C bonds per carbon atom, which can be
used to make an estimate for the average size of the
polyaromatic graphene clusters in the biochars –
which is likely to be an indicative measure of the overall
biochar stability in the soil. For instance, for a biochar
with an H/C ratio of 0.37, in its simplest construction,
could be composed of carbon graphene clusters having
an average of 22 aryl rings per cluster. In reality, the
cluster formation and aryl ring consistency is unlikely
to be well defined – with an extensive inhomogeneous
network more probable – but such estimations may be
useful in developing a better understanding of the
molecular structure of biochar. The linear correlation
between H/C ratio and fixed carbon content indicates
that fixed carbon has a very low H content and also that
volatile matter released during pyrolysis is composed of
compounds with higher H/C ratios than the remaining
biochar (fixed carbon). Hence the devolatilization
removes most of the H from the biomass as the pyrolysis
conversion reaction takes place.
Higher heating value
The calorific data are plotted in Fig. 6. The higher heat-
ing values (HHV) of the produced biochars increased
with increasing pyrolysis residence time and HTT for
all feedstocks except algae. This anomalous observation
is explained by the fact that energy densification from
pyrolysis only occurs in the organic fraction of the feed-
stock. For algae, the reduction of the HHV in pyrolysis
is caused by the high ash content of the algae, which
was 38.2 wt% (dry basis), whereas the ash contents of
wood, straw and green waste were 0.2, 7.9 and 3.5 wt%
respectively. Similarly, the differences in HHV of the
0.0
0.2
0.4
0.6
0.8
1.0
1.2
1.4
1.6
250 350 450 550 650 750
H/C
ratio
HTT (°C)
Fig. 4 The relationship between HTT and measured H/C
ratio of the biochar samples. Biochar samples prepared from
wood (♦), straw (□), green waste (▲) and algae (○), samples
produced with a residence time of 10 min connected with solid
black lines, and grey dotted lines for residence times of 60 min.
y = –0.0169 x + 1.8459R2 = 0.9714
0.0
0.2
0.4
0.6
0.8
1.0
1.2
1.4
1.6
20 30 40 50 60 70 80 90 100
H/C
ratio
Fixed carbon content, wt% (on daf basis)
Fig. 5 The measured H/C ratio of the biochar samples plotted
against fixed carbon content (in wt% and expressed on dry ash-
free basis). Biochar samples prepared from wood (♦), straw (□),green waste (▲) and algae (○).
© 2012 Blackwell Publishing Ltd, GCB Bioenergy, 5, 104–115
110 F. RONSSE et al.
biochars formed from other feedstocks are also attribut-
able to relative ash contents. As pyrolysis occurs, the
char slowly trends towards pure carbon (graphitic
structure) which carries a HHV of 32.8 kJ kg�1 (Soares
et al., 1997). Ash contained within char will therefore
‘dilute’ the energy content, meaning the limited value of
the HHV for completely carbonized materials will be
lower than that of pure C (as seen in the HHVs of
biochars from straw and green waste). However, the
HHV of the biochars derived from wood is higher than
the HHV of pure carbon (up to almost 35 MJ kg�1).
This is due to the presence of C–H, C–O, and perhaps O
–H bonds remaining in the carbonaceous mass.
Considering biochars with carbon contents from 90% to
100%, one expects the HHV to peak and slowly decline
as the heterogeneous bonding is sequentially eliminated,
and the carbon molecular structures become increasingly
energetically stabilized by aromatic resonances and p-pstacking of graphitic sheets.
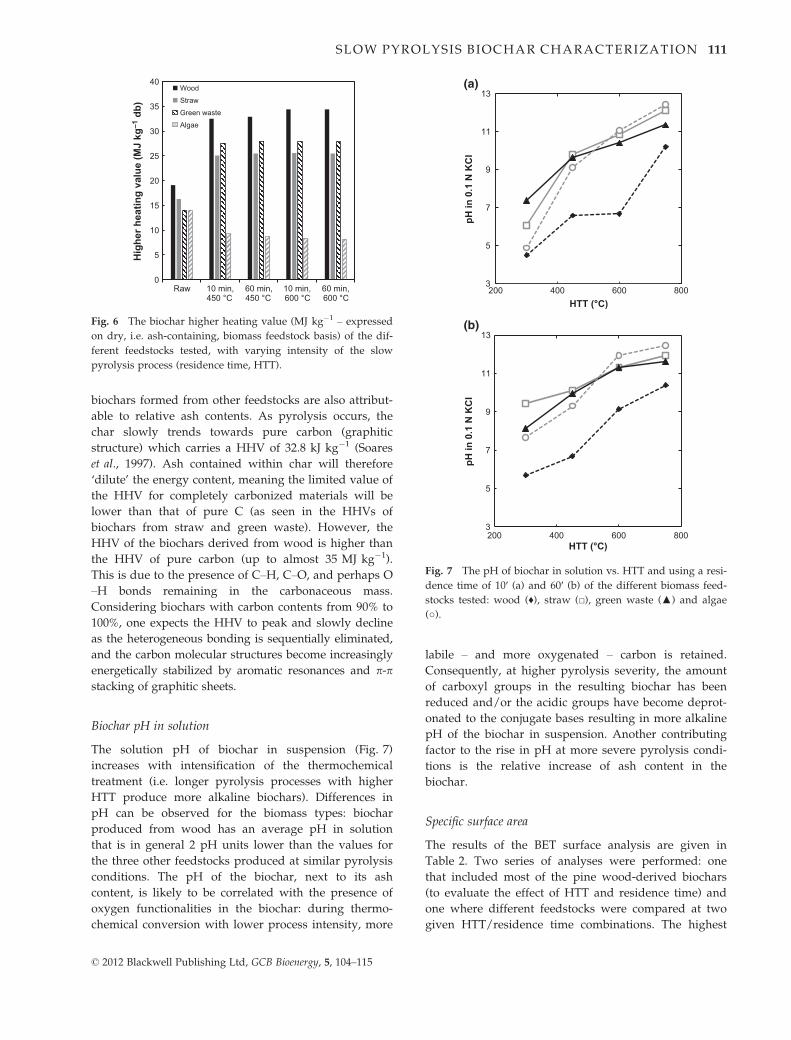
Biochar pH in solution
The solution pH of biochar in suspension (Fig. 7)
increases with intensification of the thermochemical
treatment (i.e. longer pyrolysis processes with higher
HTT produce more alkaline biochars). Differences in
pH can be observed for the biomass types: biochar
produced from wood has an average pH in solution
that is in general 2 pH units lower than the values for
the three other feedstocks produced at similar pyrolysis
conditions. The pH of the biochar, next to its ash
content, is likely to be correlated with the presence of
oxygen functionalities in the biochar: during thermo-
chemical conversion with lower process intensity, more
labile – and more oxygenated – carbon is retained.
Consequently, at higher pyrolysis severity, the amount
of carboxyl groups in the resulting biochar has been
reduced and/or the acidic groups have become deprot-
onated to the conjugate bases resulting in more alkaline
pH of the biochar in suspension. Another contributing
factor to the rise in pH at more severe pyrolysis condi-
tions is the relative increase of ash content in the
biochar.
Specific surface area
The results of the BET surface analysis are given in
Table 2. Two series of analyses were performed: one
that included most of the pine wood-derived biochars
(to evaluate the effect of HTT and residence time) and
one where different feedstocks were compared at two
given HTT/residence time combinations. The highest
0
5
10
15
20
25
30
35
40
Raw 10 min,450 °C
60 min,450 °C
10 min,600 °C
60 min,600 °C
Hig
her h
eatin
g va
lue
(MJ
kg–1
db)
Wood
Straw
Green waste
Algae
Fig. 6 The biochar higher heating value (MJ kg�1 – expressed
on dry, i.e. ash-containing, biomass feedstock basis) of the dif-
ferent feedstocks tested, with varying intensity of the slow
pyrolysis process (residence time, HTT).
3
5
7
9
11
13
200 400 600 800
pH in
0.1
N K
Cl
HTT (°C)
3
5
7
9
11
13
200 400 600 800
pH in
0.1
N K
Cl
HTT (°C)
(a)
(b)
Fig. 7 The pH of biochar in solution vs. HTT and using a resi-
dence time of 10′ (a) and 60′ (b) of the different biomass feed-
stocks tested: wood (♦), straw (□), green waste (▲) and algae
(○).
© 2012 Blackwell Publishing Ltd, GCB Bioenergy, 5, 104–115
SLOW PYROLYSIS BIOCHAR CHARACTERIZATION 111

BET specific surface (196 m2 g�1) was observed for
biochar produced from wood at an HTT of 600 °C and
a shorter residence time of 10 min. At lower pyrolysis
temperatures (300 and 450 °C), the biochar surface area
was generally low, but gradually increased in biochars
produced with longer residence times. Pyrolysis at
600 °C produced the most accessible surface in the
chars for all feedstock biomasses tested, but an inverse
relationship between specific surface and residence time
was also observed. When the pyrolysis temperature was
increased further, the BET surface area reduced again,
which is likely due to restructuring taking place in the
biochar or due to the onset of ash melting at higher tem-
peratures.
When comparing the different biomass feedstocks in
Table 2b, woody biochar offers the highest potential of
surface area as all other biochar types had a BET spe-
cific surface below 50 m² g�1. Also, wood had the low-
est ash content of all feedstocks used (0.2, 7.9, 3.5, and
38.4 wt% for wood, straw, green waste and algae,
respectively). From these observations, higher amount
of inorganics (i.e. ash content) in the biomass feedstock
negatively correlate with specific surface area in the
produced biochar. This is possibly explained by fusion
of molten ash filling up pores in the biochar, thereby
decreasing accessible surface area.
Biological degradation
Figure 8 shows the results of the cumulative BOD for
biochars produced from wood under different pyrolysis
intensities (residence time, HTT). These data show that
the rate of oxygen demand during the 2-week incuba-
tion period decreased exponentially, with a logarithmic
relationship existing between incubation time and
cumulative BOD. In case of wood, the R2 in the logarith-
mic regression analysis varied between 0.899 and 0.956.
Similar logarithmic trends were seen with biochars
produced from feedstocks other than wood.
Total cumulated BOD was found to be directly
proportional to the volatile content of biochar with a
correlation of R2 = 0.728 (Fig. 9). Higher carbon
mineralization rates in soils amended with biochars
Table 2 The BET surface area of (a) woody biochar pro-
duced at varying highest treatment temperatures (HTTs) and
residence times and (b) of different feedstock materials pyrol-
ysed with a HTT of 450 and 600 °C and a residence time of
60 min.
(a) Wood biochar
Highest treatment temperature (°C)
Residence time (min) 300 450 600 750
10 – 4 196 128
60 6 23 127 –
(b) Residence time = 60 min
Biomass input material
HTT (°C) Wood Straw Green waste Algae
450 23 16 17 14
600 127 22 46 19
–, No data recorded.
0
10
20
30
40
50
60
70
80
90
0 2 4 6 8 10 12 14 16 18
Bio
logi
cal o
xyge
n de
man
d (m
g O
2 L–
1 )
Oxidation time (days)
450 °C, 10 min450 °C, 60 min600 °C, 10 min600 °C, 60 minLog. (450 °C, 10 min)Log. (450 °C, 60 min)Log. (600 °C, 10 min)Log. (600 °C, 60 min)
Fig. 8 Cumulative biological oxygen demand (BOD), measured over a 14-day period with regular sampling and for wood-based
biochar, treated at different HTTs and different residence times.
© 2012 Blackwell Publishing Ltd, GCB Bioenergy, 5, 104–115
112 F. RONSSE et al.

produced from low-temperature pyrolysis processes
have also been previously observed by Zimmerman
(2010) and Cross & Sohi (2011). The high-volatile matter
content of these chars was identified as the main cause
of the higher carbon mineralization.
Given the results in Table 1, assuming exponential
decay of the volatile matter in the biochar and by taken
into account the pool of volatile matter in the biochar,
then extrapolation indicates that all ‘volatile carbon’
should be consumed after 7 months (algae, HTT = 600 °Cand tr = 60 min) to 2.3 years (wood, HTT = 750 °C and
tr = 60 min). However, these crude estimates are based
on the assumption that the volatile matter and stable
carbon fraction as determined by the proximate analysis
method correspond respectively to the labile and recal-
citrant carbon fractions in the soil, which not necessarily
holds true.
In the second biological degradation test, biochar was
mixed with an actual soil sample and the CO2 produc-
tion was measured during a 42-day incubation period.
The tests were only limited to the woody biochar
samples produced using a residence time of 60 min.
In Fig. 10, the cumulative respiration, relative to the
untreated control soil sample (i.e. cumulative respira-
tion biochar-amended sample minus cumulative
respiration control soil), for the different-tested woody
biochars is plotted for a 42-day incubation period. It is
important to stress that in this test, no distinction can be
made between the mineralization of preexisting C
already present in the soil sample and the C from
biochar itself. The results show that the initial carbon
mineralization rates are suppressed by the addition of
biochar, which is clearly seen by the negative slopes of
the relative carbon respiration curves in Fig. 10. After
their initial reduced values, respiration rates were seen
to restore to a level above that of the control (untreated)
soil sample – as can be seen by the positive slope of the
relative respiration curve near the end of the 42-day
measurement period of most of the biochar-amended
soil samples. Also, the depression of initial carbon min-
eralization is proportional to the intensity of thermal
treatment during pyrolysis – although the sample pro-
duced at 600 °C does not follow trend. Chars produced
at higher HTT tend to have lower, more suppressed, ini-
tial carbon mineralization rates. The initial depression
of the respiration rate could be attributed to the time
needed for the soil microculture to adapt to the new
conditions. The changes brought upon the soil sample
by the addition of biochar occur on different levels: for
instance, the pH and soil texture will be altered; biochar
could have the ability to adsorb certain compounds –
i.e. nutrients or phytotoxic compounds (Beesley et al.,
2010; Borchard et al., 2012) – or release additional nutri-
ents; there may be a mild toxicity associated with ‘fresh’
biochar; perhaps the added biochars alters the soil
structure and/or water-holding capacity in a way that
disrupts the soil biota. Regarding the effect of biochar
addition to the initial CO2 respiration in soils, some
researchers have found an opposite effect, i.e. an
increase in evolved CO2 in biochar-amended soil
samples – an effect also know as positive ‘priming
effect’ (Novak et al., 2010; Jones et al., 2011; Zimmerman
et al., 2011). However, this positive priming effect has
not always been observed to significant extent (Cross &
Sohi, 2011; Case et al., 2012) or a negative priming
effect, a reduction in initial CO2 soil respiration in
y = 0.8783 x + 4.2894R² = 0.7283
5
10
15
20
25
30
35
5 10 15 20 25 30
BO
D14
(mg
O2
g–1
bioc
har)
Volatile matter (wt%)
Fig. 9 Cumulative biological oxygen demand (BOD), mea-
sured over a 14-day period plotted against volatile matter con-
tent, for wood (♦), straw (□), green waste (▲) and algae (○) andunder varying HTTs and residence times.
1.0
–0.8
–0.6
–0.4
–0.2
0.0
0.2
0 10 20 30 40
Cum
ulat
ive
resp
iratio
n (m
mol
CO
2-C
)
Time (days)
Wood 300 °C Wood 450 °CWood 600 °C Wood 750 °C
zero biochar control sample
Fig. 10 Cumulative respiration, relative to the untreated con-
trol soil sample and expressed as mol CO2-C produced per
day, recorded during a 42-day incubation period in a biochar-
treated soil sample. Biochar samples were all produced with a
residence time of 60 min.
© 2012 Blackwell Publishing Ltd, GCB Bioenergy, 5, 104–115
SLOW PYROLYSIS BIOCHAR CHARACTERIZATION 113

biochar-amended soil samples could be observed
(Zimmerman et al., 2011). Clearly, the outcome of
changes in CO2 respiration in biochar supplemented soil
samples depends on a large number of variables,
including biochar type (feedstock, pyrolysis conditions),
soil type, biochar loading in the soil (i.e. wt% biochar in
soil) and physical conditions during the soil incubation
tests (temperature, air humidity, soil moisture content,
etc.). Consequently, it is difficult to interpret and com-
pare the C mineralization observations in this study.
Longer soil incubation tests, with different biochar load-
ings, are needed to clarify the overall effects biochar has
on overall mineralization in the soil.
Discussion
The fixed-bed pyrolysis experiments in this study
tested a range of biomass feedstocks and variable pro-
cess parameters. Analysis of the produced biochars
provided significant data and increased the overall
understanding of slow pyrolysis. Raw biochar yield
was seen to decrease with both the intensity of the
pyrolysis process (i.e. residence time and highest
treatment temperature) and by the ash content of the
feedstock biomass. The volatile matter content of the
produced biochars also declined with pyrolysis sever-
ity, whereas ash and fixed carbon contents increased.
If, however, the fixed carbon content of the different
biochars is corrected for ash content (i.e. reported on
daf basis), it was found that whereas the fixed carbon
content of the biochars strongly depended on the
intensity of the thermal treatment, the actual overall
yield in fixed carbon was practically insensitive to the
treatment temperature and residence time. This obser-
vation could result in the faulty conclusion that the
thermochemical conversion that occurs in the organic
fraction of biomasses during slow pyrolysis is largely
invariant across the tested range of HTTs and resi-
dence times. However, the observed constant fixed
carbon yields were merely the result of the method
employed for measuring ‘fixed carbon’, as this
method itself is a pyrolysis process (up to 950 °C)and in effect, supersedes any previous slow pyrolysis
production. This conclusion is further supported by
the consistent linear relationship between fixed carbon
and H/C atomic ratio found across the produced
biochars.
The HHV of the produced chars was largely consis-
tent for any given feedstock material beyond a moder-
ate pyrolysis treatment. The HHV of the biochars
trended towards a consistent limit for each feedstock
with increasing pyrolysis intensity. The actual HHVs of
the produced biochars were largely determined by the
amount of ‘dilution’ of the combustible fraction by ash
content. Thus, the energy densification in pyrolysis is
confined to the C fraction and was consistent across the
tested feedstocks.
The pH in dispersion of the produced biochars was
governed by feedstock type, ash content and pyrolysis
intensity, with more increased pyrolysis temperature
and duration generally increasing the solution pH.
Specific BET surface areas of the biochars produced in
this study were generally low, with the exception of
those produced from wood and high HTT which had
comparatively moderate specific surfaces. Higher HTT
increased the BET specific surface across all feed-
stocks, whereas longer residence times reduced the
BET specific surfaces in biochars produced at high
temperatures, possibly due to ash fusion filling mi-
cropores.
In the biological degradation experiments, the volatile
matter content of biochar correlated positively with
initial BOD. Whereas in the soil incubation carbon
mineralization tests, the addition of biochar to the soil
initially reduced the C-mineralization rate. Hence indi-
cating that the soil microculture needs to adapt to the
new conditions. This effect was more pronounced when
adding chars with high fixed carbon content, as chars
with low C-content had a larger amount of volatile, pre-
sumably, more easily biodegradable, C-compounds. The
extent to which labile and stable C-fraction is present is
greatly determined by the intensity of the pyrolysis
process, both in terms of residence time and highest
treatment temperature (HTT).
Acknowledgements
The authors gratefully acknowledge the financial support ofEvonik Industries AG and the Multidisciplinary Research Part-nership Ghent Bio-Economy in conducting this study.
References
Anderson JM, Ineson P (1982) A soil microcosm system and its application to mea-
surements of respiration and nutrient leaching. Soil Biology and Biochemistry, 14,
415–416.
Antal MJJ, Gronli M (2003) The art, science, and technology of charcoal production.
Industrial and Engineering Chemistry Research, 42, 1619–1640.
ASTM (2007) D1762–84: Standard Method for Chemical Analysis of Wood Charcoal.
American Society for Testing and Materials international, West Conshohocken,
PA, USA.
Balat M, Balat M, Kirtay E, Balat H (2009) Main routes for the thermo-conversion of
biomass into fuels and chemicals. Part 1: pyrolysis systems. Energy Conversion and
Management, 50, 3147–3157.
Beesley L, Moreno-Jimenez E, Gomez-Eyles JL (2010) Effects of biochar and green
waste compost amendments on mobility, bioavailability and toxicity of inorganic
and organic contaminants in a multi-element polluted soil. Environmental Pollu-
tion, 158, 2282–2287.
Borchard N, Prost K, Kautz T, Moeller A, Siemens J (2012) Sorption of copper (II)
and sulphate to different biochars before ans after composting with farmyard
manure. European Journal of Soil Science, 63, 399–409.
Bridgwater AV (2012) Review of fast pyrolysis of biomass and product upgrading.
Biomass and Bioenergy, 38, 68–94.
© 2012 Blackwell Publishing Ltd, GCB Bioenergy, 5, 104–115
114 F. RONSSE et al.

Bridgwater AV, Peacocke GVC (2000) Fast pyrolysis processes for biomass. Renew-
able Sustainable Energy Reviews, 4, 1–73.
Brown RA, Kercher AK, Nguyen TH, Nagle DC, Ball WP (2005) Production and
characterisation of synthetic wood chars for use as surrogates for natural sor-
bents. Organic Geochemistry, 37, 321–333.
Case DCC, McNamara NP, Reay DS, Whitaker J (2012) The effect of biochar addition
on N2O and CO2 emissions from a sandy soil – the role of soil aeration. Soil Biol-
ogy and Biochemistry, 51, 125–134.
Chan KY, Van Zwieten L, Meszaros I, Downie A, Joseph S (2007) Agronomic values
of greenwaste biochar as a soil amendment. Australian Journal of Soil Research, 45,
629–634.
Cross A, Sohi SP (2011) The priming potential of biochar products in relation to
labile carbon contents and soil organic matter status. Soil Biology and Biochemistry,
43, 2127–2134.
Czernik S, Bridgwater AV (2004) Overview of applications of biomass fast pyrolysis
oil. Energy & Fuels, 18, 590–598.
Deutsches Institut fur Normung (1975) DIN66132: Bestimmung der spezifischen Obe-
rflache von Feststoffen durch Stickstoffadsorption (Einpunkt-Differenzverfahren nach
Haul und Dumbgen). Beuth Verlag GmbH, Berlin, Germany.
Hossain MK, Strezov V, Chan KY, Ziolkowski A, Nelson PF (2011) Influence of
pyrolysis temperature on production and nutrient properties of wastewater
sludge biochar. Journal of Environmental Management, 92, 223–228.
International Biochar Initiative (IBI) (2012) Guidelines for Specifications of Biochars for
Use in Soils, Final Version (May 2012), IBI, Westerville, OH, USA.
ISO (1999) ISO 14851:1999, Determination of the Ultimate Aerobic Biodegradability of
Plastic Materials in an Aqueous Medium – Method by Measuring the Oxygen Demand
in a Closed Respirometer, International Organization for Standardisation, Geneva,
Switzerland.
Jeffery S, Verheijen FGA, van der Velde M, Bastos AC (2011) A quantitative review
of the effects of biochar application to soils on crop productivity using meta-anal-
ysis. Agriculture, Ecosystems and Environment, 144, 175–187.
Jones DL, Murphy DV, Khalid M, Ahmad W, Edwards-Jones G, DeLuca TH (2011)
Short-term biochar-induced increase in soil CO2 release is both biotically and abi-
otically mediated. Soil Biology and Biochemistry, 43, 1723–1731.
Keiluweit M, Nico PS, Johnson MG, Kleber M (2010) Dynamic molecular structure
of plant biomass-derived black carbon (biochar). Environmental Science and Tech-
nology, 44, 1247–1253.
Kuzyakov Y, Subbotina I, Chen H, Bogomolova I, Xu X (2009) Black carbon decom-
position and incorporation into soil microbial biomass estimated by 14C labeling.
Soil Biology and Biochemistry, 41, 210–219.
Laird DA, Brown RC, Amonette JE, Lehmann J (2009) Review of the pyrolysis
platform for co-producing bio-oil and biochar. Biofuels, Bioproducts and Biorefineries, 3,
547–562.
Lehmann J, Joseph S (2009) Biochar for Environmental Management – Science and Tech-
nology. Earthscan, London.
Lehmann J, Gaunt J, Rondom M (2006) Bio-char sequestration in terrestrial
ecosystems – a review. Mitigation and Adaptation Strategies for Global Change, 11,
403–427.
Long J, Song H, Jun X, Sheng S, Lun-shi S, Kai X, Yao Y (2012) Release characteris-
tics of alkali and alkaline earth metallic species during biomass pyrolysis and
steam gasification process. Bioresource Technology, 116, 278–284.
Lu Q, Li W-Z, Zhu X-F (2009) Overview of fuel properties of biomass fast pyrolysis
oils. Energy Conversion and Management, 50, 1376–1383.
Lua AC, Yang T, Guo J (2004) Effects of pyrolysis conditions on the properties of
activated carbons prepared from pistachio-nut shells. Journal of Analytical and
Applied Pyrolysis, 72, 279–287.
Major J, Rondon M, Molina D, Riha SJ, Lehmann J (2010) Maize yield and nutrition
during 4 years after biochar application to a Colombian savanna oxisol. Plant and
Soil, 333, 117–128.
Masek O, Brownsort P, Cross A, Sohi S (2011) Influence of production conditions on
the yield and environmental stability of biochar. Fuel. doi: 10.1016/j.fuel.2011.
08.044 (in press).
Matovic D (2011) Biochar as a viable carbon sequestration option: global and Cana-
dian perspective. Energy, 36, 2011–2016.
Mohan D, Pittman CU Jr., Steele PH (2006) Pyrolysis of wood/biomass for bio-oil: a
critical review. Energy & Fuels, 20, 848–889.
Novak JM, Busscher WJ, Laird DA, Ahmedna M, Watts DM, Niandou M (2009)
Impact of biochar amendment on fertility of a southeastern Coastal Plain soil. Soil
Science, 174, 105–112.
Novak JM, Busscher WJ, Watts DW, Laird DA, Ahmedna MA, Niangou MAS (2010)
Short-term CO2 mineralization after additions of biochar and switchgrass to
Typic Kandiudult. Geoderma, 154, 281–288.
Ozcimen D, Ersoy-Mericboyu A (2008) A study on the carbonisation of grapeseed
and chestnut shell. Fuel Processing Technology, 89, 1041–1046.
Patwardhan PR, Satrio JA, Brown RC, Shanks BH (2010) Influence of inorganic salts on
the primary pyrolysis products of cellulose. Bioresource Technology, 101, 4646–4655.
Roberts KG, Gloy BA, Joseph S, Scott NR, Lehmann J (2010) Life cycle assessment of
biochar systems: estimating the energetic, economic, and climate change poten-
tial. Environmental Science and Technology, 44, 827–833.
Schimmelpfennig S, Glaser B (2012) One step forward toward characterization: some
important material properties to distinguish biochars. Journal of Environmental
Quality, 41, 1–13.
Schmidt HP, Abiven S, Kammann C, Glaser B, Bucheli T, Leifeld J (2012) Guide-
lines on the Production of Biochar – Euorpaisches Pflanzenkohle Zertifikat/European
Biochar Certificate. Delinat Institute and Biochar Science Network, Ayent, Swit-
zerland.
Soares RW, Menzes VJ, Fonsec MVA, Dweck J (1997) Characterization of carbona-
ceous products by TG and DTA. Journal of Thermal Analysis, 49, 657–661.
Sohi SP, Krull E, Lopez-Capel E, Bol R (2010) A review of biochar and its use and
function in soil. Advances in Agronomy, 105, 47–82.
Song W, Guo M (2012) Quality variations of poultry litter biochar generated at differ-
ent pyrolysis temperatures. Journal of Analytical and Applied Pyrolysis, 94, 138–145.
Sun H, Hockaday WC, Masiello CA, Zygourakis K (2012) Multiple controls on the
chemical and physical structure of biochars. Industrial and Engineering Chemistry
Research, 51, 3587–3597.
Veeken AHM, de Wilde V, Hamelers HVM (2003) OxiTop® Measuring System for
Standardised Determination of the Respiration Rate and N-Mineralisation Rate of
Organic Matter in Waste Material, Compost and Soil. Nutrient Management Institute
(NMI), Wageningen, the Netherlands.
Zimmerman AR (2010) Abiotic and microbial oxidation of laboratory-produced
black carbon (biochar). Environmental Science and Technology, 44, 1295–1301.
Zimmerman AR, Gao B, Ahn MY (2011) Positive and negative carbon mineralization
priming effects among a variety of biochar-amended soils. Soil Biology and Bio-
chemistry, 43, 1169–1179.
© 2012 Blackwell Publishing Ltd, GCB Bioenergy, 5, 104–115
SLOW PYROLYSIS BIOCHAR CHARACTERIZATION 115