Press Release Revision in suffix to ratings pursuant … CE...Press Release

Press release 25 February 2013
Pearson plc, 80 Strand, London, WC2R 0RL Registered in England 53723
PEARSON 2012 PRELIMINARY RESULTS (UNAUDITED) Pearson accelerates global education strategy: Restructuring and investment in digital, services and emerging markets for faster growth, larger market opportunity and greater impact on learning outcomes Financial highlights* • Sales up 5% at CER to £6.1bn (with digital and services businesses contributing 50% of sales) • Adjusted operating profit 1% higher at £936m • Adjusted EPS of 84.2p (86.5p in 2011) • Operating cash flow of £788m (£983m in 2011) • Return on invested capital of 9.1% (9.1% in 2011) • Dividend raised 7% to 45.0p. Market conditions and industry change • Market conditions generally weak in developed world and for print publishing businesses;
generally strong in emerging economies and for digital and services businesses. • Continuing structural change in education funding, retail channels, consumer behaviour and
content business models. • Considerable growth opportunity in education driven by rapidly-growing global middle class,
adoption of learning technologies, the connection between education and career prospects and increasing consumer spend, especially in emerging economies.
Strong competitive performance • North American Education revenues up 2% in a year when US School and Higher Education
publishing revenues declined by 10% for the industry as a whole. • International Education revenues up 13% with emerging market revenues up 25%. • FT Group revenues up 4% with the Financial Times’ total paid print and online circulation up to
602,000; digital subscriptions exceed print circulation for the first time. • Penguin revenues up 1%, with strong publishing performance and eBooks now 17% of sales. Accelerated shift to digital & services and to fast-growing economies • Pearson announces gross restructuring costs of approximately £150m in 2013 (£100m net of
cost savings achieved in the year), focused on: 1. significantly accelerating the shift of Pearson’s education businesses towards fast-growing
economies and digital and services businesses; 2. separating Penguin activities from Pearson central services and operations in preparation for
the merger of Penguin and Random House. • Restructuring expected to generate annual cost savings of approximately £100m in 2014. • In 2014, £100m of cost savings to be reinvested in organic development of fast-growing
education markets and categories and further restructuring, including the Penguin Random House integration.
• From 2015, restructuring programme expected to produce faster growth, improving margins and stronger cash generation.
Page 2 of 36
Outlook • Pearson expects tough trading conditions and structural industry change to continue in 2013. • Excluding restructuring costs and including Penguin for the full year, Pearson expects to
achieve 2013 operating profit and adjusted EPS broadly level with 2012. John Fallon, chief executive, said: “Pearson has a sound, successful strategy: now we are significantly accelerating its implementation. Trading conditions are tough and structural changes mean many of our traditional publishing activities are under pressure. But the underlying demand for effective education remains immensely powerful and our developing world and digital services businesses have real scale and momentum. The restructuring of the company that we are announcing today is designed to strengthen dramatically Pearson’s position in digital education services and in our most important markets for the future – and to enable us to capture the once-in-a-generation opportunity that comes with being the world’s leading learning company.” * Total business
Page 3 of 36
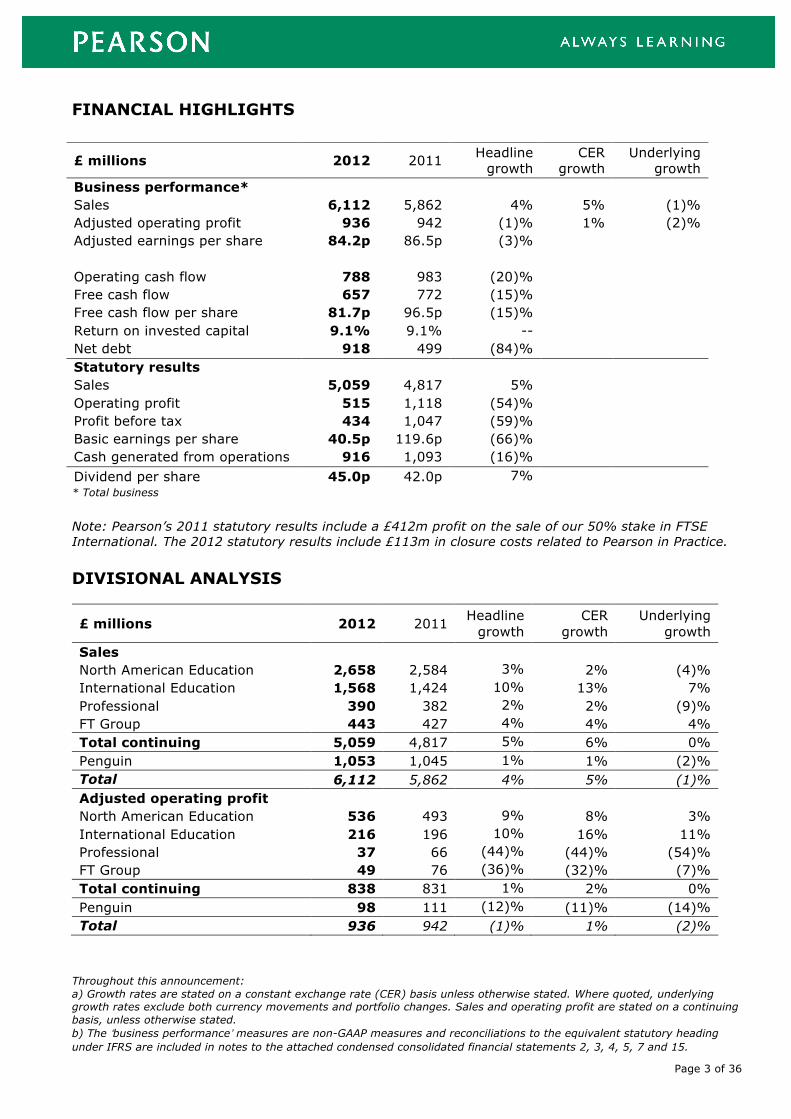
FINANCIAL HIGHLIGHTS
* Total business
Note: Pearson’s 2011 statutory results include a £412m profit on the sale of our 50% stake in FTSE International. The 2012 statutory results include £113m in closure costs related to Pearson in Practice. DIVISIONAL ANALYSIS
£ millions 2012 2011 Headline growth
CER growth
Underlying growth
Sales North American Education 2,658 2,584 3% 2% (4)% International Education 1,568 1,424 10% 13% 7% Professional 390 382 2% 2% (9)% FT Group 443 427 4% 4% 4% Total continuing 5,059 4,817 5% 6% 0% Penguin 1,053 1,045 1% 1% (2)% Total 6,112 5,862 4% 5% (1)% Adjusted operating profit North American Education 536 493 9% 8% 3% International Education 216 196 10% 16% 11% Professional 37 66 (44)% (44)% (54)% FT Group 49 76 (36)% (32)% (7)% Total continuing 838 831 1% 2% 0% Penguin 98 111 (12)% (11)% (14)% Total 936 942 (1)% 1% (2)%
Throughout this announcement: a) Growth rates are stated on a constant exchange rate (CER) basis unless otherwise stated. Where quoted, underlying growth rates exclude both currency movements and portfolio changes. Sales and operating profit are stated on a continuing basis, unless otherwise stated. b) The ‘business performance’ measures are non-GAAP measures and reconciliations to the equivalent statutory heading under IFRS are included in notes to the attached condensed consolidated financial statements 2, 3, 4, 5, 7 and 15.
£ millions 2012 2011 Headline growth
CER growth
Underlying growth
Business performance* Sales 6,112 5,862 4% 5% (1)% Adjusted operating profit 936 942 (1)% 1% (2)% Adjusted earnings per share 84.2p 86.5p (3)% Operating cash flow 788 983 (20)% Free cash flow 657 772 (15)% Free cash flow per share 81.7p 96.5p (15)% Return on invested capital 9.1% 9.1% -- Net debt 918 499 (84)% Statutory results Sales 5,059 4,817 5% Operating profit 515 1,118 (54)% Profit before tax 434 1,047 (59)% Basic earnings per share 40.5p 119.6p (66)% Cash generated from operations 916 1,093 (16)% Dividend per share 45.0p 42.0p 7%

Page 4 of 36
OUTLOOK We expect the external environment to remain challenging for our developed world and publishing businesses in 2013 owing to a combination of cyclical and structural factors: pressures on education budgets and college enrolments; retail consolidation; the shift in our business model from print sales to digital subscriptions; changing consumer behaviour and a dynamic competitive landscape. In general, we expect market conditions to remain favourable for our businesses in developing economies and education software and services. In order to reshape the company to take advantage of significant growth opportunities, we will expense approximately £150m of restructuring costs in 2013 (the restructuring cost will be approximately £100m net of cost savings achieved in the year). This investment has two objectives: 1. to accelerate our transition from print to digital business models and from developed to
developing economies; and 2. to separate Penguin activities from Pearson central services and operations, and to reduce
fixed cost infrastructure in Pearson, in preparation for the Penguin Random House merger. We expect this transformation programme to generate approximately £100m of annual cost savings from 2014. In 2014, we intend to reinvest the £100m of cost savings in the organic development of our fast-growing digital, services and emerging markets businesses and further restructuring, including the Penguin Random House integration. We expect these businesses to contribute to faster organic growth, improving margins and improved cash flow and capital intensity from 2015. The precise phasing of restructuring costs and benefits will depend on timing of completion of the Penguin Random House combination, which remains subject to regulatory approval and which we expect to complete in the second half of 2013. At this early stage in the year we expect Pearson 2013 operating profits and adjusted EPS to be broadly level with 2012 before expensing these restructuring costs (compared to 2012 adjusted EPS of 82.6p under revised IAS 19 which we will adopt in 2013) and including Penguin for the full year. This guidance is struck at the 2012 average exchange rate of £1:$1.59 and reflects the following outlook: In Education, we expect to achieve modest revenue growth in 2013 with margins similar to 2012. In North America, we anticipate modest growth with challenging cyclical and structural market conditions in publishing offset by growth in digital and services. We expect our International education business to show good growth. Austerity measures will continue to affect education spending in much of the developed world and we expect a slower year for UK examinations and qualifications. However, we see significant opportunity in emerging markets in Asia, Latin America, the Middle East and Sub-Saharan Africa – which together accounted for 45% of our International education revenues in 2012. Our Professional education business will reflect the closure of our UK professional training business and continued growth from our professional certification business. We expect the FT Group to benefit from continued growth in digital and subscription revenues in 2013 but advertising to remain weak and volatile with profits reflecting further actions to accelerate the shift from print to digital. Mergermarket will benefit from its high subscription renewal rates, with market activity likely to boost its core product offerings. As previously announced, subject to regulatory approval we expect Penguin's combination with Random House to be completed in the second half of 2013. We believe that the combined organisation will have a stronger platform and greater resources to invest in rich content, new digital publishing models and high-growth emerging markets. The organisation will generate synergies from shared resources such as warehousing, distribution, printing and central functions. We expect market conditions to remain similar to 2012 with a tough environment in the physical bookstore channel but helped by good growth in digital.

Page 5 of 36
Interest and tax. In 2013, our net interest charge to adjusted earnings will exclude pension income and charges following the adoption of IAS19 revised and be similar to the £65m reported in 2012 on a comparable basis. We anticipate our P&L tax charge against adjusted earnings to be in the 23-25% range with our cash tax rates around the same level. Exchange rates. Pearson generates approximately 60% of its sales in the US. A five cent move in the average £:$ exchange rate for the full year (which in 2012 was £1:$1.59) has an impact of approximately 1.4p on adjusted earnings per share. For more information: Luke Swanson / Simon Mays-Smith / Charles Goldsmith + 44 (0)20 7010 2310 Pearson’s results presentation for investors and analysts will be audiocast live today from 0900 (GMT) and available for replay from 1200 (GMT) via www.pearson.com. High resolution photographs for the media are available from our website www.pearson.com.

Page 6 of 36
STRATEGY OVERVIEW Pearson’s goal is to help people make progress in their lives through learning. Over the past 15 years, through a major programme of organic investment and acquisitions, Pearson has become the leading education company in the world, with unique geographic reach, product breadth and professional depth. More recently, we have achieved particularly rapid growth in digital products and in education services businesses, which together now account for half our sales, and in emerging economies, which now make up 16% of sales on a continuing basis. At the same time, structural trends have placed some pressure on parts of our business including book publishing and financial advertising. Looking ahead, we see considerable growth opportunities in education, driven by trends including rapid growth of the global middle class, adoption of learning technologies, the connection between education and career prospects and increasing consumer spend on education, especially in emerging economies. We are therefore planning significantly to accelerate our push into digital learning, education services and emerging markets. For some time we have been focusing our acquisition and organic investment in these areas; we now intend a further significant reallocation of internal resources to these activities. We are making a restructuring investment across three areas: the transformation of our education company; the separation of Penguin from Pearson and the creation of Penguin Random House. We are directing our resources and capital towards being an education services company that is global in its ambition and intensely local in its focus on its largest market opportunities. We are therefore developing a new strategic framework to organise Pearson, to analyse opportunities, to allocate investment capital, to develop world-class products and services and to drive performance. 1. First, we are concentrating on four global businesses: school, higher education, English and
business. We are taking an increasingly global view of educational needs, consumer trends and product development for these businesses;
2. Second, we are applying a rigorous framework to prioritise geographic markets and to
determine where we offer global products and services; where we customise for local needs; and where we require a fully local approach. We are targeting our investment at a small group of markets where we see our biggest growth opportunities and reducing local infrastructure and investment in a ‘long tail’ of smaller markets.
3. Third, we are channelling our investment into four business models: direct to consumer;
‘Pearson Inside’ (our comprehensive institutional services); assessment and certification; and learning services.
Running throughout this strategy is a process to ensure that our products and services deliver demonstrable learning outcomes to the student or the institution. We have therefore developed the Pearson efficacy framework: a unique, rigorous and scalable quality assurance system that checks that the necessary conditions are in place for an education programme to deliver intended learning outcomes. We now require that all Pearson acquisitions and all product investments over $3m go through the Pearson efficacy framework and set out a plan to implement its recommendations before approval. Through this process, we are accelerating the work that is already under way to transform Pearson from the world’s most international education publishing company to the world’s leading global learning services business. We believe it will provide Pearson with a larger market opportunity, sharper focus on the fastest-growing markets, stronger financial returns and a greater impact on educational outcomes.
Page 7 of 36
FINANCIAL OVERVIEW In 2012, Pearson increased sales by 4% in headline terms to £6.1bn generating a total adjusted operating profit of £936m (2011: £942m). The headline growth rates were reduced by currency movements and helped by acquisitions. Currency movements reduced sales by £27m and operating profits by £11m. This was the result of non-dollar currency depreciation relative to sterling. At constant exchange rates (ie stripping out the impact of those currency movements), our sales and adjusted operating profit grew 5% and 1% respectively. Acquisitions, primarily in our education company, contributed £318m to sales and £39m to operating profits. This includes integration costs and investments related to our newly-acquired companies, which we expense. The disposal of our 50% stake in FTSE International in 2011 reduced operating profits by £20m. Our underlying revenue and adjusted operating profit (ie stripping out the impact of both portfolio changes and currency movements) declined by 1% and 2% respectively. Our tax rate in 2012 was 23.1% compared to 22.4% in 2011 reflecting movements in tax settlements in each year. Adjusted earnings per share were 84.2p (2011: 86.5p). Cash generation. Headline operating cash flow declined by £195m reflecting longer debtor days, currency fluctuations and increased investment in new education programmes. Free cash flow declined by £115m to £657m, additionally reflecting lower tax payments. Our average working capital to sales ratio improved by a further 0.4 percentage points to 13.8% reflecting the benefits of our shift to more digital and service-orientated businesses. Return on invested capital. Our return on average invested capital was 9.1%, well ahead of our cost of capital and level with 2011. ROIC was affected by profit decline at Pearson in Practice and the sale of FTSE International (one of our least capital-intensive businesses), offset by a lower cash tax charge. Statutory results. Our statutory results show a decrease of £603m in operating profit to £515m, from £1,118m in 2011, reflecting the absence in 2012 of the £412m profit on the sale of FTSE International in 2011 and the £113m closure-related costs on Pearson in Practice in 2012. Basic earnings per share similarly fell to 40.5p in 2012, down from 119.6p in 2011. Balance sheet. Our net debt increased to £918m (£499m in 2011) reflecting acquisition investment of £759m and sustained organic investment in our business, partly offset by cash generation. Since 2000, Pearson’s net debt/EBITDA ratio has fallen from 3.9x to 0.9x and our interest cover has increased from 3.1x to 18.7x. Dividend. The board is proposing a dividend increase of 7% to 45.0p, subject to shareholder approval. 2012 will be Pearson’s 21st straight year of increasing our dividend above the rate of inflation. Over the past ten years we have increased our dividend at a compound annual rate of 7%, returning more than £2.5bn to shareholders. We have a progressive dividend policy: we intend to sustain our dividend cover at around 2.0x over the long term, increasing our dividend more in line with earnings growth.

Page 8 of 36
NORTH AMERICAN EDUCATION In 2012, our strength in digital and services businesses and tight cost control enabled us to perform ahead of our more traditional print publishing markets, which declined by 10% for the industry as a whole and were adversely affected by state budget pressures and declines in college enrolments. Key highlights in 2012 include: • In Higher Education, the publishing market declined by 6% net in 2012, according to the
Association of American Publishers. Total US College enrolments were 2% lower in 2012 than in 2011, affected by rising employment rates, state budget pressures and regulatory change affecting the for-profit sector. In a difficult trading environment Pearson gained share for the 14th consecutive year, again benefitting from our lead in technology and customisation.
• Student registrations at eCollege grew 3% to 8.7 million, despite pressure in the for-profit
college market. We won new online enterprise learning contracts with California State University and Rutgers University. Our strong managed enrolment services and student marketing product offering, coupled with continued strong growth at Arizona State University, helped our online enterprise learning business to grow 150% to almost 44,000 enrolments. In October 2012, we announced the acquisition of EmbanetCompass for $650m which provides a full range of services targeted towards online graduate programmes.
• Pearson’s pioneering ‘MyLab’ digital learning, homework and assessment programmes grew
well with student registrations in North America up 11% to almost 10 million with strong usage growth with graded submissions up 12% to almost 320m across the globe. Evaluation studies show that the use of MyLab programmes can significantly improve student test scores and institutional efficiency (http://bit.ly/ymMMAi).
• OpenClass, Pearson's free learning management system, has been installed by almost 1,300
K12 and College institutions in the US and now serves approximately 100,000 users. In November 2012, we launched Project Blue Sky, a cloud-based content service that allows college instructors to combine Open Educational Resources (OER) with instructor-created and Pearson content.
• We launched Pearson Workforce Education which delivers more than 60 online courses in high demand occupational training areas from IT and Healthcare to management and soft skills courses; and Propero, which combines on-demand tutoring, student support and online courses to expand access to higher education and support degree completion.
• We announced the acquisition of a 5% stake in NOOK Media for $89.5m in December 2012
with the option to purchase up to an additional 5%, subject to certain conditions. This strategic investment will help accelerate customer access to digital content by pairing the company’s leading expertise in online learning with NOOK Media’s expertise in online distribution and customer service. This will facilitate improved discovery of available digital content and services, as well as seamless access.
• At our Assessment and Information business, revenues were flat in 2012. State funding
pressures and the transition to Common Core assessments continued to make market conditions tough for our state assessment and teacher testing businesses.
• The Partnership for Assessment of Readiness for College and Careers (PARCC), a consortium
of 23 states, awarded Pearson and Educational Testing Service (ETS) the contract to develop test items that will be part of the new English and mathematics assessments to be administered from the 2014-2015 school year. The assessments will be based on what students need to be ready for college and careers, and will measure and track their progress along the way.
• We continued to produce strong growth in secure online testing, an important market for the
future. We increased online testing volumes by more than 10%, delivering 6.5 million state

Page 9 of 36
accountability tests, 4.5 million constructed response items and 21 million spoken tests. We now assess oral proficiency in English, Spanish, French, Dutch, Arabic and Chinese. We also launched the Online Assessment Readiness Tool for the PARCC and the Smarter Balance Assessment Consortium (SBAC) Common Core consortia to help 45 states prepare for the transition to online assessments.
• We won new state contracts in Colorado and Missouri and a new contract with the College
Board to deliver ReadiStep, a middle school assessment that measures and tracks college readiness skills. We extended our contract with the College Board to deliver the ACCUPLACER assessment, a computer-adaptive diagnostic, placement and online intervention system that supports 1,300 institutions and 7 million students annually.
• We won five Race To The Top (RTTT) state deals (Kentucky, Florida, Colorado, North
Carolina and New York) led by Schoolnet. PowerSchool won three state/province-level contracts (North Carolina, New Brunswick and Northwest Territories). We launched our mobile PowerSchool applications and grew our 3rd party partner ecosystem to over 50 partners. PowerSchool supports more than 12 million students, up more than 20% on 2011 while Schoolnet supports 8.3 million students, up almost 160% on 2011.
• Our clinical assessment business was boosted by strong growth at AIMSweb, our progress
monitoring service which enables early intervention and remediation for struggling students. AIMSweb delivered 58 million assessments in 2012, up 12%.
• In School, the textbook publishing market declined 15% in 2012, according to the
Association of American Publishers. There were several pressures on the industry including weakness in state budgets, a lower new adoption opportunity (total opportunity of $380m in 2012 against $650m in 2011) and delays in purchasing decisions during the transition to the new Common Core standards.
• Pearson gained share in very tough market conditions, taking an estimated 31% of new adoptions where we competed. enVisionMATH continued to perform strongly, with a recent What Works Clearing House study showing that students using the programme out-performed peers by between six and eight percentiles in math across a broad range of student populations. iLit, our new digital reading intervention programme, was successfully implemented in 20 districts with early results showing strong reading gains.
• Connections Education, which operates online K-12 schools in 22 states and a nationwide
charter school programme, served more than 43,000 students in 2012, up 31% from 2011 and broadened its product offering to include virtual classrooms for public school campuses. Connections Academy Schools have consistently high performance ratings, particularly in states focused on measuring growth in student learning.

Page 10 of 36
INTERNATIONAL EDUCATION Our businesses in emerging markets continued to perform strongly, supported by good enrolment trends and sustained investment. Our UK business was resilient during the year despite significant regulatory and policy changes across vocational and general qualifications, apprenticeships and higher education. In the rest of the world, a recovery in Japan following the 2011 tsunami and a strong competitive performance in Italy more than offset weak market conditions in Spain. Key highlights in 2012 include: • In English Language Learning, Wall Street English (WSE), Pearson’s worldwide chain of
English language centres for professionals, opened a net of 11 new centres around the world, bringing the total number to 460. Student numbers fell by 2% to more than 191,000, primarily due to the closure of a large franchise centre in Chile with approximately 7,000 students. MyEnglishLabs enrolments grew 60% to 263,000 supported by the launch of our next generation platform which supports 13 languages and 43 new courses. We acquired GlobalEnglish, a leading provider of cloud-based, on-demand Business English learning, assessment and performance support software, for $90m in cash in July 2012.
• More than 1.1 million students registered for our MyLab digital learning, homework and
assessment programmes, an increase of 18%, with good growth in school, ELT and institutional selling in higher education.
• In the United Kingdom, we marked more than 6.3 million GCSE, A/AS Level and other
examinations with 90% using onscreen technology and more than 3.8 million test scripts for over half a million pupils taking National Curriculum Tests at Key Stage Two in 2012. We launched our Next Generation BTECs which are now the leading vocational qualification on the new funding and accountability frameworks in schools. Our Vocational qualifications business grew well with the continued popularity of BTEC amongst employers and universities and a strong performance in work-based learning (with registrations now up to 170,000) further boosted by a good performance from EDI.
• In China, student enrolments at Wall Street English increased 15% to almost 61,000,
boosted by good underlying demand and the launch of ten new centres taking the total to 66. Our students rapidly acquire high-level English skills with average grade levels achieved rising by 8% during 2012. Enrolments at Global Education, our test preparation services for English language qualifications, increased 16% to more than 1 million, through 73 owned and 372 franchised learning centres.
• In South Africa we held share in school publishing in market conditions which were tougher
than expected despite a year of major curriculum reform. Student enrolments grew strongly at CTI, up 19% to more than 10,000. We partnered with UNISA, South Africa's largest university and the largest distance learning provider in Africa, to provide 30,000 students with access to our MyLabs software, digital resources and customised e-books.
• In Brazil, we ended 2012 with 533,000 students in our public and private sistemas (or
learning systems) and added 24,000 students in our two largest private sistemas, COC and Dom Bosco, up 8% on 2011. Our public sistema, NAME, includes the top performing lower secondary school in Brazil and test scores for our public school students are, on average, 20% above the 2011 national IDEB standard for 4th and 8th grade students.
• In Mexico, we partnered with local curriculum and technology experts INITE to launch UTEL,
a new university enabling Mexicans to enrol in online degree courses in management, IT, marketing, engineering and computer science. UTEL enrolled 2,500 undergraduate students and 4,000 learners in shorter corporate training or continuing professional education courses. UTEL’s services arm, Scala, signed its first contract to provide online learning services to an existing higher education institution.

Page 11 of 36
• In India, TutorVista is now managing 35 schools and its multimedia teaching solution Digiclass is installed in approximately 17,000 classrooms. ActiveTeach, our digital learning platform for schools, was adopted by 200 schools serving approximately 100,000 students.
• In the Middle East, the Abu Dhabi Education Council purchased our print and digital Maths
and Science resources for all schools from grades 6 to 10, the American University of Sharjah adopted MyLabs for four mathematics courses and three science courses, and we are providing access to digital course content for 5,000 students at Abu Dhabi's Higher Colleges of Technology through our Pearson e-texts iPad app.
• In Italy, 6,000 students registered for MyEnglishLab Italiano, our new digital curriculum,
helping us gain share in upper secondary adoptions and to see good growth overall.

Page 12 of 36
PROFESSIONAL Our Professional education business is focused on publishing, training, testing and certification for professionals. The weakness in our UK training business, Pearson in Practice, had a significant negative impact on our 2012 performance and resulted in our decision to exit the business. Other parts of the Professional division performed well. Key highlights in 2012 include: • Professional testing continued to see good revenue and profit growth with test volumes at
Pearson VUE up 7% on 2011 to almost 8 million with Certiport adding an additional 2.3 million tests, up 13% on 2011. There were key renewals of the National Council of State Boards of Nursing contract running until 2019 and the Computing Technology Industry Association contract was secured with Pearson VUE as the single vendor running through to 2017.
• We won a number of new contracts including a 10-year contract to administer all computer
and paper based tests for the Australia CPA Professional exams and five-year contracts with the National Center for Assessment in Saudi Arabia and the National Council of State Boards of Nursing to provide the NCLEX-RN in Canada beginning in 2015 for 10 Canadian registered nurse (RN) regulatory bodies.
• The partnership with the American Council on Education to develop an online General
Educational Development (GED) test aligned with new Common Core standards has now launched computer-based testing in 37 jurisdictions.
• Continuing our digital transformation, we adapted our booking service for the Driving
Standards Agency (DSA) to work on mobile devices. We also introduced one-to-many biometric matching technology into testing centres to enhance fraud detection.
• Professional training was very weak with our UK adult training business, Pearson in
Practice, facing a dramatic fall in demand as a result of changes to the apprenticeships programme. We believe this business no longer has a sustainable model and announced in January that we are to exit Pearson in Practice. The cost of exit and impairment is £113m and is reported as a loss on closure in Pearson's 2012 statutory accounts.
• TQ continues to make significant progress in the direct delivery of training services overseas.
In Saudi Arabia, we extended the contract to operate the Saudi Petroleum Services Institute for five years and won a five-year contract to run a new Institute at Al Khafji. In Oman, a TQ-led consortium won the bid to provide training to BP, including a wide range of technical and English language training for BP workers as they prepare to open up the Khazzan oilfield for full scale production in 2016.
• Professional publishing grew modestly with good profit growth. In the US, growth of
eBook sales and other digital products and services continued to outpace ongoing challenges in the traditional retail channel.

Page 13 of 36
FINANCIAL TIMES GROUP Digital and services revenues accounted for 50% of FT Group revenues (31% in 2008). Content revenues comprised 61% of revenues (48% in 2008), while advertising accounted for 39% of FT Group revenues (52% in 2008). Key highlights in 2012 include: • The Financial Times digital readership continues to grow strongly with digital subscriptions
increasing 18% to almost 316,000 and with 3.5 million FT Web App users. The FT’s total paid circulation was more than 602,000 across print and online, modestly up on 2011, with digital subscriptions exceeding print circulation for the first time. Mobile devices now account for 30% of FT.com traffic and 15% of new subscriptions. The FT now has almost 2,800 direct corporate licenses, up 40% on 2011.
• We continued to invest in new products and innovation, including launching a Windows 8 app
and the FT Web App on Chrome for Android; a bespoke web app for Latin America; a re-brand of the conferences division, FT Live, with the introduction of live streaming at key events; and the launch of GatekeeperIQ, a new subscription service to track large, retail investment platforms.
• Advertising was generally weak and volatile with poor visibility but the FT grew market share
with mobile, luxury and business education showing good growth. Digital revenues benefited from the launch of FT SmartMatch, which automatically puts client content such as articles, white papers and videos in front of FT.com users while they’re reading related FT news stories.
• FT Live, our events business, continued to grow strongly and launch new events, including
the Global Commodities Summit, delivering more than 200 events that attracted over 17,000 delegates. We launched a digital portal that offers on-demand webinars, live-streamed events and social media tools.
• Educational services are an important area of expansion. The FT Non-Executive Director
Certificate (in partnership with Pearson Learning Studio and Edexcel) was attended by over 150 candidates across five intakes. FT Newslines, an annotations tool on FT.com that allows students and faculties from around the world to create and share annotations on FT articles, is now being used at many business schools. The new FTChinese MBA Gym App, which features tailored training courses categorized by topic, has ranked among the top paid-for education apps on the iTunes Store and was recognized as one of the ‘App Store Best of 2012’ by Apple in China.
• Money-Media revenues and profits continued to grow well boosted by a strong subscription
performance, with the number of individual users growing 6% year on year to 220,000, and new product launches, including Ignites Retirement Research which broadens Money-Media's product offering into the investment industry research sector.
• Mergermarket grew well, despite challenging markets, due to a good performance from
Debtwire, mergermarket, Xtract and Remark underpinned by a strong offering following investment in its product breadth, strong editorial analysis and global presence. We launched several new products and services, including a new mergermarket Android app, a Debtwire Analytics platform in Europe and Policy and Regulatory Report (PaRR), a global intelligence, analysis and proprietary data product focused on competition law, IP and trade law, and sector-specific regulatory change. We also expanded our coverage in faster growth markets such as Latin America, China and the Middle East, generating new business and extending our international reach.
• In The Economist Group (50% owned by Pearson), The Economist launched three
HTML5-powered apps in collaboration with FT Labs. The Economist’s worldwide print and digital circulation increased by 2% to 1.67m (at 31 December 2012) of which 150,000 customers bought digital-only copies. The Economist Intelligence Unit acquired Clearstate in Singapore and Bazian, a London-based healthcare research company, as part of its strategy to build a healthcare information business.

Page 14 of 36
PENGUIN In October 2012, Pearson and Bertelsmann announced an agreement to create the world’s leading consumer publishing company by combining Penguin and Random House. Pearson will own 47% of the combined organisation, which is subject to regulatory approval and is expected to complete in the second half of 2013. We believe that the combined organisation will have a stronger platform and greater resources to invest in rich content, new digital publishing models and high-growth emerging markets. In market conditions that remained challenging, Penguin had a solid year with momentum and share improving in the second half of the year. It also made several moves to offer a broader range of services to more authors across more platforms in more markets. Key highlights in 2012 included: • In the United States, we published 255 New York Times bestsellers (254 in 2011) including
No Easy Day: The Firsthand Account of the Mission that Killed Osama bin Laden by ‘Mark Owen’, Bared to You by Sylvia Day and Nate Silver’s The Signal and the Noise as well as new titles from bestselling authors including Ken Follett, Nora Roberts, Tom Clancy and Harlan Coben.
• In the UK, we published 90 Bookscan bestsellers, our best year on record (and compared to
78 in 2011) including Sylvia Day’s Bared to You; Jamie Oliver’s 15 Minute Meals; Clare Balding’s My Animals and Other Family and Daniel Kahneman’s Thinking Fast and Slow.
• eBook revenue grew strongly in 2012 and accounted for 17% of Penguin’s global revenue
(12% in 2011), and almost 30% in the US (20% in 2011). We continued to invest in digital publishing programmes, making eBooks available in new markets including Australia, India, Brazil and China; launching a number of digital-only imprints around the world and expanding our eSpecials list. Global app sales grew by more than 200% driven by brands including Wreck this App, Mad Libs, Moshi Monsters and LEGO®. DK was Apple’s only trade publisher launch partner for the January launch of the iBooks Author 2 platform and now has more than 50 interactive titles available.
• In Brazil, we acquired 45% of Companhia das Letras, a leading trade book publisher. In
India, we launched a local eBook programme and enjoyed considerable success in commercial fiction with bestselling authors including Ravinder Singh and Shobhaa De. In China, we expanded our local publishing programmes in both Chinese and English with more than 100 titles now available, including its first local language top ten title, tennis player Li Na’s autobiography and launched its first list of eBooks.
• DK performed strongly and grew share globally led by our LEGO® publishing list. In the UK,
DK celebrated a number one bestseller with Mary Berry’s Complete Cookbook, which has sold more than one million copies worldwide. BradyGames had bestsellers with Borderlands 2, Skylanders Giants and Call of Duty: Black Ops II.
• Author Solutions, which we acquired in July 2012 for $116m, had a good start. It is the
world’s leading provider of professional self-publishing services and broadens our expertise in online marketing, consumer analytics, professional services and user-generated content. In February 2013 Penguin India launched Partridge, a new self-publishing imprint, in partnership with Author Solutions.
• Penguin has a strong publishing list for 2013 with major new books from authors including
Khaled Hosseini, Elizabeth Gilbert, Sylvia Day, Nora Roberts, Nathanial Philbrick and Sarah Dessen in the US, and Jamie Oliver, John Le Carre, Jennifer Saunders, Malcolm Gladwell, Steven D Levitt & Stephen J Dubner, Jeremy Paxman, Jonathan Coe and John Green in the UK. DK will launch more LEGO® titles and Mary Berry’s Cookery Course. New apps for 2013 include Anne Frank: The Diary of a Young Girl, I’m Ready to Spell and Poems by Heart.

Page 15 of 36
FINANCIAL REVIEW Operating result
On a headline basis, sales from continuing operations increased by £242m or 5% from £4,817m in 2011 to £5,059m in 2012 and adjusted operating profit from continuing operations increased by £7m or 1% from £831m in 2011 to £838m in 2012. On an underlying basis, both sales and adjusted operating profit from continuing operations were level in 2012 compared to 2011. Our underlying measures exclude the effects of exchange and portfolio changes. In 2012, currency movements reduced sales by £29m (1%) and adjusted operating profit by £10m (1%) while portfolio changes increased sales by £286m (6%) and adjusted operating profit by £16m (2%). Adjusted operating profit excludes amortisation of acquired intangibles, acquisition costs and gains and losses on acquisitions and disposals but includes the adjusted profits from discontinued operations. Statutory operating profit (from continuing operations) decreased by £603m or 54% from £1,118m in 2011 to £515m in 2012. Statutory operating profit includes intangible amortisation, acquisition costs and other gains and losses on acquisitions and disposals but does not include the contribution from discontinued operations. Included in other gains and losses in 2012 is the loss from the closure of the Pearson in Practice business of £113m. In 2011 we benefitted from a profit of £412m on the disposal of the FT Group’s 50% stake in FTSE International Limited (FTSE). Both the loss on closure of Pearson in Practice and the profit on sale of FTSE have been excluded from adjusted operating profit as explained above. In 2011 we recorded the share of profit from the investment in FTSE together with royalties received from FTSE prior to the date of sale. Together these totalled £20m and were included in adjusted operating profit.
Net finance costs
Net finance costs reported in our adjusted earnings comprises net interest payable and net finance income relating to post-retirement plans. Net interest payable increased from £55m in 2011 to £65m in 2012. The increase reflects an increase in floating market interest rates on US dollar borrowings combined with the effect of higher average levels of net debt resulting from the Group’s acquisition activity during 2012. The increase is also partly explained by a reduction in interest income on deposits and the impact of new Notes issued in 2012. Net finance income relating to post-retirement plans was £13m in 2012 compared to £3m in 2011. Also included in the statutory definition of net finance costs are finance costs on put options and deferred consideration associated with acquisitions, foreign exchange and other gains and losses. Finance costs for put options and deferred consideration are excluded from adjusted earnings as they relate to future earn outs and similar payments on acquisitions and therefore do not reflect cash expended. Foreign exchange and other gains and losses are excluded from adjusted earnings as they represent short-term fluctuations in market value and are subject to significant volatility. These other gains and losses may not be realised in due course as it is normally the intention to hold the related instruments to maturity. In 2012, the total of these items excluded from adjusted earnings was a loss of £29m compared to a loss of £19m in 2011. The majority of the loss in 2012 relates to movements in the valuation of put options associated with acquisitions. In 2011 the loss relates mainly to foreign exchange differences on a proportion of the unhedged US dollar proceeds from the Interactive Data sale in 2010. Taxation
The effective tax rate on adjusted earnings in 2012 was 23.1% as compared to an effective rate of 22.4% in 2011. Our overseas profits, which arise mainly in the US, are largely subject to tax at higher rates than that in the UK (which had an effective statutory rate of 24.5% in 2012 and 26.5% in 2011). These higher tax rates were offset by amortisation-related tax deductions and by prior year adjustments including those arising from settlements with tax authorities.

Page 16 of 36
The reported tax charge on a statutory basis was £148m (34.1%) compared to a charge of £162m (15.5%) in 2011. The increase in the statutory rate is largely due to the lack of tax relief on the loss on closure of Pearson in Practice together with the effect of a low tax charge in 2011 on the gain on disposal of FTSE. Tax paid in 2012 was £65m compared to £151m in 2011. The reduction in the 2012 tax paid is largely the result of the permitted deferral of US tax payments into 2013 following Hurricane Sandy. Discontinued operations
In October 2012, Pearson and Bertelsmann announced an agreement to create a new consumer publishing business by combining Penguin and Random House. The transaction is expected to complete in 2013 and, at that point, Pearson will no longer control the Penguin Group of companies but will equity account for its 47% associate interest. The loss of control results in the Penguin business being classified as held for sale on the Pearson balance sheet at 31 December 2012 and the results for both 2011 and 2012 have been included in discontinued operations. Also included in discontinued operations are the costs associated with the formation of the Penguin Random House venture including provision for the settlement of litigation associated with the agency arrangements for eBooks.
Other comprehensive income
Included in other comprehensive income are the net exchange differences on translation of foreign operations. The loss on translation of £238m in 2012 compares to a loss in 2011 of £44m. The Group is principally exposed to movements in the US dollar as a significant proportion of the Group’s operations are based in the US. In 2011 the US dollar strengthened only slightly from an opening rate of £1:$1.57 to a closing rate at the end of that year of £1:$1.55. Other currency movements were relatively more significant in 2011 causing a small loss. In 2012 the US dollar has weakened to close at £1:$1.63 and was the most significant contributor to the increase in the loss. Also included in other comprehensive income in 2012 is an actuarial loss of £122m in relation to post retirement plans. This loss arose largely because of unfavourable changes in the discount rate and other assumptions used in the actuarial valuation that offset the effect of continuing asset returns and deficit funding in the UK plan. In 2011 the loss of £64m was also due to discount rate and other assumption changes outweighing improved asset returns and deficit funding. Non-controlling interest
There are non-controlling interests in the Group’s businesses in South Africa, China and India although none of these are material to the Group numbers. Cash flows
Operating cash flow reduced by £195m from £983m in 2011 to £788m in 2012. The reduction is also reflected in operating cash conversion which fell from 104% in 2011 to 84% in 2012. The principal reasons for the reduced operating cash flow were a reduction in the level of cash collection at the end of the year together with continuing investment in pre-publication and technology and an adverse impact from currency fluctuations. The Group’s net debt rose from £499m at the end of 2011 to £918m at the end of 2012. In 2012 we invested £759m in new acquisitions and that together with tax and dividend payments was enough to offset cash generated from operating activities.
Pensions
Pearson operates a variety of pension plans. Our UK Group plan has by far the largest defined benefit section. We have some smaller defined benefit sections in the US and Canada but, outside the UK, most of our companies operate defined contribution plans.

Page 17 of 36
The charge to profit in respect of worldwide pensions and post-retirement benefits for continuing operations amounted to £84m in 2012 (2011: £82m) of which a charge of £97m (2011: £85m) was reported in operating profit and a net benefit of £13m (2011: £3m) was reported against net finance costs. In addition to these amounts, in 2012 a charge of £11m (2011: £11m) has been reported in operating profit in respect of discontinued operations. The overall surplus on the UK Group plan of £25m at the end of 2011 has become a deficit of £19m at 31 December 2012. The deficit has arisen due to unfavourable movements in the discount rate and other assumptions used to value the liabilities, offset by continuing asset returns and deficit funding. In total, our worldwide deficit in respect of pensions and post-retirement benefits increased from £141m in 2011 to £198m at the end of 2012, this amount includes a deficit of £26m which specifically relates to Penguin and has been classified as a liability held for sale. Dividends The dividend accounted for in our 2012 financial statements totalling £346m represents the final dividend in respect of 2011 (28.0p) and the interim dividend for 2012 (15.0p). We are proposing a final dividend for 2012 of 30.0p, bringing the total paid and payable in respect of 2012 to 45.0p, a 7% increase on 2011. This final 2012 dividend which was approved by the Board in February 2013, is subject to approval at the forthcoming AGM and will be charged against 2013 profits. For 2012, the dividend is covered 1.9 times by adjusted earnings. Return on invested capital (ROIC)
Our ROIC is calculated as total adjusted operating profit less cash tax, expressed as a percentage of average gross invested capital. ROIC remained flat at 9.1% in both 2011 and 2012. The impact of lower cash tax payments in 2012 has been offset by slightly lower profit and increased investment in new acquisitions.
ENDS
Except for the historical information contained herein, the matters discussed in this press release include forward-looking statements that involve risk and uncertainties that could cause actual results to differ materially from those predicted by such forward-looking statements. These risks and uncertainties include international, national and local conditions, as well as competition. They also include other risks detailed from time to time in the company’s publicly-filed documents, including the company’s Annual Report. The company undertakes no obligation to update publicly any forward-looking statement, whether as a result of new information, future events or otherwise.

Page 18 of 36
CONDENSED CONSOLIDATED INCOME STATEMENT for the year ended 31 December 2012
2012 2011
all figures in £ millions note
Continuing operations Sales 2 5,059 4,817 Cost of goods sold (2,224) (2,072) Gross profit 2,835 2,745 Operating expenses (2,216) (2,072) Profit on sale of associate - 412 Loss on closure of subsidiary (113) - Share of results of joint ventures and associates 9 33 Operating profit 2 515 1,118 Finance costs 3 (113) (96) Finance income 3 32 25 Profit before tax 4 434 1,047 Income tax 5 (148) (162) Profit for the year from continuing operations 286 885 Discontinued operations Profit for the year from discontinued operations 8 43 71 Profit for the year 329 956
Attributable to: Equity holders of the company 326 957 Non-controlling interest 3 (1) Earnings per share from continuing and discontinued operations (in pence per share) Basic 6 40.5p 119.6p Diluted 6 40.5p 119.3p Earnings per share from continuing operations (in pence per share) Basic 6 35.2p 110.7p Diluted 6 35.1p 110.5p
The accompanying notes to the condensed consolidated financial statements form an integral part of the financial information.
Page 19 of 36
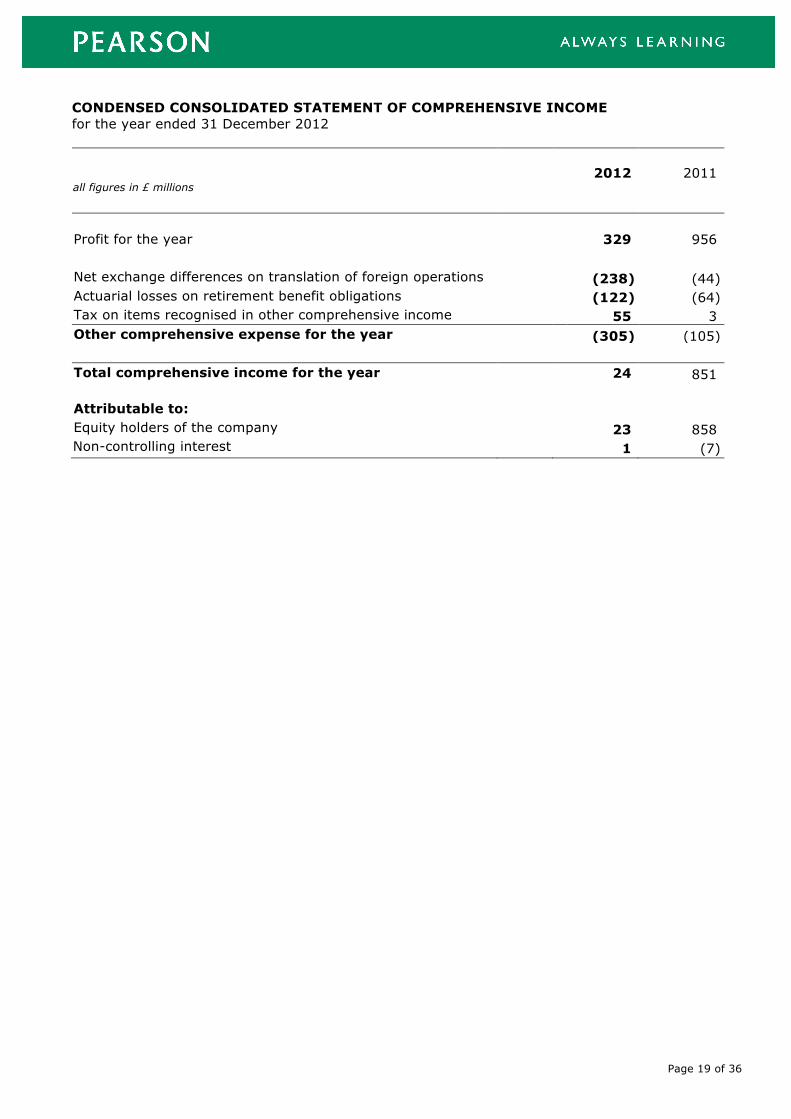
CONDENSED CONSOLIDATED STATEMENT OF COMPREHENSIVE INCOME for the year ended 31 December 2012
2012 2011
all figures in £ millions
Profit for the year 329 956
Net exchange differences on translation of foreign operations (238) (44) Actuarial losses on retirement benefit obligations (122) (64) Tax on items recognised in other comprehensive income 55 3 Other comprehensive expense for the year (305) (105) Total comprehensive income for the year 24 851 Attributable to: Equity holders of the company 23 858 Non-controlling interest 1 (7)

Page 20 of 36
CONDENSED CONSOLIDATED BALANCE SHEET as at 31 December 2012
2012 2011
all figures in £ millions note Property, plant and equipment 327 383
Intangible assets 11 6,218 6,342 Investments in joint ventures and associates 15 32 Deferred income tax assets 229 287 Financial assets – Derivative financial instruments 174 177 Retirement benefit assets - 25 Other financial assets 31 26 Trade and other receivables 79 151 Non-current assets 7,073 7,423 Intangible assets – Pre-publication 666 650 Inventories 261 407 Trade and other receivables 1,104 1,386 Financial assets – Derivative financial instruments 4 - Financial assets – Marketable securities 6 9 Cash and cash equivalents (excluding overdrafts) 1,062 1,369 Current assets 3,103 3,821 Assets classified as held for sale 1,172 - Total assets 11,348 11,244 Financial liabilities – Borrowings (2,010) (1,964) Financial liabilities – Derivative financial instruments - (2) Deferred income tax liabilities (601) (620) Retirement benefit obligations (172) (166) Provisions for other liabilities and charges (110) (115) Other liabilities 12 (282) (325) Non-current liabilities (3,175) (3,192) Trade and other liabilities 12 (1,556) (1,741) Financial liabilities – Borrowings (262) (87) Financial liabilities – Derivative financial instruments - (1) Current income tax liabilities (291) (213) Provisions for other liabilities and charges (38) (48) Current liabilities (2,147) (2,090) Liabilities classified as held for sale (316) - Total liabilities (5,638) (5,282) Net assets 5,710 5,962 Share capital 204 204 Share premium 2,555 2,544 Treasury shares (103) (149) Reserves 3,030 3,344 Total equity attributable to equity holders of the company 5,686 5,943 Non-controlling interest 24 19 Total equity 5,710 5,962
The condensed consolidated financial statements were approved by the Board on 24 February 2013.

Page 21 of 36
CONDENSED CONSOLIDATED STATEMENT OF CHANGES IN EQUITY for the year ended 31 December 2012
Equity attributable to the equity holders of
the company Non-
controlling interest
Total equity
Share
capital
Share
premium
Treasury shares
Translation reserve
Retained
earnings
Total
all figures in £ millions
2012
At 1 January 2012 204 2,544 (149) 364 2,980 5,943 19 5,962
Total comprehensive income - - - (236) 259 23 1 24 Equity-settled transactions - - - - 32 32 - 32
Tax on equity-settled transactions
- - - - (6) (6) - (6)
Issue of ordinary shares under share option schemes
- 11 - - - 11 - 11
Purchase of treasury shares - - - - - - - -
Release of treasury shares - - 46 - (46) - - -
Put options over non-controlling interest
- - - - 39 39 - 39
Changes in non-controlling interest
- - - - (10) (10) 6 (4)
Dividends - - - - (346) (346) (2) (348)
At 31 December 2012 204 2,555 (103) 128 2,902 5,686 24 5,710
2011
At 1 January 2011 203 2,524 (137) 402 2,546 5,538 67 5,605
Total comprehensive income - - - (38) 896 858 (7) 851
Equity-settled transactions - - - - 40 40 - 40
Tax on equity-settled transactions
- - - - 3 3 - 3
Issue of ordinary shares under share option schemes
1 20 - - - 21 - 21
Purchase of treasury shares - - (60) - - (60) - (60)
Release of treasury shares - - 48 - (48) - - -
Put options over non-controlling interest
- - - - (63) (63) - (63)
Changes in non-controlling interest
- - - - (76) (76) (40) (116)
Dividends - - - - (318) (318) (1) (319)
At 31 December 2011 204 2,544 (149) 364 2,980 5,943 19 5,962

Page 22 of 36
CONDENSED CONSOLIDATED CASH FLOW STATEMENT for the year ended 31 December 2012
2012 2011
all figures in £ millions note
Cash flows from operating activities Net cash generated from operations 15 916 1,093 Interest paid (75) (70) Tax paid (65) (151) Net cash generated from operating activities 776 872 Cash flows from investing activities Acquisition of subsidiaries, net of cash acquired (716) (779) Acquisition of joint ventures and associates (39) (9) Purchase of investments (10) (12) Purchase of property, plant and equipment (78) (67) Purchase of intangible assets (73) (77) Disposal of subsidiaries, net of cash disposed (11) (6) Proceeds on disposal of associates - 428 Proceeds from the sale of investments - 75 Proceeds from sale of property, plant and equipment 1 9 Proceeds from sale of intangible assets 3 3 Proceeds from sale of liquid resources 23 - Investment in liquid resources (19) - Interest received 9 10 Dividends received from joint ventures and associates 27 30 Net cash used in investing activities (883) (395) Cash flows from financing activities Proceeds from issue of ordinary shares 11 21 Purchase of treasury shares - (60) Proceeds from borrowings 327 - Proceeds from the sale of liquid resources - 2 Liquid resources acquired (1) - Repayment of borrowings - (318) Finance lease principal payments (8) (8) Dividends paid to company’s shareholders (346) (318) Dividends paid to non-controlling interest (2) (1) Transactions with non-controlling interest (4) (108) Net cash used in financing activities (23) (790) Effects of exchange rate changes on cash and cash equivalents (24) (60) Net decrease in cash and cash equivalents (154) (373) Cash and cash equivalents at beginning of year 1,291 1,664 Cash and cash equivalents at end of year 1,137 1,291
For the purposes of the cash flow statement, cash and cash equivalents are presented net of overdrafts repayable on demand. These overdrafts are excluded from cash and cash equivalents disclosed on the balance sheet. Included in the figures above are net cash generated from / (used in) discontinued operations as follows: operating activities £83m (2011: £107m); investing activities £(81)m (2011: £(13)m); financing activities £10m (2011: £(71)m).

Page 23 of 36
NOTES TO THE CONDENSED CONSOLIDATED FINANCIAL STATEMENTS for the year ended 31 December 2012
1. Basis of preparation
The condensed consolidated financial statements have been prepared in accordance with the Listing Rules of the Financial Services Authority and in accordance with International Financial Reporting Standards (IFRS) and International Financial Reporting Interpretations Committee (IFRIC) interpretations as adopted by the European Union (EU). In respect of accounting standards applicable to the Group, there is no difference between EU-adopted IFRS and International Accounting Standards Board (IASB)-adopted IFRS.
The condensed consolidated financial statements have also been prepared in accordance with the accounting policies set out in the 2011 Annual Report and have been prepared under the historical cost convention as modified by the revaluation of financial assets and liabilities (including derivative financial instruments) at fair value. The 2011 Annual Report refers to other new standards effective from 1 January 2012. None of these standards have had a material impact in these financial statements. The preparation of condensed consolidated financial statements requires the use of certain critical accounting assumptions. It also requires management to exercise its judgement in the process of applying the Group’s accounting policies. The areas requiring a higher degree of judgement or complexity, or areas where assumptions and estimates are significant to the condensed consolidated financial statements, have been set out in the 2011 Annual Report. This preliminary announcement does not constitute the Group’s full financial statements for the year ended 31 December 2012. The Group’s full financial statements will be approved by the Board of Directors and reported on by the auditors later in March 2013. Accordingly, the financial information for 2012 is presented unaudited in the preliminary announcement. The financial information for the year ended 31 December 2011 does not constitute statutory accounts as defined in section 434 of the Companies Act 2006. A copy of the statutory accounts for that year has been delivered to the Registrar of Companies. The auditors' report on the full financial statements for the year ended 31 December 2011 was unqualified and did not contain an emphasis of matter paragraph or any statement under section 498 of the Companies Act 2006.

Page 24 of 36
NOTES TO THE CONDENSED CONSOLIDATED FINANCIAL STATEMENTS continued for the year ended 31 December 2012
2. Segment information The Group is organised into the following business segments: North American Education; International Education; Professional and the Financial Times Group (FT Group). The results of the Penguin segment are shown as discontinued for both 2011 and 2012. 2012 2011
all figures in £ millions
Sales North American Education 2,658 2,584 International Education 1,568 1,424 Professional 390 382 Pearson Education 4,616 4,390 FT Group 443 427 Sales – continuing operations 5,059 4,817 Sales – discontinued operations 1,053 1,045 Total sales 6,112 5,862 Adjusted operating profit North American Education 536 493 International Education 216 196 Professional 37 66 Pearson Education 789 755 FT Group 49 76 Adjusted operating profit – continuing operations 838 831 Adjusted operating profit – discontinued operations 98 111 Total adjusted operating profit 936 942 In addition to the external sales above, Penguin made inter-segment sales to the Education businesses of £2m (2011: £2m), the North American Education business made inter-segment sales to the other education businesses of £5m (2011: £3m), the International Education business made inter-segment sales to the North American Education business of £1m (2011: £nil) and the Professional business made inter-segment sales to the other education businesses of £12m (2011: £9m). Adjusted operating profit is one of Pearson’s key business performance measures; it includes the operating profit from the total business including the results of discontinued operations. Other net gains and losses that represent profits and losses on the sale of subsidiaries, joint ventures, associates and other financial assets are excluded from adjusted operating profit as they distort the performance of the Group. Amortisation of acquired intangibles, acquisition costs and movements in contingent acquisition consideration are also excluded from adjusted operating profit as these items are not considered to be fully reflective of the underlying performance of the Group.

Page 25 of 36
NOTES TO THE CONDENSED CONSOLIDATED FINANCIAL STATEMENTS continued for the year ended 31 December 2012
2. Segment information continued
The following table reconciles adjusted operating profit from continuing operations and discontinued operations to operating profit for each segment. N
orth Am
erican Education
International Education
Professional
FT Group
Co
ntin
uin
g
Discontinued
Total
all figures in £ millions
2012 Adjusted operating profit 536 216 37 49 838 98 936 Other net gains and losses - - (123) - (123) (32) (155) Acquisition costs (7) (8) (1) (4) (20) (1) (21) Intangible charges (66) (73) (37) (4) (180) (3) (183) Operating profit 463 135 (124) 41 515 62 577
2011
Adjusted operating profit 493 196 66 76 831 111 942 Other net gains and losses 29 (6) - 412 435 - 435 Acquisition costs (2) (9) - (1) (12) - (12) Intangible charges (57) (60) (11) (8) (136) (3) (139) Operating profit 463 121 55 479 1,118 108 1,226
Corporate costs are allocated to business segments including discontinued operations on an appropriate basis depending on the nature of the cost and therefore the total segment result is equal to the Group operating profit. Included in other net gains and losses in 2012 in the Professional segment is the loss on closure of Pearson in Practice (£113m) and an impairment loss on a joint venture (£10m). Also included in other net gains and losses in 2012 for discontinued businesses are the costs associated with the formation of Penguin Random House (£32m) including a provision for the settlement of litigation associated with the agency arrangements for eBooks. In 2011 we excluded a net gain of £435m comprising the gain on sale of FTSE (£412m) in the FT Group, a gain on the sale of investments in the North American Education business (£29m) and a net loss on acquisition and disposal transactions in the International Education business (£6m).

Page 26 of 36
NOTES TO THE CONDENSED CONSOLIDATED FINANCIAL STATEMENTS continued for the year ended 31 December 2012
3. Net finance costs 2012 2011
all figures in £ millions
Net interest payable (65) (55) Finance income in respect of retirement benefits 13 3 Finance cost of put options and deferred consideration associated with acquisitions
(27) (4)
Net foreign exchange gains / (losses) 1 (11) Other gains / (losses) on financial instruments in a hedging relationship:
- fair value hedges (1) - Other gains / (losses) on financial instruments not in a hedging relationship:
- amortisation of transitional adjustment on bonds - 1 - derivatives (2) (5)
Net finance costs (81) (71) Analysed as: Finance costs (113) (96) Finance income 32 25 Net finance costs (81) (71) Analysed as: Net interest payable (65) (55) Finance income in respect of retirement benefits 13 3 Net finance costs reflected in adjusted earnings (52) (52) Other net finance costs (29) (19) Net finance costs (81) (71)
For the purposes of calculating adjusted earnings, we have excluded the finance costs of put options and deferred consideration as they relate to future earn outs and similar payments on acquisitions and do not reflect cash expended. Foreign exchange and other gains and losses are excluded from adjusted earnings as they represent short-term fluctuations in market value and are subject to significant volatility. These other gains and losses may not be realised in due course as it is normally the intention to hold the related instruments to maturity.

Page 27 of 36
NOTES TO THE CONDENSED CONSOLIDATED FINANCIAL STATEMENTS continued for the year ended 31 December 2012
4. Profit before tax 2012 2011
all figures in £ millions note
Profit before tax – continuing operations 434 1,047 Add back: amortisation of acquired intangibles 2 180 136 Add back: acquisition costs 2 20 12 Add back: other net losses / (gains) 2 123 (435) Add back: other net finance costs 3 29 19 Adjusted profit before tax - continuing operations 786 779 Adjusted profit before tax - discontinued operations 98 111 Total adjusted profit before tax 884 890
5. Income tax 2012 2011
all figures in £ millions
Income tax charge – continuing operations (148) (162) Add back: tax benefit on amortisation of acquired intangibles (54) (43) Add back: tax benefit on acquisition costs (5) (4) Add back: tax charge on other net gains - 19 Add back: tax benefit on other net finance costs (1) (5) Tax amortisation benefit on goodwill and intangibles 36 34 Adjusted income tax charge - continuing operations (172) (161) Adjusted income tax charge - discontinued operations (32) (38) Total adjusted income tax charge (204) (199) Tax rate reflected in adjusted earnings 23.1% 22.4%
The adjusted income tax charge excludes the tax benefit or charge on items that are excluded from profit before tax (see note 4). The tax benefit from tax deductible goodwill and intangibles is added to the adjusted income tax charge as this benefit more accurately aligns the adjusted tax charge with the expected rate of cash tax payments.

Page 28 of 36
NOTES TO THE CONDENSED CONSOLIDATED FINANCIAL STATEMENTS continued for the year ended 31 December 2012 6. Earnings per share Basic earnings per share is calculated by dividing the profit attributable to equity shareholders of the Company (earnings) by the weighted average number of ordinary shares in issue during the year, excluding ordinary shares purchased by the Company and held as treasury shares. Diluted earnings per share is calculated by adjusting the weighted average number of ordinary shares to take account of all dilutive potential ordinary shares and adjusting the profit attributable, if applicable, to account for any tax consequences that might arise from conversion of those shares.
2012 2011
all figures in £ millions
Profit for the year from continuing operations 286 885 Non-controlling interest (3) 1 Earnings from continuing operations 283 886 Profit for the year from discontinued operations 43 71 Non-controlling interest - - Earnings 326 957
Weighted average number of shares (millions) 804.3 800.2 Effect of dilutive share options (millions) 1.3 1.7 Weighted average number of shares (millions) for diluted earnings 805.6 801.9 Earnings per share from continuing and discontinued operations Basic 40.5p 119.6p Diluted 40.5p 119.3p Earnings per share from continuing operations Basic 35.2p 110.7p Diluted 35.1p 110.5p
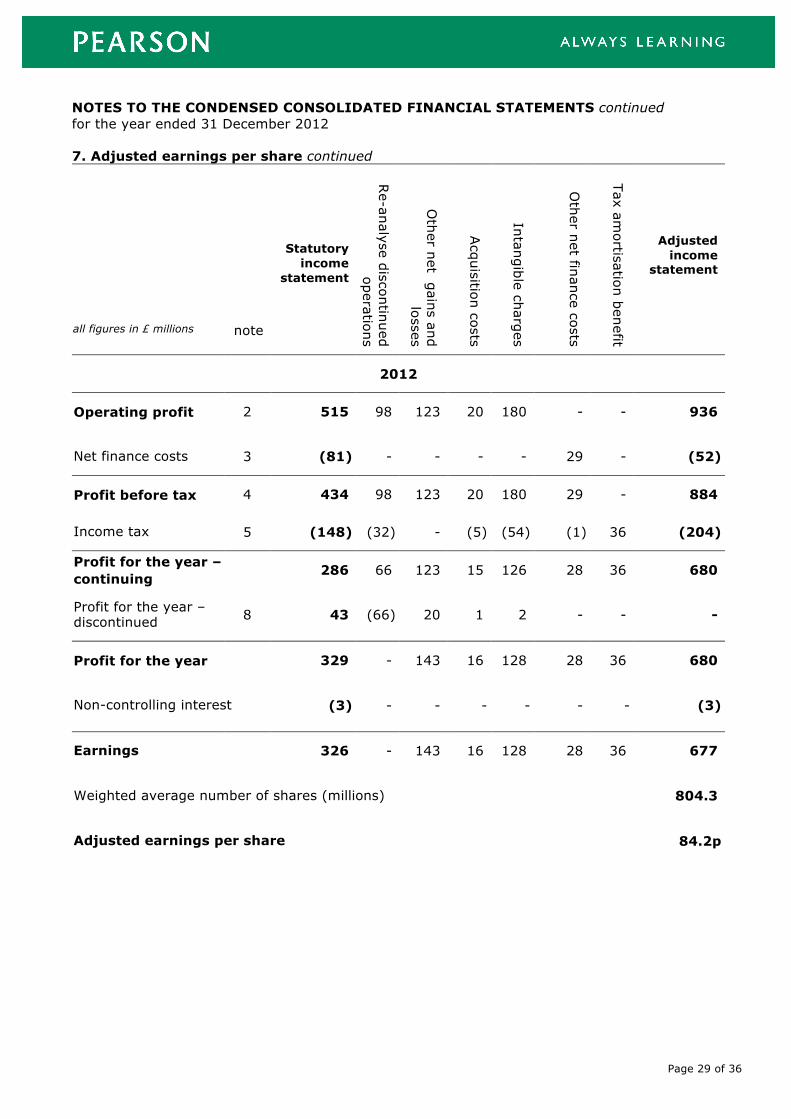
7. Adjusted earnings per share
In order to show results from operating activities on a consistent basis, an adjusted earnings per share is presented which excludes certain items as set out below. The adjusted earnings per share includes both continuing and discontinued businesses on an undiluted basis. The Company’s definition of adjusted earnings per share may not be comparable to other similarly titled measures reported by other companies.
Page 29 of 36
NOTES TO THE CONDENSED CONSOLIDATED FINANCIAL STATEMENTS continued for the year ended 31 December 2012
7. Adjusted earnings per share continued
Statutory income
statement
Re-analyse discontinued
operations
Other net gains and
losses
Acquisition costs
Intangible charges
Other net finance costs
Tax amortisation benefit
Adjusted income
statement
all figures in £ millions note
2012
Operating profit 2 515 98 123 20 180 - - 936
Net finance costs 3 (81) - - - - 29 - (52)
Profit before tax 4 434 98 123 20 180 29 - 884
Income tax 5 (148) (32) - (5) (54) (1) 36 (204)
Profit for the year – continuing
286 66 123 15 126 28 36 680
Profit for the year – discontinued 8 43 (66) 20 1 2 - - -
Profit for the year 329 - 143 16 128 28 36 680
Non-controlling interest (3) - - - - - - (3)
Earnings 326 - 143 16 128 28 36 677
Weighted average number of shares (millions) 804.3
Adjusted earnings per share 84.2p

Page 30 of 36
NOTES TO THE CONDENSED CONSOLIDATED FINANCIAL STATEMENTS continued for the year ended 31 December 2012 7. Adjusted earnings per share continued
Statutory income
statement
Re-analyse discontinued
operations
Other net gains and
losses
Acquisition costs
Intangible charges
Other net finance costs
Tax amortisation benefit
Adjusted income
statement
all figures in £ millions note
2011
Operating profit 2 1,118 111 (435) 12 136 - - 942
Net finance costs 3 (71) - - - - 19 - (52)
Profit before tax 4 1,047 111 (435) 12 136 19 - 890
Income tax 5 (162) (38) 19 (4) (43) (5) 34 (199)
Profit for the year – continuing
885 73 (416) 8 93 14 34 691
Profit for the year – discontinued 8 71 (73) - - 2 - - -
Profit for the year 956 - (416) 8 95 14 34 691
Non-controlling interest 1 - - - - - - 1
Earnings 957 - (416) 8 95 14 34 692
Weighted average number of shares (millions) 800.2
Adjusted earnings per share 86.5p

Page 31 of 36
NOTES TO THE CONDENSED CONSOLIDATED FINANCIAL STATEMENTS continued for the year ended 31 December 2012
8. Discontinued operations In October 2012, Pearson and Bertelsmann announced an agreement to create a new consumer publishing business by combining Penguin and Random House. The transaction is expected to complete in 2013 and, at that point, Pearson will no longer control the Penguin Group of companies but will equity account for its 47% associate interest. The loss of control results in the Penguin business being classified as held for sale at 31 December 2012 and the results for both 2011 and 2012 have been included in discontinued operations. The sales and profit for the year for discontinued operations are analysed below.
2012 2011 all figures in £ millions
Sales by discontinued operations 1,053 1,045
Operating profit included in adjusted earnings 98 111 Intangible amortisation (3) (3) Acquisition costs (1) - Costs relating to the formation of Penguin Random House (32) - Finance income - - Profit before tax 62 108 Attributable tax expense (19) (37) Profit for the year from discontinued operations 43 71 Operating profit included in adjusted earnings 98 111 Finance income - - Attributable tax expense (32) (38) Profit for the year included in adjusted earnings 66 73 Intangible amortisation (3) (3) Attributable tax benefit 1 1 Acquisition costs (1) - Attributable tax benefit - - Costs relating to the formation of Penguin Random House (32) - Attributable tax expense 12 - Profit for the year from discontinued operations 43 71
9. Dividends 2012 2011
all figures in £ millions
Amounts recognised as distributions to equity shareholders in the year 346 318
The directors are proposing a final dividend of 30.0p per equity share, payable on 3 May 2013 to shareholders on the register at the close of business on 5 April 2013. This dividend, which will absorb an estimated £245m of shareholders’ funds, has not been included as a liability as at 31 December 2012.

Page 32 of 36
NOTES TO THE CONDENSED CONSOLIDATED FINANCIAL STATEMENTS continued for the year ended 31 December 2012 10. Exchange rates Pearson earns a significant proportion of its sales and profits in overseas currencies, the most important being the US dollar. The relevant rates are as follows:
2012 2011
Average rate for profits 1.59 1.60
Year end rate 1.63 1.55
11. Intangible assets 2012 2011
all figures in £ millions Goodwill 5,077 5,199
Other intangibles 1,141 1,143 Total intangibles 6,218 6,342
12. Trade and other liabilities 2012 2011
all figures in £ millions Trade payables (337) (483)
Accruals (470) (569) Deferred income (714) (678) Other liabilities (317) (336) Trade and other liabilities (1,838) (2,066) Analysed as: Trade and other liabilities – current (1,556) (1,741) Other liabilities – non-current (282) (325) Total trade and other liabilities (1,838) (2,066)
The deferred income balance comprises principally: cash received in advance for multi year obligations to deliver workbooks to customers in school businesses; advance payments in assessment and testing businesses; subscription income in school and newspaper businesses; and obligations to deliver digital content in future periods.

Page 33 of 36
NOTES TO THE CONDENSED CONSOLIDATED FINANCIAL STATEMENTS continued for the year ended 31 December 2012 13. Business combinations In May 2012, the Professional business acquired Certiport, Inc. for $140m. Certiport is based in the US and is a leading provider of certification and assessment programmes in IT and digital literacy. In July 2012, the International Education business completed the purchase of GlobalEnglish Corporation, a leading provider of cloud-based, on demand business English learning, assessment and performance support software for a net cash consideration of $90m. Also in July 2012, Penguin acquired Author Solutions, Inc., the world’s leading provider of professional self-publishing services, for $116m in cash. The $650m acquisition of EmbanetCompass by the North American Education business was completed in November 2012. EmbanetCompass partners with leading non-profit colleges in North America to provide online learning solutions for university programmes. All the above acquisitions were for a 100% interest. Provisional values for the assets and liabilities arising from acquisitions completed in the year together with adjustments to prior year acquisitions are set out below.
Certiport ASI Global English
Embanet Compass
Other Total
all figures in £ millions
Property, plant and equipment - 1 - 3 6 10 Intangible assets 49 35 36 74 86 280 Intangible assets – Pre-publication 5 - 1 - - 6 Inventories - - - - 1 1 Trade and other receivables 5 8 8 13 - 34 Cash and cash equivalents 2 - 8 18 6 34 Net deferred income tax liabilities (20) (3) (13) (21) (10) (67) Retirement benefit obligations - - - - (2) (2) Provisions for other liabilities and charges - - - - (1) (1) Trade and other liabilities (11) (28) (22) (26) (24) (111) Current income tax liabilities - - (1) - - (1) Net assets acquired at fair value 30 13 17 61 62 183 Goodwill 58 56 46 350 (5) 505 Total 88 69 63 411 57 688 Satisfied by: Cash (88) (69) (63) (411) (51) (682) Deferred consideration - - - - (6) (6) Total consideration (88) (69) (63) (411) (57) (688)

Page 34 of 36
NOTES TO THE CONDENSED CONSOLIDATED FINANCIAL STATEMENTS continued for the year ended 31 December 2012 13. Business combinations continued The net cash outflow on acquisitions in the year is shown in the table below: Total
all figures in £ millions
Cash – Current year acquisitions (682) Deferred payments for prior year acquisitions and other items (31) Cash and cash equivalents acquired 34 Acquisition costs and other liabilities paid (37) Net cash outflow on acquisitions (716)
In total, acquisitions completed in the year contributed an additional £45m of sales and £5m of operating profit from continuing operations before acquisition costs and intangible amortisation. If the acquisitions had completed on 1 January 2012 then we estimate that sales for the year would have been £5,168m and profit before tax would have been £444m.
14. Net debt 2012 2011
all figures in £ millions Non-current assets
Derivative financial instruments 174 177 Current assets Derivative financial instruments 4 - Marketable securities 6 9 Cash and cash equivalents (excluding overdrafts) 1,062 1,369 Non-current liabilities Borrowings (2,010) (1,964) Derivative financial instruments - (2) Current liabilities Borrowings (262) (87) Derivative financial instruments - (1) Net debt – continuing operations (1,026) (499) Net cash classified as held for sale 108 - Total net debt (918) (499)
In May 2012, Pearson issued $500m 3.75% Notes due in 2022. The proceeds are being used for general corporate purposes and to maintain an adequate level of liquidity.
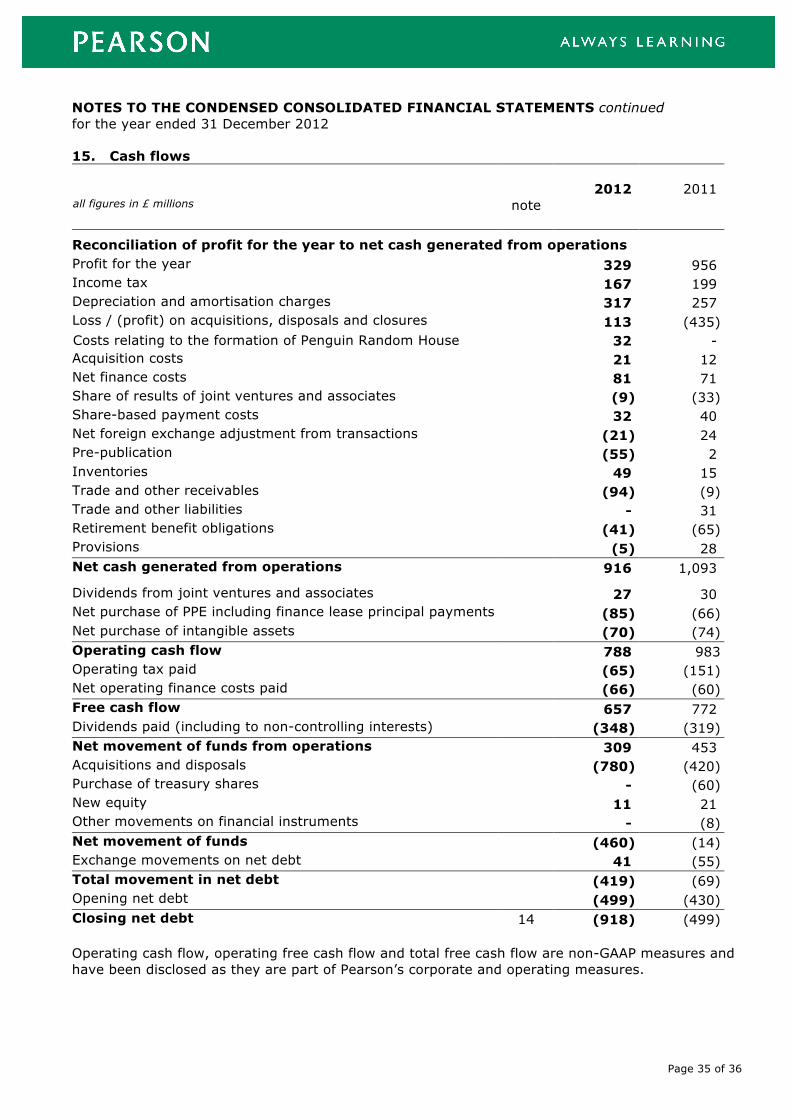
Page 35 of 36
NOTES TO THE CONDENSED CONSOLIDATED FINANCIAL STATEMENTS continued for the year ended 31 December 2012
15. Cash flows 2012 2011
all figures in £ millions note Reconciliation of profit for the year to net cash generated from operations
Profit for the year 329 956 Income tax 167 199 Depreciation and amortisation charges 317 257 Loss / (profit) on acquisitions, disposals and closures 113 (435) Costs relating to the formation of Penguin Random House 32 - Acquisition costs 21 12 Net finance costs 81 71 Share of results of joint ventures and associates (9) (33) Share-based payment costs 32 40 Net foreign exchange adjustment from transactions (21) 24 Pre-publication (55) 2 Inventories 49 15 Trade and other receivables (94) (9) Trade and other liabilities - 31 Retirement benefit obligations (41) (65) Provisions (5) 28 Net cash generated from operations 916 1,093 Dividends from joint ventures and associates 27 30 Net purchase of PPE including finance lease principal payments (85) (66) Net purchase of intangible assets (70) (74) Operating cash flow 788 983 Operating tax paid (65) (151) Net operating finance costs paid (66) (60) Free cash flow 657 772 Dividends paid (including to non-controlling interests) (348) (319) Net movement of funds from operations 309 453 Acquisitions and disposals (780) (420) Purchase of treasury shares - (60) New equity 11 21 Other movements on financial instruments - (8) Net movement of funds (460) (14) Exchange movements on net debt 41 (55) Total movement in net debt (419) (69) Opening net debt (499) (430) Closing net debt 14 (918) (499)
Operating cash flow, operating free cash flow and total free cash flow are non-GAAP measures and have been disclosed as they are part of Pearson’s corporate and operating measures.
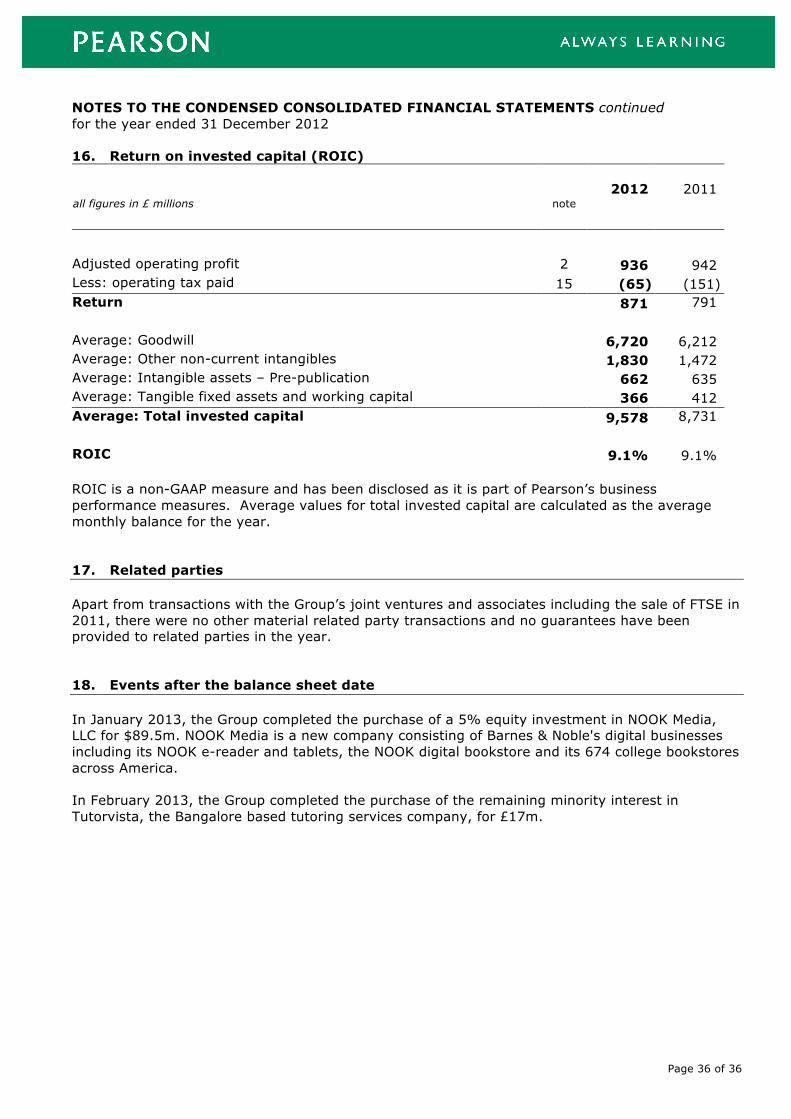
Page 36 of 36
NOTES TO THE CONDENSED CONSOLIDATED FINANCIAL STATEMENTS continued for the year ended 31 December 2012
16. Return on invested capital (ROIC) 2012 2011
all figures in £ millions note
Adjusted operating profit 2 936 942 Less: operating tax paid 15 (65) (151) Return 871 791 Average: Goodwill 6,720 6,212 Average: Other non-current intangibles 1,830 1,472 Average: Intangible assets – Pre-publication 662 635 Average: Tangible fixed assets and working capital 366 412 Average: Total invested capital 9,578 8,731 ROIC 9.1% 9.1%
ROIC is a non-GAAP measure and has been disclosed as it is part of Pearson’s business performance measures. Average values for total invested capital are calculated as the average monthly balance for the year. 17. Related parties Apart from transactions with the Group’s joint ventures and associates including the sale of FTSE in 2011, there were no other material related party transactions and no guarantees have been provided to related parties in the year.
18. Events after the balance sheet date
In January 2013, the Group completed the purchase of a 5% equity investment in NOOK Media, LLC for $89.5m. NOOK Media is a new company consisting of Barnes & Noble's digital businesses including its NOOK e-reader and tablets, the NOOK digital bookstore and its 674 college bookstores across America. In February 2013, the Group completed the purchase of the remaining minority interest in Tutorvista, the Bangalore based tutoring services company, for £17m.


![[MMC PRESS KIT] Press Release _ID](https://static.fdocuments.in/doc/165x107/58677ec31a28ab27408bc670/mmc-press-kit-press-release-id.jpg)