2013 Nevada Agriculture Analysis - Nevada Department of Agriculture
108
2013 Nevada Agriculture Analysis and Opportunities This report will be available on the Governor’s Office of Economic Development and the Northern Nevada Development Authority websites: www.diversifynevada.com www.nnda.org Governor’s Office of Economic Development 808 West Nye Lane Carson City, Nevada 89703 Tel: (800) 336-1600
Transcript of 2013 Nevada Agriculture Analysis - Nevada Department of Agriculture
2013 Nevada Agriculture
Analysis and Opportunities
This report will be available on the Governor’s Office of Economic Development
and the Northern Nevada Development Authority websites:
www.diversifynevada.com
www.nnda.org
Governor’s Office of Economic Development
808 West Nye Lane
Carson City, Nevada 89703
Tel: (800) 336-1600

“I have always said there is only one thing that can bring our nation down - our dependence
on foreign countries for food and energy. Agriculture is the backbone of our economy.”
John Salazar

ACKNOWLEDGEMENTS
This report was prepared by the Northern Nevada Development Authority and the Business Resource
Innovation Center, the business branch of Carson City Library, for the Governor’s Office of Economic
Development. Support for this report was provided by the members of the Agriculture Committee of the
Northern Nevada Development Authority. Special thanks to Lynn Hettrick, Jim Barbee, Al DiStefano, Sarah
Adler, University of Nevada Cooperative Extension Program, Doug Taylor, and Ann Louhela for providing
valuable information and industry insight. Thanks to Eugenia Larmore of Ekay Economic Consultants for
her expertise, resources, and economic development and impact analysis report that added to the
foundation of this study. Thanks to the NNDA staff for their tireless efforts in getting this report ready for
publication.

Table of Contents
EXECUTIVE SUMMARY ……………………………………………………………………………… 1 AGRICULTURE IN NEVADA .………………………………………………………………………. 4
Nevada Agriculture Survey 5
Examples of existing agriculture success 8
Economic analysis of agriculture sector 12
Agriculture sector definition 12
Agriculture production industries 12
Agriculture support industries 13
Agriculture processing and packaging industries 14
Agriculture distribution industries 16
Agriculture sector performance 16
Comparison to US 20
Comparison to other Nevada sectors 20
Output per employee 21
Labor income per employee 24
Value of imports 27
Value of exports 28
Location quotient 29
Summary 32
AGRICULTURE CLUSTER ECONOMIC DEVELOPMENT ………………………………………. 33
Cluster value chains 33
Export enhancement 34
Directory of “Best Case” export 37
Import substitution 37
Imports by industry 41
Agriculture cluster economic impact analysis 44
Economic impacts of agriculture cluster output 46
Employment impacts of agriculture cluster output 47
FUTURE AGRICULTURE OPPORTUNITIES ……………………………………………………. 55
Hoop house or high tunnel 55
New crop opportunities 57
Saffron 58
What is a Rodale Test Garden? 59
Hops 59
Canola 60
Aquaculture farming 61
Talapia farms 61
Alternative crops 65
Perennial grasses 66
Teff (Tiffany Hay) 67
Expansion opportunities 69
Vertical farming and hydroponics 69
Wine Grapes / Vineyards 70
AGRICULTURE GAPS ………………………………………………………………………………… 74
Gap 1: Seed processing 75
Gap 2: Localized agriculture development 75
Gap 3: Dairy processing 79
Gap 4: Meat production 79
Gap 5: Agriculture equipment manufacturing 80
Gap 6: Agriculture marketing program 81
Gap 7: Federal loans, grants, incentives 82
USDA 82
Small Business Administration loans and grants 86
Industry constraints 86
Regulations 86
Taxes 87
RECOMMENDATIONS ………………………………………………………………………………… 89
RESEARCH ………………………………………………………………………………………….. 94
REFERENCES …………………………………………………………………………………………….96
APPENDICES …………………………………………………………………………………………. 102

“Nevada’s Agriculture Industry Sector is a major
contributor to the overall economy of the state.”

1 | P a g e
1. EXECUTIVE SUMMARY
Nevada’s Agriculture Industry Sector is a major contributor to the overall economy of the state. Its
contribution has not been fully articulated nor understood by the general business and state government
communities within Nevada. This study has been undertaken to examine the sector in an organized fashion
and to identify gaps and targets for future economic development efforts.
The study utilized primary and secondary research including interviews with industry stakeholders, surveys
at all levels within the industry, and economic research and analysis to examine this critical industry.
Findings of the study are summarized below:
The overall economic impact of the agricultural cluster on the State of Nevada is estimated at $5.3
billion using 2010 data, including direct, indirect, and induced impacts. This impact varies by
region; the study estimates impacts of the Northwestern, Northeastern, and Southern regions within
the state.
Nevada’s agriculture production has a significant impact on the state and varies by county. Some
counties focus more on agricultural production, while others prefer agri-tourism and operation
businesses, depending on the county’s strengths and assets.
The location quotient analysis defines the agriculture production sector as Emerging, which
indicates a sector that is not specialized compared to the nation, but growing in its specialization.
The agriculture industry has numerous backward and forward linkages, including Wholesale Trade,
Truck Transportation, Food Services, Hotels and Motels, and Real Estate. This means that logistic
channels between these suppliers and customers are well established, which may make the state
more attractive to businesses operating within these industries.
The agriculture cluster has a number of gaps and disconnects, resulting in local businesses
importing goods and services from outside of the area, which is the first step of import substitution,
a practice of reducing the purchases of goods and services by local firms from outside of the state.
The study shows a number of new crop opportunities given Nevada’s physical and economic
strengths, including saffron, hops, canola, and aquaculture.
Expanded agricultural opportunities for the state include vertical farming, wine grapes and
vineyards, potatoes, onions and alfalfa.
The agriculture cluster also has a number of industries exporting large amounts of goods and
services outside of the area. For a successful export substitution effort, these businesses should
be encouraged to increase exports and new exporters should be identified and developed
.

2 | P a g e
The employment impact of the agriculture cluster on the State of Nevada, using 2010 data, is
estimated at 60,700 jobs, including direct, indirect, and induced impacts. The impacts of the
Northwestern, Northeastern, and Southern regions are also estimated.
Additionally, the study identified a number of gaps and resulting opportunities available for the
Nevada agricultural sector, including the need for seed, dairy, and meat processing facilities as
well as an agricultural equipment manufacturing facility.
Agriculture, Forestry, Fishing and Hunting are emerging industries in Nevada, with a 7 percent
growth from 2006-2011, showing industry growth and potential for future concentration.
Overall, the agriculture cluster has a positive and significant impact on the state and is well positioned for
future growth, given its potential for export enhancement and import substitution, though much work
remains in identifying the factors necessary for successful growth. This includes understanding the reasons
for import gaps and disconnects, identifying export ready companies, and supporting existing operators.

3 | P a g e
“Nevada ranks third in the nation in ranch size, averaging 3,500 acres.”

4 | P a g e
2. AGRICULTURE IN NEVADA
Overview
Agriculture is one of Nevada’s most important industries, contributing significantly to the economies of rural
communities and the state as a whole. Below is a summary of relevant facts regarding the agriculture
industry in Nevada, and these facts are discussed in more detail throughout the report.
Nevada’s ranches rank third in the nation in size, averaging 3,500 acres.
Nevada agriculture is directed primarily toward range livestock production. Cattle and calves are
Nevada’s leading agricultural industry, totaling $732,883,000 or 62.5 percent of the farm receipts
(Nevada Department of Agriculture, 2011). “Over eighty percent of meat producers (including cattle,
lamb, etc.) sell their meat as live animals on the hoof, while approximately ten percent sell their meat
as carcasses” (Curtis, Cowee, & Havercamp, 2007). One reason for this is the limited number of meat
processing facilities in the state, which is a potential growth area for the agriculture sector. Cow-Calf
Operations are most prevalent with a few stocker operators and feedlots.
Dairy, sheep, lambs, and hogs are among Nevada’s other livestock enterprises. The larger cattle and
sheep ranches are in the northern half of the state. The greatest number of dairies is in northern
Nevada, but the largest dairies are in the south.
Despite Nevada’s arid climate, irrigation allows for excellent crop growth. Alfalfa hay is the leading cash
crop of the state, totaling $232,100,000 (USDA, 2012). Much of the hay is sold to dairy operations in
surrounding states. Significant quantities of alfalfa cubes and compressed bales are exported overseas
each year. Alfalfa seed is another substantial crop.
Additional crops produced in Nevada include potatoes, barley, winter and spring wheat, corn, oats,
onions, garlic, and honey. Smaller acreages of mint, fruits and vegetables are grown throughout the
state.
The chart below shows the top five commodities in the state as determined by the Nevada Agriculture
Statistics Bulletin, 2012 (USDA, National Agriculture Statistics Service, 2012).

5 | P a g e
Graph 1. Nevada Top 5 Commodities
Nevada Agriculture Survey
The Nevada Agriculture Community was surveyed to better understand the industry and its needs. The
survey was made available through CenterPoint Community website and agriculture-related agencies and
associations. Organizations that focus on agriculture participated in the marketing of the survey. These
organizations included the Nevada Dairy Commission, the Nevada Cattlemen’s Association, the Nevada
Department of Agriculture, and the Nevada Future Farmers of America (FFA). These efforts resulted in 89
returned surveys.
The surveys collected general demographic information along with specific questions about projected
employment, impediments to business growth, connections along the supply chain, feedback on
government performance, growth opportunities, workforce skills assessment, taxes and regulations,
expansion and exporting plans, the value of local products, and more. Detailed results of the survey can be
viewed on www.centerpointcommunity.com.
Survey Results
The following is the summary of the survey results.
$251,821,00037.0%
$149,541,00022.0%
$136,206,00020.0%$95,693,000
14.1%$25,602,0003.8%
Meat Animals
Feed Crops
Dairy Products
Vegetables and Melons
All Other Crops
NEVADA TOP 5COMMODITIES

6 | P a g e
Employment levels are projected to grow slightly over the next 12 months.
22.6% of respondents expect to add employees in the next 12 months, while 73.8% expect to keep
staffing levels constant.
The biggest impediments to business growth were identified as laws and regulations (23.0%),
transportation costs (20.9%), cost or availability of goods or materials (15.3%), reduced consumer
spending (10.2%), and financing (10.2%).
Local consumers and processors purchase 40.5% of respondents’ products. Regional consumers
and processors purchase 29.8% of production. Broker/wholesalers purchase 25.0% of production,
while only 5.7% is exported. It was noted that respondents to this survey were smaller farms,
growers, processors, and ranches.
77.4% of all respondents purchase some equipment, raw materials, or administrative goods and
services from local suppliers. Of total respondents, 57.1% purchase from regional suppliers, 34.5%
of respondents purchase from national suppliers, and 7.1% purchase goods or services from
foreign suppliers.
When asked which tier of government costs the most time/money/problems, 65.5% of respondents
pointed to the Federal government, 20.2% named the state, 6.0% named their county, and 4.8%
named their local city/township.
When asked which tier of government is the most helpful, 50.0% of respondents pointed to their
county, 26.2% named the state, 10.7% named their city/township, and 4.8% named the Federal
government.
Respondents identified five areas that would help grow their business: lower transportation and/or
fuel costs (25.5%), reduced government regulation (22.3%), marketing and promotion of their
products or services (14.0%), financing (11.1%), and access to new markets (9.8%).
Skills identified by respondents as lacking in the local workforce included industry specific skills
and training (23.8%), honesty (16.3%), showing up as scheduled (15.8%), customer relations
(14.8%), and punctuality (12.2%).
When asked what laws cost the most in time and money, respondents answered most frequently
with licenses, permits, penalties (30.8%), taxation (25.6%), and environmental laws (25.1%).
Federal income taxes were considered by 28.9% of respondents to be the highest tax burdens,
followed by payroll taxes with 24.4% of respondents, property taxes with 16.3% and annual
business taxes with 11.9%.
34.5% of all respondents reported having plans to expand or to relocate.
29.8% of all respondents reported having an interest in exporting.
71.4% of all respondents value local products and 70.2% would pay more to support local
businesses.
10.9% of producers reported producing crops in a hoop house. Of those not using hoop house
technologies, 19.8% are interested in learning more.
20.0% of producers feel that food safety laws are an impediment.
7 | P a g e
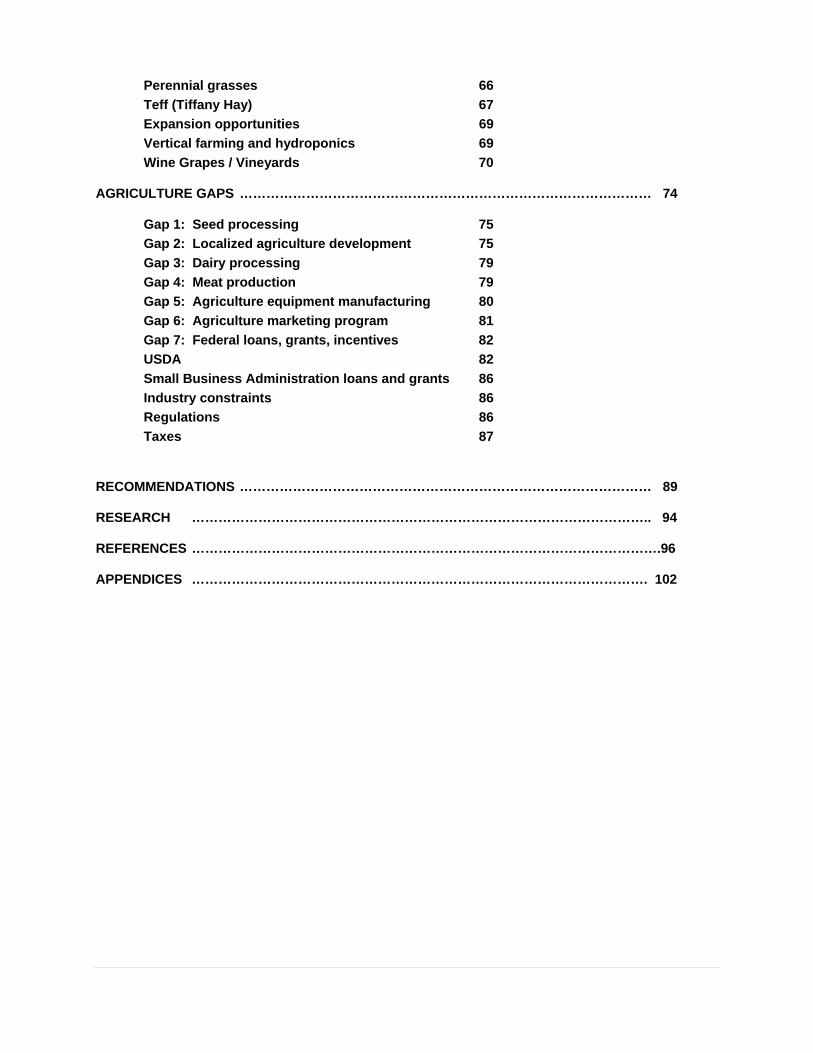
56.4% of producers would grow other crops if there were a market demand.
15.5% of producers feel that their business would grow by having access to wholesale distribution.
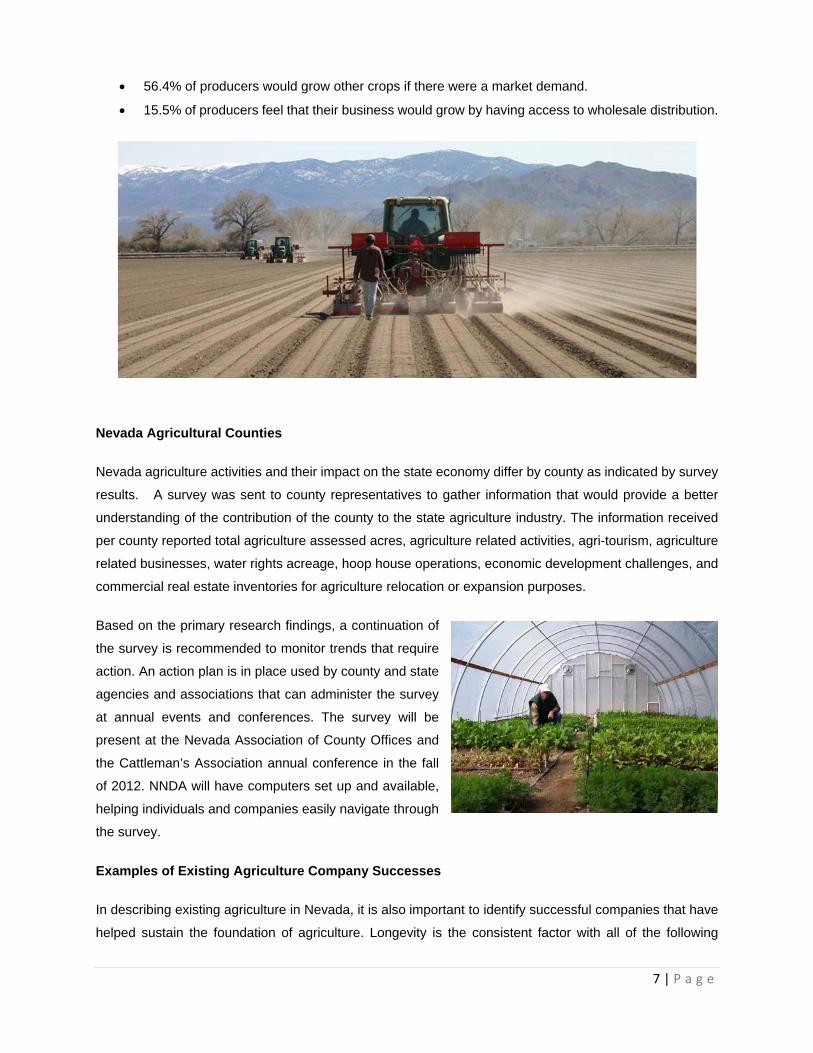
Nevada Agricultural Counties
Nevada agriculture activities and their impact on the state economy differ by county as indicated by survey
results. A survey was sent to county representatives to gather information that would provide a better
understanding of the contribution of the county to the state agriculture industry. The information received
per county reported total agriculture assessed acres, agriculture related activities, agri-tourism, agriculture
related businesses, water rights acreage, hoop house operations, economic development challenges, and
commercial real estate inventories for agriculture relocation or expansion purposes.
Based on the primary research findings, a continuation of
the survey is recommended to monitor trends that require
action. An action plan is in place used by county and state
agencies and associations that can administer the survey
at annual events and conferences. The survey will be
present at the Nevada Association of County Offices and
the Cattleman’s Association annual conference in the fall
of 2012. NNDA will have computers set up and available,
helping individuals and companies easily navigate through
the survey.
Examples of Existing Agriculture Company Successes
In describing existing agriculture in Nevada, it is also important to identify successful companies that have
helped sustain the foundation of agriculture. Longevity is the consistent factor with all of the following

8 | P a g e
successful agriculture companies. Their ability to withstand the ups and downs of local and national
economies has proven these companies to be mainstays in the Nevada agriculture industry and the state
economy.
Anderson Dairy
This company is privately owned and has been operating in
southern Nevada since 1907, starting out with 10-15 milk cows.
Today they are the largest, most advanced dairy processing and
bottling plant in the southwest, employing 135 people and
grossing annual revenue of approximately $45 million. Their
37,000 square foot facility has the most up-to-date equipment
and technology available. Anderson processes milk, sour
cream, cottage cheese, ice cream, buttermilk, whipping cream
and much more. The Barn Buddies Tour has been toured by
thousands of school age children and adults, showing how they process and package the dairy products
and the importance of the health benefits of dairy.
Peri and Sons
This company started in 1979 growing 20 acres of distinctive, superior-quality, pesticide-free products and
today has approximately 8,000 acres under production, with annual gross revenue over $53 million. Crops
are 2,500 acres in white, yellow, red, and sweet onions, 1,500 acres in leafy greens and the remainder is
rotational forage crops. During peak season they ship 60-70 truckloads per day and employ over 1,200
people, with a year-round, full-time employment base of 250-
300. They have been consistent in growth and expansion,
with another expansion planned for 2013. In the last 15 years,
Peri and Sons have implemented water-conservation
systems, improved pest management practices, reduced
resource consumption and implemented efficient waste-
management practices as part of their on-going “green”
efforts.
Snyder Livestock
This privately held company started fattening cattle for market at the 4,000-head feedlot in Yerington in the
1960’s. A secondary part of the cattle operation custom-feeds and breeds stock for purebred cattle
9 | P a g e
producers and Snyder is considered to raise the best bulls on the west coast which are sold at the annual
“Bulls for the 21st Century” auction. Snyder produces a diversity of product including, onions, alfalfa, oat
and grass hays and is one of the few garlic producers in the U.S. In an effort to remain on the cutting edge,
a state-of-the-art electronic feed measuring system was installed in 2006, coupled with radio ID tags and
individual feed bunks mounted on scales. The company has 150 employees and grosses approximately
$29 million in revenues.
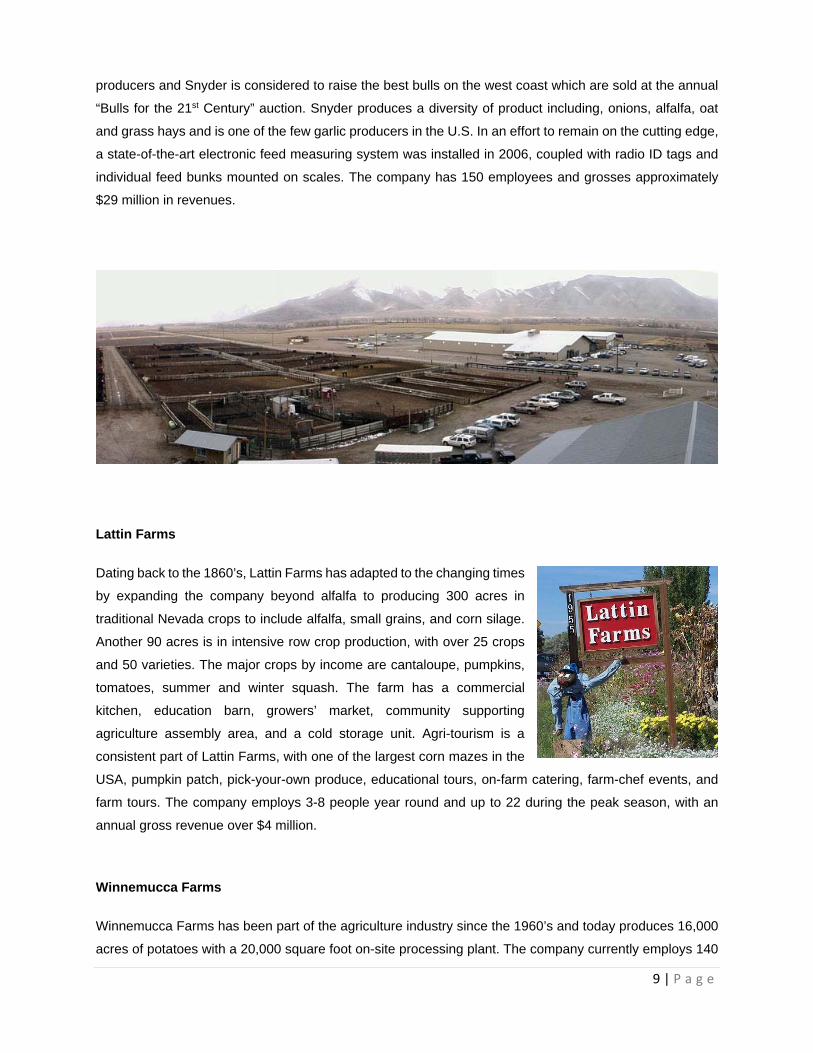
Lattin Farms
Dating back to the 1860’s, Lattin Farms has adapted to the changing times
by expanding the company beyond alfalfa to producing 300 acres in
traditional Nevada crops to include alfalfa, small grains, and corn silage.
Another 90 acres is in intensive row crop production, with over 25 crops
and 50 varieties. The major crops by income are cantaloupe, pumpkins,
tomatoes, summer and winter squash. The farm has a commercial
kitchen, education barn, growers’ market, community supporting
agriculture assembly area, and a cold storage unit. Agri-tourism is a
consistent part of Lattin Farms, with one of the largest corn mazes in the
USA, pumpkin patch, pick-your-own produce, educational tours, on-farm catering, farm-chef events, and
farm tours. The company employs 3-8 people year round and up to 22 during the peak season, with an
annual gross revenue over $4 million.
Winnemucca Farms
Winnemucca Farms has been part of the agriculture industry since the 1960’s and today produces 16,000
acres of potatoes with a 20,000 square foot on-site processing plant. The company currently employs 140
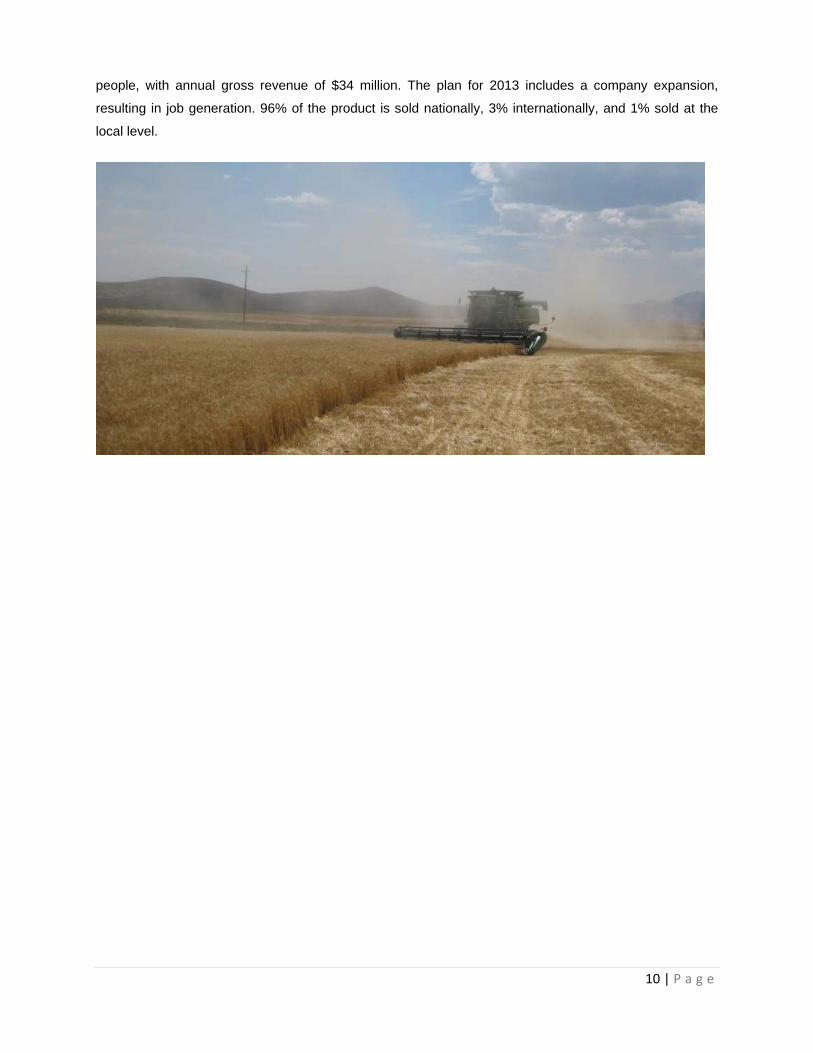
10 | P a g e
people, with annual gross revenue of $34 million. The plan for 2013 includes a company expansion,
resulting in job generation. 96% of the product is sold nationally, 3% internationally, and 1% sold at the
local level.

11 | P a g e
“Products and services are often imported
into the economy when similar products and services
are available locally, creating a disconnect.”
12 | P a g e
3. ECONOMIC ANALYSIS OF AGRICULTURE SECTOR
Agriculture Sector Definition
To understand the impact of the agriculture sector on the State of Nevada, it is important to realize that the
agriculture sector is more than farming, ranching, fishing, and forestry activities. The sector provides
products and services to, and purchases products and services from, other industries. To understand the
impact of the agriculture sector, therefore, we must understand the connections of this sector to its suppliers
and customers, also known as an industrial cluster.
An industrial cluster is a geographically bound collection of similar and/or related firms that together create
competitive advantages for member firms and the local economy. Clusters generally include firms with
significant horizontal and/or vertical linkages, or firms with similar resource and/or labor needs. Firms in a
cluster may interact through purchase-sale relationships; inter-firm collaboration in product development;
marketing or research, or a shared reliance on specialized services and labor markets.
Industries making up the agriculture cluster were defined using data provided by similar studies, specifically
the “Environmental Scan, Agriculture Value Chain: California” dated June 2011, by the Center of Excellence
at Modesto Junior College. This study provided a comprehensive list of agriculture-related industries using
the North American Industry Classification System (NAICS). Each NAICS code is referred to as an industry,
as defined by the Office of Management & Budget. Resulting industries were defined using four areas: 1)
Production; 2) Support; 3) Processing and Packaging; 4) Distribution.
The analysis describes each of the four agricultural areas below. It should be noted that while all relevant
NAICS codes are included in the below definition of the agriculture cluster, some of these industries may
have no activities in the state and may be excluded from subsequent analyses and tables. They are
included in the below tables to provide a full overview of the agriculture cluster.
Agriculture Production Industries
This area includes the direct activities of the agriculture cluster, including the creation of food, feed, and
other agriculture products. The table below provides a list of the NAICS codes corresponding to this
economic area.

13 | P a g e
Table 1. Agriculture Production Industries
It should also be noted that only a four-digit NAICS code is provided for the above area, while all other
areas are defined by six-digit codes. This is because the agriculture sector is made up of 64 six-digit NAICS
codes and including all is unnecessary, given that the entire NAICS 11-Agriculture, Forestry, Fishing and
Hunting is represented in this area.
Agriculture Support Industries
The agriculture support area industries provide support services essential to agricultural operations. These
support activities range from farm machinery and fertilizer manufacturing, to landscaping and pest control.
Table 2 below provides a summary of the industries within this area.
NAICS Code NAICS Definition1111 Oilseed and Grain Farming
1112 Vegetable and Melon Farming
1113 Fruit and Tree Nut Farming
1114 Greenhouse, Nursery, and Floriculture Production
1119 Other Crop Farming
1121 Cattle Ranching and Farming
1122 Hog and Pig Farming
1123 Poultry and Egg Production
1124 Sheep and Goat Farming
1125 Aquaculture
1129 Other Animal Production
1131 Timber Tract Operations
1132 Forest Nurseries and Gathering of Forest Products
1133 Logging
1141 Fishing
1142 Hunting and Trapping
1151 Support Activities for Crop Production
1152 Support Activities for Animal Production
1153 Support Activities for Forestry

14 | P a g e
Table 2. Agriculture Support Industries
It should be noted that only those industries that provide the majority of its products and services or
purchase the majority of its products and services from the agriculture sector are included. These industries
are included on the assumption that the industries may not exist if it were not for the agriculture activities.
The agriculture sector also employs the services of employment agencies, marketing and accounting firms,
construction companies, and more, as will be discussed in the “Agriculture Cluster Economic Development”
section of this report. However, as these industries provide services to a wide range of other industries, it
is difficult to determine the portion of sales attributed to the agriculture sector.
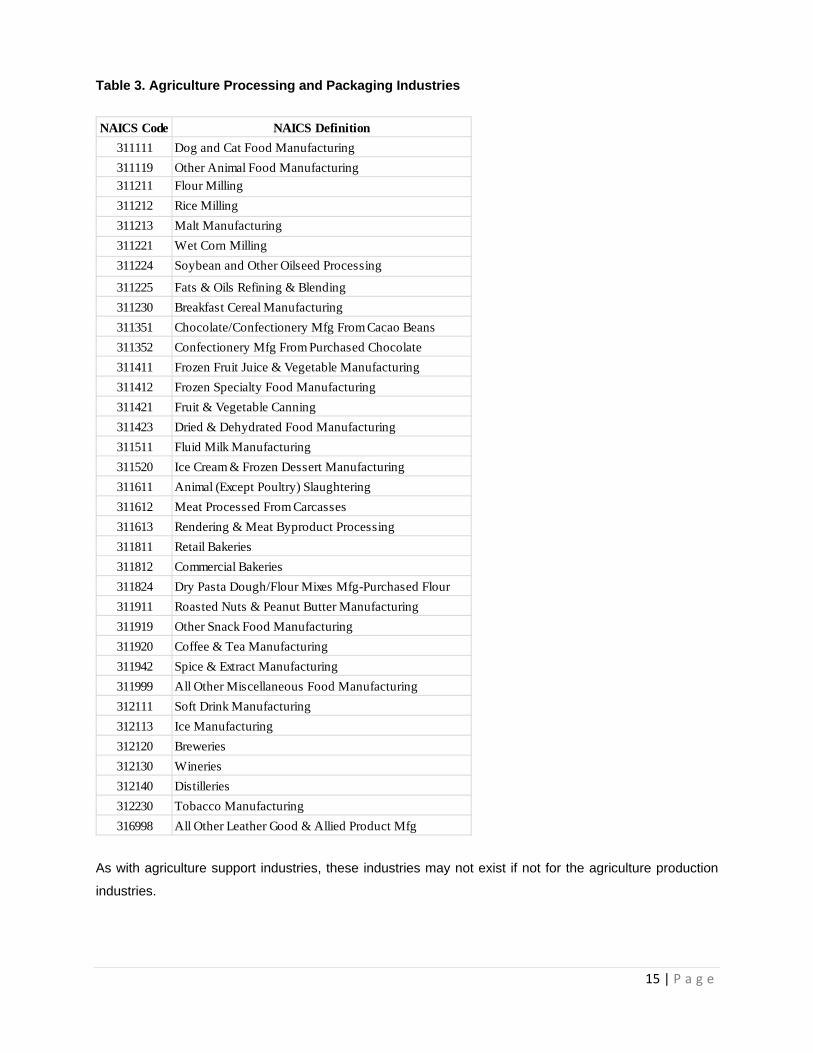
Agriculture Processing and Packaging Industries
The agriculture processing and packaging area is the changing of products of the agriculture production
industries into processed forms for consumers. This area includes breweries, bakeries, meat processing
and other industries as summarized in Table 3.
NAICS Code NAICS Definition
325199 All Other Basic Organic Chemical Manufacturing
325311 Nitrogenous Fertilizer Manufacturing
325314 Fertilizer (Mixing Only) Manufacturing
325320 Pesticide & Other Agricultural Chemical Mfg
333111 Farm Machinery & Equipment Manufacturing
333241 Food Product Machinery Manufacturing
423820 Farm & Garden Machinery & Equip Merchant Whlsrs
424910 Farm Supplies Merchant Wholesalers
493120 Refrigerated Warehousing & Storage
541320 Landscape Architectural Services
541370 Surveying & Mapping (Except Geophysical) Services
541940 Veterinary Services
561710 Exterminating & Pest Control Services
561730 Landscaping Services
15 | P a g e
Table 3. Agriculture Processing and Packaging Industries
As with agriculture support industries, these industries may not exist if not for the agriculture production
industries.
NAICS Code NAICS Definition
311111 Dog and Cat Food Manufacturing
311119 Other Animal Food Manufacturing
311211 Flour Milling
311212 Rice Milling
311213 Malt Manufacturing
311221 Wet Corn Milling
311224 Soybean and Other Oilseed Processing
311225 Fats & Oils Refining & Blending
311230 Breakfast Cereal Manufacturing
311351 Chocolate/Confectionery Mfg From Cacao Beans
311352 Confectionery Mfg From Purchased Chocolate
311411 Frozen Fruit Juice & Vegetable Manufacturing
311412 Frozen Specialty Food Manufacturing
311421 Fruit & Vegetable Canning
311423 Dried & Dehydrated Food Manufacturing
311511 Fluid Milk Manufacturing
311520 Ice Cream & Frozen Dessert Manufacturing
311611 Animal (Except Poultry) Slaughtering
311612 Meat Processed From Carcasses
311613 Rendering & Meat Byproduct Processing
311811 Retail Bakeries
311812 Commercial Bakeries
311824 Dry Pasta Dough/Flour Mixes Mfg-Purchased Flour
311911 Roasted Nuts & Peanut Butter Manufacturing
311919 Other Snack Food Manufacturing
311920 Coffee & Tea Manufacturing
311942 Spice & Extract Manufacturing
311999 All Other Miscellaneous Food Manufacturing
312111 Soft Drink Manufacturing
312113 Ice Manufacturing
312120 Breweries
312130 Wineries
312140 Distilleries
312230 Tobacco Manufacturing
316998 All Other Leather Good & Allied Product Mfg

16 | P a g e
Agriculture Distribution Industries
The agriculture distribution area includes the trade industries related to agriculture culture as summarized
in Table 4 below. It may also include logistics, warehousing, and transportation activities associated with
the agriculture sector. However, as these activities are also conducted for industries outside of the
agriculture sector, these activities are not included in the definition of an agriculture cluster.
Table 4. Agriculture Distribution Industries
Agriculture Sector Performance
Industry Overview
The agriculture sector is an important component of the Nevada economy.
The agriculture production sector (classified as NAICS 11 and traditionally
considered the main agriculture sector) not only compares favorably to
national agriculture trends, it performs well compared to other economic
activities in Nevada. The sector is composed primary of livestock and crop
production, with a detailed breakdown by commodity provided in Graph 2.
NAICS Code NAICS Definition
424410 General Line Grocery Merchant Wholesalers
424420 Packaged Frozen Food Merchant Wholesalers
424430 Dairy Product (Exc Dried Or Canned) Mrchnt Whlsrs
424440 Poultry & Poultry Product Merchant Wholesalers
424450 Confectionery Merchant Wholesalers
424460 Fish & Seafood Merchant Wholesalers
424470 Meat & Meat Product Merchant Wholesalers
424480 Fresh Fruit & Vegetable Merchant Wholesalers
424490 Other Grocery & Related Products Merchant Whlsrs
424510 Grain & Field Bean Merchant Wholesalers
424520 Livestock Merchant Wholesalers
424590 Other Farm Product Raw Material Merchant Whlsrs
424720 Other Petroleum Merchant Wholesale
424810 Beer & Ale Merchant Wholesalers
424820 Wine & Distilled Alcoholic Beverage Mrchnt Whlsrs
424930 Flower, Nursery Stock/Florists Supls Mrchnt Whlsrs
444220 Nursery, Garden Center & Farm Supply Stores

17 | P a g e
Graph 2. Total Cash Receipts, by Commodity, Nevada-2010 (Nevada Agricultural Statistics, 2011)
Nevada’s agriculture production is not evenly distributed across the 17 counties. Table 5 below shows the
number of farms, land in farms and average farm size for each of the counties in the state.
The table shows that Churchill County has the highest number of farms with 529 farms. Elko County has
the highest amount of land in farms with 2.1 million acres. Eureka County has the biggest average farms
with an average land per farm of over 9,000 acres.
Cattle and Calves, 39%
Sheep and Lambs, 1%
Dairy Products, 19%
Other Livestock & Products, 2%
Wheat , 1%
All Hay, 18%
Potatoes, 2%
Vegetables, 13%
Other Crops, 5%
Total Cash Receipts by Commodity

18 | P a g e
Table 5. Farm Data by County, 2007 (Nevada Agricultural Statistics, 2011)
County Number of Farms
Land in Farms (acres)
Average Farm Size (acres)
Carson City 21 2,756 131
Churchill 529 131,448 248
Clark 193 88,381 458
Douglas 179 91,046 509
Elko 456 2,085,135 4,573
Esmeralda 19 24,943 1,313
Eureka 86 783,440 9,110
Humboldt 254 756,313 2,978
Lander 84 339,091 4,037
Lincoln 98 46,271 472
Lyon 325 260,660 802
Mineral 84 (D) (D)
Nye 173 90,868 525
Pershing 135 244,249 1,809
Storey 5 (D) (D)
Washoe 393 485,893 1,236
White Pine 97 (D) (D)
Total 3,131 5,865,392 1,873 (D) amount withheld to avoid disclosing data for invididual operators
Not only is there a size difference among Nevada counties, but counties tend to specialize in certain
commodities. For example, 18.6 percent of Alfalfa Hay, part of the third biggest commodity produced in
the state, is produced in Humboldt County, another 17.1 percent in Lyon County, 11.5 percent in Lander
County, and 9.7 percent in Pershing County. In total, 57.0 percent of all alfalfa production takes place in
these four counties, as shown below.

19 | P a g e
Table 6. Alfalfa Hay Production Data by County, 2010 (Nevada Agricultural Statistics, 2011)
County Acres Yield (tons/acre)
Production (tons)
Production % of Total
Churchill 22,000 5.00 110,000 9.1%
Douglas 10,000 4.10 41,000 3.4%
Elko 17,000 3.05 52,000 4.3%
Esmeralda 13,000 5.45 71,000 5.9%
Eureka 18,000 4.05 73,000 6.1%
Humboldt 52,000 4.30 224,000 18.6%
Lander 28,000 4.95 139,000 11.5%
Lincoln 14,000 4.00 56,000 4.7%
Lyon 44,000 4.70 206,000 17.1%
Pershing 31,000 3.75 117,000 9.7%
White Pine 14,000 3.50 49,000 4.1%
Other Counties 17,000 3.88 66,000 5.5%
Total 280,000 4.30 1,204,000
Cattle and calves production, the largest agricultural commodity produced in the state, is similarly
concentrated within a few counties. Elko County is the biggest producer of the Cattle and Calves commodity
with 29.3 percent of total state production, followed by Humboldt County with 14.1 percent of state total and
Churchill County with 8.3 percent. Overall, over 51.7 percent of total cattle production occurs in the three
counties.
Table 7. Cattle and Calves Inventory Data by County, 2011 (Nevada Agricultural Statistics, 2011)
CountyInventory (number
of head)Inventory as %
of TotalCarson City 1,000 0.2%Churchill 38,000 8.3%Clark 5,000 1.1%Douglas 14,500 3.2%Elko 135,000 29.3%Esmeralda 1,500 0.3%Eureka 25,500 5.5%Humboldt 65,000 14.1%Lander 23,500 5.1%Lincoln 17,000 3.7%Lyon 38,000 8.3%Mineral 3,000 0.7%Nye 30,500 6.6%Pershing 24,000 5.2%Storey - 0.0%Washoe 15,500 3.4%White Pine 23,000 5.0%Total 460,000
20 | P a g e
Comparison to US
In 2007 (latest state data from the US Department of Agriculture-USDA), Nevada had a total of 3,131 farms
with over 5.8 million acres dedicated to farming. The average size of Nevada farms of 1,873 acres was
considerably larger than the average US farm size of 418 acres. The average estimated market value of
land and buildings in Nevada was $1.1 million per farm, compared to $791,138 for the US average. The
average market value of Nevada agricultural products sold in 2007 was $163,931 per farm, compared to
$134,807 for the US average.
Additionally, in 2007 the agriculture production sector employed approximately 4,428 farm workers with a
total payroll of $65.1 million. The resulting payroll per worker amount was estimated at $14,710. Nationally,
a total of 2.6 million farm workers were employed in 2007, with total payroll of $21.9 billion, or a payroll per
worker of $8,298. Additionally, Nevada hired farm labor per farm of 5.36 compared closely to national hired
farm labor per farm of 5.46 (USDA, 2012).
Comparison to Other Nevada Sectors
Not only did the agriculture production sector outperform or match the national average, it compares
favorably to other economic sectors in Nevada. Using data by economic sector provided by the IMPLAN
(Impact Analysis for Planning) model, the agriculture sector can be compared to other Nevada economic
sectors in terms of output, labor income, total exports, total imports, and location quotient.
The IMPLAN model is a valuable tool in determining the impacts of economic sectors and is used
throughout this report. As a result, it is important to understand more about the model. The IMPLAN model
enables the construction of regional input-output models for any county or state in the United States. It is
a technique built around quantifying the interaction between industries and industry sub-sectors within an
economy.
The model is based on the theory that when new money enters a region through investments, revenue or
expenditures, some of it is re-spent one or more times in the regional economy, creating additional impacts.
IMPLAN estimates these impacts using specific data on what inputs are needed to produce the goods and
services for all identified industries. Data in the IMPLAN database is based on the US Department of
Commerce, Bureau of Economic Analysis (BEA) Covered Employment and Wages (CEW) program, the
County Business Pattern data provided by the US Census, and the Regional Economic Information System
data provided by the BEA. The IMPLAN model database also draws from secondary economic data at the
state and local level from a variety of public sources.
Data in the IMPLAN model is coded differently than the NAICS code system, though a bridge exists to allow
for the comparison of the two classification systems. Industries within the agriculture cluster correspond to
the following IMPLAN codes:

21 | P a g e
Table 8. IMPLAN Codes
Using data provided by the State of Nevada for the 2010 IMPLAN model, Tables 8 through 13 compare the
performance of the industries within the agriculture cluster to other industries within the state.
Output per Employee
Table 9 shows the top 25 Nevada industries by output per employee. Output per employee data for all
industries in the state is summarized in the appendices at the end of this report. Output is defined by
IMPLAN as “the value of industry production. In IMPLAN these are annual production estimates for the
year of the data set and are in producer prices. For manufacturers this would be sales plus/minus change
IMPLAN Code IMPLAN Definition
IMPLAN Code IMPLAN Definition
1 Oilseed farming 41 Dog and cat food manufacturing
2 Grain farming 42 Other animal food manufacturing
3 Vegetable and melon farming 43 Flour milling and malt manufacturing
4 Fruit farming 44 Wet corn milling
5 Tree nut farming 45 Soybean and other oilseed processing
6 Greenhouse, nursery, and floriculture production 46 Fats and oils refining and blending
7 Tobacco farming 47 Breakfast cereal manufacturing
8 Cotton farming 48 Sugar cane mills and refining
9 Sugarcane and sugar beet farming 49 Beet sugar manufacturing
10 All other crop farming 50 Chocolate and confectionery manufacturing from cacao beans
11 Cattle ranching and farming 51 Confectionery manufacturing from purchased chocolate
12 Dairy cattle and milk production 52 Nonchocolate confectionery manufacturing
13 Poultry and egg production 53 Frozen food manufacturing
14 Animal production, except cattle and poultry and eggs 54 Fruit and vegetable canning, pickling, and drying
15 Forest nurseries, forest products, and timber tracts 55 Fluid milk and butter manufacturing
16 Logging 56 Cheese manufacturing
17 Fishing 57 Dry, condensed, and evaporated dairy product manufacturing
18 Hunting and trapping 58 Ice cream and frozen dessert manufacturing
19 Support activities for agriculture and forestry 59 Animal (except poultry) slaughtering, rendering, and processing
60 Poultry processing
61 Seafood product preparation and packaging
62 Bread and bakery product manufacturing
319 Wholesale trade 63 Cookie, cracker, and pasta manufacturing
323 Retail - Building material and garden supply 64 Tortilla manufacturing
65 Snack food manufacturing
66 Coffee and tea manufacturing
67 Flavoring syrup and concentrate manufacturing
126 Other basic organic chemical manufacturing 68 Seasoning and dressing manufacturing
130 Fertilizer manufacturing 69 All other food manufacturing
131 Pesticide and other agricultural chemical manufacturing 70 Soft drink and ice manufacturing
203 Farm machinery and equipment manufacturing 71 Breweries
207 Other industrial machinery manufacturing 72 Wineries
319 Wholesale trade 73 Distilleries
340 Warehousing and storage 74 Tobacco product manufacturing
369 Architectural, engineering, and related services 94 Other leather and allied product manufacturing
379 Veterinary services
388 Services to buildings and dwellings
Agriculture Processing and Packaging Industries
IMPLAN Code IMPLAN Definition
IMPLAN Code IMPLAN Definition
Agriculture Production Industries
Agriculture Distribution Industries
Agriculture Support Industries

22 | P a g e
in inventory. For service sectors production = sales. For Retail and wholesale trade, output = gross margin
and not gross sales.” (IMPLAN, 2012) Output per employee is often referred to as “employee productivity.”
Table 9. Top 25 Industries by Output per Employee-Nevada
Industry Code Description Output Employment
Output per Employee
0 Total 183,729,971,997$ 1,487,063 123,552$ 115 Petroleum refineries 415,060,608 57 7,278,54245 Soybean and other oilseed processing 214,797,888 53 4,071,99467 Flavoring syrup and concentrate manufacturing 31,377,938 10 3,003,314
337 Transport by pipeline 40,879,392 23 1,764,894130 Fertilizer manufacturing 55,208,900 42 1,303,678117 Asphalt shingle and coating materials manufacturing 111,441,424 89 1,251,471276 Automobile manufacturing 136,509,680 109 1,250,526127 Plastics material and resin manufacturing 7,558,801 6 1,237,26741 Dog and cat food manufacturing 139,940,048 114 1,230,40942 Other animal food manufacturing 28,209,424 24 1,181,031
234 Electronic computer manufacturing 55,018,568 48 1,140,706126 Other basic organic chemical manufacturing 30,889,744 27 1,138,591138 Soap and cleaning compound manufacturing 26,777,138 24 1,131,889366 Lessors of nonfinancial intangible assets 777,665,728 736 1,057,171133 Pharmaceutical preparation manufacturing 529,497,184 516 1,025,84532 Natural gas distribution 1,282,179,840 1,327 966,478
123 Alkalies and chlorine manufacturing 124,019,920 129 959,235121 Industrial gas manufacturing 24,079,696 26 931,345111 Sanitary paper product manufacturing 388,610,656 464 838,24247 Breakfast cereal manufacturing 124,184,952 150 826,135
347 Sound recording industries 239,300,688 304 786,662176 Primary smelting and refining of nonferrous metal 52,928,572 69 763,588116 Asphalt paving mixture and block manufacturing 16,360,722 21 761,532125 All other basic inorganic chemical manufacturing 110,914,504 147 752,587118 Petroleum lubricating oil and grease manufacturing 23,916,728 32 746,774
The table shows that seven of the agriculture cluster industries are included in the top 25 Nevada industries
in terms of output per employee (highlighted in yellow). This includes a number of food manufacturing
industries, including Soybean and Other Oilseed Processing, Flavoring Syrup and Concentrate
Manufacturing, and Fertilizer Manufacturing industries. All of these industries are considerably more
productive than the state average output per employee of $123,552.

23 | P a g e
Table 10. Agriculture Cluster Output per Employee-Nevada
Industry Code Description Output Employ Output
45 Soybean and other oilseed processing 214,797,888$ 53 4,071,994$ 67 Flavoring syrup and concentrate 31,377,938 10 3,003,314
130 Fertilizer manufacturing 55,208,900 42 1,303,67841 Dog and cat food manufacturing 139,940,048 114 1,230,40942 Other animal food manufacturing 28,209,424 24 1,181,031
126 Other basic organic chemical 30,889,744 27 1,138,59147 Breakfast cereal manufacturing 124,184,952 150 826,13513 Poultry and egg production 383,668 1 732,72670 Soft drink and ice manufacturing 170,303,056 247 688,42871 Breweries 4,870,839 7 673,35166 Coffee and tea manufacturing 136,665,920 209 654,22755 Fluid milk and butter manufacturing 276,041,824 446 619,20968 Seasoning and dressing manufacturing 177,234,176 325 545,36665 Snack food manufacturing 11,731,769 22 538,58054 Fruit and vegetable canning etc 139,187,808 261 533,66473 Distilleries 2,493,586 5 513,57359 Animal (no poultry) processing 57,270,696 128 445,83058 Ice cream and frozen dessert 189,487,552 437 433,60063 Cookie, cracker, and pasta manufacturing 16,720,385 44 379,68051 Confectionery from purchased chocolate 66,802,576 196 341,07061 Seafood product preparation / packaging 10,068,521 30 335,98552 Nonchocolate confectionery 29,799,682 89 334,02753 Frozen food manufacturing 93,487,496 304 307,42369 All other food manufacturing 84,740,000 287 295,03610 All other crop farming 395,312,448 1,389 284,6803 Vegetable and melon farming 85,862,304 325 264,4714 Fruit farming 1,168,816 5 218,569
64 Tortilla manufacturing 13,577,219 67 201,978207 Other industrial machinery 9,254,150 47 196,36412 Dairy cattle and milk production 106,081,312 542 195,5596 Greenhouse, nursery, and floriculture 11,682,558 67 174,790
11 Cattle ranching and farming 217,091,408 1,263 171,940319 Wholesale trade businesses 5,859,927,040 36,427 160,86862 Bread and bakery product 206,969,408 1,326 156,0550 Total 183,729,971,997 1,487,063 123,5525 Tree nut farming 219,984 2 112,909
16 Commercial logging 4,548,193 41 110,317369 Architectural, engineering services 1,704,675,712 15,946 106,90594 Other leather and allied product 2,250,697 25 91,163
323 Retail Stores - Building and garden supply 609,654,464 7,731 78,8622 Grain farming 6,999,957 97 72,324
388 Services to buildings and dwellings 1,387,577,728 24,408 56,850379 Veterinary services 211,920,544 3,730 56,81217 Commercial Fishing 24,687,964 438 56,39314 Animal production, no cattle - poultry 15,846,335 287 55,23019 Support activities for agriculture and forestry 39,497,184 1,242 31,808

24 | P a g e
Table 10 compares output per employee for the agriculture cluster industries to the average amount for the
state (highlighted in green). Those industries above the Total line have output higher than state average,
and those below are lower. The table shows that 34 of 45 agriculture cluster industries (76 percent) have
employee productivity greater than the state average.
Labor Income per Employee
Table 11 shows the top 25 Nevada industries by labor income per employee. Labor income per employee
data for all industries in the state is summarized in the appendices at the end of this report. Labor income
is the sum of employee compensation and proprietor income, since many farms are owner operated.
IMPLAN defines employee compensation as “the total payroll cost of the employee paid by the employer.
This includes, wage and salary, all benefits (health, retirement, etc.) and employer paid payroll taxes (e.g.
employer side of social security, unemployment taxes, etc.).” Proprietor income is defined by IMPLAN as
“payments received by self-employed individuals and unincorporated business owners. This income also
includes the capital consumption allowance and is recorded on Federal Tax form 1040C.”

25 | P a g e
Table 11. Top 25 Industries by Labor Income per Employee-Nevada
Industry Code Description
Employee Compensation Proprietor Income Labor Income
Employment
Labor Income per Employee
0 Total 61,110,889,368$ 6,922,144,558$ 68,033,033,926$ 1,487,063 45,750$ 337 Transport by pipeline 1,362,891 25,247,192 26,610,083 23 1,148,843115 Petroleum refineries 6,303,051 4,558,390 10,861,440 57 190,467
117 Asphalt shingle and coating materials manufacturing 9,629,990 6,100,553 15,730,543 89 176,65267 Flavoring syrup and concentrate manufacturing 1,509,185 21,745 1,530,930 10 146,532
123 Alkalies and chlorine manufacturing 12,358,741 4,582,379 16,941,120 129 131,031127 Plastics material and resin manufacturing 542,298 255,343 797,640 6 130,562116 Asphalt paving mixture and block manufacturing 2,137,605 665,425 2,803,030 21 130,471
31Electric power generation, transmission, and distribution 362,066,304 7,147,269 369,213,573 2,930 126,027
141All other chemical product and preparation manufacturing 15,033,395 6,008,202 21,041,597 167 126,019
287 Guided missile and space vehicle manufacturing 25,434,684 12,006,194 37,440,878 302 124,17632 Natural gas distribution 158,659,760 2,595,077 161,254,837 1,327 121,550
125 All other basic inorganic chemical manufacturing 12,760,418 4,799,927 17,560,345 147 119,152140 Printing ink manufacturing 4,271,082 2,338,072 6,609,154 57 116,300181 All other forging, stamping, and sintering 5,784,705 59,332 5,844,037 54 107,94724 Mining gold, silver, and other metal ore 978,599,872 64,871,468 1,043,471,340 9,799 106,489
334 Transport by water 6,730,247 6,367,789 13,098,036 123 106,374160 Cement manufacturing 6,380,445 85,255 6,465,699 61 105,942
275All other miscellaneous electrical equipment and component manufacturing 29,421,924 (159,815) 29,262,109 277 105,587
284 Aircraft manufacturing 785,682 413,064 1,198,747 11 105,240381 Management of companies and enterprises 2,252,079,360 (167,666,864) 2,084,412,496 20,106 103,673111 Sanitary paper product manufacturing 33,399,684 14,297,798 47,697,482 464 102,885333 Transport by rail 60,919,760 2,103,707 63,023,467 616 102,390121 Industrial gas manufacturing 1,893,802 718,837 2,612,639 26 101,051432 Other state and local government enterprises 688,108,352 0 688,108,352 6,816 100,949317 All other miscellaneous manufacturing 583,561,280 7,360,215 590,921,495 5,869 100,686
Table 11 shows only one agriculture cluster industry falls in the top 25 industries in Nevada by labor income
per employee (highlighted in yellow). However, approximately 47 percent of all agriculture cluster industries
(21 out of 45) have labor income per employee greater than the state average of $45,750 as summarized
in the table below.

26 | P a g e
Table 12. Agriculture Cluster Labor Income per Employee-Nevada
DescriptionEmployee
Compensation Proprietor
Income Labor Income
Employmen Labor
Income per
Flavoring syrup and concentrate manufacturing 1,509,185 21,745 1,530,930 10 146,532
Greenhouse, nursery, and floriculture production 3,135,575 2,124,825 5,260,400 67 78,704Fertilizer manufacturing 2,538,425 624,184 3,162,610 42 74,680Other basic organic chemical manufacturing 1,360,644 569,435 1,930,080 27 71,142Wholesale trade businesses 2,295,387,136 266,693,296 2,562,080,432 36,427 70,335Fluid milk and butter manufacturing 30,399,710 379,863 30,779,573 446 69,044Vegetable and melon farming 10,445,844 11,968,357 22,414,201 325 69,040Breakfast cereal manufacturing 10,040,317 172,800 10,213,117 150 67,942Soybean and other oilseed processing 3,508,380 52,710 3,561,090 53 67,509Dog and cat food manufacturing 7,316,658 101,101 7,417,758 114 65,220Architectural, engineering, and related services 814,101,760 198,979,440 1,013,081,200 15,946 63,533
Fruit and vegetable canning, pickling, and drying 15,667,290 196,694 15,863,984 261 60,825Ice cream and frozen dessert manufacturing 25,380,744 355,050 25,735,794 437 58,891Fruit farming 133,709 180,041 313,749 5 58,671Poultry and egg production 22,634 7,077 29,711 1 56,742Seasoning and dressing manufacturing 16,946,936 259,576 17,206,512 325 52,946Commercial logging 1,634,101 524,496 2,158,597 41 52,357Soft drink and ice manufacturing 12,023,499 878,322 12,901,821 247 52,154Coffee and tea manufacturing 10,676,673 144,338 10,821,011 209 51,801Other animal food manufacturing 1,206,877 17,188 1,224,064 24 51,247Other industrial machinery manufacturing 2,201,518 16,793 2,218,311 47 47,070Total 61,110,889,368 6,922,144,558 68,033,033,926 1,487,063 45,750Animal (except poultry) slaughtering, rendering, and processing 5,611,503 70,569 5,682,071 128 44,233All other crop farming 28,902,958 28,503,746 57,406,704 1,389 41,341Seafood product preparation and packaging 1,190,170 23,837 1,214,007 30 40,511Breweries 258,498 28,542 287,039 7 39,681
Retail Stores - Building material and garden supply 271,752,768 18,285,626 290,038,394 7,731 37,518Confectionery manufacturing from purchased chocolate 6,781,971 108,412 6,890,383 196 35,180Veterinary services 98,721,984 30,791,846 129,513,830 3,730 34,720Tree nut farming 53,134 13,865 66,999 2 34,388Frozen food manufacturing 10,293,411 142,614 10,436,025 304 34,318Tortilla manufacturing 2,178,131 17,594 2,195,726 67 32,664Nonchocolate confectionery manufacturing 2,845,936 43,295 2,889,231 89 32,386Bread and bakery product manufacturing 41,049,544 545,866 41,595,410 1,326 31,363All other food manufacturing 8,515,761 112,176 8,627,937 287 30,040Support activities for agriculture and forestry 21,363,508 8,899,203 30,262,711 1,242 24,371Cookie, cracker, and pasta manufacturing 1,042,307 17,587 1,059,894 44 24,068Services to buildings and dwellings 502,095,136 52,711,172 554,806,308 24,408 22,731Commercial Fishing 6,480,706 2,271,730 8,752,436 438 19,992Other leather and allied product manufacturing 382,881 81,515 464,396 25 18,810Snack food manufacturing 402,358 5,073 407,431 22 18,704Distilleries 72,050 6,476 78,527 5 16,173Cattle ranching and farming 12,379,557 400,015 12,779,572 1,263 10,122Dairy cattle and milk production 4,587,248 289,511 4,876,759 542 8,990Animal production, except cattle and poultry and eggs 1,801,480 220,650 2,022,130 287 7,048Grain farming 181,863 264,680 446,543 97 4,614

27 | P a g e
Value of Imports
In an open economy, economic sectors trade outside of the local economy, purchasing goods and services
from outside of the region (imports) and selling goods and services to other sectors outside of the region
(exports). Industries importing goods and services from outside of the region are important to economic
development entities as importing creates an outflow of money that could otherwise be spent within the
economy. It is the goal of economic development to reduce the amount of imports into a region by attracting
or starting companies to produce the imported goods and services locally.
Table 13 compares the top 25 industries in Nevada by value of imports by industry. The table shows
Nevada businesses imported a total of $29.9 billion in 2010. Of the top 25 industries by imports, two are
part of the agriculture cluster.
Table 13. Top 25 Industries by Value of Imports –Nevada
Industry Code Description
Value of Imports
0 Total 29,852,733,104$ 24 Mining gold, silver, and other metal ore 942,744,163 32 Natural gas distribution 698,768,918 34 Construction of new nonresidential commercial and health care structures 891,873,466 36 Construction of other new nonresidential structures 976,595,283 37 Construction of new residential permanent site single- and multi-family structures 553,451,750 38 Construction of other new residential structures 372,334,818 39 Maintenance and repair construction of nonresidential structures 290,084,968 115 Petroleum refineries 342,705,517 317 All other miscellaneous manufacturing 495,031,350 319 Wholesale trade businesses 480,753,791 332 Transport by air 517,265,715 335 Transport by truck 257,863,626 351 Telecommunications 496,312,122 354 Monetary authorities and depository credit intermediation activities 373,881,426 355 Nondepository credit intermediation and related activities 311,126,443 356 Securities, commodity contracts, investments, and related activities 1,994,828,797 361 Imputed rental activity for owner-occupied dwellings 376,954,582 381 Management of companies and enterprises 505,001,212 388 Services to buildings and dwellings 392,289,079 394 Offices of physicians, dentists, and other health practitioners 652,247,596 397 Private hospitals 478,398,379 409 Amusement parks, arcades, and gambling industries 517,929,479 411 Hotels and motels, including casino hotels 2,455,858,530 413 Food services and drinking places 1,799,595,706 432 Other state and local government enterprises 530,864,243

28 | P a g e
Overall, Agriculture Production sectors (defined above) imported approximately $354 million in goods and
services into Nevada, which was 1.2 percent of all imports into the state. Agriculture Processing and
Packaging sectors imported another $1.2 billion in goods and services, 4.1 percent of total state imports.
Imports by other agriculture areas are not shown as they include imports for industries other than those
directly related to agricultural activities.
The above table is used to compare agricultural cluster industries to other state industries only; the
“Agriculture Cluster Economic Development” section of this report discusses the state’s import substitution
opportunities in further detail.
Value of Exports
Export enhancement attempts to increase export sales to buyers outside
the region. Export sales by Nevada’s industries bring dollars into the
economy to provide growth for future economic expansion. Economic
strategy seeks to expand the exports of specific sectors which could
enhance future economic development in the state.
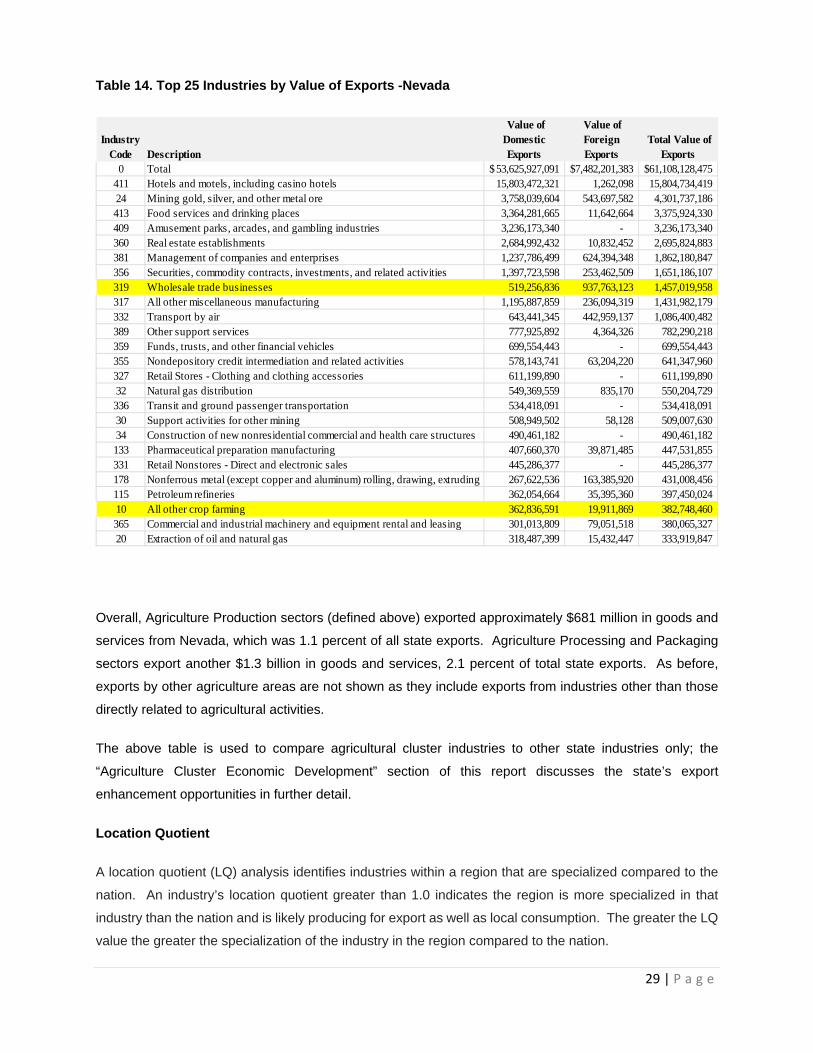
Table 14 compares the top 25 industries in Nevada by value of exports, both domestic and foreign, by
industry. The table shows Nevada businesses exported a total of $61.1 billion in 2010. Of the top 25
industries by value of imports, two are part of the agriculture cluster, including All Other Crop Farming, a
direct agricultural industry.
29 | P a g e
Table 14. Top 25 Industries by Value of Exports -Nevada
Overall, Agriculture Production sectors (defined above) exported approximately $681 million in goods and
services from Nevada, which was 1.1 percent of all state exports. Agriculture Processing and Packaging
sectors export another $1.3 billion in goods and services, 2.1 percent of total state exports. As before,
exports by other agriculture areas are not shown as they include exports from industries other than those
directly related to agricultural activities.
The above table is used to compare agricultural cluster industries to other state industries only; the
“Agriculture Cluster Economic Development” section of this report discusses the state’s export
enhancement opportunities in further detail.
Location Quotient
A location quotient (LQ) analysis identifies industries within a region that are specialized compared to the
nation. An industry’s location quotient greater than 1.0 indicates the region is more specialized in that
industry than the nation and is likely producing for export as well as local consumption. The greater the LQ
value the greater the specialization of the industry in the region compared to the nation.
Industry Code Description
Value of Domestic Exports
Value of Foreign Exports
Total Value of Exports
0 Total 53,625,927,091$ 7,482,201,383$ 61,108,128,475$ 411 Hotels and motels, including casino hotels 15,803,472,321 1,262,098 15,804,734,419 24 Mining gold, silver, and other metal ore 3,758,039,604 543,697,582 4,301,737,186 413 Food services and drinking places 3,364,281,665 11,642,664 3,375,924,330 409 Amusement parks, arcades, and gambling industries 3,236,173,340 - 3,236,173,340 360 Real estate establishments 2,684,992,432 10,832,452 2,695,824,883 381 Management of companies and enterprises 1,237,786,499 624,394,348 1,862,180,847 356 Securities, commodity contracts, investments, and related activities 1,397,723,598 253,462,509 1,651,186,107 319 Wholesale trade businesses 519,256,836 937,763,123 1,457,019,958 317 All other miscellaneous manufacturing 1,195,887,859 236,094,319 1,431,982,179 332 Transport by air 643,441,345 442,959,137 1,086,400,482 389 Other support services 777,925,892 4,364,326 782,290,218 359 Funds, trusts, and other financial vehicles 699,554,443 - 699,554,443 355 Nondepository credit intermediation and related activities 578,143,741 63,204,220 641,347,960 327 Retail Stores - Clothing and clothing accessories 611,199,890 - 611,199,890 32 Natural gas distribution 549,369,559 835,170 550,204,729 336 Transit and ground passenger transportation 534,418,091 - 534,418,091 30 Support activities for other mining 508,949,502 58,128 509,007,630 34 Construction of new nonresidential commercial and health care structures 490,461,182 - 490,461,182 133 Pharmaceutical preparation manufacturing 407,660,370 39,871,485 447,531,855 331 Retail Nonstores - Direct and electronic sales 445,286,377 - 445,286,377 178 Nonferrous metal (except copper and aluminum) rolling, drawing, extruding 267,622,536 163,385,920 431,008,456 115 Petroleum refineries 362,054,664 35,395,360 397,450,024 10 All other crop farming 362,836,591 19,911,869 382,748,460 365 Commercial and industrial machinery and equipment rental and leasing 301,013,809 79,051,518 380,065,327 20 Extraction of oil and natural gas 318,487,399 15,432,447 333,919,847

30 | P a g e
Changes in industry specialization are measured by comparing five-year trends of location quotients. The
specialization of industries changes over time and it is possible that highly specialized industries may be
actually decreasing in their specialization. Likewise, non-specialized industries may become more
specialized over time. Table 15 below summarizes the location quotient results by 2-digit NAICS code for
all major industry sectors in Nevada.
Table 15. Location Quotient by Major Industry, Nevada-2011 (DETR, 2011),1
Using location quotient data, a location quotient matrix can be developed to show whether industries are
more specialized than the nation and whether they are increasing or decreasing in their degree of
specialization. A location quotient matrix divides industries into four categories:
Stars-Star industries are those whose ratio of employment in the region is larger than that in the
nation and whose ratio of employment has increased over the five year period relative to the nation.
Star industries are specialized compared to the nation and are becoming more specialized.
1 Employment data available from DETR may not match employment data from IMPLAN shown later in the report due to differences in data collection for the two sources. DETR data may exclude sole proprietor data and include differences due to classification of businesses between IMPLAN and NAICS codes.
NAICS Code Definition
County Employment
by Sector (Eir)
Total County
Employment (Er)
National Employment
by Sector (Ein)
Total National
Employment (En)
Location Quotient (Eir/Er)/ (Ein/En)
% Change
from 2006
11 Agriculture, Forestry, Fishing and Hunting 2,262 1,108,882 1,179,871 129,673,330 0.22 6.76%21 Mining, Quarrying, and Oil and Gas Extraction 13,582 1,108,882 717,288 129,673,330 2.21 11.65%22 Utilities 5,553 1,108,882 807,027 129,673,330 0.80 -3.06%23 Construction 51,229 1,108,882 5,669,141 129,673,330 1.06 -45.81%
31 to 33 Manufacturing 37,972 1,108,882 11,710,267 129,673,330 0.38 1.23%42 Wholesale Trade 31,596 1,108,882 5,541,939 129,673,330 0.67 0.04%
44 to 45 Retail Trade 127,578 1,108,882 14,617,096 129,673,330 1.02 8.61%48 to 49 Transportation and Warehousing 49,728 1,108,882 4,964,304 129,673,330 1.17 18.11%
51 Information 13,311 1,108,882 2,691,241 129,673,330 0.58 9.41%52 Finance and Insurance 29,603 1,108,882 5,516,496 129,673,330 0.63 -7.14%53 Real Estate and Rental and Leasing 21,581 1,108,882 1,955,709 129,673,330 1.29 2.10%54 Professional, Scientific, and Technical Services 47,131 1,108,882 7,732,536 129,673,330 0.71 -6.13%55 Management of Companies and Enterprises 17,574 1,108,882 1,910,527 129,673,330 1.08 35.88%
56Administrative Support, Waste Management and Remediation Services
71,337 1,108,882 7,793,025 129,673,330 1.07 -4.17%
61 Educational Services 76,208 1,108,882 12,518,219 129,673,330 0.71 13.77%62 Health Care and Social Assistance 104,146 1,108,882 18,333,814 129,673,330 0.66 13.07%71 Arts, Entertainment, and Recreation 26,801 1,108,882 2,410,092 129,673,330 1.30 -6.42%72 Accommodation and Food Services 292,348 1,108,882 11,587,280 129,673,330 2.95 1.51%81 Other Services (except Public Administration) 27,965 1,108,882 4,457,781 129,673,330 0.73 8.06%92 Public Administration 60,692 1,108,882 7,359,028 129,673,330 0.96 8.01%99 Unclassified 685 1,108,882 200,649 129,673,330 0.40 -20.45%

31 | P a g e
Mature-Mature industries are those whose ratio of employment in the region is larger than that in
the nation and whose ratio of employment has decreased over the five year period relative to the
nation. Mature industries are still specialized compared to the nation, but are becoming less
specialized.
Emerging-Emerging industries are those whose ratio of employment in the region is less than that
in the nation, but whose ratio of employment has increased over the five year period relative to the
nation. These clusters are less specialized compared to the nation, but some of the emerging
industries may become specialized in the future.
Transforming-Transforming industries are those whose ratio of employment in the region is less
than that in the nation and whose ratio of employment has decreased over the five year period
relative to the nation. These clusters are less specialized in the region, and are unlikely to become
specialized in the future.
These categories are shown on the sample location quotient matrix below. On the x-axis (LQ Change), the
dividing line between Mature/Transforming and Stars/Emerging sectors is the zero line. On the y-axis (LQ
2011), the dividing line between Mature/Stars and Transforming/Emerging sectors is the 1.0 line.

32 | P a g e
The location quotient matrix for Nevada industries is shown below. The size of each bubble is determined
by the industry’s 2011 employment, allowing for the comparison of the size of the industry, as well as its
specialization and change in specialization between 2006 and 2011
Graph 3. Location Quotient Matrix for Major Industries-Nevada
The matrix shows that the Agriculture, Forestry, Fishing and Hunting industry is one of the Emerging
industries in Nevada. Though it does not have a high level of concentration with a 2011 LQ score of 0.22,
or a large number of employees, its LQ score grew by almost 7 percent between 2006 and 2011, showing
industry growth and potential for future concentration.
Summary
Overall, the agriculture cluster has an important impact on the state, supplying jobs, income, exports, and
spending in the state economy. The sector compares favorably to the national agriculture sector statistics
33 | P a g e
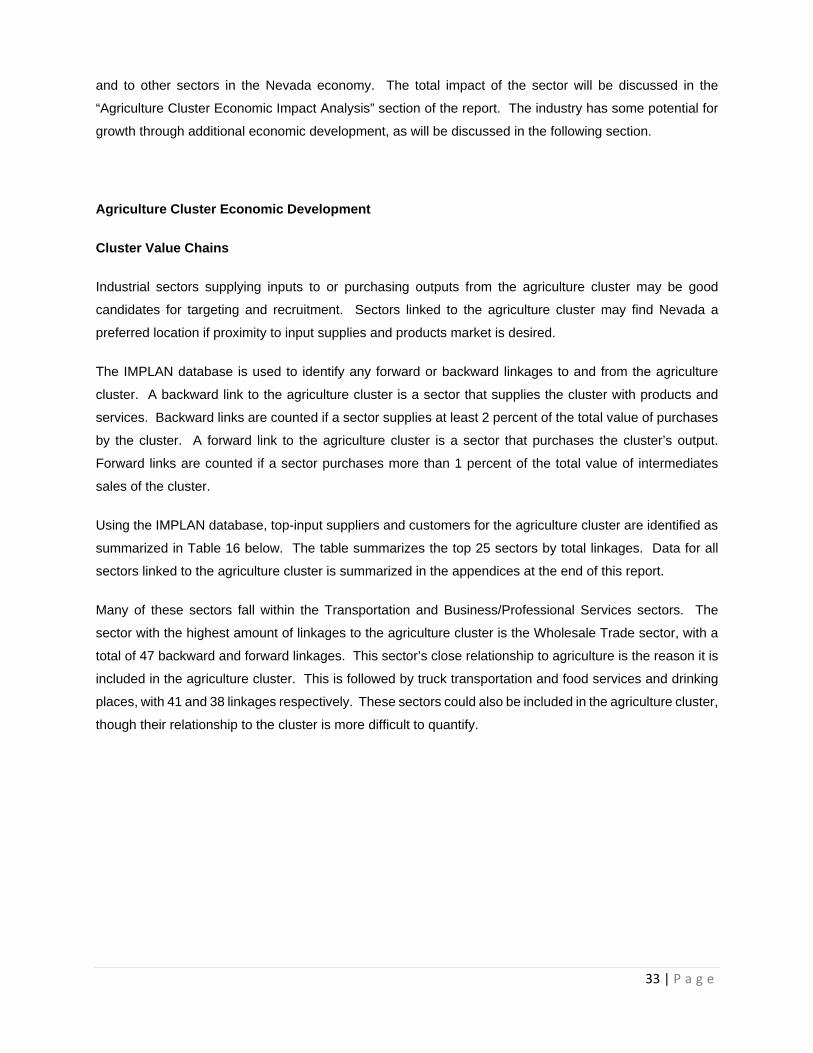
and to other sectors in the Nevada economy. The total impact of the sector will be discussed in the
“Agriculture Cluster Economic Impact Analysis” section of the report. The industry has some potential for
growth through additional economic development, as will be discussed in the following section.
Agriculture Cluster Economic Development
Cluster Value Chains
Industrial sectors supplying inputs to or purchasing outputs from the agriculture cluster may be good
candidates for targeting and recruitment. Sectors linked to the agriculture cluster may find Nevada a
preferred location if proximity to input supplies and products market is desired.
The IMPLAN database is used to identify any forward or backward linkages to and from the agriculture
cluster. A backward link to the agriculture cluster is a sector that supplies the cluster with products and
services. Backward links are counted if a sector supplies at least 2 percent of the total value of purchases
by the cluster. A forward link to the agriculture cluster is a sector that purchases the cluster’s output.
Forward links are counted if a sector purchases more than 1 percent of the total value of intermediates
sales of the cluster.
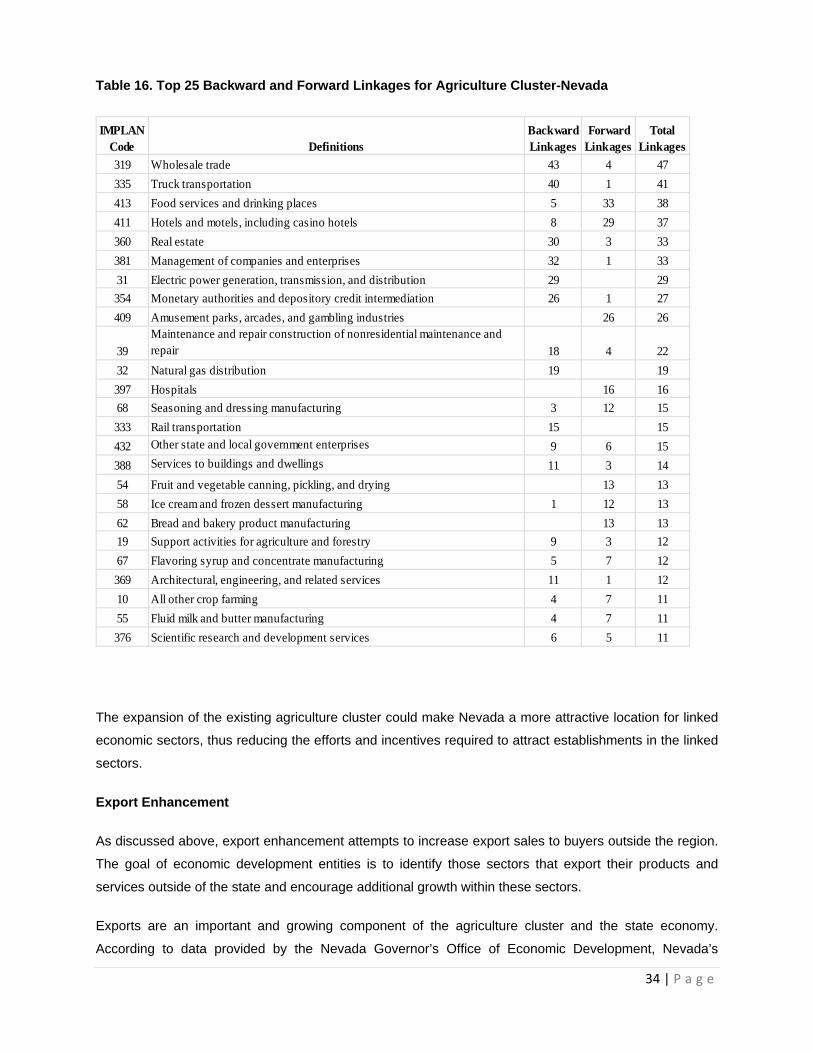
Using the IMPLAN database, top-input suppliers and customers for the agriculture cluster are identified as
summarized in Table 16 below. The table summarizes the top 25 sectors by total linkages. Data for all
sectors linked to the agriculture cluster is summarized in the appendices at the end of this report.
Many of these sectors fall within the Transportation and Business/Professional Services sectors. The
sector with the highest amount of linkages to the agriculture cluster is the Wholesale Trade sector, with a
total of 47 backward and forward linkages. This sector’s close relationship to agriculture is the reason it is
included in the agriculture cluster. This is followed by truck transportation and food services and drinking
places, with 41 and 38 linkages respectively. These sectors could also be included in the agriculture cluster,
though their relationship to the cluster is more difficult to quantify.
34 | P a g e
Table 16. Top 25 Backward and Forward Linkages for Agriculture Cluster-Nevada
IMPLAN Code Definitions
Backward Linkages
Forward Linkages
Total Linkages
319 Wholesale trade 43 4 47
335 Truck transportation 40 1 41
413 Food services and drinking places 5 33 38
411 Hotels and motels, including casino hotels 8 29 37
360 Real estate 30 3 33
381 Management of companies and enterprises 32 1 33
31 Electric power generation, transmission, and distribution 29 29
354 Monetary authorities and depository credit intermediation 26 1 27
409 Amusement parks, arcades, and gambling industries 26 26
39Maintenance and repair construction of nonresidential maintenance and repair 18 4 22
32 Natural gas distribution 19 19
397 Hospitals 16 16
68 Seasoning and dressing manufacturing 3 12 15
333 Rail transportation 15 15
432 Other state and local government enterprises 9 6 15
388 Services to buildings and dwellings 11 3 14
54 Fruit and vegetable canning, pickling, and drying 13 13
58 Ice cream and frozen dessert manufacturing 1 12 13
62 Bread and bakery product manufacturing 13 13
19 Support activities for agriculture and forestry 9 3 12
67 Flavoring syrup and concentrate manufacturing 5 7 12
369 Architectural, engineering, and related services 11 1 12
10 All other crop farming 4 7 11
55 Fluid milk and butter manufacturing 4 7 11
376 Scientific research and development services 6 5 11
The expansion of the existing agriculture cluster could make Nevada a more attractive location for linked
economic sectors, thus reducing the efforts and incentives required to attract establishments in the linked
sectors.
Export Enhancement
As discussed above, export enhancement attempts to increase export sales to buyers outside the region.
The goal of economic development entities is to identify those sectors that export their products and
services outside of the state and encourage additional growth within these sectors.
Exports are an important and growing component of the agriculture cluster and the state economy.
According to data provided by the Nevada Governor’s Office of Economic Development, Nevada’s

35 | P a g e
agricultural exports (classified as Miscellaneous Edible Preparations) grew by over 650 percent between
1997 and 2011, an average of 47 percent per year.
Graph 4. Agriculture Exports, Nevada 1997-2011 (GOED, 2012)
The total value of domestic and foreign exports for all agriculture cluster industries in Nevada is
$3,696,204,330. Not all of the exports can be attributed to the agriculture sector; for example, the Wholesale
Trade businesses sell products other than agriculture products and services, so the entire value of exports
cannot be attributed to the agriculture cluster. However, it does show that the agriculture cluster exports its
products and services outside of the state and provides a magnitude of these by sector.
Table 17 below shows commodities exported by agriculture cluster industries within Nevada. As noted
above, not all of these exports can be attributed to the agriculture sector.
According to the table, the agriculture cluster made up 6.05 percent of all Nevada exports in 2010. All other
crop farming provided 0.63 percent of all exports made in the state. Another high exporting industry was
Soybean and Other Oilseed Processing, with 0.341 percent of all state exports, followed by Seasoning and
Dressing manufacturing with 0.23 percent of exports.
$-
$10,000
$20,000
$30,000
$40,000
$50,000
$60,000
$70,000
$80,000
$90,000
$100,000
Thousands
Total Agriculture Revenue

36 | P a g e
Table 17. Agriculture Cluster Value of Exports-Nevada
Description Value of Domestic
Exports Value of Foreign
Exports Total Value of Exports % of TotalTotal all Nevada industries 53,625,927,091$ 7,482,201,383$ 61,108,128,475$ 100.000%Total all agriculture cluster industries 2,532,339,053 1,163,865,277 3,696,204,330 6.049%Wholesale trade businesses 519,256,836 937,763,123 1,457,019,958 2.384%All other crop farming 362,836,591 19,911,869 382,748,460 0.626%Soybean and other oilseed processing 176,588,725 31,808,381 208,397,106 0.341%Seasoning and dressing manufacturing 136,318,032 7,283,339 143,601,371 0.235%Cattle ranching and farming 143,382,908 2,107 143,385,014 0.235%Coffee and tea manufacturing 117,430,131 11,268,676 128,698,807 0.211%Fruit and vegetable canning 107,314,953 7,148,357 114,463,310 0.187%Ice cream and frozen dessert 110,759,974 1,841,529 112,601,503 0.184%Breakfast cereal manufacturing 93,902,228 4,870,539 98,772,767 0.162%Bread and bakery 71,757,357 4,667,512 76,424,869 0.125%Architectural, engineering 9,018,148 66,002,810 75,020,957 0.123%Fluid milk and butter 66,157,399 2,363,307 68,520,705 0.112%All other food 51,121,188 9,812,262 60,933,450 0.100%Frozen food 52,214,267 3,633,087 55,847,354 0.091%Dog and cat food 50,755,978 4,667,167 55,423,144 0.091%Dairy cattle and milk production 54,619,371 595 54,619,965 0.089%Fertilizer manufacturing 47,575,094 6,143,962 53,719,057 0.088%Confectionery from purchased chocolate 45,158,800 1,625,843 46,784,643 0.077%Animal (except poultry) processing 40,684,553 4,708,925 45,393,477 0.074%Services to buildings and dwellings 35,949,707 433,936 36,383,643 0.060%Other basic organic chemical 27,114,891 3,297,342 30,412,233 0.050%Support for agriculture forestry 28,834,564 43,658 28,878,222 0.047%Retail Stores 26,350,685 - 26,350,685 0.043%Other animal food 25,461,049 758,500 26,219,549 0.043%Nonchocolate confectionery 23,360,145 1,427,787 24,787,932 0.041%Commercial Fishing 9,850,063 14,023,172 23,873,236 0.039%Veterinary services 23,315,460 244,858 23,560,319 0.039%Vegetable and melon farming 13,808,540 9,714,217 23,522,758 0.038%Cookie, cracker, and pasta 9,064,447 271,394 9,335,842 0.015%Other industrial machinery 7,482,991 1,587,373 9,070,364 0.015%Seafood product prep and packaging 8,794,837 212,701 9,007,538 0.015%Greenhouse, nursery, and floriculture 8,337,842 257,543 8,595,385 0.014%Grain farming 5,102,308 1,771,631 6,873,939 0.011%Animal production, except cattle / poultry 5,910,306 362,063 6,272,369 0.010%Snack food manufacturing 5,894,863 138,833 6,033,696 0.010%Soft drink and ice manufacturing 2,700,486 1,320,508 4,020,994 0.007%Breweries 2,780,885 260,039 3,040,924 0.005%Other leather and allied product 1,282,981 904,132 2,187,114 0.004%Commercial logging 1,593,876 370,749 1,964,625 0.003%Flavoring syrup and concentrate 828,122 355,126 1,183,248 0.002%Tortilla manufacturing 828,261 77,531 905,792 0.001%Distilleries 402,441 214,416 616,857 0.001%Poultry and egg production 349,710 - 349,710 0.001%Fruit farming 43,812 169,773 213,584 0.0003%Tree nut farming 43,250 124,603 167,853 0.0003%

37 | P a g e
Understanding the industries within the agriculture sector cluster best positioned for exporting is the first
step in the export substitution strategy. This is followed by identifying the individual companies, within these
industries, that are interested in beginning or growing their exports.
Directory of “Best Case” Exporters
Staff at the Global Trade and Investment office of the Governor’s Office of Economic Development (GOED)
determined not only a list of many agriculture related industries that currently export, but also a list of
potential and interested best-case agriculture exporters in Nevada. This list will be used to create other
opportunities to expand already exporting companies, and to work with the companies interested in
exporting to understand and expedite the process. As this study is meant to be a living document, this list
is a beginning to help provide assistance to those that want to start exporting and those that want to export
more product and services.
It must be understood that this list is by no means representative of changing business strategies,
information sources, or influence of this or other reports. It is the desire to provide a starting point for all
support organizations and agencies to provide training and assistance to those that show an interest.
The recommendation to help link producers to export markets is to utilize the Nevada Investment and Trade
Organization (NITRO). A strategic initiative by the state of Nevada in cooperation with the Small Business
Administration (SBA), NITRO’s objective is to get more companies, particularly small and medium-sized
enterprises, to export. Through its export expertise, this organization is properly positioned to help with the
export information and training needs of the agriculture industry.
Import Substitution
Import substitution is another important aspect of economic development as it attempts to stop the outflow
of money from the state and provides information necessary to attract companies producing imported goods
and services. An important location consideration for many industries is the size of the local market for the
industry’s products. One measure of potential local market size is the dollar value of imports of an industry’s
product to Nevada. The potential to substitute for Nevada’s imports may make the region an attractive
location for companies.
Import information provided by the IMPLAN model can be used to identify potential “gaps” and “disconnects”
in the local economy that can serve as a starting point for economic development strategies. These “gaps”
and “disconnects” can occur for two reasons. First, a given industry in Nevada may demand a certain good
or service as an input into its production process. For some

38 | P a g e
industries, certain inputs may not be available in the Nevada economy and must be imported into the state.
This type of imports can be classified as a “gap” in a local economy.
Second, the good or service that a given industry may demand is produced in Nevada, but is also imported
for some reason. This type of import is often referred to as a “disconnect” in the local economy. An import
substitution analysis can identify these disconnects, providing information for the economic development
entities to investigate its causes.
It should be noted that while methods outlined in this report serve as a starting point to identify specific
industries, some gaps and disconnects are logical once they are further explored. In some instances
because of governmental, physical or other limitations, a gap cannot be addressed. A disconnect may not
be overcome, for example, if the quality of input required by a local business cannot be produced by the
local input supplier. Additional research and analysis must be performed for the individual industries to
determine the actual causes of the gaps and disconnects in the economy.
Non-Competitive Imports
The IMPLAN software estimates two types of imports. Non-competitive imports are imports for which there
is no production in the Nevada economy. Competitive imports are imports of goods and services that are
also produced locally.
Table 18 shows all non-competitive imports for Nevada, also known as “gaps”. Many of these are
agriculture-related products, including Wine and Brandies, Oilseeds, Refined Sugar, Cotton, Tanned and
Finished Leather and Hides, and Sugarcane and Sugar Beets. These are products for which no local
production is available and provide the first steps in identifying companies suitable for import substitution
efforts. The amount of imports for each product indicates the level of locally unmet demand for this product,
an important piece of information for producers of these products considering locating in the state.
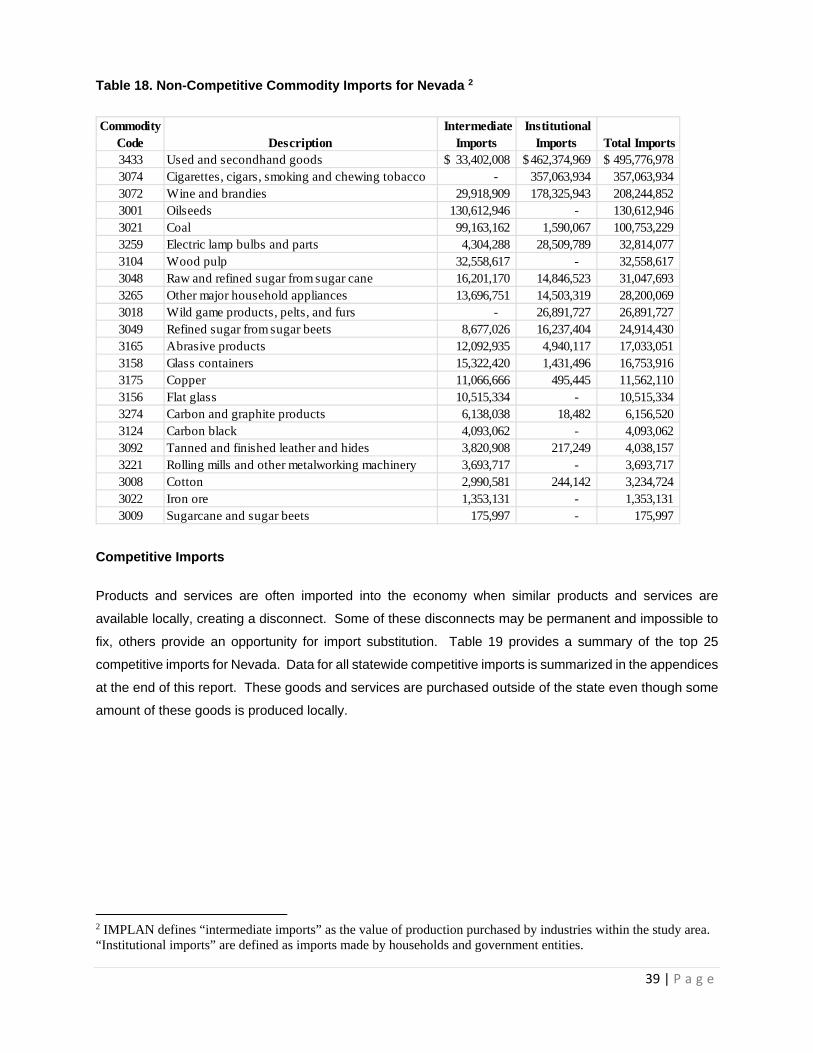
39 | P a g e
Table 18. Non-Competitive Commodity Imports for Nevada 2
Competitive Imports
Products and services are often imported into the economy when similar products and services are
available locally, creating a disconnect. Some of these disconnects may be permanent and impossible to
fix, others provide an opportunity for import substitution. Table 19 provides a summary of the top 25
competitive imports for Nevada. Data for all statewide competitive imports is summarized in the appendices
at the end of this report. These goods and services are purchased outside of the state even though some
amount of these goods is produced locally.
2 IMPLAN defines “intermediate imports” as the value of production purchased by industries within the study area. “Institutional imports” are defined as imports made by households and government entities.
Commodity Code Description
Intermediate Imports
Institutional Imports Total Imports
3433 Used and secondhand goods 33,402,008$ 462,374,969$ 495,776,978$ 3074 Cigarettes, cigars, smoking and chewing tobacco - 357,063,934 357,063,934 3072 Wine and brandies 29,918,909 178,325,943 208,244,852 3001 Oilseeds 130,612,946 - 130,612,946 3021 Coal 99,163,162 1,590,067 100,753,229 3259 Electric lamp bulbs and parts 4,304,288 28,509,789 32,814,077 3104 Wood pulp 32,558,617 - 32,558,617 3048 Raw and refined sugar from sugar cane 16,201,170 14,846,523 31,047,693 3265 Other major household appliances 13,696,751 14,503,319 28,200,069 3018 Wild game products, pelts, and furs - 26,891,727 26,891,727 3049 Refined sugar from sugar beets 8,677,026 16,237,404 24,914,430 3165 Abrasive products 12,092,935 4,940,117 17,033,051 3158 Glass containers 15,322,420 1,431,496 16,753,916 3175 Copper 11,066,666 495,445 11,562,110 3156 Flat glass 10,515,334 - 10,515,334 3274 Carbon and graphite products 6,138,038 18,482 6,156,520 3124 Carbon black 4,093,062 - 4,093,062 3092 Tanned and finished leather and hides 3,820,908 217,249 4,038,157 3221 Rolling mills and other metalworking machinery 3,693,717 - 3,693,717 3008 Cotton 2,990,581 244,142 3,234,724 3022 Iron ore 1,353,131 - 1,353,131 3009 Sugarcane and sugar beets 175,997 - 175,997

40 | P a g e
Table 19. Top 25 Competitive Commodity Imports for Nevada
The table shows the Processed Animal (except poultry) Meat and Rendered Byproducts animal commodity
is the only directly-related agriculture commodity included in the top 25 range for the state. The table shows
approximately $780 million of Processed Animal (except poultry) Meat and Rendered Byproducts goods
and services were imported into Nevada in 2010. Local Nevada industries produced only $58.6 million
worth of this commodity, indicating underproduction of this commodity locally, which may make Nevada an
attractive market for a company supplying this commodity and bears further discussion.
According to the IMPLAN database, the majority (98 percent) of the processed animal commodity is
produced by the animal (except poultry) slaughtering, rendering and processing industry (IMPLAN code
59). The industry shows annual sales of $57.3 million and employs 128 people with $5.6 million in employee
compensation (average of $43,683 per employee). What is also interesting is that $45.4 million worth of
the goods and services produced by this industry (79% of total production) is exported outside of Nevada.
There is a significant disconnect in this industry, with over $780 million of this industry’s product being
imported from outside the state and the majority of the industry’s local production exported outside the
state.
Commodity Code Description
Local Commodity Production
Intermediate Imports
Institutional Imports Total Imports
3000 Total 183,729,974,078$ 29,852,732,930$ 37,824,773,281$ 67,677,506,256$ 3115 Refined petroleum products 434,748,260 1,466,685,425 2,421,682,129 3,888,367,676 3357 Insurance 1,385,110,107 1,428,656,494 1,863,382,324 3,292,038,818 3133 Pharmaceutical preparations 505,919,647 259,230,438 2,083,356,445 2,342,586,914 3351 Telecommunications 2,261,397,949 1,053,639,771 626,910,461 1,680,550,293 3377 Advertising and related services 1,412,126,831 1,556,190,430 75,732,079 1,631,922,485 3319 Wholesale trade distribution services 5,859,927,246 365,180,695 968,043,701 1,333,224,365 3024 Gold, silver, and other metal ore 5,661,059,082 348,001,465 876,289,429 1,224,290,894 3031 Electricity, and distribution services 1,688,693,848 691,044,373 499,670,288 1,190,714,600 3397 Private hospital services 2,985,351,563 815,689 1,134,048,340 1,134,864,014 3020 Oil and natural gas 293,221,161 1,045,781,494 - 1,045,781,494 3374 Management, scientific, and technical consulting services 533,828,796 861,189,880 131,602,585 992,792,480 3398 Nursing and residential care services 703,032,471 - 859,905,640 859,905,640 3283 Motor vehicle parts 156,593,857 668,735,596 138,632,385 807,367,981 3059 Processed animal (except poultry) meat and rendered byproducts 58,612,110 210,017,365 570,386,658 780,404,053 3392 Education from private junior colleges, colleges, universities 156,864,365 14,841,932 740,123,840 754,965,759 3276 Automobiles 113,749,825 92,906 746,960,815 747,053,711 3354 Monetary authorities and depository credit intermediation services 3,707,124,268 381,917,542 338,314,941 720,232,483 3411 Hotels and motel services, including casino hotels 15,724,279,297 257,436,096 420,331,787 677,767,883 3277 Light trucks and utility vehicles 25,073,933 415,501 609,647,827 610,063,354 3352 Data processing- hosting- ISP- web search portals 214,036,209 97,239,738 480,088,715 577,328,430 3234 Electronic computers 67,816,559 4,773,818 528,989,563 533,763,367 3394 Offices of physicians, dentists, and other health practitioners 4,211,644,531 - 511,154,297 511,154,297 3359 Funds, trusts, and other financial services 1,159,851,563 53,411,003 443,106,293 496,517,303 3433 Used and secondhand goods - 33,402,008 462,374,969 495,776,978 3425 Civic, social, and professional services 776,103,271 155,831,833 336,414,551 492,246,399

41 | P a g e
Further research must be conducted to understand the reason for this disconnect. There may be locational,
physical, governmental or other constraints that may be precluding companies in this industry from locating
and operating in Nevada to meet the demand of local companies. If these constraints can be overcome
and production increased in existing companies or new companies are started or relocated to produce the
demanded commodity locally, the impact on the state can be significant.
For example, if 25 percent of the $780 million that is currently produced outside of Nevada and imported
into the state can be produced locally, it can have a direct increase on Nevada’s output of $195 million.
Applying indirect and induced multipliers for this industry (as supplied by IMPLAN), the total impact of a 25
percent increase in production in this industry can have a statewide effect of $360 million (including direct,
indirect and induced effects). Using existing employee productivity for the animal processing industry, an
increase in sales of $195 million is estimated to generate approximately 430 employees. Applying
employment multipliers for the animal processing industry will result in a total employment impact of
approximately 1,600 employees, including direct, indirect, and induced impacts.
Above is a basic example of the potential for growth that can be found in import substitution. It should be
noted, however, that the analysis is based on existing industry averages and does not take into account
the specifics that will accompany new or expanded companies within this industry. For more information
on the economic impact methodology, please see the “Agriculture Cluster Economic Impact Analysis”
section below.
Imports by Industry
The first part of the import substitution analysis discussed commodities that are imported by Nevada
industries. In order to reduce imports, Nevada economic development decision-makers need to know which
agriculture cluster industries are the largest importers in Nevada and the commodities these industries
import. Identifying these importers may provide some information as to why and what they import and how
their purchases can be transferred to local sources.

42 | P a g e
Table 20. Value of Agriculture Cluster Imports-Nevada
Table 20 shows the value of all agriculture cluster imports into Nevada. The Wholesale Trade sector is the
largest importer, followed by Services to Buildings and Dwellings and Architectural, Engineering and
Related Services. Table 21 shows top ten importers for Nevada and their top five imported commodities.
IMPLAN Code Definition Value of Imports319 Wholesale trade 480,753,791$ 388 Services to buildings and dwellings 392,289,079 369 Architectural, engineering, and related services 248,608,274 45 Soybean and other oilseed processing 177,237,549 10 All other crop farming 163,950,065 55 Fluid milk and butter manufacturing 117,264,241 70 Soft drink and ice manufacturing 112,909,333 68 Seasoning and dressing manufacturing 103,887,309 62 Bread and bakery product manufacturing 86,871,099 58 Ice cream and frozen dessert manufacturing 84,707,937 11 Cattle ranching and farming 83,494,976 41 Dog and cat food manufacturing 81,575,395 66 Coffee and tea manufacturing 80,076,331 54 Fruit and vegetable canning, pickling, and drying 73,020,949 323 Retail - Building material and garden supply 61,212,807 47 Breakfast cereal manufacturing 54,168,243 53 Frozen food manufacturing 52,308,761 12 Dairy cattle and milk production 49,927,670 69 All other food manufacturing 43,187,194 379 Veterinary services 41,977,220 51 Confectionery manufacturing from purchased chocolate 34,937,571 130 Fertilizer manufacturing 30,625,227 3 Vegetable and melon farming 25,651,097 59 Animal (except poultry) slaughtering, rendering, and processing 23,952,142 126 Other basic organic chemical manufacturing 22,134,082 42 Other animal food manufacturing 20,271,030 52 Nonchocolate confectionery manufacturing 17,414,482 67 Flavoring syrup and concentrate manufacturing 12,285,460 63 Cookie, cracker, and pasta manufacturing 9,917,322 17 Fishing 9,713,990 19 Support activities for agriculture and forestry 7,720,782 65 Snack food manufacturing 7,201,845 61 Seafood product preparation and packaging 6,104,801 64 Tortilla manufacturing 6,068,673 14 Animal production, except cattle and poultry and eggs 5,677,647 207 Other industrial machinery manufacturing 4,608,097 2 Grain farming 3,189,965 6 Greenhouse, nursery, and floriculture production 3,076,858 71 Breweries 2,843,855 73 Distilleries 1,275,880 94 Other leather and allied product manufacturing 1,023,475 16 Logging 965,385 4 Fruit farming 371,284 13 Poultry and egg production 272,703 5 Tree nut farming 64,209

43 | P a g e
Interviews with industry representatives regarding their purchases of these commodities can help identify
the reasons why these commodities are imported rather than purchased locally and provide information
regarding the types of companies which could be attracted to the area to meet the unmet local demand.
Table 21. Top 10 Agriculture Cluster Importers and Their Five Most Imported Commodities-Nevada
Industry Commodity Sector Value of Imports319-Wholesale trade
3377-Advertising and related services 52,893,124$ 3357-Insurance 39,894,182 3374-Management, scientific, and technical consulting services 27,663,209 3115-Refined petroleum products 25,826,266 3319-Wholesale trade distribution services 23,089,694
388-Services to buildings and dwellings 3115-Refined petroleum products 207,796,334$ 3357-Insurance 26,706,580 3351-Telecommunications 21,813,351 3374-Management, scientific, and technical consulting services 14,659,607 3283-Motor vehicle parts 10,561,469
369-Architectural, engineering, and related services3357-Insurance 33,023,180$ 3374-Management, scientific, and technical consulting services 26,526,689 3382-Employment services 13,317,830 3373-Other computer related services, including facilities management 12,159,185 3384-Office administrative services 11,580,742
45-Soybean and other oilseed processing
3001-Oilseeds 130,174,186$ 3045-Soybean oil and cakes and other oilseed products 24,718,102 3008-Cotton 2,265,918 3002-Grains 2,231,327 3319-Wholesale trade distribution services 1,920,881
10-All other crop farming 3019-Agriculture and forestry support services 40,436,669$ 3115-Refined petroleum products 33,179,947 3131-Pesticides and other agricultural chemicals 21,895,133 3130-Fertilizer 18,462,372 3002-Grains 12,294,203
55-Fluid milk and butter manufacturing 3012-Dairy cattle and milk products 60,202,852$ 3055-Fluid milk and butter 8,783,254 3127-Plastics materials and resins 6,349,501 3107-Paperboard containers 5,989,668 3149-Other plastics products 4,251,474
70-Soft drink and ice manufacturing 3067-Flavoring syrups and concentrates 32,478,541$ 3174-Aluminum products from purchased aluminum 17,602,671 3044-Corn sweetners, corn oils, and corn starches 14,087,384 3148-Plastics bottles 12,814,472 3107-Paperboard containers 8,353,708

44 | P a g e
Agriculture Cluster Economic Impact Analysis
The objective of the economic impact analysis is to estimate the total economic impact of the agriculture
cluster in Nevada in terms of dollar output, and jobs created and supported by the cluster.
The economic impacts of the agriculture cluster are analyzed through the use of an industry input-output
model (IMPLAN). Through this economic modeling software, the total economic and employment impact
of the agriculture cluster on the state is estimated. The following definitions of economic impact terms are
important to understand, as they are widely used in this analysis.
Employment:
Represents the total people (full-time equivalents) employed by the agriculture
cluster and the additional jobs in the regional economy supported by the cluster’s
economic activity.
Direct Economic
Impact:
Represents the expenditure amounts from the agriculture cluster that directly
impacts the regional economy. The direct impact includes operating and payroll
expenditures.
Indirect
Economic
Impact:
After expenditures are made by the agriculture cluster (direct impacts), the indirect
impacts represent the further iterations of expenditures from local vendors who
purchase goods and services from supplying vendors to restock inventory and fulfill
non-commodity needs. These purchases are also commonly referred to as the
“ripple effect”.
Industry Commodity Sector Value of Imports68-Seasoning and dressing manufacturing
3010-All other crop farming products 13,829,871$ 3067-Flavoring syrups and concentrates 13,484,787 3068-Seasonings and dressings 10,336,600 3046-Shortening and margarine and other fats and oils products 7,163,107 3044-Corn sweetners, corn oils, and corn starches 5,043,577
62-Bread and bakery product manufacturing 3043-Flour and malt 19,823,832$ 3044-Corn sweetners, corn oils, and corn starches 14,693,413 3046-Shortening and margarine and other fats and oils products 3,928,568 3107-Paperboard containers 3,797,866 3063-Cookies, crackers, and pasta 3,354,889
58-Ice cream and frozen dessert manufacturing 3107-Paperboard containers 13,449,886$ 3057-Dry, condensed, and evaporated dairy products 8,571,997 3055-Fluid milk and butter 5,888,016 3012-Dairy cattle and milk products 5,112,285 3044-Corn sweetners, corn oils, and corn starches 4,685,947

45 | P a g e
Induced
Economic
Impact:
The direct and indirect impacts from expenditures generate and support
employment and wages in the region, leading to a tertiary level of economic impact
through household expenditures on goods and services. The induced impacts
reflect the local spending from households that benefit from the direct and indirect
expenditures.
Total Economic
Impact:
Represents the sum of the direct, indirect, and induced economic impacts on the
economy in the area of study.
Multipliers:
Multipliers are used by the economic impact model to calculate the indirect and
induced effects. Multipliers are based on federal surveys of each industrial sector,
quantifying the cause and effect of industries purchasing from other industries.
The IMPLAN model provides data for each industry within the model, including employment, output,
employee compensation, proprietor income and more. This data is collected for all of the industries within
the agriculture cluster to estimate the impact of the cluster on the output and employment in Nevada.
Output data provided by IMPLAN for each industry was adjusted for the value of imports purchased by that
industry from outside of the region. This was done to exclude any portion of the industry’s output leaving
the state, allowing for only the “local” impact of each industry to be considered.
The difficulty in estimating the impact of multiple related industries is that the impact of the purchases made
by each industry from other industries within the cluster is included in the impact of both industries, thus
double-counting the impact on the state. As a result, the purchases of industries from other industries
within the agriculture cluster were adjusted to avoid overestimating the impact of the cluster.
Finally, because of the difference between the NAICS and IMPLAN classifications of industries, some
industries directly related to the agriculture cluster by their 6-digit NAICS code definition are included in an
IMPLAN code with other non-agriculture related industries. To estimate the impact of only the agriculture-
related industries, data for the entire IMPLAN industry was adjusted based on the percent of agriculture
cluster employment in the 6-digit NAICS sectors associated with the single IMPLAN sector.
For example, agriculture related employment makes up approximately 26 percent of the total Wholesale
Trade (IMPLAN sector 319) employment. As a result, IMPLAN data for employment and output in that
sector was adjusted to 26 percent. This was also done for the Retail, Building Material and Garden Supply
(IMPLAN 323), Warehousing and Storage (IMPLAN 340), Architectural Services (IMPLAN 369), and
Services to Buildings (IMPLAN 388) sectors.
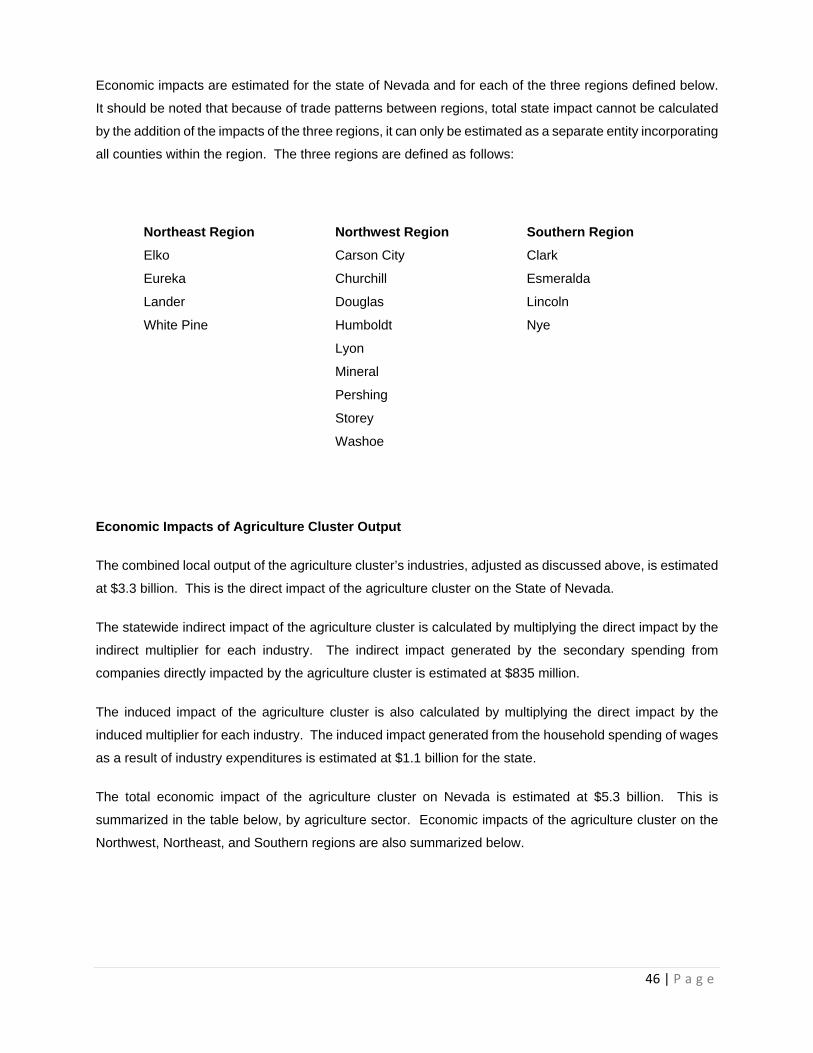
46 | P a g e
Economic impacts are estimated for the state of Nevada and for each of the three regions defined below.
It should be noted that because of trade patterns between regions, total state impact cannot be calculated
by the addition of the impacts of the three regions, it can only be estimated as a separate entity incorporating
all counties within the region. The three regions are defined as follows:
Northeast Region Northwest Region Southern Region
Elko Carson City Clark
Eureka Churchill Esmeralda
Lander Douglas Lincoln
White Pine Humboldt Nye
Lyon
Mineral
Pershing
Storey
Washoe
Economic Impacts of Agriculture Cluster Output
The combined local output of the agriculture cluster’s industries, adjusted as discussed above, is estimated
at $3.3 billion. This is the direct impact of the agriculture cluster on the State of Nevada.
The statewide indirect impact of the agriculture cluster is calculated by multiplying the direct impact by the
indirect multiplier for each industry. The indirect impact generated by the secondary spending from
companies directly impacted by the agriculture cluster is estimated at $835 million.
The induced impact of the agriculture cluster is also calculated by multiplying the direct impact by the
induced multiplier for each industry. The induced impact generated from the household spending of wages
as a result of industry expenditures is estimated at $1.1 billion for the state.
The total economic impact of the agriculture cluster on Nevada is estimated at $5.3 billion. This is
summarized in the table below, by agriculture sector. Economic impacts of the agriculture cluster on the
Northwest, Northeast, and Southern regions are also summarized below.

47 | P a g e
Table 22. Economic Impacts of the Agriculture Cluster Output-Nevada
Table 23. Economic Impacts of the Agriculture Cluster Output-Northwest Region
Table 24. Economic Impacts of the Agriculture Cluster Output-Northeast Region
Table 25. Economic Impacts of the Agriculture Cluster Output-Southern Region
Agriculture Sectors Direct Impact Indirect Impact Induced Impact Total Impact
Agriculture Production 461,182,816$ 156,763,876$ 102,142,342$ 720,089,034$
Agriculture Processing and Packaging 769,039,911 260,620,365 137,706,227 1,167,366,503
Agriculture Support 649,161,916 161,112,719 283,444,219 1,093,718,855
Agriculture Distribution 1,438,369,071 256,557,126 596,690,258 2,291,616,455
Total Agriculture Cluster 3,317,753,714$ 835,054,087$ 1,119,983,046$ 5,272,790,847$
Agriculture Sectors Direct Impact Indirect Impact Induced Impact Total Impact
Agriculture Production 245,545,329$ 81,154,895$ 61,952,742$ 388,652,966$
Agriculture Processing and Packaging 513,687,567 216,615,105 85,040,235 815,342,908
Agriculture Support 188,051,023 50,084,123 79,326,971 317,462,116
Agriculture Distribution 347,568,945 68,743,786 142,211,139 558,523,869
Total Agriculture Cluster 1,294,852,864$ 416,597,908$ 368,531,088$ 2,079,981,860$
Agriculture Sectors Direct Impact Indirect Impact Induced Impact Total Impact
Agriculture Production 91,071,752$ 24,611,730$ 6,739,921$ 122,423,404$
Agriculture Processing and Packaging 2,464,149 277,357 96,502 2,838,007
Agriculture Support 8,030,735 1,100,457 1,291,696 10,422,888
Agriculture Distribution 78,143,018 5,694,192 15,530,777 99,367,987
Total Agriculture Cluster 179,709,653$ 31,683,736$ 23,658,896$ 235,052,286$
Agriculture Sectors Direct Impact Indirect Impact Induced Impact Total Impact
Agriculture Production 54,882,836$ 16,404,500$ 13,708,629$ 84,754,165$
Agriculture Processing and Packaging 433,394,959 143,268,475 88,777,658 512,656,451
Agriculture Support 533,534,082 129,468,085 239,989,612 902,991,779
Agriculture Distribution 966,223,083 169,333,061 408,154,452 1,543,710,596
Total Agriculture Cluster 1,988,034,960$ 458,474,121$ 750,630,350$ 3,044,112,991$

48 | P a g e
Graphs 5-8 below show the percentage of the three regions’ impacts on each of the agriculture sectors.
The graphs show total impacts (direct, indirect and induced) of each sector’s operations.
Graph 5 shows that the Northwest Region generates the largest percentage of all Agriculture Production
impacts in the state at 65 percent of total. This is followed the Northeast Region with 21 percent of total
Agriculture Production impact, and Southern Region with 14 percent.
Graph 5: Agriculture Production Impacts, by Region
Graph 6 shows the total impacts of the Agriculture Processing and Packaging activities, by region. The
Northwest Region, again, has the highest impact in this area, with 61 percent of total statewide impact.
This is followed by the Southern Region with 39 percent of total and the Northeast region with 0.2 percent
of total.
Graph 6: Agriculture Processing and Packaging Impacts, by Region
Southern Region14%
Northeast Region21%
Northwest Region 65%
AGRICULTURE PRODUCTION
Southern Region39%
Northeast Region0.2%
Northwest Region 61%
AGRICULTURE PROCESSING AND
PACKAGING

49 | P a g e
Graph 7 shows the Southern Region provides the majority of impacts of Agriculture Support with 73 percent,
followed by the Northwest Region with 26 percent of total and the Northeast Region with 0.8 percent of
total.
Graph 7: Agriculture Support Impacts, by Region
Graph 8 shows the Southern Region again provides the majority of impacts of Agriculture Distribution with
70 percent of total impact generated by this activity. This is followed by the Northwest Region with 25
percent of total and the Northeast Region with 4.5 percent of total.
Graph 8: Agriculture Distribution Impacts, by Region
The above graphs show that regions are specialized, with the Northwest and Northeast regions providing
the majority of agriculture production, the Northwest Region also providing the majority of processing and
packaging services, and the Southern Region focusing on support and distribution activities within the state.
Southern Region73%
Northeast Region0.8%
Northwest Region 26%
AGRICULTURE SUPPORT
Southern Region70%
Northeast Region4.5%
Northwest Region 25%
AGRICULTURE DISTRIBUTION

50 | P a g e
The next set of graphs provides the same information for each region, by agriculture area. Graph 9 shows
the portion of the impact of each agriculture area on the State of Nevada. Graphs 10 through 12 show the
portion of the impact of each agriculture area on each region within the state. Graph 13 provides a
comparison of the size of the impact of each agriculture area on the state, by geographic region.
Graph 9: Economic Impact of Northwest Region, by Agriculture Area
Graph 10: Economic Impact of Northeast Region, by Agriculture Area
Agriculture Production
19%
Processing and
Packaging39%
Agriculture Support
15%
Agriculture Distribution
27%
Agriculture Production
52%
Processing and
Packaging1%
Agriculture Support
5%
Agriculture Distribution
42%
NORTHWEST REGION
NORTHEAST REGION
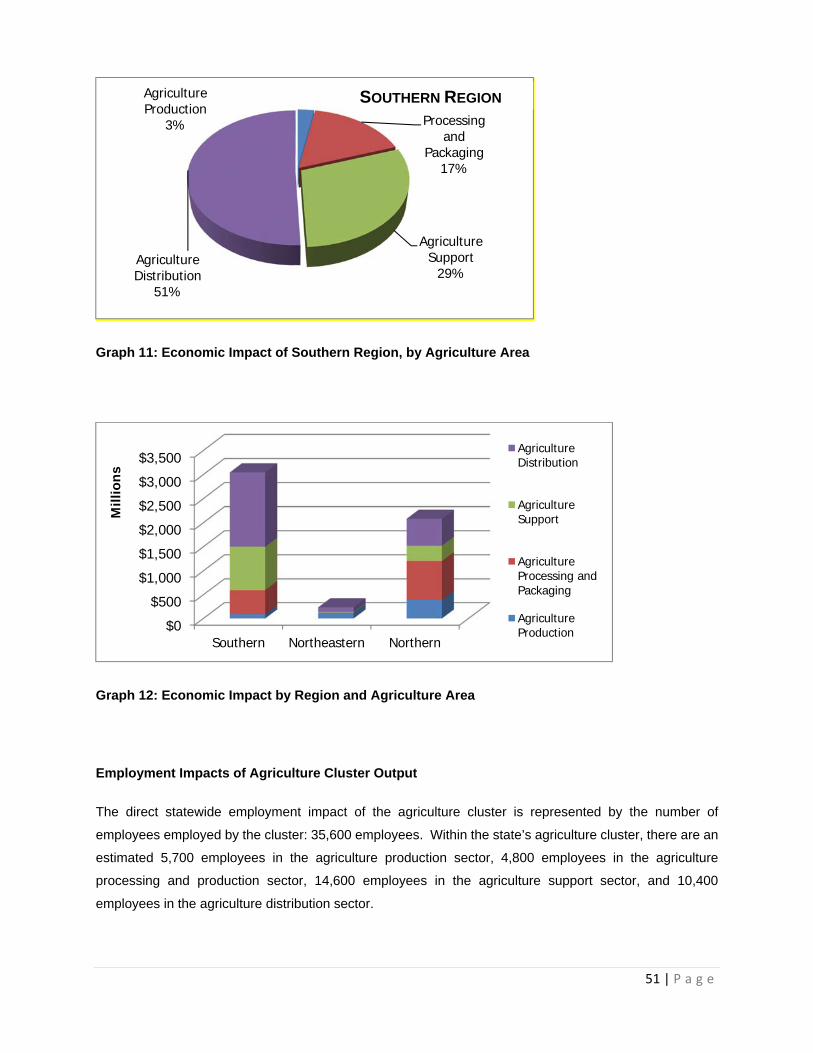
51 | P a g e
Graph 11: Economic Impact of Southern Region, by Agriculture Area
Graph 12: Economic Impact by Region and Agriculture Area
Employment Impacts of Agriculture Cluster Output
The direct statewide employment impact of the agriculture cluster is represented by the number of
employees employed by the cluster: 35,600 employees. Within the state’s agriculture cluster, there are an
estimated 5,700 employees in the agriculture production sector, 4,800 employees in the agriculture
processing and production sector, 14,600 employees in the agriculture support sector, and 10,400
employees in the agriculture distribution sector.
Agriculture Production
3% Processing and
Packaging17%
Agriculture Support
29%Agriculture Distribution
51%
$0$500
$1,000$1,500$2,000$2,500$3,000$3,500
Southern Northeastern Northern
Mill
ions
AgricultureDistribution
AgricultureSupport
AgricultureProcessing andPackaging
AgricultureProduction
SOUTHERN REGION

52 | P a g e
When the agriculture industry purchases goods and services from its vendors, those vendors hire new
employees to meet the new level of demand or retain jobs which may otherwise be eliminated. This is the
indirect employment impact; the agriculture cluster has an estimated indirect employment impact on the
state of 11,500 employees.
The employment impacts from the spending of household wages created by the direct and indirect
expenditures support an estimated 13,600 jobs in Nevada.
The total employment impact of the agriculture cluster on Nevada is estimated at 60,700. This is
summarized in the table below, by the agriculture area. Impacts of the agriculture cluster on the Northwest,
Northeast, and Southern regions in Nevada are also summarized below.
Table 26. Employment Impacts of the Agriculture Cluster Output-Nevada
Table 27. Employment Impacts of the Agriculture Cluster Output-Northern Region
Table 28. Employment Impacts of the Agriculture Cluster Output-Northeast Region
Agriculture Sectors Direct Impact Indirect Impact Induced Impact Total Impact
Agriculture Production 5,697 2,425 1,540 9,663
Agriculture Processing and Packaging 4,807 4,572 3,123 12,502
Agriculture Support 14,645 1,979 3,335 19,959
Agriculture Distribution 10,428 2,492 5,630 18,550
Total Agriculture Cluster 35,577 11,468 13,628 60,673
Agriculture Sectors Direct Impact Indirect Impact Induced Impact Total Impact
Agriculture Production 3,675 1,449 1,030 6,155
Agriculture Processing and Packaging 1,930 2,726 1,548 6,204
Agriculture Support 4,651 690 1,006 6,347
Agriculture Distribution 2,784 705 1,420 4,910
Total Agriculture Cluster 13,040 5,571 5,004 23,615
Agriculture Sectors Direct Impact Indirect Impact Induced Impact Total Impact
Agriculture Production 1,063 422 136 1,622
Agriculture Processing and Packaging 31 11 5 47
Agriculture Support 182 23 22 226
Agriculture Distribution 571 66 169 806
Total Agriculture Cluster 1,846 522 332 2,701

53 | P a g e
Table 29. Employment Impacts of the Agriculture Cluster Output-Southern Region
Agriculture Sectors Direct Impact Indirect Impact Induced Impact Total Impact
Agriculture Production 959 277 207 1,442
Agriculture Processing and Packaging 2,846 2,049 1,640 6,536
Agriculture Support 11,842 1,550 2,760 16,151
Agriculture Distribution 6,872 1,626 3,797 12,294
Total Agriculture Cluster 22,519 5,501 8,404 36,424

54 | P a g e
“Anyone who travels through Nevada can see the vast, open spaces
… some of the world’s richest gold mines, highest quality hay,
finest cow-calf operations and even world renowned onion production”

55 | P a g e
4. FUTURE AGRICULTURE OPPORTUNITIES
Nevada’s unique climate, marked by vast temperature swings and arid and semi-arid landscapes, allows
many crops to grow well in Nevada. “Anyone who travels through Nevada can see the vast, open spaces
that are such an important part of the state’s persona. Within that vastness are some of the world’s richest
gold mines, highest quality hay, finest cow-calf operations and even world renowned onion production”
(Singletary & Smith, 2006).
For the past 10 to 15 years, Nevada has been looking for the “silver dollar agriculture opportunity,” according
to Jay Davison of University of Nevada Cooperative Extension (UNCE). This report highlights a few possible
“silver dollar” agriculture opportunities in Nevada. These opportunities are by no means definitive. Nevada
farms may see increased success by offering tourist elements to farming operations (Curtis & Johnson,
2005), for example, but it is impossible to cover in this report every feasible way for operations to expand.
Moreover, new and alternative crops carry inherent risks to producers. “Being successful in growing and
marketing an alternative crop is not easy. If it were, Nevada agriculture would be much more diverse”
(Davison, 2002).
The following are potential areas for the state’s agricultural producers to consider for further development,
expansion, or diversification:
Hoop House or High Tunnel Technology
New Crops
Alternative Crops
Expansion Opportunities
Aquaculture
Hoop House or High Tunnel Technology
Recent university studies have tested the feasibility of hoop houses in the production of vegetables, fruits
and flowers in areas where growing seasons are short or limited by temperatures, rainfall, snowfall, pests,
and winds. The three universities used in this study for their hoop house or high tunnel success are
University of Nevada, Michigan State University, and Utah State University. Each university has produced
multiple studies focusing on style of construction, materials, soil preparation, crop choice, and documented
cost and return.
University of Nevada, Reno (UNR), has been growing in hoop houses in southeastern Nevada for several
years and plans to start hoop house growing in northern Nevada in the fall of 2012, through the High Desert
Farming Initiative, in which $500,000 was funded by U.S. Department of Housing and Urban Development.

56 | P a g e
Conservative Cost and Return, Cost Summary and Monthly Cash Flow reports for UNR hoop houses are
available (Appendix A).
The Michigan State University (MSU) has one of the greatest success models and has been growing in
high tunnels since 2006. MSU is most noted for their Business Plan Model (Appendix B).
The Utah State University (USU) has had great success in growing berries, tomatoes, and salad greens.
They are most noted for their Low Cost Construction of High Tunnels that has been widely publicized. UNR
has followed USU Low Cost Construction method when constructing the high tunnels in southeastern
Nevada. Berry and tomato cost and returns are included in this study as well as the Low Cost Construction
publication (Appendix C).
The key studies conducted by the universities applied local conditions, materials, labor costs and overhead
in a formula to determine the feasibility of hoop house growing. In each study, variables at each construction
location contributed to the varying levels of success. Since many of the studies have been conducted in
small farming operations, the results are based on getting more product to market over a longer harvesting
period.
Crops for hoop houses are chosen by profitability, marketability, cold hardiness, and the appropriate
growing season and climate. Crops currently being tested or that have been tested are:
Tomatoes – multiple varieties Strawberries Herbs Peppers Eggplant Lettuce and Baby Greens Squash Golden Zucchini Mustards Kale Spinach Cucumbers
Hoop House Technology Advantages:
Applies to both small and large scale production operations.
Can be used on existing lands to expand use– highly recommended to farmers already producing
with additional space available to cultivate with water availability and existing soil testing data. No
additional insurance is usually required, since the farmer/owner already pays property and liability
insurance.

57 | P a g e
Lengthens growing seasons – reduces heat in southern Nevada and increases heating in northern
Nevada, therefore extending the growing season and type of crops that can be grown.
Environmental Damage Protection – temperature, rain, hail, and wind resistant.
Lower Establishment Cost - hoop houses are less expensive than permanent structures or green
houses of comparable size.
Lower Cost of Irrigation – hoop houses are typically very water friendly. UNR reported that the total
start-up cost for installation of an irrigation system for a 14 x 90 hoop house was $1,303.74.
Large crop selection.
Access to financing is critical in today’s economic environment. Listed below are a few of the loan programs
available for hoop house construction.
Agriculture and Food and Research Initiative
Beginning Farmers and Ranchers
Community Facilities
Community Food Project
Environmental Quality Incentives program
Sustainable Agriculture Research and Education
A complete list of Federal Loans, Grants, and Incentives with descriptions and loan features, can be found
on pages 83-87.
New Crop Opportunities
There have been numerous crops tested in both northern and southern Nevada, but due to various
reasons (climate, temperature, soil, water requirements, and others) not all have been deemed as a
prospect for Nevada. Therefore, these crops have not been considered viable, cost effective opportunities
for growers. This report focuses on agriculture crops that are presently being tested or have documented
results. This is not to say others do not have potential, but they do lack the study results that can positively
identify these crops as a viable source at this time.
The crops tested in the northern part of the state to determine the potential have included:
soybeans poplars, and poplars as biofuels warm season grass forages perennial grasses as biofuels

58 | P a g e
trees and shrubs for landscape use (nursery crops) amaranth millets malting barley wine grapes teff buckwheat native crop seed production canola seaberries
The crops tested in the southern part of the state to determine the potential have included:
numerous orchard crops wine grapes numerous vegetables and varieties saffron hops perennial grasses as biofuels
Each crop is similarly tested, focusing on these areas: Yield/Harvest, Water Consumption, Cold
Hardiness, Disease, Demand, Cost and Return, and Pest Management.
This following are good candidates as new crop and new farming opportunities for Nevada.
Saffron Hops Canola Aquaculture
Saffron
Saffron, one of the most expensive spices in the world, is successfully
being grown by Leslie Doyle in the Rodale test garden in Las Vegas with
great success. The test crop is showing a very promising organic
opportunity. Doyle, author of three gardening books, owner and operator
of Sweet Tomato Test Garden, and writer and tester for Organic
Gardening Magazine, stated that southern Nevada is a perfect climate to
grow saffron, due to the dry, hot summers and the resistance to frost and cold in the winter. The price per
pound varies according to the grade of saffron being grown, but typically high grade saffron sells for more
$120 per ounce retail. Growing saffron is considered labor intensive because it grows close to the ground.
“But the bulbs are cheap,” Doyle said (Doyle, L., 2008).

59 | P a g e
What is a Rodale Test Garden?
Rodale is considered to be the pioneer of organic farming. Rodale Institute is dedicated to organic farming
through research and outreach. For over sixty years, Institute researchers have been researching the best
practices of organic agriculture and sharing their findings with
farmers and scientists throughout the world, advocating for
policies that support farmers, and educating consumers about
how going organic is the healthiest option for people and the
planet. To be considered and named a Rodale test garden is one
of the highest accreditations a grower can obtain.
Hops
University of Nevada, Reno, Cooperative Extension planted Hops
in the northern Nevada, in 2012, therefore yielding no results to
be reviewed until 2013. Doug Taylor, colleague of Mario Batali
and Joe Bastianich, founders of Bet on the Farm Initiative
(www.betonthefarm.com) in Las Vegas, started growing hops in
southern Nevada in the UNCE Orchard in 2011. This was in
response to the need for hops by the breweries throughout the
state. Research determined that of the 14 local micro-breweries or brew pubs, almost 80 percent had
problems with the supply of hops. Taylor reported that nearly 100 percent of the microbreweries in the
state would prefer to buy locally grown hops, rather than importing from another state.
According to the American Organic Hops Growing Association (AOHGA), the United States grows over
30,000 acres of hops and increased the acreage of organic hops by 125 additional acres in the spring of
2012. That does not include non-organic, conventional hops. AOHGA recommends a “farmer to brewer”
process to create more effective locally-based grower and user economies. In this system, the brewer
calculates their hops needs for three years and communicates the need to the grower. Growing for the
specific needs of the buyer, not only the quantity but the variety, guarantees production to the brewer and
income to the farmer.
The five varieties being grown and tested for Nevada are:
1. Chinook 2. Willamette 3. Cascade - highly recommended, tripling their yield from 1st harvest to 2nd harvest 4. Nugget 5. Mt. Hood - highly recommended, tripling their yield from 1st harvest to 2nd harvest 6. Centennial - NOT recommended due to soil and heat (Jay Davison, UNR and Doug Taylor, Bet on
the Farm, 2012 source)

60 | P a g e
Each year, 55 to 60 million pounds of hops are grown in the United States and the majority of the hops
are still used for beer. However, hops are now being recognized for antimicrobial benefits and are being
used for livestock production, processed sugar, and animal feed, particularly poultry feed since it is a great
alternative to antibiotics, therefore, raising the demand for hops.
NEW CROP PROS CONS
HOPS
Can be grown outdoors with no shade Not all varieties are successful
Water friendly – 20 gallons per week per
plant
Takes 3-5 years for full root to
build up
Can be grown in hoop houses to lengthen
growing season
Unknown life of hop plant in
Nevada
Profitable - $18.99-$20.99 per lb.
Little to no pest management
Canola
According to the University of Nevada’s College of Agriculture,
Biotechnology and Natural Resources, “biofuels are receiving
increasing interest due to the increasing cost of energy, as well
as concerns about the global warming impacts from use of fossil
fuels. Nevada's arid lands can potentially contribute to biofuels
production, particularly for crops that have relatively low water
requirements, and are adapted to Nevada's Great Basin growing
conditions” (CABNR, 2012). Canola is a high seed oil crop used for food oil, biofuel oil and industrial oil
and there are presently five varieties being grown in Fallon, Lovelock, and Reno. Canola is also used to
produce ethanol and bio-diesel fuel.
Canola is getting more recognition as a biofuel. Nevada Soy Products, in Lovelock, Nevada, processes
the canola seed and has potential for much more production. Having an in-state processor means all of
the dollars stay in Nevada. Canola is a fairly new crop for the University of Nevada, Reno, but will have
full reports available in 2013. Jay Davison, of UNR Cooperative Extension (UNCE), reported at the
Agriculture Expo in Fallon, NV, to keep canola at the top of any crop list.

61 | P a g e
NEW CROP PROS CONS
CANOLA
Excellent rotation crop, particularly wheat
Not water efficient – does best in medium to high rainfall
+40% in wheat gross margin after 2 years as rotation crop
High weed and insect management
Fast growth rate Does not grow well in high clay top soils
Grown with conventional grain crop equipment
Must be processed out of state
Same price subsidies as other commodity crops
Aquaculture Farming
Tilapia Farms
Demand for tilapia continues to grow in the U.S., the single largest market for tilapia. In the first ten months
of 2010, a 15% growth in total tilapia imports was recorded, compared with the year before. The chart below
shows the total imports into the US for 2008, 2009, and 2010, by supplying country (AMRC).3
Graph 13. Total Imports per country in the United States
3 Agricultural Marketing Resource Center
0
20
40
60
80
100
120ORIGIN OF USA IMPORTS (1000 tons)
2008 2009 2010

62 | P a g e
In the US, imports are growing, demand is high and 96 percent of the supply is coming from imports. The
popularity of this fish in the US remained unaffected during the economic recession, even though overall
consumption of fish products fell by 1.25 percent. During the same time, tilapia consumption increased
slightly (UOA).
The U.S. is the single greatest importer of tilapia, but is the smallest tilapia
farmer. China is the largest tilapia producer with the greatest number of “Do
not buy” food warnings due to not being farmed in closed, inland systems,
raising contamination and impurity risks. As of 2005, 156 farms in United
States cultured tilapia, reporting total sales of $31.3 million (Census of
Aquaculture). According to the Department of Commerce, tilapia imports
to the United States in 2011 totaled $838.4 million. Despite the tilapia farms
in the US, the current demand heavily outweighs what is farmed in this country, forcing international imports
to be remarkably high and revenues positively impacting other countries.
While the largest number of tilapia farms are located in Hawaii (19 farms) and Florida (18 farms), California
(15 farms) ranked first with sales over $8.1 million. Idaho ranked second, reporting over $1.5 million in sales
from seven farms. Data from some states with very high production but very few operations were not
available due to reporting concerns related to confidentiality.
The majority of the tilapia farms in the United States are closed inland
systems that guard against escapes and pollution. Many of these farms
conserve resources by re-circulating the water and because they are
indoors, re-circulating systems are carefully controlled. Tilapia
producers in the United States rarely use antibiotics or chemicals.
Open systems, utilized by other countries, have more pollution, more
disease, a greater chance of escape, and lower management systems, resulting in a significant lack of
quality control standards.
The advantages of tilapia farming in closed inland systems are:
High growth rates
Adaptable to a wide range of environment conditions
Thrives on plant-based diets; their feed does not require wild fish as an ingredient
Important source of protein, making tilapia a good candidate for farming, as it provides more protein
than it takes to raise it
Tolerates a wide range of water conditions, making it easy to farm
Ability to grow and reproduce in captivity

63 | P a g e
Nutritious, low in sodium, low in calories and carbohydrates, low levels of mercury, high protein,
and contains phosphorus, niacin, selenium, vitamin B-12, and potassium
Nevada is an ideal location for tilapia farming, when coupled with Integrated Farming - systems that
integrate livestock and crop production.
The advantages of integration are obvious for four reasons.
1. As far as fish production is concerned, it serves the major purpose of providing cheap feedstuffs
and organic manure for the fish ponds, thereby reducing the cost and need for providing
compounded fish feeds and chemical fertilizers. By reducing the cost of fertilizers and feedstuffs
the overall cost of fish production is reduced and profits increased. The profit from fish culture is
often increased 30 to 40 percent as a result of integration.
2. The overall income is increased by adding pig, goat, or poultry raising, grain and vegetable farming,
etc., which supplement the income from fish farming.
3. By producing grain, vegetables, fish and livestock products, the community becomes self-sufficient
in regard to food and this contributes to a high degree of self-reliance.
4. The silt from the ponds, which is used to fertilize crops, increases the yield of crops at a lower cost
and the need to buy chemical fertilizer is greatly reduced. It is estimated that about one third of all
the fertilizer required for farming in the country comes from fish ponds (AIB) (AMRC).
A comparable Tilapia Farm model for Nevada, considering climate, temperatures, livestock and crop
production, and has integrated farming, is the Desert Springs Tilapia Farm in Hyder, Arizona. Durkee
McGloster, farm operator, has seen increases in the tilapia farm since 2008, except for 2011. So far, 2012
is a record year, with an estimated 1,000,000 pounds to be sold.
The chart below shows the total pounds sold, both iced and alive.
Graph 14. Total pounds of tilapia shipped live and iced (Desert Springs Farm)
0
200,000
400,000
600,000
800,000
1,000,000
1,200,000
ICED LBS. LIVE LBS. TOTAL LBS.
2008
2009
2010
2011
2012

64 | P a g e
Desert Springs Farm has integrated Bermuda and Alfalfa fields that are watered from the water of the tilapia
ponds, which is baled and sold, adding another tier of income to the farm. Due to the integration of goats,
2012 is the last year for this process. The hay fields will still be watered by the tilapia farm, but will be
grazing fields for 700 goats, with future expansion up to 10,000 head.
Desert Springs Farm sells primarily to California, Arizona, Las Vegas, and most recently signed a very large
contract with Canada. The facility has room to grow and the potential to double their capacity.
Alternative Recommendation
Shrimp has similar economic and production characteristics as tilapia: high US imports, but low US
production. Shrimp is the number one product in seafood imports. In 2010, the US imported 1.2
billion pounds, 22.2 million pounds more than the quantity imported in 2009. Valued at $4.3 billion,
shrimp imports account for 28.9 percent of the value of total edible imports (NOAA, 2010).
Shrimp farming can be generated in Nevada the same as tilapia using closed inland systems.
Other Possibilities
Nevada’s natural resource challenges – particularly pervasive wildfire and invasive species – may also
present opportunities for producers or land managers to capitalize on landscape needs. The University of
Nevada, Reno’s 2008 Great Basin Wildfire Forum report identified significant problems facing Nevada in
terms of the health of its rangelands. Healthy rangelands are critical to urban and rural communities
because such lands provide access to recreation, support wildlife habitat and grazing mammals, and are
required for healthy watersheds. However, the state’s rangelands were described as being in peril with the
wholesale change occurring to the state’s vegetation types.
“The Great Basin landscape is now characterized by three major vegetation/wildfire fuel complexes:
1) large expanses of monotypic, highly flammable, annual grassland; 2) overly dense sagebrush
stands with a meager understory of perennial grasses and forbs or annual exotics; and 3) greatly
expanded pinyon-juniper woodlands with a rapidly closing crown canopy and non-existent
understory of perennial grasses and forbs.
No longer is the natural force of fire characterized by frequent, low intensity burns that ensure the
persistence of diverse, resilient, fire-adapted plant communities. Rather, the current fuel complexes
are prone to large, catastrophic, high intensity burns that destroy the vegetation, degrade the soil
and create conditions for the establishment of highly undesirable invasive weed species that defy
efforts to rehabilitate the damaged sites” (Great Basin Wildfire Forum, 2008).
The prevalence of invasive species such as cheat grass in the north and red brome in the southern part of
the state, in addition to pinyon-juniper woodlands encroaching into sagebrush ecosystems (in many cases,

65 | P a g e
valuable sage-grouse habitat) – may open up market potential for both land treatments and new, small-
scale industries.
Early indications show that bio-charcoal, made from pinyon-juniper, can be used productively. “Pinyon-
juniper has encroached onto productive rangelands and can be a severe fire hazard. Charcoal made from
pinyon-juniper is being used as a soil amendment, which enhances wildlife habitat and rejuvenates soils at
mine sites. The bio-char may also be used for energy-crop production in the future” (Nevada State Office
of Energy, 2012).
Similarly, land restoration after fires requires a reliable source of seeds and plant materials. A UNCE study
found market demand for locally grown native plant products. “Growers provided plants and seeds primarily
to government agencies, such as the Bureau of Land Management (BLM). However, agency demand for
these products is determined primarily by the current fire restoration efforts, resulting in large fluctuations
in demand from year to year” (Curtis & Cowee, 2008). Non-native plants, such as forage kochia, crested
wheatgrass, and Russian wildrye, were identified in the Great Basin Wildfire Forum report for post-fire land
restoration where cheat grass infestation was likely and perennial grasses were minimal. Should these
recommendations be adopted, these plants and seeds could have a market potential in areas where land
rehabilitation is needed.
Lastly, one entrepreneurial effort has successfully made beer from cheat grass. And, recently, Lake Tahoe
opened up its waters to crawdad fishing, potentially opening up a new, niche market for the edible while
reducing the negative impacts crayfish have on the lake. These kinds of possibilities show that, in some
cases, the state’s natural resource problems may have small-scale solutions that can be capitalized upon
by agriculture producers and entrepreneurs.
Alternative Crops
Alternative crops in Nevada have been tested for decades to determine the growing feasibility in the state’s
climate, as well as profitability for the state’s farmers. According to Jay Davison of University of Nevada
Cooperative Extension (UNCE), “a producer is advised to start on small acreages with any alternative
crop. They must develop skills related to production, pest control, harvesting, and marketing of the crop.
Keeping good records on associated costs and selling prices are also a must” (Davison, 2002). The
success of alternative crops increases as growers increase their knowledge and experience with the
crops.
Two potential alternative crops are
1. Perennial grasses for biomass
2. Teff

66 | P a g e
Perennial grasses are less promising as a biofuel source, while teff may be a suitable Nevada crop to be
used as forage and as a source of gluten-free flour.
Perennial Grasses
University of Nevada, Reno, first started identifying the perennial cool and warm season grasses almost
a decade ago and seeded for the first time in 2008. Reports being followed for alternative crops are
through Jay Davison, a plant scientist for University of Nevada, Reno, Cooperative Extension. The results
have been calculated from a 4 year average yield. The evaluation objectives are:
1. Identify biofuel candidates from both warm and cool season grasses
2. Determine production potential
3. Determine economic potential
The charts below show grasses given three irrigation treatments.
50%(2ac ft/acre)
75%(3ac ft/acre)
100%(4ac ft/acre)
Graph 15. 4-Year Average Yield (University of Nevada, Reno, Cooperative Extension)
Increased watering of perennial grasses grew larger yields for cool and warm season grasses, indicating
that more water consumption led to higher yields. These results suggest that these grasses may be
produced in commercial quantities; however, the economic feasibility of these crops comes with the
following caveats:
0
2
4
6
8
10
12
Cool Season Warm Season
100% water
75% water
50% water
4 Year Warm and Cool Season AvgGrass Biomass Yields
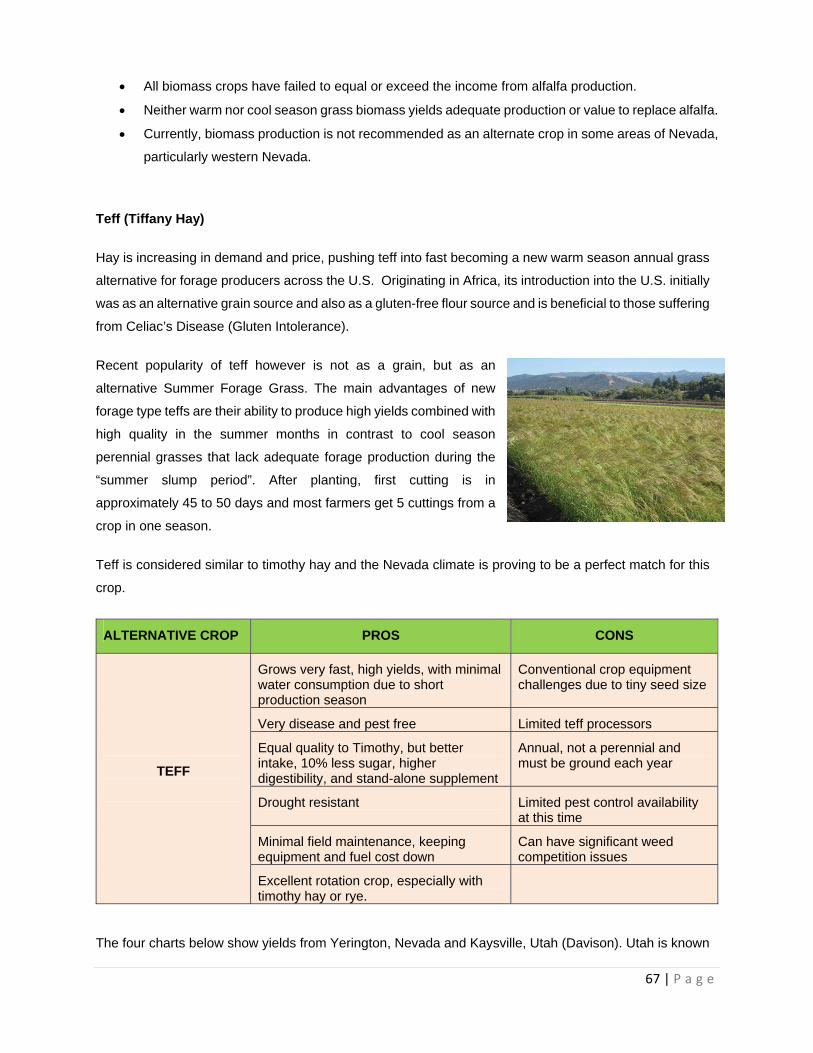
67 | P a g e
All biomass crops have failed to equal or exceed the income from alfalfa production.
Neither warm nor cool season grass biomass yields adequate production or value to replace alfalfa.
Currently, biomass production is not recommended as an alternate crop in some areas of Nevada,
particularly western Nevada.
Teff (Tiffany Hay)
Hay is increasing in demand and price, pushing teff into fast becoming a new warm season annual grass
alternative for forage producers across the U.S. Originating in Africa, its introduction into the U.S. initially
was as an alternative grain source and also as a gluten-free flour source and is beneficial to those suffering
from Celiac’s Disease (Gluten Intolerance).
Recent popularity of teff however is not as a grain, but as an
alternative Summer Forage Grass. The main advantages of new
forage type teffs are their ability to produce high yields combined with
high quality in the summer months in contrast to cool season
perennial grasses that lack adequate forage production during the
“summer slump period”. After planting, first cutting is in
approximately 45 to 50 days and most farmers get 5 cuttings from a
crop in one season.
Teff is considered similar to timothy hay and the Nevada climate is proving to be a perfect match for this
crop.
ALTERNATIVE CROP PROS CONS
TEFF
Grows very fast, high yields, with minimal water consumption due to short production season
Conventional crop equipment challenges due to tiny seed size
Very disease and pest free Limited teff processors
Equal quality to Timothy, but better intake, 10% less sugar, higher digestibility, and stand-alone supplement
Annual, not a perennial and must be ground each year
Drought resistant Limited pest control availability at this time
Minimal field maintenance, keeping equipment and fuel cost down
Can have significant weed competition issues
Excellent rotation crop, especially with timothy hay or rye.
The four charts below show yields from Yerington, Nevada and Kaysville, Utah (Davison). Utah is known

68 | P a g e
to be a hay growing state and in the examples below, the yield in Nevada was equal to, if not greater than,
the Utah yield, suggesting Nevada is an ideal state to grow teff.
YERINGTON, NEVADA, 2010 KAYSVILLE, UTAH, 2010
YERINGTON, NEVADA, 2010 KAYSVILLE, UTAH, 2010
Graph 16. Yerington, NV and Kaysville, UT. Growth Comparison
In 2011, Nevada produced approximately 700,000 lbs. of teff @ $0.40/lb. to farmers, $0.65/lb. cleaned to
wholesalers, and $0.92/lb. as flour and the 2012 teff demand is calculated at 2,000,000 lbs., more than
double last year’s production, representing a growth opportunity.

69 | P a g e
Teff is increasing in demand and has been tested and charted as a good product for Nevada, but the
downside (and the economic development opportunity) is, there are not any teff processors in the state. All
teff seed is sent out-of-state for processing. This discussion is covered thoroughly in the “Nevada
Agriculture Gaps” portion of Section 6.
Expansion Opportunities
For the purpose of this study “Expansion Opportunities” means taking what we already do well and
expanding processes, methods, and practical farming parameters. Expanding what is grown and how it is
grown can increase sustainability and improve the livelihood of the farmers and local communities. Keeping
within the guidelines of practical parameters, not only means utilizing farms that have additional acreage
that can be farmed or incorporating hoop house technology throughout the state in order to lengthen
growing seasons, but it also means creating alternative ways of growing and alternative farming products.
The expansion areas discussed are:
Vertical Farming
Wine Grapes and Vineyards
Potatoes, Onions and Alfalfa
Vertical Farming and Hydroponics
Mr. Hienz Gisel, founder of Vitality Concepts and his associate Mike Dial are experts on sustainable vertical
farming and organic, soilless hydroponic growing methods. Mike Dial is an international authority in
sustainable vertical farming and has built more than 800 organic farms around the world. Together they are
currently tackling food security for Tohoku (Japan) and decontaminating radioactive and tsunami
devastated soil. In addition, their research farm and school in the Philippines is making a major impact on
the growing process and health of consumers within the region.
EXPANSION PROS CONS

70 | P a g e
OPPORTUNITY
VERTICAL FARMING
Sustainability and Dependable food source; Food Security
High cost if large scale. $1.5 to 2 million per acre
Produces Large yields in Controlled environment
Lack of knowledge and awareness
Soilless cultivation, eliminating pest, toxins, and soil diseases; healthier foods; increase in nutritional value
Lack of volunteers to help run small community gardens; lack of community support
Excellent growing method for herbs, strawberries, tomatoes, and small vine crops
Lack of funding from county and/or state (needs micro funding)
Vertical farming and/or hydroponics growing produces about 10 times the amount of produce per acre, per
year, than a traditional soil farmer. This type of growing uses 70 to 90 percent less water than a field farmer,
as the water is recirculated and goes straight to the plant, resulting in minimal evaporation. Since most
pests and diseases are soil-born and hydroponics is soilless, there are fewer pest and disease problems.
This type of growing allows crops that would traditionally be a mono crop to have multiple yields.
Wine Grapes/Vineyards
Wine grapes have low-water requirements, and vineyards offer tourism opportunities such as tours and
wine tastings; however, wine grape growing success in Nevada can be hampered by spring frosts and
the dearth of varieties that succeed in local growing conditions.
EXPANSION OPPORTUNITY
PROS CONS
WINE GRAPES
Low water use crop Red grapes struggle in climate
Potential for higher return than forages or grain crops
Potential to have high winter die rates
Currently high demand for Nevada wine
Slow vine maturity
Provides diversity in a cropping system
Three wineries in the state have expanded operations in recent years and have vineyards that grow their
own grapes in addition to importing grapes from California.

71 | P a g e
Churchill Vineyard
Tahoe Ridge Winery
Pahrump Winery
Churchill Vineyards, Tahoe Ridge Winery, and Pahrump Winery have each expanded wine-grape
production in recent years, and each winery offers Nevada grown wines, tourist attractions, and special
events.
Churchill Vineyard
Also known as Frey Vineyards, Churchill planted 13 varieties in 2001 and in 2005 bottled their first wine
and with the following results:
White Riesling 680 bottles
Sémillon 435 bottles
Gewurztraminer 215 bottles
Chardonnay 140 bottles
White Riesling / Sémillon 125 bottles
Merlot 80 bottles
Totaling 1,680 Bottles/140 Cases
After more than a decade of growing grapes, Churchill Vineyard has narrowed their varietal menu and
only grows four varieties of White grapes and four varieties of Red grapes. The Vineyard has many
success mile markers, making them a model subject for this crop opportunity.
All wine is produced and sold locally; it is reported that the vineyard cannot keep up with total
demand.
Expanded winery in 2006.
Started statewide distribution in 2008.
Received 1st Nevada Commercial Distillery permit in 2010, after 5 year experimental license. Also
produces vodka, brandy, grappa, and single malt whiskey (Churchill Vineyard, 2012).
Tahoe Ridge Winery
Tahoe Ridge Winery began operations in 1990 with a three-acre research vineyard and completed three
more research vineyards in 1994, adding one more research vineyard under the University of Nevada,
Reno, Cooperative Extension in 1995. Today the company grows 60 varieties in 17 Nevada locations from
Pahrump to the Carson Valley, making them a model subject for this crop opportunity. The operation
includes a marketplace and bistro in Minden, where special events and wine tastings are offered.

72 | P a g e
Pahrump Valley Winery
The Pahrump Valley Winery is the oldest winery in the state and is currently growing Zinfandel and Petite
Syrah varieties in the Pahrump area. The winery currently imports 60 percent of their grapes from
California due to local microclimate conditions. The winery recently completed a 1,000 case order to
Shanghai, China and they are looking to purchase additional acreage in the Pahrump area to grow more
grapes locally. The vineyard also offers wine tastings and a “grape stomp,” a competition that sells out
each year (Pahrump Winery, 2012).
Potatoes and Onions
The United State Department of Agriculture of Nevada reported potatoes and onions as two of the top five
commodities in Nevada for 2010. The cash receipts for potatoes and onions totaled over 81.6 million. The
climate, environment, and soil allow these two commodities to grow well and make expansion of these
products an opportunity for Nevada.
Alfalfa
Alfalfa hay is grown more than any other hay in Nevada. The United States Department of Agriculture of
Nevada reported 280,000 acres of hay were harvested in 2010, up 15,000 acres from 2008. The cash
receipts totaled over 143.2 million, an increase of approximately 2.5 million from 2009. The demand for
hay is continuing to drive up the price for the commodity. Alfalfa and other hays are the number three
commodity in the state and the expansion of this product is an opportunity for Nevada.

73 | P a g e
“Localized food is the strongest trend in agriculture and has been for a number of years.”

74 | P a g e
5. AGRICULTURE GAPS
This study has not only identified what Nevada presently has in terms of producers, processors, and other
agriculture related businesses, it has also identified what Nevada is lacking. Nevada agriculture performs
well in many areas, but economic gaps are occurring that result in a large in-state revenue loss. In addition
to the major gap of animal processing within the state as described in the Economic Analysis Section, there
are six additional gaps identified for improvement to avoid out of state economic leakage.
1. Teff Processing
2. Localized Agriculture
3. Dairy Processing
4. Meat Production and USDA Meat Processing/Slaughterhouses
5. Agriculture Equipment Manufacturing
6. Agriculture Marketing Program
7. Understanding and Access to Federal Loans, Grants, and Incentives
To complete the analysis, 341 phone calls were made to current agriculture-related businesses, including
food and dairy processors and companies that sell to processors outside of the state to evaluate impact.
Evaluation questions included:
1. Is your business dependent on being in Nevada?
2. Do you process your product in Nevada or send it out of state?
3. If there was a processor in-state for that type of product, would you use them?
4. What do you purchase outside of the state because Nevada does not provide that product or service?
If there was an in-state business providing that product or service, would you use them?
5. What is the freight impact?
6. What is the revenue impact?
The agriculture gaps identified are categorized in two areas:
What we have and can build on
What we need
What we have and can build on identifies what Nevada already has and does well on the front end, but
the back end is lacking, causing in-state revenue losses.
What we need identifies the gaps that are causing large revenue losses because the products and services
are not in-state.

75 | P a g e
GAP 1: Seed Processing
Teff Processing
As teff gains popularity and more acres are being produced, a need for an in-state processor also
increases. The company used as an example is Desert Oasis Teff Company (DOTC), with future plans to
expand and possibly double teff production. DOTC owns one teff farm and contracts three other farms to
grow. Together they produce approximately one million pounds and are the only teff seed cleaning company
in the state. DOTC sends all teff outside of the state to be processed into gluten-free flour, due to the lack
of an in-state processor. The company ships its product to Bob’s Red
Mill in Redding, California and Moore’s Mill in Portland, Oregon. It is
reported that freight is their largest expense, and are now contracting
with larger companies to pick up the seed, resulting in less expensive
freight fees. DOTC reported they would use an in-state teff processor,
resulting in higher profits for their business.
The economic cost to Desert Oasis for out-of-state processing is primarily the shipping, which amounts to
approximately $90,000 annually. Desert Oasis spends another $70,000 to have it processed in California
and Oregon. Due to the increased demand for teff, DOTC is going to expand, contracting more farms to
grow double what is currently being grown, which will double the freight expense as well as double the
processing expense. Although this may be one small example, it shows the economic disconnect of this
emerging alternative crop with the revenue losses that will continue to be incurred. Alpine Farms of
Gardnerville is another Nevada business incurring freight and out of state processing charges to ship their
teff to California.
Other Seed Processing
Another gap in seed processing is alfalfa seed. Brinkerhoff Ranches in Lovelock sends all of its seed to
Idaho to be processed. Val Brinkerhoff stated Nevada used to have several alfalfa seed processors in the
state, but it became more economical to be in other states where the demand was greater, leaving Nevada
without a seed processor. Additional research will need to be conducted to determine leakage and
processing viability.
GAP 2: Localized Agriculture Development
Vegetables, potatoes, and other crops made up 21.1 percent of the Total Cash Receipts, by Commodity,
in Nevada 2010 (Nevada Agriculture Statistics, 2011) or in terms of economic contribution, $10,587,500;
however, the state imports $93.8 million of vegetables and melons and $195 million of fruits every year
(Harris). This is an economic disconnect. Nevada is importing approximately nine times current in-state
production, in commodities already successfully grown in Nevada.
76 | P a g e
A strategy to increase statewide agriculture revenues throughout the state is the development of “localized
agriculture” or the creation of distribution channels that will connect local producers to restaurants, grocers,
and the communities.
The newer strategies are defined as food hubs. The goal of this hub is to create “a system of mutual support
that increases sustainability and profitability (Compendium of Food Clusters, 2009, Appendix D).
Advantages of localized agriculture:
Creates healthy sustainable community
Increases in-state economic contributions
Introduces farmers to local markets, commercial and residential
Supports efforts to increase sustainability by growing and meeting demands for fresh produce
Reduces transportation costs
Initializes food hubs
Produces fresher, more nutritious products
Provides positive impact to health
Industry Trends and Fit
Localized food is the strongest trend in agriculture and has been for a number of years. There is concern
that local food costs more to produce, especially in the desert. Some research shows that people from all
incomes are willing to spend more on good quality food. The sale of food locally is shown to create a 1.45
to 1.58 multiplier effect on both income and the number of jobs (USDA, 2010).
In rural Nevada there is great need for jobs and business development and the response to locally grown
food has been favorable. This is a segment that can grow with support from local communities. Business
professionals in Lincoln County have commented that this is one of the first business development concepts
that appears feasible for the rural frontier and has real potential to a create positive, long-term impact.
Filling the Gap in Business Demand
There is a series of gaps in Nevada to develop local food systems. One gap is consumer awareness. The
goal is getting the consumers to understand that high quality food is available and produced in Nevada.
There are several successful programs to be used as a model that can be duplicated in filling this gap.
NevadaGrown - The oldest statewide localized agriculture program in Nevada. Nevada Grown
works with Whole Foods and US Foods, grows produce for other retailers and restaurants, provides
marketing materials, holds monthly agriculture workshops and keeps the most extensive website
listing for the availability of all locally grown foods including farmers’ markets, CSAs (Community
77 | P a g e
Supporting Agriculture), and restaurants in the state. NevadaGrown has been funded from grants
by the Nevada Department of Agriculture for the past 10 years.
Producer to Chef Program - University of Nevada Cooperative Extension educates Nevada
restaurants and consumers that quality food can be grown in Nevada. This program takes chefs to
farmers’ fields and has locally grown food evaluated by chefs. The program has also started local
farmers’ markets, runs local food events, and educates farmers on producing high quality food for
local sales. Because of the program, there has been an increase in requests for local produce from
high end chefs, farmers’ markets, Community Supported Agriculture (CSA) businesses, and
specialty grocery stores (Whole Foods and US Foods).
Bet on the Farm - Doug Taylor, Executive Chef for B & B restaurants, works with Mario Batali and
Joe Bastianich, and helped opened Bet on the Farm in 2009. More than 100 chefs have been
introduced to local farmers; approximately 40 chefs are now supporting local farming on a weekly
basis. More work is needed to educate the consumers on the local food availability in Nevada.
Sierra Bounty – Using a collective CSA (Community Supporting Agriculture) model, several farms
are growing vegetables, herbs, flowers, fruit, hops, corn, and wheat. Two farms raise chickens,
turkeys, and deer, and sell the eggs produced by the chickens and turkeys. Sierra Bounty makes
local products available by coordinating pre-ordered sales and deliveries between growers,
members, restaurants, and grocers.
Greenhouses and community gardens - Winnemucca community gardens, Carson City
Greenhouse Project, Lyon County Hoop houses, Bellagio Hotel and Resort Rooftop Herb Gardens
are examples of local gardens.
Fallon Farmers Collaborative - Comprised of Winnemucca, Fallon, Lovelock, and Reno, the small
farm coalition received a Specialty Block Grant in 2011 to help farmers market their goods to local
area farmers’ markets. The Coalition received a Specialty Block Grant in 2012 to help form a
business entity.
Solano and Yolo Counties – This industry model is described in “The Food Chain Cluster,
Integrating the Food Chain in Solano and Yolo Counties to Create Economic Opportunity and Jobs”
by Collaborative Economics (Appendix E). The approach focused on the interrelationships in the
agriculture industry cluster, including emphasis on the definition of the diversity of industries, the
potential markets, and the connection to the other industry clusters in the area. While the size of
the direct agriculture industry in Solana and Yolo counties is similar to Nevada, it has achieved a
better integration into other local industries and has been practicing innovation for a number of
years.
There is a series of gaps that needs to be addressed to develop a supply of locally grown products in
Nevada. These gaps appear in production, postharvest handling, marketing, sales and delivery of quality
products. Local food production is a different business for Nevada farmers because it is more intense

78 | P a g e
(greater labor and production in a smaller area) and more complex (the farmer must market, distribute and
sell their products directly to the consumers themselves).
The chart below shows development steps required for establishing a supply system. The chart aids in the
many phases that must be taken to ensure products get to markets, grocers, and communities. According
to the size of the business or the intended or expected growth, employees can be added at any phase
(Holly Gatzke, University of Nevada, Reno, Cooperative Extension).
Farm to Market Establishment
Additional Food Cluster Opportunity
Localized Agriculture is the key component to managing a significant threat to the State of Nevada known
as Food Security. An excessive reliance on imported foods threatens Nevada economically and diminishes
its ability to properly meet a major disaster that would cut off food supply to the state. Fortunately the state
has an initiative underway that should be recognized and supported. The Lead Nevada steering committee
is establishing an initiative that requires support of every agency in the state. Lead Nevada is organized in
three areas, each having a working committee: Grow Nevada, Reach Nevada, and Feed Nevada. The
initiative is currently undergoing its assessment of its critical issues to result in a strategic plan.
GAP 3: Dairy Processing
Nevada has approximately 28,000 milk cows and has the potential to be a very strong industry, but Nevada
needs to double or triple that number in order to attract more companies requiring milk production (e.g.
yogurt producer).
79 | P a g e
The present day example is the powdered milk plant being built in Fallon, Nevada, that will require an
additional 13,000 milk cows to reach full capacity processing 2 million lbs. of milk per day. The DFA (Dairy
Farmers of America, developer of the plant) is trying to recruit dairies to Nevada, but the relocation or
expansion cost for these companies can be cost prohibitive.
Increasing dairy cows is vital to the dairy industry in Nevada. A typical dairy cow generates more than
$30,000 in economic activity and a herd of 100 cows creates 20 jobs for Nevada residents each year. The
increase of 13,000 milk cows for the dry milk plant will generate more than $390,000,000 each year and
will create 2,600 jobs.
Since 2001, the number of milk cows in Nevada has increased by 3,000 head and cash receipts from
marketing have increased from $62,270,000 to $103,766,000 (Nevada Agriculture Statistics, 2011).
Although an increase in milk cows has occurred, it is not enough to meet demand both current and
expected. This creates another economic development opportunity when compared to the value of
Agriculture Cluster Imports in Nevada.
According to an analysis of the top ten Nevada imports, Fluid Milk and Butter Manufacturing is number six.
It also shows the top imported commodities for this category.
#1 Imported commodity - Dairy Cattle and Milk Products $60,202,852
#2 Imported commodity - Fluid Milk and Butter $8,783,254
Nevada imports $68,986,106 in the Fluid Milk and Butter Manufacturing category, providing a growth
potential in two areas (a) Milk (Dairy) Cows and (b) Milk product processors and/or manufacturers.
GAP 4: Meat Production and USDA Meat Processors/Slaughter Houses
Approximately $780 million of Processed Animal (except poultry) Meat and Rendered Byproducts goods
and services were imported into Nevada in 2010 (Ekay Consulting, 2012). Local Nevada industries
produced only $58.6 million worth of this commodity, indicating underproduction of this commodity locally,
which makes Nevada an attractive market for a company supplying this commodity.
Of the more than $45.4 million worth of the goods and services produced by this industry, 79 percent of
total production is exported outside of Nevada. This is a significant disconnect, with over $780 million of
this industry’s product being imported from outside the state and the majority of the industry’s local
production exported outside the state.

80 | P a g e
Research could be conducted to understand the reason for this disconnect. There may be regulatory
limitations and constraints keeping companies in this industry from locating and operating in Nevada. One
study found that a mobile slaughter operation was feasible and potentially profitable, but it has not yet been
pursued (Cowee & Harris, 2011). If these constraints can be overcome, the impact could be significant for
the state.
For example, if 25% of the $780 million that is currently
produced outside of Nevada and imported into the state
can be produced locally, a direct increase on Nevada’s
output is $195 million. Applying indirect and induced
multipliers for this industry to total impact of a 25
percent increase in this industry can have a statewide
effect of $360 million. Using existing employee
productivity for the animal processing industry, an
increase in sales of $195 million will generate
approximately 430 employees. This is a basic example of the potential for growth that can be found in
import substitution.
Not only is this an import disconnect, but what is produced in state primarily goes out of state to be
processed due to an absence of a USDA meat processor. One example of large amounts of money leaving
the state is through the USDA, Food Commodities Program and the Child Nutrition Program. According to
Jim Barbee, State Director for Department of Agriculture, approximately $115 million is part of the
processing gap in Nevada. Purchases and processes occur outside of the state and incur hundreds of
thousands of dollars in freight charges. Once everything is processed it is trucked back into the state and
distributed.
Another real life example is First Quality Sausage, with an annual income of $7,980,000, buys 100% of
their raw materials, chicken, turkey, and beef from Arizona, South Dakota, and Ohio, due to an absence of
a USDA approved slaughterhouse in Nevada. It should be noted that 100 percent of the First Quality
Sausage’s products are sold in the state primarily to hotels and casinos in Las Vegas, NV.
GAP 5: Agriculture Equipment Manufacturing Companies
Nevada is highly concentrated with agriculture businesses and is surrounded by states that are also highly
agriculturally concentrated: California, Utah, and Idaho. Farm Equipment Manufacturing companies are
ideal for Nevada given the corporate tax structures, state incentives and the availability of land and
buildings. The companies listed below are the manufacturing companies currently in Nevada, totaling $27.7
million annually:
Cummins-Allison Corporation
81 | P a g e
High Desert Barns
High Desert Livestock Supply
Rain Aid Inc.
Windspur Discount Pipe and Irrigation
Winnemucca New Holland
Wyatt Gate and Corrals
The Northern Nevada Development Authority Agriculture Committee, chaired by Lynn Hettrick, determined
additional equipment manufacturers that would be most beneficial to Nevada’s landscape. These include:
Tractors suppliers
Seed mill equipment suppliers
Equestrian-related businesses
Dairy equipment suppliers and manufacturers
Irrigation and field equipment suppliers and manufacturers
The business development specialist within the economic development agencies could explore potential
opportunities in these categories for possible relocations or expansions into Nevada, such as from
California.
GAP 6: Agriculture Marketing Program
An Agriculture Marketing Program is needed to support the acceleration of growth within the sector by
creating a statewide outreach strategy for Nevada agriculture. This study has identified numerous
individuals and organizations striving to accomplish this, but they are operating in silos, increasing overlap
of efforts and reducing overall effectiveness. The state would benefit from a higher level of coordination and
development of marketing programs.
A Statewide Agricultural Marketing (SAM) program would analyze the supply and demand of agricultural
products and services, and would create an organized effort to increase the sector’s ability to better meet
the demands of the buyers and support higher profits for the suppliers. This program would include the
support of marketing the key growth products and commodities, conduct market research, develop and
deliver industry promotions, develop and communicate state branding, support transportation improvement,
create agriculture map, outlining all crops grown in each location, define and determine other agriculture
related business opportunities to form food clusters, support and actively work with Food Security Programs
and provide constant vigilance on industry retarding policies and regulations within all levels of government.
82 | P a g e
GAP 7: Understanding and Accessing Federal Loans, Grants and Incentives
Nevada growers, producers and distributors have many loans, grants, and incentives available to support
their operations, expansions and eventual bottom line success. However, many of these programs are
minimally utilized. Through conversations within the agriculture community, it is clear that businesses would
use these programs if they were aware of them and if they knew how to access them. This lack of
understanding and process capabilities represents an economic gap. It is believed that if filled, the
expansion of the sector would be accelerated. The programs provide assistance to organizations connected
to the Agriculture industry to support:
Research
Access to capital
Community development
Marketing
Conservation practices
Operating funds
Export assistance
Renewable energy implementation
Organic certification
Youth programs
Available grants, loans, and incentive programs are summarized below and listed by master agency.
USDA
Agriculture and Food and Research Initiative (AFRI)
Agricultural Economics and Rural Communities - Supports research, education, and/or
extension projects that address the long-term viability of small and medium-sized farms as well as
entrepreneurship and small business development, markets and trade, and rural communities.
Improved Sustainable Food Systems – Conducts research, education, and extension on local
and regional food systems, from field to fork, that will increase sustainable food security in U.S.
communities and expand viability within local economies.
Beginning Farmers and Ranchers Loan - Makes and guarantees loans to beginning farmers who
are unable to obtain financing from commercial lenders.
Business & Industry Guaranteed Loans - Supports hydroponic and aquaculture food production.

83 | P a g e
Business and Industry Guaranteed Loan Program (B&I) - Helps new and existing businesses
based in rural areas gain access to affordable capital, providing guarantees on loans made by
private lenders. USDA essentially co-signs the loan with the loan recipient, lowering the lender's
risk and allowing for more favorable interest rates and terms.
Community Development Block Grant Program – Designed to address the critical issues
involving community development such as, infrastructure development and improvement,
education and workforce development, job creation through entrepreneurship, business
development etc., marketing the community, and development of tourism and other natural
resources.
Community Facilities (CF) – Supports rural communities by providing loans and grants for the
construction, acquisition, or renovation of community facilities or for the purchase of equipment for
community facilities.
Community Food Projects (CFP) – Designed to assess strengths, establish linkages, and create
systems in the whole food system that improve the self-reliance of community members to increase
food security.
Conservation Loan Program (CL) – Farm Service Agency makes and guarantees conservation
loans to promote conservation on farms and ranches to conserve our natural resources and can
be used to implement conservation practices approved by the Natural Resources and Conservation
Services.
Cooperative Development Assistance – Assist in forming business entities that allow producers
to cooperate on one or more aspects of the production and marketing cycle, sharing the costs, the
risks, and the profits associated.
Efficiency Improvement Guaranteed Loan and Grant Program - Provides financial assistance
to agricultural producers and rural small businesses in rural America to purchase, install, and
construct renewable energy systems; make energy efficiency improvements to non-residential
buildings and facilities; use renewable technologies that reduce energy consumption; and
participate in energy audits, renewable energy development assistance, and feasibility studies.
Environmental Quality Incentives Program (EQIP) - Assists farmers and ranchers in planning
and implementing conservation practices that improve the natural resources (e.g. soil, water,
wildlife) on their agricultural land and forestland.

84 | P a g e
Environmental Quality Incentives Program (EQIP) - Offers financial and technical help to assist
eligible farmers and ranchers to install or implement structural and management practices on
eligible agricultural land.
Farm and Ranch Lands Protection Program (FRPP) - Purpose is to keep agricultural lands in
production by assisting with the purchase of conservation easements from volunteer landowners
to ensure that the land will never be developed out of agricultural uses and provide income for
landowners.
Farm Operating Loans – FSA loan used to purchase livestock, feed, farm equipment, fuel, farm
chemicals, insurance and other operating costs, including family living expenses, minor
improvements or repairs to buildings, and refinance certain farm-related debts, excluding real
estate.
Farm Ownership Loans - FSA loan providing farmers and ranchers opportunity to purchase
farmland, construct and repair buildings, and make farm improvements.
Farm Storage Facility Loans (FSFL) - Finances the purchase, construction, or refurbishment of
farm storage facilities. This program finances new cold storage buildings, which can be particularly
important to those growing fruits and vegetables for the fresh market.
Farmers Market Promotion Program (FMPP) - Helps communities support local food systems
through direct marketing of farmers markets, roadside stands, community-supported agriculture,
agri-tourism and other direct producer-to-consumer marketing opportunities. Project awards
increase access to local foods by low-income consumers, expand opportunities for farmers and
growers to market their products directly to the consumer, and raise customer awareness of local
farm products through promotion and outreach.
Federal-State Marketing Improvement Program (FSMIP) - Funds are used to explore barriers,
challenges, and opportunities in marketing, transporting, and distributing food and forest products.
Minority and Women Farmers and Ranchers, also known as Socially Disadvantaged Applicants
(SDAs) - Targets a portion of its loan funds to minorities and women farmers and ranchers.
Organic Cost Share Program - Reimburses eligible producers and handlers for a portion of the
costs of organic certification.
Rural Business Enterprise Grant (RBEG) – Funds projects that facilitate the development of
small and emerging rural businesses, distance learning networks, and employment-related adult
education programs.
85 | P a g e
Rural Cooperative Development Grants (RCDG) - Supports rural economic development
through the creation or improvement of cooperative development centers that provide assistance
for starting up, improving, or expanding rural businesses, especially cooperatives.
Rural Energy for America Program (REAP) - Provides financial assistance to agricultural
producers and rural small businesses in rural America to purchase, install, and construct renewable
energy systems; make energy efficiency improvements to non-residential buildings and facilities;
use renewable technologies that reduce energy consumption; and participate in energy audits,
renewable energy development assistance, and feasibility studies.
Rural Micro-Entrepreneur Assistance Program (RMAP) - Provides direct loans, technical
assistance grants, and technical assistance-only grants to Microenterprise Development
Organizations (MDOs) to support the development and ongoing success of rural micro-
entrepreneurs and micro-enterprises.
Rural Youth Loans – Designed to establish and operate income-producing projects of modest size
in connection with their participation in 4-H clubs, FFA and similar organizations, providing practical
business and educational experience and produces sufficient income to repay the loan.
Specialty Crop Block Grant Program (SCBGP) - Enhances the competitiveness of specialty
crops (fruits, vegetables, tree nuts, dried fruits, horticulture, nursery crops, floriculture), including
locally grown and consumed specialty crops, e.g. school or community gardens.
Value-Added Producer Grants - Supports business planning activities and helps farmers and
ranchers receive a higher portion of the retail dollar, e.g. helps a farmer develop a business plan to
turn berries into jam or basil into pesto.
Western Sustainable Agriculture Research and Education Competitive Grants Program
(SARE) Provides assistance for a producer, working with a technical advisor that develops a
proposal to conduct research and education on a sustainable agricultural topic and incorporates
such items as: on-farm/ranch demonstrations; farmer-to-farmer educational outreach and other
items to assist in producer adoption in an area of sustainable agriculture. The information must
help improve income, the environment, communities and quality of life for all citizens.
Western United States Agriculture Trade Association (WUSATA) – Provides assistance to
small food and agricultural companies in marketing their products overseas.
Small Business Administration
Small Business Innovation Research (SBIR) - Helps small businesses conduct high quality
research related to important scientific problems and opportunities in agriculture. Research is

86 | P a g e
intended to increase the commercialization of innovations and foster participation by women-owned
and socially and economically disadvantaged small businesses in technological innovation.
State Trade and Export Promotion Grant Program (STEP) - Designed for businesses that desire
financial support to build brand-name recognition of U.S. made products in foreign markets and
increase product exports.
Nevada Investment and Trade Revenue Opportunities (Nitro) – Encompasses (4) key programs
and events all designed to help small businesses market products overseas and increase exports
from Nevada.
Industry Constraints
The primary research determined two areas of constraint that producers and processors report as
consistent issues and problems.
Regulations
In the primary research survey, there was an opportunity for respondents to give general comments as well
as comments specifically about food safety and other regulations. Recurring themes were focused on
relationships with Federal agencies, such as the BLM, and perceived misplaced antagonism from
environmental organizations. Another common comment was the constraints of the lengthy and difficult
permitting process.
Regarding Federal agencies, the primary challenges for Nevada Agricultural companies are reported as
excessive fees, burdensome permits, adjudication and process time and the lack of empathy in dealing
with real world issues.
With environmentalists, complaints are delays related to issues such as sage grouse protection and an
antagonistic relationship with the advocacy groups.
There were widespread complaints with respect to the inconsistency of regulations across the state. The
regulations, both county and state based, were mentioned numerous times expressing how different the
process is for some of these regulations from the northern part of the state vs. the southern part of the
state.
Taxes
Payroll and property taxes dominated the survey as creating the biggest burden on businesses. To a lesser
extent, federal income taxes and annual business taxes also scored high in the survey. In the general

87 | P a g e
political climate in the state and across the nation, these results were not surprising. Only about 6 percent
of the surveys did not list any taxes as creating a burden.

88 | P a g e
“Expand focus and investment on agricultural sciences in the state’s higher education system.”

89 | P a g e
6. RECOMMENDATIONS
This study has identified the gaps and opportunities associated with Nevada agriculture. It is clear there is
no one single solution to solve the issues associated with such a diverse industry across the broad
geography of the state. However, a number of recommendations can be suggested. The recommendations
are presented in order, as each topic area was discussed in the report. Additional recommendations are
made that coincide with the larger challenges that face the state’s agriculture industry, such as reliable
funding for the state’s agriculture programs in the Nevada System of Higher Education, as well as improving
regulations impact the agriculture industry.
Hoop House
Continue to hold workshops for hoop house growing through the community colleges, university and
community horticulture programs, and by community gardening organizations to support best practices and
adoption of new applications of hoop houses.
Wine Grapes and Vineyards
Target programs to support expansion of wine grape production in the state to reduce the importing of
grapes from California.
Saffron
Expand the research and testing of growing saffron in Nevada by experimenting with different organic
soils and varieties to determine the best-case growing procedures for maximum yield. Also, focus on
saffron as an export crop.
Hops
Establish a “farmer-to-brewer” initiative to in-state brewers to promote the crop as a niche-market reality.
Expand export programs.
Canola
Continue the growth of canola as an edible food oil and biofuel, working with in-state processors for out-
of-state exporting opportunities.
Perennial Grass as a Biomass Crop
Due to an inability to economically produce these crops, it is recommended that additional effort be placed
on research and development that would improve economic viability before committing resources in the
field.
90 | P a g e
Teff
Expand production of teff due to low input cost, its high potential returns and lower water demand. Promote
the use of teff as a forage and support the attraction and development of in -state processing of gluten-free
flour for in-state distribution and export.
Vertical Farming and Hydroponics
Expand local based agriculture through vertical farming and hydroponic growing operations. Focus efforts
on expanding technology adoption within the state and the promotion and education of businesses to
establish and succeed. Seek out empty buildings within communities and support their transition to growing
centers.
Aquaculture
Target aquaculture companies and solicit them to expand operations to Nevada. Develop an “add on”
program targeting current farmers and animal producers to consider adding aquaculture in an integrated
system.
Teff
Target a teff seed processor for relocation to Nevada or support the expansion of an existing company to
reduce economic leakage.
Alfalfa Seed
Quantify the feasibility of this type processor in Nevada to support active solicitation of a relocation or
expansion to Nevada.
Local Agriculture Development
Develop a state wide program to support the development and success of local growing hubs through the
following activities:
Connect local growers to local markets
Create distribution centers
Create statewide cooperatives, working together
Create an agriculture marketing program in the state or in the northern and southern regions that
connects, markets, and increases the crop agriculture production with a main goal of import
substitution, thereby increasing the economic contribution of this industry cluster.

91 | P a g e
Dairy
Provide state incentives to support the expansion of Nevada’s dairy herd. Target dairy processors for liquid
milk, powdered milk and yogurt as recruitment and expansion opportunities.
Exports
Organize the information and processes of existing programs of the state and the U.S. Department of
Commerce and create an aggressive communications program targeting producers with the goal to expand
exports.
Federal Loans, Grants, and Incentives
Create a single source on-line data web site organizing all available loans and programs and provide user
friendly access. Aggressively promote use of site and therefore programs.
Meat Production and USDA Meat Processors/Slaughter Houses
Bring every support mechanism possible to ensure the successful establishment of the Walker River Beef
project in Wabuska in recognition of its aggressive scale and its ability to fill the gap within the state.
Agriculture Marketing Program
The forming of an agriculture marketing program is recommended at the state level through the Department
of Agriculture, to develop, initiate and sustain agricultural food systems.
Agriculture Equipment Manufacturers
Develop a state supported marketing and sales program to attract key expansions and relocations within
this sector.
Research, Education, and Outreach
Expand focus and investment on agricultural sciences in the state’s higher education system. The
University of Nevada Agricultural Experiment Station provides the research backbone for Nevada’s many
agricultural industries. Recent cutbacks to the university system have impacted the Experiment Station’s
programs. This is in spite of previous recommendations to increase the state’s research investment,
particularly to address the Great Basin’s natural resource challenges (Great Basin Wildfire Forum, 2008).
A research foundation is frequently required for new industries to develop, as evidenced by the wine grape
enterprises that developed after research conducted at the University of Nevada, Reno.
92 | P a g e
The University of Nevada Cooperative Extension has been the state’s agriculture outreach resource. It also
conducts research and offers numerous community education opportunities. At the time of this writing,
budget cut recommendations approved by the system of higher education’s Board of Regents are
threatening to further impact UNCE’s operations. Though UNCE has a statewide mission, its personnel
have been reduced in recent years as the higher education system suffered budget cuts. Work by UNCE
personnel has been invaluable for the state’s agriculture industry, and it is anticipated that further reducing
this resource will negatively impact the state’s producers.
Other higher educational institutions have also contributed to local agriculture needs. The Specialty Crop
Institute at Western Nevada College (http://www.wnc.edu/ce/sci/) is a program that provides training for
new farming methods for the high-desert climate. Similar programs in the state can benefit producers
directly, and with a regional focus, can aid producers with needs specific to their locations. The Ornamental
Horticulture program at the College of Southern Nevada is an example of a program geared toward regional
horticultural requirements. Great Basin College’s (GBC) Associate of Science in Agriculture offers animal
science, a natural resources emphasis, and rangeland livestock production. GBC partnered with UNR and
offers a 2+2 degree option, where students can receive a bachelor’s degree after two years of study at
GBC and two additional years at UNR.
Reductions to the state’s higher education system can negatively impact growth potential in Nevada’s
agriculture industry. It is recommended that funding become stable for the state’s agriculture-related
research, education, and outreach programs. These programs can continue partnering with local efforts
where appropriate as well as finding alternate sources of funding where available.
Regulations and Taxes
Producers consistently expressed concern over regulations and taxes that negatively impact agricultural
operations. Streamlining or improving regulations may allow producers to expand and improve their
businesses. Similarly, there remains contention expressed toward the federal government and how it
impacts agriculture producers. More than 60 percent of producers surveyed indicated that the federal
government costs them the most time and money. Easing these burdens could potentially help agriculture
producers expand and become more profitable.

93 | P a g e
“If we knew what it was we were doing, it would not be called research, would it?” Albert Einstein
94 | P a g e
7. Research
Primary and Secondary Research of the Agriculture Cluster Study
The primary research methods for this report were designed to gather information addressing agriculture
gaps, challenges, and obstacles pertaining to employment, regulations, government, taxes, and successes
that can be expanded or duplicated. Two surveys were administered: one to county officials, and the other
to include processors, producers, retailers, manufacturers, and service providers. The primary research
included 312 calls to producers and processors gathering information about imports, exports, and future
growth. During this phase, phone and face-to-face interviews were conducted throughout the state with
agriculture experts to better understand the agriculture industry and the economic impact of various
agriculture factors. Additional interviews were conducted with Tom Harris of the University of Nevada,
Reno’s University Center for Economic Development. John McLain of Resource Concepts, Inc. was also
invaluable in providing information about pinyon-juniper as having biomass potential.
The secondary research involved in-depth research from sources, including detailed economic impact
analysis by Ekay Economic Consultants. Research focused on the impact of the agriculture cluster by
comparing the cluster’s performance to other economic sectors in the state and agriculture industries
nationally, providing information relevant to future economic development strategies regarding the cluster,
and estimating the economic and employment impact of the cluster’s operations on Nevada and state
regions (Ekay Consultants, 2012). Additional secondary research included a review of economic reports
from the University Center for Economic Development and reports and factsheets produced by University
of Nevada Cooperative Extension.
Major sources of data used in the secondary research included:
Nevada Agricultural Statistics 2011; Nevada Department of Agriculture, October 2011
2007 Census of Agriculture-State Data; USDA National Agriculture Statistics Service
Impact Analysis for Planning (IMPLAN) model
Nevada Governor’s Office of Economic Development (GOED). July 2012
University of Nevada, Cooperative Extension

95 | P a g e
“Agriculture not only gives riches to a nation, but the only riches she can call her own.”
Samuel Johnson

96 | P a g e
8. References
Agricultural Marketing Resource Center (2012, July). Tilapia Overview. Retrieved September 30,
2012from Agricultural Marketing Resource Center
Web site: www.agmrc.org/commoditiesproducts/aquaculture/tilapia/
American Organic Hop Grower Association (2010). Benefits of the AOHGA. Retrieved September 28,
2012, from American Organic Hop Grower Association
Web site: www.usorganichops.com/AOHGA/benefits.html
Center of Excellence at Modesto Junior College. “Environmental Scan, Agriculture Value Chain:
California” June 2011.
Churchill Vineyards (2011). Our Story and Goals. Retrieved September 29, 2012, from Churchill
Vineyards
Web site: /www.churchillvineyards.com/Our_Story_and_Goals.html
Coleman‐Jensen, A., Nord, M., Andrews, M., & Carlson, S. (2011). Household Food Security in the
United States in 2010 (Economic Research Report No. (ERR‐125) 37, September 2011). Retrieved
September 16, 2012, from USDA Economic Research Service
Web site: www.ers.usda.gov/publications/err‐economic‐research‐report/err125.
Cowee, M. W., & Harris, T. R. (2010). Regulatory and Financial Considerations for Red Meat Mobile
Slaughter in Nevada. In Technical Report (UCED 2010/11‐04). Retrieved September 16, 2012, from
University Center for Economic Development
Website: http://www.ag.unr.edu/ucedReports/Technical/TechnicalStatewide2011478pdf
Curtis, K., Cowee, M., & Gatzke, H. (2009, April). Who is Shopping at Nevada’s Farmers’ Markets and
Why? (Technical Report UCED 2008/09‐24). Retrieved September 30, 2012, from University Center for
Economic Development
Web site /www.ag.unr.edu/uced/Reports/Technical/08‐0924%20Farmers'%20Market %20report‐
UCED‐Final.pdf
DETR (2011). Department of Employment, Training and Rehabilitation (DETR). Data for 2nd Quarter of
2006 and 2011.

97 | P a g e
Department of Natural Resources & Environmental Science (2012). Arid Lands Crops for Biofuels, Edible
Oils and Biomaterials. Retrieved September 29, 2012, from Department of Natural Resources and
Environmental Science
Web site: www.cabnr.unr.edu/nres/Research_Project.aspx?GrantID=591
Doyle, L. (2008, October 28). Saffron – The World's Most Expensive Spice – But the Bulbs are
Cheap[Article]. Retrieved September 28, 2012, from Organic Gardening
Web site: http://organicgardening.com/blogs/fromthetestgardens/2008/10/28/saffron‐the‐
worldsmostexpensive‐spice‐but‐the‐bulbs‐are‐cheap/
Durham, S. (2008, October 28). Hops Extract May Reduce Clostridium in Chickens [Article]. Retrieved
September 28, 2012, from USDA Agricultural Research Service
Web site: www.ars.usda.gov/is/pr/2008/081029.htm
Ekay Consultants (2012, August). Analysis of the Impact of the Agriculture Cluster on the State of
Nevada. Reno, Nevada: Ekay Economic Consultants
Fitzsimmons, K. (2012, June 28). The success story of the Tilapia industry; current and future trends of
the US seafood market [PowerPoint Slides]. Retrieved September 30, 2012, from American Tilapia
Association W Website: http://ag.arizona.edu/azaqua/ista/Markets/Vietnam2012Tilapia.ppt
Gatzke, Holly, PhD. “Developing a Local Food Industry.” University of Nevada, Reno.
Great Basin Environmental Program (2012, February). In B. L. Perryman & T. K. Stringham (Eds.),
Assessing Landscape Scale Cheatgrass Fuel Load Reduction for Protection of Great Basin Ecosystems
and Wildland‐Urban Interface Using Late Season Grazing. Retrieved September 23, 2012, from Great
Basin Environmental Program
Web site: http://greatbasinenvironmentalprogram.org/wp‐content/uploads/2012/08/2012‐
landscape proposal.pdf
Harris, Thomas. “Input-Output Model, State of Nevada (IMPLAN).” University Center for Economic
Development, University of Nevada, Reno
IMPLAN (2012). “Glossary of IMPLAN Related Terms.”
Website. http://implan.com.

98 | P a g e
Michigan State University Extension (2010). In D. S. Conner (Ed.), Model Business Plan for Season
Extension with Hoophouses (Extension Bulletin E‐3112 ‐‐ New ‐‐ June 2010). East Lansing, MI: Michigan
State University Extension.
Monterey Bay Aquarium (2011). Turning the Tide: The State of Seafood (Second Edition, Updated 2011).
Retrieved September 30, 2012, from Monterey Bay Aquarium
Web site: www.montereybayaquarium.org
Nevada Agricultural Statistics (2011). Nevada Department of Agriculture. October 2011
Nevada Agricultural Experiment Station (2008). In E. Miller, R. Narayanan, & B. Conrad (Eds.), Great
Basin Wildfire Forum: The Search for Solutions. Retrieved September 23, 2012, from Nevada Department
of Conservation and Natural Resources.
Website: http://dcnr.nv.gov/wpcontent/wildfireforum.pdf
Nevada State Office of Energy (2012). Nevada Status of Energy Report: 2011‐12. Retrieved
September30, 2012, from Nevada State Office of Energy
Web site: http://energy.nv.gov/documents/StatusofEnergyReport.pdf
Nevada Agricultural Statistics (2011). Nevada Department of Agriculture. October 2011
Nevada Agricultural Experiment Station (2008). In E. Miller, R. Narayanan, & B. Conrad (Eds.), Great
Basin Wildfire Forum: The Search for Solutions. Retrieved September 23, 2012, from
Nevada Department of Conservation and Natural Resources
Website: http://dcnr.nv.gov/wpcontent/ wildfireforum.pdf
Nevada State Office of Energy (2012). Nevada Status of Energy Report: 2011‐12.
NOAA (2010). NOAA Fisheries, Office of Science and Technology, 2010.
Pahrump Valley Winery (2012). Our Story: Pahrump Valley Winery. Retrieved September 28, 2012, from
Pahrump Valley Winery
Website: http://www.pahrumpwinery.com/About‐Us
Tahoe Ridge Winery (2010a). History of Tahoe Ridge. Retrieved September 28, 2012, from Tahoe Ridge
Winery Tahoe Ridge Winery (2010b). Vineyards. Retrieved September 29, 2012, from Tahoe Ridge
Winery

99 | P a g e
Web site: http://www.tahoeridge.com/our‐story/history‐of‐tahoe‐ridge/
Website: http://www.tahoeridge.com/wines/vineyards/
University Center for Economic Development (2008/09). Market Potential for Nevada Teff Products.
K. D. Curtis, J. S. Entsminger, M. W. Cowee, & T. R. Harris (Eds.), Technical Report (UCED 2008/09‐02).
Reno: University of Nevada, Reno.
University of Nevada Cooperative Extension (2002). In J. Davison (Ed.), Evaluating the Potential of an
Alternative Crop (Fact Sheet 02‐54). Retrieved September 29, 2012, from University of Nevada
Cooperative Extension
Web site: http://www.unce.unr.edu/publications/files/ag/2002/ fs0254.pdf
University of Nevada Cooperative Extension (2005). In K. R. Curtis & J. Monson (Agritourism:
Eds.), Opportunity for Farm Diversification in Nevada (Fact Sheet 05‐38). Retrieved September 29, 2012,
from University of Nevada Cooperative Extension
Web site: http://www.unce.unr.edu/ publications/files/ag/2005/fs0538.pdf
University of Nevada Cooperative Extension (2006). In L. Singletary & M. Smith (Eds.), Nevada
Agriculture Producer Research and Education Needs: Results of 2006 Statewide Needs Assessment
(Educational Bulletin EB‐06‐02). Retrieved September 18, 2012, from University of Nevada Cooperative
Extension
Web site: http://www.unce.unr.edu/publications/files/ag/2006/eb0602.pdf
University of Nevada Cooperative Extension (2006b). In K. R. Curtis, M. W. Cowee, & M. J. Havercamp
Eds.), Agriculture Production & Producer Needs in Nevada, 2005 (Fact Sheet ‐06‐08). Retrieved
September 30, 2012, from University of Nevada Cooperative Extension
Web site: www.unce.unr.edu/publications/files/ag/2006/fs0608.pdf
University of Nevada Cooperative Extension (2007). In K. R. Curtis & M. W. Cowee (Eds.), Markets for
Nevada Native Plants & Seeds (Special Publication‐07‐03). Retrieved September 28,
2012, from University of Nevada Cooperative Extension
Web site: www.unce.unr.edu/publications/ files/ag/2007/sp0703.pdf

100 | P a g e
University of Nevada Cooperative Extension (2008). In K. R. Curtis & M. W. Cowee (Eds.), Alternative
Marketing Options for Nevada’s Livestock Producers (Special Publication‐08‐02).
Retrieved September 30, 2012, from University of Nevada Cooperative Extension
Web site: www.unce.unr.edu/publications/files/ag/2008/sp0802.pdf
University of Nevada Cooperative Extension (2009b). In M. W. Cowee, K. R. Curtis, & H. Gaztke (Eds.),
Nevada Farmers Market Customer Profiles (Factsheet‐09‐45). Retrieved September 30, 2012, from
University of Nevada Cooperative Extension
Web site: /www.unce.unr.edu/publications/files/ag/2009/fs0945.pdf
University of Nevada Cooperative Extension (2010). In J. Davison & M. Laca (Eds.), Biomass Production
of15 Teff Varieties Grown (Fact Sheet‐10‐34). Reno: University of Nevada, Reno.
University of Nevada Cooperative Extension (2010b). In C. Bishop, H. Gatzke, & K. R. Curtis (Eds.),
Small Farm Hoop House Production of Vegetables in Desert Climates Costs & Returns, 2010(SP‐10‐11).
Retrieved September 30, 2012, from University of Nevada Cooperative Extension
Web site: http://www.unce.unr.edu/publications/files/ag/2010/sp1011.pdf
University of Nevada Cooperative Extension (2010c). In H. Gatzke & K. Curtis (Eds.), Starting a
Horticultural Business: Primary Considerations (Fact Sheet‐08‐43). Retrieved September 30, 2012, from
University of Nevada Cooperative Extension
Web site: www.unce.unr.edu/publications/files/ho/2008/fs0843.pdf
USDA (2005). Summary of Aquaculture Products Sold by Species and Size Category, United States:
2005[Table]. Available September 30, 2012, from USDA Census of Agriculture
Web site: www.agcensus.usda.gov/Publications/ 2002/Aquaculture/aquacen2005_02.pdf
USDA (2010, May). Local Food Systems: Concepts, Impacts, and Issues (Economic Research Report
No. (ERR‐97) 87 pp, May 2010). Retrieved September 28, 2012, from USDA Economic Research Service
Web site: www.ers.usda.gov/publications/err‐economic‐research‐report/ err97.aspx
USDA (2012, March 28). 2007 Census Volume 1, Chapter 1: State Level Data. Retrieved September 30,
2012, from USDA Census of Agriculture
www.agcensus.usda.gov/Publications/2007/Full_Report/Volume1,Chapter1StateLevel/Nevada/

101 | P a g e

102 | P a g e
Appendices – Available upon request from the Northern Nevada Development Authority
APPENDIX A –
University of Nevada, Reno, Cost and Return
Cost Summary
Monthly Cash flow Report
APPENDIX B –
Michigan State University Business Plan Model
APPENDIX C –
Berry and Tomato Cost and Return
Low Cost Construction
APPENDIX D –
Compendium of Food Clusters, 2009
APPENDIX E –
The Food Chain Cluster, Integrating the Food Chain in solano and Yolo Counties to Create
Economic Opportunity and Jobs