
2013 Navigate-cost containment in West Australian healthcare-our perspective
29
Western Australian Health System and Hospital Cost Containment Strategies A Preliminary Perspective on Possible Options Prepared By: John Gregg, Principal Navigate Consulting December 12th, 2013 Prepared for the Western Australian Department of Health
-
Upload
navigate-consulting -
Category
Healthcare
-
view
320 -
download
0
Transcript of 2013 Navigate-cost containment in West Australian healthcare-our perspective

Western Australian Health System and Hospital Cost Containment
StrategiesA Preliminary Perspective on Possible Options
Prepared By:John Gregg, Principal
Navigate Consulting
December 12th, 2013
Prepared for the Western Australian Department of Health

The objective of this presentation is to discuss available strategiesfor policymakers and administrators to contain healthcare costs
Discuss the components of costs as well as the factors that drive cost growth
– Spend areas vs. drivers
Differentiate between cost at the system level vs. cost at the hospital level
Discuss cost containment strategies at the system level
– Illustrate some system cost containment strategies
Discuss cost containment strategies for hospitals
– Illustrate some hospital cost containment strategies
Answer questions you might have

Health systems all over the globe pursue three essential objectivesand have to grapple with the trade-offs inherent to these
Typical Challenges
Accessibility and quality challenges are lessacute in developed countries than cost
Regionally governments are facing a majordemand and supply imbalance. For examplein Indonesia
– In 2015, 195K beds are expected to beneeded while 45K beds are currentlyavailable
– In 2015, the gap in physicians is expected tobe 27K while the gap in nurses is expectedto be 60K
Governments are rushing to fill the supply-demand gap by building hospitals at afrenzied pace with the risks of having costs explode
IncreaseQuality
ImproveAccessibility
Health Systems Objectives
ReduceCosts
Typical Challenges

Cost is of particular interest as it underlies most of the discussionsaround the future of healthcare

Health System Costs
Hospitals Costs

Hospitalizations
28%27%
22%
Comparing spend areas between 1992 and 2012, it is clear that expenditure in all areas increasing
Home Care
7%
Physician
5%
MedicalProducts
Administration
11%
Drugs
5%
Other Prof.Services
6%7%
13%14%
7%
Mental HealthServices
10%
7%
10%
1992 2012
31%

Similar trends can be observed in most developed anddeveloping countries
Evolution of Healthcare Expenditures (% of GDP)
9
8
7
6
10
11
12
13
14
15
16
17
5
4
3
1990 1991 1992 1993 1994 1995 1996 1997 1998 1999 2000 2001 2002 2003 2004 2005 2006 2007 2008 2009
% of GDP
USA
Canada
OECD
Korea
Australia
Greece
Source: OECD 2010, WHO GHO 2010, Navigate analysis

Out of the many factors driving cost growths, adoption ofnew medical technologies is by far the largest
12
PriceInflation
Technology
10
3-10
11-22
11-18
38-62
Ageing Insurance IncomeGrowthAdmin
Expenses
Source: “The impact of technological change on health care cost spending”, Smith, Heffler and Freeland, 2010, “An iconoclastic view of health cost containment”, Navigate Analysis
Defensive
Cost Drivers
Costs is a measure ofconsumption areas in the systemat a certain point in time
Cost drivers measureconsumption evolution over time
and is about identifying the factorsthat shift relative weights of eachconsumption area (e.g. drugsmoving from 6% to 10%)
Out of the many drivers of growth,adoption of new medicaltechnologies is the largestrepresenting (according to differentstudies) between 38 and 62% ofyear on year growth
Cost Drivers

Hence, to contain costs at the system level, it is imperative forpolicymakers to control technology as well as hospital spending
ControlTechnologySpending
Highest Growth Factor Highest Spending Category
ControlHospitalSpending

Given the faster rates of technology adoption, typical costcontainment policies will fail to slow healthcare costs growth
Reduce Costsnot Growth
Promote evidence basedmedicine Pay for performance
Limit access to elective services Increase public governance
Establish well designedco- payments
Encourageconsolidation
NON-EXHAUSTIVE

And given the underlying industry “disconnects”, policymakersshould not expect the system to proactively contain its costs
There are no, or little, incentives for providers in the system to contain or reduce costs as
– patients are to a large extent shielded from the financial implications of their “consumption”
– providers get in general paid more when providing additional services
– payors have limited ability to assess quality and pertinence of services
Disconnect between Needs andServices
Disconnect betweenConsumption and Payment
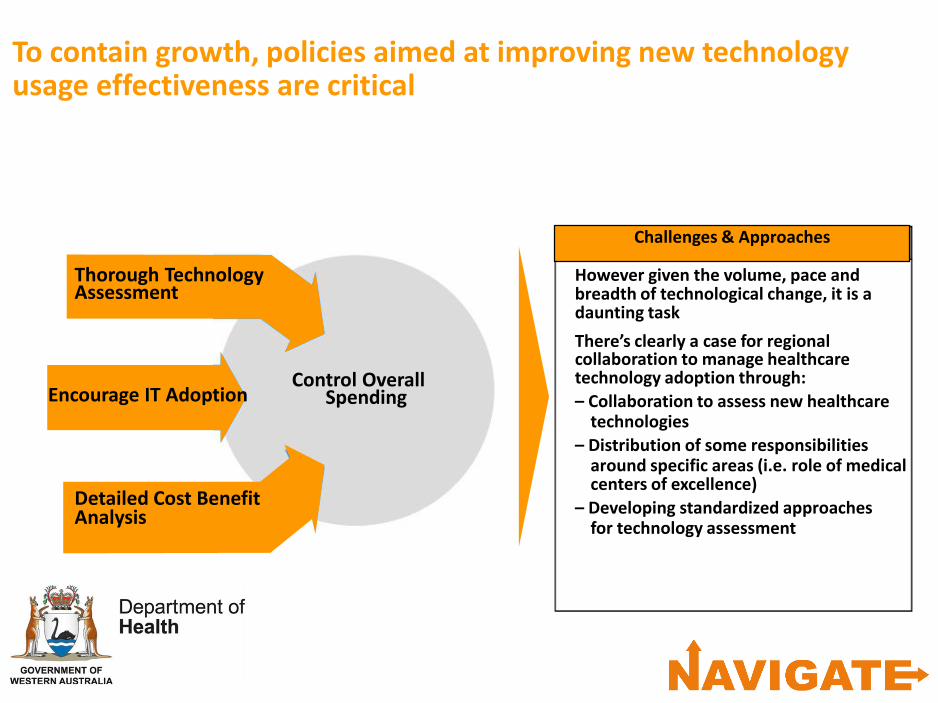
To contain growth, policies aimed at improving new technology usage effectiveness are critical
Control Overall Spending
Challenges and Approaches
However given the volume, pace andbreadth of technological change, it is adaunting task
There’s clearly a case for regionalcollaboration to manage healthcaretechnology adoption through:
– Collaboration to assess new healthcaretechnologies
– Distribution of some responsibilitiesaround specific areas (i.e. role of medicalcenters of excellence)
– Developing standardized approachesfor technology assessment
Thorough TechnologyAssessment
Encourage IT Adoption
Detailed Cost BenefitAnalysis
Challenges & Approaches

Deploying state Electronic Health Records (EHR) platforms is atremendous opportunity to improve quality and contain costs
Hospitals(e.g. MoH Hospitals,
Private Hospitals) Pharmacies Nursing Homes Patients
Private GPs Insurers Others
DataEMRCharttrackingDischargesummaries
DataEMRClinicalNotesFlowSheets
DataElectronicprescrip-tionPaymentdata
DataMedicalrecordsFamilymedicalhistory
DataMedicationinformationConsentsLiving wills
DataE-claimsHealthInsurancedata
DataPersonalHealthRecords
DataMedication,Radiologyand otherdata
Clinics(e.g. MoH Clinics,
Private Clinics)
National EHRPlatform
Benefits
Many players served (e.g.
physicians access a patient fullmedical history)
Rich datasets enable technologyeffectiveness analysis to enhancequality and improve outcomes
Major driver for cost saving
Benefits

Such policies should be complemented by policies to decreasehospitalizations
ControlHospitalSpending
ContainCosts
EnhancePopulation
Health
IncreaseCitizen
Satisfaction
Reduce spending due to:
– Lower incidence of diseases
– Better management ofchronic diseases
– Reduce hospital stays
Improve overall populationhealth by preventing diseaseand education population abouthealthy lifestyles
Improve management ofdiseases and quality of life
Improve overall citizensatisfaction with healthcaresystem by reducing pressureon hospitals, reducing ALOSand encouraging home carewhen appropriate
National Prevention Strategy
Day Surgery and HomeCare
Disease Management for ChronicPatients

For example a targeted weight loss program in New South Walespresented substantial savings in direct diabetes costs alone
Australia has some of the highestproportion ofdiabetes in theworld
Diabetes treatmentcosts areexpected to risesignificantly asobese peoplehealth consume upto 70% moreservices
High
10,000
$700
$7,000,000
10.0%
1,000
51%
510
$1000
$10,000,000
$3,000,000
Introduction of a targeted (weight loss) program
# of participants
cost of program per participant
total cost of program
success rate (% participants losing 15lb+)
# of successful participants
reduction in diabetes risk due to weight loss
reduction in # of diabetics
direct diabetic treatment cost per year
savings in diabetes costs
net savings in direct diabetes costs
Disease Management Benefits - Example

Health System Costs
Hospitals Costs

Hospitals are labor intensive and have high-fixed cost ashighlighted by labor being the largest cost component
Source: “Costing of Inpatient Services at a Public Hospital in NSW” “Bending the Curve: Hospital Cost Cutting Efforts Begin to Pay Off”, MHA, Navigate
70%Labor
21%Patient Care
Hospital Cost Distribution (Australia)Utilities and Capex
9%

To contain hospital costs, 4 strategies stand out as they balance costwith quality and accessibility as well as reduce the impact of labor
Improve ClinicalStaff Efficiency
Outsource non-core functions
Excel inOperations
Adopt IT
Challenges
GManpower shortage driving increase in clinical staff salaries highlights need for effective utilization
Low-value add activities consume professional time with limited benefits to patients
Traditional operating model based on self-sufficiency leads to wide range of in-house support functions
In-house services operate sub optimally relative to outsource entities with greater scale economics
Focus on clinical service delivery tend to blind hospital managers from the importance of operationalexcellence both in supporting clinical services and the overall hospital administration
Many hospitals function at suboptimal capacity across many functions (e.g. bed management, OR,outpatient services) due to limited expertise, low capabilities or rigidities in the system (e.g. working hours)
Adoption of IT is still limited in many hospitals to administrative (mainly financial) systems, though potentialapplications are far more broad
The manual administrative and clinical processes not only are costlier and more error prone, they usuallyare a major cause of unmotivated staff (especially clinical ones)

Improving clinical staff efficiency is crucial and should focus onimproving MD productivity and enriching nursing tasks
Improve PhysicianUtilization
Enrich NursingTasks
Limit Overtime
Reduce ContractLabor
Improve patient visit ratioImprove scheduling
Task out administrativeactivities to lower skilledstaff
Improve shift schedulingStep-up recruitment andretention efforts especiallyfor nurses
Align hiring plans withexpected service volumesTake into considerationpeaks and troughs
1
2
3
4

Our State hospitals are increasingly outsourcing non-clinicalfunctions and, when done properly, are witnessingsignificant benefits
Security
ICTFacilities
Management
Cleaning Services
Suggested Areas for
Outsourcing
WasteManagement
Potential Benefits
ReduceCosts
ImproveCoverage /Availability
ImproveEfficiency
ImproveQuality
Always retain governance ofoutsourced functions
including planning andmanagement
Revenue Cycle

Outsourcing is not about carving-out non-core functions but ratherselecting long-term partners that will continue to add value
Key Outsourcing Activities
and negativeincentives
performance reporting
Commercial criteriashould include immediatesavings as well as clearlong-term savings andimprovement in service
Govern Vendors
Closely monitorvendorsperformance
Report anydeviations fromservice levels
Identify penalties /rewards based oncontractualagreements
Procure Services
Request offers from topvendors (e.g. top three)
Assess offers based ontechnical and commercialcriteria
Technical criteria shouldincludecomprehensiveness ofscope coverage,dedicated resources,service levels as well as
DefineGovernance
Structure
Define interactionmodel with vendorpost-procurement
Retain planning andmanagement ofoutsourced functions
Clearly delineateresponsibilitiesbetween vendor
Assess MarketMaturity
Identify vendorspresent in the marketwith the capabilities tooffer the servicesrequired
Assess vendorscapabilities (e.g. RFIs,RFPs) and rank them
Identify Functionsto Outsource
Assess non-corefunctions that can beoutsourced
Documentrequirements in termsof scope of activitiesand deliverablesrequired
Define service levels,tiers as well as positive

State hospitals have at their disposal several levers for operationalexcellence that should be used to contain costs
Operational Excellence
Optimize Occupancy Rates– Improve bed utilization– Optimize scheduling– Optimize ADT processes
Optimize OR utilization– Optimize usage time– Optimize scheduling– Improve logistics (e.g.
clean/dirty pathways)– Diversify OR types
Decrease ALOS– Promote Evidence Based
Medicine– Manage Physicians
Performance
Optimize Supply Chain– Reduce supplies variability– Standardize suppliers– Forecast demand and
analyze spend

SavingsPotential%
20-25% 15-20% 5-10% 8-12% 10-20%
EaseofImplementation
3 3 1 1 2
For our hospitals, non-medical items and medical supplies presentthe biggest opportunity for savings
10,837
18,223
28,530
41,493
57,089
Non-Medical
MedicalSupplies
MedicalEquipment
Pharmaceutical Implants
Typical WA Hospital Operating CostsProcurement Addressable Spend categories
Cost per Bed in $AUS
21 - 38%
44 - 70%Labor
Utilities andCapex
100%
9-18%
Patient Care
Average of AUS 6 Mn inPurchasing Savings for a
300 Bed Hospital
Source: Navigate review of Royal Perth Hospital cost inputs

There are several levers to capture these cost reductions andshould be selectively applied by our 6 metropolitan hospitals
Note: Savings ranges assume standalone implementation
Initiative
Clean Up ItemMaster
Description
Develop a clean item masterEstablish common taxonomyReduce/standardize products
SavingsImpact
High
TimeRequired
2 to 3months
SpendAnalytics
Increase spend transparencyTrack usage and tie supplies to medical proceduresReduce storage costs and inventory obsolescenceAnalyze product life cycle view (“total cost of ownership”)
High 2- 3months
Sourcing andContractingEfficiency
SupplierRelationshipManagement
Develop specific sourcing strategy for product categoriesImplement processes for product selection, standardizationand utilizationEstablish contract and procurement controls
Increase of the no of potential suppliers considered for bidsSwitch to cost-advantaged suppliersRestructure and reduce supply baseRe-negotiate contracts
Medium
Medium
4-6months
4-6months
PerformanceManagement
Improved coordination between supply chain & clinical teamsImprove procure to pay processAutomate systems and establish inter-linkages betweenhospital departments
High3-4
months

A proper diagnostic across all spend areas should be done tounderstand sourcing levers and identify savings opportunities
Medical Supplies SKU Proliferation
Medical Supplies: High fragmentation due to numerousrequisitioners and limited product selection controls
Pharmaceuticals: Minimal use of lower costalternatives within a highly complex drug portfolio
Branded w/Genericalternate availGeneric w/Branded
alternate avail
Therapeutic AreaSKU Tree
Implants: Strong loyalty to high-price suppliers and high-end device functionality
OthersSupplier 8Supplier 7Supplier 6Supplier 5Supplier 4Supplier 3Supplier 2Supplier 1
Supplier Utilization Pricing Structure for FunctionallyEquivalent Devices
Current price
Supplier 1
Current price
Supplier 2
For each spend area, developed category summarieshighlighting key sourcing levers and savings opportunities
Pharmaceuticals by Patent Type
Branded only purchased
Branded only purchased
Generic onlypurchased

Ease
of Im
ple
me
nta
tio
n1
High
Savings can be captured rapidly by segmenting the high priorityareas by distinct savings capture approaches
$0 $1 $2 $3 $4 $5 $6 $7 $8
Travel
HR
Prof Svcs
Implants
Building Ops
ITChem/ReagentsMarketing
Equip
Utilities
Med Svcs
Med Supplies Pharma
HighLowPotential Savings Opportunity ($M)
Low
1) Ease of Implementation factors include strong senior support, alignment across functions, ability to modify specifications, minimal disruption to operations and limited political sensitivity
Note: Size of bubble is proportional to category spendSource: Navigate Analysis of RPH as part of this project
Sourcing Opportunity Size and Ease of Implementation
Office Supplies
Savings CaptureApproach
StrategicSourcing
Rapid Sourcing
Launch broad strategicsourcing efforts to capturethe maximum opportunityacross supply and demandlevers
Leverage current marketconditions to increasecompetitive pressure incentrally-driven categoriesand tail of department/functional spend
SpendManagement(influences multiple
categories)
Design basic spendmanagement processes,policies, and tools to quicklyestablish control andvisibility
Strategic SourcingRapid SourcingFuture Waves
WA Example
Description

Health IT benefits include reduction in costs and also significantimprovements in overall quality with a reduction in errors
Health IT Benefits
Source: Navigate Analysis
Clinical
Benefits
Financial Operational
1
23
Enables clinical decision supportProvides real time access to historical data onthe patient thus reducing redundant tests
Educates patient on health trends throughvarious channels such as portalsReduce medical errors such as adverse drugevents
Increases nurse productivity bymonitoring utilization and automatingclinical workflows
Eliminates human error, thusincreasing process efficiencyReduces denial rates for claims
Eliminates cost of overhead associatedwith managing paper medical records
Reduces manpower requirements byautomating several clinical and operationalworksteps
Provides socio economic benefits (e.g.reduces cost of care, greater access tohealthcare) within 4-10 years of theinvestment
… and freeing up skilled resources to take care of the patients

Our survey among hospital administrators across Australia highlighted the many clinical and administrative benefitsof patient medical records
BetterAdherence toBest Practices
Faster Accessto Patient
HistoryFaster Search
forDocumentation
BetterTreatment
and Medication
BetterDiagnostic
EHR Benefits
Clinical Administrative
Source: “Best Practice Review of Shared Health Record Sites in Australia 2013, Navigate Consulting
Clinical and Administrative Benefits Overview
ReducedDuplication of
Tests

In summary, containing healthcare costs at the system andprovider level is challenging given the underlying dynamics…
Healthcare costs are increasing and cost growth is speeding up
Traditional cost containments strategies can cut costs but won't slow cost growth
Costs can be contained at the hospital levels by
– Improve clinical staff efficiency
– Outsourcing of non-core functions
– Excel in operations- Adopt IT
…however policymakers and administrators can use a set of leversto achieve this without compromising quality and accessibility