2013 NAEP Reading and Mathematics:Summary of …€¦ · Web viewThey should be able to interpret...
63
2013 NAEP Reading and Mathematics: Summary of State Results
Transcript of 2013 NAEP Reading and Mathematics:Summary of …€¦ · Web viewThey should be able to interpret...

2013 NAEP Reading and Mathematics:Summary of State Results
November 2013
Massachusetts Department of Elementary and Secondary Education75 Pleasant Street, Malden, MA 02148
Phone 781-338-3000 TTY: N.E.T. Relay 800-439-2370www.doe.mass.edu

This document was prepared by the Massachusetts Department of Elementary and Secondary Education
Mitchell D. Chester, Ed.D.Commissioner
The Massachusetts Department of Elementary and Secondary Education, an affirmative action employer, is committed to ensuring that all of its programs and
facilities are accessible to all members of the public.We do not discriminate on the basis of age, color, disability, national origin, race,
religion, sex or sexual orientation.Inquiries regarding the Department’s compliance with Title IX and other civil rights
laws may be directed to theHuman Resources Director, 75 Pleasant St., Malden, MA 02148 781-338-6105.
© 2013 Massachusetts Department of Elementary and Secondary EducationPermission is hereby granted to copy any or all parts of this document for non-
commercial educational purposes. Please credit the “Massachusetts Department of Elementary and Secondary Education.”
This document printed on recycled paper
Massachusetts Department of Elementary and Secondary Education75 Pleasant Street, Malden, MA 02148-4906
Phone 781-338-3000 TTY: N.E.T. Relay 800-439-2370http://www.doe.mass.edu/
2
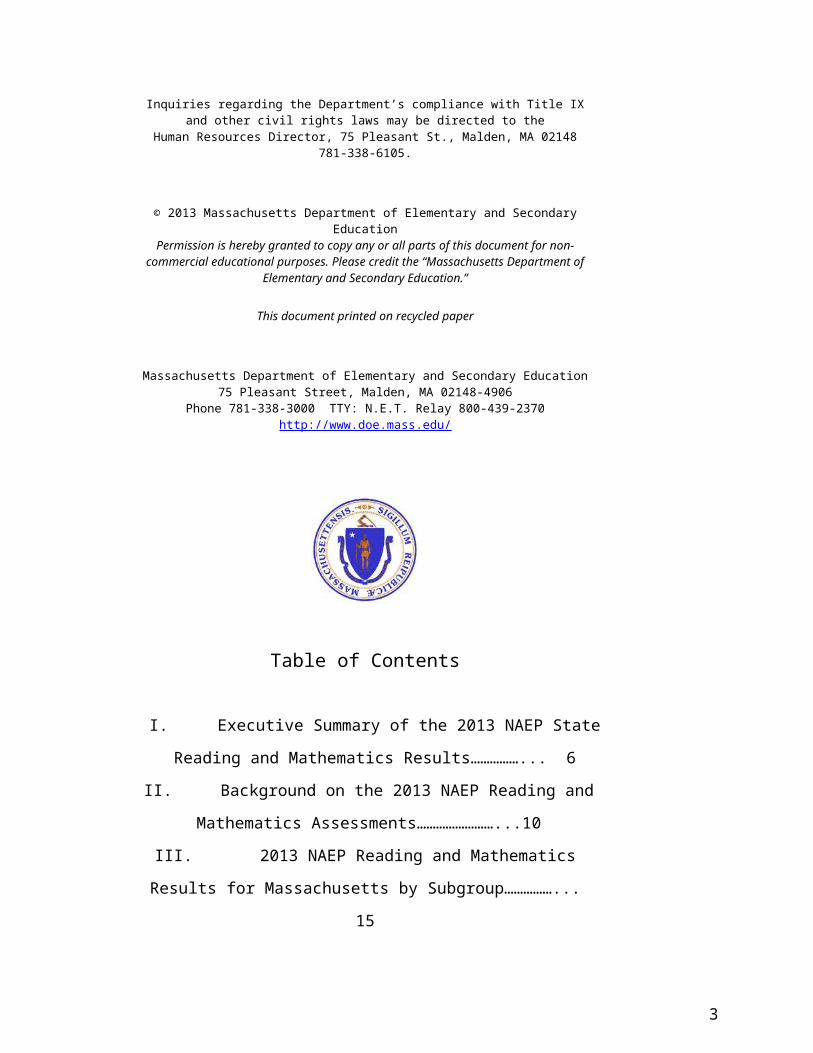
Table of Contents
I. Executive Summary of the 2013 NAEP State Reading and
Mathematics Results……………... 6
II. Background on the 2013 NAEP Reading and Mathematics
Assessments……………………...10
III. 2013 NAEP Reading and Mathematics Results for
Massachusetts by Subgroup……………... 15
IV. 2013 NAEP Reading and Mathematics Results for
Massachusetts by School
Location………………………………………………………
………………………………... 23
V. 2013 NAEP Reading and Mathematics Results for Massachusetts by Parents’ Level of
Education………………………………………………………………
………………………. 26
VI. 2013 NAEP Reading Achievement Level Descriptions for
Grade 4 ……………..................... 27
VII. 2013 NAEP Reading Achievement Level Descriptions for
Grade 8……………....................... 29
VIII. 2013 NAEP Mathematics Achievement Level Descriptions for
Grade 4 ….............................. 31
IX. 2013 NAEP Mathematics Achievement Level Descriptions for Grade 8…................................ 32
X. NAEP Assessment Glossary…………………………………………………………………
… 34
3

Table of Contents
I. Executive Summary of the 2013 NAEP State Results in Reading and Mathematics……………………………………………………………………….4
II. Background Information on the 2013 NAEP reading and Mathematics Assessments…………………………………...…………………………………..8
III. 2013 NAEP Reading and Mathematics Results by Subgroup……………….12
IV. 2013 NAEP Reading and Mathematics Results by School Location………..20
V. 2013 NAEP Reading and Mathematics Results by Parent’s Level of Education.………………………………………………………………...............23
VI. 2013 NAEP Grade 4 Reading Achievement Level Descriptions……………24
VII. 2013 NAEP Grade 8 Reading Achievement Level Descriptions...................26
VIII. 2013 NAEP Grade 4 Mathematics Achievement Level Descriptions……..28
IX. 2013 NAEP Grade 8 Mathematics Achievement Level Descriptions……….29
NAEP Assessment Reporting Glossary………………………………………….31
4

I. Executive Summary of the 2013 NAEP State Results in Reading and Mathematics
Fifty states took part in the 2013 state administration of the National Assessment of Educational Progress (NAEP) reading and mathematics assessments at grades 4 and 8. In Massachusetts, grade 4 students from 177 schools and grade 8 students from 144 schools participated in the 2013 NAEP state assessments; 9,000 students were assessed in reading and 8,800 students were assessed in mathematics. This report provides state-level results for the reading and mathematics assessments.
□ Interpreting this Report
When reviewing this report, it is important to keep in mind that the NAEP results are based on a sample of students across Massachusetts and not on the population of Massachusetts students. In analyzing the results, tests of significance were used to determine differences in the data that could be confidently characterized as not occurring by chance. This type of difference is commonly referred to as a statistically significant difference. In the report’s tables, an asterisk is used to denote a value that is significantly different from the value for the nation’s public schools.
□ Overall Performance for Reading
Massachusetts tied for first on the grades 4 and 8 NAEP reading test. Based on average scale scores, Massachusetts tied for first in the nation with four states at
grade 4. At grade 8, Massachusetts tied for first in the nation with two states. In reading at grade 4, the percentage of Massachusetts students scoring at or above the
Proficient level was higher than the percentage of students at or above the Proficient level in 46 states and no different from the percentage of students at or above the Proficient level in the remaining 3 states. At grade 8, the percentage of Massachusetts students scoring at or above the Proficient level in reading was higher than the percentage of students at or above the Proficient level in 46 states and no different from the percentage of students at or above the Proficient level in the remaining 3 states.
Students in Massachusetts outperformed students nationally on the NAEP reading tests. The average scale score of Massachusetts grade 4 students on the reading assessment was
232, higher than the national average of 221. Eighth-grade Massachusetts students (277) also outscored their counterparts nationwide (266).
Forty-seven percent of Massachusetts grade 4 students and 48 percent of grade 8 students scored at or above the Proficient level. These percentages were higher than the comparable percentages of students nationally who scored at or above the Proficient level (34 percent at both grades 4 and 8).
5

□ Overall Performance for Mathematics
Massachusetts tied for first with two other states on the grade 4 mathematics assessment and outperformed all other states on the grade 8 mathematics assessment.
Based on average scale scores, Massachusetts tied for first in the nation at grade 4 with two other states. At grade 8, Massachusetts outperformed all other states.
In mathematics at grade 4, the percentage of Massachusetts students scoring at or above the Proficient level was higher than the percentage of students at or above the Proficient level in 47 states and no different from the percentage of students at or above the Proficient level in two states. At grade 8, the percentage of Massachusetts students scoring at or above the Proficient level in mathematics was higher than the percentage of students at or above the Proficient level in 49 states.
Students in Massachusetts outperformed students nationally on the NAEP mathematics tests. The average scale score of Massachusetts grade 4 students on the mathematics
assessment was 253, higher than the national average of 241. Eighth-grade Massachusetts students (301) also outscored their counterparts nationwide (284).
Fifty-eight percent of Massachusetts grade 4 students and 55 percent of grade 8 students scored at or above the Proficient level. These percentages were higher than the comparable percentages of students nationally who scored at or above the Proficient level (41 percent at grade 4 and 34 percent at grade 8).
6

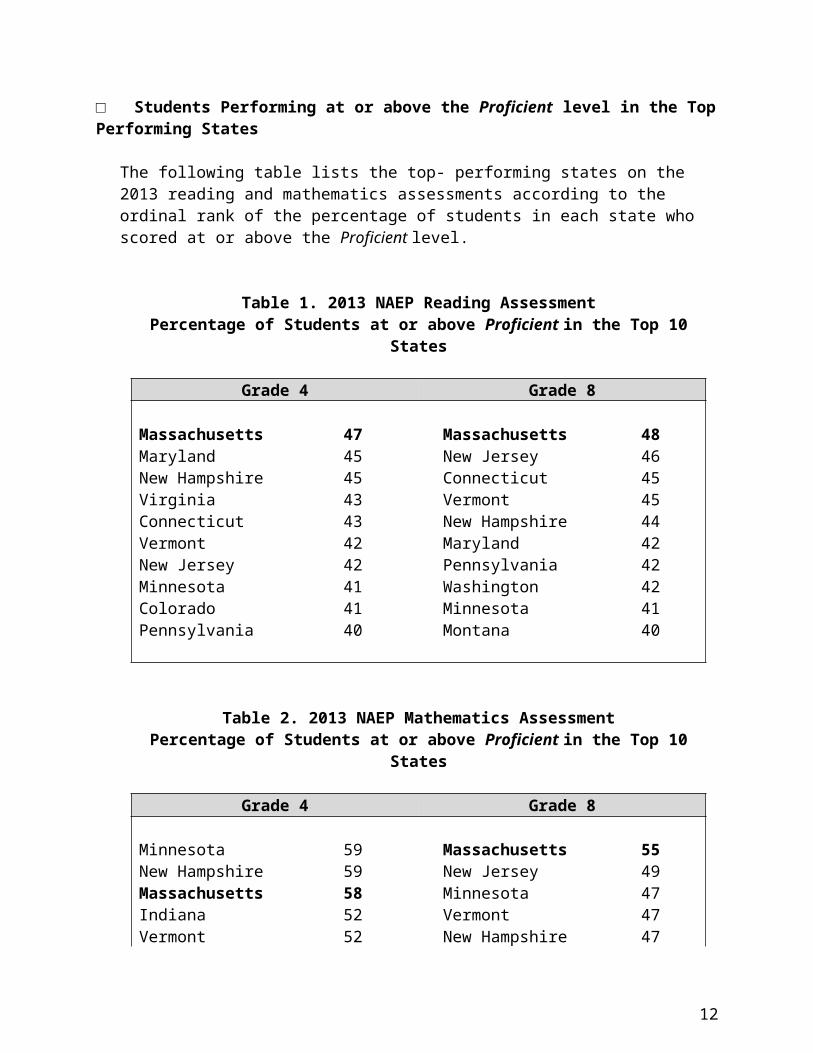
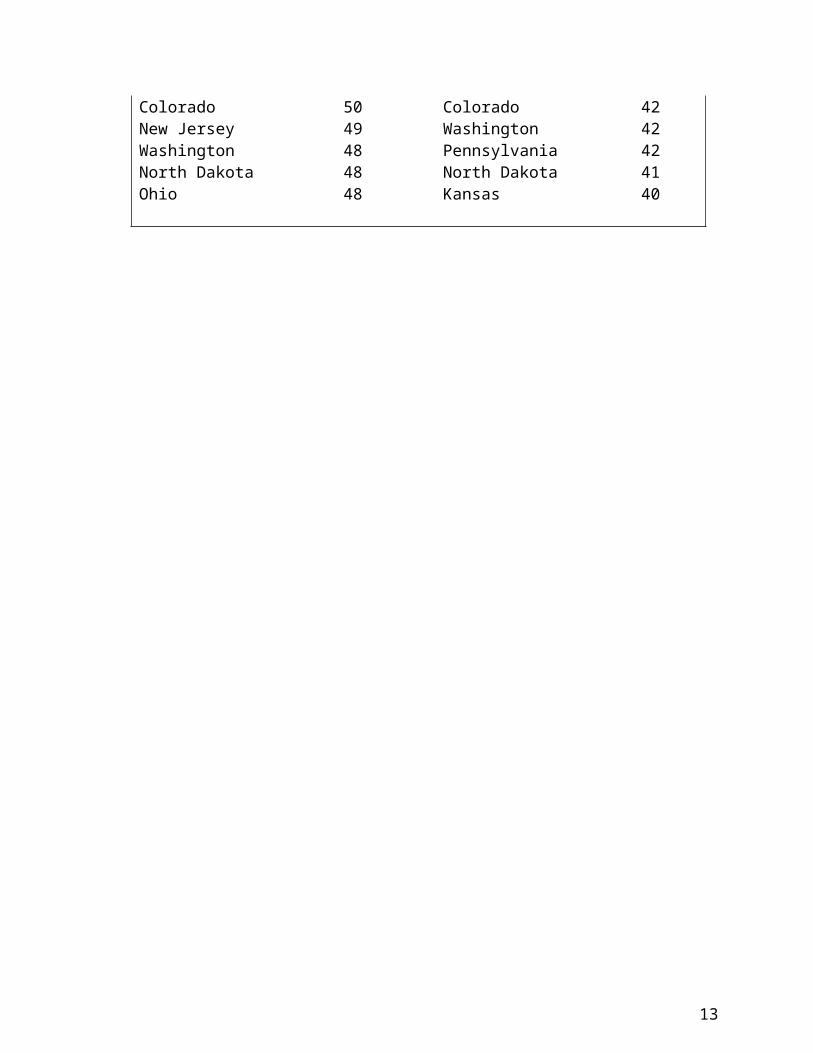
□ Students Performing at or above the Proficient level in the Top Performing States
The following table lists the top- performing states on the 2013 reading and mathematics assessments according to the ordinal rank of the percentage of students in each state who scored at or above the Proficient level.
Table 1. 2013 NAEP Reading AssessmentPercentage of Students at or above Proficient in the Top 10 States
Grade 4 Grade 8
Massachusetts 47 Massachusetts 48Maryland 45 New Jersey 46New Hampshire 45 Connecticut 45Virginia 43 Vermont 45Connecticut 43 New Hampshire 44Vermont 42 Maryland 42New Jersey 42 Pennsylvania 42Minnesota 41 Washington 42Colorado 41 Minnesota 41Pennsylvania 40 Montana 40
Table 2. 2013 NAEP Mathematics AssessmentPercentage of Students at or above Proficient in the Top 10 States
Grade 4 Grade 8
Minnesota 59 Massachusetts 55New Hampshire 59 New Jersey 49Massachusetts 58 Minnesota 47Indiana 52 Vermont 47Vermont 52 New Hampshire 47Colorado 50 Colorado 42New Jersey 49 Washington 42Washington 48 Pennsylvania 42North Dakota 48 North Dakota 41Ohio 48 Kansas 40
7

□ Student Subgroup Performance in Reading in Massachusetts Compared to the Nation
Race/Ethnicity : In 2013, at both grades 4 and 8, White students in Massachusetts outperformed their counterparts nationally. The performance of Massachusetts Hispanic, African/Black, and Asian students at both grades did not differ significantly from the performance of their counterparts nationally.
Gender : At grades 4 and 8, both female and male students in Massachusetts outscored their counterparts nationally.
Student Status : At both grades 4 and 8, students with disabilities and students eligible for free or reduced price lunch in Massachusetts outscored their counterparts nationally. English language learner students in Massachusetts in both grades scored significantly lower than their counterparts in the nation.
□ Student Subgroup Performance in Mathematics in Massachusetts Compared to the Nation
Race/Ethnicity : In 2013, grade 4 White, African American/Black, and Asian students in Massachusetts outperformed their counterparts nationally. At grade 8, Massachusetts White, African American/Black, Hispanic, and Asian students outperformed their counterparts nationally. The performance of Massachusetts Hispanic students at grade 4 did not differ significantly from the performance of their counterparts nationally.
Gender : At grades 4 and 8, both female and male students in Massachusetts outscored their counterparts nationally.
Student Status : At both grades 4 and 8, students with disabilities and students eligible for free/reduced lunch students in Massachusetts outscored their counterparts nationally. However, there was no significant difference between the performance of English language learner students in Massachusetts and the national average at both grades.
8

II. Background Information on the NAEP Reading and Mathematics Assessments
Participation in NAEP state assessments in reading and mathematics at grades 4 and 8 is mandated by the No Child Left Behind (NCLB) Act. Students from 50 states participated in the 2013 NAEP state assessments in reading and mathematics. Across the nation, roughly 350,000 fourth- and eighth grade students were assessed in reading. Roughly 345,000 fourth- and eighth- grade students were assessed in mathematics.
□ Test Content of the Reading Assessment
The 2013 NAEP reading framework approved by the National Assessment Governing Board carries forward changes that were made in 2009 to include more emphasis on literary and informational texts, a redefinition of reading cognitive processes, a systemic assessment of vocabulary knowledge, and the addition of poetry at grade 4. Results from special analyses conducted in 2009 determined that, even with these changes to the assessment, results could continue to be compared to those from earlier assessment years.
Table 3. 2013 NAEP Reading AssessmentDistribution of Questions by Cognitive Skill across the Test
Field of Reading Grade 4 Grade 8
Locate and Recall: locating or recalling information from what they have read, students may identify explicitly stated main ideas or may focus on specific elements of a story.
Integrate and Interpret: when integrating and interpreting what they have read, students may make comparisons, explain character motivation, or examine relations of ideas across the text.
Critique and Evaluate: when critiquing or evaluating what they have read, students view the text critically by examining it from numerous perspectives or may evaluate overall text quality or the effectiveness of particular aspects of the text.
30%
50%
20%
20%
50%
30%
9

□ Test Content of the Mathematics Assessment
The 2013 NAEP mathematics framework approved by the National Assessment Governing Board specifies that each question in the assessment measure one of five mathematical content areas. Although the names of the content areas, as well as some of the topics in those areas, have changed over the years, there has been a consistent focus across frameworks on collecting information about students’ performance in the following five areas: number properties and operations; measurement; geometry; data analysis, statistics, and probability; and algebra.
Table 4. 2013 NAEP Mathematics AssessmentDistribution of Questions By Content Area Across the Test
Field of Mathematics Grade 4 Grade 8
Number properties and operations measures students’ understanding of ways to represents, calculate, and estimate with numbers.
Measurement assesses students’ knowledge of units of measurement for such attributes as capacity, length, area, volume, time, angles, and rates.
Geometry measures students’ knowledge and understanding of shapes in two and three dimensions, and relationships between shapes such as symmetry and transformations.
Data analysis, statistics, and probability measures students’ understanding of data representation, characteristics of data sets, experiments and samples, and probability.
Algebra measures students’ understanding of patterns, using variables, algebraic representation, and functions.
40%
20%
15%
10%
15%
20%
15%
20%
15%
30%
10
□ Types of Questions on the Reading and Mathematics Assessments
The NAEP reading and mathematics assessments contained three types of questions, or items: multiple-choice, short constructed-response, and extended constructed-response.
□ Student Participation
Each student selected for NAEP participates in only one subject-area test, and he/she takes only a portion of the entire test in that subject. For instance, a student chosen for the 2013 reading or mathematics test took two 25-minute blocks or sets of test items out of a total of 13 blocks of items at that grade level.
NAEP spirals blocks of items into different test booklets, administers them to representative samples of students, and combines the results in order to produce average scale scores for the entire group and for subgroups of student populations. This approach reduces the burden on each individual student.
□ Reporting
Student performance on NAEP is indicated in two ways—scale scores and achievement levels. The NAEP reading and mathematics assessment scales range from 0 to 500. Performance for each grade is scaled separately. Therefore, average scale scores cannot be compared across grades.
Achievement levels are used to describe expectations for student performance according to a set of standards for what students should know and be able to do. The three achievement levels are Basic, Proficient, and Advanced.
Basic denotes partial mastery of prerequisite knowledge and skills that are fundamental for proficient work at a given grade. Examples of skills demonstrated by students performing at the Basic level:
In Reading, fourth-grade students should be able to locate relevant information, make simple inferences, and use their understanding of the text to identify details that support a given interpretation or conclusion. Students should be able to interpret the meaning of a word as it is used in the text.
In Reading, eighth-grade students should be able to locate information; identify statements of main idea, theme, or author’s purpose; and make simple inferences from texts. They should be able to interpret the meaning of a word as it is used in the text. Students performing at this level should also be able to state judgments and give some support about content and presentation content.
In Mathematics, fourth-grade students should show some evidence of understanding the mathematical concepts and procedures in the five NAEP content areas.
In Mathematics, eighth-grade students should exhibit evidence of conceptual and procedural understanding in the five NAEP content areas. This level of performance
11
signifies an understanding of arithmetic operations—including estimation—on whole numbers, decimals, fractions, and percents.
Proficient represents solid academic performance. Students reaching this level have demonstrated competency over challenging subject matter. Examples of skills demonstrated by students performing at the Proficient level:
In Reading, fourth-grade students should be able to integrate and interpret texts and apply their understanding of the text to draw conclusions and make evaluations.
In Reading, eighth-grade students should be able to provide relevant information and summarize main ideas and themes. They should be able to make and support inferences about a text, connect parts of a text, and analyze text features. Students performing at this level should also be able to fully substantiate judgments about content and presentation of content.
In Mathematics, fourth-grade students should consistently apply integrated procedural knowledge and conceptual understanding to problem solving in the five NAEP content areas.
In Mathematics, eighth-grade students should apply mathematical concepts and procedures consistently to complex problems in the five NAEP content areas.
Advanced represents superior performance. Examples of skills demonstrated by students performing at the Advanced level:
In Reading, fourth-grade students should be able to make complex inferences and construct and support their inferential understanding of the text. Students should be able to apply their understanding of a text to make and support a judgment.
In Reading, eighth-grade students should be able to make connections within and across texts and to explain causal relations. They should be able to evaluate and justify the strength of supporting evidence and the quality of an author’s presentation. Students performing at the Advanced level should be able to manage the processing demands of analysis and evaluation by stating, explaining, and justifying.
In Mathematics, fourth-grade students should apply integrated procedural knowledge and conceptual understanding to complex and non-routine real-world problem solving in the five NAEP content areas.
In Mathematics, eighth-grade students should be able to reach beyond the recognition, identification, and application of mathematical rules in order to generalize and synthesize concepts and principles in the five NAEP content areas.
12

III. 2013 NAEP Reading and Mathematics Results by Subgroup
Student performance data are reported for public school students in Massachusetts and the nation according to the following demographic characteristics:
Race/ethnicity Gender Student eligibility for the National School Lunch Program Type of school location Parents’ highest level of education
Results for each of the characteristics are reported in tables that include the percentage of students in each subgroup in the first column. The columns to the right show the average scale score and the percentage of students at each achievement level.
The reader is cautioned against making causal inferences about subgroup differences, as a complex mix of educational and socioeconomic factors may affect student performance.
□ Race/Ethnicity
The race/ethnicity of each student was reported by the schools. The next four tables show reading and mathematics average scale scores, achievement level data, and population percentages for public school students at grades 4 and 8 in Massachusetts and the nation by race/ethnicity.
Table 5-A. 2013 NAEP Reading AssessmentGrade 4 Performance by Race/Ethnicity
Percentage of Students
Race/Ethnicity
Percentage of
Students
Average Scale Score
Below
Basic
At or Above Basic
At or Above
ProficientAt
AdvancedWhite
Nation 51 231* 21* 79* 45* 11*Massachusetts 64 241 13 87 57 17
African American/BlackNation 15 205 50 50 17 2Massachusetts 7 209 45 55 21 3
HispanicNation 25 207 48 52 19 3Massachusetts 18 208 44 56 20 3
Asian/Pacific IslanderNation 5 235 21 79 51 18Massachusetts 7 240 17 83 57 22
* Value is significantly different from the value for the same subgroup in Massachusetts due to the larger national sample size.
13

Table 5-B. 2013 NAEP Reading Assessment:Grade 8 Performance by Race/Ethnicity
Percentage of Students
Race/Ethnicity
Percentage of
Students
Average Scale Score
Below
Basic
At or Above Basic
At or Above
ProficientAt
AdvancedWhite
Nation 53 275* 15* 85* 44* 5*Massachusetts 67 285 9 91 57 10
African American/BlackNation 15 250* 40 60 16* 1Massachusetts 9 255 36 64 24 2
HispanicNation 23 255 33 67 21 1Massachusetts 16 253 36 64 20 1
Asian/Pacific IslanderNation 5 279 15* 85* 50 9Massachusetts 6 286 9 91 56 14
* Value is significantly different from the value for the same subgroup in Massachusetts due to the larger national sample size.
Table 6-A. 2013 NAEP Mathematics AssessmentGrade 4 Performance by Race/Ethnicity
Percentage of Students
Race/Ethnicity
Percentage of
Students
Average Scale Score
Below
Basic
At or Above Basic
At or Above
ProficientAt
AdvancedWhite
Nation 51 250* 9* 91* 54* 10*Massachusetts 64 260 4 96 68 18
African American/BlackNation 16 224* 34 66 18 1Massachusetts 7 230 29 71 26 5
HispanicNation 25 230 27 73 26 2Massachusetts 18 234 25 75 32 5
Asian/Pacific IslanderNation 5 258* 9* 91 64 23Massachusetts 7 266 4 96 72 31
* Value is significantly different from the value for the same subgroup in Massachusetts due to the larger national sample size.
14

Table 6-B. 2013 NAEP Mathematics AssessmentGrade 8 Performance by Race/Ethnicity
Percentage of Students
Race/ethnicity
Percentage of
Students
Average Scale Score
Below
Basic
At or Above Basic
At or Above
ProficientAt
AdvancedWhite
Nation 53 293* 17* 83* 44* 11*Massachusetts 67 307 8 92 63 21
African American/BlackNation 15 263* 49* 51 14* 2*Massachusetts 9 277 33 67 28 6
HispanicNation 23 271* 38* 62 21* 3Massachusetts 16 277 31 69 28 4
Asian/Pacific IslanderNation 5 306* 13* 87* 60 25*Massachusetts 6 323 7 93 78 42
* Value is significantly different from the value for the same subgroup in Massachusetts due to the larger national sample size.
□ Gender
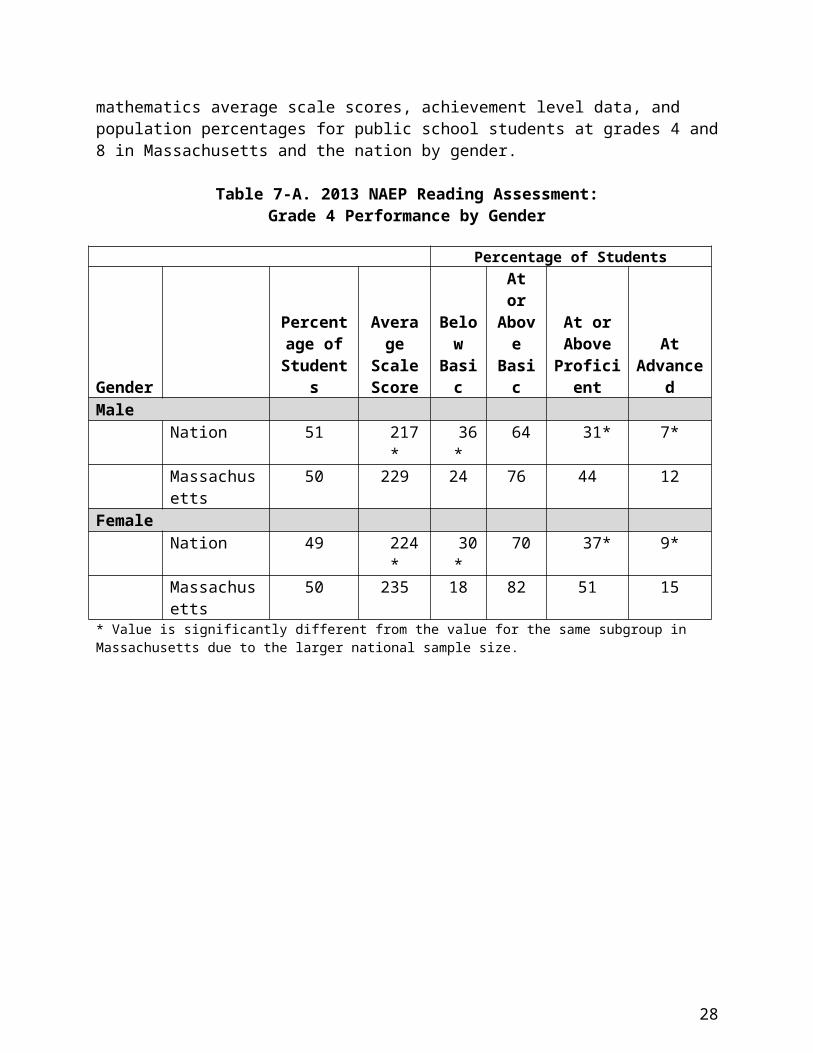
Information on student gender is reported by the student’s school when rosters of the students eligible to be assessed are submitted to NAEP. The next four tables show reading and mathematics average scale scores, achievement level data, and population percentages for public school students at grades 4 and 8 in Massachusetts and the nation by gender.
Table 7-A. 2013 NAEP Reading Assessment:Grade 4 Performance by Gender
Percentage of Students
Gender
Percentage of
Students
Average Scale Score
Below Basic
At or Above Basic
At or Above
ProficientAt
AdvancedMale
Nation 51 217* 36* 64 31* 7*Massachusetts 50 229 24 76 44 12
FemaleNation 49 224* 30* 70 37* 9*Massachusetts 50 235 18 82 51 15
* Value is significantly different from the value for the same subgroup in Massachusetts due to the larger national sample size.
15

Table 7-B. 2013 NAEP Reading Assessment:Grade 8 Performance by Gender
Percentage of Students
Gender
Percentage of
Students
Average Scale Score
Below Basic
At or Above Basic
At or Above
ProficientAt
AdvancedMale
Nation 51 261* 27* 73* 29* 2*Massachusetts 50 273 19 81 43 6
FemaleNation 49 271* 19* 81* 40* 5*Massachusetts 50 281 13 87 54 10
* Value is significantly different from the value for the same subgroup in Massachusetts due to the larger national sample size.
Table 8-A. 2013 NAEP Mathematics Assessment:Grade 4 Performance by Gender
Percentage of Students
Gender
Percentage of
Students
Average Scale Score
Below Basic
At or Above Basic
At or Above
ProficientAt
AdvancedMale
Nation 51 242* 18* 82* 42* 7*Massachusetts 50 253 11 89 59 16
FemaleNation 49 241* 18* 82* 40* 7*Massachusetts 50 253 9 91 58 15
* Value is significantly different from the value for the same subgroup in Massachusetts due to the larger national sample size.
Table 8-B. 2013 NAEP Mathematics Assessment:Grade 8 Performance by Gender
Percentage of Students
Gender
Percentage of
Students
Average Scale Score
Below Basic
At or Above Basic
At or Above
ProficientAt
AdvancedMale
Nation 51 284* 27* 73* 35* 9*Massachusetts 50 301 15 85 54 19
FemaleNation 49 283* 27* 73* 34* 7*Massachusetts 50 300 14 86 55 17
* Value is significantly different from the value for the same subgroup in Massachusetts due to the larger national sample size.
16

□ Free/Reduced-Price Lunch
NAEP collects data on student eligibility for the federal program providing free or reduced-price school lunches. The free/reduced-price lunch component of the National School Lunch Program (NSLP) offered through the U.S. Department of Agriculture (USDA) is designed to ensure that children near or below the poverty line receive nourishing meals. Eligibility is determined through the USDA’s Income Eligibility Guidelines, and is included as an indicator of lower family income. The following four tables show average scale scores, achievement level data, and population percentages for public school students at grades 4 and 8 in Massachusetts and the nation by eligibility for the NSLP.
Table 9-A. 2013 NAEP Reading Assessment:Grade 4 Performance by Free/Reduced Price Lunch Eligibility
Percentage of Students
Eligibility Status
Percentage of
Students
Average Scale Score
Below
Basic
At or Above Basic
At or Above
ProficientAt
AdvancedEligible
Nation 54 207* 47 53* 20* 3Massachusetts 39 213 39 61 25 3
Not EligibleNation 46 236* 17* 83* 51* 14*Massachusetts 61 245 10 90 62 21
* Value is significantly different from the value for the same subgroup in Massachusetts due to the larger national sample size.
Table 9-B. 2013 NAEP Reading Assessment:Grade 8 Performance by Free/Reduced Price Lunch Eligibility
Percentage of Students
Eligibility Status
Percentage of
Students
Average Scale Score
Below
Basic
At or Above Basic
At or Above
ProficientAt
AdvancedEligible
Nation 49 254* 34* 66 20* 1Massachusetts 38 260 29 71 28 2
Not EligibleNation 50 278* 13* 87* 48* 6*Massachusetts 62 288 7 93 61 12
* Value is significantly different from the value for the same subgroup in Massachusetts due to the larger national sample size.
17
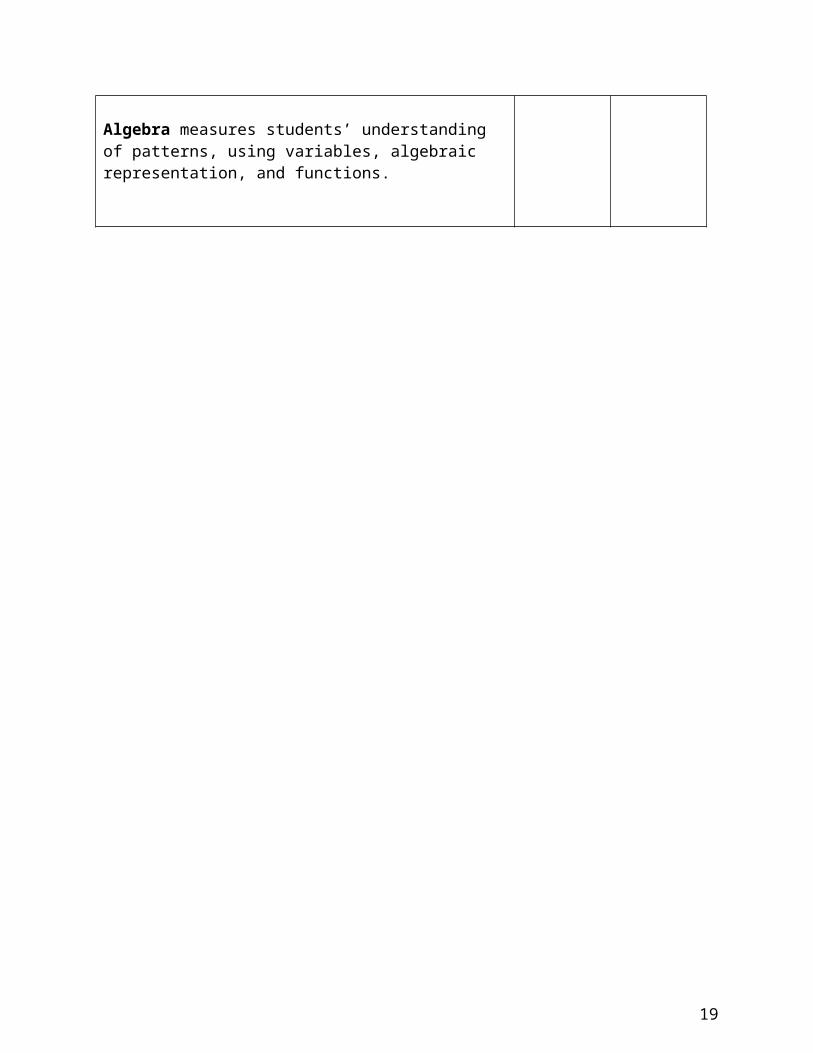
Table 10-A. 2013 NAEP Mathematics Assessment:Grade 4 Performance by Free/Reduced Price Lunch Eligibility
Percentage of Students
Eligibility Status
Percentage of
Students
Average Scale Score
Below
Basic
At or Above Basic
At or Above
ProficientAt
AdvancedEligible
Nation 54 230* 27* 73 26* 2*Massachusetts 40 237 21 79 35 5
Not EligibleNation 46 254* 7* 93* 60* 14*Massachusetts 60 264 3 97 74 23
* Value is significantly different from the value for the same subgroup in Massachusetts due to the larger national sample size.
Table 10-B. 2013 NAEP Mathematics Assessment:Grade 8 Performance by Free/Reduced Price Lunch Eligibility
Percentage of Students
Eligibility Status
Percentage of
Students
Average Scale Score
Below
Basic
At or Above Basic
At or Above
ProficientAt
AdvancedEligible
Nation 50 270* 39* 61 20* 3*Massachusetts 38 281 28 72 31 6
Not EligibleNation 50 297* 14* 86* 49* 14*Massachusetts 62 313 6 94 69 26
* Value is significantly different from the value for the same subgroup in Massachusetts due to the larger national sample size.
□ Students with Disabilities and/or English Language Learners
To ensure that samples are representative, NAEP has established policies and procedures to maximize the inclusion of all students in the assessment. Every effort is made to ensure that all selected students who are capable of participating meaningfully in NAEP are assessed. While some students with disabilities (SD) and/or English language learner (ELL) students can be assessed without any special procedures, others require accommodations to participate. Still other SD and/or ELL students selected by NAEP may not be able to participate.
Tables 11-A, 11-B, 12-A, and 12-B show average scale scores, achievement level data, and population percentages for public school students at grades 4 and 8 in Massachusetts and the nation by disability status. Tables 13-A, 13-B, 14-A, and 14-B show average scale scores, achievement level data, and population percentages for public school students at grades 4 and 8 in Massachusetts and the nation by ELL status.
18

Table 11-A. 2013 NAEP Reading Assessment:Grade 4 Performance by Disability Status
Percentage of Students
Disability Status
Percentage of
Students
Average Scale Score
Below Basic
At or Above Basic
At or Above
ProficientAt
AdvancedSD
Nation 12 184* 69* 31* 11* 2Massachusetts 18 201 54 46 17 3
Not SDNation 88 226* 28* 72* 37* 9*Massachusetts 82 239 14 86 54 16
* Value is significantly different from the value for the same subgroup in Massachusetts due to the larger national sample size.
Table 11-B. 2013 NAEP Reading Assessment:Grade 8 Performance by Disability Status
Percentage of Students
DisabilityStatus
Percentage of
Students
Average Scale Score
Below Basic
At or Above Basic
At or Above
ProficientAt
AdvancedSD
Nation 11 231* 62* 38* 8* #Massachusetts 16 246 45 55 15 1
Not SDNation 89 270* 19* 81* 38* 4*Massachusetts 84 283 10 90 55 9
* Value is significantly different from the value for the same subgroup in Massachusetts due to the larger national sample size.
Table 12-A. 2013 NAEP Mathematics Assessment:Grade 4 Performance by Disability Status
Percentage of Students
Disability Status
Percentage of
Students
Average Scale Score
Below Basic
At or Above Basic
At or Above
ProficientAt
AdvancedSD
Nation 13 218* 45* 55* 18* 2Massachusetts 18 232 28 72 29 5
Not SDNation 87 244* 14* 86* 45* 8*Massachusetts 82 258 7 94 65 18
* Value is significantly different from the value for the same subgroup in Massachusetts due to the larger national sample size.
19

Table 12-B. 2013 NAEP Mathematics Assessment:Grade 8 Performance by Disability Status
Percentage of Students
DisabilityStatus
Percentage of
Students
Average Scale Score
Below Basic
At or Above Basic
At or Above
ProficientAt
AdvancedSD
Nation 12 248* 66* 34* 8* 1Massachusetts 16 268 42 58 17 3
Not SDNation 88 288* 22* 78* 38* 9*Massachusetts 84 307 9 91 62 21
* Value is significantly different from the value for the same subgroup in Massachusetts due to the larger national sample size.
Table 13-A. NAEP 2013 Reading Assessment:Grade 4 Performance by ELL Status
Percentage of Students
ELL Status
Percentage of
Students
Average Scale Score
Below
Basic
At or Above Basic
At or Above
ProficientAt
AdvancedELL
Nation 10 187 69 31 7 1Massachusetts 10 204 60 40 12 1
Not ELLNation 90 225* 29* 71 37* 9*Massachusetts 90 237 17 83 51 15
* Value is significantly different from the value for the same subgroup in Massachusetts due to the larger national sample size.
Table 13-B. NAEP 2013 Reading Assessment:Grade 8 Performance by ELL Status
Percentage of Students
ELL Status
Percentage of Students
Average Scale Score
Below Basic
At or Above Basic
At or Above Proficient
At Advanced
ELLNation 5 225 70 30 3 #Massachusetts 5 224 72 28 4 #
Not ELLNation 95 268* 21* 79* 36* 4*Massachusetts 95 277 13 87 50 8
# Rounds to zero* Value is significantly different from the value for the same subgroup in Massachusetts due to the larger national sample size.
20

Table 14-A. NAEP 2013 Mathematics Assessment:Grade 4 Performance by ELL Status
Percentage of Students
ELL Status
Percentage of
Students
Average Scale Score
Below
Basic
At or Above Basic
At or Above
ProficientAt
AdvancedELL
Nation 11 219 41 59 14 1Massachusetts 10 223 37 63 19 2
Not ELLNation 89 244* 15* 85* 45* 8*Massachusetts 90 255 7 93 63 17
* Value is significantly different from the value for the same subgroup in Massachusetts due to the larger national sample size.
Table 14-B. NAEP 2013 Mathematics Assessment:Grade 8 Performance by ELL Status
Percentage of Students
ELL Status
Percentage of
Students
Average Scale Score
Below
Basic
At or Above Basic
At or Above
ProficientAt
AdvancedELL
Nation 5 245 69 31 5 1Massachusetts 5 249 66 34 8 2
Not ELLNation 95 286* 25* 75* 36* 9*Massachusetts 95 303 12 88 57 19
* Value is significantly different from the value for the same subgroup in Massachusetts due to the larger national sample size.
IV. 2013 NAEP Reading and Mathematics Results by School Location
Schools that participated in the assessment were classified as being located in four mutually exclusive types of communities: city, suburb, town, and rural. These categories indicate the geographic locations of schools. The following four tables show average scale scores, achievement-level data, and population percentages for public school students at grades 4 and 8 in Massachusetts and the nation, by type of location.
21

Table 15-A. NAEP 2013 Reading Assessment:Grade 4 Performance by School Location
Percentage of Students
Location
Percentage of
Students
Average Scale Score
Below Basic
At or Abov
e Basic
At or Above
ProficientAt
AdvancedCity
Nation 29 214 40 60* 28 7Massachusetts 22 218 35 65 32 7
SuburbNation 35 225* 29* 71* 39* 10*Massachusetts 67 236 18 82 52 16
TownNation 11 219 33 67 32 6Massachusetts 1 ‡ ‡ ‡ ‡ ‡
RuralNation 25 223* 29* 71* 35* 8Massachusetts 10 234 17 83 47 11
* Value is significantly different from the value for the same subgroup in Massachusetts due to the larger national sample size.‡ Reporting standards not met
Table 15-B. NAEP 2013 Reading Assessment:Grade 8 Performance by School Location
Percentage of Students
Location
Percentage of
Students
Average Scale Score
Below Basic
At or Abov
e Basic
At or Above
ProficientAt
AdvancedCity
Nation 28 260 30 70* 28 3Massachusetts 20 263 28 72 32 5
SuburbNation 35 270* 20* 80* 39* 5*Massachusetts 65 281 13 87 52 9
TownNation 13 263 25 75 31 2Massachusetts 3 ‡ ‡ ‡ ‡ ‡
RuralNation 24 268* 21* 79* 36* 3*Massachusetts 12 282 9 91 52 9
* Value is significantly different from the value for the same subgroup in Massachusetts due to the larger national sample size ‡ Reporting standards not met
22
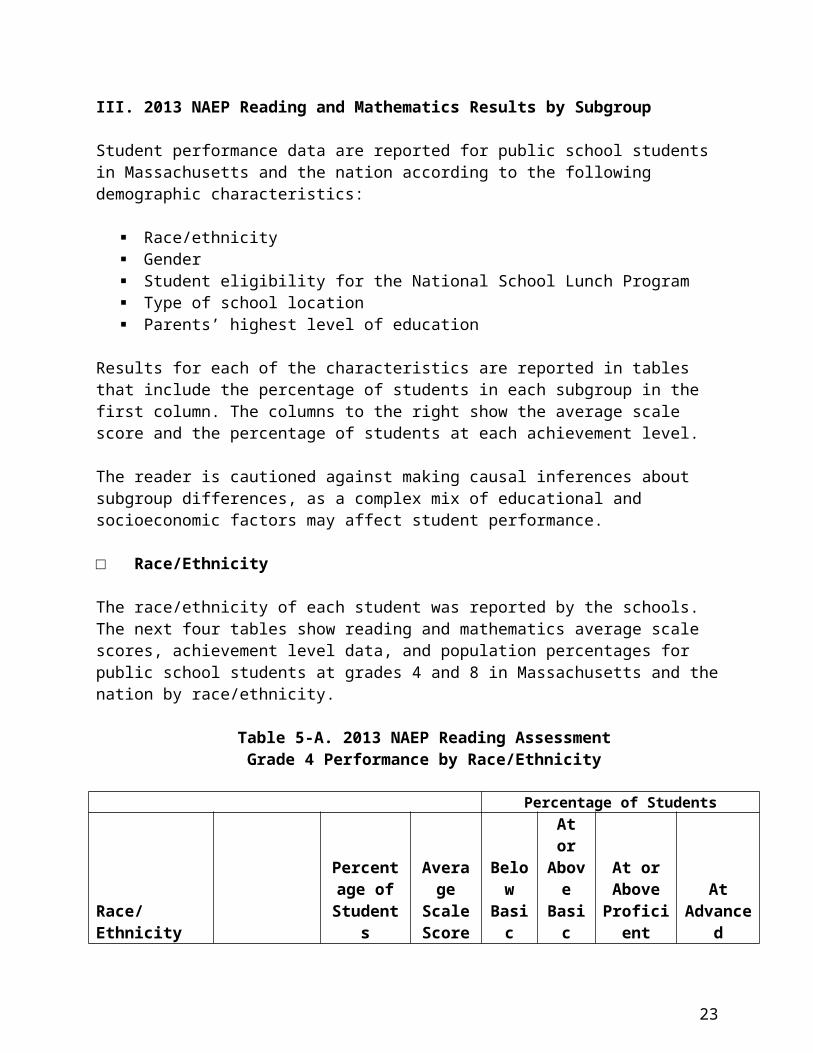
Table 16-A. NAEP 2013 Mathematics Assessment:Grade 4 Performance by School Location
Percentage of Students
Location
Percentage of
Students
Average Scale Score
Below Basic
At or Abov
e Basic
At or Above
ProficientAt
AdvancedCity
Nation 30 236* 24* 76* 35* 7Massachusetts 22 241 18 82 42 8
SuburbNation 35 244* 15* 85* 46* 9*Massachusetts 67 256 8 92 62 18
TownNation 11 240 17 83 39 6Massachusetts 1 ‡ ‡ ‡ ‡ ‡
RuralNation 25 243* 14* 86* 44* 7*Massachusetts 9 258 4 96 66 16
* Value is significantly different from the value for the same subgroup in Massachusetts due to the larger national sample size ‡ Reporting standards not met
Table 16-B. NAEP 2013 Mathematics Assessment:Grade 8 Performance by School Location
Percentage of Students
Location
Percentage of
Students
Average Scale Score
Below Basic
At or Abov
e Basic
At or Above
ProficientAt
AdvancedCity
Nation 28 278* 34* 66* 29* 7*Massachusetts 20 288 25 75 40 12
SuburbNation 35 288* 24* 76* 39* 10*Massachusetts 65 303 12 88 57 19
TownNation 13 281 28 72 32 6Massachusetts 3 ‡ ‡ ‡ ‡ ‡
RuralNation 24 286* 24* 76* 36* 8*Massachusetts 12 308 8 92 64 22
23

* Value is significantly different from the value for the same subgroup in Massachusetts due to the larger national sample size ‡ Reporting standards not met
24

V. 2013 NAEP Reading and Mathematics Results by Parents’ Level of Education
Eighth-grade students who participated in the NAEP 2013 assessment were asked to indicate the highest level of education they thought their father and mother had completed. Five response options—did not finish high school, graduated from high school, some education after high school, graduated from college, and “I don’t know”—were offered. The highest level of education reported for either parent was used in the analysis. The results by highest level of parental education are shown in Tables 17 and 18. Fourth-graders were not asked about their parents’ education level because their responses in previous NAEP assessments were not reliable, and a large percentage of them chose the “I don’t know” option.
Table 17. NAEP 2013 Reading Assessment:Grade 8 Performance by Parents’ Level of Education
Percentage of Students
Parent EducationPercentage of Students
Average Scale Score
Below Basic
At or Above Basic
At or Above
ProficientAt
AdvancedDid Not Finish High School Nation 8 250 37 63 16 # Massachusetts 5 251 37 63 19 1Graduated High School Nation 16 255 33 67 20 1
Massachusetts 13 260 28 72 27 2Graduated College Nation 49 276 15 85 46 6 Massachusetts 62 286 9 91 59 11# Rounds to zero
Table 18. NAEP 2013 Mathematics Assessment:Grade 8 Performance by Parents’ Level of Education
Percentage of Students
Parent Education
Percentage of
Students
Average Scale Score
Below Basic
At or Above Basic
At or Above
ProficientAt
AdvancedDid Not Finish High School Nation 8 267 42 58 16 2 Massachusetts 7 274 32 68 22 3Graduated High School Nation 17 270 39 61 19 2
Massachusetts 12 283 25 75 33 5Graduated College Nation 49 295 17 83 47 14 Massachusetts 60 311 8 92 67 26
25

VI. 2013 NAEP Reading Achievement Level Descriptions for Grade 4
NAEP achievement levels are cumulative; therefore, student performance at the Proficient level includes the competencies associated with the Basic level, and the Advanced level also includes the skills and knowledge associated with both the Basic and the Proficient levels. The cut score indicating the lower end of the score range for each level is noted in parentheses.
Achievement Level DescriptionBasic (208) Fourth-grade students performing at the Basic level should be able to
locate relevant information, make simple inferences, and use their understanding of the text to identify details that support a given interpretation or conclusion. Students should be able to interpret the meaning of a word as it is used in the text.
When reading literary texts such as fiction, poetry, and literary nonfiction, fourth-grade students performing at the Basic level should be able to make simple inferences about characters, events, plot, and setting. They should be able to identify a problem in a story and relevant information that supports an interpretation of a text.
When reading informational texts such as articles and excerpts from books, fourth-grade students performing at the Basic level should be able to identify the main purpose and an explicitly stated main idea, as well as gather information from various parts of a text to provide supporting information.
Proficient (238) Fourth-grade students performing at the Proficient level should be able to integrate and interpret texts and apply their understanding of the text to draw conclusions and make evaluations.
When reading literary texts such as fiction, poetry, and literary nonfiction, fourth-grade students performing at the Proficient level should be able to identify implicit main ideas and recognize relevant information that supports them. Students should be able to judge elements of an author's craft and provide some support for their judgment. They should be able to analyze character roles, actions, feelings, and motivations.
When reading informational texts such as articles and excerpts from books, fourth-grade students performing at the Proficient level should be able to locate relevant information, integrate information across texts, and evaluate the way an author presents information. Student performance at this level should demonstrate an understanding of the purpose for text features and an ability to integrate information from headings, text boxes, and graphics and their captions. They should be able to explain a simple cause-and-effect relationship and draw conclusions.
26

DescriptionAdvanced (268) Fourth-grade students performing at the Advanced level should be able
to make complex inferences and construct and support their inferential understanding of the text. Students should be able to apply their understanding of a text to make and support a judgment.
When reading literary texts such as fiction, poetry, and literary nonfiction, fourth-grade students performing at the Advanced level should be able to identify the theme in stories and poems and make complex inferences about characters' traits, feelings, motivations, and actions. They should be able to recognize characters' perspectives and evaluate characters' motivations. Students should be able to interpret characteristics of poems and evaluate aspects of text organization.
When reading informational texts such as articles and excerpts from books, fourth-grade students performing at the Advanced level should be able to make complex inferences about main ideas and supporting ideas. They should be able to express a judgment about the text and about text features and support the judgments with evidence. They should be able to identify the most likely cause given an effect, explain an author's point of view, and compare ideas across two texts.
27
VII. 2013 NAEP Reading Achievement Level Descriptions for Grade 8
Achievement Level DescriptionBasic (243) Eighth-grade students performing at the Basic level should be able to locate
information; identify statements of main idea, theme, or author's purpose; and make simple inferences from texts. They should be able to interpret the meaning of a word as it is used in the text. Students performing at this level should also be able to state judgments and give some support about content and presentation of content.
When reading literary texts such as fiction, poetry, and literary nonfiction, eighth-grade students performing at the Basic level should recognize major themes and be able to identify, describe, and make simple inferences about setting and about character motivations, traits, and experiences. They should be able to state and provide some support for judgments about the way an author presents content and about character motivation.
When reading informational texts such as exposition and argumentation, eighth-grade students performing at the Basic level should be able to recognize inferences based on main ideas and supporting details. They should be able to locate and provide relevant facts to construct general statements about information from the text. Students should be able to provide some support for judgments about the way information is presented.
Proficient (281) Eighth-grade students performing at the Proficient level should be able to provide relevant information and summarize main ideas and themes. They should be able to make and support inferences about a text, connect parts of a text, and analyze text features. Students performing at this level should also be able to fully substantiate judgments about content and presentation of content.
When reading literary texts such as fiction, poetry, and literary nonfiction, eighth-grade students performing at the Proficient level should be able to make and support a connection between characters from two parts of a text. They should be able to recognize character actions and infer and support character feelings. Students performing at this level should be able to provide and support judgments about characters' motivations across texts. They should be able to identify how figurative language is used.
When reading informational texts such as exposition and argumentation, eighth-grade students performing at the Proficient level should be able to locate and provide facts and relevant information that support a main idea or purpose, interpret causal relations, provide and support a judgment about the author's argument or stance, and recognize rhetorical devices.
28

DescriptionAdvanced (323) Eighth-grade students performing at the Advanced level should be able to
make connections within and across texts and to explain causal relations. They should be able to evaluate and justify the strength of supporting evidence and the quality of an author's presentation. Students performing at the Advanced level also should be able to manage the processing demands of analysis and evaluation by stating, explaining, and justifying.
When reading literary texts such as fiction, literary nonfiction, and poetry, eighth-grade students performing at the Advanced level should be able to explain the effects of narrative events. Within or across texts, they should be able to make thematic connections and make inferences about characters' feelings, motivations, and experiences.
When reading informational texts such as exposition and argumentation, eighth-grade students performing at the Advanced level should be able to infer and explain a variety of connections that are intra-textual (such as the relation between specific information and the main idea) or inter-textual (such as the relation of ideas across expository and argument texts). Within and across texts, students should be able to state and justify judgments about text features, choice of content, and the author's use of evidence and rhetorical devices.
29

VIII. 2013 NAEP Mathematics Achievement Level Descriptions for Grade 4
Achievement Level DescriptionBasic (214) Fourth-grade students performing at the Basic level should show some
evidence of understanding the mathematical concepts and procedures in the five NAEP content areas.
Fourth-graders performing at the Basic level should be able to estimate and use basic facts to perform simple computations with whole numbers, show some understanding of fractions and decimals, and solve some simple real-world problems in all NAEP content areas. Students at this level should be able to use—although not always accurately—four-function calculators, rulers, and geometric shapes. Their written responses are often minimal and presented without supporting information.
Proficient (249) Fourth-grade students performing at the Proficient level should consistently apply integrated procedural knowledge and conceptual understanding to problem solving in the five NAEP content areas.
Fourth-graders performing at the Proficient level should be able to use whole numbers to estimate, compute, and determine whether results are reasonable. They should have a conceptual understanding of fractions and decimals; be able to solve real-world problems in all NAEP content areas; and use four-function calculators, rulers, and geometric shapes appropriately. Students performing at the Proficient level should employ problem-solving strategies such as identifying and using appropriate information. Their written solutions should be organized and presented both with supporting information and explanations of how they were achieved.
Advanced (282) Fourth-grade students performing at the Advanced level should apply integrated procedural knowledge and conceptual understanding to complex and non-routine real-world problem solving in the five NAEP content areas.
Fourth-graders performing at the Advanced level should be able to solve complex and non-routine real-world problems in all NAEP content areas. They should display mastery in the use of four-function calculators, rulers, and geometric shapes. These students are expected to draw logical conclusions and justify answers and solution processes by explaining why, as well as how, they were achieved. They should go beyond the obvious in their interpretations and be able to communicate their thoughts clearly and concisely.
30

IX. 2013 NAEP Mathematics Achievement Level Descriptions for Grade 8
Achievement Level DescriptionBasic (262) Eighth-grade students performing at the Basic level should exhibit
evidence of conceptual and procedural understanding in the five NAEP content areas. This level of performance signifies an understanding of arithmetic operations—including estimation—on whole numbers, decimals, fractions, and percents.
Eighth-graders performing at the Basic level should complete problems correctly with the help of structural prompts such as diagrams, charts, and graphs. They should be able to solve problems in all NAEP content areas through the appropriate selection and use of strategies and technological tools—including calculators, computers, and geometric shapes. Students at this level also should be able to use fundamental algebraic and informal geometric concepts in problem solving.As they approach the Proficient level, students at the Basic level should be able to determine which of the available data are necessary and sufficient for correct solutions and use them in problem solving. However, these eighth-graders show limited skill in communicating mathematically.
Proficient (299) Eighth-grade students performing at the Proficient level should apply mathematical concepts and procedures consistently to complex problems in the five NAEP content areas.
Eighth-graders performing at the Proficient level should be able to conjecture, defend their ideas, and give supporting examples. They should understand the connections among fractions, percents, decimals, and other mathematical topics such as algebra and functions. Students at this level are expected to have a thorough understanding of Basic level arithmetic operations—an understanding sufficient for problem solving in practical situations.Quantity and spatial relationships in problem solving and reasoning should be familiar to them, and they should be able to convey underlying reasoning skills beyond the level of arithmetic. They should be able to compare and contrast mathematical ideas and generate their own examples. These students should make inferences from data and graphs, apply properties of informal geometry, and accurately use the tools of technology. Students at this level should understand the process of gathering and organizing data and be able to calculate, evaluate, and communicate results within the domain of statistics and probability.
Advanced (333) Eighth-grade students performing at the Advanced level should be able to
31

reach beyond the recognition, identification, and application of mathematical rules in order to generalize and synthesize concepts and principles in the five NAEP content areas.
Eighth-graders performing at the Advanced level should be able to probe examples and counterexamples in order to shape generalizations from which they can develop models. Eighth-graders performing at the Advanced level should use number sense and geometric awareness to consider the reasonableness of an answer. They are expected to use abstract thinking to create unique problem-solving techniques and explain the reasoning processes underlying their conclusions.
32

NAEP Assessment Reporting Glossary
Accommodations. Accommodations are alterations in the way tasks are presented that allow children with learning disabilities to complete the same assignments as other students. Accommodations do not alter the content of assignments, give students an unfair advantage or in the case of assessments such as NAEP, change what a test measures.
Achievement levels. Performance standards set by the National Assessment Governing Board that provide a context for interpreting student performance on NAEP, based on recommendations from panels of educators and members of the public. The levels, Basic, Proficient, and Advanced, measure what students should know and be able to do at each grade assessed. See each NAEP subject for a detailed description of what students should know and be able to do at each level at grade 4, 8, or 12.
Basic. One of the three NAEP achievement levels, denoting partial mastery of prerequisite knowledge and skills that are fundamental for proficient work at each grade assessed. NAEP also reports the proportion of students whose scores place them below the Basic achievement level. See each NAEP subject for a detailed description of what students should know and be able to do at grade 4, 8, or 12 at the Basic level. The cut scores determining each level are available with these descriptions.
Proficient. One of the three NAEP achievement levels, representing solid academic performance for each grade assessed. Students reaching this level have demonstrated competency over challenging subject matter, including subject-matter knowledge, application of such knowledge to real-world situations, and analytical skills appropriate to the subject matter. See each NAEP subject for a detailed description of what students should know and be able to do at grade 4, 8, or 12 at the Proficient level. The cut scores determining each level are available with the descriptions.
Advanced. One of the three NAEP achievement levels, denoting superior performance at each grade assessed. See each NAEP subject for a detailed description of what students should know and be able to do at grade 4, 8, or 12 at the Advanced level. The cut scores determining each level are available with these descriptions.
Achievement-level percentages. The percentage of students within the total population, or in a particular student group, who meet or exceed expectations of what students should know and be able to do. Specifically, it is the weighted percentage of students with NAEP composite scores that are equal to, or exceed, the achievement-level cut scores specified by the National Assessment Governing Board.
Gender. NAEP results are reported separately for males and females, based on students' self-reported gender.
English language learners (ELL). A term used to describe students who are in the process of acquiring English language skills and knowledge.
33

NAEP. The National Assessment of Educational Progress (NAEP), also known as "the Nation's Report Card," is the only nationally representative and continuing assessment of what America's students know and can do in various subject areas. Since 1969, assessments have been conducted periodically in mathematics, reading, science, writing, U.S. history, geography, civics, the arts, and other subjects.
NAEP scales. The scales common across age or grade levels and assessment years used to report NAEP results.
National Assessment Governing Board. An independent organization whose members are appointed by the U.S. Secretary of Education. The Governing Board provides overall policy direction to the NAEP program. It is an independent, bipartisan group whose members include governors, state legislators, local and state school officials, educators, business representatives, and members of the general public.
National School Lunch Program (NSLP). A federally assisted meal program that provides low-cost or free lunches to eligible students. It is sometimes referred to as the free/reduced-price lunch program. Free lunches are offered to those students whose family incomes are at or below 130 percent of the poverty level; reduced-price lunches are offered to those students whose family incomes are between 130 percent and 185 percent of the poverty level.
Parental education. A NAEP reporting group defined by the highest level of education of the mother and father of an assessed student as derived from the student's response to two background questionnaire items.
Percentile. A score location below which a specified percentage of the population falls. For example, in 1998, the tenth percentile of fourth-grade reading scores was 167. This means that in 1998, ten percent of fourth-graders had NAEP reading scores below 167, while 90 percent scored at or above 167.
Race/ethnicity. In order to allow comparisons across years, assessment results presented are based on information for six mutually exclusive racial/ethnic categories: White, Black, Hispanic, Asian/Pacific Islander, American Indian (including Alaska Native), and Other. Students who identified with more than one of the first five categories or had a background other than the ones listed were categorized as Other. In all NAEP assessments, data about student race/ethnicity is collected from two sources: school records and student self-reports. Before 2002, NAEP used students' self-report of their race and ethnicity on a background questionnaire as the source of race/ethnicity data. In 2002, it was decided to change the student race/ethnicity variable highlighted in NAEP reports. Starting in 2002, NAEP reports of students' race and ethnicity are based on the school records, with students' self-report used only if school data are missing. Information based on student self-reported race/ethnicity will continue to be reported in the NAEP Data Explorer for assessments after 2001.
Reporting group. Groups within the national population for which NAEP data are reported; for example, gender, race/ethnicity, grade, age, level of parental education, region, and type of location.
34

Sample. A subset of a population whose characteristics are studied to gain information about the entire population. NAEP assesses a representative sample of students each year, rather than the entire population of students.
Sampling error. The error in survey estimates that occurs because only a sample of the population is observed. Measured by sampling standard error.
Scale score. A score, derived from student responses to assessment items, that summarizes the overall level of performance attained by that student. While NAEP does not produce scale scores for individual students, NAEP does produce summary statistics describing scale scores for groups of students. NAEP subject area scales typically range from 0 to 500 (reading, mathematics, U.S. history, and geography) or from 0 to 300 (science, writing, and civics).
School location. The physical location of a school. NAEP reporting includes city, suburb, town, and rural.
Significantly different, statistically significant, statistically significant difference. Statistical tests are conducted to determine whether the changes or differences between two result numbers are statistically significant. The term "significant" does not imply a judgment about the absolute magnitude or educational relevance of changes in student performance. Rather, it is used to indicate that the observed changes are not likely to be associated with sampling and measurement error, but are statistically dependable population differences. NAEP uses widely accepted statistical standards in analyzing data. For instance, this website discusses only findings that are statistically significant at the .05 level. However, some differences that are statistically significant appear small, particularly in recent assessment years, when the sample sizes have been larger.NOTE: Differences between scale scores or percentages are calculated using unrounded values. In some instances, the result of the subtraction differs from what would be obtained by subtracting the rounded values shown in the accompanying figure or table.
Standard error. In NAEP, a measure of sampling variability and measurement error for a NAEP scale score. However, for other statistics, it reflects the sampling variability. Because of NAEP's complex student sampling design, sampling standard errors are estimated by jackknifing the samples from first-stage sample estimates. Standard errors may also include a component due to the error of measurement of individual scores estimated using plausible values.
Student sample. A portion of a population, or a subset from a set of units, that is selected by some probability mechanism for the purpose of investigating the properties of the population.
Students with disabilities (SD). A student with a disability may need specially designed instruction to meet his or her learning goals. A student with a disability will usually have an Individualized Education Plan (IEP), which guides his or her special education instruction. Students with disabilities are often referred to as special education students and may be classified by their school as learning disabled (LD) or emotionally disturbed (ED). The goal of NAEP is that students who are capable of participating meaningfully in the assessment are assessed, but
35

some students with disabilities selected by NAEP may not be able to participate, even with the accommodations provided.
Subject area. One of the areas assessed by NAEP: the arts, civics, economics, foreign language, geography, mathematics, reading, science, U.S. history, world history, or writing.
Weighted percentage. A percentage that has been calculated by differentially weighting observations to account for complex sampling procedures. It differs from a simple percentage in which all cases are equally weighted.
In NAEP, each sampled student is assigned a weight that makes proper allowances for the sampling design and reflects adjustments for school and student nonparticipation.
Weighted percentages are estimates of the percentages of the total population, student group that share a specified characteristic. For example, the weighted percentage of fourth-grade students in the NAEP sample that correctly answered a particular NAEP test item is an estimate of the percentage of fourth-grade students in the nation that can correctly answer that question.
36