
2013 MBA Boeing Case Competition
25
Team Titan Dreamliner Boeing Competition Case Study 1
-
Upload
luis-gaitan -
Category
Business
-
view
480 -
download
4
Transcript of 2013 MBA Boeing Case Competition

1
Team Titan DreamlinerBoeing Competition Case Study

2
Luis G. Wilson Quang Victor Sophie
SataLink Team Members

3
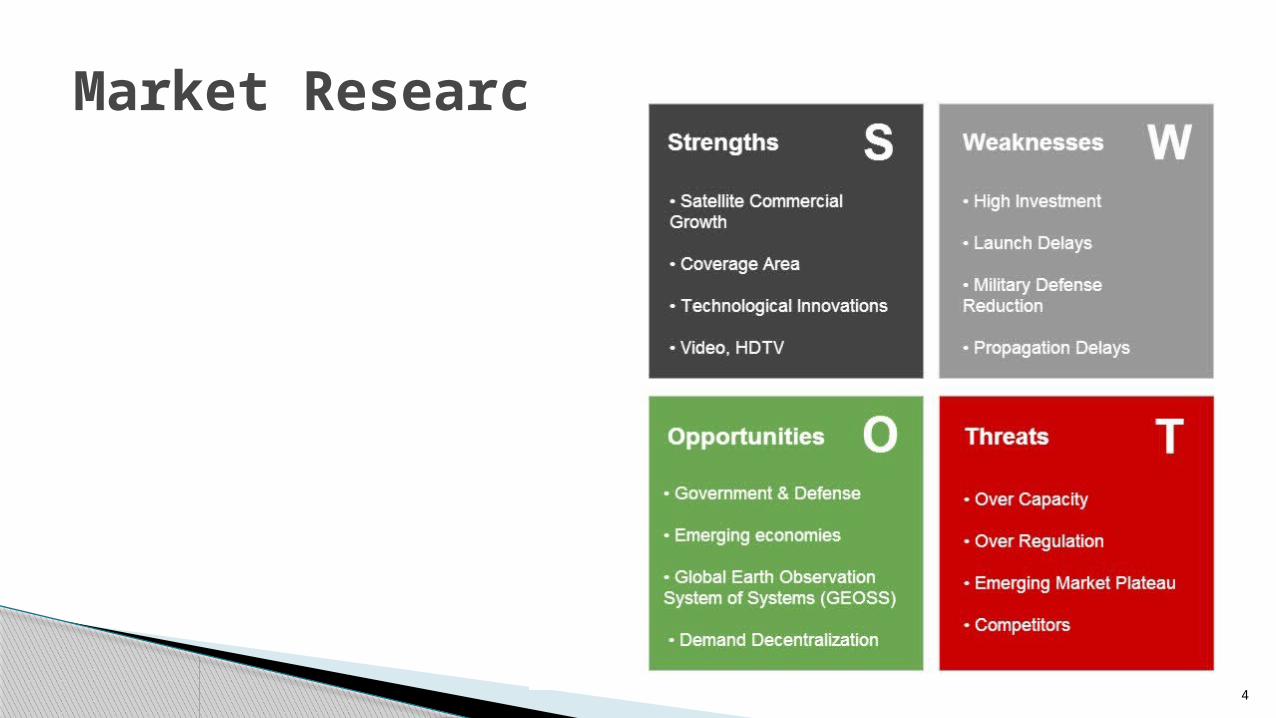
Market Research
Global Growth Strategy
Execution Plan
Risk Analysis
Financial Management
Executive Summary
4
Market Research
5
Expansion Across All Regions
Sustainable Revenue Growth
Increase Global Presence
Global Growth Strategy

6
Continuous worldwide coverage Focus growth in all regions More emphasis on Africa/M.E
Expansion Across All Regions
CAGR 2025 Revenue
5%
$10351 M
6%
$13610 M
4.5% $14680 M
5%
$10744 M

7
CAGR far exceeds industry growth across all regions Combined CAGR of 12.8% (50% more than industry growth)
Sustainable Revenue Growth
America Europe Africa/M.E Asia/Oceania Global
Satalink Satalink Satalink Satalink Satalink
Industry Industry Industry Industry Industry

8
Increase market share across all regions Global market share increases to 6.1% Combined annual revenue doubles by 2025
Increase Global Presence Year 2016 2025 CAGR
Region Market Share
Revenue ($ M)
Market Share
Revenue ($ M)
America 8.2% 543.5 10.4% 1049.1 7.6%
Europe 6.3% 580.1 8.2% 1108.8 7.4%
Africa/M.E 0.9% 80.0 1.4% 201.2 10.8%
Asia/Oceania 5.3% 367.4 6.2% 669.1 6.9%
Global 5.0% 1571.7 6.1% 3028.3 7.6%
9
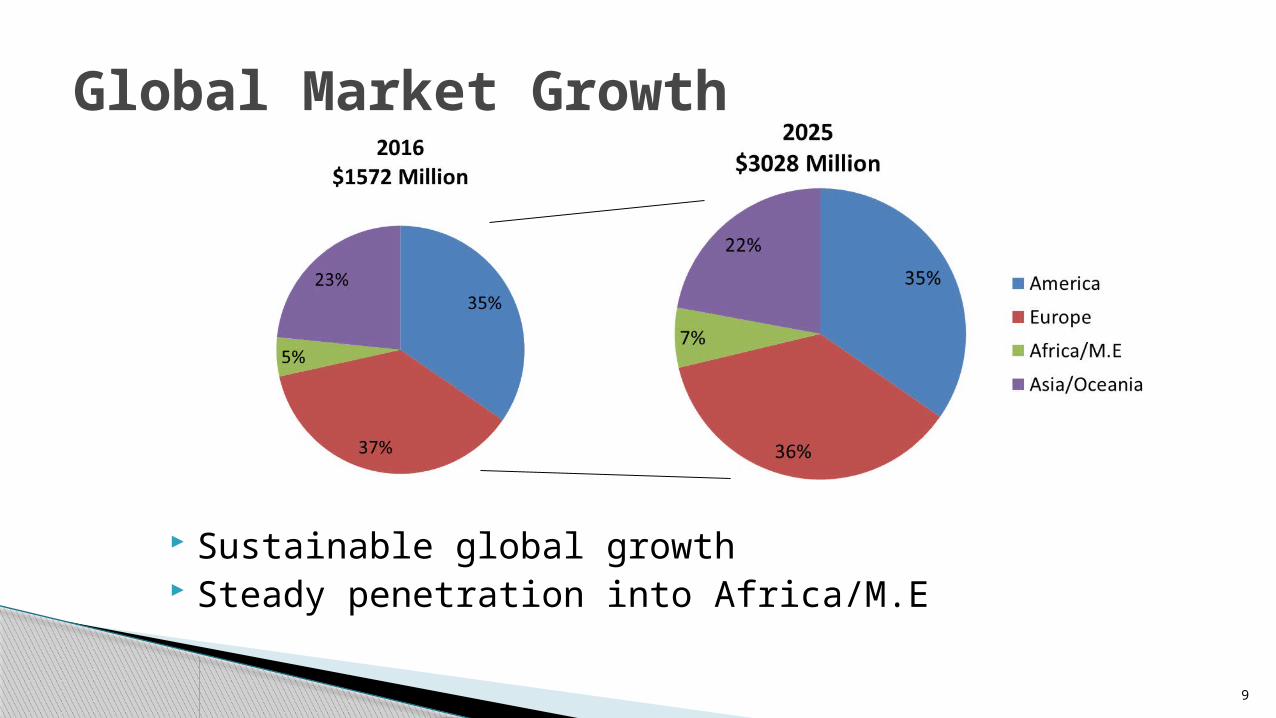
Sustainable global growth Steady penetration into Africa/M.E
Global Market Growth

10
Projected Growth
Satellite Configuration
Global Transponder Fill Rate
Execution Plan
11
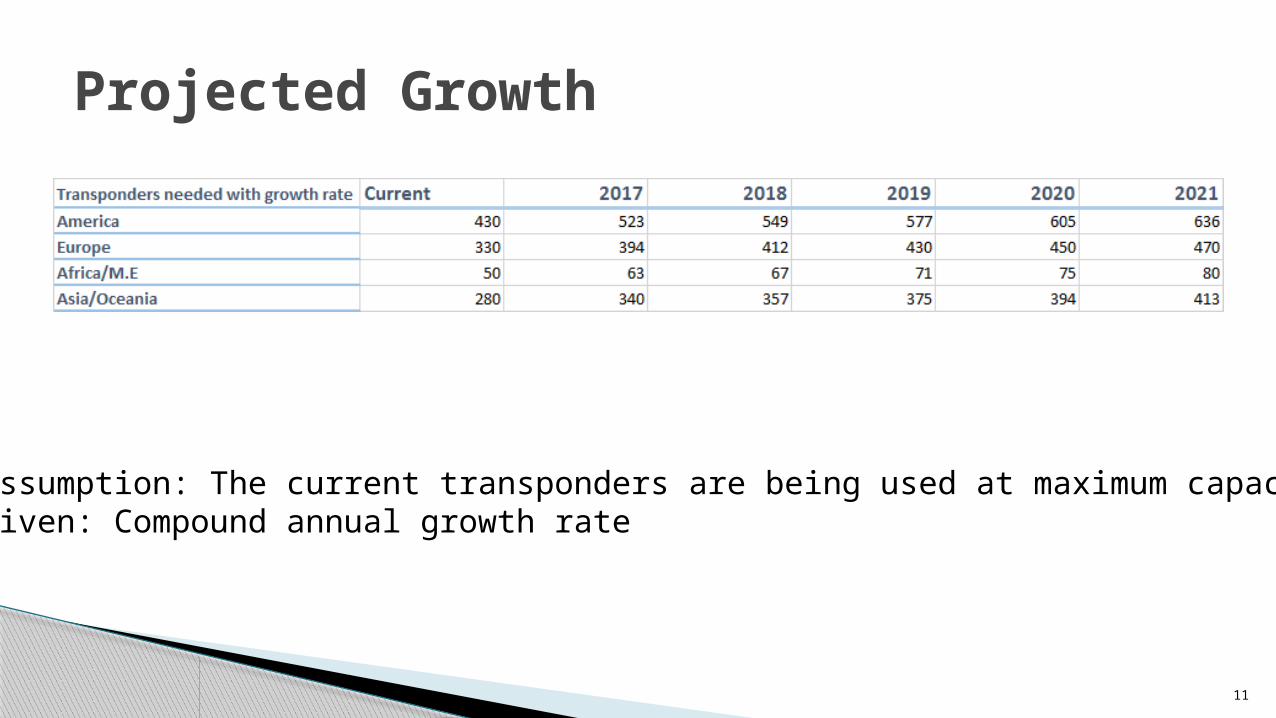
Projected Growth
Assumption: The current transponders are being used at maximum capacityGiven: Compound annual growth rate
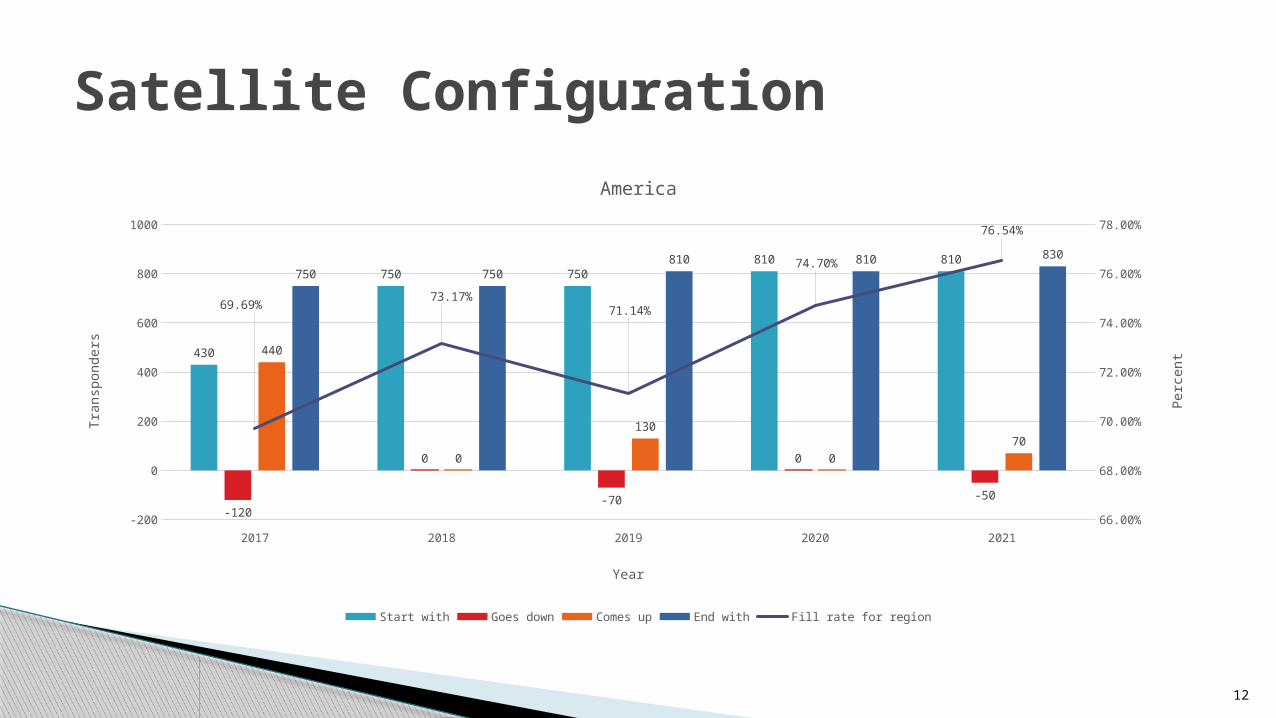
12
Satellite Configuration
2017 2018 2019 2020 2021-200
0
200
400
600
800
1000
66.00%
68.00%
70.00%
72.00%
74.00%
76.00%
78.00%
430
750 750810 810
-120
0
-70
0
-50
440
0
130
0
70
750 750810 810 830
69.69%73.17%
71.14%
74.70%
76.54%
America
Start with Goes down Comes up End with Fill rate for region
Year
Tra
nsp
onders
Perc
ent
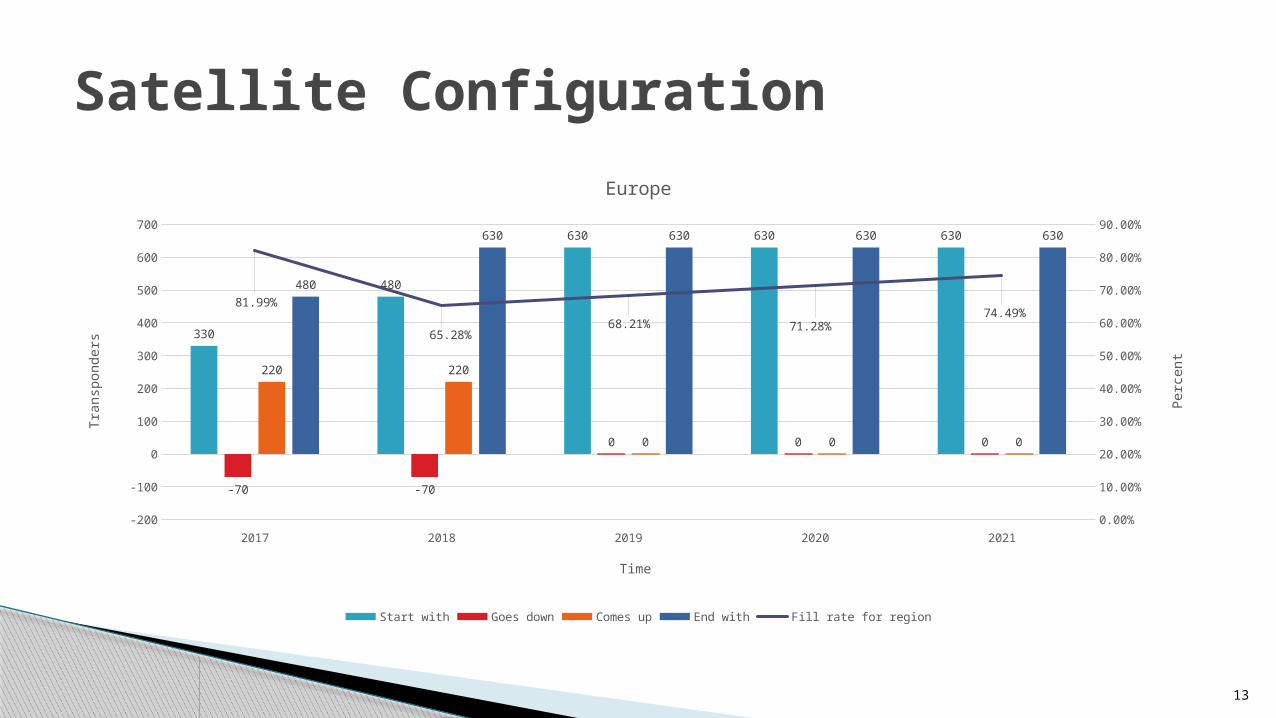
13
Satellite Configuration
2017 2018 2019 2020 2021-200
-100
0
100
200
300
400
500
600
700
0.00%
10.00%
20.00%
30.00%
40.00%
50.00%
60.00%
70.00%
80.00%
90.00%
330
480
630 630 630
-70 -70
0 0 0
220 220
0 0 0
480
630 630 630 630
81.99%
65.28%68.21% 71.28%
74.49%
Europe
Start with Goes down Comes up End with Fill rate for region
Time
Tra
nsp
onders
Perc
ent
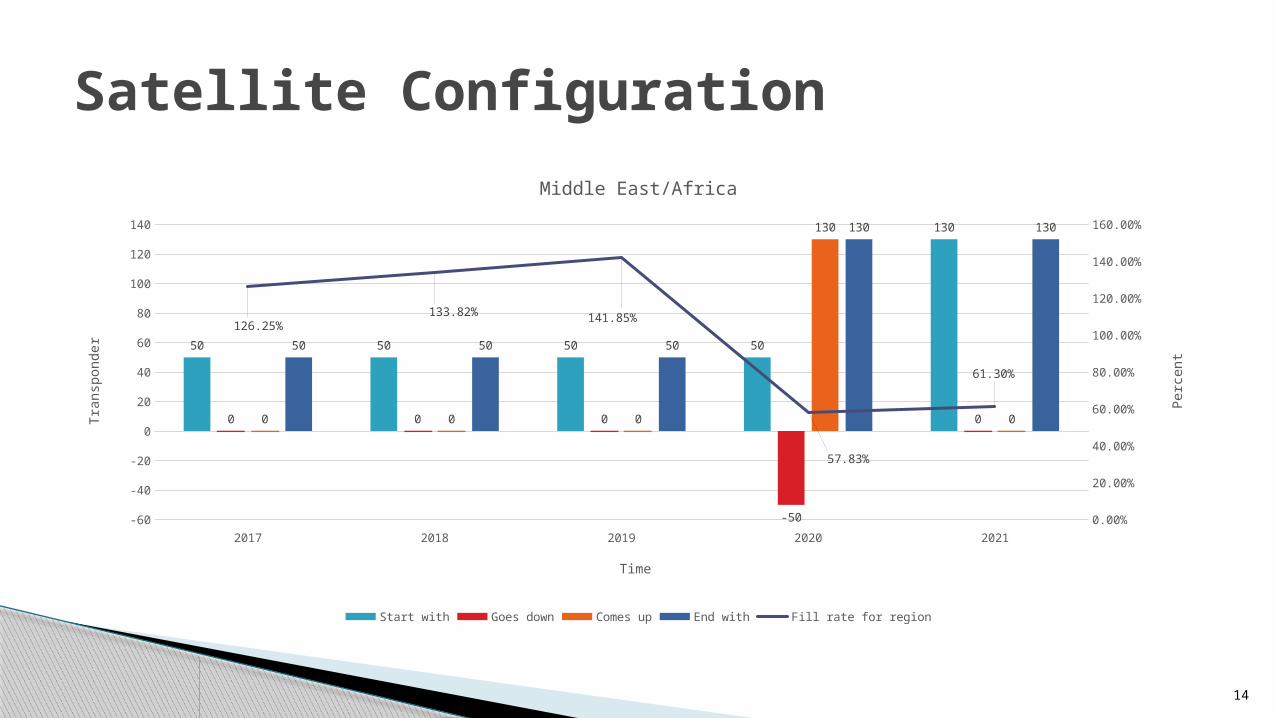
14
Satellite Configuration
2017 2018 2019 2020 2021-60
-40
-20
0
20
40
60
80
100
120
140
0.00%
20.00%
40.00%
60.00%
80.00%
100.00%
120.00%
140.00%
160.00%
50 50 50 50
130
0 0 0
-50
00 0 0
130
0
50 50 50
130 130
126.25%133.82% 141.85%
57.83%
61.30%
Middle East/Africa
Start with Goes down Comes up End with Fill rate for region
Time
Tra
nsp
onder
Perc
ent
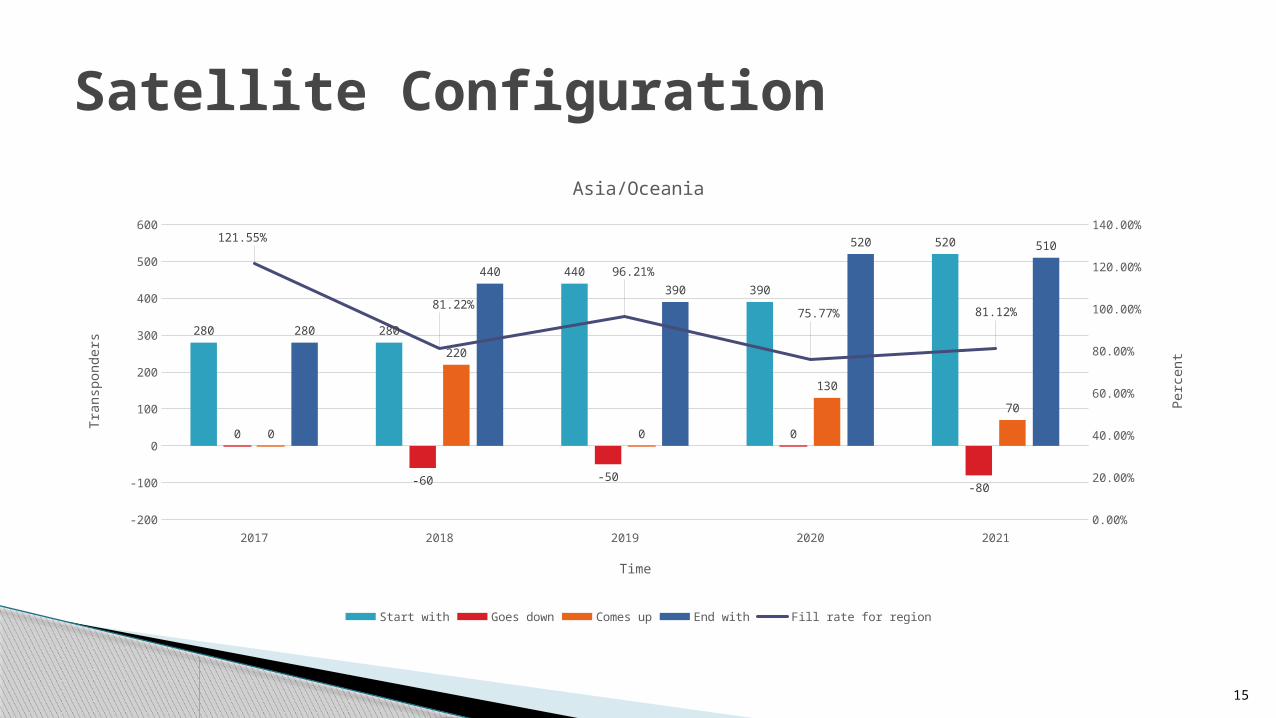
15
Satellite Configuration
2017 2018 2019 2020 2021-200
-100
0
100
200
300
400
500
600
0.00%
20.00%
40.00%
60.00%
80.00%
100.00%
120.00%
140.00%
280 280
440
390
520
0
-60 -50
0
-80
0
220
0
130
70
280
440
390
520 510121.55%
81.22%
96.21%
75.77% 81.12%
Asia/Oceania
Start with Goes down Comes up End with Fill rate for region
Time
Tra
nsp
onders
Perc
ent

16
Satellite Configuration
2017 2018 2019 2020 20210
500
1000
1500
2000
2500
66.00%
68.00%
70.00%
72.00%
74.00%
76.00%
78.00%
80.00%
82.00%
84.00%
86.00%
13201384
14521523
15981560
1870 1880
2090 2100
84.59%
74.03%
77.24% 72.89%76.09%
Global
Total Transponders Needed Total Transponders Available Total Transponders Fill Rate
Time
Tra
nsp
onders
Perc
ent

17
Total number of satellites - 10
Total cost of satellite launches - $1.57B
Average satellite launch cost - $157M
On average, one out of ten rockets fail
Takes three years to set up a new launch
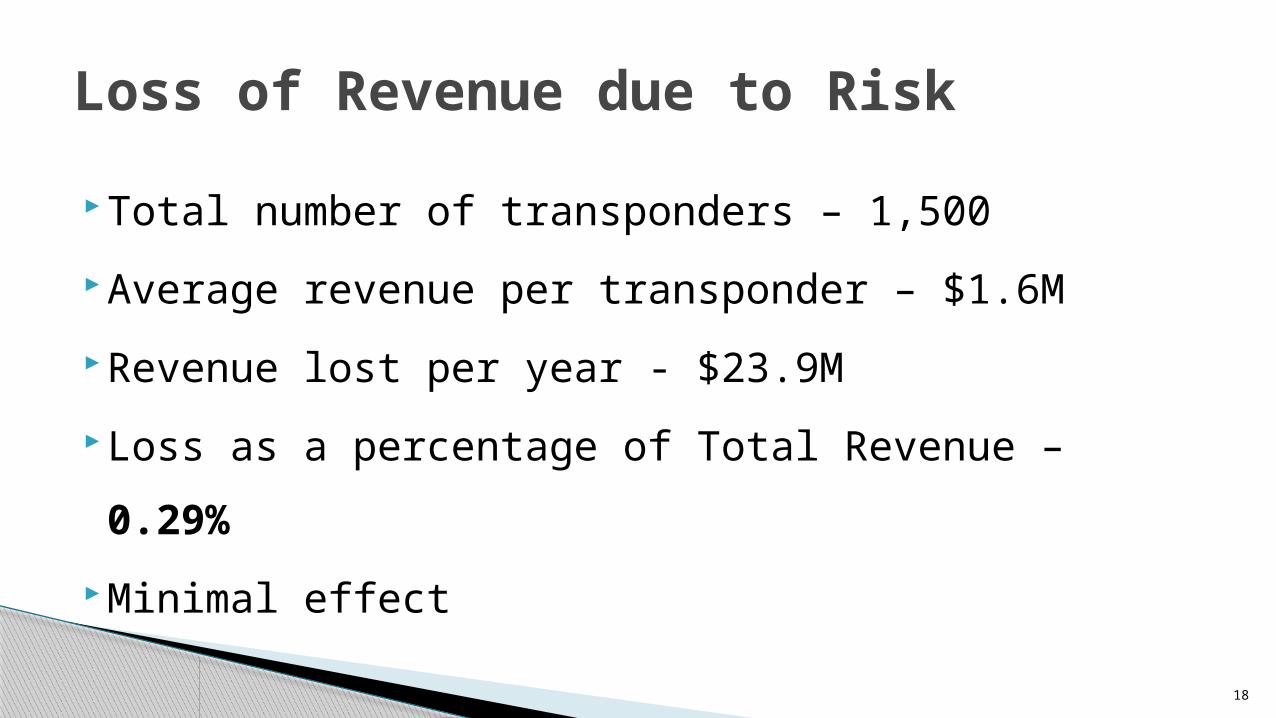
Loss of Revenue due to Risk
18
Total number of transponders – 1,500
Average revenue per transponder – $1.6M
Revenue lost per year - $23.9M
Loss as a percentage of Total Revenue – 0.29%
Minimal effect
Loss of Revenue due to Risk

19
Current Financial Situation
Financial Objectives
Interest Rate Forecasting
Additional Financing
Projected Cash Flows
Financial Management
20
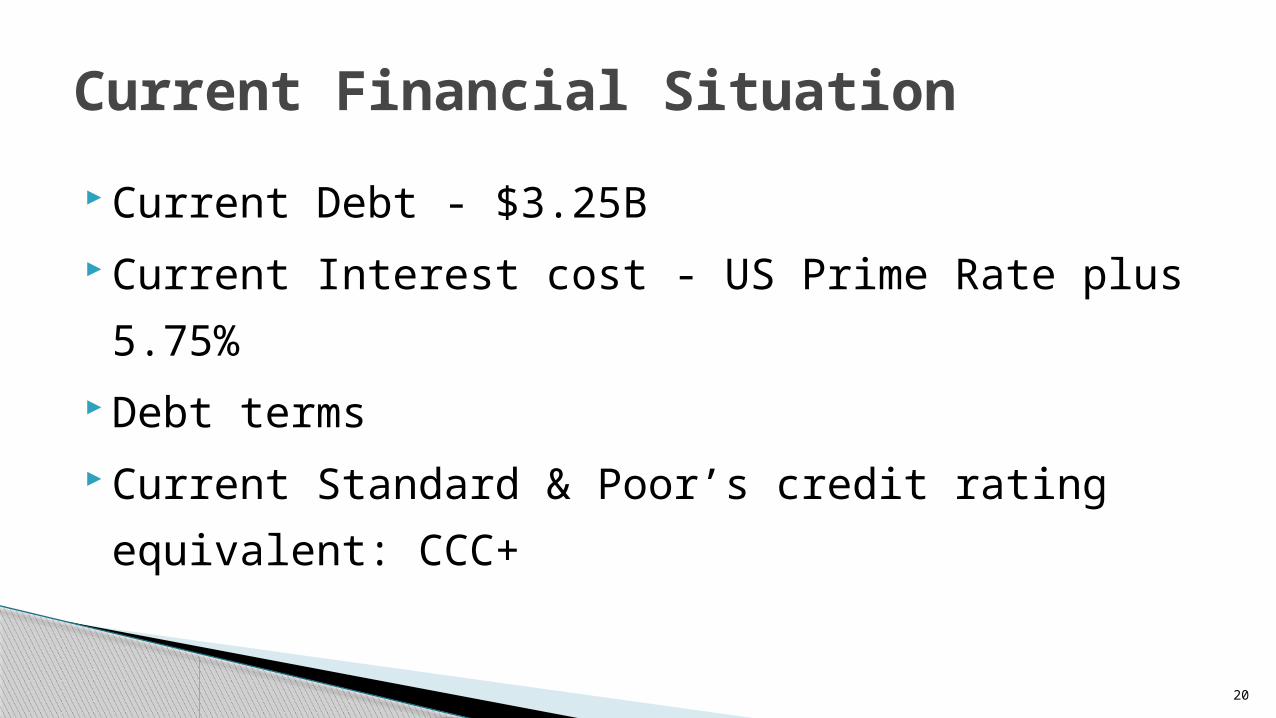
Current Debt - $3.25B Current Interest cost - US Prime Rate plus 5.75% Debt terms Current Standard & Poor’s credit rating equivalent:
CCC+
Current Financial Situation
21
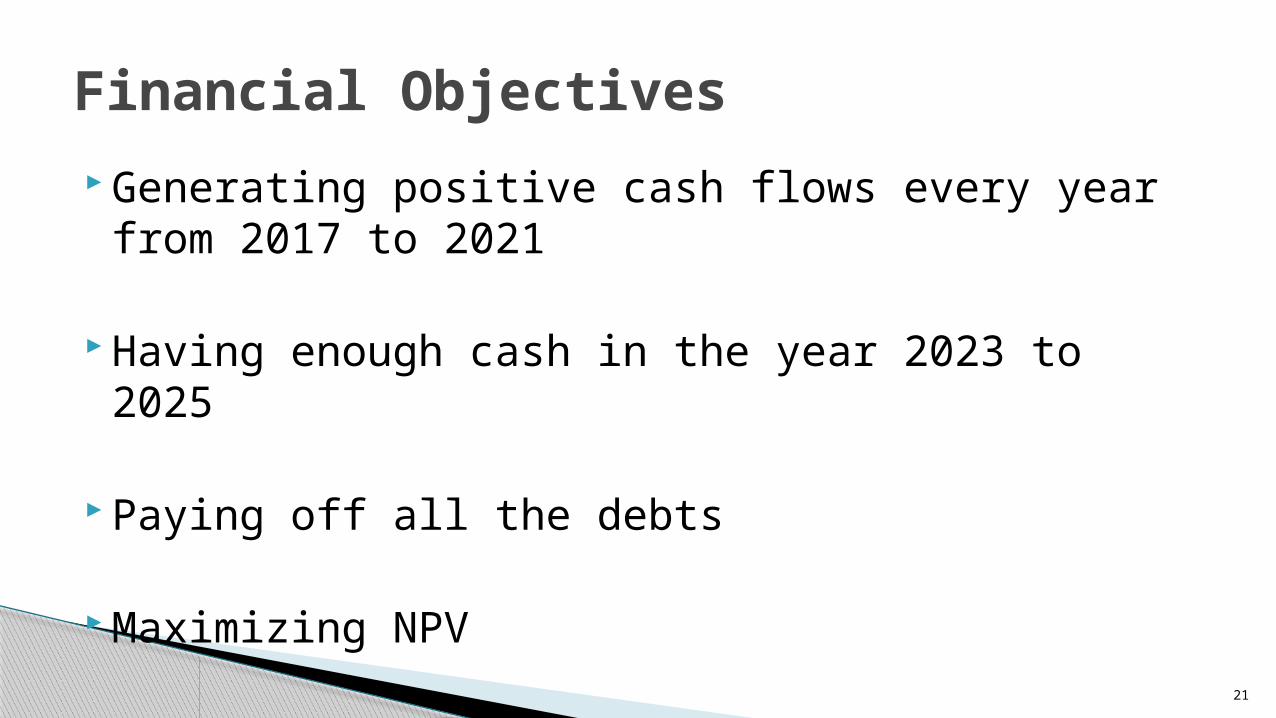
Generating positive cash flows every year from 2017 to 2021
Having enough cash in the year 2023 to 2025
Paying off all the debts
Maximizing NPV
Financial Objectives

22
Current US prime rate: 3.25%
Assume starting in 2015, the US prime rate will goes up 1%
every 3 years due to the economic recovery
US Prime Rate
2013 2014 2015 2016 2017 2018 2019 2020 2021 2022 2023 2024 2025
US Prime rate assumption(in %)
3.25 3.25 3.55 3.85 4.25 4.55 4.85 5.25 5.55 5.85 6.25 6.55 6.85
23
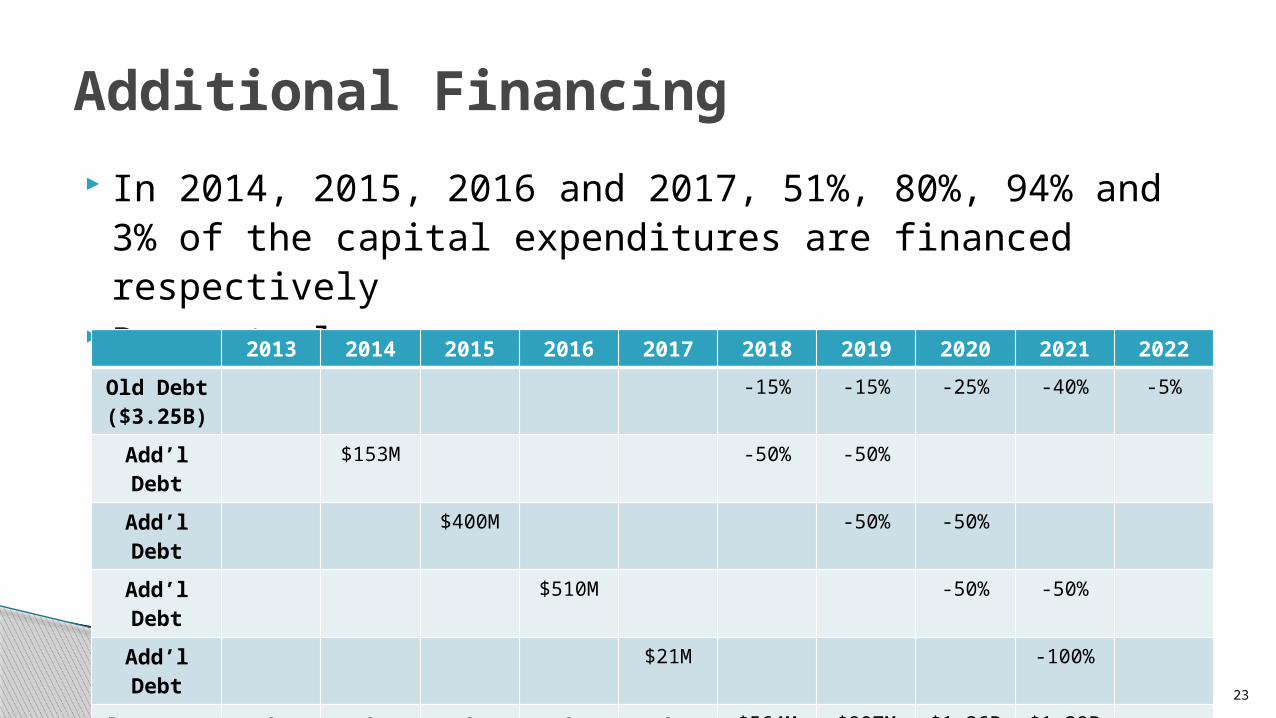
In 2014, 2015, 2016 and 2017, 51%, 80%, 94% and 3% of the capital expenditures are financed respectively
Payment plan
Additional Financing
2013 2014 2015 2016 2017 2018 2019 2020 2021 2022
Old Debt ($3.25B)
-15% -15% -25% -40% -5%
Add’l Debt
$153M -50% -50%
Add’l Debt
$400M -50% -50%
Add’l Debt
$510M -50% -50%
Add’l Debt
$21M -100%
Payments
0 0 0 0 0 $564M $907M $1.26B $1.39B
Total Debt
$3250M
$3403M
$3803M
$4336M
$4358M
$3794M
$3030M
$1750M
$163M 0
24
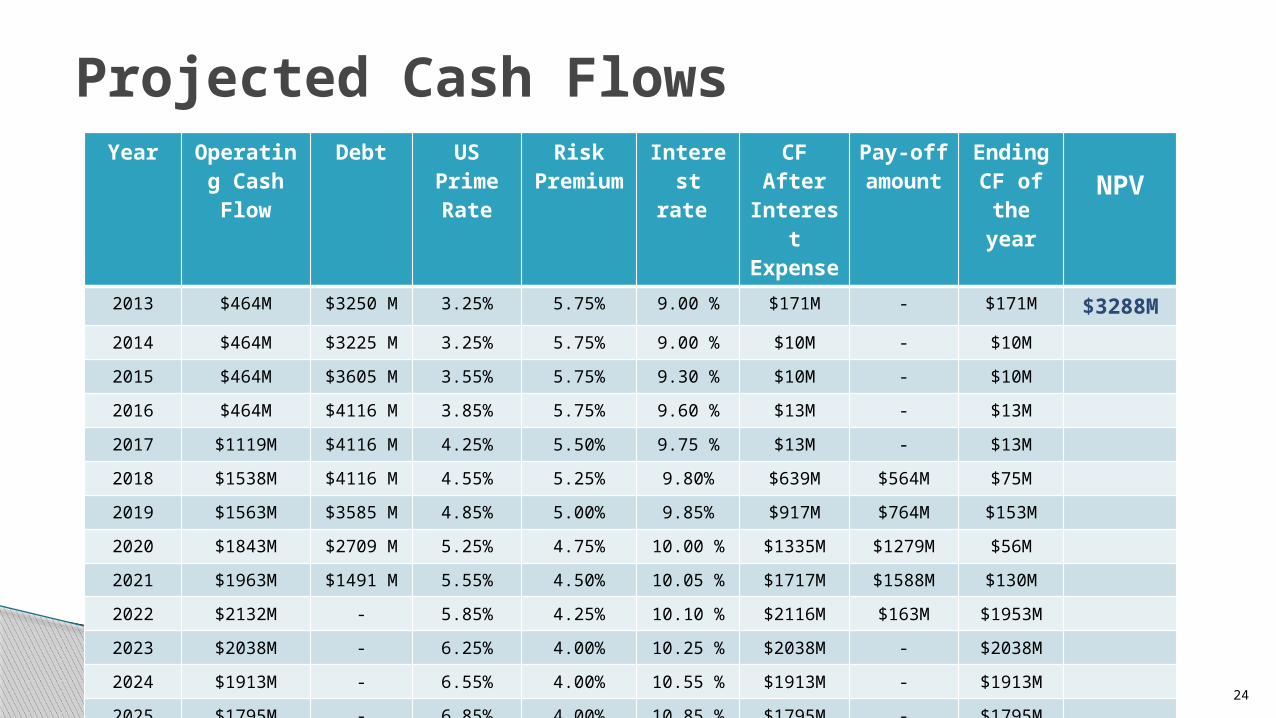
Year Operating Cash Flow
Debt US Prime Rate
Risk Premiu
m
Interest rate
CF After
Interest
Expense
Pay-off amoun
t
Ending CF of the year
NPV
2013 $464M $3250 M 3.25% 5.75% 9.00 % $171M - $171M $3288M
2014 $464M $3225 M 3.25% 5.75% 9.00 % $10M - $10M
2015 $464M $3605 M 3.55% 5.75% 9.30 % $10M - $10M
2016 $464M $4116 M 3.85% 5.75% 9.60 % $13M - $13M
2017 $1119M $4116 M 4.25% 5.50% 9.75 % $13M - $13M
2018 $1538M $4116 M 4.55% 5.25% 9.80% $639M $564M $75M
2019 $1563M $3585 M 4.85% 5.00% 9.85% $917M $764M $153M
2020 $1843M $2709 M 5.25% 4.75% 10.00 % $1335M $1279M $56M
2021 $1963M $1491 M 5.55% 4.50% 10.05 % $1717M $1588M $130M
2022 $2132M - 5.85% 4.25% 10.10 % $2116M $163M $1953M
2023 $2038M - 6.25% 4.00% 10.25 % $2038M - $2038M
2024 $1913M - 6.55% 4.00% 10.55 % $1913M - $1913M
2025 $1795M - 6.85% 4.00% 10.85 % $1795M - $1795M
Projected Cash Flows

25
Questions?