2013 Management Plan for the Shellfish Fishery Sector
19
STATE OF RHODE ISLAND AND PROVIDENCE PLANTATIONS DEPARTMENT OF ENVIRONMENTAL MANAGEMENT DIVISION OF MARINE FISHERIES 2018 Shellfish Sector Management Plan
Transcript of 2013 Management Plan for the Shellfish Fishery Sector

STATE OF RHODE ISLAND AND PROVIDENCE PLANTATIONS DEPARTMENT OF ENVIRONMENTAL MANAGEMENT
DIVISION OF MARINE FISHERIES
2018 Shellfish Sector Management Plan

1
2018 Shellfish Sector Management Plan
TABLE OF CONTENTS
INTRODUCTION .................................................................................................... 2 BAY QUAHAUG ..................................................................................................... 2 SOFT-SHELL CLAM .............................................................................................. 4 WHELK ............................................................................................................. 5 OTHER SHELLFISH .............................................................................................. 7 LITERATURE CITED ............................................................................................. 8 TABLES AND FIGURES ........................................................................................ 3 SIGNATURE PAGE ............................................................................................. 17

2 2018 Shellfish Sector Management Plan
INTRODUCTION
This plan is developed pursuant to RI Gen. Law 20-2.1-9(5), which states that the Director of the Department of Environmental Management (DEM) develop conservation and management plans in support of regulations that may restrict the issuance of commercial fishing licenses. Such restrictions were clearly contemplated by the Rhode Island General Assembly as a means to limit fishing effort and to rebuild depleted fishery resources. As articulated in statute, these plans shall focus on fishery resources with the greatest value to the state. To meet the purposes of the act, the commercial licensing program created four endorsement categories for the commercial shellfish fishery: Bay quahaug, Soft-shell clam, Whelk, and Shellfish Other. Within each endorsement category is an exit/entry ratio, or the number of new individual license opportunities provided for each license not renewed. Exit/entry ratios are reviewed annually by the Industry Advisory Committee (IAC) and Rhode Island Marine Fisheries Council, and presented for public comment at a public hearing in accordance with the requirements of the Administrative Procedures Act (RIGL Chapter 42-35) prior to finalization. Sector Management Plans are designed specifically to provide needed resource information to discuss effort control measures such as exit/entry ratios. In addition to the licensing program, management of shellfish in state waters is accomplished using various measures including gear and harvest restrictions, minimum sizes, seasons, possession limits, and tagging areas. Establishment of Shellfish Management Areas (SMA) provide for additional management measures, including more restrictive possession limits and areas closed to harvest to protect spawning stock. The following SMAs are currently in place: Conimicut Point, Potowomut, High Banks, Bissel Cove/Fox Island, Mill Gut, Bristol Harbor, Kickemuit River, Jenny’s Creek, Sakonnet River, Pt. Judith Pond, Potter Pond, Ninigret (Charlestown) Pond, Quonochontaug Pond, Winnapaug Pond, Green Hill Pond, Narrow River, Little Narragansett Bay/Pawcatuck River, Providence/Seekonk Rivers, Warren River, and Town Pond. This management plan is updated annually in support of the commercial licensing program in accordance with RIGL 20-2.1-9(5).
BAY QUAHAUG Resource Assessment: Since 1993 DEM has conducted bay quahaug surveys in Narragansett Bay on an annual basis (Ganz et al. 1999) in both fished and unfished (i.e., closed) areas (Figure 1). The sampling consists of towing a small hydraulic dredge (0.36 meter sweep) for a target distance of 30.5 meters (100 ft) at each station. Pressurized water is delivered to the dredge manifold which dislodges shellfish from the substrate. The dredge is designed to retain legal-sized quahaugs (> 25.4mm hinge width). All species retained in the dredge when

3 2018 Shellfish Sector Management Plan
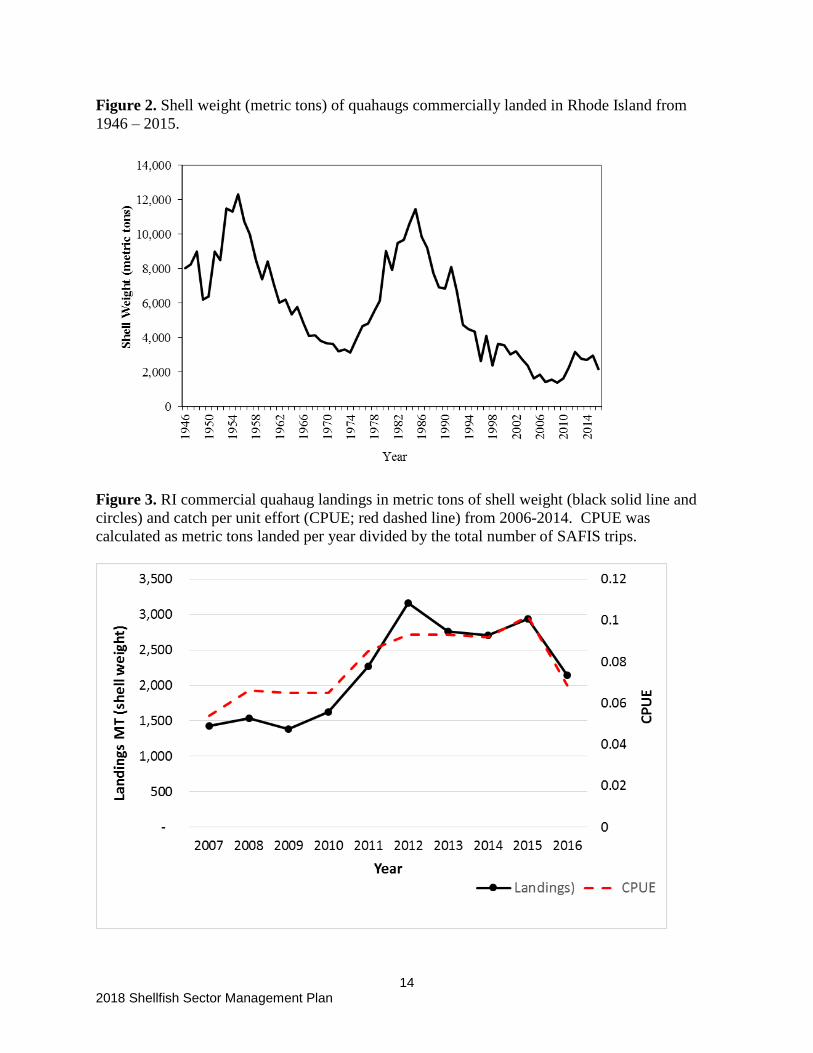
hauled are identified and all shellfish are counted and measured. In 2006, the Division evaluated the quahog dredge survey design and suggested a change from randomly sampling 20% of the entire bay in a year to a rotational design that would accommodate additional sampling in each strata. In 2008, the Division started to implement these revisions. In 2012, the annual survey employed a fully reconfigured design to increase sampling in specific strata in a given year, ultimately allowing all strata to be sampled over several years rather than in a single year as previously conducted. In general, the reconfiguration is designed to increase sampling intensity so that the number of samples per strata is sufficient to produce improved estimates of biomass by size class. Based on this survey, stratified mean density of quahaugs in Narragansett Bay has been fairly constant through the duration of the survey, typically around 2-3 quahogs per square meter. In the 2015-2016 sampling seasons, mean abundances were greatest in the Conditional Areas and West Passage (Table 1). Dredge efficiency by sediment type will be evaluated in 2017 through a collaboration with academia and industry, where side-by-side tows using the dredge, bullrakes, and quadrat sampling on SCUBA will be performed. These results will be used to inform the Division on where the dredge is and isn’t fishing effectively as well as provide appropriate calibrations for abundance data. Performance of Fishery: There are two very distinct peaks in commercial landings of bay quahaugs in Rhode Island since 1946, the first occurred in 1955 followed by a rapid decline until 1974 and then a second peak in 1985 (Figure 2). Landings and catch per unit effort (CPUE) in 2016 decreased compared to 2015 (Figure 3). In 2016, landings were primarily harvested from Conditional Areas A, followed by Conditional B and the East Passage of Narragansett Bay, and consist of littlenecks (70.5%), top-necks (21.4%), chowders (5.5%) and cherrystones (2.6%) (Table 1). Licensing Activity and Landings: In 2015, the exit/entry ratio for the Bay quahaug endorsement was changed from 2:1 to 1:1, believing that the number of active fishermen and corresponding effort is more an industry-based economic issue than a resource management or availability issue. As such, the Division believes that the number of people participating in the fishery is becoming less relevant from a resource management perspective. Improvements in landings data and reporting compliance, continued resource surveys, refinements to tagging areas and management area harvest schedules will all contribute to improved management. In 2017 1,735 licenses were issued with the ability to harvest Quahaugs in state waters (Table 2). Between 2016 and 2017, 31 restricted Quahaug licenses were not renewed (12 Multipurpose, 9 Principal Effort Licenses, 10 Commercial Fishing Licenses). Under the current exit/entry ratio regulations (1:1) 33 CFL Quahaug endorsements would be issued for 2018. Division Recommendation for the Bay Quahaug Endorsement: There are no major changes in Quahaug management anticipated in 2018. DFW recommends maintaining effort at current levels by maintaining the 1:1 exit/entry ratio for the Commercial Fishing License (CFL) Quahaug endorsement.
4 2018 Shellfish Sector Management Plan
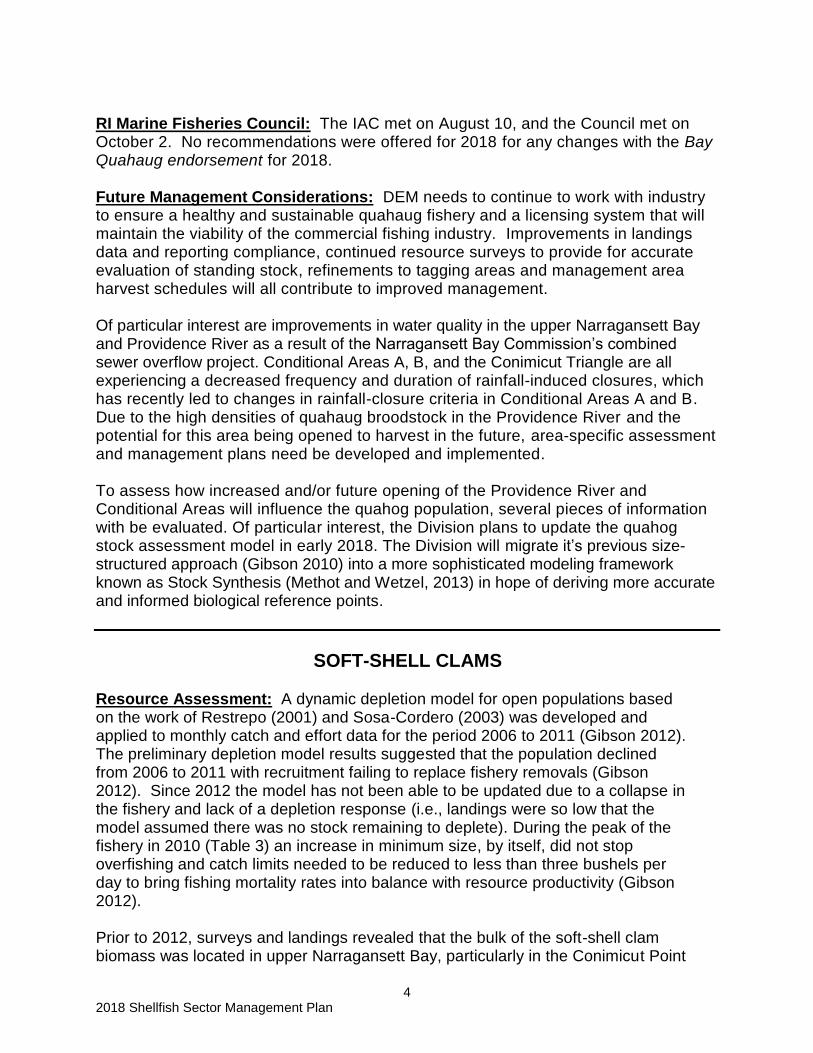
RI Marine Fisheries Council: The IAC met on August 10, and the Council met on October 2. No recommendations were offered for 2018 for any changes with the Bay Quahaug endorsement for 2018. Future Management Considerations: DEM needs to continue to work with industry to ensure a healthy and sustainable quahaug fishery and a licensing system that will maintain the viability of the commercial fishing industry. Improvements in landings data and reporting compliance, continued resource surveys to provide for accurate evaluation of standing stock, refinements to tagging areas and management area harvest schedules will all contribute to improved management. Of particular interest are improvements in water quality in the upper Narragansett Bay and Providence River as a result of the Narragansett Bay Commission’s combined sewer overflow project. Conditional Areas A, B, and the Conimicut Triangle are all experiencing a decreased frequency and duration of rainfall-induced closures, which has recently led to changes in rainfall-closure criteria in Conditional Areas A and B. Due to the high densities of quahaug broodstock in the Providence River and the potential for this area being opened to harvest in the future, area-specific assessment and management plans need be developed and implemented. To assess how increased and/or future opening of the Providence River and Conditional Areas will influence the quahog population, several pieces of information with be evaluated. Of particular interest, the Division plans to update the quahog stock assessment model in early 2018. The Division will migrate it’s previous size-structured approach (Gibson 2010) into a more sophisticated modeling framework known as Stock Synthesis (Methot and Wetzel, 2013) in hope of deriving more accurate and informed biological reference points.
SOFT-SHELL CLAMS
Resource Assessment: A dynamic depletion model for open populations based on the work of Restrepo (2001) and Sosa-Cordero (2003) was developed and applied to monthly catch and effort data for the period 2006 to 2011 (Gibson 2012). The preliminary depletion model results suggested that the population declined from 2006 to 2011 with recruitment failing to replace fishery removals (Gibson 2012). Since 2012 the model has not been able to be updated due to a collapse in the fishery and lack of a depletion response (i.e., landings were so low that the model assumed there was no stock remaining to deplete). During the peak of the fishery in 2010 (Table 3) an increase in minimum size, by itself, did not stop overfishing and catch limits needed to be reduced to less than three bushels per day to bring fishing mortality rates into balance with resource productivity (Gibson 2012). Prior to 2012, surveys and landings revealed that the bulk of the soft-shell clam biomass was located in upper Narragansett Bay, particularly in the Conimicut Point

5 2018 Shellfish Sector Management Plan
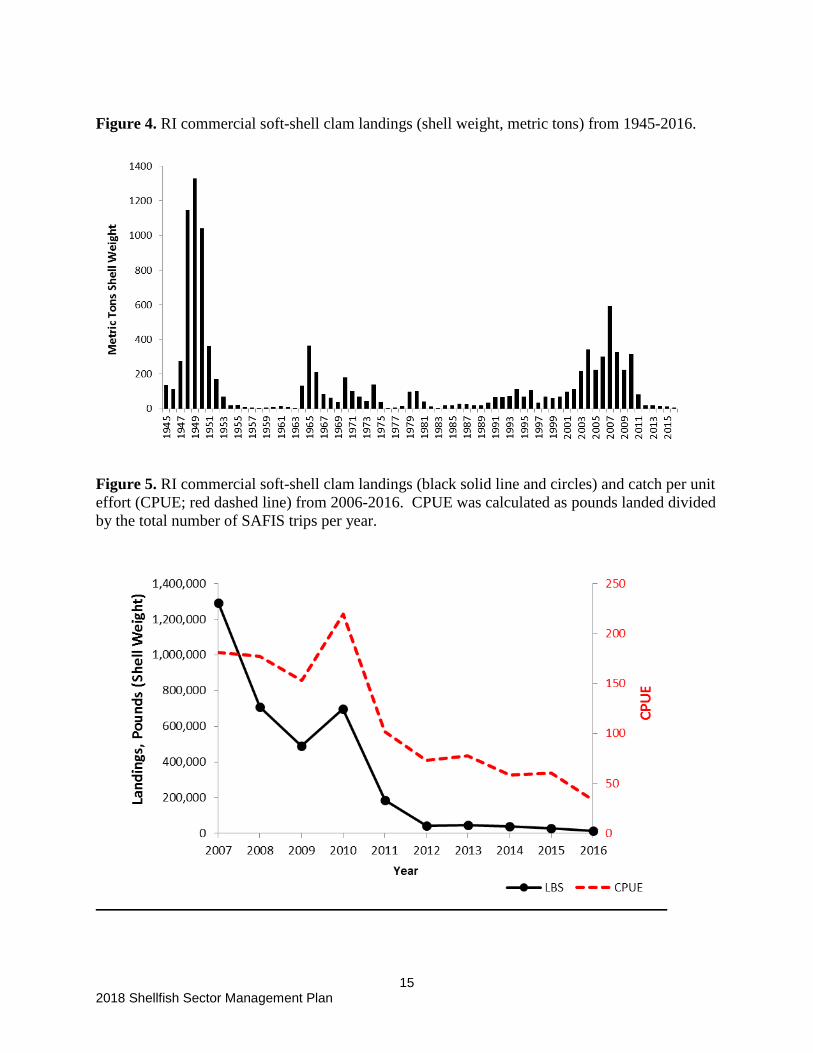
area. Due to water quality improvements from the Narragansett Bay Commission’s combined sewer overflow project, the Conimicut Triangle Conditional Area opened on June 13th, 2010. However, lacking management area status, the twelve bushel daily possession limit and 1½” minimum size resulted in the biomass being depleted to less than 10% of its former abundance (Gibson 2012). As a result, in April of 2011, the Conimicut Point SMA was established with a possession limit of three bushels per day, as well as an increase in minimum size to two inches state-wide. Performance of Fishery: Commercial landings of soft-shell clams in Rhode Island have fluctuate greatly since the mid 1990’s (Figure 4); however, recent years appear to show historically low landings (Figure 5). Landings in 2016 were down 57% from 2015 and represent the lowest levels in recent history (Table 3). Licensing Activity: In 2017, 1,104 licenses were issued with the ability to harvest Soft Shell Clams in state waters (Table 2). Between 2016 and 2017, 26 Soft Shell Clam licenses were not renewed (12 Multipurpose, 4 Principal Effort Licenses, 10 Commercial Fishing Licenses). Under the current exit/entry ratio regulations (5:1) 6 CFL Soft Shell Clam endorsements would be issued for 2018. There are no major changes in Soft Shell Clam management anticipated in 2018. Division Recommendation for the Soft-shell Clam Endorsement: DFW recommends maintaining effort at current levels by maintaining the 5:1 exit/entry ratio for the Commercial Fishing License (CFL) Soft Shell Clam endorsement. Future Management Considerations: Landings of soft-shelled clams continues to decline (Table 3). Although the Division currently doesn’t have a soft-shell clam survey, results from work in the coastal ponds combined with anecdotal observations and landings suggest that the stock is severally depleted. Research to better understand mortality sources, including presence or absence of neoplasia (i.e., leukemia-like cancer, see Metzger et al. 2015) could inform future management practices. RI Marine Fisheries Council: The IAC met on August 10, and the Council met on October 2. No recommendations were offered for 2018 for any changes with the Soft-shell Clam endorsement for 2018.
WHELK
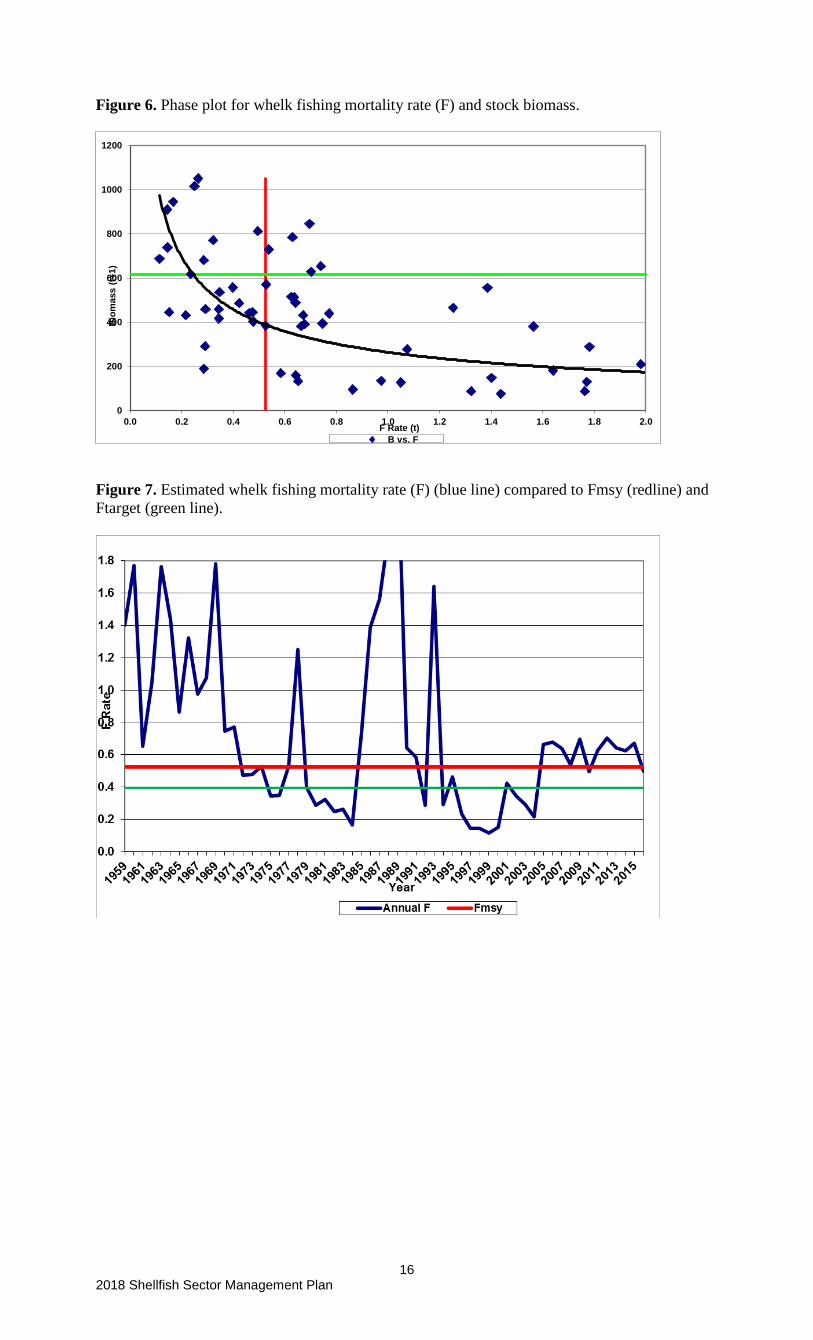
Resource Assessment: In 2010, DEM conducted its first comprehensive analytical assessment on whelk resources in Rhode Island (Gibson 2010). This work constituted the first attempt to assess the stock status of the whelk fishery in Rhode Island waters. This initial stock assessment used a biomass dynamic model (BDM) and an overfishing reference point of Fmsy=0.33 was calculated. The BDM clearly showed that whelk abundance is strongly influenced by fishing mortality rate (F). High F rates above the Fmsy=0.33 level result in low biomass; high whelk abundance occurs when the F is less than Fmsy (Figure 6). Based on the available data at that time, it was concluded that Fmsy=0.33 was an appropriate overfishing reference point and a fishing mortality rate

6 2018 Shellfish Sector Management Plan
target equal to 75% of Fmsy (F=0.25) would provide a buffer to the overfishing threshold. Based on this initial stock assessment, F rate was at or below this level, indicating that overfishing was not occurring. Also, biomass was estimated to be near the Bmsy reference level, so an overfished condition was not likely (Gibson 2010). The whelk stock BDM assessment was updated to include data through 2016 and resulted in re-estimation of Fmsy=0.53. As in the previous stock assessment, fishing mortality rates above Fmsy result in low biomass; high whelk abundance occurs when the F is less than Fmsy. The updated target F rate is 0.39. F has risen since the original assessment and is now estimated to be at or above Fmsy (Figure 7), so overfishing is likely. Stock biomass is declining but remains above the threshold for overfished status. The fishery seems to have operated in a pulse fishing mode with periodic increases in abundance that attracted fishing effort (Gibson 2010). High fishing mortality rates ensued (1960’s, 1980’s), the stock declined, effort dissipated, and a biomass recovery followed. Also, in 2012, a comprehensive whelk fishery sampling program was conducted by DEM which may aid in future assessment of the resource. Performance of Fishery: A commercial fishery for whelks has existed in Rhode Island for many years; however, until September 2009 it was not regulated or the subject of a stock assessment. There are two species commonly landed in RI, the channeled (Busycotypus canaliculatus) and knobbed (Busycon carica) whelk, with channeled whelk constituting 98% of reported landings. Since 2006, whelk landings by species have been monitored through the SAFIS reporting system, which captures landings from both state and federally permitted fishers. A sharp increase in whelk landings occurred from 2008 to 2009, and landings remained at peak levels through 2012. Since 2012, whelk landings have steadily decreased (Figure 8). Total landings of whelk (all species) in 2016 was 338,914 pounds (live weight), which was a 31% (493,166 live pounds) decrease compared to 2015. In 2016, the total value of the fishery was reported at $909,068, which was a 29% decrease compared to 2015 (Figure 8). The average whelk landings per fisher show an overall decreasing trend from 2010 onward (30% decrease since 2010). Number of active whelk fishers have decreased annually since 2011 (45% decrease since 2011) (Figure 9). Ex-vessel value of whelks from 2006 to 2009 was steady at about $1.04 per pound of live product. Price per pound of live product increased annually from 2010 to 2016, averaging $2.15 for the timeframe and peaking at an average of $2.68 in 2016 (SAFIS 2017). Effort during 2016 was reported at 2,629 fishing days by 137 individual fishers, a 9% and 15% decrease respectively, compared to 2015 (3,098 fishing days; 151 individual fishers). Licensing Activity: In 2017, 908 licenses were issued with the ability to harvest whelk in state waters (Table 2). Between 2016 and 2017, there was a net loss of 4 whelk licenses (-12 Multipurpose, +10 Principal Effort Licenses, -2 Commercial Fishing Licenses). Whelk endorsements are not managed under an exit/entry ratio system. Only current license holders with Quahaug or Soft Shell Clam endorsements may acquire a whelk endorsement.
7 2018 Shellfish Sector Management Plan
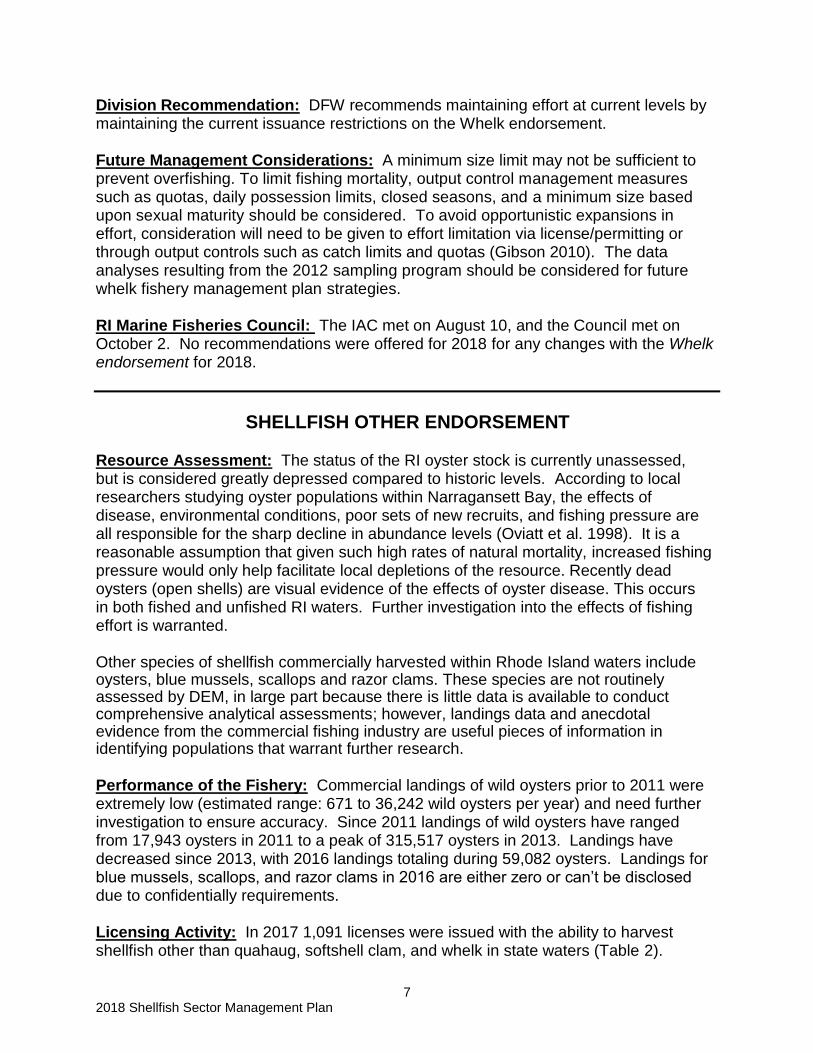
Division Recommendation: DFW recommends maintaining effort at current levels by maintaining the current issuance restrictions on the Whelk endorsement. Future Management Considerations: A minimum size limit may not be sufficient to prevent overfishing. To limit fishing mortality, output control management measures such as quotas, daily possession limits, closed seasons, and a minimum size based upon sexual maturity should be considered. To avoid opportunistic expansions in effort, consideration will need to be given to effort limitation via license/permitting or through output controls such as catch limits and quotas (Gibson 2010). The data analyses resulting from the 2012 sampling program should be considered for future whelk fishery management plan strategies. RI Marine Fisheries Council: The IAC met on August 10, and the Council met on October 2. No recommendations were offered for 2018 for any changes with the Whelk endorsement for 2018.
SHELLFISH OTHER ENDORSEMENT Resource Assessment: The status of the RI oyster stock is currently unassessed, but is considered greatly depressed compared to historic levels. According to local researchers studying oyster populations within Narragansett Bay, the effects of disease, environmental conditions, poor sets of new recruits, and fishing pressure are all responsible for the sharp decline in abundance levels (Oviatt et al. 1998). It is a reasonable assumption that given such high rates of natural mortality, increased fishing pressure would only help facilitate local depletions of the resource. Recently dead oysters (open shells) are visual evidence of the effects of oyster disease. This occurs in both fished and unfished RI waters. Further investigation into the effects of fishing effort is warranted. Other species of shellfish commercially harvested within Rhode Island waters include oysters, blue mussels, scallops and razor clams. These species are not routinely assessed by DEM, in large part because there is little data is available to conduct comprehensive analytical assessments; however, landings data and anecdotal evidence from the commercial fishing industry are useful pieces of information in identifying populations that warrant further research. Performance of the Fishery: Commercial landings of wild oysters prior to 2011 were extremely low (estimated range: 671 to 36,242 wild oysters per year) and need further investigation to ensure accuracy. Since 2011 landings of wild oysters have ranged from 17,943 oysters in 2011 to a peak of 315,517 oysters in 2013. Landings have decreased since 2013, with 2016 landings totaling during 59,082 oysters. Landings for blue mussels, scallops, and razor clams in 2016 are either zero or can’t be disclosed due to confidentially requirements. Licensing Activity: In 2017 1,091 licenses were issued with the ability to harvest shellfish other than quahaug, softshell clam, and whelk in state waters (Table 2).

8 2018 Shellfish Sector Management Plan
Between 2016 and 2017, there was a net loss of 29 shellfish other licenses (-12 Multipurpose, -4 Principal Effort Licenses, -13 Commercial Fishing Licenses). Shellfish other endorsements are not managed under an exit/entry ratio system. This is an open license category available to the general public during the application period. Division Recommendation: Maintain status quo. RI Marine Fisheries Council: The IAC met on August 10, and the Council met on October 2. No recommendations were offered for 2018 for any changes with the Shellfish Other endorsement for 2018. Future Management Considerations: Several oyster restoration and enhancement projects are currently being conducting in RI waters, as well as research investigating factors influencing recruitment or lack thereof, on natural and restored reefs. Until levels of recruitment increase, the stock will likely remain a severally depleted. The Division should consider maintaining current and expanding future enhancement, monitoring, and research along with evaluating possession limits.

9 2018 Shellfish Sector Management Plan
LITERATURE CITED Ganz A., N. Lazar, and A. Valliere. 1999. Narragansett Bay Quahaug Management
Plan. RI Division of Fish and Wildlife. Report to the Narragansett Bay Project and RI Marine Fisheries Council.
Gibson, M.R. 1999. Assessment of quahaugs (Mercenaria mercenaria) in Narragansett Bay: technical analyses in support of a bay wide quahaug management plan. RI Division of Fish and Wildlife. Res. Ref. Doc. 99/2.
Gibson, M.R. 2010. Stock Assessment of Whelk in Rhode Island and Recommendations for Research and Management. In progress
Gibson, M.R. 2012. Stock Assessment of Soft-Shell Clams (Mya arenaria) in Rhode
Island Using a Dynamic Depletion Model Applied to SAFIS Data. Draft Report - RI Division of Fish and Wildlife.
Metzger, M.J., C. Reinisch, J. Sherry, and S.P. Goff. 2015. Horizontal Transmission of
Clonal Cancer Cells Causes Leukemia in Soft-Shell Clams. Cell 161, 255–263. April 9, 2015 Elsevier Inc
Methot Jr., R.D., and C.R. Wetzel. 2013. Stock synthesis: A biological and statistical
framework for fish stock assessment and fishery management. Fisheries Research 142: 86-99.
Oviatt, C, Wolff, N, VanKeuren, D, and E. Nicosia. 1998. Oysters (Crassostrea virginica)
as indicators of a climate warming trend in Northeast waters. CR822051-010 Final report. Funding agency: Environmental Protection Agency.
Restrepo, V.R. 2001. Dynamic depletion models. Pages 345-356, In: J. G. Cano and
V.R. Restrepo, eds. Report on the FAO/DANIDA/CFRAMP WECAFC regional workshops on the assessment of spiny lobster Panulirus argus. Belize City, Belize April 21- May 2, 1997 and Merida, Yucatan Mexico June 1-12, 1998. FAO Fish. Rep. 619. Part III: Stock Assessment Methods.
Sosa-Cordero, E. 2003. Trends and dynamics of the spiny lobster, Panulirus argus,
resource in Banco Chinchorro, Mexico. Bull. Mar. Sci. 73: 203-217.

10
2018 Shellfish Sector Management Plan
Table 1. 2016 RI commercial quahaug landings by shellfish tagging area (A) and market category, and total 2016 landings by tagging area compared to mean abundances (2015-
2016) sampled by the RI DEM Dredge Survey. Totals and means are also presented as percentages.
A Count of Quahogs Landed by Market Size Total % of
Shellfish Tagging Areas Little Neck Top Neck Cherry Chowder Unclassified (#) Total
RI 1A,M - Conditional Area A, Mill Gut Management Area 12,065,662 3,884,417 398,821 910,433 0 17,259,333 60.38
RI 1B - Conditional Area B 2,421,022 682,145 99,713 114,277 0 3,317,157 11.60
RI 1C - Conditional Area C 21,790 1,953 533 221 0 24,497 0.09
RI 2 - Greenwich Bay 969,450 213,148 42,709 24,520 0 1,249,827 4.37 RI 3A,C,F,H - West Passage Management Areas 30,590 3,155 1,359 300 0 35,404 0.12
RI 3W - West Passage 1,884,722 448,183 184,339 150,284 0 2,667,528 9.33
RI 4A,B - East Passage 1,821,600 738,792 8,179 319,387 0 2,887,958 10.10
RI 5A,K - Mount Hope Bay 28,127 11,976 454 4,970 0 45,527 0.16
RI 5B - Sakonnet River 34,602 26,844 0 17,379 0 78,825 0.28 RI 6B,N,P,Q,W - Coastal Ponds & Block Island 882,839 106,296 7,083 23,065 0 1,019,283 3.57
Grand Total 20,160,404 6,116,909 743,191 1,564,835 0 28,585,338 -
B
Total Landings Mean 2015-2016 Abundance
Shellfish Tagging Areas (#) % (# m-2) %
RI 1A,M - Conditional Area A, Mill Gut Management Area 17,259,333 60.38
2.33 14.69
RI 1B - Conditional Area B 3,317,157 11.60 2.30 14.49
RI 1C - Conditional Area C 24,497 0.09 4.71 29.74
RI 2 - Greenwich Bay 1,249,827 4.37 0.82 5.16
RI 3A,C,F,H - West Passage Management Areas 35,404 0.12 3.21 20.24
RI 3W - West Passage 2,667,528 9.33 1.27 8.02
RI 4A,B - East Passage 2,887,958 10.10 0.90 5.66
RI 5A,K - Mount Hope Bay 45,527 0.16 0.08 0.49
RI 5B - Sakonnet River 78,825 0.28 0.24 1.51
RI 6B,N,P,Q,W - Coastal Ponds & Block Island 1,019,283 3.57 NA -

11
2018 Shellfish Sector Management Plan
Table 2. Historical commercial license counts.
License Type 2013 2014 2015 2016 2017
MULTI-PURPOSE LICENSE 829 816 804 802 789
GILLNET ENDORSEMENT 227 221 218 218 214
DOCKSIDE SALE ENDORSEMENT 241 236 236 245 242
MIDWATER/PAIR TRAWL ENDORSEMENT 132 133 137 139 145
PURSE SEINE ENDORSEMENT 134 134 129 136 140
FLOATING FISH TRAP ENDORSEMENT 5 3 5 7 7
PRINCIPAL EFFORT LICENSE 655 615 593 580 586
LOBSTER ENDORSEMENT 30 27 21 20 19
NON-LOBSTER CRUSTACEAN ENDORSEMENT 35 36 33 33 35
QUAHOG ENDORSEMENT 376 347 340 322 321
RESTRICTED FINFISH ENDORSEMENT 262 258 251 252 266
NON-RESTRICTED FINFISH ENDORSEMENT 135 133 130 152 159
SOFTSHELLED CLAM ENDORSEMENT 235 204 194 183 186
WHELK ENDORSEMENT 118 79 62 53 63
DOCKSIDE SALE ENDORSEMENT 13 12 11 13 15
MIDWATER/PAIR TRAWL ENDORSEMENT 8 9 7 10 9
PURSE SEINE ENDORSEMENT 7 6 5 9 9
OTHER SHELLFISH ENDORSEMENT (replaces non-quahog endorsement) 211 186 177 177 173
COMMERICAL FISHING LICENSE 420 404 412 416 429
LOBSTER ENDORSEMENT 15 14 14 12 11
NON-LOBSTER CRUSTACEAN ENDORSEMENT 100 101 95 95 104
QUAHOG ENDORSEMENT 165 181 189 197 217
RESTRICTED FINFISH ENDORSEMENT 0 0 0 0 0
NON-RESTRICTED FINFISH ENDORSEMENT 256 240 243 248 253
SOFTSHELLED CLAM ENDORSEMENT 163 155 148 139 129
WHELK ENDORSMENT 92 75 65 58 56
DOCKSIDE SALE ENDORSEMENT 14 16 16 15 18
MIDWATER/PAIR TRAWL ENDORSEMENT 46 39 39 40 37
PURSE SEINE ENDORSEMENT 40 42 43 41 40
OTHER SHELLFISH ENDORSEMENT (replaces non-quahog endorsement) 160 149 152 142 129
OVER 65 SHELLFISH LICENSE 268 289 309 350 369
STUDENT SHELLFISH LICENSE 48 47 37 48 39

12
2018 Shellfish Sector Management Plan
Table 3. RI commercial soft-shell clam landings (lbs) for 2008-2015 by shellfish tagging area.
Shellfish Tagging
Areas 2008 2009 2010 2011 2012 2013 2014 2015 2016
Average
Catch (Count)
per Day
2016 (% of
total by area)
Unknown 8,820 46,169 7,922 183 1,134 410 740 - -
RI 1A - CONDITIONAL
AREA A
519,762 351,635 138,754 66,576 2,371 999 5,225 586 1,198 33.3 4%
RI 1B,C -
CONDITIONAL AREA
B & C
- - 498,901 46,476 192 92 6,255 13,637 885 49.2 3%
RI 2 - Greenwich Bay 5,704 4,182 70 358 286 - 1,073 148 - -
RI 3 - F,W - Bissel
Cove/Fox Island,
West Passage
151,825 72,660 36,227 16,745 10,377 14,453 10,024 7,003 3,303 25.8 11%
RI 4 - East Passage 4,856 5,636 2,692 19,400 377 336 3,926 2,551 3,114 33.1 11%
RI 5 A,B,K - Mt Hope
Bay, Sakonnet River,
Kickemuit
860 1,930 427 394 97 157 231 528 523 34.9 2%
RI 6 - Coastal Ponds 22,333 12,421 13,602 33,619 27,053 29,334 10,420 4,792 3,520 22.7 12%
Total 714,160 494,633 698,595 183,751 41,887 45,781 37,894 29,245 12,543 33.2 43%
Landings (count) by year per area

13
2018 Shellfish Sector Management Plan
Figure 1. Recent sampling locations and survey strata in Narragansett Bay as measured by RI
DEM Fish and Wildlife’s hydraulic dredge survey strata (light yellow) in 2015 (red) and 2016
(blue).
14 2018 Shellfish Sector Management Plan
Figure 2. Shell weight (metric tons) of quahaugs commercially landed in Rhode Island from
1946 – 2015.
Figure 3. RI commercial quahaug landings in metric tons of shell weight (black solid line and
circles) and catch per unit effort (CPUE; red dashed line) from 2006-2014. CPUE was
calculated as metric tons landed per year divided by the total number of SAFIS trips.
15
2018 Shellfish Sector Management Plan
Figure 4. RI commercial soft-shell clam landings (shell weight, metric tons) from 1945-2016.
Figure 5. RI commercial soft-shell clam landings (black solid line and circles) and catch per unit
effort (CPUE; red dashed line) from 2006-2016. CPUE was calculated as pounds landed divided
by the total number of SAFIS trips per year.
16
2018 Shellfish Sector Management Plan
Figure 6. Phase plot for whelk fishing mortality rate (F) and stock biomass.
Figure 7. Estimated whelk fishing mortality rate (F) (blue line) compared to Fmsy (redline) and
Ftarget (green line).
0
200
400
600
800
1000
1200
0.0 0.2 0.4 0.6 0.8 1.0 1.2 1.4 1.6 1.8 2.0
Bio
mass (
t+1)
F Rate (t)
B vs. F

17 2018 Shellfish Sector Management Plan
Figure 8. RI commercial whelk landings and value (species combined) for 2006-2016 (SAFIS
2017).
Figure 9. Number of active fishers and mean landings per fisher reported in the RI commercial
whelk fishery from 2006-2016 (SAFIS 2017).
18 2018 Shellfish Sector Management Plan
Plan approved:
__________________________________ _____________
Jason McNamee, Chief Date
Division of Fish and Wildlife
Office of Marine Resource Management