2013 IRP Advisory Group Meeting - Puget Sound Energyintegrated resource plan." (2) (a) ......
44
2013 IRP Advisory Group Meeting Demand-Side Resource Potentials Gas Resource Needs & Alternatives Colstrip November 15, 2012
Transcript of 2013 IRP Advisory Group Meeting - Puget Sound Energyintegrated resource plan." (2) (a) ......

2013 IRP Advisory Group Meeting Demand-Side Resource Potentials Gas Resource Needs & Alternatives Colstrip
November 15, 2012

Today’s Agenda
9:00 – 9:15 am: Hello and Welcome
9:15 – 9:30 am: Introductions
9:30 – 9:45 am: Process Check-In
9:45 – 11:15 am: Demand Side Resource Potentials
11:15 – 11:30 am: Gas Resource Needs
11:30 – 12:30 pm: Gas Resource Alternatives
12:00 – 1:00 pm: Lunch & Electric Acquisition Update
1:00 – 2:30 pm: Colstrip
2:30 – 2:50 pm: Wrap-Up & Next Steps
2

Safety Moment
According to the Centers for Disease Control, the most common causes of longterm disability are arthritis and musculoskeletal problems. They make up about 1/3 of all disability cases, and bad backs fall into this category. To help keep your back healthy for years to come, proper lifting techniques are essential.
3

Integrated Resource PlanningWAC 480-100-238 Integrated resource planning.
(1) Purpose. Each electric utility regulated by the commission has the responsibility to meet its system demand with a least cost mix of energy supply resources and conservation. In furtherance of that responsibility, each electric utility must develop an "integrated resource plan."
(2) (a) "Integrated resource plan" or "plan" means a plan describing the mix of energy supply resources and conservation that will meet current and future needs at the lowest reasonable cost to the utility and its ratepayers.
(2) (b) "Lowest reasonable cost" means the lowest cost mix of resources determined through a detailed and consistent analysis of a wide range of commercially available sources. At a minimum, this analysis must consider resource cost, market-volatility risks, demand-side resource uncertainties, resource dispatchability, resource effect on system operation, the risks imposed on ratepayers, public policies regarding resource preference adopted by Washington state or the federal government and the cost of risks associated with environmental effects including emissions of carbon dioxide.
( )_____________

Regulatory Compliance
Customer Needs
Stak
ehol
ders
Market O
utlook
5

Mar 6th 2012 – Kickoff Meeting
Big Picture Framing,
Began discussion on WUTC letter regarding Colstrip analysis
May 1st 2012 – Framing & Draft Work Plan
Discussion on scenarios,
Discussion of some Colstrip analysis isssues,
PSE agrees to model the societal costs of CO2 in addition to the CO2 tax approach.
June 21st 2012 – Framing & Into Assumptions
More discussion on scenarios,
Shared draft CO2 costs/prices, draft gas prices, draft base case power prices.
Sep 6th 2012 – Market Assumptions & Operational Flexibility Approach
Review power prices for all scenarios,
Assumption and results of market power price analysis,
Analyzing electric operational flexibility—physical and financial—and approach to incorporate into 2013 IRP.
Advisory Group Meeting Summary to Date
6

Two Meetings on Scenarios/Sensitivities
Looking at various Colstrip sensitivities
Looking at CO2 costs as a societal costs as well as a carbon cost and as a tax
New Questions for the IRP
Flexibility needs
Availability of the Regional Surplus
Build Constraints
Transmission considerations
Future of Colstrip
Showed early assumptions
Gas Prices
CO2 Cost/Prices
Electric Prices Incl. Impact of Colstrip Retirement on Mid-C
IRP Advisory Group Meeting Highlights
7

2013 IRP: DRAFT Scenarios & SensitivitiesScenarios: 4 Complete Possible Futures
Base Case: Mid Growth, Mid Gas Price, No New CO2 Prices
Green World: High Growth, High Gas Price, Mid CO2 Prices
Low: Low Growth, Low Gas Price, No New CO2 Prices
High: High Growth, High Gas Price, No New CO2 Prices
Sensitivities: 17+ What if/All Else Equals???
2 Base + CO2 Costs: High/Low
2-3 No Colstrips: Sold/Retired
2 Gas Price Extremes: Very High & Very Low Gas Prices
DSR Avoided Capacity Value: Physical & Financial
Accelerated Demand-Side Resources
Transportation Load: Electric and Gas
Tax Incentives for Renewables
Timing of Regional Surplus
Build Constraints
Fuel Supply Constraints8
High+Mid CO2
-------__
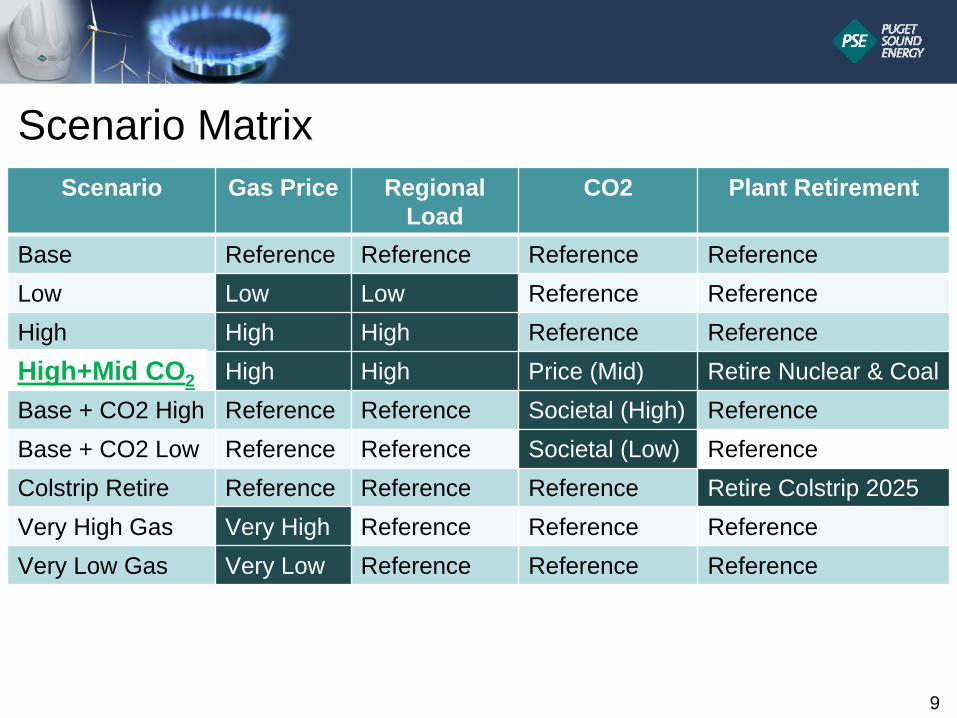
Scenario MatrixScenario Gas Price Regional
LoadCO2 Plant Retirement
Base Reference Reference Reference ReferenceLow Low Low Reference ReferenceHigh High High Reference ReferenceGreen World High High Price (Mid) Retire Nuclear & CoalBase + CO2 High Reference Reference Societal (High) ReferenceBase + CO2 Low Reference Reference Societal (Low) ReferenceColstrip Retire Reference Reference Reference Retire Colstrip 2025Very High Gas Very High Reference Reference ReferenceVery Low Gas Very Low Reference Reference Reference
9
High+Mid CO2

10
$/M
MB
tu
4.205.81
8.08
9.9611.57
3.174.20
6.06
7.81
9.98
0.00
2.00
4.00
6.00
8.00
10.00
12.00
14.00
Very Low Gas Low Gas Base High Gas Very High Gas
$/MMBtu
Compare Draft 2013 IRP Levelized Gas Prices(Sumas Hub, 20 year levelized , nominal $, 7/09/12 update)
2011 IRP2013 IRP

CO2 Cost/Price Forecasts

Avg Annual Mid-C Price Forecast: Summary
0
20
40
60
80
100
120
140
160
180
2012 2013 2014 2015 2016 2017 2018 2019 2020 2021 2022 2023 2024 2025 2026 2027 2028 2029 2030 2031 2032 2033
Nom
inal $/M
Wh
Annual Average Mid‐C Power Price (Nominal $/MWh)
Base + High CO2
Green World
Very High Gas
High
Base + Low CO2
Colstrip Retire 2025
Base
Low
Very Low Gas
12
Hi + Mid CO2 Price

Regulatory Compliance
Customer Needs
Stak
ehol
ders
Market O
utlook
13

Demand-Side Resource Potentials
Cadmus Presentation
14

Gas Portfolio Needs & Resource Alternatives
November 15, 2012
Jay Jacobsen, Gurvinder Singh & Bill Donahue

Agenda – Gas Resource Needs and Alternatives
Introduction
Needs
Peak Capacity
Annual Load
Resource Alternatives
DSR
Supply – Pipeline and Storage
LNG Peak Shaving
Q & A
16

17
-
200.0
400.0
600.0
800.0
1,000.0
1,200.0
1,400.0
1,600.0
MD
th /
day
Peak Load/Resource Balance - Gas Sales Portfolio(Draft 11/15/2012)
Total Jackson Prairie & Redelivery Service Plymouth LNG & Redelivery ServiceOn System Total NWP Firm Transport (TF-1)Additional NWP Firm Transport Available w/ Renewals F2012 Base Forecast w/ 2012-13 DSR Only
13
195323
99

18
0
50
100
150
200
250
300
MD
th / d
ay
Peak Load/Resource Balance - Gas for Power Portfolio(Note: Existing Generation Only - Draft 11/15/12)
Total Jackson Prairie (no redelivery service) NWP Year-Round Transport (TF-1)Additional NWP Firm Transport Available w/ Renewals Existing Generation Peak Demand
-5

19
0
20,000
40,000
60,000
80,000
100,000
120,000
140,000
160,000
Annu
al V
olum
e (M
Dth
)
Weather Normalized Historical
Base
2005‐11 Historical Loads & F2012 IRP Forecast Scenario(Firm + Interruptible excluding transport, includes 2012-13 DSR)

DSR Resource Alternatives
Eligible Customers, Loads, End- Uses, DSR Measures
Technical Potential
Achievable Technical Potential
DSR Bundle
A2
DSR Bundle
A3
DSR Bundle
B1 … …
Customer Forecast
Load Forecast
Baseline EUC
System Load Curve
Fuel Shares
Appliance Saturation
Measure Characteristics
End-use Load Shapes
Market Constraint Factors
Measure Costs & Administrative Expenses Divide into Cost Groups
Portfolio Optimization Model - SENDOUT®
Sub-divide into market sectors and weather-sensitive measures
DSR Bundle
A1
…DSR Bundles
D, E, F,G
DSR Bundle
B2
DSR Bundle
C1
DSR Bundle
C2

Bundles 2011 IRP vs. 2013 IRP
21
Bundle 2011 IRP Bundle 2013 IRPA ($99.00) to $0.45 A1 ($99.00) to $0.22
B $0.45 to $0.70 A2 $0.22 to $0.30
C $0.70 to $0.95 A3 $0.30 to $0.45
D $0.95 to $1.20 B1 $0.45 to $0.55
E $1.20 to $1.50 B2 $0.55 to $0.70
F $1.50 to $2.00 C1 $0.70 to $0.85
G $2.00 to $2.50 C2 $0.85 ‐
$0.95
H $2.50 to $99.00 D $0.95 to $1.20
E $1.20 to $1.50
F $1.50 to $2.00
G $2.00 to $99.00

Achievable Technical Potentials
Bundle Price Cut-Offs for Bundles2013 IRP Annual MDth ATP1
2014 2033
A1 ($99.00) to $0.22 83.0 3,361.3
A2 $0.22 to $0.30 168.0 3,406.6
A3 $0.30 to $0.45 13.2 377.4
B1 $0.45 to $0.55 2.3 53.3
B2 $0.55 to $0.70 9.8 254.7
C1 $0.70 to $0.85 11.9 329.1
C2 $0.85 ‐
$0.95 4.5 96.1
D $0.95 to $1.20 25.7 887.3
E $1.20 to $1.50 128.5 2,634.6
F $1.50 to $2.00 38.8 1,105.5
G $2.00 to $99.00 583.4 12,817.0
22Notes: 1. ATP = Achievable Technical Potential

Gas DSR Ramp Rates
23
Three ramp rates will be tested:
10-year ramp of discretionary measures
20-year ramp of discretionary measures
Delayed 10-year ramp of discretionary measures

Regional Transportation Map
24

Pipeline Alternatives
25
Alternative From/ToCapacity Demand
($/Dth/Day)
Variable Commodity
($/Dth)
Fuel Use (%) Comments
Vintage NWP Rockies & Sumas to PSE 0.41 0.03 1.4 No additional vintage capacity available
Expansion of NWP Sumas to PSE 0.50 0.03 1.9 Prospective project, estimated project cost
Westcoast (T-south) Station 2 to Sumas 0.42 0.01 1.6 30% of Westcoast capacity is uncontracted
Westcoast (T-north) Prod. fields to Station 2 0.13 0.01 1 Needed in conjunction with Aitken Creek storage
Fortis BC/Spectra KORP
Foothills to Sumas (Bi- directional) 0.44 0 0 Prospective project
NGTL (Nova) Pipeline AECO to Alberta/BC border 0.17 0 0 Uncontracted capacity is available
Foothills Pipeline BC Border to Kingsgate 0.097 0 1.1 Uncontracted capacity is available
GTN Pipeline Kingsgate to Stanfield 0.177 0.004 1.4 Uncontracted capacity is available
Palomar/Blue Bridge Stanfield to PSE 0.80 0.005 2.0 Prospective project, estimated project cost
Ruby Pipeline Rockies to Malin 1.14 0.01 0Published tariff is $1.14 but discounted rates are expected to be available for
several years
GTN "Backhaul" Malin to Stanfield 0.21 0.005 0 Uncontracted capacity is available

Storage AlternativesAlternative
Storage Capacity
(MDth)
Max. With.
Capacity (MDth/day)
Days of Full With.
(days)
Max. Injection Capacity
(MDth/day)
Capacity Demand
($/Dth/mo)
Delivery Demand
($/Dth/mo)
Inj. Rate
($/Dth)
With. Rate
($/Dth)
Fuel Use (%)
Comments
Recent Jackson Prairie
Expansion2,184 104 21 52 0.106 1.234 - - 0.58 No additional JP
expansions planned
PSE LNG Project (PSE
portion)300 30 10 1.5 ? ? ? ? ?
Prospective project, estimated size and
costs
LNG Peak Gas Supply 200 20 10 - ? ? ? ? ?
Prospective project, estimated size and
costs
Mist Expansion 1000 50 20 20 - - - - -Prospective project, estimated size and costs, confidential
Clay Basin 4,000 33 120 26 0.024 2.85 0.011 0.018 1.9Existing project,
released capacity available in 2018
Ryckman Creek
(Peregrine)- 40 101 - - - - - -
Existing project, estimated size and costs, confidential
Aitken Creek - 40 150 - - - - - - Existing project - capacity available
26

27
LNG in PSE Service Territory
PSE is considering development of an LNG project to provide fuel for the natural gas vehicle market – specifically, maritime vessels and large trucks:
• Proposed site could be ideal for peak-shaving on the PSE distribution system
• Cost savings might be achieved through a larger, combined-use project
• Project could also provide reliable local supply for Gig Harbor and a future satellite to serve PSE’s Kittitas system

28
$0.00
$0.50
$1.00
$1.50
$2.00
$2.50
$3.00
$3.50
$4.00
$4.5020
11
2012
2013
2014
2015
2016
2017
2018
2019
2020
2021
2022
2023
2024
2025
2026
2027
2028
2029
2030
2031
2032
2033
2034
2035
$2010
Fuel Cost Per Gallon Equivalent (Source: EIA 2012 AEO)
Gasoline Diesel Natural Gas

29
LNG Peak-ShavingTo be considered in IRP for gas customer portfolio:
• 30,000 Dth per day vaporization• 300,000 Dth (3.6 million gallons LNG) storage
for up to 10 days of service• Size limited by ability of distribution system to
absorb the vaporized supplyCosts to PSE gas customer portfolio would include contracted use of:
• Portion of larger, combined-use storage tank• Vaporization equipment• Portion of truck-loading capacity• Portion of liquefaction capacity (250 days to
refill)

30
LNG Peak-Shaving
It may be possible to increase the peaking resource by the amount of plant inlet:
•Supply that would have been used for liquefaction is diverted to other city-gates to serve gas customers•LNG service would rely on previously stored volumes on those few days

31
LNG Peak-Shaving
Additional considerations:• Could the addition of LNG peak-shaving in the
gas portfolio displace some Jackson Prairie storage, which could then be used by the electric portfolio?• Better fit resource for type of need –
• Gas portfolio demand is very weather sensitive with a significant needle-peak, protecting against extreme cold weather conditions (13º F @ Seatac)
• Electric portfolio requires flexible injections & withdrawals for intra-day supply or sink
• Transfer price issues to be resolved

Gas Supply Assumptions for Generic Resources - Draft
32
Notes: 1.Firm Pipeline Capacity: Assume firm pipeline capacity to liquid market hub(s)2.Storage Flexibility: For the gas for power portfolio assume maintenance of current ratio of storage capacity to peak gas demand (approximately 20%).3.Storage may substitute for pipeline capacity in some cases.

Gas Supply Cost Assumptions for Generic Resources - Draft
33
Westside CCCT & Peakers w/o Oil Back-up - 100% Sumas on NWP + 50% Station 2 on Westcoast
Fixed Demand ($/Dth/day)
Variable Commodity
($/Dth)ACA Charge
($/Dth) Fuel Use (%)
Utility Taxes (3.852% - if
located in WA)NWP Expansion (1) 0.500 0.030 0.0018 1.90%Westcoast @ 50% 0.210 0.010 1.60%Storage (@ 20% of Demand) (2) 0.037 0.000 2.00%
Total 0.747 0.040 0.0018 5.50% 3.852%
Annual Fixed Cost for 50,000 Dth/day Plant ($/yr) = $13,631,500
Eastside CCCT & Peakers w/o Oil Backup - 100% AECO on GTN/Nova/Foothills
Fixed Demand ($/Dth/day)
Variable Commodity
($/Dth)ACA Charge
($/Dth) Fuel Use (%)
Utility Taxes (3.852% - if
located in WA)NOVA (TC-AB) 0.170 0.00 0%Foothills (TC-BC) 0.097 0.00 1.10%GTN to Stanfield 0.177 0.004 0.0018 1.39%Storage (@ 20% of Demand) (2) 0.037 0.000 2.00%
Total 0.481 0.004 0.0018 4.49% (3)
Annual Fixed Cost for 50,000 Dth/day Plant ($/yr) = $8,783,319
Notes:(1) Estimated NWP Sumas to PSE Expansion
(3) Assume Eastside plants located in Oregon near Stanfield.(4) Pipeline demand costs are assumed to escalate at 1.25% per year.
(2) Storage requirements are based on current storage withdrawal capacity to peak plant demand for the gas for power portfolio (approx. 20%).
Lunch Break & Electric Acquisition Update
34

Colstrip Discussion
Colstrip Ownership Structure
Approach in IRP
Colstrip Transmission
Case Studies
Q & A
Next Steps

36
Colstrip Ownership Structure

Approach
Key Finding From Analysis Presented on Sept 6:
Colstrip Won’t Have Significant Impact on Mid-C Price Forecast
Allows More Flexibility in Market Portfolio Analysis
Additional Assumptions—Colstrip Compliance Cases
Three Compliance Cases
Units 1&2 and Units 3&4 Analyzed Independently
Include Opportunity Cost of Transmission
Colstrip Portfolio Analysis
Remove Units 1 & 2 and Units 3 & 4 from Portfolio in 2014
Questions: Would Units 1 & 2 and Units 3 &4 Be Economic Under Each Case? Different Market Scenarios Change Answer? Benefits/Costs Relative to Societal Costs?

Colstrip Case Studies
Refer to Hand Out
Colstrip Units 1 & 2 Case Studies
Colstrip Unitis 3 & 4 Case Studies
38

39
Colstrip
Townsend
GarrisonPSE

Colstrip Transmission
Three Primary Segments of Transmission
Colstrip to Townsend: Joint Owners
Townsend to Garrison: BPA (~Joint Owners Contract 2027)
Garrison to PSE: BPA Transmission (5-Year Terms)
Opportunity Cost of Transmission
What Transmission Cost Would Be Avoided if Colstrip Was Not In Portfolio?
Garrison to PSE: ~$13.5 Million/Year
Townsend to Garrison: ~$5 Million/Year After 2027
Colstrip to Townsend: Sunk
40

Additional Discussion
Remediation Costs
Other Regulatory Impacts
Processes
41

Demand-Side Resources: Electric & Gas
Gas Utility Resource Needs
Gas Resource Alternatives
Colstrip
42
Wrap Up for Today

43
Anticipated 2013 IRP Work Plan Schedule for Public Participation-October 15, 2012
Feb Mar Apr May June July Aug Sept Oct Nov Dec Jan Feb Mar Apr MayFrame & ScenariosResource NeedsDefine AlternativesAnalysis of AlternativesAnalysis of Results Conclusions & DraftingFinalization & Production
2012 2013
Thurs, Sept 6in Bellevue at
PSE in Summit Room
Work Plan
Draft IRP
Final IRP
Nov 14+15in Bellevue
at PSE in Forum Room
Tues, Jan 22in Bellevueat PSE in
Forum Room
Tues, Mar 5in Bellevueat PSE in
Forum Room
Tues, Apr 23in Bellevueat PSE in
Forum Room
Tues , May 1in Bellevueat PSE in
Forum Room
Tues, March 6in Bellevue at PSE in Forum
Room
Tues , June 21in Bellevueat PSE in
Summit Room

Thank You!
44