2013 Full Year results - Nexans _FY_results2013.pdf · 2013 Full Year results 2 ... demand in Q3...
37
2013 Full Year results February 11, 2014
-
Upload
phunghuong -
Category
Documents
-
view
217 -
download
1
Transcript of 2013 Full Year results - Nexans _FY_results2013.pdf · 2013 Full Year results 2 ... demand in Q3...

2013 Full Year results February 11, 2014
2 2013 Full Year results
This presentation contains forward-looking statements relating to the Group’s expectations for future financial performance, including sales and profitability. The forward looking statements contained in this presentation are dependent on the risks and uncertainties, known or unknown at this date, that may impact on the Company’s future performance, and which may differ considerably. Such factors may include the trends in the economic and commercial conditions and in the regulatory framework and also the risk factors set out in the 2013 Registration Report, including confirmation of the risks linked to the authorities‘ antitrust investigations in Europe, the United States, Canada, Brazil, Australia and South Korea (in addition to the on-going procedures regarding local business) for alleged anticompetitive behavior in the submarine and underground power cable sectors. An unfavorable outcome of these investigations and follow-on consequences could have a significant material adverse effect on the results and Nexans’ financial situation, even excluding the potential fine that may be imposed by the European Commission.
Investor relations :
Michel Gédéon
Laura Duquesne
Carole Vitasse
+ 33 1 73 23 85 31
+ 33 1 73 23 84 61
+ 33 1 73 23 84 56
Safe Harbor In addition to the risk factors, the main uncertainties concern in particular: • The cost-saving plans in Europe and Asia may have a significant adverse impact on operations.
• The operating performance of the high voltage business, in particular compliance with delivery lead times and successful results of tests requested by customers, as well as positive outcomes for claims management procedures related to turnkey projects.
• A sufficient level of demand and prices being maintained in Europe and North America.
• The economic environment in certain emerging countries (China, Brazil).
• The potential impact in 2014 of the antitrust investigations begun in 2009, consistent with the accounting options applied by the Group.
• The Group's ability to integrate newly-acquired entities, leverage its partnerships and carry out its planned divestments in the best conditions.
• Increased customer credit risks, which in some cases cannot be insured, or fully insured, in Southern Europe and North Africa and in some customer segments in China.

XXXXXXXX ACTIVITY OVERVIEW
4 2013 Full Year results
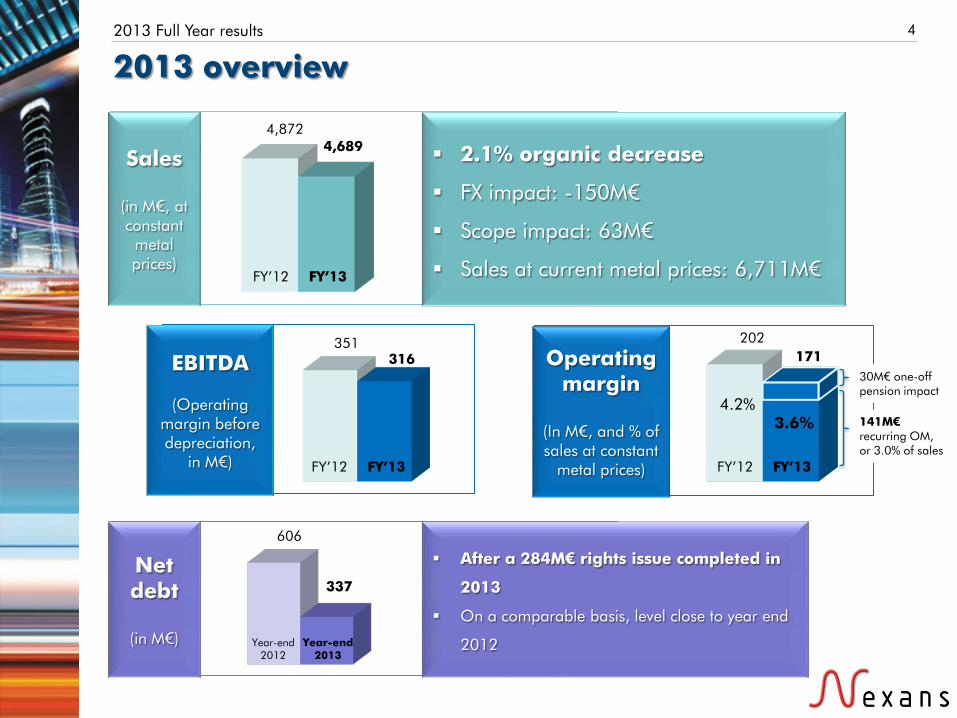
2013 overview
FY’12 FY’13
4,872 4,689
Sales
(in M€, at constant
metal prices)
2.1% organic decrease
FX impact: -150M€
Scope impact: 63M€
Sales at current metal prices: 6,711M€
FY’12 FY’13
351 316 EBITDA
(Operating
margin before depreciation,
in M€) FY’12 FY’13
202 171 Operating
margin
(In M€, and % of sales at constant
metal prices)
4.2% 3.6%
30M€ one-off pension impact
141M€ recurring OM, or 3.0% of sales
Year-end 2012
606
337 Net debt
(in M€)
After a 284M€ rights issue completed in
2013
On a comparable basis, level close to year end
2012 Year-end 2013

5 2013 Full Year results
2013: Difficult environment but start of implementation of strategic initiatives
Operating margin, in M€
Fixed cost reduction
High voltage
Competitiveness
Baseline
Pension impact
202
171
2012 2013
30
19
122
Strategic initiatives
6 2013 Full Year results
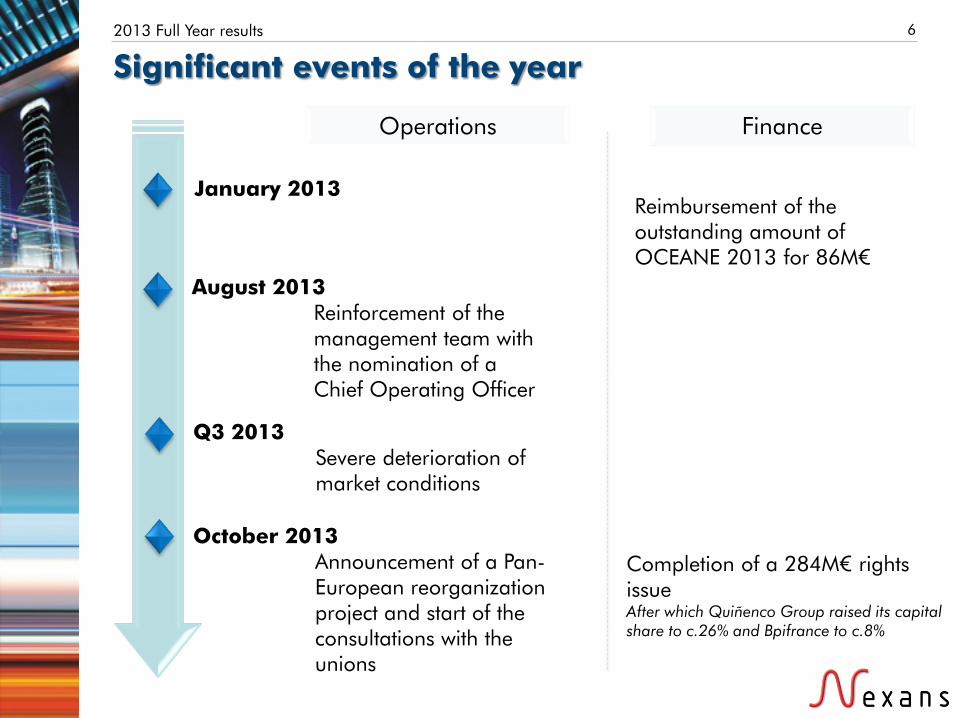
Significant events of the year
August 2013 Reinforcement of the management team with the nomination of a Chief Operating Officer
October 2013 Announcement of a Pan-European reorganization project and start of the consultations with the unions
Q3 2013 Severe deterioration of market conditions
Operations Finance
Completion of a 284M€ rights issue After which Quiñenco Group raised its capital share to c.26% and Bpifrance to c.8%
Reimbursement of the outstanding amount of OCEANE 2013 for 86M€
January 2013
7 2013 Full Year results
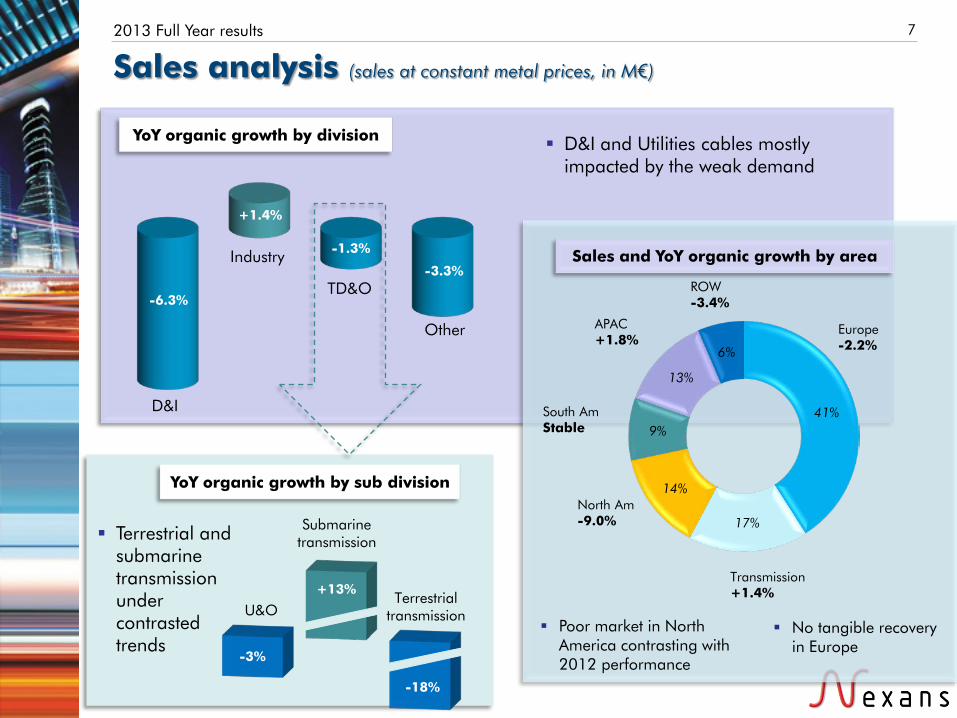
Sales analysis (sales at constant metal prices, in M€)
YoY organic growth by division D&I and Utilities cables mostly impacted by the weak demand
D&I
Industry
Other
-6.3%
+1.4%
-3.3% TD&O
-1.3%
YoY organic growth by sub division
Terrestrial and submarine transmission under contrasted trends
Sales and YoY organic growth by area
North Am -9.0%
South Am Stable
APAC +1.8%
ROW -3.4%
Europe -2.2%
41%
17%
14%
9%
13%
6%
Poor market in North America contrasting with 2012 performance
Transmission +1.4%
No tangible recovery in Europe
-3%
+13%
-18%
Submarine transmission
U&O Terrestrial
transmission
8 2013 Full Year results
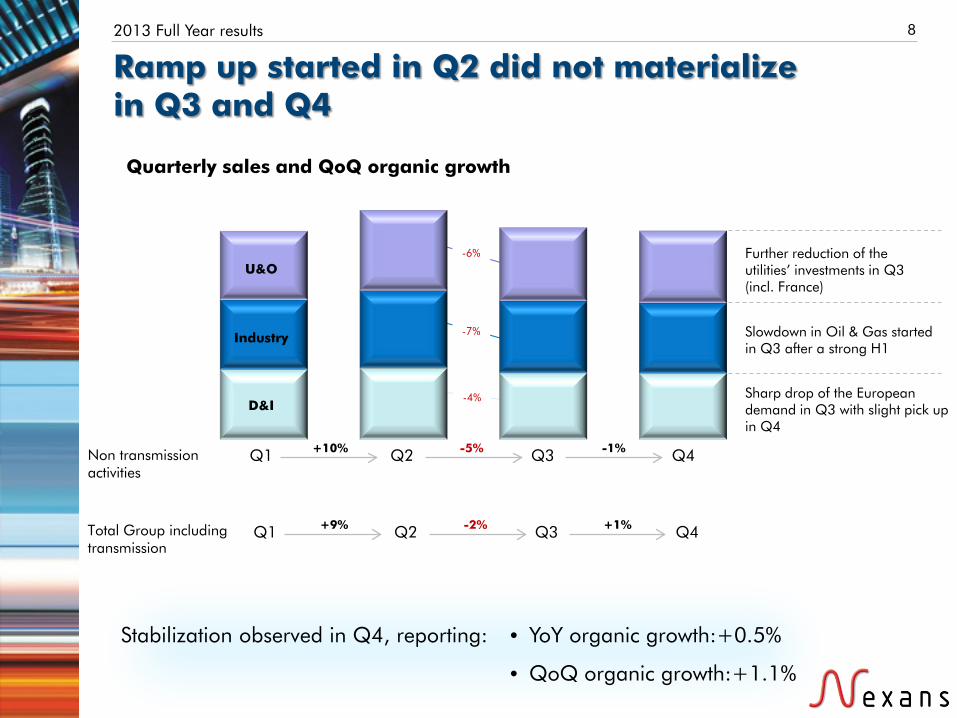
Ramp up started in Q2 did not materialize in Q3 and Q4
Quarterly sales and QoQ organic growth
Q1 Q2 Q3 Q4
D&I
U&O
Industry
Sharp drop of the European demand in Q3 with slight pick up in Q4
Slowdown in Oil & Gas started in Q3 after a strong H1
Further reduction of the utilities’ investments in Q3 (incl. France)
+10% -5% -1%
• YoY organic growth:+0.5%
• QoQ organic growth:+1.1%
Non transmission activities
Total Group including transmission
Q1 Q2 Q3 Q4 +9% -2% +1%
Stabilization observed in Q4, reporting:
-4%
-7%
-6%
9 2013 Full Year results
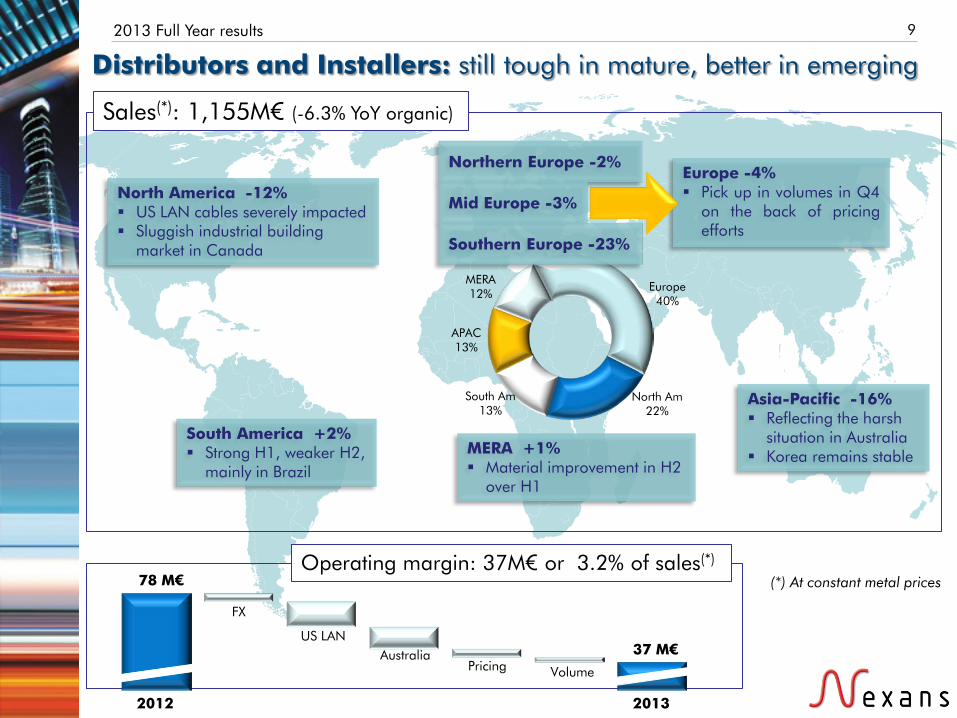
Distributors and Installers: still tough in mature, better in emerging
-6.3% +1.4%
-1.3%
-3.3%
North America -12% US LAN cables severely impacted Sluggish industrial building
market in Canada
South America +2% Strong H1, weaker H2,
mainly in Brazil
Asia-Pacific -16% Reflecting the harsh
situation in Australia Korea remains stable
Northern Europe -2%
Mid Europe -3%
Europe -4% Pick up in volumes in Q4
on the back of pricing efforts
Sales(*): 1,155M€ (-6.3% YoY organic)
Operating margin: 37M€ or 3.2% of sales(*)
78 M€
37 M€
2012
FX
US LAN
Pricing Volume Australia
Europe 40%
North Am 22%
South Am 13%
APAC 13%
MERA 12%
MERA +1% Material improvement in H2
over H1
Southern Europe -23%
2013
(*) At constant metal prices
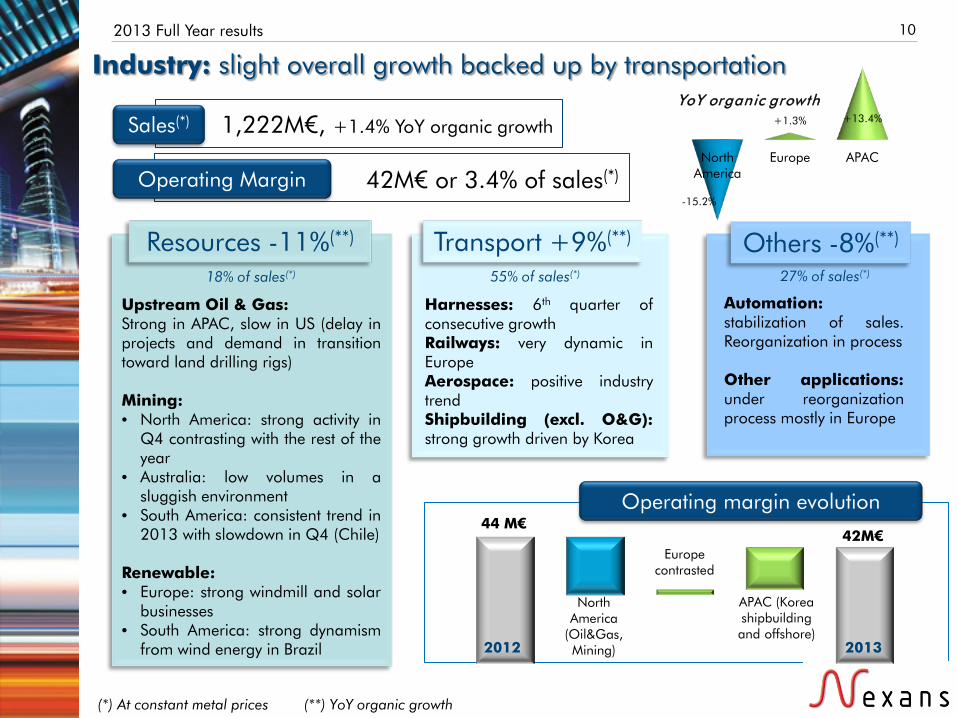
North America
Europe APAC
-15.2%
+1.3% +13.4%
10 2013 Full Year results
Industry: slight overall growth backed up by transportation
Transport +9%(**)
Harnesses: 6th quarter of consecutive growth Railways: very dynamic in Europe Aerospace: positive industry trend Shipbuilding (excl. O&G): strong growth driven by Korea
Resources -11%(**)
Upstream Oil & Gas: Strong in APAC, slow in US (delay in projects and demand in transition toward land drilling rigs)
Mining: • North America: strong activity in
Q4 contrasting with the rest of the year
• Australia: low volumes in a sluggish environment
• South America: consistent trend in 2013 with slowdown in Q4 (Chile)
Renewable: • Europe: strong windmill and solar
businesses • South America: strong dynamism
from wind energy in Brazil
1,222M€, +1.4% YoY organic growth
42M€ or 3.4% of sales(*)
Sales(*)
Operating Margin
YoY organic growth
(**) YoY organic growth (*) At constant metal prices
Operating margin evolution 44 M€
42M€
2012 2013
North America
(Oil&Gas, Mining)
Europe contrasted
APAC (Korea shipbuilding and offshore)
18% of sales(*) 55% of sales(*)
Others -8%(**)
Automation: stabilization of sales. Reorganization in process Other applications: under reorganization process mostly in Europe
27% of sales(*)

Emerging
Mature
11 2013 Full Year results
Utilities and Operators: sales decrease by 3% on the back of reduced investments from European utilities
North America -7% Volatile environment impacting margins
South America +9% H2 in Brazil reversed the H1 negative trend Dynamic in Peru and Chile
MERA -10% Decrease driven by Egypt: divestiture under way Russia catching up from a poor H1
Asia-Pacific +7% Difficult momentum in Australia offset by Korea and China (Yanggu)
Europe -10% Decrease driven by France, Greece, Spain and the Nordics
-1.3%
Utilities: -4% YoY organic
Emerging (+5%) Dynamic trend driven by China, Korea, Peru and Lebanon More project oriented contracts
Mature (-9%) Sharp decrease in Q3 in Europe (France, Greece and the Nordics) Blanket agreement type of contract
Sales quarterly evolution, in M€ at constant metal prices
246 294
264 258
Utilities Europe & MERA
South America & APAC
Copper
Fiber Operators Copper
contribution divided by 2
2012 2013
Operating margin
evolution
Operators: +5% YoY organic
Driven by fiber
Q1’13 Q2’13 Q3’13 Q4’13

12 2013 Full Year results
Transmission: contrasted picture between businesses
SUBMARINE AND SUBSEA Organic increase in sales of 13%
>500M€ sales at constant metal prices in 2013 Significant contract signed in January for subsea power link in
Canada worth 175M€ and in Norway, worth 78M€
Margins improving at fast pace, legacy projects marginal in 2014 Good dynamic in umbilicals supported by the various frame
agreements in place
Total backlog: 2 years of sales
LAND Organic decrease in sales of 18%
Europe: no improvement in volumes vs 2012. Project of rationalization of the footprint under process Middle-East: fierce competition in a deteriorated pricing environment. Very selective approach China: slow ramp up in Yanggu (facility upgrade, accreditation, tendering activity) US: commissioning expected Q3’14
Middle East
Europe
APAC
2012
2013
37% 8% 55%
66% 20% 14%
Sales+13%
H1'12 H2'12 H1'13 H2'13

XXXXXXXX FINANCIAL RESULTS
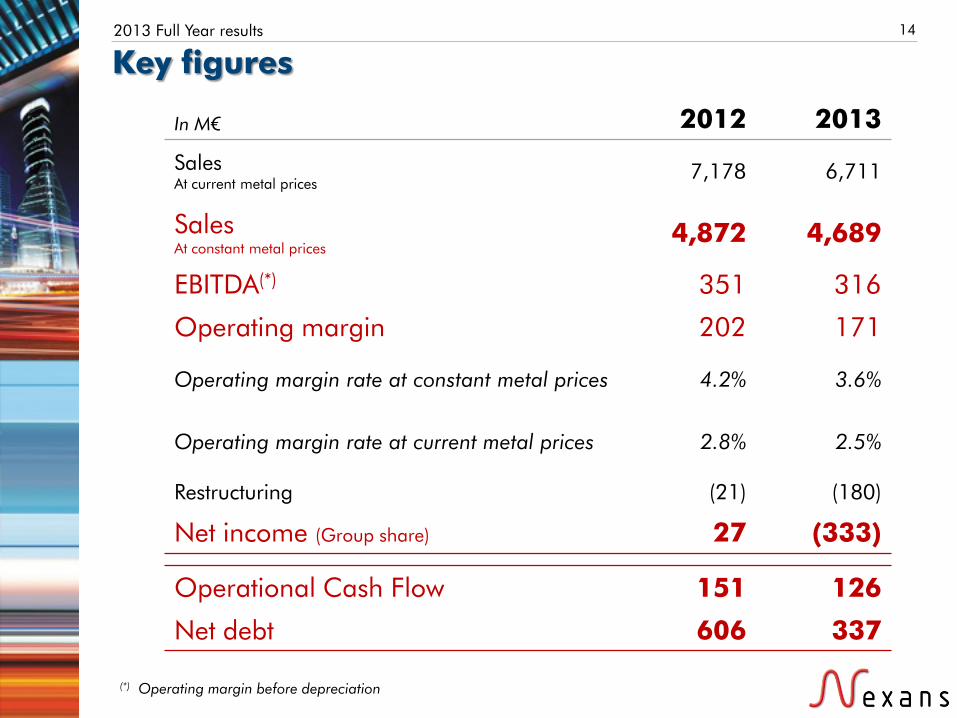
14 2013 Full Year results
In M€ 2012 2013
Sales At current metal prices
7,178 6,711
Sales At constant metal prices
4,872 4,689
EBITDA(*) 351 316
Operating margin 202 171
Operating margin rate at constant metal prices 4.2% 3.6%
Operating margin rate at current metal prices 2.8% 2.5%
Restructuring (21) (180)
Net income (Group share) 27 (333)
Operational Cash Flow 151 126
Net debt 606 337
Key figures
(*) Operating margin before depreciation
15 2013 Full Year results
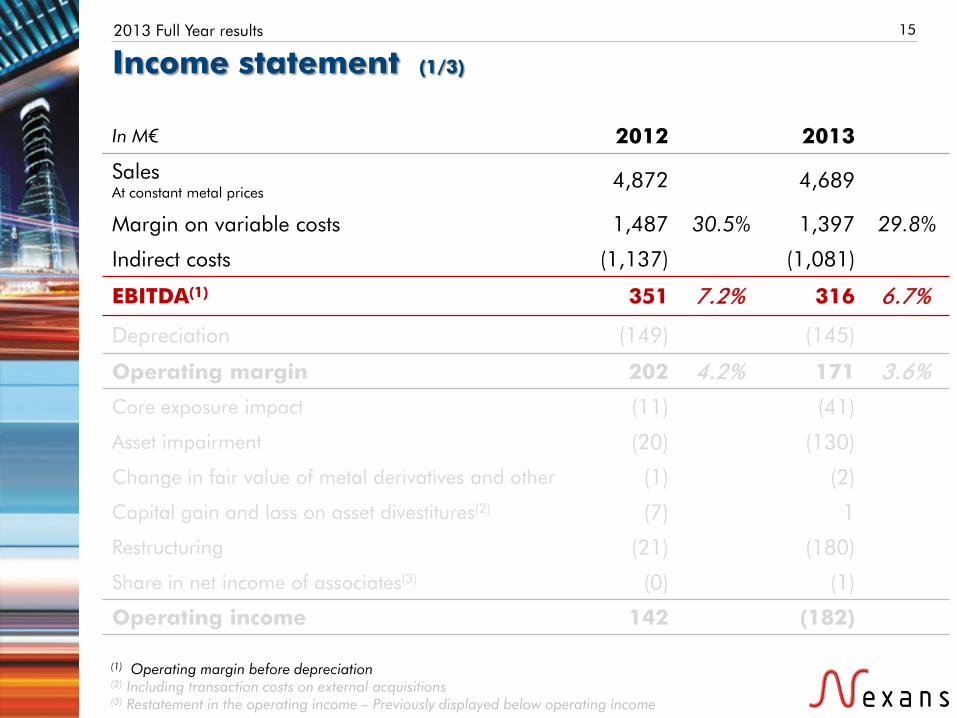
In M€ 2012 2013
Sales At constant metal prices
4,872 4,689
Margin on variable costs 1,487 30.5% 1,397 29.8%
Indirect costs (1,137) (1,081)
EBITDA(1) 351 7.2% 316 6.7%
Depreciation (149) (145)
Operating margin 202 4.2% 171 3.6%
Core exposure impact (11) (41)
Asset impairment (20) (130)
Change in fair value of metal derivatives and other (1) (2)
Capital gain and loss on asset divestitures(2) (7) 1
Restructuring (21) (180)
Share in net income of associates(3) (0) (1)
Operating income 142 (182)
Income statement (1/3)
(1) Operating margin before depreciation (2) Including transaction costs on external acquisitions (3) Restatement in the operating income – Previously displayed below operating income

351
316
30
(9)
(9)
(23)
(34)
19 (9)
16 2013 Full Year results
EBITDA evolution In M€
2012 2013
Pension one-off impact
FX & scope
Volume
Price & Mix
Operating Costs
Australia
Transmission
Main impacts in Europe and North America

17 2013 Full Year results
In M€ 2012 2013
Sales At constant metal prices
4,872 4,689
Margin on variable costs 1,487 30.5% 1,397 29.8%
Indirect costs (1,137) (1,081)
EBITDA(1) 351 7.2% 316 6.7%
Depreciation (149) (145)
Operating margin 202 4.2% 171 3.6%
Core exposure impact (11) (41)
Asset impairment (20) (130)
Change in fair value of metal derivatives and other (1) (2)
Capital gain and loss on asset divestitures(2) (7) 1
Restructuring (21) (180)
Share in net income of associates(3) (0) (1)
Operating income 142 (182)
Income statement (2/3)
(1) Operating margin before depreciation (2) Including transaction costs on external acquisitions (3) Restatement in the operating income – Previously displayed below operating income
18 2013 Full Year results
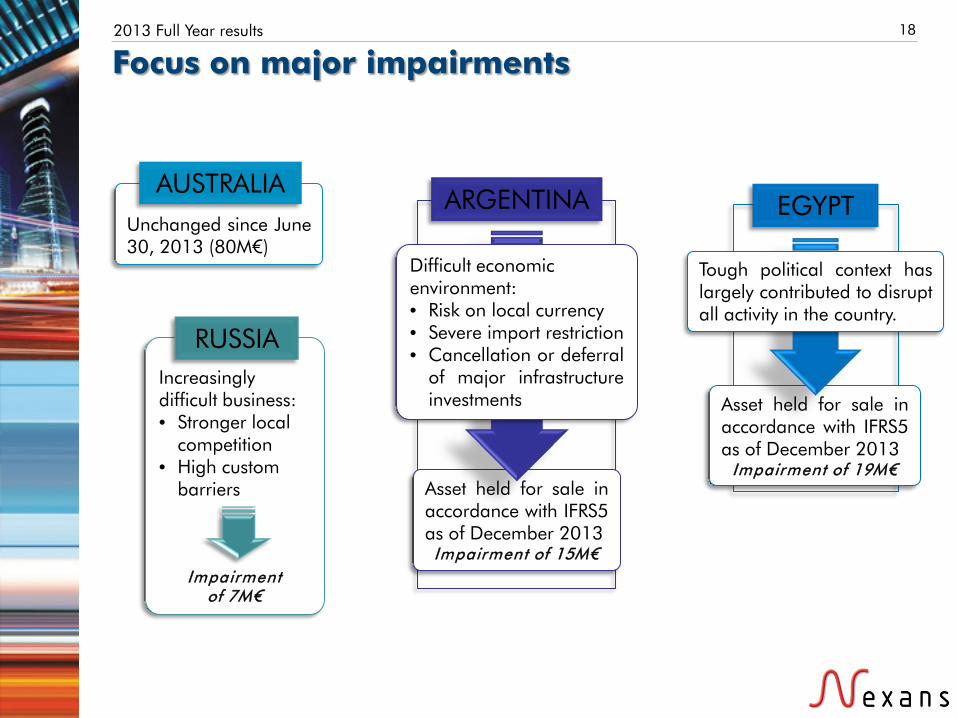
Focus on major impairments
Unchanged since June 30, 2013 (80M€)
AUSTRALIA
Asset held for sale in accordance with IFRS5 as of December 2013 Impairment of 15M€
Difficult economic environment: • Risk on local currency • Severe import restriction • Cancellation or deferral
of major infrastructure investments
ARGENTINA
Asset held for sale in accordance with IFRS5 as of December 2013
Impairment of 19M€
EGYPT
Tough political context has largely contributed to disrupt all activity in the country.
Increasingly difficult business: • Stronger local
competition • High custom
barriers
Impairment of 7M€
RUSSIA

19 2013 Full Year results
In M€ 2012 2013
Operating income 142 (182)
Financial charge (112) (109)
Income before tax 30 (291)
Income tax (5) (39)
Net income from operations 25 (330)
Net income Group share 27 (333)
Income statement (3/3)

20 2013 Full Year results
Balance Sheet
In M€ 31 Dec. 2012 31 Dec. 2013
Long-term fixed assets 2,069 1,844 of which goodwill 509 414
Deferred tax assets 141 120
Non-current assets 2,210 1,964
Working Capital 1,124 879
Total to finance 3,335 2,843
Net financial debt 606 337 Reserves 772 824
Deferred tax liabilities 114 82
Shareholders' equity and Minority interests
1,843 1,600
Total financing 3,335 2,843
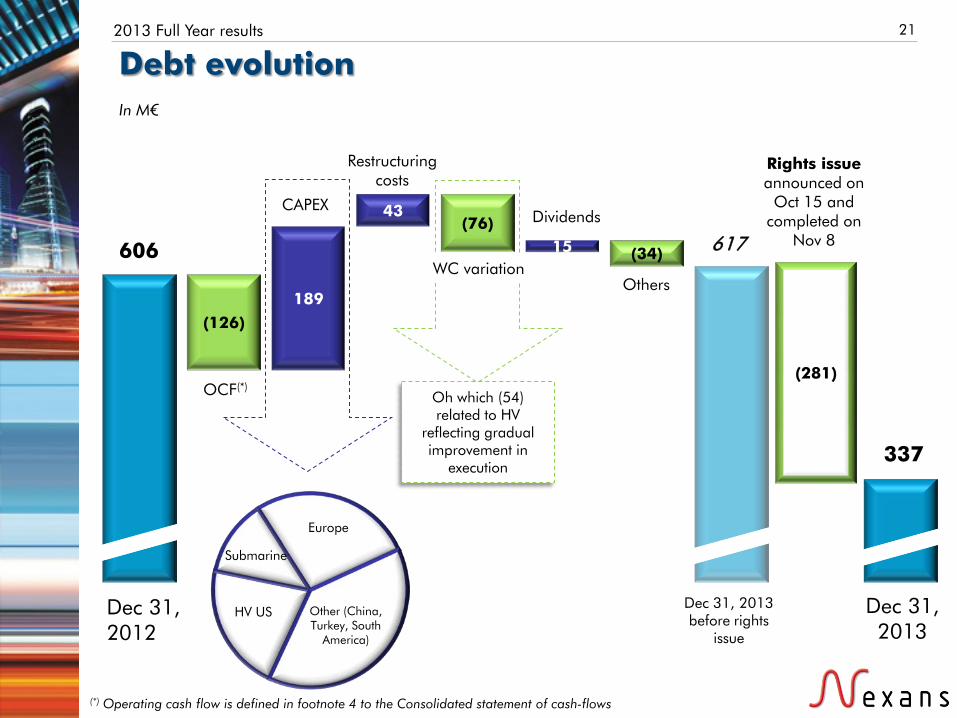
617
(126) 189
43 (76)
15 (34)
(281) Oh which (54) related to HV
reflecting gradual improvement in
execution
21 2013 Full Year results
Debt evolution In M€
(*) Operating cash flow is defined in footnote 4 to the Consolidated statement of cash-flows
Dec 31, 2012
Dec 31, 2013 before rights
issue
Dec 31, 2013
606
337
OCF(*)
CAPEX
Restructuring costs
Dividends
Others
Rights issue announced on
Oct 15 and completed on
Nov 8
HV US
Submarine
Europe
Other (China, Turkey, South
America)
WC variation
22 2013 Full Year results
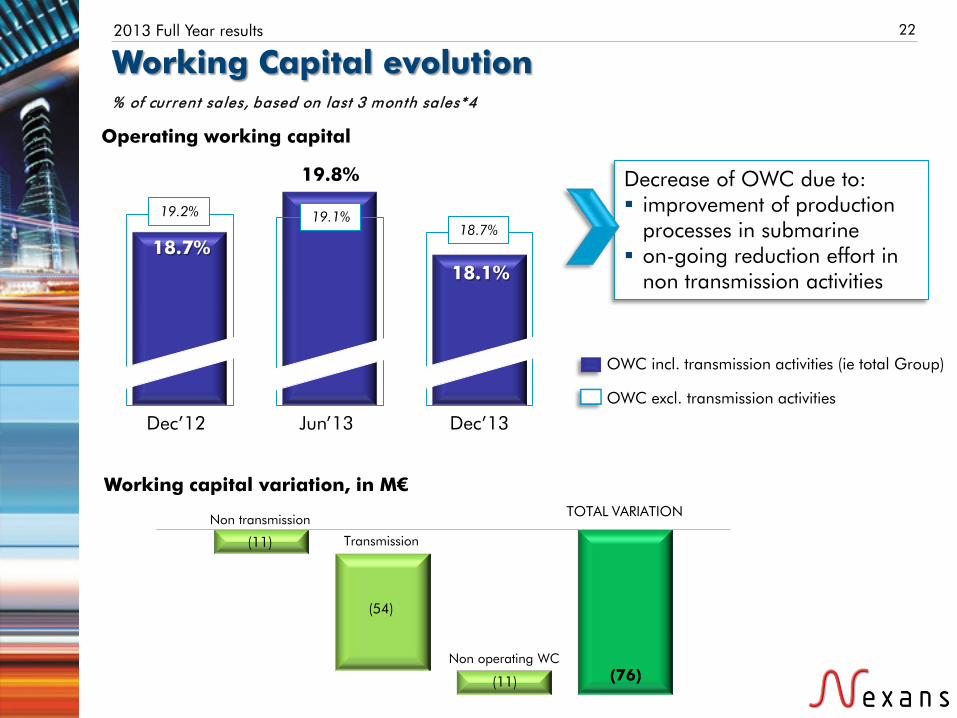
Working Capital evolution
% of current sales, based on last 3 month sales*4
18.7% 18.1%
19.2% 18.7%
19.8%
19.1%
Dec’12 Dec’13 Jun’13
Decrease of OWC due to: improvement of production
processes in submarine on-going reduction effort in
non transmission activities
OWC excl. transmission activities
OWC incl. transmission activities (ie total Group)
Working capital variation, in M€
Non transmission
Transmission
Non operating WC
TOTAL VARIATION
(11)
(54)
(11) (76)
Operating working capital

XXXXXXXX MID-TERM PERSPECTIVES

-2.6%
1,2%
EUROPE
1.6%
4,7%
NAM
5.1%
6,3%
SAM
4.6%
6,5%
MERA
3.7%
6,0%
APAC
2,6%
5,1%
% YoY change based on tons conductors
Actual 2013
2013 as forecasted in 2012
24 2013 Full Year results
Major changes in the market in 2013… 2013 growth has been down compared to 2012 expectations
118
124
131
138
121
126
132
137
2012 2013 2014 2015 2016
Market size in Bn€ Excl. winding wires
Market evolution has taken 1 year delay compared to 2012 expectations
Source: Nexans analysis and CRU – based on 2012 metal price, FX rate and pricing
Source: CRU
Worldwide growth in 2013
Market as forecasted in 2012
Market as forecasted in 2013
4.4% CAGR
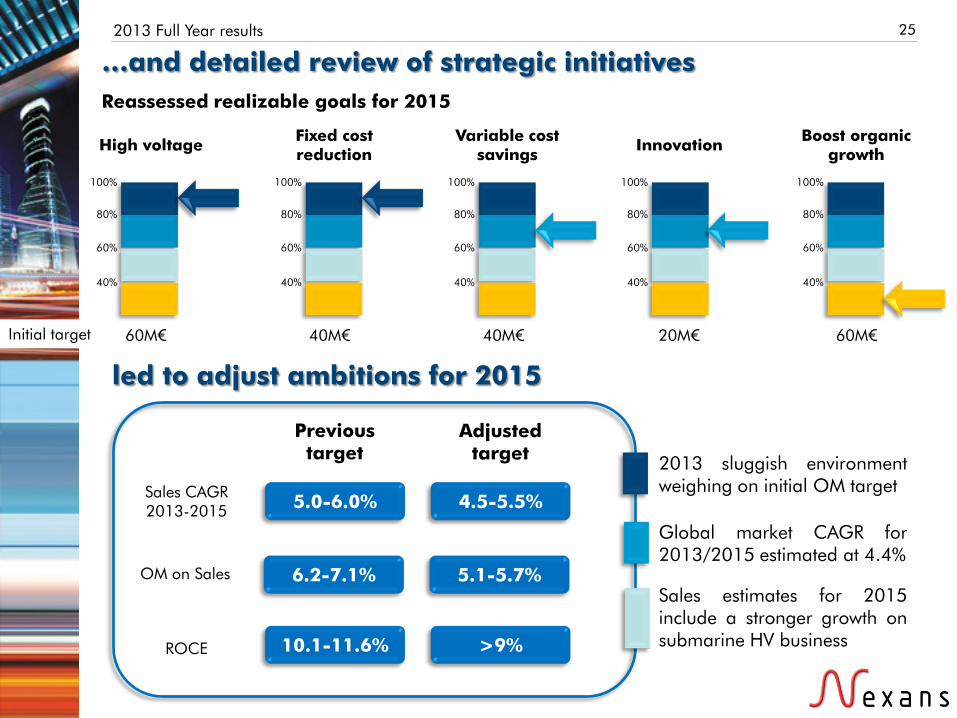
25 2013 Full Year results
led to adjust ambitions for 2015
Sales CAGR 2013-2015
OM on Sales
ROCE
Adjusted target
5.1-5.7%
>9%
4.5-5.5%
Previous target
6.2-7.1%
10.1-11.6%
5.0-6.0%
2013 sluggish environment weighing on initial OM target
Global market CAGR for 2013/2015 estimated at 4.4%
Sales estimates for 2015 include a stronger growth on submarine HV business
High voltage
100%
80%
60%
40%
Variable cost savings
100%
80%
60%
40%
Fixed cost reduction
100%
80%
60%
40%
Innovation
100%
80%
60%
40%
Boost organic growth
100%
80%
60%
40%
60M€ 40M€ 40M€ 20M€ 60M€ Initial target
…and detailed review of strategic initiatives
Reassessed realizable goals for 2015

Major contracts awarded in submarine: Cabot Strait (175M€), BKK (78M€)
TRANSMISSION
World’s longest superconductor power cable deployed (Germany)
Significant call-offs within umbilicals frame agreements
26 2013 Full Year results
Positive signals for 2014 Despite a decrease in sales in 2013, the commercial activity has been very dynamic and has led to successes in all businesses.
: new low voltage cable
featuring two major enhancements: length marking and color marking. Awarded and accredited as a Standard on the French building market
D&I
France: MV & accessories frame contract renewed with a major European DSO (2 years, ~40M€) Germany: Thüga frame contract (3 years) GCC (2 years, 120MUSD)
UTILITIES Aerospace Airbus : won “best improver award”. New 5 year agreement (~205M€) Oil & Gas
3 contracts signed in Brazil for 5 drilling and 1 FPSO platforms (total amount: 42MUSD, delivery 2014-2015)
INDUSTRY

27 2013 Full Year results
Perspectives in transmission: a strong potential for the next years
Indonesia Java-Sumatra
Submarine: significant projects in tender phase in both grid and offshore wind farms Market size: 3.0Bn€/year
Norlink Norway-UK
UK SSE, SPEN Germany Partial undergrounding program US
Chino Hills, California RARP, Rochester Sealink, Boston
Dardanelli strait 2
Beatrice windfarm Canada Onshore windfarms
submarine
terrestrial
China HongYang Korea
Jeju Daejung windfarm
UK offshore wind round 3
Land: Stronger tendering activity in Europe and North America in the coming years Market size: 1.6Bn€/year
France-Italy
Belgium Stevin
EUROPE: largest ground of projects
Netherlands, Randstad
Australia Ausgrid
Saudi Arabia SEC

28 2013 Full Year results
Implementation of a Transformation Program Office to follow up on strategic plan progression
Change management
Stimulate, embark and align
Communicate and deploy success stories
Transformation
Project management practices
Standard project management methodology
Training
In-house consultancy
Benchmark and best practices
Office
Project portfolio setup and delivery
Support project definition
Transparency and quick issue
solving
Program
Prioritize
Risks & mitigation
Track regularly
This organization enables a real time control of the progress of each initiative
Project committee Coordinate actions, follow progress
Project steering committee Track main objectives &
milestones, take key decisions, align resources, treat risks
Management Board Decide on requested points and
risks & adjust perimeter if necessary
Operational organization
Weekly alerts
7 days decision
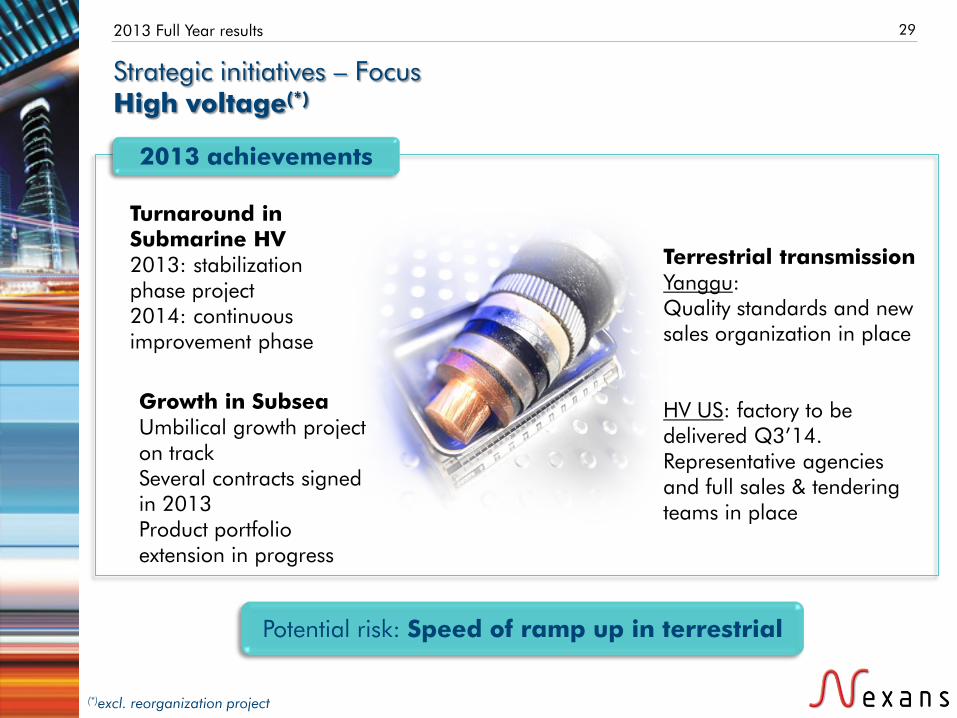
Potential risk: Speed of ramp up in terrestrial
29 2013 Full Year results
Strategic initiatives – Focus High voltage(*)
2013 achievements
Turnaround in Submarine HV 2013: stabilization phase project 2014: continuous improvement phase
Growth in Subsea Umbilical growth project on track Several contracts signed in 2013 Product portfolio extension in progress
Terrestrial transmission Yanggu: Quality standards and new sales organization in place HV US: factory to be delivered Q3’14. Representative agencies and full sales & tendering teams in place
(*)excl. reorganization project

30 2013 Full Year results
Strategic initiatives – Focus Fixed cost reduction
Potential risks
factored
Initial project implemented
Step-up plan involving further capacity reduction and supply sources
APAC
Social planning in Europe
Order book attrition in Europe
Ramp-up of China to support Australia
Consultations started October 15, 2013
NEWCO opinion obtained December 5, 2013
Swiss and Belgium procedures achieved at year end 2013
Expected achievement of German, Italian and French procedures before end of Q1’14
EUROPE
2015 2017
40M€ 70M€
Land HV
Industry
Support functions
Initial savings target
2013 achievement related to negotiations
2013 restructuring costs:180M€
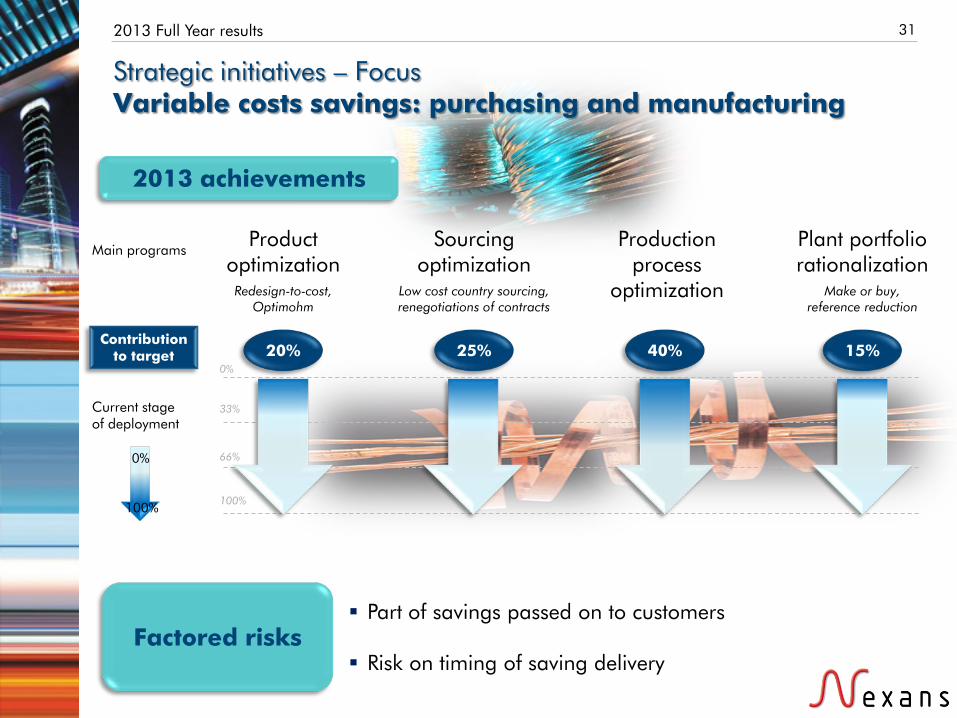
31 2013 Full Year results
Strategic initiatives – Focus Variable costs savings: purchasing and manufacturing
Part of savings passed on to customers Risk on timing of saving delivery
2013 achievements
Product optimization
Sourcing optimization
Plant portfolio rationalization
Production process
optimization
Current stage of deployment
0%
100%
20% Contribution
to target 25% 15% 40%
Main programs
Factored risks
Redesign-to-cost, Optimohm
Low cost country sourcing, renegotiations of contracts
Make or buy, reference reduction
0%
33%
66%
100%

32 2013 Full Year results
Update
Strategic initiatives – Focus Boost organic growth in attractive markets
Actual CAGR below previous expectations
Risk due to market environment in Europe, China, Brazil
Australia shifted from organic growth to turnaround initiative
2013 achievements
China Industry Development of new industrial segments (handling, metro, wind) Restart of rolling stock program
LV/MV in developing countries SAM: capacity increase sales up 12% with margin improvement MERA: capacity increase in Lebanon China: ramp up in Yanggu LV/MV effective but tight competition
Europe Industry Growth on 7 strategic segments on-going
Oil & Gas (Upstream) & Mining Global organization in place led from NAM
Upstream O&G: first successes in Brazil and Korea Mining: first successes in MERA
Downstream O&G On-going facility upgrade in Turkey to create a business hub for Middle East & Caspian sea
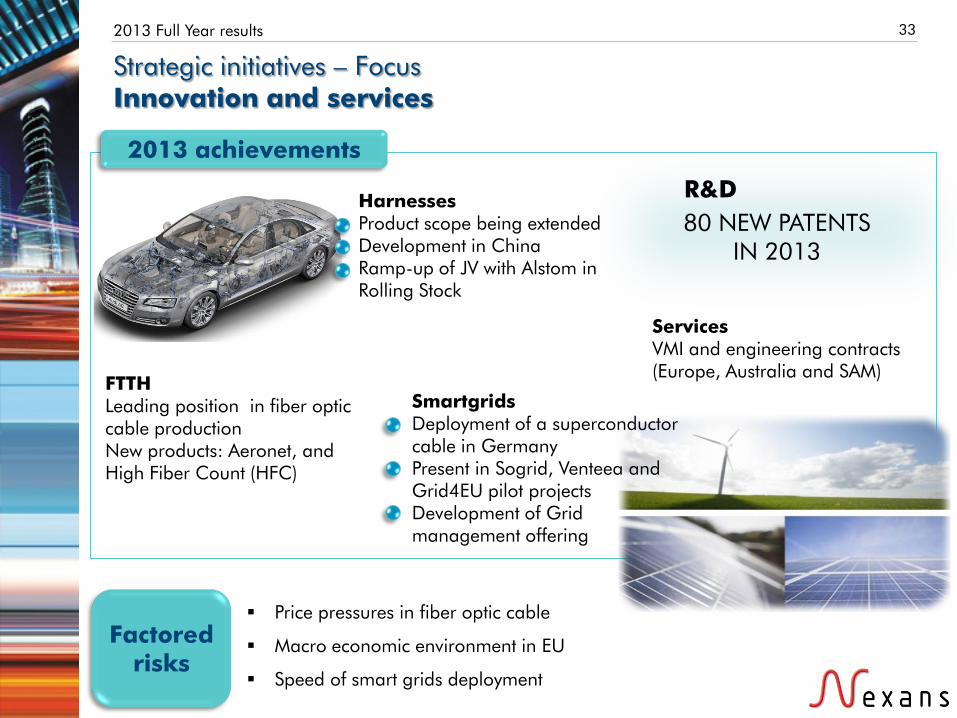
33 2013 Full Year results
Price pressures in fiber optic cable
Macro economic environment in EU
Speed of smart grids deployment
Factored risks
2013 achievements
Strategic initiatives – Focus Innovation and services
Services VMI and engineering contracts (Europe, Australia and SAM)
R&D 80 NEW PATENTS
IN 2013
Harnesses Product scope being extended Development in China Ramp-up of JV with Alstom in Rolling Stock
Smartgrids Deployment of a superconductor cable in Germany Present in Sogrid, Venteea and Grid4EU pilot projects Development of Grid management offering
FTTH Leading position in fiber optic cable production New products: Aeronet, and High Fiber Count (HFC)
34 2013 Full Year results
GUIDANCE FOR 2014
Debt level impacted by the deployment of initiatives
Operating margin above 2013 level
Continuing progression of strategic initiatives

XXXXXXXX APPENDICES

36 2013 Full Year results
Sales and profitability by segment
2012 2013
In M€ Sales OM OM % Sales OM OM %
Transmission, Distribution & Operators
2,088 70 3.4% 2,034 70 3.5%
Industry 1,195 44 3.7% 1,222 42 3.4%
Distributors and Installers 1,285 78 6.1% 1,155 37 3.2%
Others 304 10 3.3% 278 22 7.9%
Total Group 4,872 202 4.2% 4,689 171 3.6%

37 2013 Full Year results
Impact of foreign exchange and consolidation scope
In M€ 2012 FX Organic
growth Scope 2013
Transmission, Distributors & Operators
2,088 (73) (27) 46 2,034
Industry 1,195 (14) 17 24 1,222
Distributors & Installers 1,285 (48) (78) (4) 1,155
Others 304 (14) (8) (4) 278
Total Group 4,872 (150) (96) 63 4,689