2013 First Quarter Results 8 May 2013 - YOOXcdn3.yoox.biz › ... › doc › 2014 ›...
23
2013 First Quarter Results 8 May 2013
Transcript of 2013 First Quarter Results 8 May 2013 - YOOXcdn3.yoox.biz › ... › doc › 2014 ›...
2013 First Quarter Results
8 May 2013

The information contained in this document is confidential and proprietary to YOOX Group SLIDE 2
DISCLAIMER
This presentation has been prepared by YOOX S.p.A. for information purposes only and for use in presentations of the Group’s results and strategies. For further details on the YOOX Group, reference should be made to publicly available information. Statements contained in this presentation, particularly regarding any possible or assumed future performance of the Group, are or may be forward-looking statements based on YOOX S.p.A.’s current expectations and projections about future events, and in this respect may involve some risks and uncertainties. Actual future results for any quarter or annual period may therefore differ materially from those expressed in or implied by these statements due to a number of different factors, many of which are beyond the ability of YOOX S.p.A. to control or estimate precisely, including, but not limited to, the Group’s ability to manage the effects of the uncertain current global economic conditions on our business and to predict future economic conditions, the Group’s ability to achieve and manage growth, the degree to which YOOX S.p.A. enters into, maintains and develops commercial and partnership agreements, the Group’s ability to successfully identify, develop and retain key employees, manage and maintain key customer relationships and maintain key supply sources, unfavourable development affecting consumer spending, the rate of growth of the Internet and online commerce, competition, fluctuations in exchange rates, any failure of information technology, inventory and other asset risk, credit risk on our accounts, regulatory developments and changes in tax laws. YOOX S.p.A. does not undertake any obligation to publicly release any revisions to any forward-looking statements to reflect events or circumstances after the date of this presentation. Any reference to past performance of the YOOX Group shall not be taken as an indication of future performance. This document does not constitute an offer or invitation to purchase or subscribe to any shares and no part of it shall form the basis of or be relied upon in connection with any contract or commitment whatsoever. By attending the presentation you agree to be bound by the foregoing terms.

The information contained in this document is confidential and proprietary to YOOX Group SLIDE 3
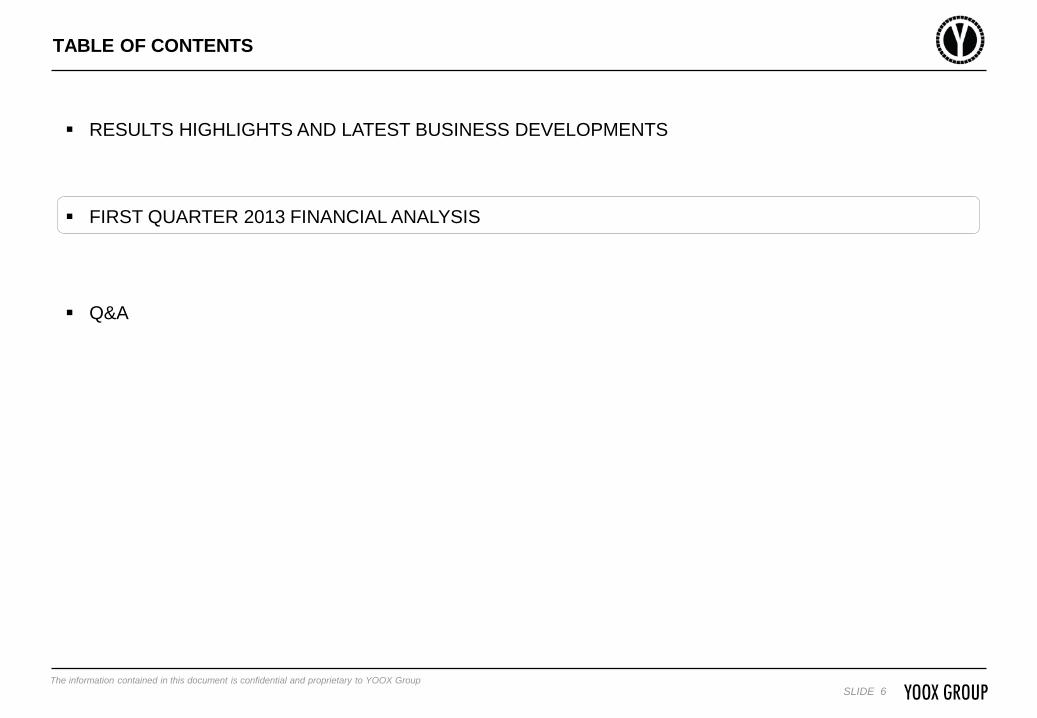
TABLE OF CONTENTS
RESULTS HIGHLIGHTS AND LATEST BUSINESS DEVELOPMENTS FIRST QUARTER 2013 FINANCIAL ANALYSIS
Q&A

The information contained in this document is confidential and proprietary to YOOX Group SLIDE 4
FIRST QUARTER ENDED 31 MARCH 2013 - RESULTS HIGHLIGHTS
Group’s Net Revenues at €110.4m, up 21% (+24% at constant exchange rates) compared with €91.0m in 1Q 2012, showing more
balanced growth between geographical markets and business lines
− Italy consolidated positive trends recorded in 4Q 2012 (+11%)
− Good performance from international markets (85%1 of total Net Revenues) including Japan, despite significant yen depreciation
− Excellent results from Multi-brand business line (+24%), driven by sustained growth of the NEW yoox.com
− Healthy performance from Mono-brand business line, despite the discontinuation of a few online stores and a schedule of new
openings and releases mainly concentrated in the period from late May 2013 onwards
Strong operating leverage on fulfillment costs more than offset negative impact of weak yen and unfavourable mix of Fall / Winter and
Spring / Summer sales on yoox.com driven by the exceptionally cold weather
− EBITDA Excluding Incentive Plan Costs at €8.0m (vs. €6.4m in 1Q 2012), with margin at 7.3%, up 30bps
− Net Income Excluding Incentive Plan Costs ahead of previous year at €2.6m (vs. €2.0m in 1Q 2012)
Positive Net Financial Position at €13.0m (vs. €14.6m at December 2012), supported by strong growth of Cash flow from Operations
1.Excludes “Not Country Related” revenues

The information contained in this document is confidential and proprietary to YOOX Group SLIDE 5
LATEST BUSINESS DEVELOPMENTS
Multi-brand business line
yoox.com - solid performance worldwide and outstanding results in China, underpinned by the new release
thecorner.com and shoescribe.com - enhancement of brand assortment continued
Technology and Logistics Platform
Significant technology platform upgrades - released faster check-out process on thecorner.com and introduced new attributes that customers
can shop by on yoox.com (e.g., material, heel height, print, etc.)
Works to expand capacity at the highly-automated global operations & distribution platform in Bologna successfully completed in late Feb. 2013
Mono-brand business line
Joint Venture with Kering1 - operations on-going and on track to bring all 6 digital stores online by early Summer 2013
Contract signed with Giorgio Armani S.p.A. for the creative concept ideation and development for the new armani.com release, which will launch
in 3Q 2013
missoni.com launched in Europe, the US and Japan in late March 2013. Creative concept ideated and developed by YOOX Group
dodo.it launched in Europe and the US today
Longstanding partnership with OTB S.p.A. further strengthened, in line with YOOX’s dynamic profit-driven portfolio management and ever
increasing focus on the high-end fashion and luxury segment:
- 5-year global partnership with Maison Martin Margiela extended for a further 2 years, under the same economic terms, thus becoming a 7-
year contract until 31 December 2017, well beyond the already lengthy current expiry dates of the global partnerships with Marni and Just
Cavalli (31 August 2016 and 28 February 2017, respectively)
- diesel.com - recently renewed for a further 6 years - will be potentially extended to China based on a feasibility study; will be discontinued in
the US at the end of 2013 (~2% of YOOX Group’s 2012 Net Revenues with AOV 43% below the US Mono-brand average) and the two
Groups will focus on operations in Europe and Japan under the terms of the existing agreement
1.PPR will become Kering, subject to approval at the Annual General Meeting on 18 June 2013
The information contained in this document is confidential and proprietary to YOOX Group SLIDE 6
TABLE OF CONTENTS
RESULTS HIGHLIGHTS AND LATEST BUSINESS DEVELOPMENTS FIRST QUARTER 2013 FINANCIAL ANALYSIS
Q&A

The information contained in this document is confidential and proprietary to YOOX Group SLIDE 7
5.8 6.4
7.6 7.1
KEY PERFORMANCE INDICATORS1
Monthly Unique Visitors (m)2 # Orders (‘000) - Group
Active Customers3 (‘000) - Group4
1.Key performance indicators do not include the Joint Venture with Kering 2.Source: SiteCatalyst for yoox.com; Google Analytics for thecorner.com, shoescribe.com and the mono-brand online stores “Powered by YOOX Group” 3.Active Customer is defined as a customer who placed at least one order in the 12 preceding months 4.Include Active Customers of the mono-brand online stores “Powered by YOOX Group”
13.4 13.5
1Q 2012 1Q 2013 1Q 2012 1Q 2013
1Q 2012 1Q 2013 1Q 2013 1Q 2012
848
977
Average Order Value (€) - Group
199
211
586
680
Multi-brand Mono-brand
Performance of mono-brand MUV reflects contribution from 29 online stores in 1Q 13 vs. 32 in 1Q 12 due to exclusion of the JV with Kering from this KPI and discontinuation of 5 online stores

The information contained in this document is confidential and proprietary to YOOX Group SLIDE 8
NET REVENUE BREAKDOWN BY BUSINESS LINE AND GEOGRAPHY
Note: Figures as absolute values and in percentages are calculated using precise financial data. Some of the differences found in this presentation are due to rounding of the values expressed in millions of Euro 1.Not Country Related
Net Revenues by Business Line Net Revenues by Geography
Y-o-Y Growth
Rest of Europe Italy
North America Japan
RoW + NCR 1 71.6%
28.4%
70.2%
29.8%
1Q 2012 1Q 2013
21.4%
23.8%
15.7% €91.0m
€110.4m
Multi-brand Mono-brand
1Q 2012 1Q 2013
15.1%
48.9%
20.8%
8.8% 6.4%
16.5%
48.7%
21.6%
8.7% 4.5%

The information contained in this document is confidential and proprietary to YOOX Group SLIDE 9
YOOX GROUP PROFIT & LOSS YOOX GROUP PROFIT & LOSS
1Q 2012 1Q 2013
Note: Depreciation & Amortisation included in Fulfillment, Sales & Marketing, General & Administrative have been reclassified and grouped under Depreciation & Amortisation EBITDA Excluding Incentive Plan Costs calculated by adding back to EBITDA the costs associated with incentive plans in each period Net Income Excluding Incentive Plan Costs calculated by adding back to Net Income the costs associated with incentive plans in each period, net of their related fiscal effect
(€m)
Net Revenues 91.0 110.4growth 30.5% 21.4%
COGS (60.1) (73.1)Gross Profit 30.9 37.3
% of Net Revenues 33.9% 33.7%Fulfillment (8.7) (10.0)
% of Net Revenues 9.6% 9.0%Sales & Marketing (9.8) (11.7)
% of Net Revenues 10.7% 10.6%EBITDA Pre Corporate Costs 12.3 15.6
% of Net Revenues 13.6% 14.1%General & Administrative (6.6) (9.1)
% of Net Revenues 7.3% 8.2%Other Income / (Expenses) (0.4) (0.5)
EBITDA 5.3 6.0% of Net Revenues 5.9% 5.5%EBITDA Excluding Incentive Plan Costs 6.4 8.0
% of Net Revenues 7.0% 7.3%Depreciation & Amortisation (2.6) (4.2)
% of Net Revenues 2.8% 3.8%Operating Profit 2.8 1.9
% of Net Revenues 3.1% 1.7%Income / (Loss) From Investment In Associates - (0.3)Net Financial Income / (Expenses) (0.7) 0.1
Profit Before Tax 2.0 1.7% of Net Revenues 2.2% 1.5%
Taxes (0.8) (0.6)Net Income 1.2 1.1
% of Net Revenues 1.4% 1.0%Net Income Excluding Incentive Plan Costs 2.0 2.6
% of Net Revenues 2.2% 2.3%

The information contained in this document is confidential and proprietary to YOOX Group SLIDE 10
EBITDA ANALYSIS BY BUSINESS LINE
Note: Multi-brand and Mono-brand EBITDA Pre Corporate Costs include all costs directly associated with the business line, including COGS, Fulfillment, Sales & Marketing (all net of D&A); Corporate Costs include General & Administrative costs (net of D&A) and Other Income / (Expenses) 1.Include the Joint Venture with Kering
EBITDA Evolution
1Q 2013
% of Net Revenues 5.9% 5.5%
Multi-brand EBITDA Pre Corporate Costs Corporate Costs Mono-brand EBITDA
Pre Corporate Costs
€8.0m €9.6m
€(7.0)m €(9.6)m
# online stores open 1
32 32
% of Multi-brand Net Revenues
12.2% 12.5% % of Mono-brand Net Revenues
% of Group Net Revenues
16.1% 19.0% 8.7% 7.7%
1Q 2012 1Q 2013 1Q 2012 1Q 2013 1Q 2012 1Q 2013
€5.3m
€6.0m
1Q 2012
€4.4m €6.0m

The information contained in this document is confidential and proprietary to YOOX Group SLIDE 11
€8.0m
€(2.0)m €6.0m
€(4.2)m €1.9m
€(0.3)m
€0.1m
€(0.6)m €1.1m
EBITDA Excl.Incentive Plan
Costs
Incentive PlanCosts
EBITDA D&A EBIT Income / (Loss)From Associates
Net FinancialIncome /
(Expenses)
Taxes Net Income
FROM EBITDA TO NET INCOME
€6.4m
€(1.0)m €5.3m
€(2.6)m €2.8m
€(0.7)m €(0.8)m
€1.2m
EBITDA Excl.Incentive Plan Costs
Incentive Plan Costs EBITDA D&A EBIT Net FinancialIncome / (Expenses)
Taxes Net Income
1Q 2012
% of Net Revenues
% of Net Revenues 7.0% 5.9% 3.1% 1.4%
7.3% 5.5% 1.7% 1.0%
1Q 2013

The information contained in this document is confidential and proprietary to YOOX Group SLIDE 12
YOOX GROUP SUMMARY BALANCE SHEET
FY 2012 1Q 2012 1Q 2013
(€m)
Net Working Capital 34.8 32.1 30.8
Non Current Assets 41.6 55.5 61.2
Non Current Liabilities (excl. financial liabilities) (0.2) (0.3) (0.3)
Total 76.2 87.2 91.7
Net Financial Debt / (Net Cash) (10.6) (14.6) (13.0)
Shareholders' Equity 86.8 101.8 104.7
Total 76.2 87.2 91.7

The information contained in this document is confidential and proprietary to YOOX Group SLIDE 13
(€m)
Inventories 109.4 138.2 136.2
Trade Receivables 12.3 13.1 14.4
Trade Payables (74.4) (96.8) (98.8)
Other Receivables / (Payables) (12.5) (22.5) (21.1)
Net Working Capital 34.8 32.1 30.8
as % of Net Revenues 11.1% 8.5% 7.8%
NET WORKING CAPITAL EVOLUTION
Net Working Capital
1
Inventory Level Evolution
48.9% 52.8%
49.2%
35.0% 36.8% 34.5%
1Q 2012 FY 2012 1Q 2013
Inventories as % of Multi-brand Net Revenues Inventories as % of Group Net Revenues
1
1 1
1.Percentages calculated on LTM Net Revenues
FY 2012 1Q 2012 1Q 2013
Strong decrease in Net Working Capital to Net Revenue ratio
Slight decrease in Inventories mainly related to very high sell-through of the Fall/Winter collection

The information contained in this document is confidential and proprietary to YOOX Group SLIDE 14
€(14.6)m
€1.1m €4.2m
€2.0m €0.4m €1.3m
€(10.0)m
€(0.4)m €(13.0)m
FY2012Net Cash Net Income D&A Incentive Plan Costs
Proceeds fromStock Option
Exercise
Change in NetWorking Capital Investments Other
1Q2013Net Cash
YOOX GROUP CASH FLOW STATEMENT AND NET FINANCIAL POSITION
Cash Flow Statement Capital Expenditure
1Q12 1Q13
Strong Cash Flow generation from Operations
% of Net Revenues 8.3% 8.6%
Net Financial Position Evolution
1.As per IFRS, line of credit of €2.7m in 1Q12 and repayment of €1.0m in 1Q13 was accounted for in Cash Flow from Investment Activities, being fully allocated to finance the new automated logistics platform 2.Please note that repayment of line of credit of €1.0m has been restated from Cash Flow from Investment Activities to Cash Flow from Financing Activities 3.Mainly refers to deferred tax assets, exchange rate impact resulting from the consolidation of foreign subsidiaries, fair value of derivative contracts
2 3
€7.5m
Tech
Operations
Other
€9.5m
1
Capex increase due to greater proportion of annual capex in 1Q13 vs. previous year attributable to completion of automation investments at our central global operations and distribution centre and set-up of nearby DC with necessary equipment
1Q12 1Q13 (€m)
Cash and Cash Equivalents at Beginning of Period 22.7 35.8
Cash Flow from Operations 2.5 8.8
Cash Flow from Investment Activities (4.5) (11.0)
Sub Total (2.0) (2.2)
Cash Flow from Financing Activities 2.5 (3.0)
Cash Flow 0.4 (5.2)
Cash and Cash Equivalents at End of Period 23.2 30.6

The information contained in this document is confidential and proprietary to YOOX Group SLIDE 15
TABLE OF CONTENTS
RESULTS HIGHLIGHTS AND LATEST BUSINESS DEVELOPMENTS FIRST QUARTER 2013 FINANCIAL ANALYSIS
Q&A

The information contained in this document is confidential and proprietary to YOOX Group SLIDE 16
APPENDIX
OUR GLOBAL STRATEGIC PARTNERSHIPS IN THE MONO-BRAND BUSINESS LINE NET REVENUE GROWTH BY GEOGRAPHY
YOOX GROUP PROFIT & LOSS EXCLUDING INCENTIVE PLAN COSTS FOCUS ON INCENTIVE PLAN COSTS
YOOX GROUP NET FINANCIAL POSITION SHAREHOLDER STRUCTURE

The information contained in this document is confidential and proprietary to YOOX Group SLIDE 17
OUR GLOBAL STRATEGIC PARTNERSHIPS IN THE MONO-BRAND BUSINESS LINE
Online stores “Powered by YOOX Group”
JVCo with Kering
alexanderwang.com
pomellato.com
pringlescotland.com
barbarabui.com
moncler.com
dolcegabbana.com
trussardi.com
missoni.com
armani.com
balenciaga.com
ysl.com
OPENING SOON
OPENING SOON
dodo.it
dsquared2.com
bally.com
moschino.com
emiliopucci.com
valentino.com
stoneisland.com
marni.com
emporioarmani.com
diesel.com
jilsander.com
bottegaveneta.com
sergiorossi.com
bikkembergs.com
brunellocucinelli.com
maisonmartinmargiela.com
albertaferretti.com
napapijri.com
giuseppezanottidesign.com
robertocavalli.com
y-3store.com
zegna.com
coccinelle.com
alexandermcqueen.com OPENING SOON
stellamccartney.com

The information contained in this document is confidential and proprietary to YOOX Group SLIDE 18
NET REVENUE GROWTH BY GEOGRAPHY
% of Total
% of Total 1Q 2012 1Q 2013 %
Change % Change
Constant FX
(€m)
Italy 14.984 16.5% 16.688 15.1% 11.4%
Europe (excluding Italy) 44.315 48.7% 53.975 48.9% 21.8%
North America 19.674 21.6% 22.941 20.8% 16.6% 17.5%
Japan 7.889 8.7% 9.703 8.8% 23.0% 44.2%
Other Countries 3.241 3.6% 5.306 4.8% 63.7%
Not country related 0.864 0.9% 1.791 1.6% 107.4%
Total Net Revenues 90.967 100.0% 110.404 100.0% 21.4% 23.5%

The information contained in this document is confidential and proprietary to YOOX Group SLIDE 19
YOOX GROUP PROFIT & LOSS EXCLUDING INCENTIVE PLAN COSTS
1Q 2012 1Q 2013 (€m)
Net Revenues 91.0 110.4growth 30.5% 21.4%
COGS (60.1) (73.1)Gross Profit 30.9 37.3
% of Net Revenues 33.9% 33.7%Fulfillment Excl. Incentive Plan Costs (8.7) (9.9)
% of Net Revenues 9.6% 8.9%Sales & Marketing Excl. Incentive Plan Costs (9.5) (11.5)
% of Net Revenues 10.4% 10.4%EBITDA Pre Corporate Costs 12.7 15.9
% of Net Revenues 14.0% 14.4%General & Administrative Excl. Incentive Plan Costs (6.0) (7.4)
% of Net Revenues 6.6% 6.7%Other Income / (Expenses) (0.4) (0.5)
% of Net Revenues 0.4% 0.4%EBITDA Excluding Incentive Plan Costs 6.4 8.0
% of Net Revenues 7.0% 7.3%
Net Income Excluding Incentive Plan Costs 2.0 2.6% of Net Revenues 2.2% 2.3%
The information contained in this document is confidential and proprietary to YOOX Group SLIDE 20
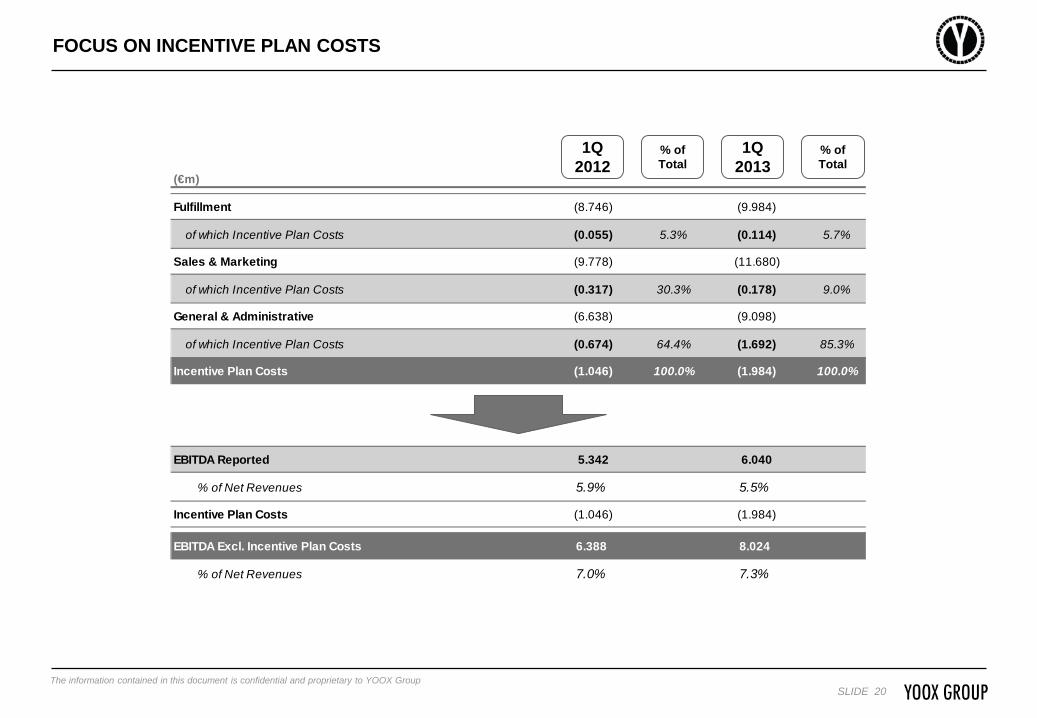
(€m)
Fulfillment (8.746) (9.984)
of which Incentive Plan Costs (0.055) 5.3% (0.114) 5.7%
Sales & Marketing (9.778) (11.680)
of which Incentive Plan Costs (0.317) 30.3% (0.178) 9.0%
General & Administrative (6.638) (9.098)
of which Incentive Plan Costs (0.674) 64.4% (1.692) 85.3%
Incentive Plan Costs (1.046) 100.0% (1.984) 100.0%
EBITDA Reported 5.342 6.040
% of Net Revenues 5.9% 5.5%
Incentive Plan Costs (1.046) (1.984)
EBITDA Excl. Incentive Plan Costs 6.388 8.024
% of Net Revenues 7.0% 7.3%
FOCUS ON INCENTIVE PLAN COSTS
% of Total
% of Total
1Q 2012
1Q 2013

The information contained in this document is confidential and proprietary to YOOX Group SLIDE 21
YOOX GROUP NET FINANCIAL POSITION
FY 2012 1Q 2012 1Q 2013 (€m)
Cash and Cash Equivalents (23.2) (35.8) (30.6)
Other Current Financial Assets (5.3) (6.5) (7.6)
Current Financial Assets (28.5) (42.3) (38.2)
Current Financial Liabilities 4.7 12.6 11.3
Long Term Financial Liabilities 13.2 15.1 13.9
Net Financial Debt / (Net Cash) (10.6) (14.6) (13.0)

The information contained in this document is confidential and proprietary to YOOX Group SLIDE 22
Federico Marchetti 7,985,653 12.0% 3,993,449 7.0%
Management team and other stock option holders 4,882,540 7.4%
Sub-total 12,868,193 19.4% 3,993,449 7.0%
Balderton Capital 4,370,280 6.6% 4,370,280 7.6%
OppenheimerFunds 3,556,634 5.4% 3,556,634 6.2%
Federated 2,764,439 4.2% 2,764,439 4.8%
Red Circle Investments 2,647,040 4.0% 2,647,040 4.6%
Red Circle Unipersonale 2,342,183 3.5% 2,342,183 4.1%
Aviva Investors Global Services 1,945,278 2.9% 1,945,278 3.4%
Capital Research and Management Company 1,641,469 2.5% 1,641,469 2.9%
Wasatch Advisors 1,638,679 2.5% 1,638,679 2.9%
Caledonia Investments 1,261,817 1.9% 1,261,817 2.2%
JPMorgan Asset Management 1,162,736 1.8% 1,162,736 2.0%
Market 30,121,176 45.4% 30,121,176 52.4%
Total 66,319,924 100.0% 57,445,180 100.0%
SHAREHOLDER STRUCTURE
Updated as of 8 May 2013 1.The fully diluted column shows the effect on the Company’s shareholder structure calculated assuming that all the stock options granted under the Company’s stock option plans are exercised. It does not
include 98,522 ordinary shares under the 2009 - 2014 Incentive Plan 2.Excludes Federico Marchetti 3.Includes 125,861 proprietary shares
2
3
Shareholder Current Fully Diluted 1

The information contained in this document is confidential and proprietary to YOOX Group SLIDE 23
CONTACTS
Investor Relations
www.yooxgroup.com
BOLOGNA - MILANO - NEW YORK - MADRID - PARIS - TOKYO - SHANGHAI - HONG KONG