2013 ELECTRIC POWER TRANSMISSION AND DISTRIBUTION (EPTD ... · PDF fileELECTRIC POWER...
36
ELECTRIC POWER TRANSMISSION AND DISTRIBUTION (EPTD) SMART GRID PROGRAM Final Program Theory and Logic Model Report Prepared for The New York State Energy Research and Development Authority Todd French Project Manager Prepared by Research Into Action, Inc. P.O. Box 12312 Portland, Oregon 97212 503 / 287-9136 Principal Investigator: Jane S. Peters Research Into Action, Inc. Project Staff: Robert Russell Brent Barkett Kirsten Midura Navigant, Inc. Project Number 9835 NYSERDA December 2013
Transcript of 2013 ELECTRIC POWER TRANSMISSION AND DISTRIBUTION (EPTD ... · PDF fileELECTRIC POWER...

ELECTRIC POWER TRANSMISSION AND DISTRIBUTION (EPTD)
SMART GRID PROGRAM
Final Program Theory and Logic Model Report
Prepared for
The New York State
Energy Research and Development Authority
Todd French
Project Manager
Prepared by
Research Into Action, Inc.
P.O. Box 12312
Portland, Oregon 97212
503 / 287-9136
Principal Investigator:
Jane S. Peters
Research Into Action, Inc.
Project Staff:
Robert Russell
Brent Barkett
Kirsten Midura
Navigant, Inc.
Project Number 9835
NYSERDA December 2013

NOTICE
This report was prepared by Research Into Action, Inc. in the course of performing work contracted for and
sponsored by the New York State Energy Research and Development Authority (hereinafter the
“Sponsor”). The opinions expressed in this report do not necessarily reflect those of the Sponsors or the
State of New York, and reference to any specific product, service, process, or method does not constitute an
implied or expressed recommendation or endorsement of it. Further, the Sponsors and the State of New
York make no warranties or representations, expressed or implied, as to the fitness for particular purpose or
merchantability of any product, apparatus, or service, or the usefulness, completeness, or accuracy of any
processes, methods, or other information contained, described, disclosed, or referred to in this report. The
Sponsors, the State of New York, and the contractor make no representation that the use of any product,
apparatus, process, method, or other information will not infringe privately owned rights and will assume
no liability for any loss, injury, or damage resulting from, or occurring in connection with, the use of
information contained, described, disclosed, or referred to in this report.

iii
TABLE OF CONTENTS
NOTICE ............................................................................................................................ II
TABLE OF CONTENTS ............................................................................................... III
INTRODUCTION.............................................................................................................. I
SECTION 1: PROGRAM CONTEXT, STAKEHOLDERS, INTENT, AND
DESIGN .......................................................................................................................... 1-1 1.1 Targeted Problem .......................................................................................................................... 1-1 1.2 Program Goals and Design ............................................................................................................ 1-1 1.3 Stakeholders .................................................................................................................................. 1-2 1.4 Program Barriers ........................................................................................................................... 1-4
SECTION 2: PROGRAM OBJECTIVES (HIGH LEVEL) ...................................... 2-1 2.1 Short-Term/Intermediate-Term (1-4 Years) .................................................................................. 2-1 2.2 Long-Term (5+ Years) .................................................................................................................. 2-1
SECTION 3: PROGRAM RESOURCES .................................................................... 3-1
SECTION 4: PROGRAM ACTIVITIES .................................................................... 4-1
SECTION 5: PROGRAM OUTPUTS ......................................................................... 5-1
SECTION 6: PROGRAM OUTCOMES AND LOGIC DIAGRAM ........................ 6-1
SECTION 7: ASSUMPTIONS ABOUT STRATEGIES ........................................... 7-1
SECTION 8: NON-PROGRAM INFLUENCES ON OUTCOMES ......................... 8-1
SECTION 9: REFERENCES ....................................................................................... 9-1

Table of Contents EPTD Smart Grid Logic Model Report
iv
LIST OF TABLES
Table 1-1: Stakeholder Context ................................................................................................................... 1-3 Table 1-2: Potential Problems and Key Stakeholders.................................................................................. 1-5 Table 2-1: Program Resources .................................................................................................................... 3-1 Table 5-1: EPTD Smart Grid Program Outputs, Associated Indicators, and Potential Data Sources ......... 5-1 Table 6-1: EPTD Smart Grid Outcomes, Associated Indicators, and Potential Data Sources ..................... 6-1
LIST OF FIGURES
Figure T-1: Program Design Template ........................................................................................................... II Figure 6-1: Electric Power Transmission and Distribution (EPTD) Smart Grid Program Logic Diagram . 6-5

I
INTRODUCTION
The electric power transmission and distribution (EPTD) system is widely regarded as an enabling
infrastructure ripe for systematic improvements, which could produce and ensure higher levels of
efficiency, reliability, security, and resiliency for all consumers. Systematic grid modernization offers an
opportunity to promote improved asset utilization, while lowering the carbon intensity of the electric-power
sector. These modernized, automated grid developments are often referred to colloquially as the “Smart
Grid.” Although there is no standardized definition of the Smart Grid, this term can often refer to “a
combination of enabling technologies, hardware, software, or practices that collectively make the delivery
infrastructure or the grid more reliable, more versatile, more secure, more accommodating, more resilient,
and ultimately more useful to consumers.”1
New York State Energy Research and Development Authority (NYSERDA)’s involvement with Smart
Grid development dates back to 2007, when it issued the first of three competitive solicitations designed to
support EPTD projects aimed at improving the reliability, efficiency, security, and overall performance of
the electric power delivery system in New York State. Using funding authorized by the Commission under
the System Benefits Charge program (SBC3), NYSERDA is currently supporting more than 30 projects
that have made advancements in such areas as establishing uniform, statewide diagnostics to assess system
reliability; integrating advanced communication; controlling and monitoring technologies, developing
power electronics and remote sensing for continuous monitoring of infrastructure; conducting real-time
monitoring of real and reactive power, voltage conservation; offering demand-side ancillary services and
facilitating the integration; and delivering electricity from renewable and distributed generation resources.
The Public Service Commission (PSC)’s October 2011 Order regarding the fourth round of System Benefit
Charge (SBC4) funding allocated $37.5 million for the NYSERDA EPTD Smart Grid Program. The Order
specifically stated that the EPTD Smart Grid program could provide enhancements that ensure higher
levels of security, quality, reliability, and availability of electric power; improve economic productivity;
and minimize environmental impacts while maximizing sustainability.2
The purpose of this document is to present the logic model for the EPTD Smart Grid Program. This
document is organized into the following segments:
1. Program Context, Stakeholders, Intent and Design:
a. The problem(s) the program is attempting to solve and the issue(s) it will address.
b. All entities (the stakeholders) with responsibility for installing and maintaining reliable,
safe and secure operation of the electric power delivery system (the environments/context
within which the program is working).
2. Program Objectives: The program’s ultimate purpose and targets.
1 Sioshansi, Fereidoon P., 2012, Smart Grid: Integrating Renewable, Distributed, & Efficient Energy.
Associated Press.
2 NYSERDA, Operating Plan for Technology and Market Development Programs (2012-2016), System
Benefits Charge, February 15, 2013 (Second Revision).

Introduction EPTD Smart Grid Logic Model Report
II
3. Program Resources: The dollars, staffing and partnership, etc. resources the program is
providing.
4. Program Activities: The various research and engineering studies, product development,
demonstration and commercialization progress support activities and strategies being delivered
through the program.
5. Program Outputs: The anticipated immediate results associated with program activities.
6. Program Outcomes and Logic Diagram: What is expected to be achieved in the near,
intermediate and longer term. Also shows in diagram form, the linkages between key activities,
outputs, outcomes, and external/non-program influences.
7. Assumptions: The assumptions about how program activities and outputs will lead to the desired
near, intermediate, and longer-term outcomes.
8. Non-Program External Influences: Factors outside the program that may drive or constrain the
achievement of outcomes.
The relationship among these eight items is presented in Figure T-1. A program-specific logic model
diagram is presented later in this document as Figure 6-1.
Figure T-1: Program Design Template
1. Problem/
Issues and
Stakeholders
(Context)
2. Program
Objectives
(a subset)
4. Program
Activities
5. Program
Outputs
6. Program
Outcomes
(near and
longer term)
3. Program
Resources
7. Assumptions About Program
(Researchable Questions)
8. Non-Program Influences
Contribution to solution? Objectives met? Need to modify?
1-1
Section 1:
PROGRAM CONTEXT, STAKEHOLDERS, INTENT, AND DESIGN
1.1 TARGETED PROBLEM
Recent advancements in technology, as well as continuing increases in electricity demands, have led
utilities to consider the Smart Grid and its role in the modernization of the electric grid. As part of the
ongoing process of upgrading and replacing our aging transmission and distribution (T&D) systems,
utilities are increasingly employing Smart Grid technologies, which, if utilized properly, have the potential
to make electric power systems more reliable, robust, efficient, and economical. Smart Grid technologies
can also enable integration of increased levels of renewable and distributed energy resources and increased
energy efficiency and demand response.
Currently, New York State faces a range of T&D system security, efficiency, reliability, and power quality
issues that affect the country’s entire northeast region and in some cases, much of the Eastern
Interconnection.3 Some of these issues will be addressed by the marketplace, and others clearly have public
benefit implications and could be addressed through public/private partnerships. To help remedy these
issues, NYSERDA’s EPTD Smart Grid Program is designed to promote the development of a Smart Grid
that accommodates a diverse set of electrical generation resources, enhances overall grid performance and
enables customers to reduce costs, energy consumption, and their environmental impacts.
NYSERDA is just one of several market actors impacted by, or involved in, addressing these challenges.
Compared to other entities that may also be investigating and investing in solutions for the multi-billion
dollar embedded electricity grid infrastructure, NYSERDA has relatively few dollars invested ($37.5
million over the five year period 2012 – 2016. The focus of NYSERDA’s EPTD Smart Grid program,
therefore, will be on projects addressing both T&D issues with public benefit implications. NYSERDA’s
program is intended to address both upstate and downstate electricity needs, support underground and
overhead power delivery systems, and support both central and distributed generation infrastructure.
Specific program areas will include grid scale energy storage; T&D automation and management;
renewable and distributed energy integration; advanced monitoring and controls; advanced sensors, devices
and systems; microgrids; advanced cables and conductors; and advanced system modeling and applications
1.2 PROGRAM GOALS AND DESIGN
The EPTD Smart Grid Program aims to improve T&D infrastructure and monitoring through increased
investment, integrate advanced communication, automation, and control technologies, improve system
efficiencies and reduce system losses, and improve reliability of the grid, among other goals. To achieve
the overall program goals, The EPTD Smart Grid Program includes the following four project categories:
Research Studies aimed at exploring new policy, business, regulatory models, advanced
concepts, and innovative product or technology development opportunities.
Engineering Studies that assess the feasibility and effectiveness of demonstrating new or under-
utilized technologies at a New York site. The studies are intended to support project development
3 The Eastern Interconnection refers to one of the two major alternating current power grids in North
America. The other major interconnection is the Western Interconnection.

Program Context, Stakeholders, Intent, and Design EPTD Smart Grid Logic Model Report
1-2
activity, such as site assessment, economic analysis, interconnection, and permitting issues
associated with potential demonstration projects that improve the reliability, quality, and
efficiency of the electric power delivery system.
New Product Development and commercialization of products for improving the performance of
the electrical power delivery system.
Demonstration Projects of new or under-utilized technologies that improve the performance of
the electrical power delivery system and are past the “proof-of-concept” stage, but that are not yet
commercially ready or certified.
1.3 STAKEHOLDERS
NYSERDA’s EPTD Smart Grid Program continues to seek input from a broad range of stakeholders. In
turn, NYSERDA provides these stakeholders with ongoing feedback about program achievements and
milestones. Following is a listing relevant stakeholder groups. Table 1-1 provides more information
regarding the context within which these and other stakeholders reside.
New York State Utilities (Investor Owned, Public, Municipal and Cooperatives)
New York Power Authority (NYPA), Long Island Power Authority (LIPA)
New York Independent System Operator (NYISO)
New York State Reliability Council (NYSRC)
Northeast Power Coordinating Council (NPCC)
New York State Public Service Commission (PSC)
New York State Smart Grid Consortium (NYSSGC) – Specifically Rochester Polytechnic Institute
and Brookhaven National Laboratory
New York Battery and Energy Storage Technology Consortium (NY-BEST)
New York State Department of Environmental Conservation (NYSDEC)
New York State Department of Public Service (NYSDPS)
Private T&D Investors
Independent Power Producers (IPPNY)
Equipment Manufacturers
Department of Energy (DOE)
Research Organizations (Electric Power Research Institute [EPRI], NY-BEST, NYSSGC, etc.)

EPTD Smart Grid Logic Model Report Program Context, Stakeholders, Intent, and Design
1-3
Table 1-1: Stakeholder Context
Utilities
Support from utilities is sought to advance improvements to the T&D system.
Needs include superconducting cables, fault current management, improved fault location
capabilities, higher capacity distribution cables, distribution automation capabilities, effective
integration of renewable and distributed resources into the distribution system, worker and public
safety, cost reduction, and reliability. Various utilities in New York State are already conducting a
substantial amount of work in these areas.4
Con Edison predominantly uses a network system and wires are underground (New Rochelle uses
a radial system). The rest of the state predominantly uses a radial system (Albany, Rochester,
Buffalo, etc. downtowns have network systems). These differences will require different T&D
research.
Orange & Rockland and Central Hudson are looking to integrated system models for their systems.
Although the distribution system is regulated, the transmission system is not. Most of the
transmission system is currently owned by the regulated utilities.
Power Plant Owners/Operators (including Renewables and Distributed Generation)
Changes to the transmission system should accommodate all types of power generation.
Investments in generation capacity must be coordinated with investments in transmission
capacity.5
Regulatory Agencies and Policy Advocates
The Federal Energy Regulatory Commission (FERC) has entrusted independent system operators
(ISOs), such as the NYISO with significant regional planning responsibilities.6
The Energy Policy Act of 2005 has made fundamental changes to the investment incentives related
to many types of energy resources and the T&D infrastructure.7
Governmental units, policy makers, DPS Staff, and electric customer advocacy groups are also
involved.
NYISO
Responsibility for system reliability and the economic dispatch of generation within New York
State and imports and exports of power from/to other Regional Transmission Operators (RTOs)
lies with the NYISO.
4 NYSERDA, Operating Plan for Technology and Market Development Programs (2012-2016), System
Benefits Charge, February 15, 2013 (Second Revision).
5 Ibid.
6 Ibid.
7 Ibid.

Program Context, Stakeholders, Intent, and Design EPTD Smart Grid Logic Model Report
1-4
Private Sector Investors
Transmission system projects are being considered and have been funded through the private
sector.
Other Mid-Market (Infrastructure) Entities
T&D equipment manufacturers, distributors, system engineers, designers, and installation
contractors are becoming aware of issues, opportunities and implications associated with new
technologies and have begun to achieve financial benefits from promotion/involvement.
Research Organizations
National government and private industry research organizations, including the Department of
Energy’s Brookhaven, Sandia, and Oak Ridge National Labs and the Electric Power Research
Institute, are well suited and currently involved in various research projects addressing security,
reliability and power quality issues associated with the electric utility T&D system.
University-based and other non-profit research centers within and outside of New York State
provide a valuable T&D research and development source.
NYSERDA provides another resource for advancing T&D technologies and policy solutions with
a focus on more local (New York State) and regional public benefit-oriented activities.
1.4 PROGRAM BARRIERS
The EPTD Smart Grid Program works to overcome a variety of market barriers. Table 1-2 highlights some
of the key barriers (and associated stakeholder groups) that NYSERDA has identified for potential
targeting within the larger grid-related problems that New York State may face. Depending on proposals
received in response to the EPTD Smart Grid Program Opportunity Notices (PONs), some or all of these
barriers may be addressed through program activities:

EPTD Smart Grid Logic Model Report Program Context, Stakeholders, Intent, and Design
1-5
Table 1-2: Potential Problems and Key Stakeholders
Problem Area and Barrier Details Stakeholders Impacted and/or Involved
1. Lack of new technology solutions and limited willingness to demonstrate or adopt existing solutions
a. Advances in transmission system technologies are not likely to
be implemented unless private investors can benefit from the
technology.
b. Diagnostic tools for early-warning detection of T&D failures are
needed.
c. The NYISO needs systems to monitor the performance of its
own transmission lines as well as those of the systems with
which it is interconnected, to increase situational awareness, to
improve early detection of dangerous situations, and to monitor
weather-related issues.
d. There is currently no system available for quantifying
transmission system performance. System/Customer Average
Interruption Duration Indices are available, yet these systems
only track frequency and duration of system outages rather than
overall performance.
e. Reliability performance is often measured as the average total
duration of interruptions (i.e., “minutes lost”) experienced by a
consumer in a year. Using this measure, over 90% of the
minutes lost for consumers are attributable to distribution events.
Hence, investments in the distribution system are required to
achieve higher levels of reliability and quality.8
f. Increased use of intermittent renewable and distributed energy
resources.
g. Improved grid monitoring/assessment/control tools are needed
to enhance real-time performance of the power delivery system.
h. Critical need for hardening of the grid to resist both natural and
manmade disturbances.
i. Better diagnostic indicators are necessary to quantify grid
performance.
j. Historical congestion points on the electric grid need to be
alleviated to improve reliability and reduce energy costs.
k. Power system operational issues, such as the need to improve
situational awareness of operators, also cut across New York
State’s boundaries.
l. An increasing need for reactive power reserves and voltage
support, and a need for improved power system integrity
protection
m. The adoption of the RPS and RGGI may require changes in the
transmission system to accommodate for increased renewable
power.
Private Sector Investors, Research
Organizations, Other Mid-Market
(infrastructure) Entities, Power Plant
Owners/Operators, Utilities, NYISO,
Regulatory Agencies
8 Ibid.

Program Context, Stakeholders, Intent, and Design EPTD Smart Grid Logic Model Report
1-6
Problem Area and Barrier Details Stakeholders Impacted and/or Involved
2. Limited interest and weak market infrastructure to support public benefits-type projects
a. Collaboration is needed to leverage financial investment to solve
critical problems that are common to multiple entities
b. T&D encompasses a diverse group of loosely coupled entities.
Coordination of these entities is essential to reach stated public
goals.
c. Electric power flows that are significantly different compared
with historical energy delivery characteristics when the industry
was fully regulated.
d. Increasing energy and peak demand requirements place a heavy
burden on the grid.
e. De-regulation has decoupled ownership of power generation and
electric power delivery infrastructure. This has resulted in less
coordinated resource planning.
f. New York State is importing more electricity and exporting less
electricity. At the same time, New York State has a desire to be
less dependent on other states for its power.
g. The FERC has entrusted ISOs/RTOs, such as the NYISO, with
significant regional planning responsibilities.9
h. The importance of maintaining high T&D system reliability will
increase with the formation of the Electricity Reliability
Organization (ERO), which will have legal authority.10
i. As the industry continues to change, research plans must be
developed and implemented to address these issues and must
adapt to the changing conditions.
Utilities, Research Organizations, Other
Mid-Market (infrastructure) Entities,
Private Sector Investors, Power Plant
Owners/Operators, NYISO
9 After transmission developers obtain approvals from the NYISO, these developers must also apply for
approval from the New York State PSC under Article VII of the Public Service Law [1].
10 With the adoption of the U.S. Energy Policy Act in 2005, a new ERO is charged with developing and
enforcing continent-wide reliability standards. The FERC has certified the North American Electric
Corporation as the ERO in the United States.

EPTD Smart Grid Logic Model Report Program Context, Stakeholders, Intent, and Design
1-7
Problem Area and Barrier Details Stakeholders Impacted and/or Involved
3. Limited private investment in T&D due to inconsistent policy/regulatory issues, conflicting incentives,
and inadequate business models
a. Energy security and reliability is a public benefit and therefore,
private sector investment is unlikely without public support.
b. Excess generation capacity exists in Upstate New York whereas
congestion exists in Downstate areas.
c. Lack of cost recovery and benefit sharing mechanisms that
promote investment in/application of smart technologies stymie
early stage investment/testing of smart devices/business
processes.
d. Lack of investment (both private and public) in T&D
infrastructure has increased system vulnerability.
Regulatory Agencies, NYISO, Power
Plant Owners/Operators, Utilities, Private
Sector Investors, Other Mid-market
(infrastructure) Entities
4. Limited recognition of T&D system benefits associated with closer/strategic coordination with load
management, energy efficiency and distributed generation efforts
a. Elimination of utility-led/regulatory-mandated integrated
resource planning has reduced careful assessment of non-
traditional solutions to technical T&D problems and constraints.
b. Targeted demand response, energy efficiency, and renewable
and distributed generation options, in addition to new T&D
technologies, are more regularly being considered as cost-
effective solutions to T&D system security, reliability, and
power quality problems.
c. High technical and financial risk associated with
demonstrating/developing new technologies.
d. Need to accurately quantify public reliability and security
benefits associated with T&D system upgrades to encourage
additional investment.
Utilities, Regulatory Agencies, Private
Sector Investors, Power Plant
Owners/Operators, Research
Organizations, NYISO

Program Context, Stakeholders, Intent, and Design EPTD Smart Grid Logic Model Report
1-8

2-1
Section 2:
PROGRAM OBJECTIVES (HIGH LEVEL)
The EPTD Smart Grid Program seeks to support appropriate policy, planning, and coordination efforts that
collectively will lead to the following objectives:
2.1 SHORT-TERM/INTERMEDIATE-TERM (1-4 YEARS)
Influence policies and regulations to support T&D infrastructure, or their adoption more quickly
(as a result of white papers, etc.) while balancing stakeholder needs
Increase private investment to promote the adoption of new business models
Dissemination of lessons learned and best practices
Respond to changing stakeholder priorities in the face of weather related or economy (expansion
or contraction) realities
Commercialize new technologies and achieve broader use of existing technologies to improve
reliability, security and power quality, with more people adopting them due to funded R&D,
demonstrations and dissemination of same
2.2 LONG-TERM (5+ YEARS)
Improve T&D infrastructure through increased investment
Improve statewide system condition monitoring (deployment and validation of remote sensing
devices) and develop advanced diagnostics to assess T&D system reliability (e.g., advanced
monitoring and control systems and subsystems)
Integrate advanced communication, control, automation, and management technologies, power
electronics, and innovative T&D technologies
Aid adoption of new and under-utilized technologies that improve system efficiencies and reduce
system losses (e.g., innovative grid scale energy storage technologies including, but not limited to,
stationary batteries, flywheels, ultra-capacitors, flow batteries, compression systems and
superconducting magnetic energy storage)
Improve power reliability in terms of reduced number and duration of power outages in New York
State (e.g., advanced sensors, devices, control systems and other equipment innovations that
improve T&D system performance and reliability)
Improve power quality by reducing voltage sags, flicker, etc. which currently require customers to
install systems to protect against power anomalies
Improve power security
Preparing the grid for the delivery of electricity from large-scale and distributed renewable
generation resources including wind and solar as these resources become available
Enhance economic development by reducing congestion charges (e.g., advanced conductor and
cabling technologies to improve throughput and reduce losses)

Program Objectives (High Level) EPTD Smart Grid Logic Model Report
2-2
Confirm that focused R&D portfolios, developed by NYSERDA and other entities, are helping to
make these advances

3-1
Section 3:
PROGRAM RESOURCES
As shown in Table 3-1, NYSERDA’s EPTD Smart Grid Program will take advantage of numerous
resources.
Table 3-1: Program Resources
SBC Funding
$37.5 million commitment over the five year period (2012 – 2016)
This funding will be leveraged with other SBC4 funding targeted for advancing electric vehicle
and energy storage technology under the broader Power Supply and Delivery Initiatives
NYSERDA Staff Resources
Program administration and implementation oversight support
External Resources
Utilities, Independent Power Plant Owners/Operators
Regulatory Agencies and Policy Advocates, NYISO
Private Sector Investors, Other Mid-Market (Infrastructure) Entities, Research Organizations, such
as EPRI, NY-BEST, and the NYS Smart Grid Consortium
Intangible Resources
NYSERDA’s credibility and relationship with key stakeholders, policy makers and key market
actors
NYSERDA’s experience with product development and demonstration projects

Program Resources EPTD Smart Grid Logic Model Report
3-2

4-1
Section 4:
PROGRAM ACTIVITIES
To achieve its program objectives, NYSERDA seeks to fund a combination of research and engineering
studies and product development and demonstration projects that improve the reliability, efficiency,
resiliency, quality, and overall performance of the electric power delivery system in New York State. The
EPTD Smart Grid Program will offer competitive solicitations, funding, project management, and
technology transfer support for specific technology areas. The program will target market actors across the
continuum of supply, infrastructure, and demand chain. In addition, the program will coordinate closely
with various stakeholders to ensure that projects are selected and implemented in a way that maximizes
statewide benefits for New York State’s electric ratepayers.11
EPTD Smart Grid Program staff will utilize the following tactics when implementing the program:
Support projects that demonstrate significant statewide benefits (e.g., emissions reductions, job
creation, product manufacturing and sales, increased reliability, higher efficiency, and reduced
power costs)
Coordinate the efforts of all New York State T&D stakeholders
Leverage external funding to further supplement in-state resources (e.g., project cost sharing and
coordination with EPRI, DOE, etc.)
NYSERDA program activities can be grouped into the following two major categories:12
1. T&D Policy, R&D Planning and Coordination
Activities in this area are designed mainly to address ineffective policy/regulatory issues,
conflicting incentives, and inadequate business models that limit private investment in T&D. The
program’s coordination activities are intended to support public benefit-type projects by
addressing problems of limited interest and weak market infrastructure. These activities focus
mainly on:
a. Funding studies on and coordinating policy efforts,
b. Funding pre-deployment studies about infrastructure, and
c. Planning/coordinating funding of specific R&D efforts.
11 The NYISO and the NYSRC have substantial roles in managing the wholesale markets and
establishing/enforcing stringent grid reliability standards.
12 Additional detail can be found in PONs 2474 (closed) and 2715 (active).

Program Activities EPTD Smart Grid Logic Model Report
4-2
Approximately 25% of NYSERDA program resources are dedicated to these activities. Examples
include research resulting in the publication of the following reports:13
Assessment of Transmission and Distribution Losses in New York State
Microgrids: An Assessment of the Value, Opportunities, and Barriers to Deployment in
New York State
Fast Fault Screening for Real-Time Transient Stability Assessment
Competitive solicitations for research studies to address the following issues also fall into this
program activity category:
Defining effective business models that promote private investment in electric power
delivery infrastructure
Identifying and resolving regulatory barriers that can delay the implementation of an
advanced grid network
Addressing wholesale market equity issues associated with increasing the capacity of
electric energy flow from upstate to downstate communities
Ensuring grid reliability, efficiency, quality, and performance as the delivery network
accommodates clean energy technologies, such as renewable power generation, electric
vehicles, and efficient distributed generation systems
Developing a comprehensive strategy for “hardening” the T&D system to withstand
potential threats and outages
2. Technology Development, Demonstration, and Information Dissemination
Activities in this area are designed mainly to address lack of new technology solutions and limited
willingness to demonstrate or adopt existing solutions and - through information dissemination
activities - limited interest and weak market infrastructure to support public benefits-type projects.
These activities focus mainly on:
a. Funding product development
b. Funding demonstrations of new technologies
c. Disseminating results
Approximately 75% of NYSERDA’s program resources are dedicated to these activities.
Examples include the following:
Competitive solicitations for R&D technology demonstration and product development
projects that address one or more of five technology categories critical to the
development of an advanced electric power delivery system:
13 The complete set of reports recently completed through the program can be found at the following
website: http://www.nyserda.ny.gov/Publications/Research-and-Development-Technical-
Reports/Electric-Power-Delivery-Reports.aspx.

EPTD Smart Grid Logic Model Report Program Activities
4-3
1. Monitoring and Diagnostics: Deploy innovative sensors to measure critical grid
parameters (e.g., voltage, frequency, reactive power).
2. Data Processing and Analysis: Demonstrate advanced modeling tools and
analytical algorithms to predict grid performance.
3. Optimized Visualization: Implement innovative graphical user interfaces that
improve the situational awareness of grid operations in real-time.
4. Secure Communication: Incorporate secure communication technologies to
enhance the flow and accuracy of information shared among regional control
areas (i.e., NYISO, PJM Interconnection, LLC, Independent System Operator-
New England).
5. Improved Control and System Performance: Provide grid operation staff with
effective output control options to improve grid reliability, security, and overall
performance. Demonstrate innovative technologies (e.g., advanced cables,
power electronics, reactive power resources) that reduce system power losses
and congestion.
Conducting feasibility studies for specific technology demonstration and product development projects to
identify, quantify, and/or validate reliability and performance benefits for the electric power delivery
system.
Collectively, these feasibility studies, technology demonstration, and product development projects will
target a majority of the stakeholder groups (market actors) identified in Table 1-1. In addition, NYSERDA
will reach out to the NYISO and the NYSRC to ensure that selected projects are consistent with their
plans.14
Information dissemination is an essential element of the EPTD Smart Grid Program. Results of completed
projects will be shared with stakeholders, including the electric utilities, NYISO, NYSRC, and the New
York PSC. Information about projects will be shared though stakeholder participation on technical
evaluation panels, conferences, meetings, articles, reports, and the NYSERDA web site. EPRI may provide
technology transfer assistance at the national level.
14 The NYISO and the NYSRC have substantial roles in managing the wholesale markets and
establishing/enforcing stringent grid reliability standards.

Program Activities EPTD Smart Grid Logic Model Report
4-4
5-1
Section 5:
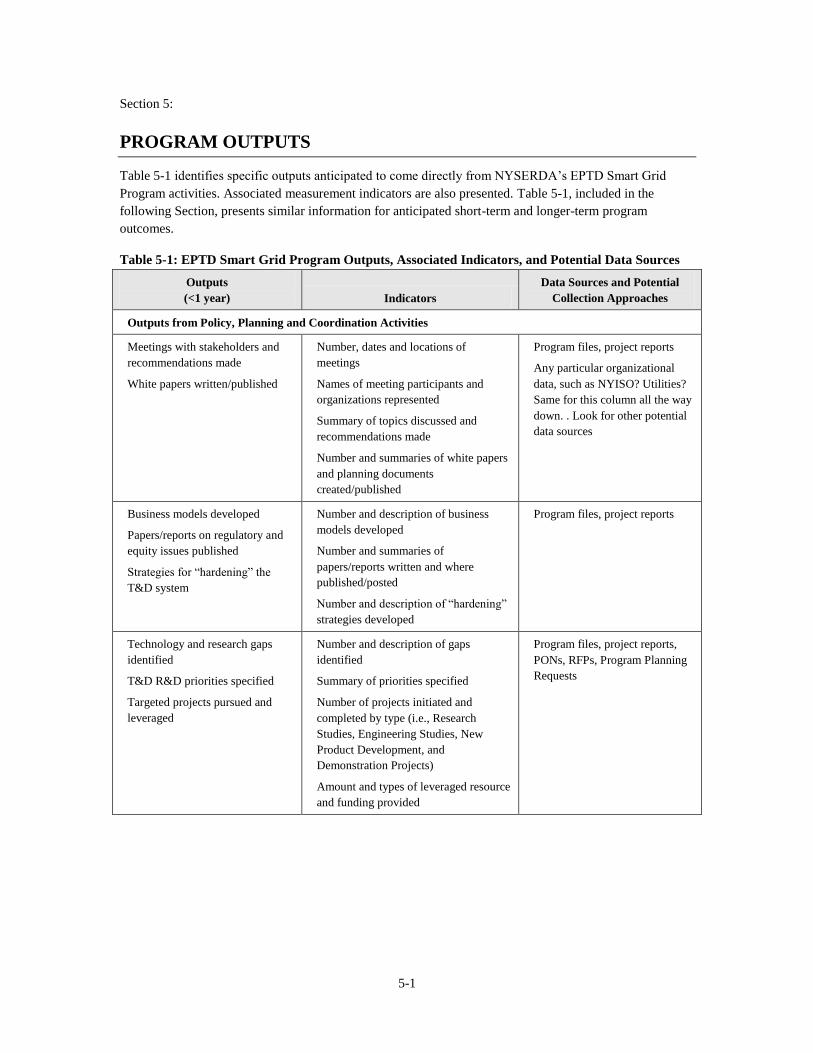
PROGRAM OUTPUTS
Table 5-1 identifies specific outputs anticipated to come directly from NYSERDA’s EPTD Smart Grid
Program activities. Associated measurement indicators are also presented. Table 5-1, included in the
following Section, presents similar information for anticipated short-term and longer-term program
outcomes.
Table 5-1: EPTD Smart Grid Program Outputs, Associated Indicators, and Potential Data Sources
Outputs
(<1 year) Indicators
Data Sources and Potential
Collection Approaches
Outputs from Policy, Planning and Coordination Activities
Meetings with stakeholders and
recommendations made
White papers written/published
Number, dates and locations of
meetings
Names of meeting participants and
organizations represented
Summary of topics discussed and
recommendations made
Number and summaries of white papers
and planning documents
created/published
Program files, project reports
Any particular organizational
data, such as NYISO? Utilities?
Same for this column all the way
down. . Look for other potential
data sources
Business models developed
Papers/reports on regulatory and
equity issues published
Strategies for “hardening” the
T&D system
Number and description of business
models developed
Number and summaries of
papers/reports written and where
published/posted
Number and description of “hardening”
strategies developed
Program files, project reports
Technology and research gaps
identified
T&D R&D priorities specified
Targeted projects pursued and
leveraged
Number and description of gaps
identified
Summary of priorities specified
Number of projects initiated and
completed by type (i.e., Research
Studies, Engineering Studies, New
Product Development, and
Demonstration Projects)
Amount and types of leveraged resource
and funding provided
Program files, project reports,
PONs, RFPs, Program Planning
Requests

Program Outputs EPTD Smart Grid Logic Model Report
5-2
Outputs
(<1 year) Indicators
Data Sources and Potential
Collection Approaches
Outputs from Technology Development and Demonstration Activities
Demonstrations of new or under-
utilized technologies
Number and description of technology
advances (by technology area and
accomplishment type)
Number, description, and results of
technology demonstrations
Number of demonstration sites located
within New York State
Number of funded demonstration
projects commissioned within 36
months
Number and description of
commercialized products
Program files, project reports
Outputs from Technology Transfer and Information Dissemination Activities
Credible data on technology
performance, cost and impacts
created and disseminated
Synthesis and translation of results
into forms useful for a broad
audience
Data and technical findings made
accessible to the public including
policy makers
Quantity, types and summary of data
created
Number and summary of magazine
articles, conference presentations,
websites and other technology transfer
and information dissemination
sources/events used to share data
Number and types of target audiences
and stakeholders informed (by topic
area and dissemination source)
Program files, project reports

6-1
Section 6:
PROGRAM OUTCOMES AND LOGIC DIAGRAM
Table 6-1 details the initiative’s expected achievements (i.e. outcomes), as well as the observable indicators
that would signify the presence of these achievements. In addition, the table shows the data sources and
potential collection approaches that an evaluation effort might undertake to determine the achievement of
the expected outcomes.
Table 6-1: EPTD Smart Grid Outcomes, Associated Indicators, and Potential Data Sources
Outcomes Indicators
Data Sources and Potential
Collection Approaches
Short-Term and Intermediate Outcomes Associated with Policy, Planning, and Coordination Activities
Supportive rulings issued
Stakeholder needs balanced
Number, source and description of policy
statements (documented and summarized by
key policy areas) that cite NYSERDA
papers/activities including:
- Policy documents addressing development of
a Smart Grid
- Policy documents addressing delivery of
electricity from renewable, DG and CHP
- Policy documents addressing grid
performance including system losses and
customer down time
- Policy documents addressing increasing
private investment in T&D
- Policy documents addressing the economic
impact of congestion relief
Number and description of rulings issued
(summarized by key policy areas) that cite
NYSERDA papers/activities
Review of policy documents
Review/assessment of rulings
Interviews with key
stakeholders
Increased private/utility
investment in infrastructure
Number of private firms adopting business
models defined by studies
Amount of private sector investment in T&D
infrastructure
Development and deployment of products and
policies that increase private sector investment
in T&D as well as market development in New
York (e.g., manufacturing in New York State).
Program records, project
reports
Survey of companies
Higher quality, more relevant
R&D
Better R&D management
Number and description of R&D projects being
implemented that align with identified and
recognized high priority T&D issues
Timely/effective project selection, management
and targeted research implementation processes
Development and deployment of uniform
statewide diagnostics systems for assessing
T&D system reliability.
Program records, project
reports
Process and impact
evaluations (including
comparison against policy
objectives and priorities)

Program Outcomes and Logic Diagram EPTD Smart Grid Logic Model Report
6-2
Outcomes Indicators
Data Sources and Potential
Collection Approaches
Short-Term and Intermediate Outcomes from Technology Development Activities
New technologies available/
commercialized (e.g., sensors,
simulation, communication)
Number and description of technologies made
available/commercialized (by technology type
and policy/priority area, and stakeholder groups
involved/impacted) including:
- Number of new diagnostics systems for
assessing T&D system reliability that are
commercialized
- Number of new remote sensor products for
continuous monitoring of T&D infrastructure
with real-time monitoring of real and reactive
power that are commercialized
- Number of new products decreasing customer
down time that are commercialized
- Number of new products to reduce system
losses that are commercialized
- Number of new products to facilitate delivery
of electricity from DG and CHP that are
commercialized
Reduced barriers to the deployment of
advanced technologies that improve the
reliability, quality and efficiency of the
electrical power delivery system
- Development and deployment of remote
sensors for continuous monitoring of T&D
infrastructure with real-time monitoring of real
and reactive power.
Program records, project
reports
U.S. Patent Office
Interviews with project
participants and other key
stakeholders
Short-Term and Intermediate Outcomes from Technology Transfer and Information Dissemination Activities
Policy makers and utilities are
aware and more likely to
support/adopt efforts to
improve the reliability,
efficiency, quality, and overall
performance of the electric
power delivery system in New
York State
Change in awareness/level of understanding of
the electricity grid and associated technologies
and how they can be used to improve grid
performance (documented by specific priority
awareness areas and stakeholder groups)
Number and types of decisions that have been
made based on this information and enhanced
understanding (by priority area and stakeholder
group)
Development and deployment of products and
policies that address the economic impact of
congestion relief.
Bibliographic data, website
hit records, etc.
Interviews with policymakers,
utilities and other key
stakeholders
Similar sources as noted in
Outcomes from Policy,
Planning and Coordination
Activities above

EPTD Smart Grid Logic Model Report Program Outcomes and Logic Diagram
6-3
Outcomes Indicators
Data Sources and Potential
Collection Approaches
Longer-Term Outcomes
New technologies adopted
(e.g., advanced monitoring
and control systems,
innovative grid scale energy
storage technologies,
distributed energy resources
and renewable energy
integration systems)
Deployment of T&D system improvement
technologies including:
- Number and description of new technologies
deployed to improve the reliability, efficiency,
quality, and overall performance of the electric
power delivery system in New York State
- Number and description of new products
deployed to reduce system losses through T&D
infrastructure
-Number and description of new technologies
deployed to increase the role of renewable, DG
and CHP in T&D infrastructure
- Number and description of new technologies
deployed to maximize the economic impact of
T&D infrastructure changes
Documented in-state and out-of-state sales
revenues and jobs created from these new
technologies (by technology type)
Recoupment funds paid to NYSERDA
(applicable to commercialized technologies that
received more than $100K from NYSERDA)
Development and deployment of products and
policies that ensure grid reliability, efficiency,
quality, and performance as the delivery
network accommodates clean energy
technologies, such as renewable power
generation, electric vehicles, and efficient
distributed generation systems.
Program records, project
reports
Survey of companies
Process and Impact analyses
NYSSGC, utilities, NYISO
NYSERDA & Non-
NYSERDA R&D efforts
successful (i.e., projects that
assess the feasibility and
effectiveness of new or under-
utilized technologies)
Number and types of R&D projects that make
up NYSERDA’s EPTD Smart Grid Program
portfolio
Number and types of R&D projects targeting
T&D technologies and policies being
conducted by other organizations
Technology and policy advancement impacts
associated with NYSERDA’s and other
organizations’ R&D projects
Synergies with national electricity grid
initiatives/research needs
Review of program records
and NYSERDA/non-
NYSERDA project reports
Interviews with key
stakeholders
Process and Impact analyses

Program Outcomes and Logic Diagram EPTD Smart Grid Logic Model Report
6-4
Outcomes Indicators
Data Sources and Potential
Collection Approaches
Development of a Smart Grid
that accommodates a diverse
supply of generation
resources, enhances overall
grid performance and enables
customers to reduce costs,
energy consumption, and
environmental impacts
Improved T&D infrastructure,
efficient use of existing
transmission lines, reduced
congestion
Provision of direct and
quantifiable energy,
environmental, and economic
benefits to New York State
(e.g., emissions reductions,
job creation, product
manufacturing and sales,
increased reliability, higher
efficiency, and reduced power
costs)
Amount of renewable or distributed energy
resources and electric energy storage
technologies integrated into New York State’s
T&D system
Number and duration of power outages
Number of power quality problems
Number of customers installing equipment to
address power quality
Dispersal/alternate paths for T&D
Miles of new transmission lines built since
program inception
Ratio of T&D capacity to peak load demand in
New York City
Amounts of congestion charges in New York
City
Prices paid for power in New York State
Amount of environmental and economic
benefits that accrue to New York State
Development and deployment of products and
policies that improve system efficiencies,
reduce system losses, and decrease customer
downtime.
Surveys of end-users
Interviews with key
stakeholders
Reports to NYISO, PSC,
utilities, etc.
Reports from utilities
Impact analysis
The following page shows, in diagram form as Figure 6-1, the linkages between activities, outputs, and
anticipated outcomes associated with the NYSERDA EPTD Smart Grid Program. This logic model
diagram also presents key features of the program including Program Resources (Inputs) and potential
Non-Program (External) Influences, which are discussed in more detail in Section 8.

Program Outcomes and Logic Diagram EPTD Smart Grid Logic Model Report
6-5
Figure 6-1: Electric Power Transmission and Distribution (EPTD) Smart Grid Program Logic Diagram

Program Outcomes and Logic Diagram EPTD Smart Grid Logic Model Report
6-6

7-1
Section 7:
ASSUMPTIONS ABOUT STRATEGIES
Based on this program logic document, a number of assumptions have been identified and are noted below.
Information from program activities (i.e., Research Studies, Engineering Studies, New Product
Development Initiatives, and Technology Demonstrations) is successfully disseminated to policy
makers, utility actors, manufacturers, investors, and other key stakeholders
Information from program activities will result in adoption of critical technologies by the NYISO,
utilities, and others
Demonstrations of new and under-utilized technologies will inform and change behavior because
key firms are involved and data is widely disseminated to influential actors
Studies on infrastructure issues will lead to increased investment in T&D infrastructure because
they are targeted at key barriers, disseminated to the right people and influence specific policies
R&D will be incorporated into new technologies because NYSERDA selects projects well and
communicates with people who will take up the technology, and new technologies will be adopted
because polices will provide incentives and regulations will require it
There are synergies: (1) among NYSERDA’s program strategies, (2) between policy and
improved infrastructure, and (3) between technology and infrastructure, and across all three of
these areas

Assumptions About Strategies EPTD Smart Grid Logic Model Report
7-2

8-1
Section 8:
NON-PROGRAM INFLUENCES ON OUTCOMES
External influences can help to enhance or hamper achievement of desired outcomes. Several of these
potential external influences are noted below:
1. Economic conditions may improve, leading to load growth. Alternatively, economic conditions
may decline, leading to a reduction in load on the system. Political priorities might result in lack of
interest or heightened, but narrower, interest in T&D issues.
2. Utilities may be willing or unwilling to adopt new technologies and time to adoption may be long.
3. Manufacturers may view new products as being too risky for investment.
4. Elimination or renewal of the Federal Production Tax Credit or other regulations may reduce or
increase need for renewable energy generation, requiring changes to the T&D system.

Non-Program Influences on Outcomes EPTD Smart Grid Logic Model Report
8-2

9-1
Section 9:
REFERENCES
Program Opportunity Notice (PON) 1913, Electric Power Transmission and Distribution (EPTD) Program,
NYSERDA, 2010.
Program Opportunity Notice (PON) 2474, Electric Power Transmission and Distribution (EPTD) Program,
NYSERDA, 2012.
System Benefits Charge Proposed Operating Plan for Technology and Market Development Programs
(2012-2016).
Toward a Brighter Energy Future, a Three-Year Strategic Outlook 2008-20011.
New York State Energy Plan.
New York State Energy Highway Initiative.

References EPTD Smart Grid Logic Model Report
9-2