2013 ECONOMIC IMPACT OF SHOPPING CENTERS - icsc.com · 5 A HISTORY OF SHOPPING CENTERS Shopping...
12
1 2013 ECONOMIC IMPACT OF SHOPPING CENTERS International Council of Shopping Centers
Transcript of 2013 ECONOMIC IMPACT OF SHOPPING CENTERS - icsc.com · 5 A HISTORY OF SHOPPING CENTERS Shopping...

1
2013 ECONOMIC IMPACT OF SHOPPING CENTERS International Council of Shopping Centers

2
3 ICSC Values
4 Marketplace Fairness
4 Did You Know?
4 Annual Performance
5 A History of Shopping Centers
6 National Impact
8 Non-Anchor Tenant Sales
8 ShoppingCenterDefinitions
9 Geographic Distribution of GLA
10 U.S. Country Fact Sheet
CONTENTS

3
Where we’ve beenRecent special classes at the University of Shopping Centers, web based programs and the John T. Riordan schools, have benefitted members by looking at redevelopment and retrofitting existing properties and opportunities to maximize retail productivity. Conferences, books, sessions and ICSC events around the world offer potential to assimilate knowledge, and only ICSC offers global professional certifications: CSM, CMD, CLS, CDP.
Where we’re goingConferences such as our NOI+ Conference will educate members on asset management priorities and maximizing net operating income at their retail properties. We’re also working with like-minded shopping center councils and associations around the globe to encourage innovative thought leadership collaboration on best practices.
EDUCATION
Where we’ve beenRecent efforts to champion Marketplace Fairness have gained greater traction than ever before in the U.S. Congress. A robust public affairs campaign and aggressive advertising have garnered legislative support and raised public awareness.
Where we’re goingICSC is working diligently to thwart any attempts to raise industry-focused taxes, such as on carried interest. In the regulatory arenas, we are playing a significant role in ensuring that international, national and local rules reflect the realities of operating in a multi-tenant retail environment.
ADVOCACYWhere we’ve been
RECon Las Vegas draws over 30,000 attendees annually. An additional 300 global events provide local and regional
networking opportunities for 70,000 more industry professionals. Every year a significant share of all retail leasing
activity is shaped at ICSC events.
Where we’re goingWe will strengthen our Global RECon and local events to
provide premier in-person networking opportunities for members in Asia, Europe, Latin America and the Caribbean, and the Middle East and North Africa. We will also use new
media and technology to create opportunities for online and mobile networking.
NETWORKING
Where we’ve beenMember research resources span an online library, a database
of more than 9,000 industry statistics, a rich offering of learning, leadership and issues videos, 11 industry-leading publications, a global shopping center directory and a wide array of special
studies.
Where we’re goingStrategic alliances with complementary associations and
industry research providers will bring new range and depth to our information offerings, especially for new and timely industry
benchmarks.
RESEARCH
E A R N
ICSC VALUES

4
MARKETPLACEFAIRNESS ACT
DID YOU KNOW?• California has the most shopping centers—14,993. Wyoming has the least with 74.
• As of May 2012, there are 1,513 enclosed malls in the U.S.
• The average enclosed mall contains 876,256 sq. ft. of total floor space.
• The are 392 lifestyle centers operating in the U.S.
• In 2012, shopping center-inclined sales accounted for $2.4 trillion.
• Shopping center-inclined sales generated $136.2 billion in state sales tax revenue in 2012.
• Shopping center-related employment totaled 12.4 million jobs in 2012. • Supermarkets are the most common anchor in open-air centers.
• Apparel and accessories stores account for 57.3% of all non-anchor mall space.
• The last enclosed mall that was built was in 2011—City Creek Center in Salt Lake City, Utah.
• Wal-Mart was the highest grossing retailer in 2011, earning $454 billion in sales.
Since 2011, ICSC has made enormous strides in advocating for sales tax fairness. Backed by the investment approved by the Board of Trustees, ICSC put significant resources towards educating Congressional offices and the public about sales tax fairness and the outstanding tax burden that consumers currently owe on many online purchases. This campaign has translated into myriad media opportunities for ICSC and has created significant momentum for legislation at the federal level. ICSC leads the Marketplace Fairness Coalition; a unified voice for the proponents of Marketplace Fairness. The members of the Coalition represent nearly 3 million businesses, associations, and organizations located in every state throughout the country.
Thus far, ICSC’s efforts have paid off in early 2013. We had several resounding bipartisan votes of approval in the U.S. Senate, culminating May 6 with the passage of S.743 by that chamber with a 69-27 vote. The push now continues to the U.S. House for action and approval there.
4
ANNUAL PERFORMANCE2012 RETAIL SALES Shoppers have found their way back to the malls; retail sales numbers for 2012 regained their strength, registering over $2.4 trillion in sales, an increase from $2.33 trillion in 2011.
Shopping center–related employment accounted for more than 12.4 million jobs for 2012, an increase from12.2 million jobs in 2011.
In 2012, there were 254 more shopping centers operating in the U.S. than in 2011. The total number of U.S. shopping centers increased in 2012 to 112,874, up from 112,620 in 2011.

5
A HISTORY OF SHOPPING CENTERSShopping centers have existed in some form for more than 1,000 years as ancient market squares, bazaars and seaport commercial districts. The modern shopping center, which includes everything from small suburban strip centers to the million-square-foot super regional mall had its genesis in the 1920s.
1920sThe concept of developing a shopping district away from a downtown is generally attributed to J. C. Nichols of Kansas City, Mo. His Country Club Plaza, which opened in 1922, was constructed as the business district for a large-scale residential development. It featured unified architecture, paved and lighted parking lots, and was managed and operated as a single unit.
In the latter half of the 1920s, small strip centers were built on the outskirts of large cities. The centers were usually anchored by a supermarket and a drugstore, supplemented by other convenience-type shops. The typical design was a straight line of stores with space for parking in front, such as the Grandview Avenue Shopping Center in Columbus, Ohio, which opened in 1928 and included 30 shops and parking for 400 cars.
Many consider Highland Park Shopping Village in Dallas, Texas, developed by Hugh Prather in 1931, to be the first planned shopping center. Its stores were built with a unified image and managed under the control of a single owner. Highland Park occupied a single site and was not bisected by public streets. And, its storefronts faced inward, away from the streets—a revolutionary design. 1930s-1940sIn the 1930s and 1940s, Sears Roebuck & Co. and Montgomery Ward set up large freestanding stores, with on-site parking, away from the centers of big cities.
1950sThe early 1950s marked the opening of the first two shopping centers anchored by full-line branches of downtown department stores. Northgate in Seattle,
Wash., (two strip centers face-to-face with a pedestrian walkway in between) opened in 1950, and Shoppers World in Framingham, Mass. (the first two-level center), debuted the following year. The concept was improved upon in 1954 when Northland Center in Detroit, Mich., used a “cluster layout” with a single department store at the center and a ring of stores around it. In 1956, Southdale Center in Edina, Minn., outside of Minneapolis, opened as the first fully enclosed mall with a two-level design. It had central air-conditioning and heating, a comfortable common area and, more importantly, it had two competing department stores as anchors. Southdale is considered by most industry professionals to be the first modern regional mall.
1960sBy 1964 there were 7,600 shopping centers in the United States. Most of the centers built in the 1950s and 1960s were strip centers serving new housing developments.
1970sBy 1972 the number of shopping centers had doubled to 13,174. During the 1970s, a number of new formats and shopping center types evolved. In 1976 The Rouse Co. developed Faneuil Hall Marketplace in Boston, Mass., which was the first of the “festival marketplaces” built in the United States. The project, which revived a troubled downtown market, was centered on food and retail specialty items. Similar projects were built in Baltimore, New York City, and Miami, and have been emulated in a number of urban areas.
The bicentennial year also marked the debut of the country’s first urban vertical mall, Water Tower Place, which opened
on Michigan Avenue in Chicago. To many experts, Water Tower Place with its stores, hotel, offices, condominiums and parking garage, remains the preeminent mixed-use project in the United States.
1980sThe 1980s saw an unparalleled period of growth in the shopping center industry, with more than 16,000 centers built between 1980 and 1990. This was also the period when super-regional centers became increasingly popular with shoppers.
Between 1989 and 1993, new shopping center development dropped nearly 70 percent, from 1,510 construction starts in 1989 to 451 starts in 1993. The sharp decline in new center starts was attributed to the savings and loan crisis, which helped precipitate a severe credit crunch.
1990sFactory outlet centers were one of the fastest-growing segments of the shopping center industry in the 1990s. In 1990, there were 183 outlet centers. Today, there are more than 225 outlet centers in the United States. By 1992, the prevailing trend in the shopping center industry had become the remodeling and expansion of existing projects. In 1992, these renovations outstripped new construction, with 571 additions and alterations reported.
One of the retail formats that became increasingly popular in the 1990s was the power center. Power centers are often located near regional and superregional malls. San Francisco–based Terranomics is credited with pioneering the concept at 280 Metro Center in Colma, Calif.

6
In 1995, with the construction of the Mall of America in Bloomington, Minn., entertainment quickly became an
In 1995, with the construction of the Mall of America in Bloomington, Minn., entertainment quickly became an industry buzzword as technological advances allowed shopping center developments to foster the same magical experiences that were once only seen in national amusement parks such as Disney World. The Mall of America, currently one of the largest malls in the U.S., includes a seven-acre amusement park, nightclubs, and restaurants, and covers 4.2 million square feet (with about half that total devoted to retailing). Since the start of the entertainment wave, retailers have focused on keeping their presentations exciting, and shopping center owners have striven to obtain tenant mixes that draw traffic from the widest audience possible. Under one roof or in an outdoor retail format, consumers enjoy children’s playscapes, virtual reality games, live shows, movies in multiplex cinemas, a variety of food in either the food court or theme restaurants, carousel rides, visually stunning merchandising techniques, robotic animal displays, and interactive demonstrations.
Many shopping centers are also focused on added service-oriented tenants, which offer today’s busy consumer an opportunity to complete weekly errands or to engage in a variety of other activities. Among the many services found in today’s malls are churches, schools, postal branches, municipal offices, libraries, and museums.
THE SHOPPING CENTER INDUSTRY NATIONAL IMPACT
Shopping centers have become an integral part of the economic and social fabric of their communities. In 2012, shopping center-inclined sales were estimated at $2.4 trillion, an increase of 2.8% from the previous year. In 2012, state sales tax revenue from shopping center-inclined sales totaled $136.2 billion, up from the $131.6 billion collected in 2011.
Economic Impact
$1.0 $1.25 $1.5 $1.75 $2.0 $2.25 $2.5
Shopping Center-Inclined Sales
Trillions
2010
2011
2012
2007
2008
2009
2004
2005
2006
2001
2002
2003
2000
6
7
2000-2012Many hurdles were faced during this decade, which shook up the shopping center industry and ultimately created a “new normal.” The economic downfall hit during the end of this decade and had a strong impact on the way future business would be conducted. By 2010 there was an all- time high of 112,384 shopping centers in the United States. Due to the downturn in the economy, sales took a hit and shopping center development saw little to no activity during the latter half of the decade. Signs of improvement have been surfacing and a new era of the shopping center industry is starting to occur. Instead of building new centers, owners are redeveloping the centers they already have, making them more appealing and driving consumers back into malls.
Green initiatives have made their way into the retail real estate industry. Developers and mall owners have taken steps to create sustainable centers by implementing “greener” methods into everyday practices. From the land that the centers are built on to the materials used when remodeling or building a new center, to putting energy-saving solar panels on roofs, green methods can be found in many of today’s shopping centers. In this process of going “green,” a favorable situation has occurred: malls are now more eco-friendly while operating more cost efficiently for the owners. Sustainability is a trend that will likely stick around for the coming years. Although this decade had its moments of ups and downs, the shopping center industry proved its strength.
THE SHOPPING CENTER INDUSTRY NATIONAL IMPACT
12.0 12.1
2010
2011
2012
2007
2008
2009
2004
2005
2006
2001
2002
2003
2000
12.2 12.3 12.4 12.5 12.6 12.7 12.8 12.9 13.0
Millions
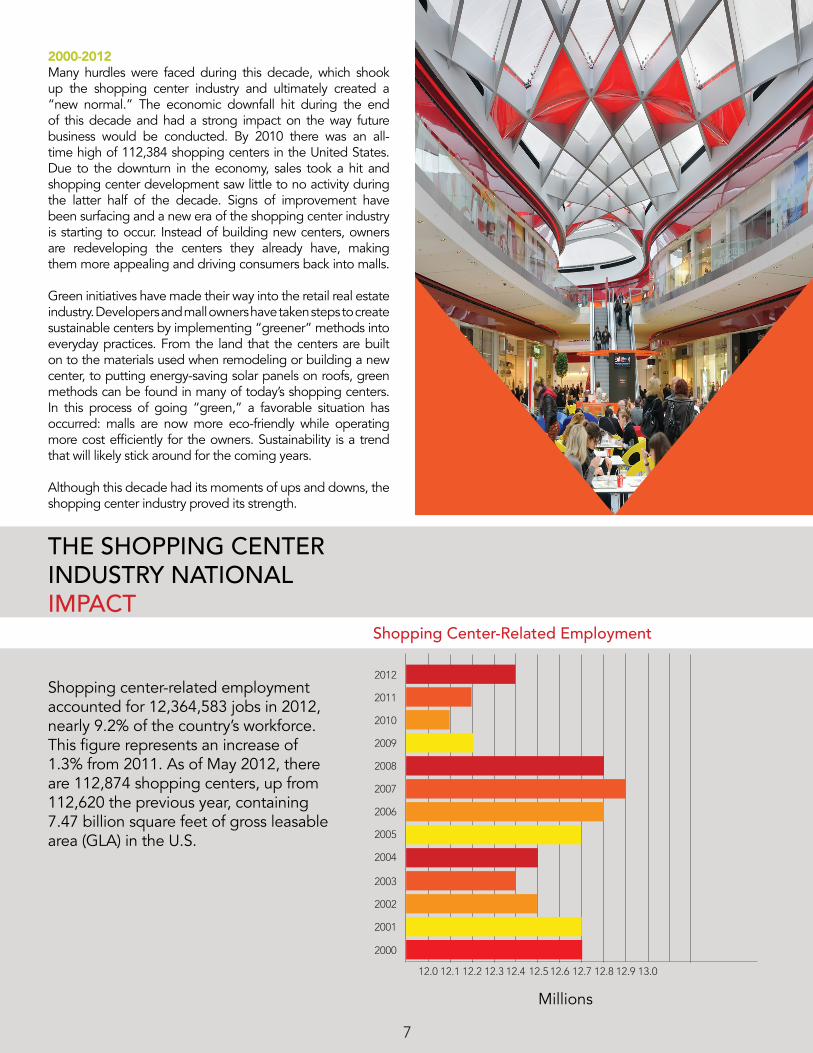
Shopping Center-Related Employment
Shopping center-related employment accounted for 12,364,583 jobs in 2012, nearly 9.2% of the country’s workforce. This figure represents an increase of 1.3% from 2011. As of May 2012, there are 112,874 shopping centers, up from 112,620 the previous year, containing 7.47 billion square feet of gross leasable area (GLA) in the U.S.
7

8
US SHOPPING CENTER DEFINITIONS
Regional [Mall]
General merchandise or fashion-oriented offerings. Typically enclosed with inward-
facing stores connected by a common walkway. Parking surrounds the outside
perimeter.
[Center Count] 828[Aggregate GLA sq. ft.] 486,259,603
[Share of Industry GLA] 6.5%[Average Size sq. ft.] 587,270
[Typical GLA Range]400,000-800,000 sq. ft.
[Trade Area Size] 5-15 miles
Super-Regional [Mall]
Similar in concept to regional malls, but offering more variety and assortment.
[Center Count] 685[Aggregate GLA sq. ft.] 839,515,217
[Share of Industry GLA] 11.2%[Average Size sq. ft.] 1,225,570
[Typical GLA Range]800,000+ sq. ft.
[Trade Area Size] 5-25 miles
Strip/Convenience [Open-Air]
Attached row of stores or service outlets, managed as a coherent retail entity. A strip center does not have enclosed
walkways linking stores. A convenience center is among the smallest of the
centers, whose tenants provide a narrow mix of goods and personal services to a
limited trade area.
[Center Count] 66, 611[Aggregate GLA sq. ft.] 890,892,391
[Share of Industry GLA] 11.9%[Average Size sq. ft.] 13,375
[Typical GLA Range]< 30,000 sq. ft.
[Trade Area Size] 1 mile
2012 MONTHLY DISTRIBUTION OF NON-ANCHOR TENANT SALES
Dec15.1%
Jan 6.6% Feb
7.6% Mar 8.3%
Apr 7.4%
May 7.4%
Jun 8.1%Jul
7.6%Aug 8.5%
Sep 7.9%
Oct 7.3%
Nov 8.8%
8

9
US SHOPPING CENTER DEFINITIONS
Neighborhood [Open-Air]
Convenience oriented.
[Center Count] 32,235[Aggregate GLA sq. ft.] 2,321,747,202
[Share of Industry GLA] 31.1%[Average Size sq. ft.] 72,026
[Typical GLA Range]30,000-150,000 sq. ft.
[Trade Area Size] 3 miles
Community [Open-Air]
General merchandise or convenience-oriented offerings. Wider range of apparel and other soft goods than
neighborhood centers. The center is usually configured in a straight line as a strip, or may be laid out in an L or U shape, depending on site and design.
[Center Count] 9,480[Aggregate GLA sq. ft.] 1,856,322,987
[Share of Industry GLA] 24.9%[Average Size sq. ft.] 195,815
[Typical GLA Range]100,000-350,000 sq. ft.
[Trade Area Size] 3-6 miles
Lifestyle [Open-Air]
Upscale national-chain specialty stores with dining and entertainment in an
outdoor setting.
[Center Count] 392[Aggregate GLA sq. ft.] 126,899,935
[Share of Industry GLA] 1.7%[Average Size sq. ft.] 323,724
[Typical GLA Range]150,000-500,000 sq. ft.
[Trade Area Size] 8-12 mile
2012 GEOGRAPHIC DISTRIBUTION OF GLA
California, Texas and Florida continue to outperform other states in shopping center gross leasable area (GLA). Combined they account for 29.3% of the total GLA. In 2012, California led the nation in GLA, with 886.8 million square feet, or 11.9% of the total United States, up from 885.3 million in 2011. Texas centers have 705.5 million square feet, from 703.5 million in 2011. Florida has 592.6 million square feet, up from 591.3 million in 2011. The next largest concentrations are in Ohio, Illinois, Georgia and New York, which all together have 16% of the total GLA. These seven states contain 45.2% of the total U.S. shopping center GLA. In contrast, the sparsely populated states of Wyoming, Vermont, South Dakota, North Dakota, Alaska and Montana are home to less than 1.0% of the total shopping center GLA.5-10 million sq. ft. 11-40 million sq. ft. 41-95 million sq. ft.
96-165 million sq. ft. 166-250 million sq. ft. 251-750 million sq. ft.
750+ million sq. ft.
9

10
UNITED STATES 2012 COUNTRY FACT SHEET
US SHOPPING CENTER DEFINITIONS
Power Center [Open-Air]
Category-dominant anchors, including discount department stores, off-price
stores, wholesale clubs, with only a few small tenants.
[Center Count] 2,029
[Aggregate GLA sq. ft.] 830,021,564[Share of Industry GLA] 11.1%[Average Size sq. ft.] 409,079
[Typical GLA Range]250,000-600,000 sq. ft.
[Trade Area Size] 5-10 miles
Theme/Festival [Open-Air]
Leisure, tourist, retail and service-oriented offerings with entertainment as a unifying theme. Often located in urban areas, they may be adapted from older—sometimes historic—buildings, and can be part of a
mixed-use project.
[Center Count] 184[Aggregate GLA sq. ft.] 25,442,812
[Share of Industry GLA] .3%[Average Size sq. ft.] 138,276
[Typical GLA Range]80,000-250,000 sq. ft.
[Trade Area Size] 25-75 miles
Outlet [Open-Air]
Manufacturers’ and retailers’ outlet stores selling brand name goods at a discount.
[Center Count] 345
[Aggregate GLA sq. ft.] 74,226,297[Share of Industry GLA] 1.0%[Average Size sq. ft.] 215,149
[Typical GLA Range]50,000-400,000 sq. ft.
[Trade Area Size] 25-75 mile
44.7%
Shopping Center GLA of Total Retail Space
Shopping Center GLA7,467,566,669 sq. ft.
Total Shopping Center GLA per 100 Inhabitants 2,378 sq. ft.
SALESTotal Retail Sales $4.36 trillion Year-on-Year Change in Retail Sales 4.9% Total Retail Sales per Capita $13,889 Total Retail Sales % GDP 27.8%
Shopping Center Sales $2.4 trillion Year-on-Year Change 2.8% Shopping Center Sales per Capita $7,637 Shopping Center Sales % GDP 15.3%
EMPLOYMENTTotal Retail Employees 14.9 millionTotal Shopping Center Employees 12.4 million
10

11
US SHOPPING CENTER DEFINITIONS
Airport Retail [Special Purpose]
Consolidation of retail stores located within a commercial airport.
[Center Count] 85
[Aggregate GLA sq. ft.] 16,238,661[Share of Industry GLA] .2%
[Average Size sq. ft.] 191,043[Typical GLA Range sq. ft]
75,000-250,000 sq. ft.
Total Industry
[Mall+Open-Air+Special Purpose]
[Center Count] 112,874[Aggregate GLA sq. ft.] 7,467,566,669
[Share of Industry GLA] 100%[Average Size] 66,158 sq. ft.
UNITED STATES 2012 COUNTRY FACT SHEET
Five Largest Shopping Centers (sq. ft.)
4.2 mil.
2.7 mil.
2.7 mil.
2.4 mil.
2.3 mil.
Del Amo Fashion Center (Torrance, Calif.)
Aventura Mall (Aventura, Fla.)
South Coast Plaza (Costa Mesa, Calif.)
Mall of America (Minneapolis, Minn.)
King of Prussia Mall (King of Prussia, Pa.)
Domestic Sales
International Sales
Five Largest Retailers
Domestic GLA
Total GLA (including International GLA)
Five Largest Shopping Center Owners
$50 billion
$100 billion
$150 billion
$200 billion
$250 billion
Wal-Mart
Target
Kroger
Costco
Walgreens
$300 billion
$350 billion
$316 bil.$109.2 bil.
$64.2 bil.$24.9 bil.
$85.5 bil.
$68.5 bil.
$66.3 bil.
50 mil.
sq. ft
.
100 mil.
sq. ft
.
150 mil.
sq. ft
.
200 mil.
sq. ft
Blackstone
General Growth
Kimco Realty
Simon
DDR
11

12
ABOUT ICSCFounded in 1957, ICSC is the premier global trade association of the shopping center industry. Its more than 60,000 members, in over 90 countries, include shopping center owners, developers, managers, marketing specialists, investors, retailers and brokers, as well as academics and public officials. As the global industry trade association, ICSC is linked to more than 25 national and regional shopping center councils throughout the world.
For more information, visit www.icsc.org.