2013 DEMOGRAPHIC PROFILE Retail Trade Area (10-Min ...
11
2013 DEMOGRAPHIC PROFILE Retail Trade Area (10-Min Drivetime) Deer Park, Texas Prepared for City of Deer Park April 2013
Transcript of 2013 DEMOGRAPHIC PROFILE Retail Trade Area (10-Min ...

2013 DEMOGRAPHIC PROFILERetail Trade Area (10-Min Drivetime)Deer Park, TexasPrepared forCity of Deer ParkApril 2013

Retail tRade aRea (10-Min dRivetiMe) Mapdeer park, texas
Contact information Debbie WestbeldEconomic Development AdministratorCity of Deer Park710 E. San AugustineDeer Park, TX 77536
Office (281) 478-2042 Fax (281) 478-7218Cell (281) 628-5114Email [email protected] www.deerparktx.gov

3
Description Data %
Population
2018 Projection 125,919
2013 Estimate 119,350
2010 Census 116,228
2000 Census 106,386
Growth 2013-2018 5.50%
Growth 2010-2013 2.69%
Growth 2000-2010 9.25%
2013 Est. Pop by Single Race Class 119,350
White Alone 94,875 79.49
Black or African American Alone 3,077 2.58
Amer. Indian and Alaska Native Alone 927 0.78
Asian Alone 2,059 1.73
Native Hawaiian and Other Pac. Isl. Alone 105 0.09
Some Other Race Alone 15,124 12.67
Two or More Races 3,183 2.67
2013 Est. Pop Hisp or Latino by Origin 119,350
Not Hispanic or Latino 62,260 52.17
Hispanic or Latino: 57,090 47.83
Mexican 51,881 90.88
Puerto Rican 878 1.54
Cuban 273 0.48
All Other Hispanic or Latino 4,058 7.11
Description Data %
2013 Est. Hisp or Latino by Single Race Class 57,090
White Alone 38,872 68.09
Black or African American Alone 343 0.60
American Indian and Alaska Native Alone 594 1.04
Asian Alone 79 0.14
Native Hawaiian and Other Pacific Islander Alone 21 0.04
Some Other Race Alone 15,005 26.28
Two or More Races 2,177 3.81
2013 Est. Pop. Asian Alone Race by Cat 2,059
Chinese, except Taiwanese 45 2.19
Filipino 260 12.63
Japanese 24 1.17
Asian Indian 323 15.69
Korean 166 8.06
Vietnamese 1,005 48.81
Cambodian 20 0.97
Hmong 0 0.00
Laotian 11 0.53
Thai 11 0.53
All Other Asian Races Including 2+ Category 194 9.42
Retail tRade aRea (10-Min dRivetiMe) deMogRaphiCsdeer park, texas
4
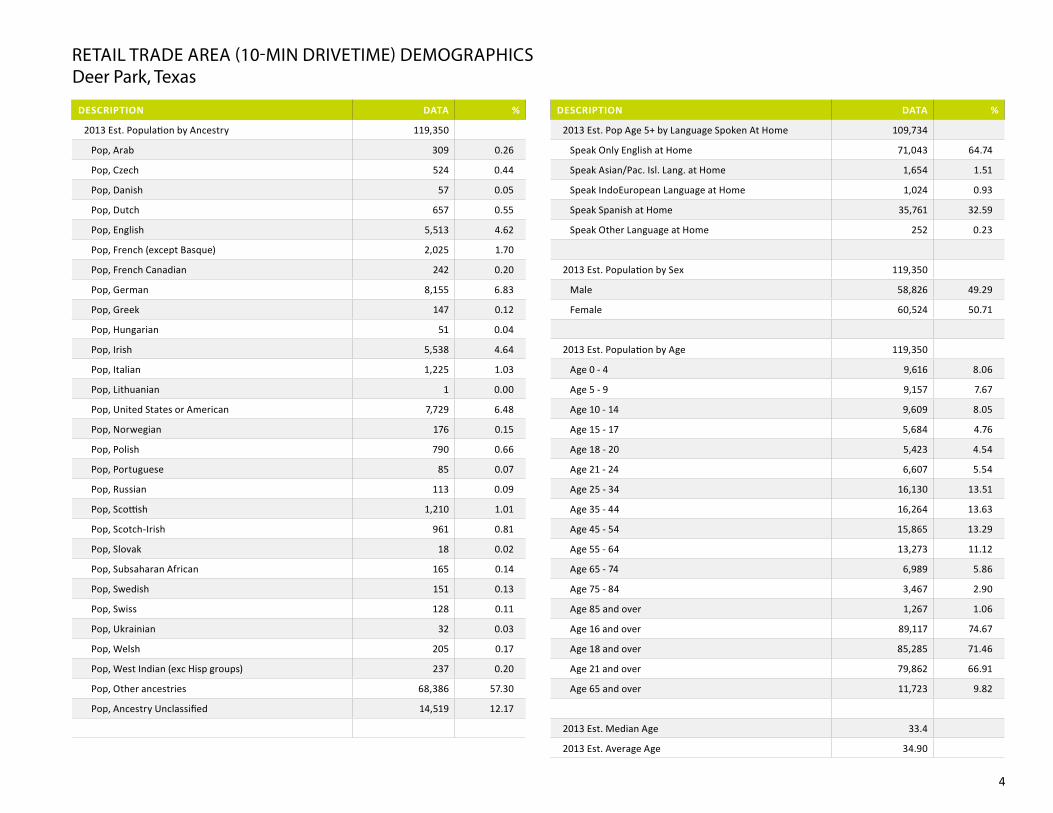
Description Data %
2013 Est. Population by Ancestry 119,350
Pop, Arab 309 0.26
Pop, Czech 524 0.44
Pop, Danish 57 0.05
Pop, Dutch 657 0.55
Pop, English 5,513 4.62
Pop, French (except Basque) 2,025 1.70
Pop, French Canadian 242 0.20
Pop, German 8,155 6.83
Pop, Greek 147 0.12
Pop, Hungarian 51 0.04
Pop, Irish 5,538 4.64
Pop, Italian 1,225 1.03
Pop, Lithuanian 1 0.00
Pop, United States or American 7,729 6.48
Pop, Norwegian 176 0.15
Pop, Polish 790 0.66
Pop, Portuguese 85 0.07
Pop, Russian 113 0.09
Pop, Scottish 1,210 1.01
Pop, Scotch-Irish 961 0.81
Pop, Slovak 18 0.02
Pop, Subsaharan African 165 0.14
Pop, Swedish 151 0.13
Pop, Swiss 128 0.11
Pop, Ukrainian 32 0.03
Pop, Welsh 205 0.17
Pop, West Indian (exc Hisp groups) 237 0.20
Pop, Other ancestries 68,386 57.30
Pop, Ancestry Unclassified 14,519 12.17
Description Data %
2013 Est. Pop Age 5+ by Language Spoken At Home 109,734
Speak Only English at Home 71,043 64.74
Speak Asian/Pac. Isl. Lang. at Home 1,654 1.51
Speak IndoEuropean Language at Home 1,024 0.93
Speak Spanish at Home 35,761 32.59
Speak Other Language at Home 252 0.23
2013 Est. Population by Sex 119,350
Male 58,826 49.29
Female 60,524 50.71
2013 Est. Population by Age 119,350
Age 0 - 4 9,616 8.06
Age 5 - 9 9,157 7.67
Age 10 - 14 9,609 8.05
Age 15 - 17 5,684 4.76
Age 18 - 20 5,423 4.54
Age 21 - 24 6,607 5.54
Age 25 - 34 16,130 13.51
Age 35 - 44 16,264 13.63
Age 45 - 54 15,865 13.29
Age 55 - 64 13,273 11.12
Age 65 - 74 6,989 5.86
Age 75 - 84 3,467 2.90
Age 85 and over 1,267 1.06
Age 16 and over 89,117 74.67
Age 18 and over 85,285 71.46
Age 21 and over 79,862 66.91
Age 65 and over 11,723 9.82
2013 Est. Median Age 33.4
2013 Est. Average Age 34.90
Retail tRade aRea (10-Min dRivetiMe) deMogRaphiCsdeer park, texas
5
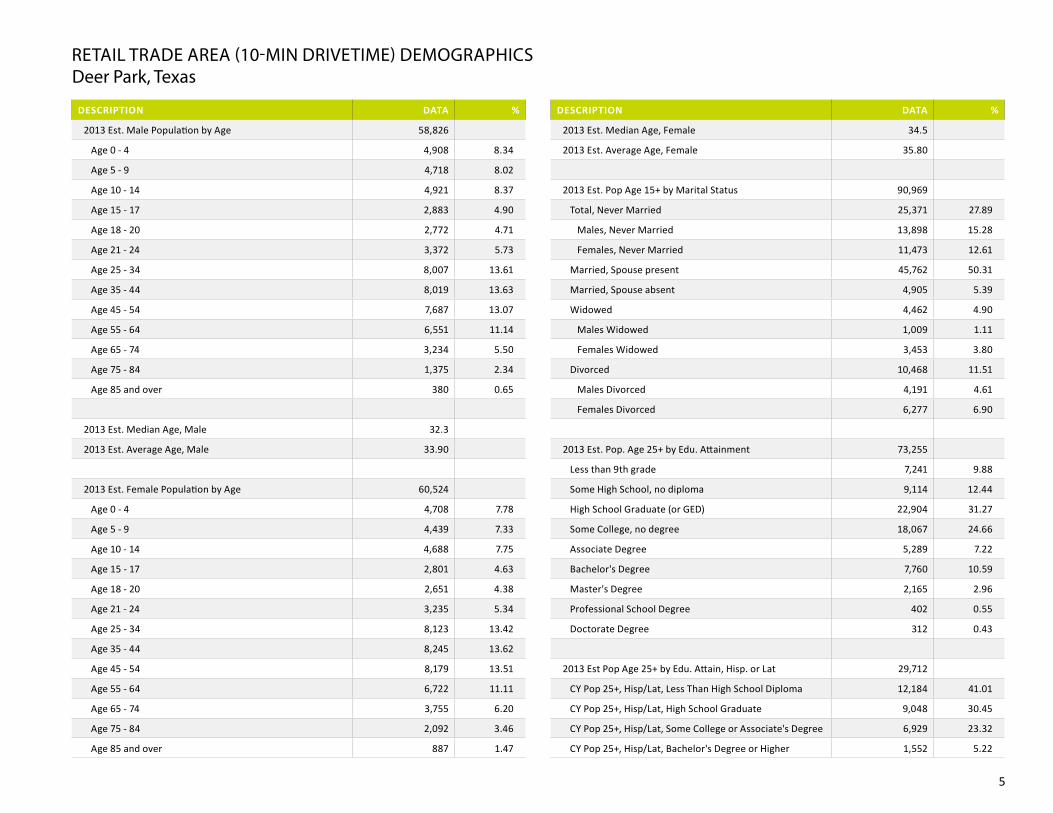
Description Data %
2013 Est. Male Population by Age 58,826
Age 0 - 4 4,908 8.34
Age 5 - 9 4,718 8.02
Age 10 - 14 4,921 8.37
Age 15 - 17 2,883 4.90
Age 18 - 20 2,772 4.71
Age 21 - 24 3,372 5.73
Age 25 - 34 8,007 13.61
Age 35 - 44 8,019 13.63
Age 45 - 54 7,687 13.07
Age 55 - 64 6,551 11.14
Age 65 - 74 3,234 5.50
Age 75 - 84 1,375 2.34
Age 85 and over 380 0.65
2013 Est. Median Age, Male 32.3
2013 Est. Average Age, Male 33.90
2013 Est. Female Population by Age 60,524
Age 0 - 4 4,708 7.78
Age 5 - 9 4,439 7.33
Age 10 - 14 4,688 7.75
Age 15 - 17 2,801 4.63
Age 18 - 20 2,651 4.38
Age 21 - 24 3,235 5.34
Age 25 - 34 8,123 13.42
Age 35 - 44 8,245 13.62
Age 45 - 54 8,179 13.51
Age 55 - 64 6,722 11.11
Age 65 - 74 3,755 6.20
Age 75 - 84 2,092 3.46
Age 85 and over 887 1.47
Description Data %
2013 Est. Median Age, Female 34.5
2013 Est. Average Age, Female 35.80
2013 Est. Pop Age 15+ by Marital Status 90,969
Total, Never Married 25,371 27.89
Males, Never Married 13,898 15.28
Females, Never Married 11,473 12.61
Married, Spouse present 45,762 50.31
Married, Spouse absent 4,905 5.39
Widowed 4,462 4.90
Males Widowed 1,009 1.11
Females Widowed 3,453 3.80
Divorced 10,468 11.51
Males Divorced 4,191 4.61
Females Divorced 6,277 6.90
2013 Est. Pop. Age 25+ by Edu. Attainment 73,255
Less than 9th grade 7,241 9.88
Some High School, no diploma 9,114 12.44
High School Graduate (or GED) 22,904 31.27
Some College, no degree 18,067 24.66
Associate Degree 5,289 7.22
Bachelor's Degree 7,760 10.59
Master's Degree 2,165 2.96
Professional School Degree 402 0.55
Doctorate Degree 312 0.43
2013 Est Pop Age 25+ by Edu. Attain, Hisp. or Lat 29,712
CY Pop 25+, Hisp/Lat, Less Than High School Diploma 12,184 41.01
CY Pop 25+, Hisp/Lat, High School Graduate 9,048 30.45
CY Pop 25+, Hisp/Lat, Some College or Associate's Degree 6,929 23.32
CY Pop 25+, Hisp/Lat, Bachelor's Degree or Higher 1,552 5.22
Retail tRade aRea (10-Min dRivetiMe) deMogRaphiCsdeer park, texas
6
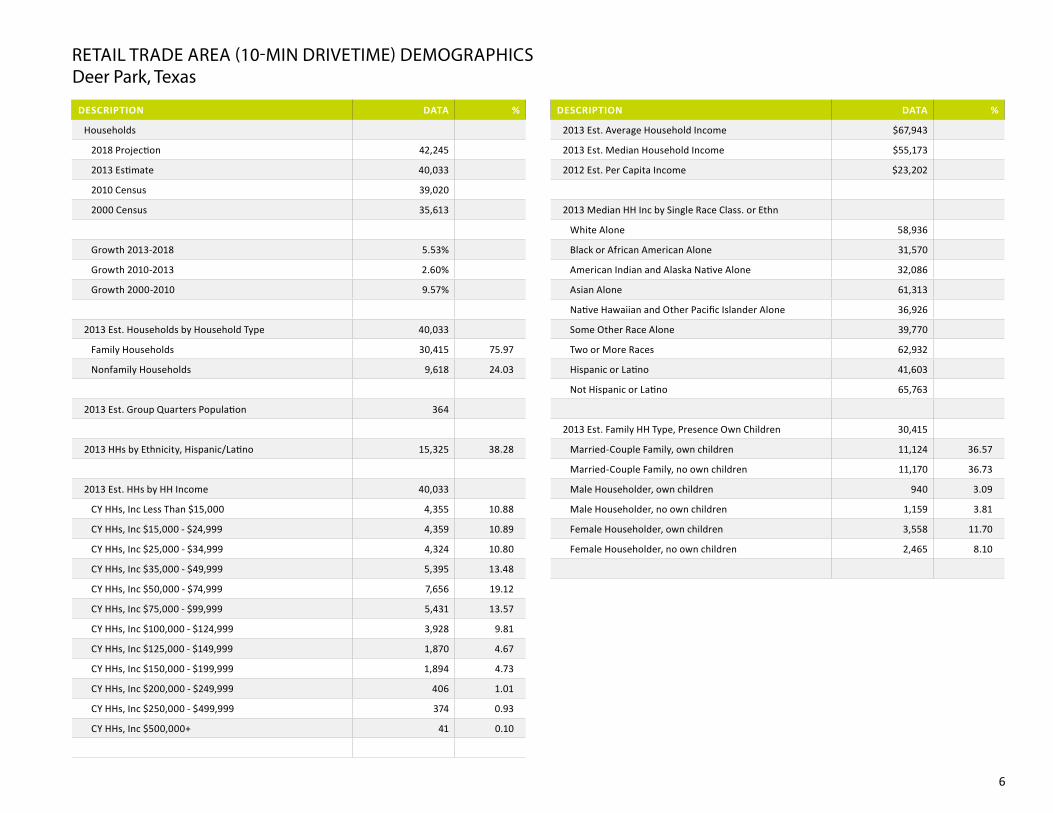
Description Data %
Households
2018 Projection 42,245
2013 Estimate 40,033
2010 Census 39,020
2000 Census 35,613
Growth 2013-2018 5.53%
Growth 2010-2013 2.60%
Growth 2000-2010 9.57%
2013 Est. Households by Household Type 40,033
Family Households 30,415 75.97
Nonfamily Households 9,618 24.03
2013 Est. Group Quarters Population 364
2013 HHs by Ethnicity, Hispanic/Latino 15,325 38.28
2013 Est. HHs by HH Income 40,033
CY HHs, Inc Less Than $15,000 4,355 10.88
CY HHs, Inc $15,000 - $24,999 4,359 10.89
CY HHs, Inc $25,000 - $34,999 4,324 10.80
CY HHs, Inc $35,000 - $49,999 5,395 13.48
CY HHs, Inc $50,000 - $74,999 7,656 19.12
CY HHs, Inc $75,000 - $99,999 5,431 13.57
CY HHs, Inc $100,000 - $124,999 3,928 9.81
CY HHs, Inc $125,000 - $149,999 1,870 4.67
CY HHs, Inc $150,000 - $199,999 1,894 4.73
CY HHs, Inc $200,000 - $249,999 406 1.01
CY HHs, Inc $250,000 - $499,999 374 0.93
CY HHs, Inc $500,000+ 41 0.10
Description Data %
2013 Est. Average Household Income $67,943
2013 Est. Median Household Income $55,173
2012 Est. Per Capita Income $23,202
2013 Median HH Inc by Single Race Class. or Ethn
White Alone 58,936
Black or African American Alone 31,570
American Indian and Alaska Native Alone 32,086
Asian Alone 61,313
Native Hawaiian and Other Pacific Islander Alone 36,926
Some Other Race Alone 39,770
Two or More Races 62,932
Hispanic or Latino 41,603
Not Hispanic or Latino 65,763
2013 Est. Family HH Type, Presence Own Children 30,415
Married-Couple Family, own children 11,124 36.57
Married-Couple Family, no own children 11,170 36.73
Male Householder, own children 940 3.09
Male Householder, no own children 1,159 3.81
Female Householder, own children 3,558 11.70
Female Householder, no own children 2,465 8.10
Retail tRade aRea (10-Min dRivetiMe) deMogRaphiCsdeer park, texas

7
Description Data %
2013 Est. Households by Household Size 40,033
1-person household 7,946 19.85
2-person household 10,941 27.33
3-person household 7,377 18.43
4-person household 6,860 17.14
5-person household 3,996 9.98
6-person household 1,747 4.36
7 or more person household 1,166 2.91
2013 Est. Average Household Size 2.97
2013 Est. Households by Presence of People 40,033
Households with 1 or more People under Age 18: 17,728 44.28
Married-Couple Family 12,217 68.91
Other Family, Male Householder 1,138 6.42
Other Family, Female Householder 4,310 24.31
Nonfamily, Male Householder 40 0.23
Nonfamily, Female Householder 23 0.13
Households no People under Age 18: 22,306 55.72
Married-Couple Family 10,502 47.08
Other Family, Male Householder 1,027 4.60
Other Family, Female Householder 1,817 8.15
Nonfamily, Male Householder 4,387 19.67
Nonfamily, Female Householder 4,572 20.50
Description Data %
2013 Est. Households by Number of Vehicles 40,033
No Vehicles 1,995 4.98
1 Vehicle 11,739 29.32
2 Vehicles 16,889 42.19
3 Vehicles 6,892 17.22
4 Vehicles 2,248 5.62
5 or more Vehicles 270 0.67
2013 Est. Average Number of Vehicles 2
Family Households
2018 Projection 32,105
2013 Estimate 30,415
2010 Census 29,646
2000 Census 28,051
Growth 2013-2018 5.56%
Growth 2010-2013 2.59%
Growth 2000-2010 5.69%
2013 Est. Families by Poverty Status 30,415
2013 Families at or Above Poverty 26,723 87.86
2013 Families at or Above Poverty with Children 14,129 46.45
2013 Families Below Poverty 3,693 12.14
2013 Families Below Poverty with Children 3,194 10.50
2013 Est. Pop Age 16+ by Employment Status 89,117
In Armed Forces 46 0.05
Civilian - Employed 55,020 61.74
Civilian - Unemployed 5,538 6.21
Not in Labor Force 28,514 32.00
Retail tRade aRea (10-Min dRivetiMe) deMogRaphiCsdeer park, texas
8
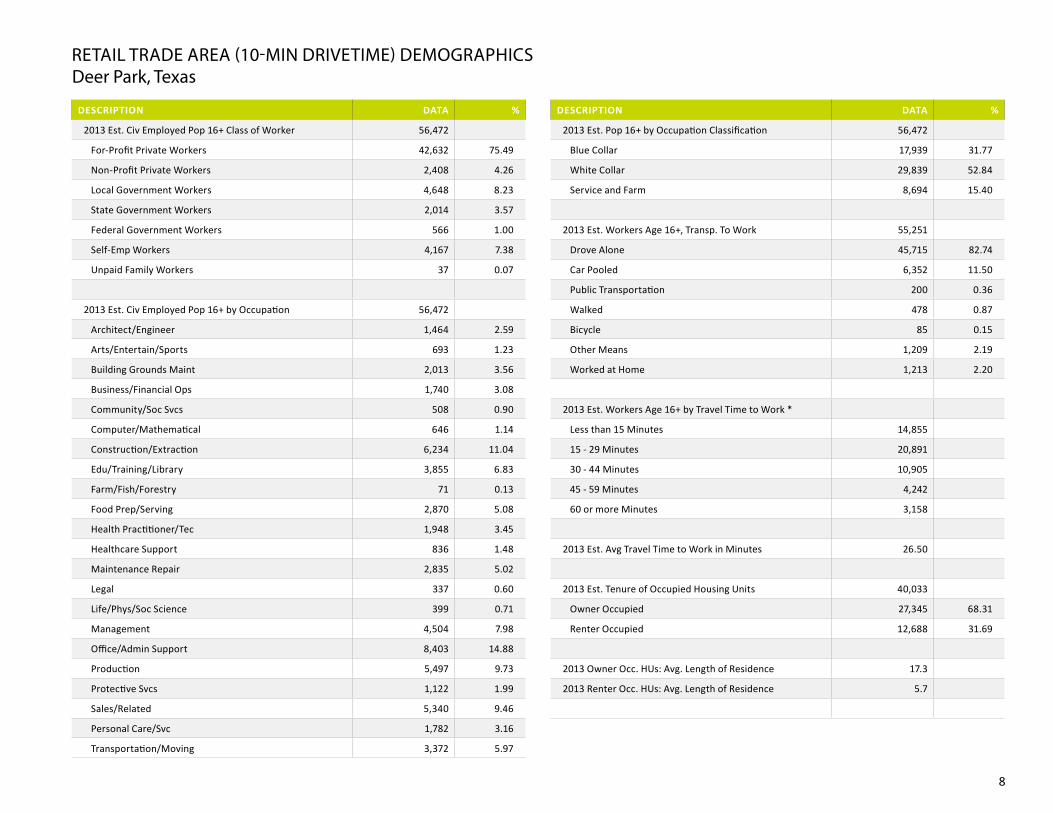
Description Data %
2013 Est. Civ Employed Pop 16+ Class of Worker 56,472
For-Profit Private Workers 42,632 75.49
Non-Profit Private Workers 2,408 4.26
Local Government Workers 4,648 8.23
State Government Workers 2,014 3.57
Federal Government Workers 566 1.00
Self-Emp Workers 4,167 7.38
Unpaid Family Workers 37 0.07
2013 Est. Civ Employed Pop 16+ by Occupation 56,472
Architect/Engineer 1,464 2.59
Arts/Entertain/Sports 693 1.23
Building Grounds Maint 2,013 3.56
Business/Financial Ops 1,740 3.08
Community/Soc Svcs 508 0.90
Computer/Mathematical 646 1.14
Construction/Extraction 6,234 11.04
Edu/Training/Library 3,855 6.83
Farm/Fish/Forestry 71 0.13
Food Prep/Serving 2,870 5.08
Health Practitioner/Tec 1,948 3.45
Healthcare Support 836 1.48
Maintenance Repair 2,835 5.02
Legal 337 0.60
Life/Phys/Soc Science 399 0.71
Management 4,504 7.98
Office/Admin Support 8,403 14.88
Production 5,497 9.73
Protective Svcs 1,122 1.99
Sales/Related 5,340 9.46
Personal Care/Svc 1,782 3.16
Transportation/Moving 3,372 5.97
Description Data %
2013 Est. Pop 16+ by Occupation Classification 56,472
Blue Collar 17,939 31.77
White Collar 29,839 52.84
Service and Farm 8,694 15.40
2013 Est. Workers Age 16+, Transp. To Work 55,251
Drove Alone 45,715 82.74
Car Pooled 6,352 11.50
Public Transportation 200 0.36
Walked 478 0.87
Bicycle 85 0.15
Other Means 1,209 2.19
Worked at Home 1,213 2.20
2013 Est. Workers Age 16+ by Travel Time to Work *
Less than 15 Minutes 14,855
15 - 29 Minutes 20,891
30 - 44 Minutes 10,905
45 - 59 Minutes 4,242
60 or more Minutes 3,158
2013 Est. Avg Travel Time to Work in Minutes 26.50
2013 Est. Tenure of Occupied Housing Units 40,033
Owner Occupied 27,345 68.31
Renter Occupied 12,688 31.69
2013 Owner Occ. HUs: Avg. Length of Residence 17.3
2013 Renter Occ. HUs: Avg. Length of Residence 5.7
Retail tRade aRea (10-Min dRivetiMe) deMogRaphiCsdeer park, texas
9
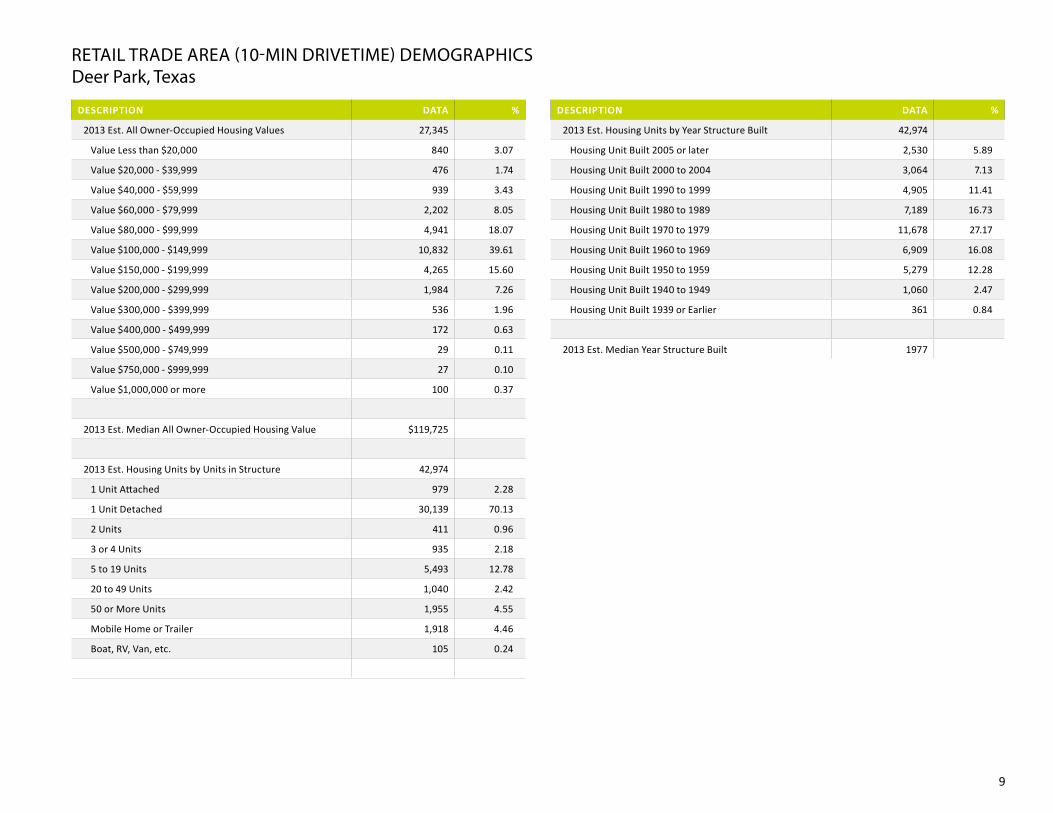
Description Data %
2013 Est. All Owner-Occupied Housing Values 27,345
Value Less than $20,000 840 3.07
Value $20,000 - $39,999 476 1.74
Value $40,000 - $59,999 939 3.43
Value $60,000 - $79,999 2,202 8.05
Value $80,000 - $99,999 4,941 18.07
Value $100,000 - $149,999 10,832 39.61
Value $150,000 - $199,999 4,265 15.60
Value $200,000 - $299,999 1,984 7.26
Value $300,000 - $399,999 536 1.96
Value $400,000 - $499,999 172 0.63
Value $500,000 - $749,999 29 0.11
Value $750,000 - $999,999 27 0.10
Value $1,000,000 or more 100 0.37
2013 Est. Median All Owner-Occupied Housing Value $119,725
2013 Est. Housing Units by Units in Structure 42,974
1 Unit Attached 979 2.28
1 Unit Detached 30,139 70.13
2 Units 411 0.96
3 or 4 Units 935 2.18
5 to 19 Units 5,493 12.78
20 to 49 Units 1,040 2.42
50 or More Units 1,955 4.55
Mobile Home or Trailer 1,918 4.46
Boat, RV, Van, etc. 105 0.24
Description Data %
2013 Est. Housing Units by Year Structure Built 42,974
Housing Unit Built 2005 or later 2,530 5.89
Housing Unit Built 2000 to 2004 3,064 7.13
Housing Unit Built 1990 to 1999 4,905 11.41
Housing Unit Built 1980 to 1989 7,189 16.73
Housing Unit Built 1970 to 1979 11,678 27.17
Housing Unit Built 1960 to 1969 6,909 16.08
Housing Unit Built 1950 to 1959 5,279 12.28
Housing Unit Built 1940 to 1949 1,060 2.47
Housing Unit Built 1939 or Earlier 361 0.84
2013 Est. Median Year Structure Built 1977
Retail tRade aRea (10-Min dRivetiMe) deMogRaphiCsdeer park, texas
10
About The Retail Coach
the Retail Coach, llC, is a national retail analytics and locational intelligence firm that specializes in all aspects of retail market analyses and recruitment, from “macro to micro” trade area assessment to actively recruiting retailers on behalf of our clients.
through its unique Retail:360 process, the Retail Coach offers a dynamic system of products and services that better enable communities to maximize their retail development potential.
Retail:360 Process
Providing more than simple data reports of psychographic and demographic trends, The Retail Coach goes well beyond other retail consulting and market research firms’ offerings by combining current national and statewide demographics and trend data with real-world, “on-the-ground” data gathered through extensive visits within our clients’ communities.
Every community is different, and there is no “one size fits all” retail recruitment solution. Compiling the gathered data into client-tailored information packets that are uniquely designed for, and targeted to, specific retailers and restaurants who meet the community’s needs helps assure our clients that they are receiving the latest and best information for their retail recruitment efforts — all with personal service and coaching guidance that continues beyond the initial project scope and timeline.
Our Retail:360 process assures that communities get timely, accurate and relevant information. Translating that data into the information that retailers need and seek assures our clients even better possibilities for tremendous retail growth and success.
The Retail Coach -It’s not about data. It’s about your success.
The Retail Coach, LLC | P. O. Box 7272 | Tupelo, Mississippi 38802Tel 662.844.2155 | Fax 662.844.2738 | Email [email protected] | Web www.theretailcoach.net
C. Kelly Cofer President & CEO
The Retail Coach, LLC

11
Acknowledgements
The observations, conclusions and recommendations contained in this study are solely those of The Retail Coach, LLC and should not be construed to represent the opinions of others, including its clients, or any other entity prior to such entity’s express approval of this study.
Sources used in completing this study include: infoUSA™, Applied Geographic Solutions, Nielsen 2012/2013, ESRI 2011/2012, U.S. Census Bureau, Economy.com, International Council of Shopping Centers, and/or U.S. Bureau of Labor and Statistics.
To better represent current data, where applicable, portions of estimated actual sales may be calculated using an average sales per square foot model.
Mapping data is provided by MapInfo, Nielsen, ESRI and/or Microsoft Corporation.
All information furnished is from sources deemed reliable and is submitted subject to errors, omissions, change of terms and/or conditions.