
© 2013 Christine E. Baver - Soil and Water Lab: Home...
61
DYNAMIC CONTACT ANGLES AND WETTING FRONT INSTABILITY IN SOILS A Thesis Presented to the Faculty of the Graduate School of Cornell University in Partial Fulfillment of the Requirements for the Degree of Masters of Science by Christine E. Baver January 2013
Transcript of © 2013 Christine E. Baver - Soil and Water Lab: Home...
DYNAMIC CONTACT ANGLES AND WETTING FRONT INSTABILITY IN SOILS
A Thesis
Presented to the Faculty of the Graduate School
of Cornell University
in Partial Fulfillment of the Requirements for the Degree of
Masters of Science
by
Christine E. Baver
January 2013

© 2013 Christine E. Baver
ABSTRACT
Dynamic contact could provide a mechanism for initiating the instability of wetting fronts
and the formation of gravity fingers/columns in porous media. To study those dynamic contact
angles when gravity effects are present, rectangular capillary tubes are used to facilitate the
observation of the complete interface without geometric distortion. Results show that if the
dynamic contact angle minus the static contact angle is used, we obtain good agreement with
previous observations. In addition, we show that in our experiments, unlike previous
observations, contact angles are independent of capillary size. It also points out a way to
calculate the capillary pressure at the wetting front as a function of the flux in the finger and
grain size diameter.
iii
BIOGRAPHICAL SKETCH
Christine was born in Lancaster, PA and grew up in Mercer, PA. In 2009, she completed her
undergraduate studies in physics at Pacific Lutheran University. She became interested in
environmental engineering through a hydrology course during study abroad experience in
Scotland in the Fall of 2007. She gained some experience with environmental engineering
through a summer internship with the US Army Corps of Engineers working with weirs, invasive
species and ArcGIS. In 2009, she enrolled at Cornell University to study environmental
engineering with Tammo Steenhuis.
iv
ACKNOWLEDGEMENTS
I want to thank Tammo Steenhuis, Jean-Yves Parlange for the privilege and opportunity to work
with them and for their continued patience and persistence with me during my studies. I would
also like to thank Cathelijne Stoof for her valuable insight, comments and friendship. Members
of the Soil and Water Lab have been invaluable to me, especially Veronica Morales, Sheila Saia
and Christian Guzman for their presence, suggestions and kindness during the years. I also want
to thank the individuals in the Cornell Wushu Club, Stewart Little Coop and Graduate Christian
Fellowship for giving me countless opportunities to have fun and relax. I would also like to
thank the administrative staff of the Biological and Environmental Engineering Department at
Cornell for their guidance during paperwork and overall encouragement. I also want to thank my
physics professors at Pacific Lutheran University, Bogomil Gerganov, Rich Louie, Steven
Starkovich, Katrina Hay, William Greenwood and Kwong-Tin Tang and classmates at Pacific
Lutheran for introducing me to the world of physics and providing opportunities to pursue
research. I also wish to thank my parents for being my biggest advocate growing up to make
sure I was in regular classrooms and integrated into all of the activities with my peers. I would
like to thank Victor Wang for his endless encouragement and understanding patience. And
finally, I wish to thank Doug Caveney for building the adjustable apparatus and Binational
Agricultural Research and Development Fund (BARD), Project No. IS-3962- 07 for their
financial assistance.

v
TABLE OF CONTENTS
BIOGRAPHICAL SKETCH ............................................................................................. iii
ACKNOWLEDGEMENTS ............................................................................................... iv
LIST OF FIGURES .......................................................................................................... vii
LIST OF TABLES ............................................................................................................. ix
LIST OF SYMBOLS ...........................................................................................................x
SECTION 1 ..........................................................................................................................1
Introduction
SECTION 2 ..........................................................................................................................3
Hoffman’s Shift Factor and Jiang’s equation
SECTION 3 ..........................................................................................................................5
Materials and Methods
SECTION 4 ........................................................................................................................10
Results and Discussion
SECTION 5 ........................................................................................................................16
Conclusion
APPENDIX A ...................................................................................................................18
Cleaning Procedure of Capillary Tubes
APPENDIX B ...................................................................................................................19
Additional Dimensionless Numbers
APPENDIX C ...................................................................................................................21
Static Contact Angle of Glycerin
vi
APPENDIX D ...................................................................................................................22
Brief Mathematical Background
APPENDIX E ...................................................................................................................28
Additional Graphs and Tables
REFERENCES ..................................................................................................................46
vii
LIST OF FIGURES
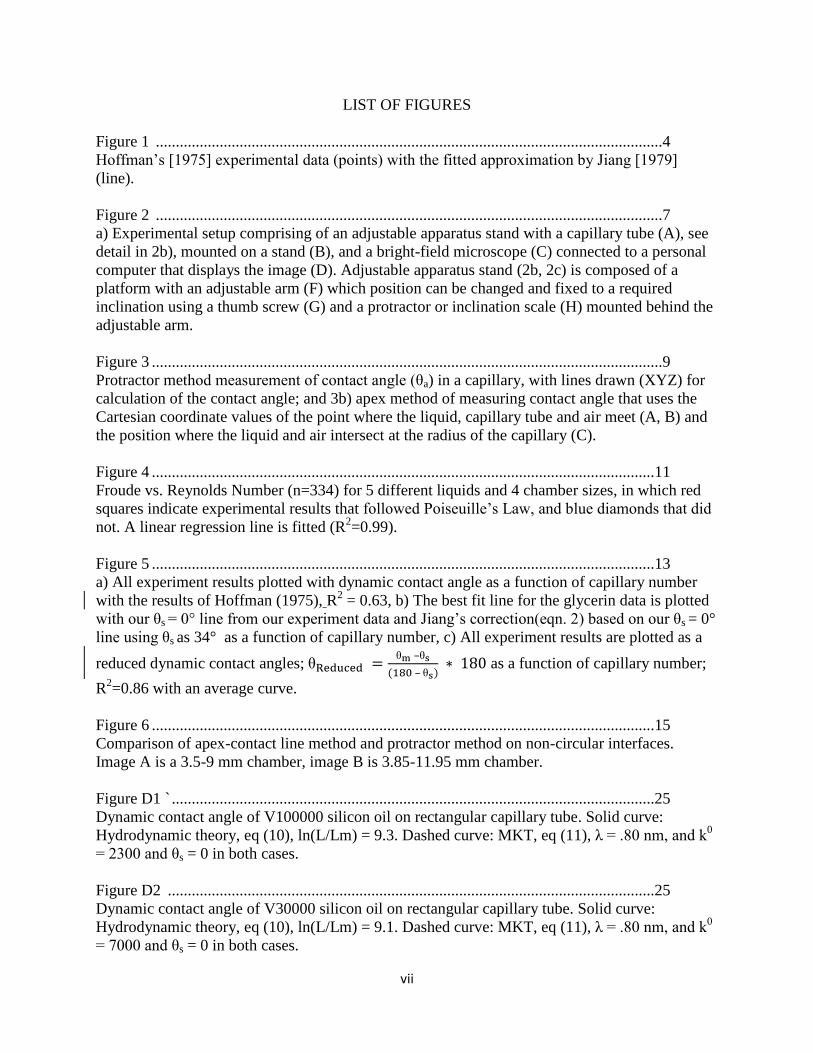
Figure 1 ...............................................................................................................................4
Hoffman’s [1975] experimental data (points) with the fitted approximation by Jiang [1979]
(line).
Figure 2 ...............................................................................................................................7
a) Experimental setup comprising of an adjustable apparatus stand with a capillary tube (A), see
detail in 2b), mounted on a stand (B), and a bright-field microscope (C) connected to a personal
computer that displays the image (D). Adjustable apparatus stand (2b, 2c) is composed of a
platform with an adjustable arm (F) which position can be changed and fixed to a required
inclination using a thumb screw (G) and a protractor or inclination scale (H) mounted behind the
adjustable arm.
Figure 3 ................................................................................................................................9
Protractor method measurement of contact angle (θa) in a capillary, with lines drawn (XYZ) for
calculation of the contact angle; and 3b) apex method of measuring contact angle that uses the
Cartesian coordinate values of the point where the liquid, capillary tube and air meet (A, B) and
the position where the liquid and air intersect at the radius of the capillary (C).
Figure 4 ..............................................................................................................................11
Froude vs. Reynolds Number (n=334) for 5 different liquids and 4 chamber sizes, in which red
squares indicate experimental results that followed Poiseuille’s Law, and blue diamonds that did
not. A linear regression line is fitted (R2=0.99).
Figure 5 ..............................................................................................................................13
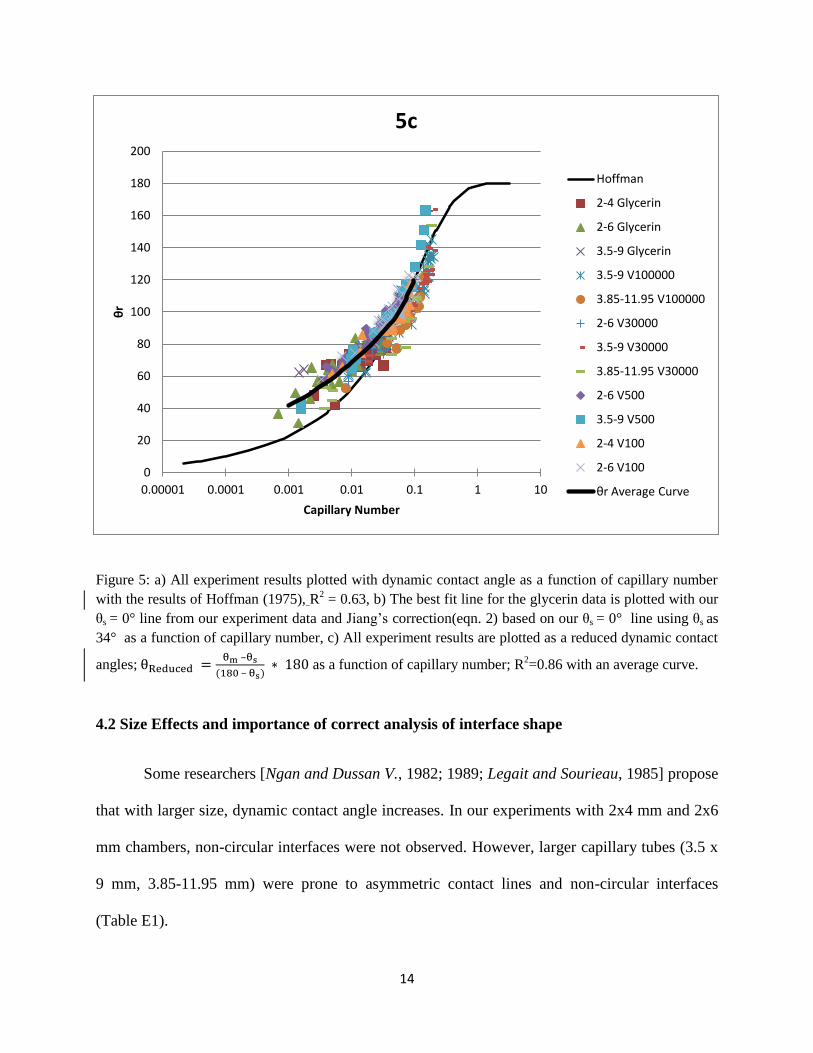
a) All experiment results plotted with dynamic contact angle as a function of capillary number
with the results of Hoffman (1975), R2 = 0.63, b) The best fit line for the glycerin data is plotted
with our θs = 0° line from our experiment data and Jiang’s correction(eqn. 2) based on our θs = 0°
line using θs as 34° as a function of capillary number, c) All experiment results are plotted as a
reduced dynamic contact angles; θ θ –θ
– θ as a function of capillary number;
R2=0.86 with an average curve.
Figure 6 ..............................................................................................................................15
Comparison of apex-contact line method and protractor method on non-circular interfaces.
Image A is a 3.5-9 mm chamber, image B is 3.85-11.95 mm chamber.
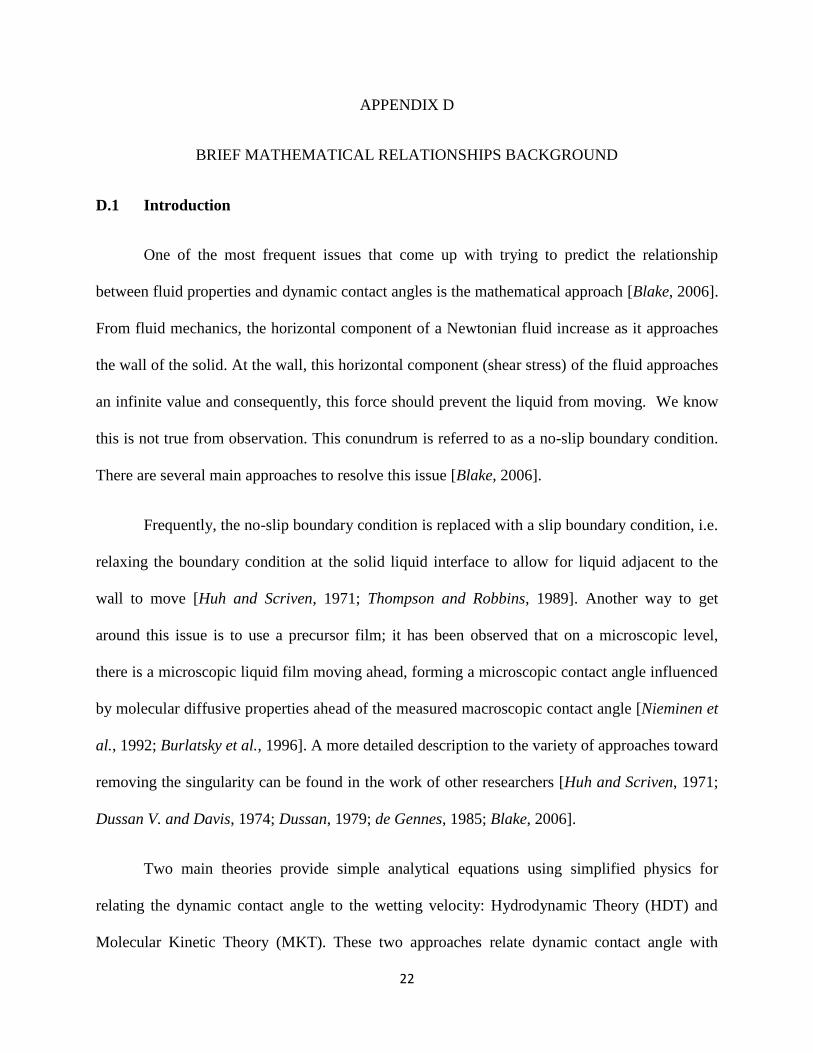
Figure D1 ` .........................................................................................................................25
Dynamic contact angle of V100000 silicon oil on rectangular capillary tube. Solid curve:
Hydrodynamic theory, eq (10), ln(L/Lm) = 9.3. Dashed curve: MKT, eq (11), λ = .80 nm, and k0
= 2300 and θs = 0 in both cases.
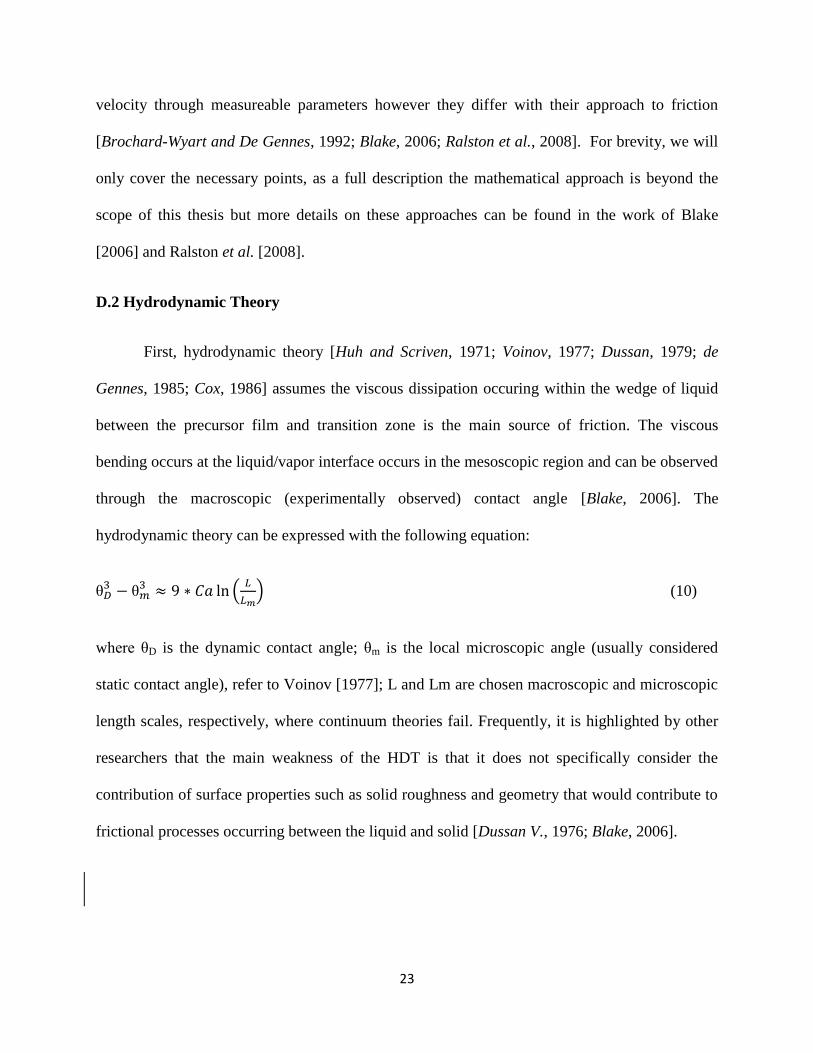
Figure D2 ..........................................................................................................................25
Dynamic contact angle of V30000 silicon oil on rectangular capillary tube. Solid curve:
Hydrodynamic theory, eq (10), ln(L/Lm) = 9.1. Dashed curve: MKT, eq (11), λ = .80 nm, and k0
= 7000 and θs = 0 in both cases.
viii
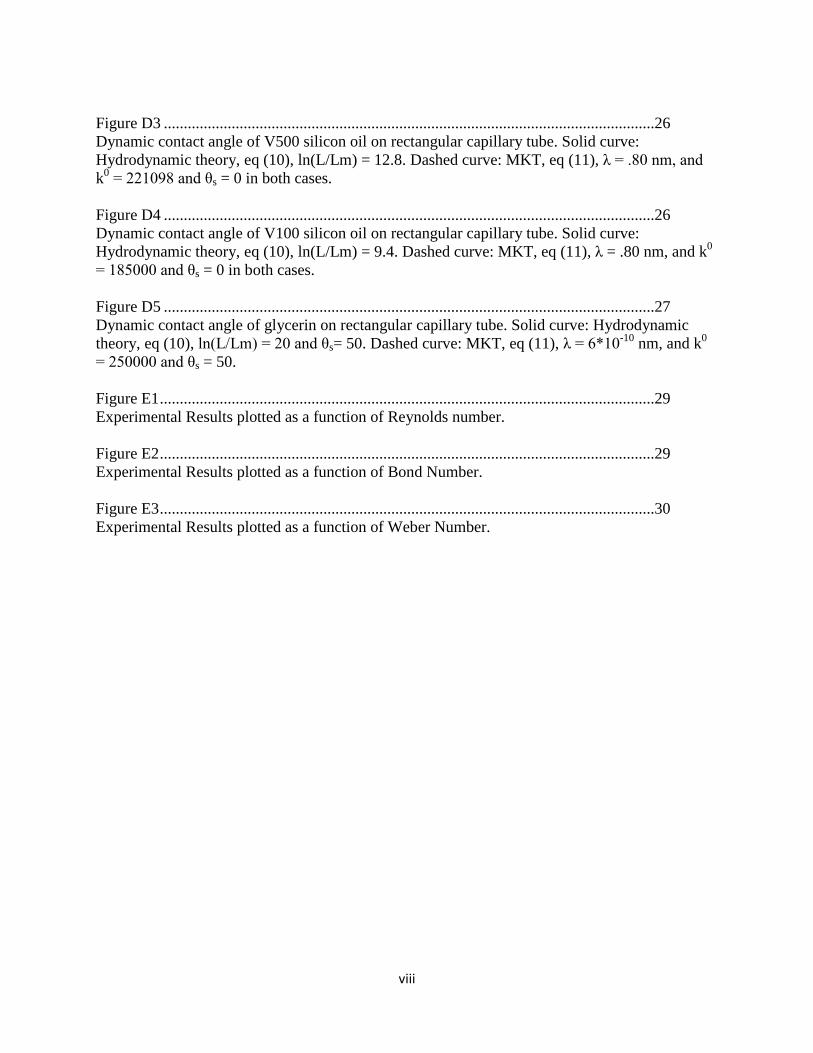
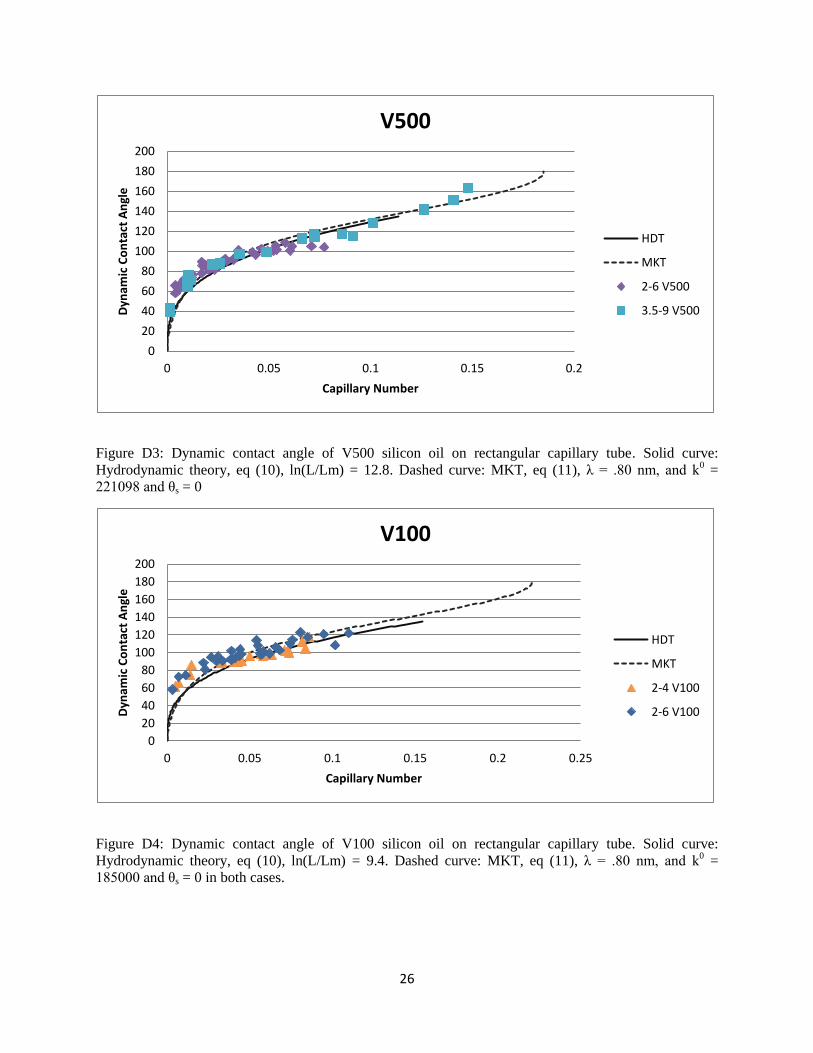
Figure D3 ...........................................................................................................................26
Dynamic contact angle of V500 silicon oil on rectangular capillary tube. Solid curve:
Hydrodynamic theory, eq (10), ln(L/Lm) = 12.8. Dashed curve: MKT, eq (11), λ = .80 nm, and
k0 = 221098 and θs = 0 in both cases.
Figure D4 ...........................................................................................................................26
Dynamic contact angle of V100 silicon oil on rectangular capillary tube. Solid curve:
Hydrodynamic theory, eq (10), ln(L/Lm) = 9.4. Dashed curve: MKT, eq (11), λ = .80 nm, and k0
= 185000 and θs = 0 in both cases.
Figure D5 ...........................................................................................................................27
Dynamic contact angle of glycerin on rectangular capillary tube. Solid curve: Hydrodynamic
theory, eq (10), ln(L/Lm) = 20 and θs= 50. Dashed curve: MKT, eq (11), λ = 6*10-10
nm, and k0
= 250000 and θs = 50.
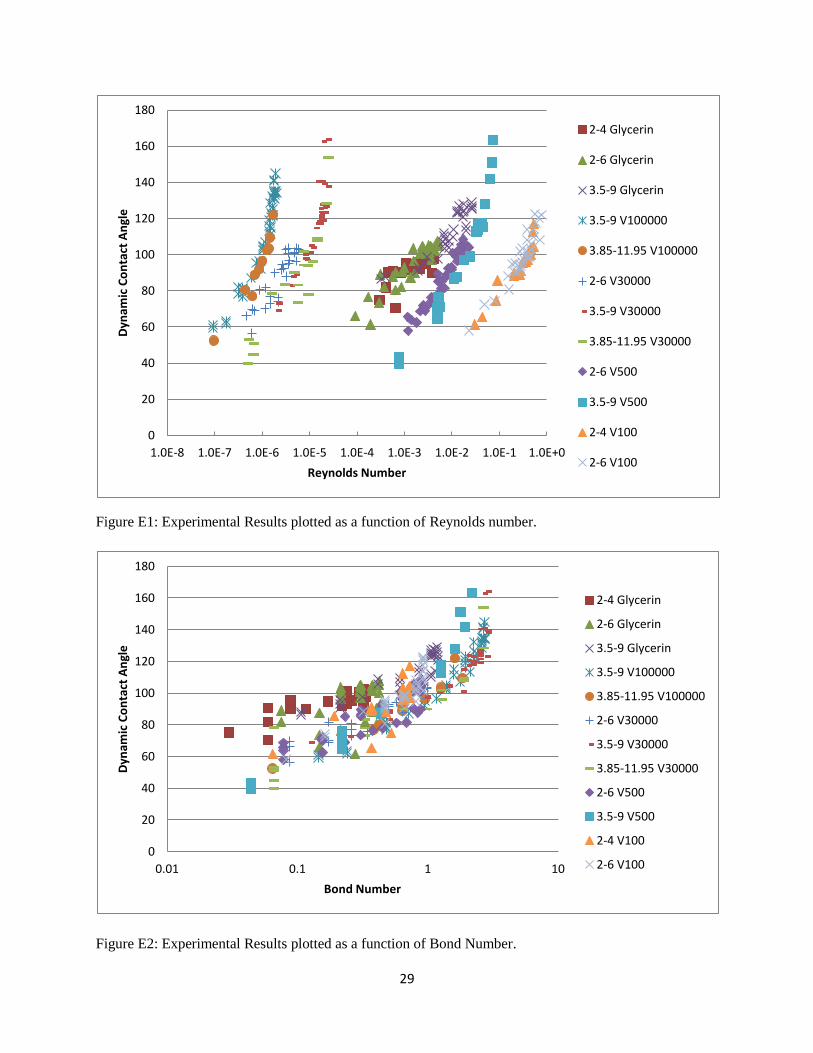
Figure E1 ............................................................................................................................29
Experimental Results plotted as a function of Reynolds number.
Figure E2 ............................................................................................................................29
Experimental Results plotted as a function of Bond Number.
Figure E3 ............................................................................................................................30
Experimental Results plotted as a function of Weber Number.
ix
LIST OF TABLES
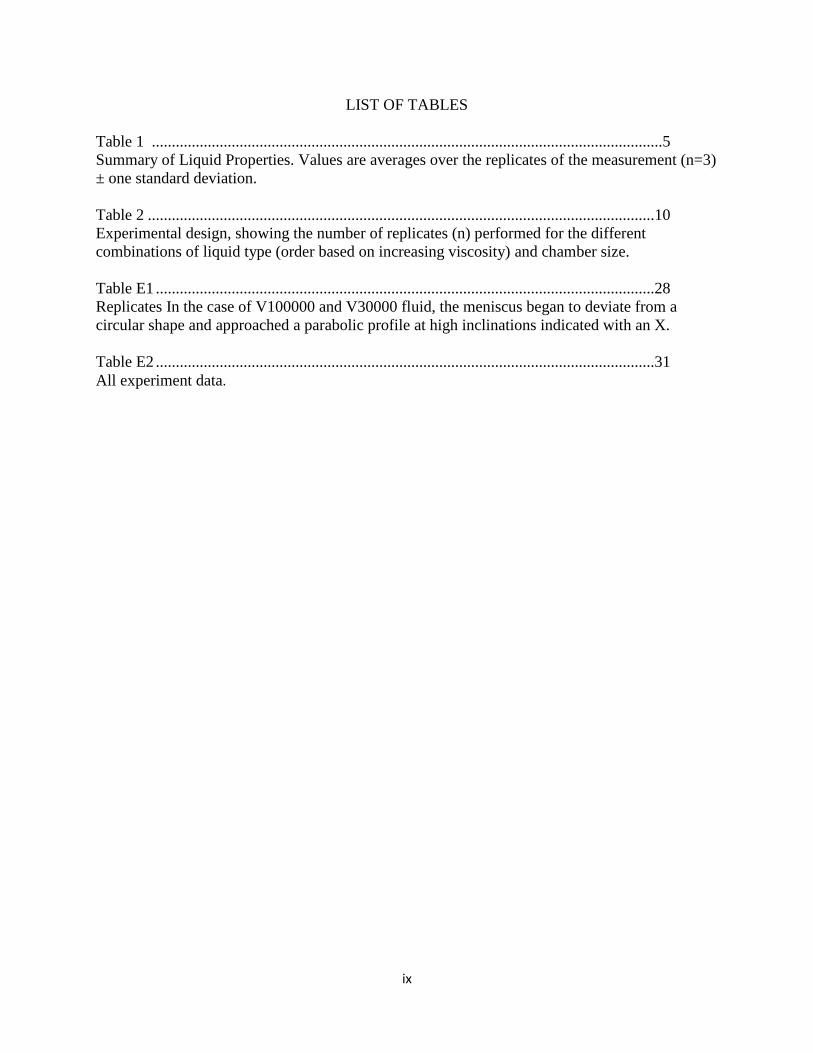
Table 1 ................................................................................................................................5
Summary of Liquid Properties. Values are averages over the replicates of the measurement (n=3)
± one standard deviation.
Table 2 ...............................................................................................................................10
Experimental design, showing the number of replicates (n) performed for the different
combinations of liquid type (order based on increasing viscosity) and chamber size.
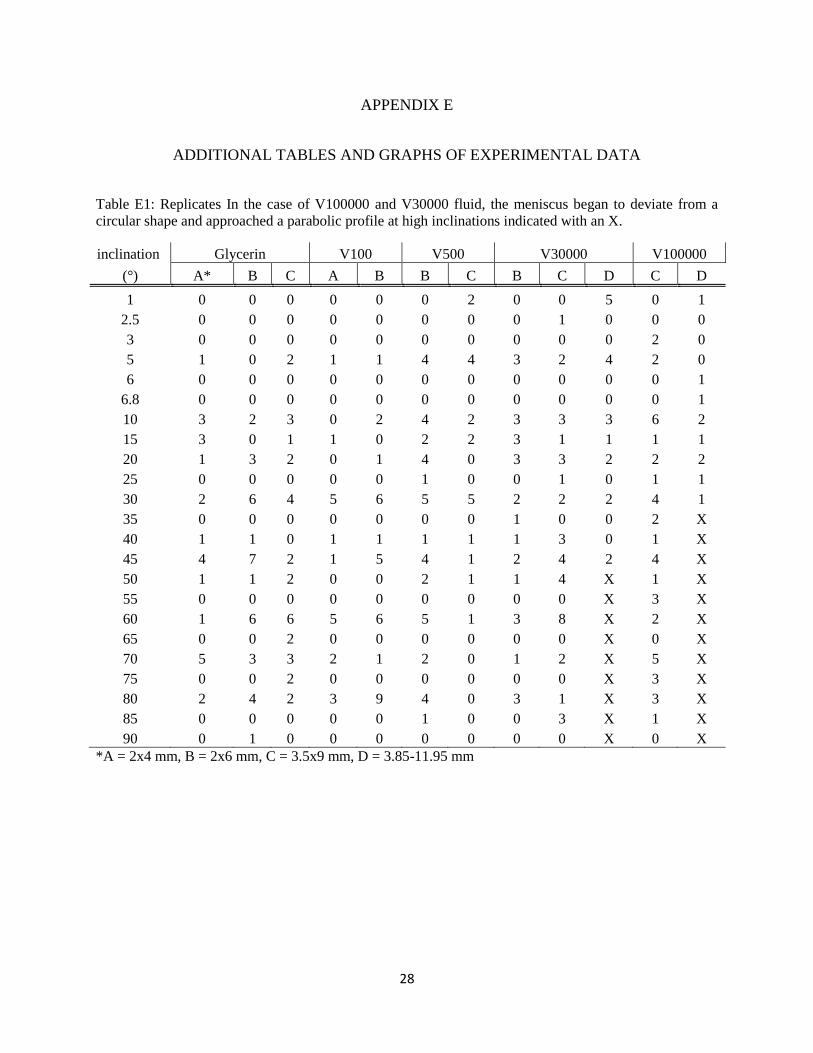
Table E1 .............................................................................................................................28
Replicates In the case of V100000 and V30000 fluid, the meniscus began to deviate from a
circular shape and approached a parabolic profile at high inclinations indicated with an X.
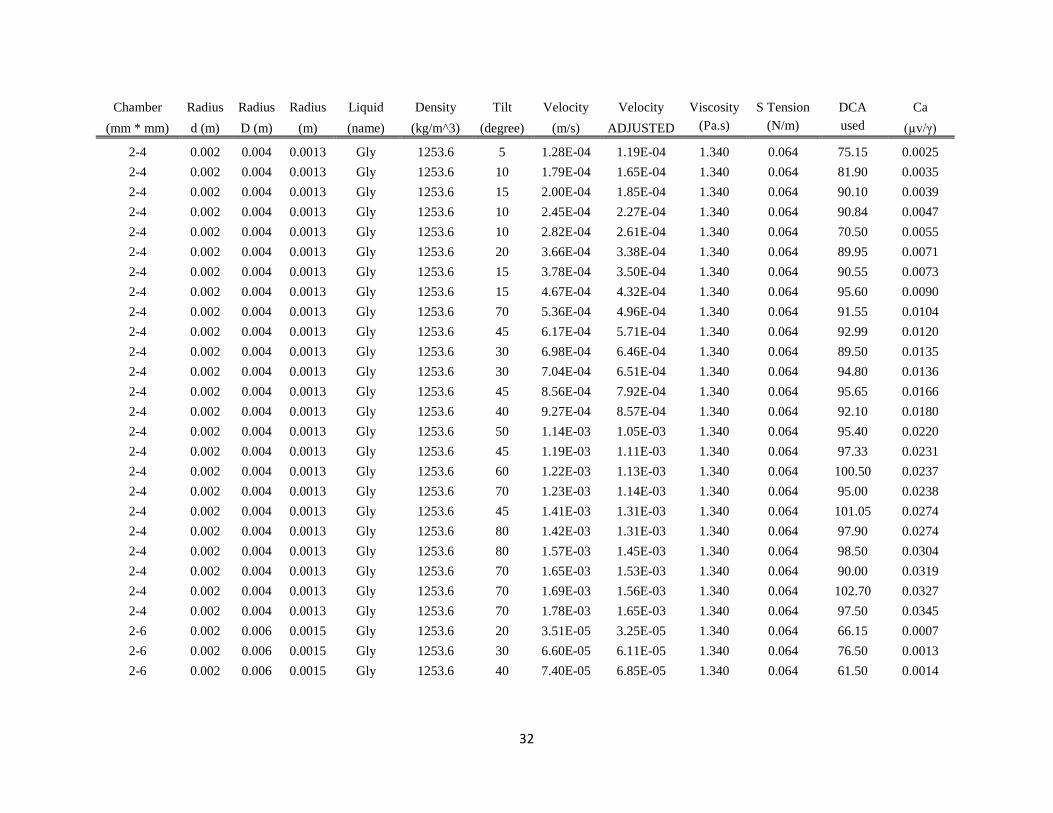
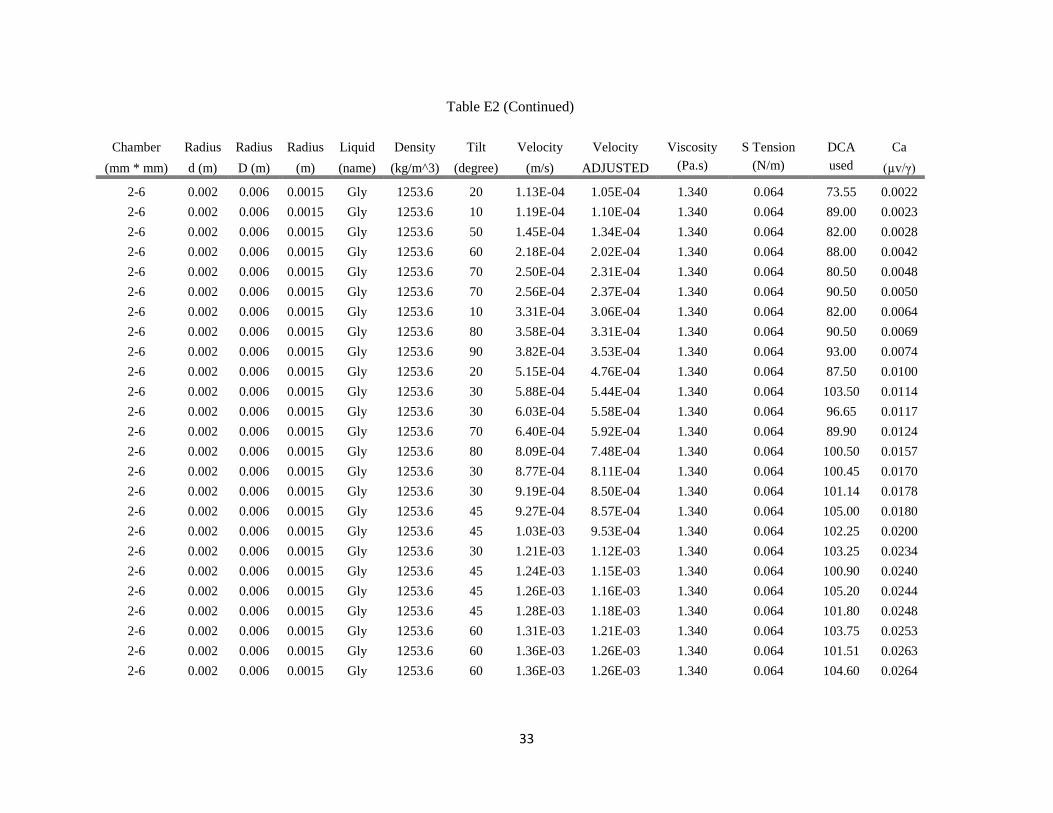
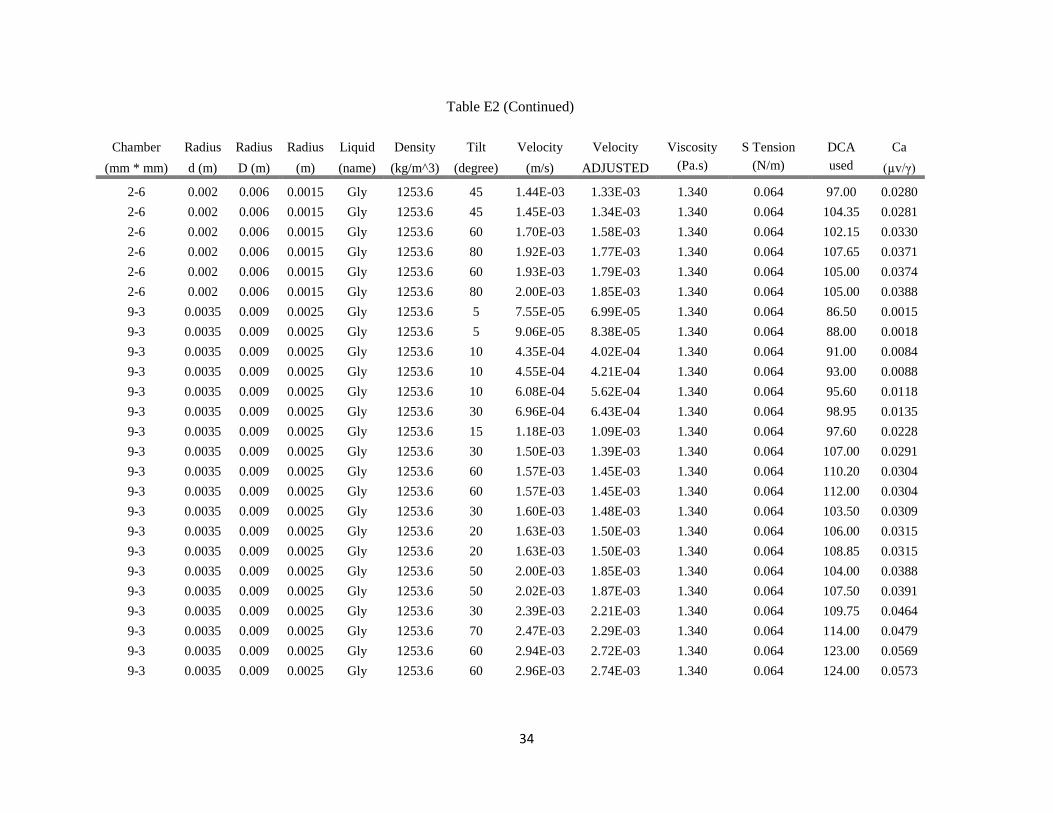
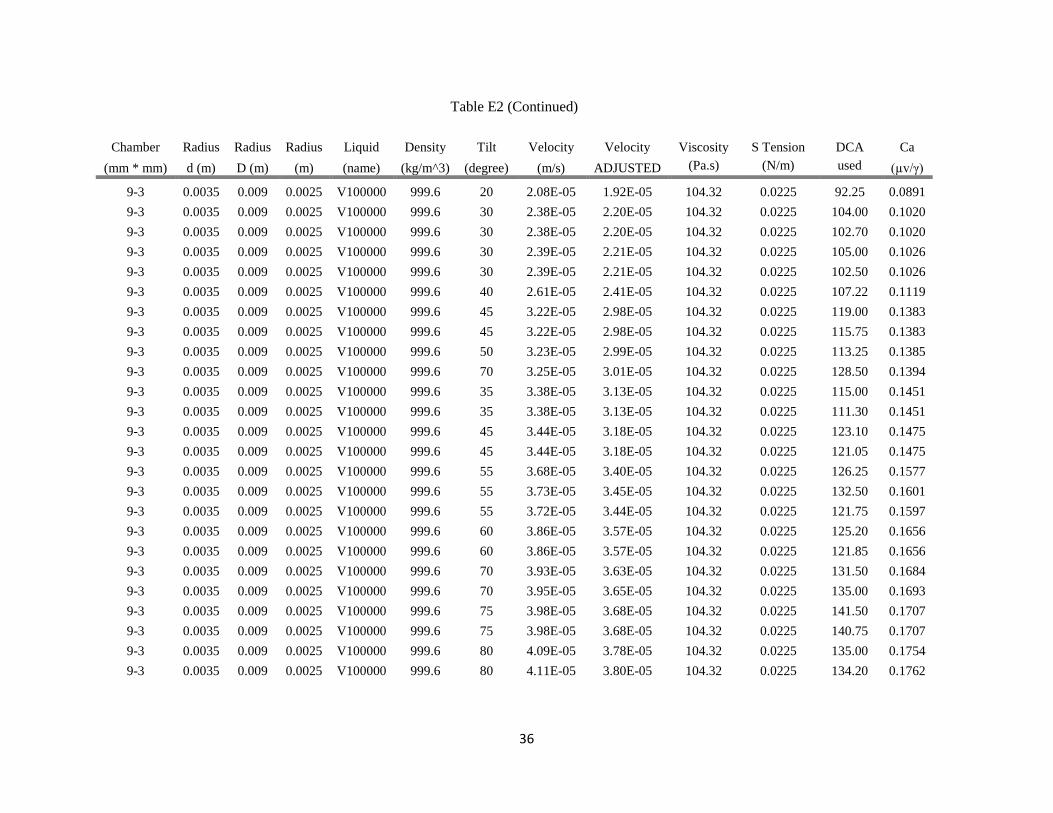
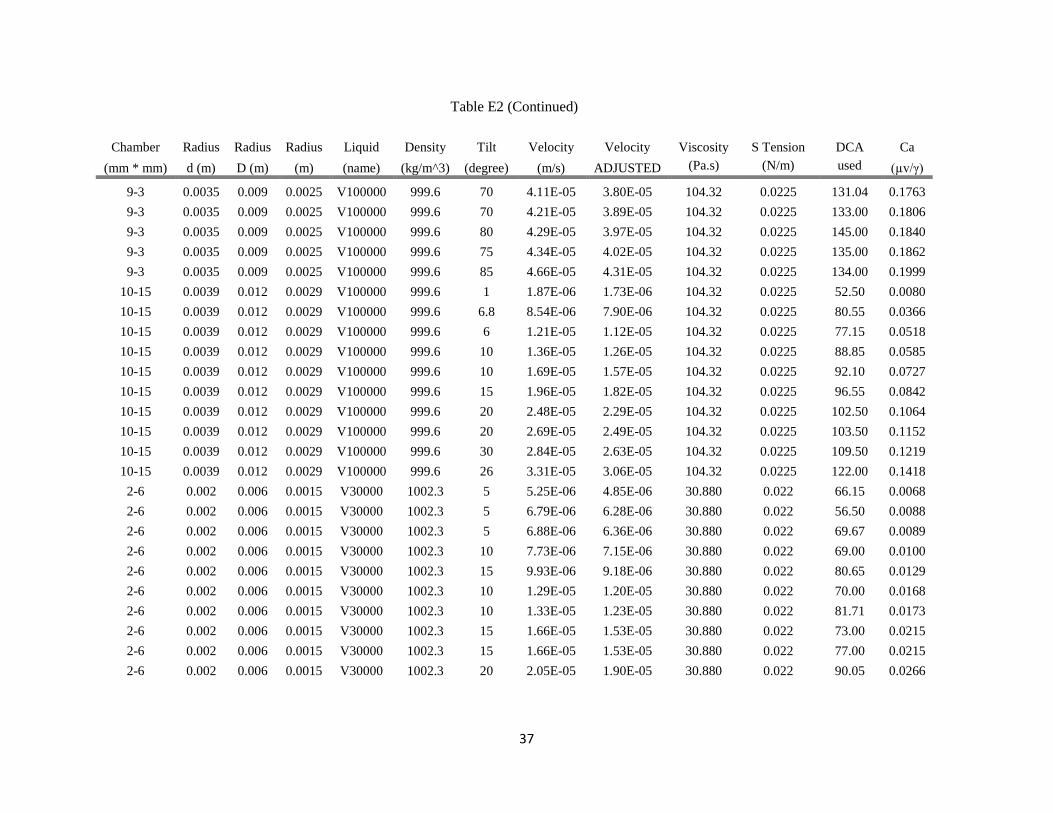
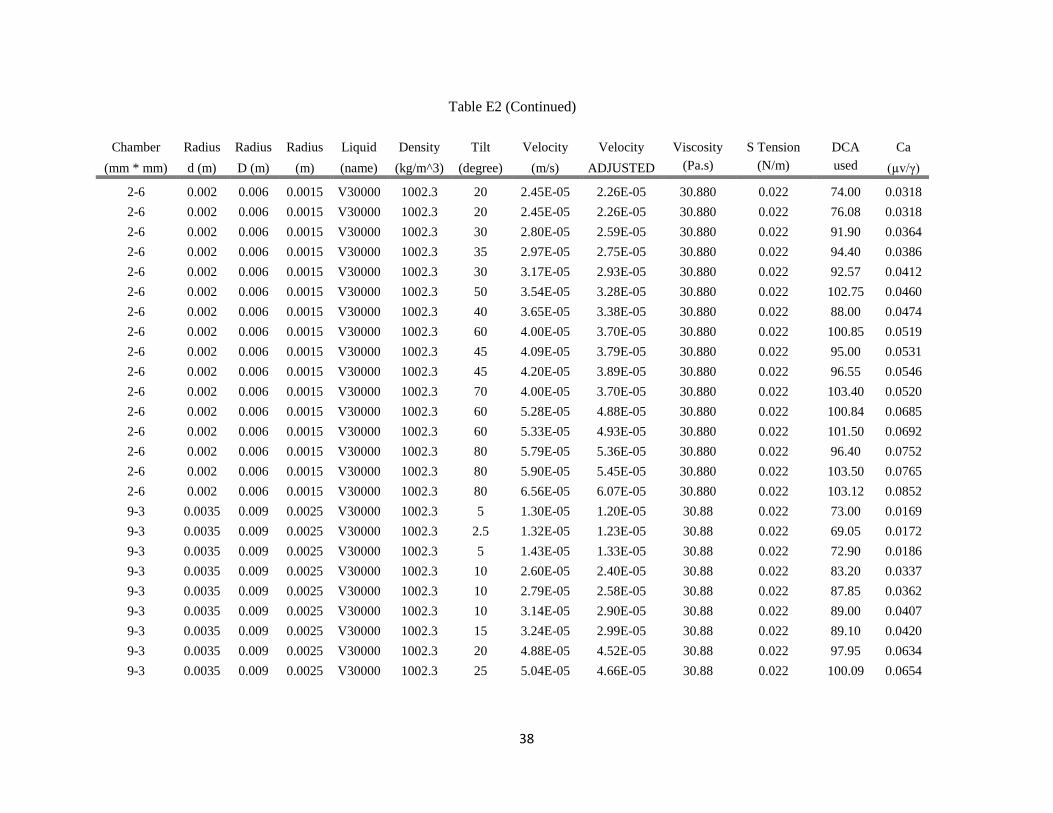
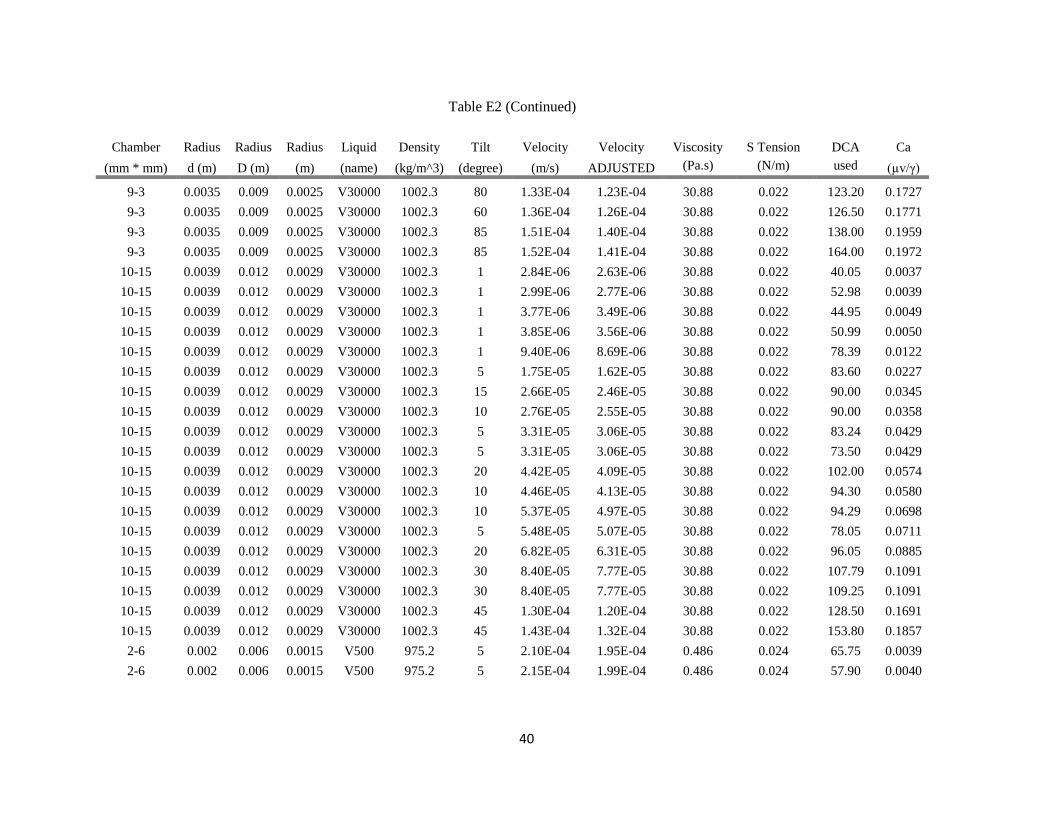
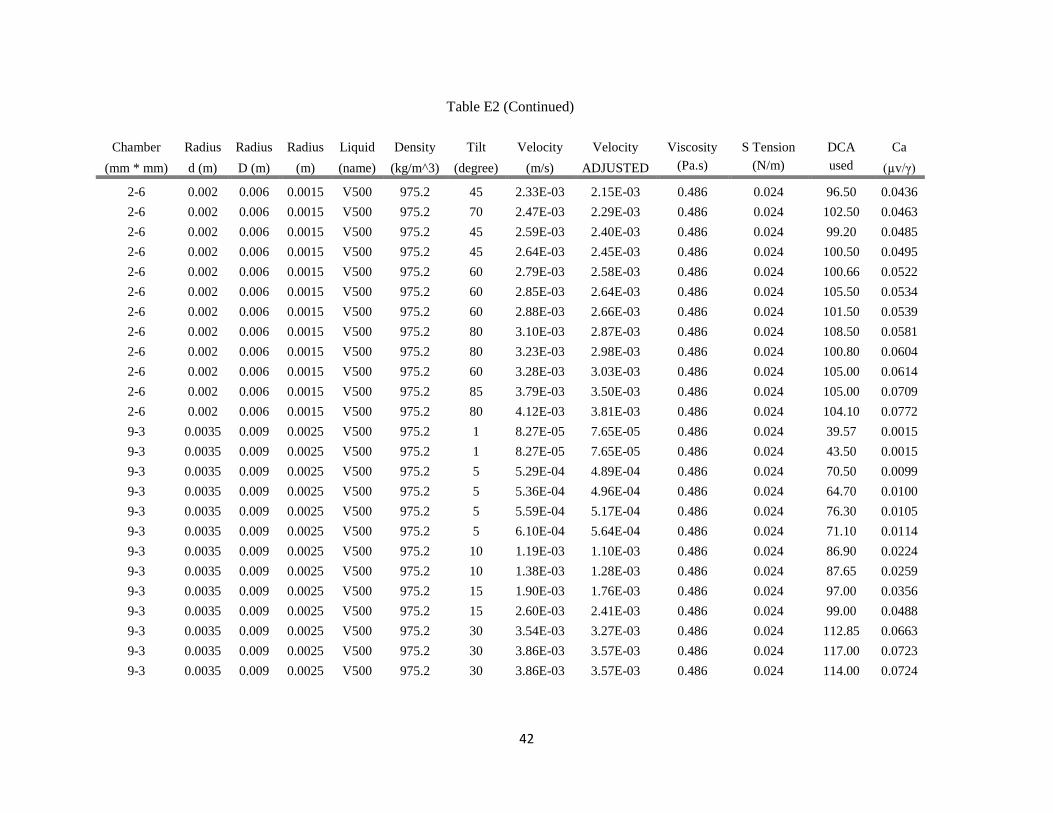
Table E2 .............................................................................................................................31
All experiment data.
x
LIST OF SYMBOLS
μ viscosity of the liquid Pa*s
v contact line velocity m/s
γ surface or interfacial tension N/m
ρ density of the fluid g/ml
r characteristic length (radius) m
g gravitational acceleration m/s2
θD dynamic contact angle degrees
θs static contact angle degrees
l characteristic length m
L macroscopic length scale micrometers
Lm microscopic length scales micrometers
k0 equilibrium frequency of the random 1/s
molecular displacements occurring within
three phase zone
λ average distance of each displacement nm
kB Boltzmann’s constant m2kg/s
2K
T temperature Kelvin
1
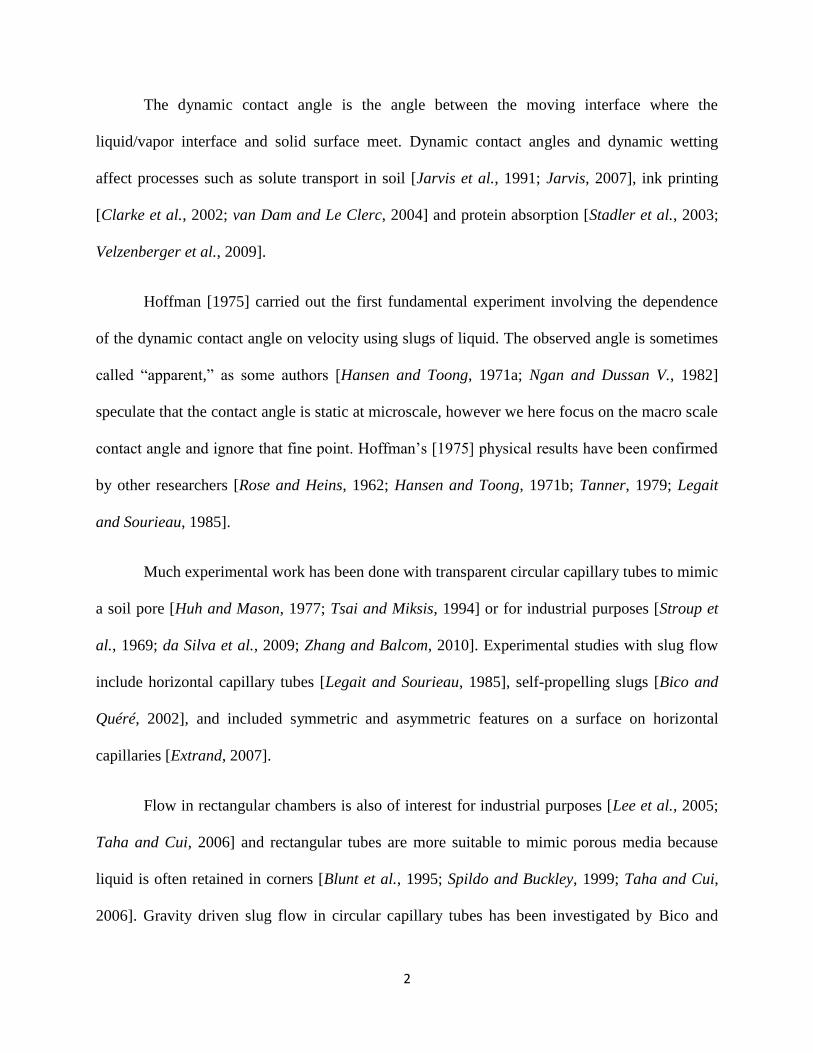
1. Introduction
While many experiments have been conducted to study unstable flow, questions remain.
Early research by Saffman and Taylor [1958] and Chuoke et al. [1959] primarily focused on
viscous fingering. Later field observations by Bond [1964] and experiments of Hill and Parlange
[1972] focused on gravity fingering, or column flow, where viscosity is less important; see also
the observations of Raats [1973]. Column flows are the most prevalent mechanism in nature to
rapidly transport large quantities of water downward, bypassing most of the soil matrix [Starr et
al., 1978]. The main difficulty in understanding column flow is that moisture content within
these columns is not uniformly distributed (columns are wetter at the tip) and that the wetting
takes place within only a few pores. Because Richards’ equation assumes that changes take place
over the Darcy scale, it cannot be used reliably to estimate derivatives on these short pore-scale
distances. Trying to correct Richards’ equation by adding higher order derivatives as is
sometimes considered cannot improve the validity of the equation. Even though Richards’
equation cannot be used to analyze processes occurring at the tip of the wetting front, it
adequately describes the structure of column flow far enough from the tip. For instance, the
decreasing water content with the distance from the tip [Selker et al., 1992] and the width of the
column flow [Parlange and Hill, 1976] can both be obtained with Richards’ equation. While
Parlange and Hill [1976] originally assumed that the tip of the column was saturated, this is
neither true in general nor necessary [Hillel and Baker, 1988; Liu et al., 1995]. An accepted
theory to predict the water content at the tip does not exist and therefore in many applications the
experimentally observed moisture content is used [Liu et al., 1995; Aminzadeh et al., 2011]. We
pose that a dynamic contact angle greater than the static contact angle, could provide an
explanation for the different observed moisture contents at the wetting front.
2
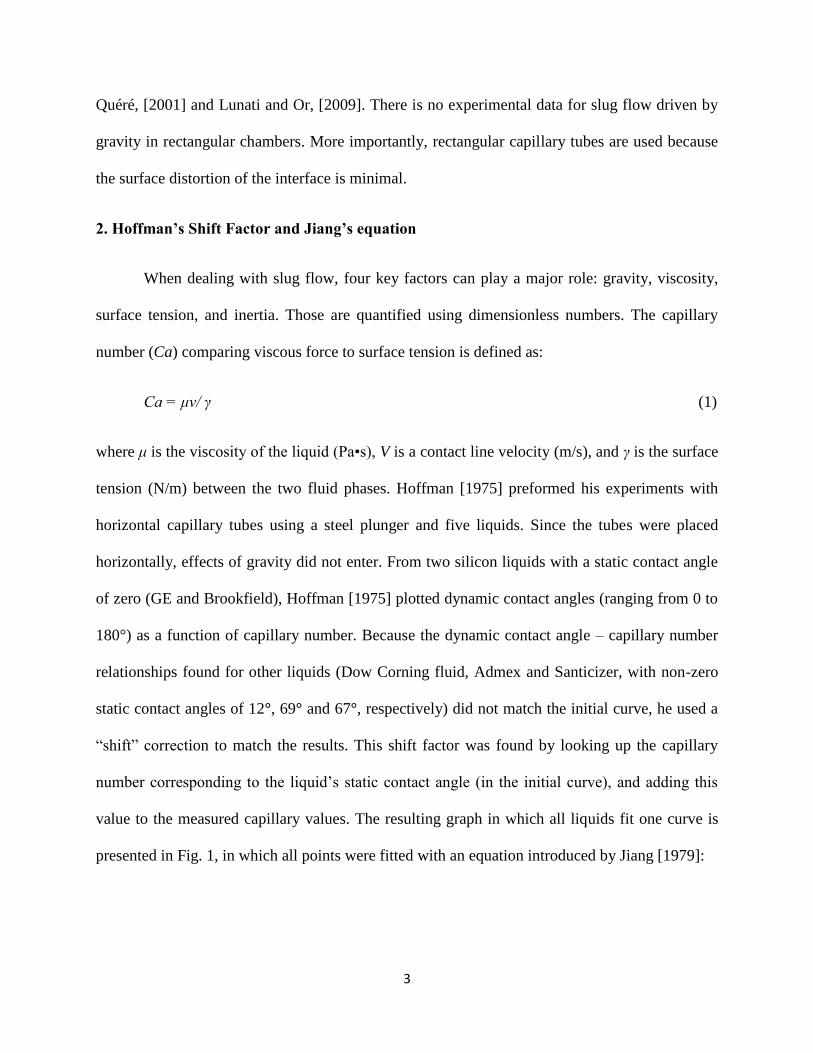
The dynamic contact angle is the angle between the moving interface where the
liquid/vapor interface and solid surface meet. Dynamic contact angles and dynamic wetting
affect processes such as solute transport in soil [Jarvis et al., 1991; Jarvis, 2007], ink printing
[Clarke et al., 2002; van Dam and Le Clerc, 2004] and protein absorption [Stadler et al., 2003;
Velzenberger et al., 2009].
Hoffman [1975] carried out the first fundamental experiment involving the dependence
of the dynamic contact angle on velocity using slugs of liquid. The observed angle is sometimes
called “apparent,” as some authors [Hansen and Toong, 1971a; Ngan and Dussan V., 1982]
speculate that the contact angle is static at microscale, however we here focus on the macro scale
contact angle and ignore that fine point. Hoffman’s [1975] physical results have been confirmed
by other researchers [Rose and Heins, 1962; Hansen and Toong, 1971b; Tanner, 1979; Legait
and Sourieau, 1985].
Much experimental work has been done with transparent circular capillary tubes to mimic
a soil pore [Huh and Mason, 1977; Tsai and Miksis, 1994] or for industrial purposes [Stroup et
al., 1969; da Silva et al., 2009; Zhang and Balcom, 2010]. Experimental studies with slug flow
include horizontal capillary tubes [Legait and Sourieau, 1985], self-propelling slugs [Bico and
Quéré, 2002], and included symmetric and asymmetric features on a surface on horizontal
capillaries [Extrand, 2007].
Flow in rectangular chambers is also of interest for industrial purposes [Lee et al., 2005;
Taha and Cui, 2006] and rectangular tubes are more suitable to mimic porous media because
liquid is often retained in corners [Blunt et al., 1995; Spildo and Buckley, 1999; Taha and Cui,
2006]. Gravity driven slug flow in circular capillary tubes has been investigated by Bico and
3
Quéré, [2001] and Lunati and Or, [2009]. There is no experimental data for slug flow driven by
gravity in rectangular chambers. More importantly, rectangular capillary tubes are used because
the surface distortion of the interface is minimal.
2. Hoffman’s Shift Factor and Jiang’s equation
When dealing with slug flow, four key factors can play a major role: gravity, viscosity,
surface tension, and inertia. Those are quantified using dimensionless numbers. The capillary
number (Ca) comparing viscous force to surface tension is defined as:
Ca = μv/ γ (1)
where μ is the viscosity of the liquid (Pa•s), V is a contact line velocity (m/s), and γ is the surface
tension (N/m) between the two fluid phases. Hoffman [1975] preformed his experiments with
horizontal capillary tubes using a steel plunger and five liquids. Since the tubes were placed
horizontally, effects of gravity did not enter. From two silicon liquids with a static contact angle
of zero (GE and Brookfield), Hoffman [1975] plotted dynamic contact angles (ranging from 0 to
180°) as a function of capillary number. Because the dynamic contact angle – capillary number
relationships found for other liquids (Dow Corning fluid, Admex and Santicizer, with non-zero
static contact angles of 12°, 69° and 67°, respectively) did not match the initial curve, he used a
“shift” correction to match the results. This shift factor was found by looking up the capillary
number corresponding to the liquid’s static contact angle (in the initial curve), and adding this
value to the measured capillary values. The resulting graph in which all liquids fit one curve is
presented in Fig. 1, in which all points were fitted with an equation introduced by Jiang [1979]:
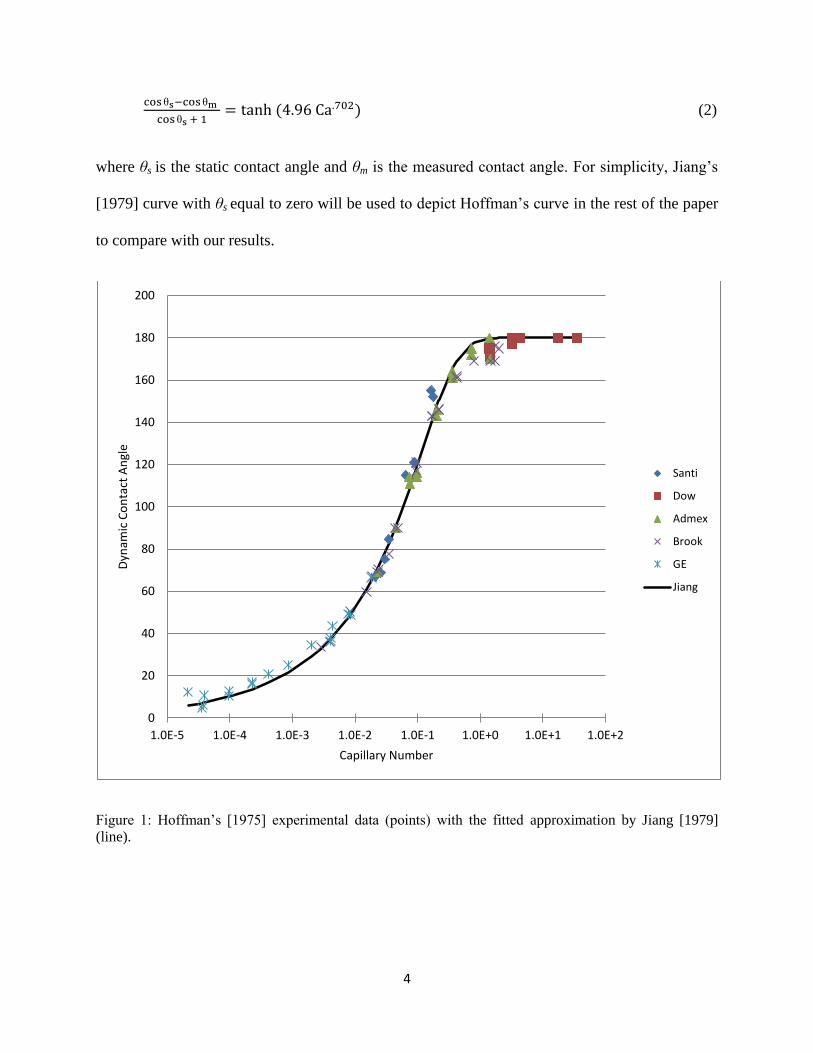
4
θ θ
θ (2)
where θs is the static contact angle and θm is the measured contact angle. For simplicity, Jiang’s
[1979] curve with θs equal to zero will be used to depict Hoffman’s curve in the rest of the paper
to compare with our results.
Figure 1: Hoffman’s [1975] experimental data (points) with the fitted approximation by Jiang [1979]
(line).
0
20
40
60
80
100
120
140
160
180
200
1.0E-5 1.0E-4 1.0E-3 1.0E-2 1.0E-1 1.0E+0 1.0E+1 1.0E+2
Dyn
amic
Co
nta
ct A
ngl
e
Capillary Number
Santi
Dow
Admex
Brook
GE
Jiang
5
3. Materials and Methods
3.1 Materials
We have performed experiments with glycerin and different silicon liquids of variable
viscosity in different size rectangular capillary tubes. The rectangular tubes used in these
experiments were 20-60 cm long rectangular borosilicate glass tubes (Friedrich & Dimmock Inc.,
Millville, NJ, USA) of four different dimensions: 2 x 4 mm, 2 x 6 mm, 3.5 x 9 mm, and 3.85 x
11.95 mm. Five liquids were tested: four silicones (Brookfield Engineering Laboratories Inc.,
Middleboro, MA, USA) selected to cover a range of viscosities, and glycerol (Mallinckrodt,
Paris, KY, USA) (Table 1). The static contact angle of the silicon liquids was 0 degrees in
agreement with Hoffman [1975] and Fermigier and Jenffer [1991]. The static contact angle of
glycerin was measured to be 34 degrees following the static sessile drop/goniometer method
[Shang et al., 2008].
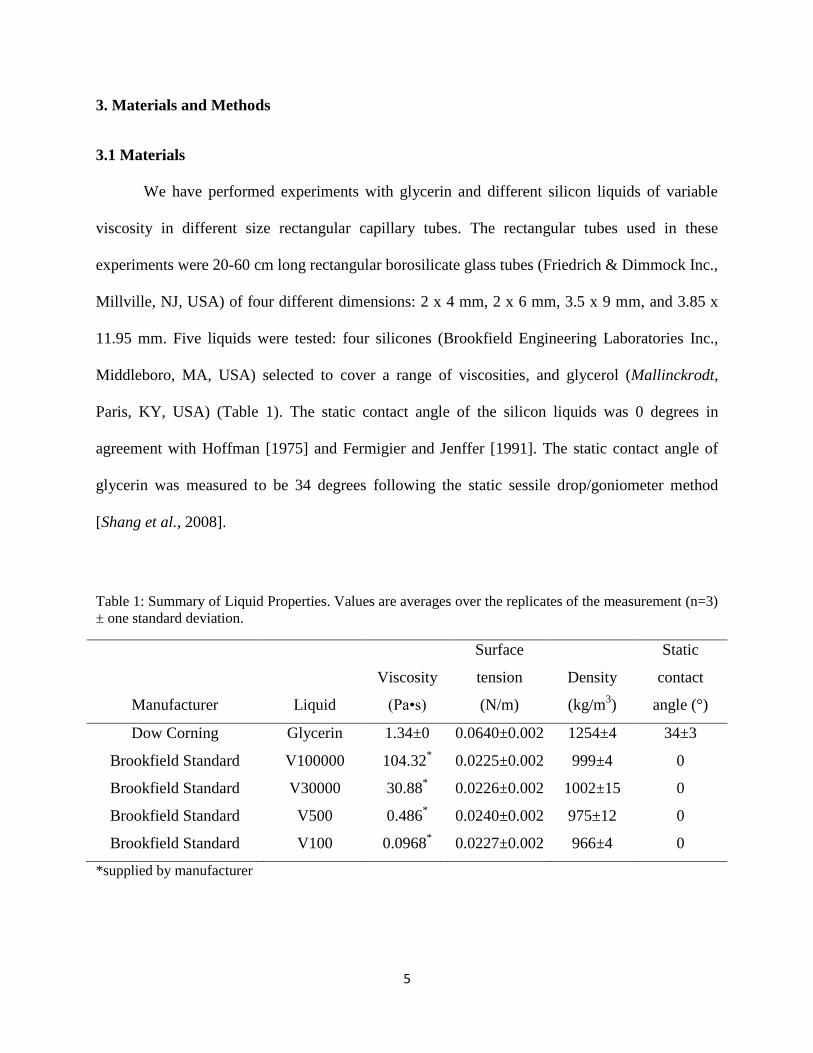
Table 1: Summary of Liquid Properties. Values are averages over the replicates of the measurement (n=3)
± one standard deviation.
Manufacturer Liquid
Viscosity
(Pa•s)
Surface
tension
(N/m)
Density
(kg/m3)
Static
contact
angle (°)
Dow Corning Glycerin 1.34±0
0.0640±0.002 1254±4 34±3
Brookfield Standard V100000 104.32*
0.0225±0.002 999±4 0
Brookfield Standard V30000 30.88*
0.0226±0.002 1002±15 0
Brookfield Standard V500 0.486*
0.0240±0.002 975±12 0
Brookfield Standard V100 0.0968*
0.0227±0.002 966±4 0
*supplied by manufacturer

6
Viscosity was measured with a SV-10 Vibro Viscometer (Worcestershire, UK); surface
tension was measured with a Fisher Surface Tensiomat (Model 21, Fisher Scientific, Pittsburgh,
PA, USA) and fluid density was measured by weighing a known volume of liquid.
3.2 Experimental setup
The shape of the moving interface was captured through a Hirox-Digital KH-7700 bright
field microscope (Hirox-USA, River Edge, NJ, USA) mounted with a MX-5040SZ Mid-Range
Straight Zoom lens and AD-5040LOWRS Low Magnification Rotary-Head adaptor, and
connected to a personal computer (Fig. 2a). Because the microscope had a maximum recording
speed of 30 frames/sec, the greatest fluid velocity that could be captured was ~1 cm/s. Results
were obtained by using recording speeds between 30 frames/sec and 20 frames/min. To vary the
strength of gravitational force, a platform with an adjustable apparatus was designed to support
capillary tubes at different specific inclinations (Fig. 2b). A built-in protractor, made of thick
transparent acrylic, allowed the apparatus to be adjusted for inclination values between 0° and
90°, while a small white piece of paper placed on the apparatus arm provided a white
background and reduced light reflection or image distortion from the acrylic material. The setup
was designed such that air could move freely and unobstructed at both ends of the capillary and
the apparatus was secured using a thumb screw and stage clips. To allow for microscope images
be taken at a 90° angle with the capillary, the microscope was tilted to offset the inclination of
the capillary tube (Fig. 2c).
7
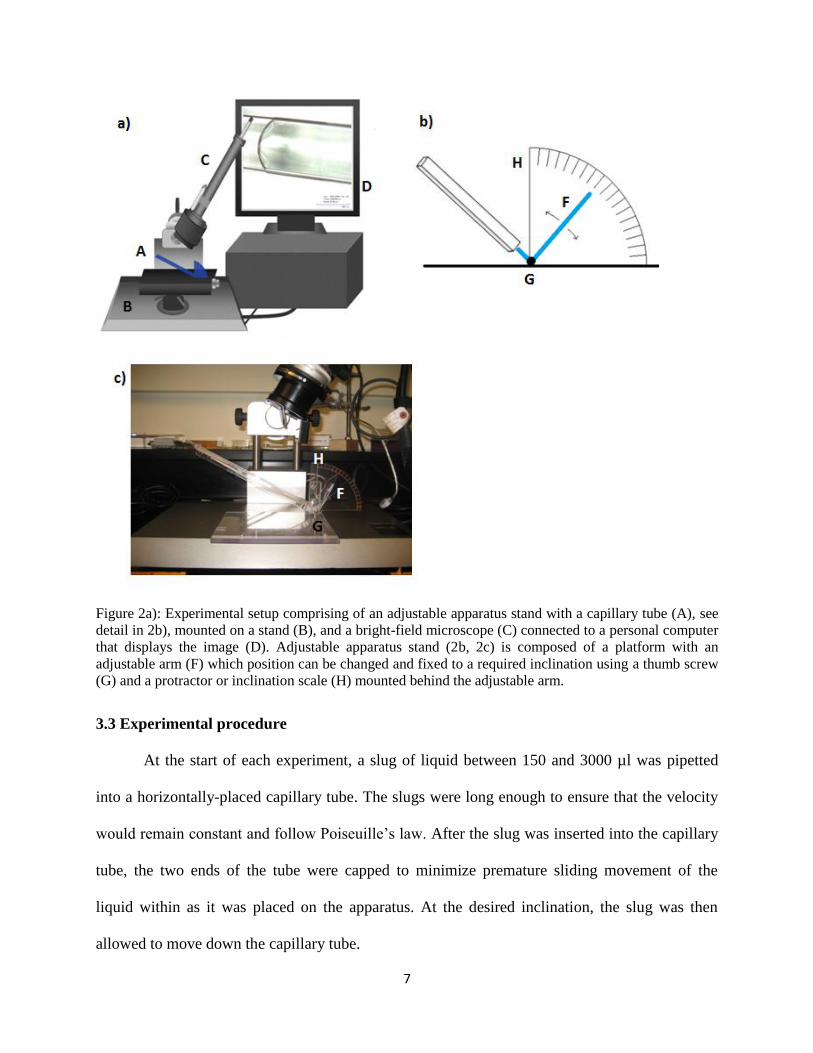
Figure 2a): Experimental setup comprising of an adjustable apparatus stand with a capillary tube (A), see
detail in 2b), mounted on a stand (B), and a bright-field microscope (C) connected to a personal computer
that displays the image (D). Adjustable apparatus stand (2b, 2c) is composed of a platform with an
adjustable arm (F) which position can be changed and fixed to a required inclination using a thumb screw
(G) and a protractor or inclination scale (H) mounted behind the adjustable arm.
3.3 Experimental procedure
At the start of each experiment, a slug of liquid between 150 and 3000 µl was pipetted
into a horizontally-placed capillary tube. The slugs were long enough to ensure that the velocity
would remain constant and follow Poiseuille’s law. After the slug was inserted into the capillary
tube, the two ends of the tube were capped to minimize premature sliding movement of the
liquid within as it was placed on the apparatus. At the desired inclination, the slug was then
allowed to move down the capillary tube.
8
After the initial transition period, when the wetting front had traveled 2-5 cm down the
tube and velocity became constant, images were taken for contact angle and velocity analysis.
Capillary tubes were cleaned between runs and used multiple times throughout the experiment.
The cleaning procedure can be found in the appendix.
3.4 Image analysis
Velocity and dynamic contact angle was determined using ImageJ (US National Institute
of Mental Health), a Java based image processing program that supports image stacks. To
account for the index of refraction, all velocity and radius measurements were adjusted by a
factor of 0.93 following Hoffman [1975].
To measure the velocity, the position of the meniscus was measured on a series of
subsequent images, noting the time that the image was recorded and the pixel position of the
meniscus. The slug velocity was then calculated as Δpixels/Δtime and converted to m/s using the
appropriate image resolution.
Two methods were used to determine the contact angles. For the protractor measurements
[Hoffman, 1975], images of dynamic menisci were enlarged and lines were drawn on the liquid-
solid-interface (XY), and the liquid-air interface (YZ) at the inflection point (Fig. 3a). The
contact angle was then calculated by an ImageJ function. This was repeated for other side.
Because the apparatus was not always perfectly level, left and right contact angles were
measured and then averaged before further analyses. If left and right contact angles differed by
more than 5° due to an unwanted tilting of the chamber causing a lack a symmetry, the data of
run was not used.
9
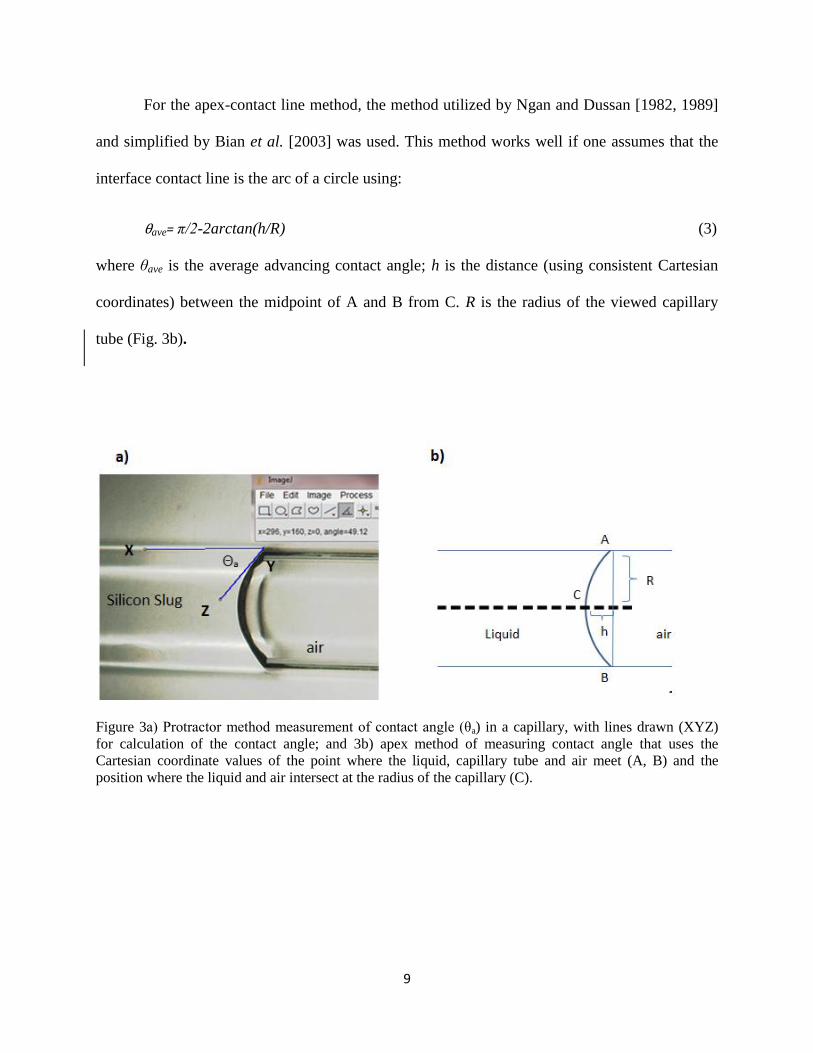
For the apex-contact line method, the method utilized by Ngan and Dussan [1982, 1989]
and simplified by Bian et al. [2003] was used. This method works well if one assumes that the
interface contact line is the arc of a circle using:
θave= π/2-2arctan(h/R) (3)
where θave is the average advancing contact angle; h is the distance (using consistent Cartesian
coordinates) between the midpoint of A and B from C. R is the radius of the viewed capillary
tube (Fig. 3b).
Figure 3a) Protractor method measurement of contact angle (θa) in a capillary, with lines drawn (XYZ)
for calculation of the contact angle; and 3b) apex method of measuring contact angle that uses the
Cartesian coordinate values of the point where the liquid, capillary tube and air meet (A, B) and the
position where the liquid and air intersect at the radius of the capillary (C).
10
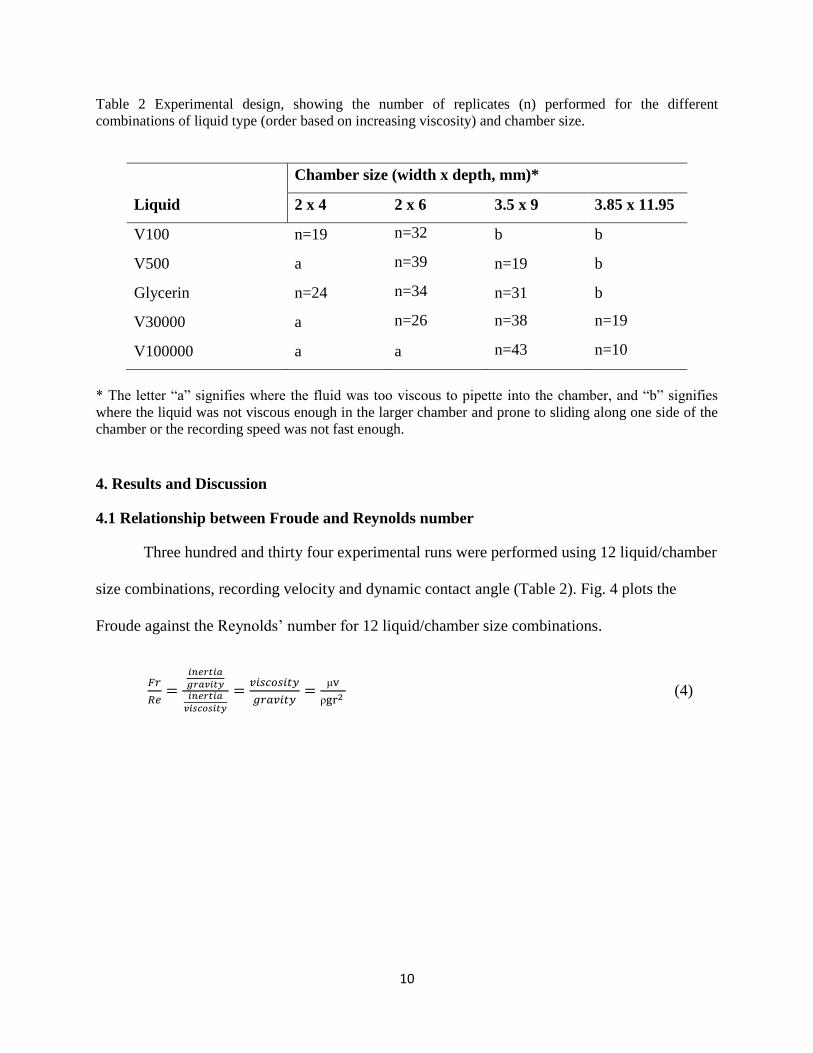
Table 2 Experimental design, showing the number of replicates (n) performed for the different
combinations of liquid type (order based on increasing viscosity) and chamber size.
Liquid
Chamber size (width x depth, mm)*
2 x 4 2 x 6 3.5 x 9 3.85 x 11.95
V100 n=19 n=32 b b
V500 a n=39 n=19 b
Glycerin n=24 n=34 n=31 b
V30000 a n=26 n=38 n=19
V100000 a a n=43 n=10
* The letter “a” signifies where the fluid was too viscous to pipette into the chamber, and “b” signifies
where the liquid was not viscous enough in the larger chamber and prone to sliding along one side of the
chamber or the recording speed was not fast enough.
4. Results and Discussion
4.1 Relationship between Froude and Reynolds number
Three hundred and thirty four experimental runs were performed using 12 liquid/chamber
size combinations, recording velocity and dynamic contact angle (Table 2). Fig. 4 plots the
Froude against the Reynolds’ number for 12 liquid/chamber size combinations.
(4)
11
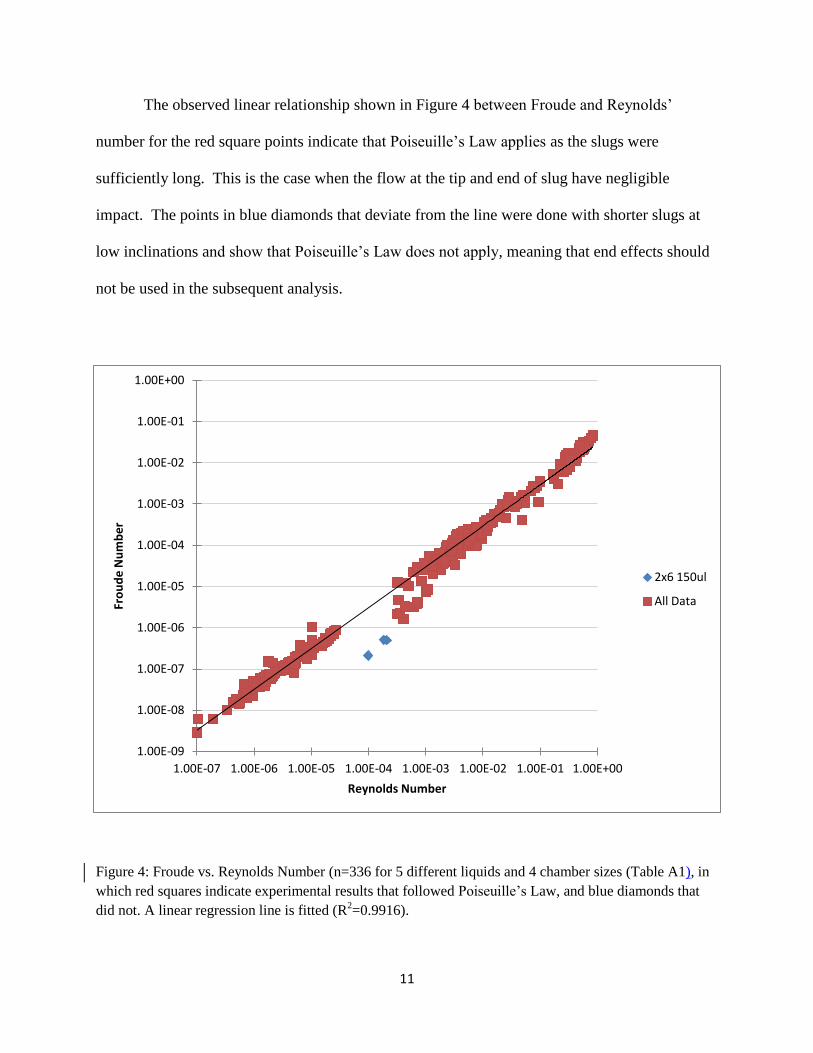
The observed linear relationship shown in Figure 4 between Froude and Reynolds’
number for the red square points indicate that Poiseuille’s Law applies as the slugs were
sufficiently long. This is the case when the flow at the tip and end of slug have negligible
impact. The points in blue diamonds that deviate from the line were done with shorter slugs at
low inclinations and show that Poiseuille’s Law does not apply, meaning that end effects should
not be used in the subsequent analysis.
Figure 4: Froude vs. Reynolds Number (n=336 for 5 different liquids and 4 chamber sizes (Table A1), in
which red squares indicate experimental results that followed Poiseuille’s Law, and blue diamonds that
did not. A linear regression line is fitted (R2=0.9916).
1.00E-09
1.00E-08
1.00E-07
1.00E-06
1.00E-05
1.00E-04
1.00E-03
1.00E-02
1.00E-01
1.00E+00
1.00E-07 1.00E-06 1.00E-05 1.00E-04 1.00E-03 1.00E-02 1.00E-01 1.00E+00
Fro
ud
e N
um
be
r
Reynolds Number
2x6 150ul
All Data
12
Fig. 5a shows the measured dynamic contact angles plotted against their capillary
number. Although there is considerable scatter between the various liquid/chamber size
combinations, as wetting speed increases, dynamic contact angles increase as observed by
Hoffman [1975]. Applying Hoffman’s shift as described in section 2 to reduce scatter barely
improved the R2 value. Our θs = 0 data is reduced to a best fit line (purple line) and applying
Jiang’s equation (2) on our using θs = 0° line with a θs of 34° (blue line) for glycerin also not
predict our experimental data (green line) adequately in Fig 5b.
Therefore, we introduce a reduced contact angle (θr) defined as
–
– (5)
Plotting the data this way improves the R2 from 0.63 to 0.86. Comparison of Hoffman
[1975] curve (thin black line in Fig. 5c) and our average curve (thick black line in Fig. 5c) shows
they coincide at the high capillary numbers. At lower capillary numbers, our contact angles were
slightly greater than Hoffman. Our average curve of the reduced data is also slightly greater than
Jiang’s equation.
From our data, θs=0 is not a unique curve as our data obtained with liquids with θs=0 does
not match exactly the results of Hoffman, however this could possibly be due to the rectangular
geometry instead of a cylindrical tubut used in Hoffman’s experiments.

13
0
20
40
60
80
100
120
140
160
180
200
0.00001 0.0001 0.001 0.01 0.1 1 10
Dyn
amic
Co
nta
ct A
ngl
e
Capillary Number
5a
2-4 Glycerin
2-6 Glycerin
3.5-9 Glycerin
3.5-9 V100000
3.85-11.95 V100000
2-6 V30000
3.5-9 V30000
3.85-11.95 V30000
2-6 V500
3.5-9 V500
2-4 V100
2-6 V100
Hoffman
0
20
40
60
80
100
120
140
160
180
200
0.00001 0.0001 0.001 0.01 0.1 1 10
θm
Capillary Number
5b
Silicon Data, θs = 0
Glycerin Data, θs = 34
Jiang, θs = 34, predicted
Hoffman
14
Figure 5: a) All experiment results plotted with dynamic contact angle as a function of capillary number
with the results of Hoffman (1975), R2 = 0.63, b) The best fit line for the glycerin data is plotted with our
θs = 0° line from our experiment data and Jiang’s correction(eqn. 2) based on our θs = 0° line using θs as
34° as a function of capillary number, c) All experiment results are plotted as a reduced dynamic contact
angles; θ –
– as a function of capillary number; R
2=0.86 with an average curve.
4.2 Size Effects and importance of correct analysis of interface shape
Some researchers [Ngan and Dussan V., 1982; 1989; Legait and Sourieau, 1985] propose
that with larger size, dynamic contact angle increases. In our experiments with 2x4 mm and 2x6
mm chambers, non-circular interfaces were not observed. However, larger capillary tubes (3.5 x
9 mm, 3.85-11.95 mm) were prone to asymmetric contact lines and non-circular interfaces
(Table E1).
0
20
40
60
80
100
120
140
160
180
200
0.00001 0.0001 0.001 0.01 0.1 1 10
θr
Capillary Number
5c
Hoffman
2-4 Glycerin
2-6 Glycerin
3.5-9 Glycerin
3.5-9 V100000
3.85-11.95 V100000
2-6 V30000
3.5-9 V30000
3.85-11.95 V30000
2-6 V500
3.5-9 V500
2-4 V100
2-6 V100
θr Average Curve
15
The protractor method and apex method were used to measure dynamic contact angles.
For angles between 60°-120° within 2x4, 2x6 mm tubes, we found that the interface was
consistently circular and the protractor method was a sufficient way for measuring contact angle
in this range as long as the contact line was nearly symmetrical. For the data outside this range
within the 2x4 and 2x6 mm tubes, the apex method was used after verifying the contact line was
circular because Ngan and Dussan [1982] point out that the protractor method is subjective. As
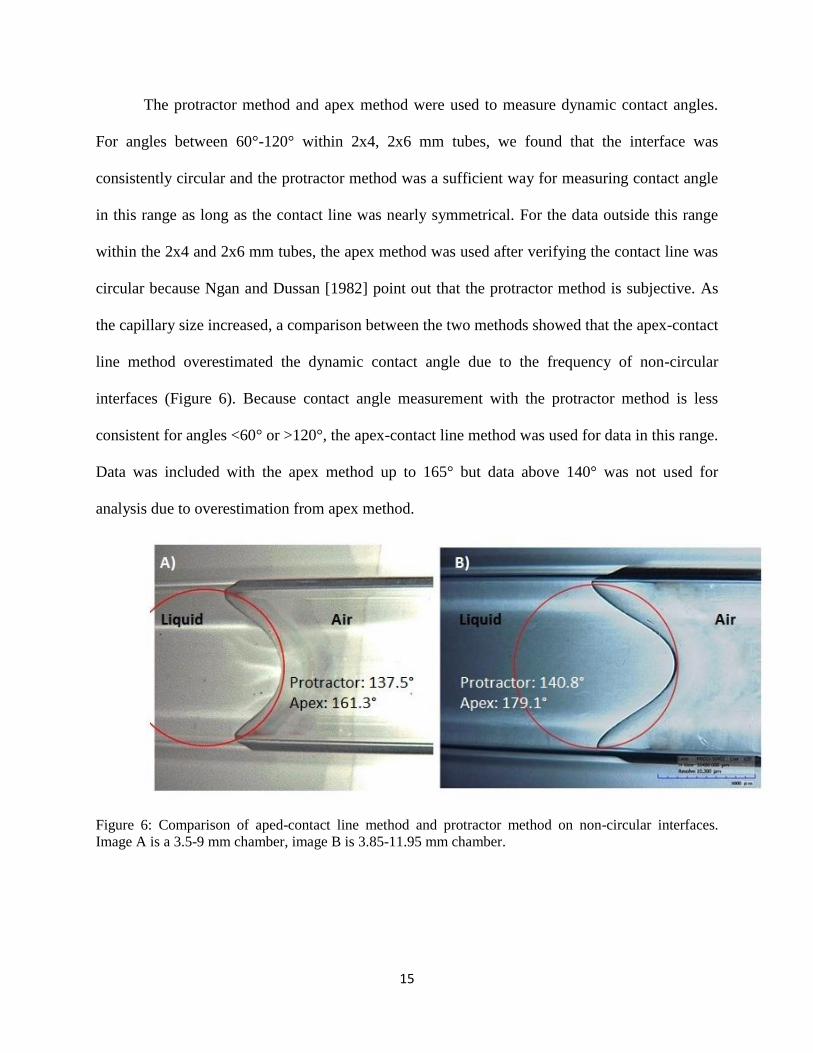
the capillary size increased, a comparison between the two methods showed that the apex-contact
line method overestimated the dynamic contact angle due to the frequency of non-circular
interfaces (Figure 6). Because contact angle measurement with the protractor method is less
consistent for angles <60° or >120°, the apex-contact line method was used for data in this range.
Data was included with the apex method up to 165° but data above 140° was not used for
analysis due to overestimation from apex method.
Figure 6: Comparison of aped-contact line method and protractor method on non-circular interfaces.
Image A is a 3.5-9 mm chamber, image B is 3.85-11.95 mm chamber.
16
The question remains how dynamic contact angles relate to instability in soil. It is
immediately clear that for fluxes in soil during natural infiltration of 0.1-10 cm/h (related
capillary numbers of 2 x 10⁻⁷
to 2 x 10⁻⁵
) the dynamic contact angle is hardly different from the
static contact angle. However we assume that the pressure at the wetting front has to build up
before it is large enough so that the water can go through the pore neck. Immediately after the
water is released, the pressure drops and then build up again until the water breaks though in the
following pore. We have seen this phenomenon during imbibition from the bottom (with much
lower velocities than wetting fronts) where one pore “pops” at a time. Thus in the experiment of
Glass et al. [1989] for a typical 1.5 cm wide finger in a 1 cm wide chamber, the flux in the finger
is approximately 10 cm3/min and assuming that this flux has to go through a neck with a radius
of 0.21 mm results in a velocity in the pore neck of approximately 1.2 m/sec with capillary
number of 0.015 and a dynamic contact angle of 60 degrees according to the Hoffman curve.
This 60 degree angle then explains that the water still infiltrates in the soil but according to
Laplace’s equation at less negative pressure than a regular wetting front explaining the overshoot
observed in DiCarlo’s [2007] experiments. Thus by assuming that the imposed flux goes through
the pore necks one at a time the dynamic contact angles seem to provide a general mechanism
for instabilities in soils.
5. Conclusions
In conclusion, using rectangular capillaries allows us to view the interfaces without
distortion, however the geometry may be responsible for the slight differences at θs=0 with
Hoffman’s [1975] results. We found that by using a reduced dynamic contact angle, simplifies
the analysis of the data. Size had no obvious impact on dynamic contact angles but we found
constant circular interfaces in smaller diameter chambers and as the capillary size increases, the
17
interfaces begins to deviate from a circular meniscus. If we assumed that the interface was
circular, it would lead to incorrectly large contact angles measurements when the apex method
was used (Fig 6). And finally, dynamic contact angles can explain the overshoot observed or wet
tip observed in finger experiments.
18
APPENDIX A
CLEANING PROCEDURE OF CAPILLARY TUBES
Capillary tubes coated with glycerin (which is water-soluble) were repeatedly flushed
with high velocity DI water, and then dried with ethyl alcohol and pressurized air. The procedure
was repeated until microscope showed no residue on the glass. Glassware coated with silicon
was cleaned using a heated solution of sodium hydroxide pellets in a 95% solution of ethyl
alcohol following Lowry [1997]. The cleaning procedure was repeated until no residue was
present when the glass tube is examined with the microscope. In general, low viscosity silicon
fluids were removed by leaving the capillary tubes in the ethyl alcohol and sodium hydroxide
cleaning solution for 10 min, while overnight soaking of the tubes was required to clean out the
more viscous silicon fluids.
19
APPENDIX B
ADDITIONAL DIMENSIONLESS NUMBERS
Other relevant dimensionless numbers to help understand slug flow include the Froude
Number, Reynolds Number, Weber Number and Bond Number. The Froude Number is the ratio
of inertia to gravity and is equal to
Fr = v2/ g*r (6)
where v is velocity (m/s), and g is gravity (m/s2) and r is radius (m).
The Reynolds number is a ratio of between inertia and viscosity and used to classify a
flow to be laminar or turbulent. Viscous flow dominates at low Reynolds number and inertial
forces dominate at high Reynolds numbers. The Reynolds number is written as
Re = ρvl/µ (7)
where ρ is fluid density (kg/m3), v is the velocity (m/s) and l is characteristic length, diameter (m)
and µ is the viscosity (Pa•s). In our experimental results, the Reynolds number for all of the data
is less than 1, indicating all slug flows were laminar.
The Weber number relates inertia with surface tension and is written as
We = ρv2l/ γ (8)
where ρ is the density of the fluid (g/ml), v is its velocity (m/s), l is its characteristic length (m)
and γ is the surface tension (N/m).
The Bond number compares gravity to surface tension is written as:
Bo = Δρg r2 / γ (9)
20
where Δρ is density or density difference of the two phases, (kg/m3), g is gravitational
acceleration, (m/s2), r is characteristic length, radius of capillary tube, (m) and γ is surface
tension, (N/m). A high bond number indicates that surface tension does not play a strong role; a
low bond number indicates that surface tension dominates.
21
APPENDIX C
STATIC CONTACT ANGLE OF GLYCERIN
The static contact angle has been measured to be about 30 degrees when measured inside
of pyrex glass tube [Bajpai and Khandekar, 2012]. It has also been measured at 27±1° using a
goniometer [Senn, 2007]. Other sources have a static contact angle around 70° [Fermigier and
Jenffer, 1991; Blake, 2006] so that experimental data agreed with the theoretical results.
22
APPENDIX D
BRIEF MATHEMATICAL RELATIONSHIPS BACKGROUND
D.1 Introduction
One of the most frequent issues that come up with trying to predict the relationship
between fluid properties and dynamic contact angles is the mathematical approach [Blake, 2006].
From fluid mechanics, the horizontal component of a Newtonian fluid increase as it approaches
the wall of the solid. At the wall, this horizontal component (shear stress) of the fluid approaches
an infinite value and consequently, this force should prevent the liquid from moving. We know
this is not true from observation. This conundrum is referred to as a no-slip boundary condition.
There are several main approaches to resolve this issue [Blake, 2006].
Frequently, the no-slip boundary condition is replaced with a slip boundary condition, i.e.
relaxing the boundary condition at the solid liquid interface to allow for liquid adjacent to the
wall to move [Huh and Scriven, 1971; Thompson and Robbins, 1989]. Another way to get
around this issue is to use a precursor film; it has been observed that on a microscopic level,
there is a microscopic liquid film moving ahead, forming a microscopic contact angle influenced
by molecular diffusive properties ahead of the measured macroscopic contact angle [Nieminen et
al., 1992; Burlatsky et al., 1996]. A more detailed description to the variety of approaches toward
removing the singularity can be found in the work of other researchers [Huh and Scriven, 1971;
Dussan V. and Davis, 1974; Dussan, 1979; de Gennes, 1985; Blake, 2006].
Two main theories provide simple analytical equations using simplified physics for
relating the dynamic contact angle to the wetting velocity: Hydrodynamic Theory (HDT) and
Molecular Kinetic Theory (MKT). These two approaches relate dynamic contact angle with
23
velocity through measureable parameters however they differ with their approach to friction
[Brochard-Wyart and De Gennes, 1992; Blake, 2006; Ralston et al., 2008]. For brevity, we will
only cover the necessary points, as a full description the mathematical approach is beyond the
scope of this thesis but more details on these approaches can be found in the work of Blake
[2006] and Ralston et al. [2008].
D.2 Hydrodynamic Theory
First, hydrodynamic theory [Huh and Scriven, 1971; Voinov, 1977; Dussan, 1979; de
Gennes, 1985; Cox, 1986] assumes the viscous dissipation occuring within the wedge of liquid
between the precursor film and transition zone is the main source of friction. The viscous
bending occurs at the liquid/vapor interface occurs in the mesoscopic region and can be observed
through the macroscopic (experimentally observed) contact angle [Blake, 2006]. The
hydrodynamic theory can be expressed with the following equation:
θ θ
(10)
where θD is the dynamic contact angle; θm is the local microscopic angle (usually considered
static contact angle), refer to Voinov [1977]; L and Lm are chosen macroscopic and microscopic
length scales, respectively, where continuum theories fail. Frequently, it is highlighted by other
researchers that the main weakness of the HDT is that it does not specifically consider the
contribution of surface properties such as solid roughness and geometry that would contribute to
frictional processes occurring between the liquid and solid [Dussan V., 1976; Blake, 2006].
24
D.3 Molecular Kinetic Theory
Second, in the molecular kinetic theory [Blake and Haynes, 1969] friction resistance is
assumed to consist of mainly of dissipation, which is related to the hopping frequency of
molecules between sorption sites and contact line at the molecular edge of the liquid film. Put
another way, molecular kinetic theory is based on the disturbance of adsorption equilibria and
surface tension at the wetting line [Blake and Haynes, 1969; Cherry and Holmes, 1969; Blake,
2006]. The main equation for the MKT applicable to the results in this paper is below.
θ θ (11)
where U is the velocity (m/s); k0
is the equilibrium frequency of the random molecular
displacements occurring within three phase zone; λ is equal to the average distance of each
displacement; γ is the surface tension of the liquid (N/m); θD is the dynamic contact angle; θS is
the static contact angle; kB is equal to the Boltzmann’s constant and T is the temperature (°K).
The relationship incorporates both measurable quantities and microscopic properties. The
γ(cosθs-cosθD) comes from the theory that the driving force is the out of balance tension force
[Blake and Haynes, 1969]. It is important to note that λ and ko are not clearly developed and
values cannot be consistently predicted [Blake, 2006]. Statistical techniques are needed to
determine the best values for best curve fitting. These are two analytical approaches that are easy
to apply, however as observed by Blake [2006] neither of these approaches is satisfactory for all
situations.
25
D.4 Results
Figure D1: Dynamic contact angle of V100000 silicon oil on rectangular capillary tube. Solid curve:
Hydrodynamic theory, eq (10), ln(L/Lm) = 9.3. Dashed curve: MKT, eq (11), λ = .80 nm, and k0 = 2300
and θs = 0 in both cases.
Figure D2: Dynamic contact angle of V30000 silicon oil on rectangular capillary tube. Solid curve:
Hydrodynamic theory, eq (10), ln(L/Lm) = 9.1. Dashed curve: MKT, eq (11), λ = .80 nm, and k0 = 7000
and θs = 0 in both cases.
0
20
40
60
80
100
120
140
160
180
200
0 0.05 0.1 0.15 0.2 0.25 0.3 0.35
Dyn
amic
Co
nta
ct A
ngl
e
Capillary Number
V100000
3.5-9 V100000
3.85-11.95 V100000
HDT
MKT
0
20
40
60
80
100
120
140
160
180
200
0 0.05 0.1 0.15 0.2 0.25 0.3
Dyn
amic
Co
nta
ct A
ngl
e
Capillary Number
V30000
HDT
MKT
2-6 V30000
3.5-9 V30000
3.85-11.95 V30000
26
Figure D3: Dynamic contact angle of V500 silicon oil on rectangular capillary tube. Solid curve:
Hydrodynamic theory, eq (10), ln(L/Lm) = 12.8. Dashed curve: MKT, eq (11), λ = .80 nm, and k0 =
221098 and θs = 0
Figure D4: Dynamic contact angle of V100 silicon oil on rectangular capillary tube. Solid curve:
Hydrodynamic theory, eq (10), ln(L/Lm) = 9.4. Dashed curve: MKT, eq (11), λ = .80 nm, and k0 =
185000 and θs = 0 in both cases.
0
20
40
60
80
100
120
140
160
180
200
0 0.05 0.1 0.15 0.2
Dyn
amic
Co
nta
ct A
ngl
e
Capillary Number
V500
HDT
MKT
2-6 V500
3.5-9 V500
0
20
40
60
80
100
120
140
160
180
200
0 0.05 0.1 0.15 0.2 0.25
Dyn
amic
Co
nta
ct A
ngl
e
Capillary Number
V100
HDT
MKT
2-4 V100
2-6 V100

27
Figure D5: Dynamic contact angle of glycerin on rectangular capillary tube. Solid curve: Hydrodynamic
theory, eq (10), ln(L/Lm) = 20 and θs= 50. Dashed curve: MKT, eq (11), λ = 6*10-10
nm, and k0 = 250000
and θs = 50.
D.5 Discussion and Conclusions
By observation, we can see that both HDT and MKT both match our experiment data
reasonably well. The HDT equation (eqn. 10) was truncated at 135° as done by Voinov [1977].
Our λ value was taken from Blake [2006]. L and Lm values (eqn. 10) and ko values (eqn. 11)
were in the same order as Blake. The MKT matched our glycerin experimental data slightly
better than the HDT approach as observed by Blake [2006]. However, for the glycerin data, the
θs was used as a fitting parameter and using θs = 34° as experimentally measured resulted in a
poor fit between HDT and MKT equations and our experimental data. As found by other
researchers, HDT and MKT both match completely wetting liquids (silicon) better than non-
completely wetting liquids. This leads to the common conclusion that neither approach is fully
robust and that it is likely both sources of friction from MKT and HDT approach play a role in
dynamic wetting [Blake, 2006].
0
20
40
60
80
100
120
140
160
-0.05 0 0.05 0.1 0.15 0.2 0.25
Dyn
amic
Co
nta
ct A
ngl
e
Capillary Number
Glycerin
HDT
MKT
2-4 Glycerin
2-6 Glycerin
3.5-9 Glycerin
28
APPENDIX E
ADDITIONAL TABLES AND GRAPHS OF EXPERIMENTAL DATA
Table E1: Replicates In the case of V100000 and V30000 fluid, the meniscus began to deviate from a
circular shape and approached a parabolic profile at high inclinations indicated with an X.
inclination Glycerin V100 V500 V30000 V100000
(°) A* B C A B B C B C D C D
1 0 0 0 0 0 0 2 0 0 5 0 1
2.5 0 0 0 0 0 0 0 0 1 0 0 0
3 0 0 0 0 0 0 0 0 0 0 2 0
5 1 0 2 1 1 4 4 3 2 4 2 0
6 0 0 0 0 0 0 0 0 0 0 0 1
6.8 0 0 0 0 0 0 0 0 0 0 0 1
10 3 2 3 0 2 4 2 3 3 3 6 2
15 3 0 1 1 0 2 2 3 1 1 1 1
20 1 3 2 0 1 4 0 3 3 2 2 2
25 0 0 0 0 0 1 0 0 1 0 1 1
30 2 6 4 5 6 5 5 2 2 2 4 1
35 0 0 0 0 0 0 0 1 0 0 2 X
40 1 1 0 1 1 1 1 1 3 0 1 X
45 4 7 2 1 5 4 1 2 4 2 4 X
50 1 1 2 0 0 2 1 1 4 X 1 X
55 0 0 0 0 0 0 0 0 0 X 3 X
60 1 6 6 5 6 5 1 3 8 X 2 X
65 0 0 2 0 0 0 0 0 0 X 0 X
70 5 3 3 2 1 2 0 1 2 X 5 X
75 0 0 2 0 0 0 0 0 0 X 3 X
80 2 4 2 3 9 4 0 3 1 X 3 X
85 0 0 0 0 0 1 0 0 3 X 1 X
90 0 1 0 0 0 0 0 0 0 X 0 X
*A = 2x4 mm, B = 2x6 mm, C = 3.5x9 mm, D = 3.85-11.95 mm
29
Figure E1: Experimental Results plotted as a function of Reynolds number.
Figure E2: Experimental Results plotted as a function of Bond Number.
0
20
40
60
80
100
120
140
160
180
1.0E-8 1.0E-7 1.0E-6 1.0E-5 1.0E-4 1.0E-3 1.0E-2 1.0E-1 1.0E+0
Dyn
amic
Co
nta
ct A
ngl
e
Reynolds Number
2-4 Glycerin
2-6 Glycerin
3.5-9 Glycerin
3.5-9 V100000
3.85-11.95 V100000
2-6 V30000
3.5-9 V30000
3.85-11.95 V30000
2-6 V500
3.5-9 V500
2-4 V100
2-6 V100
0
20
40
60
80
100
120
140
160
180
0.01 0.1 1 10
Dyn
amic
Co
nta
ct A
ngl
e
Bond Number
2-4 Glycerin
2-6 Glycerin
3.5-9 Glycerin
3.5-9 V100000
3.85-11.95 V100000
2-6 V30000
3.5-9 V30000
3.85-11.95 V30000
2-6 V500
3.5-9 V500
2-4 V100
2-6 V100

30
Figure E3: Experimental Results plotted as a function of Weber Number.
.
0
20
40
60
80
100
120
140
160
180
1E-10 1E-08 1E-06 1E-04 1E-02 1E+00
Dyn
amic
Co
nta
ct A
ngl
e
Weber Number
2-4 Glycerin
2-6 Glycerin
3.5-9 Glycerin
3.5-9 V100000
3.85-11.95 V100000
2-6 V30000
3.5-9 V30000
3.85-11.95 V30000
2-6 V500
3.5-9 V500
2-4 V100
2-6 V100

31
Table E2: All experiment data
32
Chamber Radius Radius Radius Liquid Density Tilt Velocity Velocity Viscosity S Tension DCA Ca
(mm * mm) d (m) D (m) (m) (name) (kg/m^3) (degree) (m/s) ADJUSTED (Pa.s) (N/m) used (µv/γ)
2-4 0.002 0.004 0.0013 Gly 1253.6 5 1.28E-04 1.19E-04 1.340 0.064 75.15 0.0025
2-4 0.002 0.004 0.0013 Gly 1253.6 10 1.79E-04 1.65E-04 1.340 0.064 81.90 0.0035
2-4 0.002 0.004 0.0013 Gly 1253.6 15 2.00E-04 1.85E-04 1.340 0.064 90.10 0.0039
2-4 0.002 0.004 0.0013 Gly 1253.6 10 2.45E-04 2.27E-04 1.340 0.064 90.84 0.0047
2-4 0.002 0.004 0.0013 Gly 1253.6 10 2.82E-04 2.61E-04 1.340 0.064 70.50 0.0055
2-4 0.002 0.004 0.0013 Gly 1253.6 20 3.66E-04 3.38E-04 1.340 0.064 89.95 0.0071
2-4 0.002 0.004 0.0013 Gly 1253.6 15 3.78E-04 3.50E-04 1.340 0.064 90.55 0.0073
2-4 0.002 0.004 0.0013 Gly 1253.6 15 4.67E-04 4.32E-04 1.340 0.064 95.60 0.0090
2-4 0.002 0.004 0.0013 Gly 1253.6 70 5.36E-04 4.96E-04 1.340 0.064 91.55 0.0104
2-4 0.002 0.004 0.0013 Gly 1253.6 45 6.17E-04 5.71E-04 1.340 0.064 92.99 0.0120
2-4 0.002 0.004 0.0013 Gly 1253.6 30 6.98E-04 6.46E-04 1.340 0.064 89.50 0.0135
2-4 0.002 0.004 0.0013 Gly 1253.6 30 7.04E-04 6.51E-04 1.340 0.064 94.80 0.0136
2-4 0.002 0.004 0.0013 Gly 1253.6 45 8.56E-04 7.92E-04 1.340 0.064 95.65 0.0166
2-4 0.002 0.004 0.0013 Gly 1253.6 40 9.27E-04 8.57E-04 1.340 0.064 92.10 0.0180
2-4 0.002 0.004 0.0013 Gly 1253.6 50 1.14E-03 1.05E-03 1.340 0.064 95.40 0.0220
2-4 0.002 0.004 0.0013 Gly 1253.6 45 1.19E-03 1.11E-03 1.340 0.064 97.33 0.0231
2-4 0.002 0.004 0.0013 Gly 1253.6 60 1.22E-03 1.13E-03 1.340 0.064 100.50 0.0237
2-4 0.002 0.004 0.0013 Gly 1253.6 70 1.23E-03 1.14E-03 1.340 0.064 95.00 0.0238
2-4 0.002 0.004 0.0013 Gly 1253.6 45 1.41E-03 1.31E-03 1.340 0.064 101.05 0.0274
2-4 0.002 0.004 0.0013 Gly 1253.6 80 1.42E-03 1.31E-03 1.340 0.064 97.90 0.0274
2-4 0.002 0.004 0.0013 Gly 1253.6 80 1.57E-03 1.45E-03 1.340 0.064 98.50 0.0304
2-4 0.002 0.004 0.0013 Gly 1253.6 70 1.65E-03 1.53E-03 1.340 0.064 90.00 0.0319
2-4 0.002 0.004 0.0013 Gly 1253.6 70 1.69E-03 1.56E-03 1.340 0.064 102.70 0.0327
2-4 0.002 0.004 0.0013 Gly 1253.6 70 1.78E-03 1.65E-03 1.340 0.064 97.50 0.0345
2-6 0.002 0.006 0.0015 Gly 1253.6 20 3.51E-05 3.25E-05 1.340 0.064 66.15 0.0007
2-6 0.002 0.006 0.0015 Gly 1253.6 30 6.60E-05 6.11E-05 1.340 0.064 76.50 0.0013
2-6 0.002 0.006 0.0015 Gly 1253.6 40 7.40E-05 6.85E-05 1.340 0.064 61.50 0.0014
33
Table E2 (Continued)
Chamber Radius Radius Radius Liquid Density Tilt Velocity Velocity Viscosity S Tension DCA Ca
(mm * mm) d (m) D (m) (m) (name) (kg/m^3) (degree) (m/s) ADJUSTED (Pa.s) (N/m) used (µv/γ)
2-6 0.002 0.006 0.0015 Gly 1253.6 20 1.13E-04 1.05E-04 1.340 0.064 73.55 0.0022
2-6 0.002 0.006 0.0015 Gly 1253.6 10 1.19E-04 1.10E-04 1.340 0.064 89.00 0.0023
2-6 0.002 0.006 0.0015 Gly 1253.6 50 1.45E-04 1.34E-04 1.340 0.064 82.00 0.0028
2-6 0.002 0.006 0.0015 Gly 1253.6 60 2.18E-04 2.02E-04 1.340 0.064 88.00 0.0042
2-6 0.002 0.006 0.0015 Gly 1253.6 70 2.50E-04 2.31E-04 1.340 0.064 80.50 0.0048
2-6 0.002 0.006 0.0015 Gly 1253.6 70 2.56E-04 2.37E-04 1.340 0.064 90.50 0.0050
2-6 0.002 0.006 0.0015 Gly 1253.6 10 3.31E-04 3.06E-04 1.340 0.064 82.00 0.0064
2-6 0.002 0.006 0.0015 Gly 1253.6 80 3.58E-04 3.31E-04 1.340 0.064 90.50 0.0069
2-6 0.002 0.006 0.0015 Gly 1253.6 90 3.82E-04 3.53E-04 1.340 0.064 93.00 0.0074
2-6 0.002 0.006 0.0015 Gly 1253.6 20 5.15E-04 4.76E-04 1.340 0.064 87.50 0.0100
2-6 0.002 0.006 0.0015 Gly 1253.6 30 5.88E-04 5.44E-04 1.340 0.064 103.50 0.0114
2-6 0.002 0.006 0.0015 Gly 1253.6 30 6.03E-04 5.58E-04 1.340 0.064 96.65 0.0117
2-6 0.002 0.006 0.0015 Gly 1253.6 70 6.40E-04 5.92E-04 1.340 0.064 89.90 0.0124
2-6 0.002 0.006 0.0015 Gly 1253.6 80 8.09E-04 7.48E-04 1.340 0.064 100.50 0.0157
2-6 0.002 0.006 0.0015 Gly 1253.6 30 8.77E-04 8.11E-04 1.340 0.064 100.45 0.0170
2-6 0.002 0.006 0.0015 Gly 1253.6 30 9.19E-04 8.50E-04 1.340 0.064 101.14 0.0178
2-6 0.002 0.006 0.0015 Gly 1253.6 45 9.27E-04 8.57E-04 1.340 0.064 105.00 0.0180
2-6 0.002 0.006 0.0015 Gly 1253.6 45 1.03E-03 9.53E-04 1.340 0.064 102.25 0.0200
2-6 0.002 0.006 0.0015 Gly 1253.6 30 1.21E-03 1.12E-03 1.340 0.064 103.25 0.0234
2-6 0.002 0.006 0.0015 Gly 1253.6 45 1.24E-03 1.15E-03 1.340 0.064 100.90 0.0240
2-6 0.002 0.006 0.0015 Gly 1253.6 45 1.26E-03 1.16E-03 1.340 0.064 105.20 0.0244
2-6 0.002 0.006 0.0015 Gly 1253.6 45 1.28E-03 1.18E-03 1.340 0.064 101.80 0.0248
2-6 0.002 0.006 0.0015 Gly 1253.6 60 1.31E-03 1.21E-03 1.340 0.064 103.75 0.0253
2-6 0.002 0.006 0.0015 Gly 1253.6 60 1.36E-03 1.26E-03 1.340 0.064 101.51 0.0263
2-6 0.002 0.006 0.0015 Gly 1253.6 60 1.36E-03 1.26E-03 1.340 0.064 104.60 0.0264
34
Table E2 (Continued)
Chamber Radius Radius Radius Liquid Density Tilt Velocity Velocity Viscosity S Tension DCA Ca
(mm * mm) d (m) D (m) (m) (name) (kg/m^3) (degree) (m/s) ADJUSTED (Pa.s) (N/m) used (µv/γ)
2-6 0.002 0.006 0.0015 Gly 1253.6 45 1.44E-03 1.33E-03 1.340 0.064 97.00 0.0280
2-6 0.002 0.006 0.0015 Gly 1253.6 45 1.45E-03 1.34E-03 1.340 0.064 104.35 0.0281
2-6 0.002 0.006 0.0015 Gly 1253.6 60 1.70E-03 1.58E-03 1.340 0.064 102.15 0.0330
2-6 0.002 0.006 0.0015 Gly 1253.6 80 1.92E-03 1.77E-03 1.340 0.064 107.65 0.0371
2-6 0.002 0.006 0.0015 Gly 1253.6 60 1.93E-03 1.79E-03 1.340 0.064 105.00 0.0374
2-6 0.002 0.006 0.0015 Gly 1253.6 80 2.00E-03 1.85E-03 1.340 0.064 105.00 0.0388
9-3 0.0035 0.009 0.0025 Gly 1253.6 5 7.55E-05 6.99E-05 1.340 0.064 86.50 0.0015
9-3 0.0035 0.009 0.0025 Gly 1253.6 5 9.06E-05 8.38E-05 1.340 0.064 88.00 0.0018
9-3 0.0035 0.009 0.0025 Gly 1253.6 10 4.35E-04 4.02E-04 1.340 0.064 91.00 0.0084
9-3 0.0035 0.009 0.0025 Gly 1253.6 10 4.55E-04 4.21E-04 1.340 0.064 93.00 0.0088
9-3 0.0035 0.009 0.0025 Gly 1253.6 10 6.08E-04 5.62E-04 1.340 0.064 95.60 0.0118
9-3 0.0035 0.009 0.0025 Gly 1253.6 30 6.96E-04 6.43E-04 1.340 0.064 98.95 0.0135
9-3 0.0035 0.009 0.0025 Gly 1253.6 15 1.18E-03 1.09E-03 1.340 0.064 97.60 0.0228
9-3 0.0035 0.009 0.0025 Gly 1253.6 30 1.50E-03 1.39E-03 1.340 0.064 107.00 0.0291
9-3 0.0035 0.009 0.0025 Gly 1253.6 60 1.57E-03 1.45E-03 1.340 0.064 110.20 0.0304
9-3 0.0035 0.009 0.0025 Gly 1253.6 60 1.57E-03 1.45E-03 1.340 0.064 112.00 0.0304
9-3 0.0035 0.009 0.0025 Gly 1253.6 30 1.60E-03 1.48E-03 1.340 0.064 103.50 0.0309
9-3 0.0035 0.009 0.0025 Gly 1253.6 20 1.63E-03 1.50E-03 1.340 0.064 106.00 0.0315
9-3 0.0035 0.009 0.0025 Gly 1253.6 20 1.63E-03 1.50E-03 1.340 0.064 108.85 0.0315
9-3 0.0035 0.009 0.0025 Gly 1253.6 50 2.00E-03 1.85E-03 1.340 0.064 104.00 0.0388
9-3 0.0035 0.009 0.0025 Gly 1253.6 50 2.02E-03 1.87E-03 1.340 0.064 107.50 0.0391
9-3 0.0035 0.009 0.0025 Gly 1253.6 30 2.39E-03 2.21E-03 1.340 0.064 109.75 0.0464
9-3 0.0035 0.009 0.0025 Gly 1253.6 70 2.47E-03 2.29E-03 1.340 0.064 114.00 0.0479
9-3 0.0035 0.009 0.0025 Gly 1253.6 60 2.94E-03 2.72E-03 1.340 0.064 123.00 0.0569
9-3 0.0035 0.009 0.0025 Gly 1253.6 60 2.96E-03 2.74E-03 1.340 0.064 124.00 0.0573

35
Table E2 (Continued)
Chamber Radius Radius Radius Liquid Density Tilt Velocity Velocity Viscosity S Tension DCA Ca
(mm * mm) d (m) D (m) (m) (name) (kg/m^3) (degree) (m/s) ADJUSTED (Pa.s) (N/m) used (µv/γ)
9-3 0.0035 0.009 0.0025 Gly 1253.6 70 3.20E-03 2.96E-03 1.340 0.064 124.00 0.0621
9-3 0.0035 0.009 0.0025 Gly 1253.6 70 3.20E-03 2.96E-03 1.340 0.064 127.00 0.0621
9-3 0.0035 0.009 0.0025 Gly 1253.6 80 3.90E-03 3.61E-03 1.340 0.064 123.60 0.0756
9-3 0.0035 0.009 0.0025 Gly 1253.6 80 3.90E-03 3.61E-03 1.340 0.064 120.90 0.0756
9-3 0.0035 0.009 0.0025 Gly 1253.6 65 4.01E-03 3.71E-03 1.340 0.064 128.00 0.0776
9-3 0.0035 0.009 0.0025 Gly 1253.6 65 4.01E-03 3.71E-03 1.340 0.064 124.50 0.0776
9-3 0.0035 0.009 0.0025 Gly 1253.6 45 4.50E-03 4.16E-03 1.340 0.064 115.70 0.0871
9-3 0.0035 0.009 0.0025 Gly 1253.6 45 4.50E-03 4.16E-03 1.340 0.064 113.50 0.0871
9-3 0.0035 0.009 0.0025 Gly 1253.6 75 5.93E-03 5.48E-03 1.340 0.064 129.00 0.1148
9-3 0.0035 0.009 0.0025 Gly 1253.6 75 5.93E-03 5.48E-03 1.340 0.064 126.00 0.1148
9-3 0.0035 0.009 0.0025 Gly 1253.6 60 6.01E-03 5.56E-03 1.340 0.064 127.00 0.1165
9-3 0.0035 0.009 0.0025 Gly 1253.6 60 6.01E-03 5.56E-03 1.340 0.064 125.36 0.1165
9-3 0.0035 0.009 0.0025 V100000 999.6 3 2.08E-06 1.92E-06 104.32 0.0225 61.00 0.0089
9-3 0.0035 0.009 0.0025 V100000 999.6 3 2.08E-06 1.92E-06 104.32 0.0225 59.45 0.0089
9-3 0.0035 0.009 0.0025 V100000 999.6 5 3.92E-06 3.63E-06 104.32 0.0225 63.40 0.0168
9-3 0.0035 0.009 0.0025 V100000 999.6 5 3.92E-06 3.63E-06 104.32 0.0225 61.93 0.0168
9-3 0.0035 0.009 0.0025 V100000 999.6 10 7.04E-06 6.51E-06 104.32 0.0225 82.00 0.0302
9-3 0.0035 0.009 0.0025 V100000 999.6 10 7.04E-06 6.51E-06 104.32 0.0225 78.25 0.0302
9-3 0.0035 0.009 0.0025 V100000 999.6 10 8.77E-06 8.11E-06 104.32 0.0225 79.00 0.0376
9-3 0.0035 0.009 0.0025 V100000 999.6 10 8.77E-06 8.11E-06 104.32 0.0225 76.88 0.0376
9-3 0.0035 0.009 0.0025 V100000 999.6 10 8.86E-06 8.19E-06 104.32 0.0225 81.22 0.0380
9-3 0.0035 0.009 0.0025 V100000 999.6 10 8.86E-06 8.19E-06 104.32 0.0225 81.70 0.0380
9-3 0.0035 0.009 0.0025 V100000 999.6 15 1.32E-05 1.22E-05 104.32 0.0225 87.25 0.0567
9-3 0.0035 0.009 0.0025 V100000 999.6 20 1.71E-05 1.58E-05 104.32 0.0225 95.45 0.0731
9-3 0.0035 0.009 0.0025 V100000 999.6 25 1.98E-05 1.83E-05 104.32 0.0225 96.70 0.0848
36
Table E2 (Continued)
Chamber Radius Radius Radius Liquid Density Tilt Velocity Velocity Viscosity S Tension DCA Ca
(mm * mm) d (m) D (m) (m) (name) (kg/m^3) (degree) (m/s) ADJUSTED (Pa.s) (N/m) used (µv/γ)
9-3 0.0035 0.009 0.0025 V100000 999.6 20 2.08E-05 1.92E-05 104.32 0.0225 92.25 0.0891
9-3 0.0035 0.009 0.0025 V100000 999.6 30 2.38E-05 2.20E-05 104.32 0.0225 104.00 0.1020
9-3 0.0035 0.009 0.0025 V100000 999.6 30 2.38E-05 2.20E-05 104.32 0.0225 102.70 0.1020
9-3 0.0035 0.009 0.0025 V100000 999.6 30 2.39E-05 2.21E-05 104.32 0.0225 105.00 0.1026
9-3 0.0035 0.009 0.0025 V100000 999.6 30 2.39E-05 2.21E-05 104.32 0.0225 102.50 0.1026
9-3 0.0035 0.009 0.0025 V100000 999.6 40 2.61E-05 2.41E-05 104.32 0.0225 107.22 0.1119
9-3 0.0035 0.009 0.0025 V100000 999.6 45 3.22E-05 2.98E-05 104.32 0.0225 119.00 0.1383
9-3 0.0035 0.009 0.0025 V100000 999.6 45 3.22E-05 2.98E-05 104.32 0.0225 115.75 0.1383
9-3 0.0035 0.009 0.0025 V100000 999.6 50 3.23E-05 2.99E-05 104.32 0.0225 113.25 0.1385
9-3 0.0035 0.009 0.0025 V100000 999.6 70 3.25E-05 3.01E-05 104.32 0.0225 128.50 0.1394
9-3 0.0035 0.009 0.0025 V100000 999.6 35 3.38E-05 3.13E-05 104.32 0.0225 115.00 0.1451
9-3 0.0035 0.009 0.0025 V100000 999.6 35 3.38E-05 3.13E-05 104.32 0.0225 111.30 0.1451
9-3 0.0035 0.009 0.0025 V100000 999.6 45 3.44E-05 3.18E-05 104.32 0.0225 123.10 0.1475
9-3 0.0035 0.009 0.0025 V100000 999.6 45 3.44E-05 3.18E-05 104.32 0.0225 121.05 0.1475
9-3 0.0035 0.009 0.0025 V100000 999.6 55 3.68E-05 3.40E-05 104.32 0.0225 126.25 0.1577
9-3 0.0035 0.009 0.0025 V100000 999.6 55 3.73E-05 3.45E-05 104.32 0.0225 132.50 0.1601
9-3 0.0035 0.009 0.0025 V100000 999.6 55 3.72E-05 3.44E-05 104.32 0.0225 121.75 0.1597
9-3 0.0035 0.009 0.0025 V100000 999.6 60 3.86E-05 3.57E-05 104.32 0.0225 125.20 0.1656
9-3 0.0035 0.009 0.0025 V100000 999.6 60 3.86E-05 3.57E-05 104.32 0.0225 121.85 0.1656
9-3 0.0035 0.009 0.0025 V100000 999.6 70 3.93E-05 3.63E-05 104.32 0.0225 131.50 0.1684
9-3 0.0035 0.009 0.0025 V100000 999.6 70 3.95E-05 3.65E-05 104.32 0.0225 135.00 0.1693
9-3 0.0035 0.009 0.0025 V100000 999.6 75 3.98E-05 3.68E-05 104.32 0.0225 141.50 0.1707
9-3 0.0035 0.009 0.0025 V100000 999.6 75 3.98E-05 3.68E-05 104.32 0.0225 140.75 0.1707
9-3 0.0035 0.009 0.0025 V100000 999.6 80 4.09E-05 3.78E-05 104.32 0.0225 135.00 0.1754
9-3 0.0035 0.009 0.0025 V100000 999.6 80 4.11E-05 3.80E-05 104.32 0.0225 134.20 0.1762
37
Table E2 (Continued)
Chamber Radius Radius Radius Liquid Density Tilt Velocity Velocity Viscosity S Tension DCA Ca
(mm * mm) d (m) D (m) (m) (name) (kg/m^3) (degree) (m/s) ADJUSTED (Pa.s) (N/m) used (µv/γ)
9-3 0.0035 0.009 0.0025 V100000 999.6 70 4.11E-05 3.80E-05 104.32 0.0225 131.04 0.1763
9-3 0.0035 0.009 0.0025 V100000 999.6 70 4.21E-05 3.89E-05 104.32 0.0225 133.00 0.1806
9-3 0.0035 0.009 0.0025 V100000 999.6 80 4.29E-05 3.97E-05 104.32 0.0225 145.00 0.1840
9-3 0.0035 0.009 0.0025 V100000 999.6 75 4.34E-05 4.02E-05 104.32 0.0225 135.00 0.1862
9-3 0.0035 0.009 0.0025 V100000 999.6 85 4.66E-05 4.31E-05 104.32 0.0225 134.00 0.1999
10-15 0.0039 0.012 0.0029 V100000 999.6 1 1.87E-06 1.73E-06 104.32 0.0225 52.50 0.0080
10-15 0.0039 0.012 0.0029 V100000 999.6 6.8 8.54E-06 7.90E-06 104.32 0.0225 80.55 0.0366
10-15 0.0039 0.012 0.0029 V100000 999.6 6 1.21E-05 1.12E-05 104.32 0.0225 77.15 0.0518
10-15 0.0039 0.012 0.0029 V100000 999.6 10 1.36E-05 1.26E-05 104.32 0.0225 88.85 0.0585
10-15 0.0039 0.012 0.0029 V100000 999.6 10 1.69E-05 1.57E-05 104.32 0.0225 92.10 0.0727
10-15 0.0039 0.012 0.0029 V100000 999.6 15 1.96E-05 1.82E-05 104.32 0.0225 96.55 0.0842
10-15 0.0039 0.012 0.0029 V100000 999.6 20 2.48E-05 2.29E-05 104.32 0.0225 102.50 0.1064
10-15 0.0039 0.012 0.0029 V100000 999.6 20 2.69E-05 2.49E-05 104.32 0.0225 103.50 0.1152
10-15 0.0039 0.012 0.0029 V100000 999.6 30 2.84E-05 2.63E-05 104.32 0.0225 109.50 0.1219
10-15 0.0039 0.012 0.0029 V100000 999.6 26 3.31E-05 3.06E-05 104.32 0.0225 122.00 0.1418
2-6 0.002 0.006 0.0015 V30000 1002.3 5 5.25E-06 4.85E-06 30.880 0.022 66.15 0.0068
2-6 0.002 0.006 0.0015 V30000 1002.3 5 6.79E-06 6.28E-06 30.880 0.022 56.50 0.0088
2-6 0.002 0.006 0.0015 V30000 1002.3 5 6.88E-06 6.36E-06 30.880 0.022 69.67 0.0089
2-6 0.002 0.006 0.0015 V30000 1002.3 10 7.73E-06 7.15E-06 30.880 0.022 69.00 0.0100
2-6 0.002 0.006 0.0015 V30000 1002.3 15 9.93E-06 9.18E-06 30.880 0.022 80.65 0.0129
2-6 0.002 0.006 0.0015 V30000 1002.3 10 1.29E-05 1.20E-05 30.880 0.022 70.00 0.0168
2-6 0.002 0.006 0.0015 V30000 1002.3 10 1.33E-05 1.23E-05 30.880 0.022 81.71 0.0173
2-6 0.002 0.006 0.0015 V30000 1002.3 15 1.66E-05 1.53E-05 30.880 0.022 73.00 0.0215
2-6 0.002 0.006 0.0015 V30000 1002.3 15 1.66E-05 1.53E-05 30.880 0.022 77.00 0.0215
2-6 0.002 0.006 0.0015 V30000 1002.3 20 2.05E-05 1.90E-05 30.880 0.022 90.05 0.0266
38
Table E2 (Continued)
Chamber Radius Radius Radius Liquid Density Tilt Velocity Velocity Viscosity S Tension DCA Ca
(mm * mm) d (m) D (m) (m) (name) (kg/m^3) (degree) (m/s) ADJUSTED (Pa.s) (N/m) used (µv/γ)
2-6 0.002 0.006 0.0015 V30000 1002.3 20 2.45E-05 2.26E-05 30.880 0.022 74.00 0.0318
2-6 0.002 0.006 0.0015 V30000 1002.3 20 2.45E-05 2.26E-05 30.880 0.022 76.08 0.0318
2-6 0.002 0.006 0.0015 V30000 1002.3 30 2.80E-05 2.59E-05 30.880 0.022 91.90 0.0364
2-6 0.002 0.006 0.0015 V30000 1002.3 35 2.97E-05 2.75E-05 30.880 0.022 94.40 0.0386
2-6 0.002 0.006 0.0015 V30000 1002.3 30 3.17E-05 2.93E-05 30.880 0.022 92.57 0.0412
2-6 0.002 0.006 0.0015 V30000 1002.3 50 3.54E-05 3.28E-05 30.880 0.022 102.75 0.0460
2-6 0.002 0.006 0.0015 V30000 1002.3 40 3.65E-05 3.38E-05 30.880 0.022 88.00 0.0474
2-6 0.002 0.006 0.0015 V30000 1002.3 60 4.00E-05 3.70E-05 30.880 0.022 100.85 0.0519
2-6 0.002 0.006 0.0015 V30000 1002.3 45 4.09E-05 3.79E-05 30.880 0.022 95.00 0.0531
2-6 0.002 0.006 0.0015 V30000 1002.3 45 4.20E-05 3.89E-05 30.880 0.022 96.55 0.0546
2-6 0.002 0.006 0.0015 V30000 1002.3 70 4.00E-05 3.70E-05 30.880 0.022 103.40 0.0520
2-6 0.002 0.006 0.0015 V30000 1002.3 60 5.28E-05 4.88E-05 30.880 0.022 100.84 0.0685
2-6 0.002 0.006 0.0015 V30000 1002.3 60 5.33E-05 4.93E-05 30.880 0.022 101.50 0.0692
2-6 0.002 0.006 0.0015 V30000 1002.3 80 5.79E-05 5.36E-05 30.880 0.022 96.40 0.0752
2-6 0.002 0.006 0.0015 V30000 1002.3 80 5.90E-05 5.45E-05 30.880 0.022 103.50 0.0765
2-6 0.002 0.006 0.0015 V30000 1002.3 80 6.56E-05 6.07E-05 30.880 0.022 103.12 0.0852
9-3 0.0035 0.009 0.0025 V30000 1002.3 5 1.30E-05 1.20E-05 30.88 0.022 73.00 0.0169
9-3 0.0035 0.009 0.0025 V30000 1002.3 2.5 1.32E-05 1.23E-05 30.88 0.022 69.05 0.0172
9-3 0.0035 0.009 0.0025 V30000 1002.3 5 1.43E-05 1.33E-05 30.88 0.022 72.90 0.0186
9-3 0.0035 0.009 0.0025 V30000 1002.3 10 2.60E-05 2.40E-05 30.88 0.022 83.20 0.0337
9-3 0.0035 0.009 0.0025 V30000 1002.3 10 2.79E-05 2.58E-05 30.88 0.022 87.85 0.0362
9-3 0.0035 0.009 0.0025 V30000 1002.3 10 3.14E-05 2.90E-05 30.88 0.022 89.00 0.0407
9-3 0.0035 0.009 0.0025 V30000 1002.3 15 3.24E-05 2.99E-05 30.88 0.022 89.10 0.0420
9-3 0.0035 0.009 0.0025 V30000 1002.3 20 4.88E-05 4.52E-05 30.88 0.022 97.95 0.0634
9-3 0.0035 0.009 0.0025 V30000 1002.3 25 5.04E-05 4.66E-05 30.88 0.022 100.09 0.0654

39
Table E2 (Continued)
Chamber Radius Radius Radius Liquid Density Tilt Velocity Velocity Viscosity S Tension DCA Ca
(mm * mm) d (m) D (m) (m) (name) (kg/m^3) (degree) (m/s) ADJUSTED (Pa.s) (N/m) used (µv/γ)
9-3 0.0035 0.009 0.0025 V30000 1002.3 20 5.38E-05 4.97E-05 30.88 0.022 98.05 0.0698
9-3 0.0035 0.009 0.0025 V30000 1002.3 20 5.46E-05 5.05E-05 30.88 0.022 97.10 0.0708
9-3 0.0035 0.009 0.0025 V30000 1002.3 40 6.36E-05 5.88E-05 30.88 0.022 101.15 0.0825
9-3 0.0035 0.009 0.0025 V30000 1002.3 30 6.75E-05 6.25E-05 30.88 0.022 105.20 0.0877
9-3 0.0035 0.009 0.0025 V30000 1002.3 30 7.23E-05 6.69E-05 30.88 0.022 104.13 0.0939
9-3 0.0035 0.009 0.0025 V30000 1002.3 40 8.45E-05 7.82E-05 30.88 0.022 109.30 0.1098
9-3 0.0035 0.009 0.0025 V30000 1002.3 40 8.55E-05 7.91E-05 30.88 0.022 114.80 0.1110
9-3 0.0035 0.009 0.0025 V30000 1002.3 45 9.07E-05 8.39E-05 30.88 0.022 117.50 0.1177
9-3 0.0035 0.009 0.0025 V30000 1002.3 60 9.48E-05 8.77E-05 30.88 0.022 140.50 0.1231
9-3 0.0035 0.009 0.0025 V30000 1002.3 50 9.95E-05 9.21E-05 30.88 0.022 118.30 0.1292
9-3 0.0035 0.009 0.0025 V30000 1002.3 50 9.95E-05 9.21E-05 30.88 0.022 118.64 0.1292
9-3 0.0035 0.009 0.0025 V30000 1002.3 45 1.06E-04 9.83E-05 30.88 0.022 120.40 0.1379
9-3 0.0035 0.009 0.0025 V30000 1002.3 45 1.06E-04 9.83E-05 30.88 0.022 117.50 0.1379
9-3 0.0035 0.009 0.0025 V30000 1002.3 60 1.06E-04 9.84E-05 30.88 0.022 125.55 0.1381
9-3 0.0035 0.009 0.0025 V30000 1002.3 45 1.07E-04 9.90E-05 30.88 0.022 123.65 0.1390
9-3 0.0035 0.009 0.0025 V30000 1002.3 60 1.09E-04 1.01E-04 30.88 0.022 121.55 0.1411
9-3 0.0035 0.009 0.0025 V30000 1002.3 50 1.10E-04 1.01E-04 30.88 0.022 120.25 0.1422
9-3 0.0035 0.009 0.0025 V30000 1002.3 50 1.11E-04 1.03E-04 30.88 0.022 123.00 0.1441
9-3 0.0035 0.009 0.0025 V30000 1002.3 60 1.12E-04 1.04E-04 30.88 0.022 128.00 0.1455
9-3 0.0035 0.009 0.0025 V30000 1002.3 70 1.15E-04 1.06E-04 30.88 0.022 140.65 0.1490
9-3 0.0035 0.009 0.0025 V30000 1002.3 60 1.18E-04 1.09E-04 30.88 0.022 119.11 0.1534
9-3 0.0035 0.009 0.0025 V30000 1002.3 70 1.22E-04 1.13E-04 30.88 0.022 162.80 0.1590
9-3 0.0035 0.009 0.0025 V30000 1002.3 85 1.24E-04 1.15E-04 30.88 0.022 139.35 0.1610
9-3 0.0035 0.009 0.0025 V30000 1002.3 60 1.29E-04 1.19E-04 30.88 0.022 126.00 0.1670
9-3 0.0035 0.009 0.0025 V30000 1002.3 60 1.32E-04 1.22E-04 30.88 0.022 123.60 0.1711
40
Table E2 (Continued)
Chamber Radius Radius Radius Liquid Density Tilt Velocity Velocity Viscosity S Tension DCA Ca
(mm * mm) d (m) D (m) (m) (name) (kg/m^3) (degree) (m/s) ADJUSTED (Pa.s) (N/m) used (µv/γ)
9-3 0.0035 0.009 0.0025 V30000 1002.3 80 1.33E-04 1.23E-04 30.88 0.022 123.20 0.1727
9-3 0.0035 0.009 0.0025 V30000 1002.3 60 1.36E-04 1.26E-04 30.88 0.022 126.50 0.1771
9-3 0.0035 0.009 0.0025 V30000 1002.3 85 1.51E-04 1.40E-04 30.88 0.022 138.00 0.1959
9-3 0.0035 0.009 0.0025 V30000 1002.3 85 1.52E-04 1.41E-04 30.88 0.022 164.00 0.1972
10-15 0.0039 0.012 0.0029 V30000 1002.3 1 2.84E-06 2.63E-06 30.88 0.022 40.05 0.0037
10-15 0.0039 0.012 0.0029 V30000 1002.3 1 2.99E-06 2.77E-06 30.88 0.022 52.98 0.0039
10-15 0.0039 0.012 0.0029 V30000 1002.3 1 3.77E-06 3.49E-06 30.88 0.022 44.95 0.0049
10-15 0.0039 0.012 0.0029 V30000 1002.3 1 3.85E-06 3.56E-06 30.88 0.022 50.99 0.0050
10-15 0.0039 0.012 0.0029 V30000 1002.3 1 9.40E-06 8.69E-06 30.88 0.022 78.39 0.0122
10-15 0.0039 0.012 0.0029 V30000 1002.3 5 1.75E-05 1.62E-05 30.88 0.022 83.60 0.0227
10-15 0.0039 0.012 0.0029 V30000 1002.3 15 2.66E-05 2.46E-05 30.88 0.022 90.00 0.0345
10-15 0.0039 0.012 0.0029 V30000 1002.3 10 2.76E-05 2.55E-05 30.88 0.022 90.00 0.0358
10-15 0.0039 0.012 0.0029 V30000 1002.3 5 3.31E-05 3.06E-05 30.88 0.022 83.24 0.0429
10-15 0.0039 0.012 0.0029 V30000 1002.3 5 3.31E-05 3.06E-05 30.88 0.022 73.50 0.0429
10-15 0.0039 0.012 0.0029 V30000 1002.3 20 4.42E-05 4.09E-05 30.88 0.022 102.00 0.0574
10-15 0.0039 0.012 0.0029 V30000 1002.3 10 4.46E-05 4.13E-05 30.88 0.022 94.30 0.0580
10-15 0.0039 0.012 0.0029 V30000 1002.3 10 5.37E-05 4.97E-05 30.88 0.022 94.29 0.0698
10-15 0.0039 0.012 0.0029 V30000 1002.3 5 5.48E-05 5.07E-05 30.88 0.022 78.05 0.0711
10-15 0.0039 0.012 0.0029 V30000 1002.3 20 6.82E-05 6.31E-05 30.88 0.022 96.05 0.0885
10-15 0.0039 0.012 0.0029 V30000 1002.3 30 8.40E-05 7.77E-05 30.88 0.022 107.79 0.1091
10-15 0.0039 0.012 0.0029 V30000 1002.3 30 8.40E-05 7.77E-05 30.88 0.022 109.25 0.1091
10-15 0.0039 0.012 0.0029 V30000 1002.3 45 1.30E-04 1.20E-04 30.88 0.022 128.50 0.1691
10-15 0.0039 0.012 0.0029 V30000 1002.3 45 1.43E-04 1.32E-04 30.88 0.022 153.80 0.1857
2-6 0.002 0.006 0.0015 V500 975.2 5 2.10E-04 1.95E-04 0.486 0.024 65.75 0.0039
2-6 0.002 0.006 0.0015 V500 975.2 5 2.15E-04 1.99E-04 0.486 0.024 57.90 0.0040

41
Table E2 (Continued)
Chamber Radius Radius Radius Liquid Density Tilt Velocity Velocity Viscosity S Tension DCA Ca
(mm * mm) d (m) D (m) (m) (name) (kg/m^3) (degree) (m/s) ADJUSTED (Pa.s) (N/m) used (µv/γ)
2-6 0.002 0.006 0.0015 V500 975.2 5 2.52E-04 2.33E-04 0.486 0.024 63.90 0.0047
2-6 0.002 0.006 0.0015 V500 975.2 10 3.25E-04 3.00E-04 0.486 0.024 62.50 0.0061
2-6 0.002 0.006 0.0015 V500 975.2 5 3.88E-04 3.59E-04 0.486 0.024 68.70 0.0073
2-6 0.002 0.006 0.0015 V500 975.2 10 4.46E-04 4.13E-04 0.486 0.024 72.00 0.0084
2-6 0.002 0.006 0.0015 V500 975.2 10 4.66E-04 4.31E-04 0.486 0.024 70.15 0.0087
2-6 0.002 0.006 0.0015 V500 975.2 15 4.93E-04 4.56E-04 0.486 0.024 69.00 0.0092
2-6 0.002 0.006 0.0015 V500 975.2 10 4.96E-04 4.59E-04 0.486 0.024 70.80 0.0093
2-6 0.002 0.006 0.0015 V500 975.2 20 6.42E-04 5.93E-04 0.486 0.024 73.50 0.0120
2-6 0.002 0.006 0.0015 V500 975.2 25 6.68E-04 6.18E-04 0.486 0.024 76.43 0.0125
2-6 0.002 0.006 0.0015 V500 975.2 20 9.06E-04 8.38E-04 0.486 0.024 89.50 0.0170
2-6 0.002 0.006 0.0015 V500 975.2 30 9.10E-04 8.41E-04 0.486 0.024 78.00 0.0170
2-6 0.002 0.006 0.0015 V500 975.2 15 9.31E-04 8.61E-04 0.486 0.024 85.25 0.0174
2-6 0.002 0.006 0.0015 V500 975.2 20 1.00E-03 9.28E-04 0.486 0.024 86.25 0.0188
2-6 0.002 0.006 0.0015 V500 975.2 20 1.08E-03 9.99E-04 0.486 0.024 85.40 0.0202
2-6 0.002 0.006 0.0015 V500 975.2 40 1.09E-03 1.01E-03 0.486 0.024 81.40 0.0205
2-6 0.002 0.006 0.0015 V500 975.2 50 1.25E-03 1.16E-03 0.486 0.024 81.60 0.0235
2-6 0.002 0.006 0.0015 V500 975.2 70 1.29E-03 1.19E-03 0.486 0.024 87.50 0.0241
2-6 0.002 0.006 0.0015 V500 975.2 30 1.43E-03 1.33E-03 0.486 0.024 89.05 0.0269
2-6 0.002 0.006 0.0015 V500 975.2 30 1.52E-03 1.41E-03 0.486 0.024 92.55 0.0285
2-6 0.002 0.006 0.0015 V500 975.2 80 1.56E-03 1.44E-03 0.486 0.024 90.00 0.0291
2-6 0.002 0.006 0.0015 V500 975.2 60 1.57E-03 1.45E-03 0.486 0.024 90.40 0.0294
2-6 0.002 0.006 0.0015 V500 975.2 30 1.75E-03 1.62E-03 0.486 0.024 91.90 0.0328
2-6 0.002 0.006 0.0015 V500 975.2 30 1.76E-03 1.63E-03 0.486 0.024 93.05 0.0330
2-6 0.002 0.006 0.0015 V500 975.2 45 1.87E-03 1.73E-03 0.486 0.024 101.00 0.0351
2-6 0.002 0.006 0.0015 V500 975.2 50 2.23E-03 2.07E-03 0.486 0.024 98.95 0.0418
42
Table E2 (Continued)
Chamber Radius Radius Radius Liquid Density Tilt Velocity Velocity Viscosity S Tension DCA Ca
(mm * mm) d (m) D (m) (m) (name) (kg/m^3) (degree) (m/s) ADJUSTED (Pa.s) (N/m) used (µv/γ)
2-6 0.002 0.006 0.0015 V500 975.2 45 2.33E-03 2.15E-03 0.486 0.024 96.50 0.0436
2-6 0.002 0.006 0.0015 V500 975.2 70 2.47E-03 2.29E-03 0.486 0.024 102.50 0.0463
2-6 0.002 0.006 0.0015 V500 975.2 45 2.59E-03 2.40E-03 0.486 0.024 99.20 0.0485
2-6 0.002 0.006 0.0015 V500 975.2 45 2.64E-03 2.45E-03 0.486 0.024 100.50 0.0495
2-6 0.002 0.006 0.0015 V500 975.2 60 2.79E-03 2.58E-03 0.486 0.024 100.66 0.0522
2-6 0.002 0.006 0.0015 V500 975.2 60 2.85E-03 2.64E-03 0.486 0.024 105.50 0.0534
2-6 0.002 0.006 0.0015 V500 975.2 60 2.88E-03 2.66E-03 0.486 0.024 101.50 0.0539
2-6 0.002 0.006 0.0015 V500 975.2 80 3.10E-03 2.87E-03 0.486 0.024 108.50 0.0581
2-6 0.002 0.006 0.0015 V500 975.2 80 3.23E-03 2.98E-03 0.486 0.024 100.80 0.0604
2-6 0.002 0.006 0.0015 V500 975.2 60 3.28E-03 3.03E-03 0.486 0.024 105.00 0.0614
2-6 0.002 0.006 0.0015 V500 975.2 85 3.79E-03 3.50E-03 0.486 0.024 105.00 0.0709
2-6 0.002 0.006 0.0015 V500 975.2 80 4.12E-03 3.81E-03 0.486 0.024 104.10 0.0772
9-3 0.0035 0.009 0.0025 V500 975.2 1 8.27E-05 7.65E-05 0.486 0.024 39.57 0.0015
9-3 0.0035 0.009 0.0025 V500 975.2 1 8.27E-05 7.65E-05 0.486 0.024 43.50 0.0015
9-3 0.0035 0.009 0.0025 V500 975.2 5 5.29E-04 4.89E-04 0.486 0.024 70.50 0.0099
9-3 0.0035 0.009 0.0025 V500 975.2 5 5.36E-04 4.96E-04 0.486 0.024 64.70 0.0100
9-3 0.0035 0.009 0.0025 V500 975.2 5 5.59E-04 5.17E-04 0.486 0.024 76.30 0.0105
9-3 0.0035 0.009 0.0025 V500 975.2 5 6.10E-04 5.64E-04 0.486 0.024 71.10 0.0114
9-3 0.0035 0.009 0.0025 V500 975.2 10 1.19E-03 1.10E-03 0.486 0.024 86.90 0.0224
9-3 0.0035 0.009 0.0025 V500 975.2 10 1.38E-03 1.28E-03 0.486 0.024 87.65 0.0259
9-3 0.0035 0.009 0.0025 V500 975.2 15 1.90E-03 1.76E-03 0.486 0.024 97.00 0.0356
9-3 0.0035 0.009 0.0025 V500 975.2 15 2.60E-03 2.41E-03 0.486 0.024 99.00 0.0488
9-3 0.0035 0.009 0.0025 V500 975.2 30 3.54E-03 3.27E-03 0.486 0.024 112.85 0.0663
9-3 0.0035 0.009 0.0025 V500 975.2 30 3.86E-03 3.57E-03 0.486 0.024 117.00 0.0723
9-3 0.0035 0.009 0.0025 V500 975.2 30 3.86E-03 3.57E-03 0.486 0.024 114.00 0.0724

43
Table E2 (Continued)
Chamber Radius Radius Radius Liquid Density Tilt Velocity Velocity Viscosity S Tension DCA Ca
(mm * mm) d (m) D (m) (m) (name) (kg/m^3) (degree) (m/s) ADJUSTED (Pa.s) (N/m) used (µv/γ)
9-3 0.0035 0.009 0.0025 V500 975.2 30 4.59E-03 4.24E-03 0.486 0.024 117.56 0.0860
9-3 0.0035 0.009 0.0025 V500 975.2 30 4.88E-03 4.52E-03 0.486 0.024 115.50 0.0915
9-3 0.0035 0.009 0.0025 V500 975.2 40 5.40E-03 5.00E-03 0.486 0.024 128.05 0.1012
9-3 0.0035 0.009 0.0025 V500 975.2 50 6.73E-03 6.23E-03 0.486 0.024 141.75 0.1261
9-3 0.0035 0.009 0.0025 V500 975.2 45 7.52E-03 6.95E-03 0.486 0.024 151.00 0.1408
9-3 0.0035 0.009 0.0025 V500 975.2 60 7.91E-03 7.31E-03 0.486 0.024 163.40 0.1481
2-4 0.002 0.004 0.0013 V100 966.4 5 1.24E-03 1.14E-03 0.0968 0.0227 61.50 0.0049
2-4 0.002 0.004 0.0013 V100 966.4 15 3.73E-03 3.45E-03 0.0968 0.0227 85.70 0.0147
2-4 0.002 0.004 0.0013 V100 966.4 30 1.78E-03 1.65E-03 0.0968 0.0227 65.56 0.0070
2-4 0.002 0.004 0.0013 V100 966.4 30 8.44E-03 7.80E-03 0.0968 0.0227 90.00 0.0333
2-4 0.002 0.004 0.0013 V100 966.4 30 1.03E-02 9.52E-03 0.0968 0.0227 89.91 0.0406
2-4 0.002 0.004 0.0013 V100 966.4 30 1.08E-02 9.99E-03 0.0968 0.0227 89.16 0.0426
2-4 0.002 0.004 0.0013 V100 966.4 30 1.14E-02 1.06E-02 0.0968 0.0227 90.96 0.0451
2-4 0.002 0.004 0.0013 V100 966.4 40 8.21E-03 7.59E-03 0.0968 0.0227 88.15 0.0324
2-4 0.002 0.004 0.0013 V100 966.4 45 3.50E-03 3.24E-03 0.0968 0.0227 74.72 0.0138
2-4 0.002 0.004 0.0013 V100 966.4 60 1.27E-02 1.17E-02 0.0968 0.0227 95.78 0.0499
2-4 0.002 0.004 0.0013 V100 966.4 60 1.47E-02 1.36E-02 0.0968 0.0227 96.00 0.0582
2-4 0.002 0.004 0.0013 V100 966.4 60 1.86E-02 1.72E-02 0.0968 0.0227 103.38 0.0732
2-4 0.002 0.004 0.0013 V100 966.4 60 1.87E-02 1.73E-02 0.0968 0.0227 100.17 0.0737
2-4 0.002 0.004 0.0013 V100 966.4 60 2.07E-02 1.91E-02 0.0968 0.0227 112.45 0.0815
2-4 0.002 0.004 0.0013 V100 966.4 70 1.44E-02 1.34E-02 0.0968 0.0227 98.50 0.0570
2-4 0.002 0.004 0.0013 V100 966.4 70 1.80E-02 1.67E-02 0.0968 0.0227 102.25 0.0711
2-4 0.002 0.004 0.0013 V100 966.4 80 1.60E-02 1.48E-02 0.0968 0.0227 97.19 0.0631
2-4 0.002 0.004 0.0013 V100 966.4 80 2.12E-02 1.96E-02 0.0968 0.0227 104.50 0.0836
2-4 0.002 0.004 0.0013 V100 966.4 80 2.18E-02 2.01E-02 0.0968 0.0227 117.21 0.0859
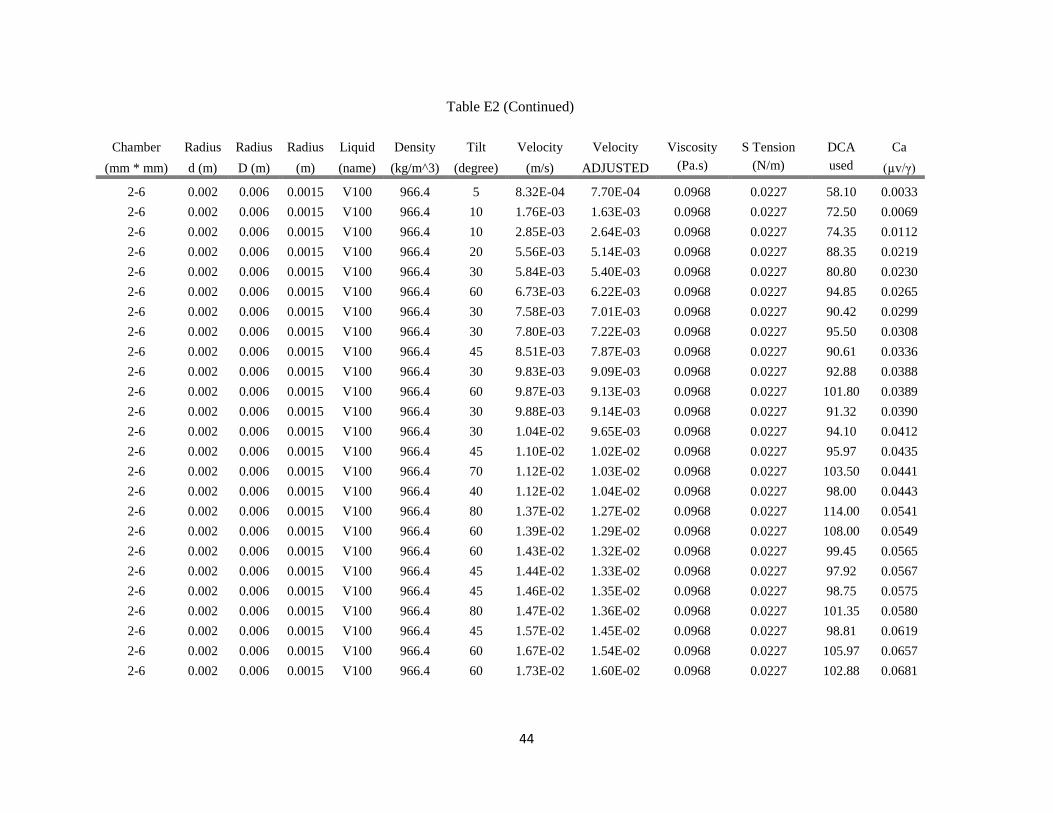
44
Table E2 (Continued)
Chamber Radius Radius Radius Liquid Density Tilt Velocity Velocity Viscosity S Tension DCA Ca
(mm * mm) d (m) D (m) (m) (name) (kg/m^3) (degree) (m/s) ADJUSTED (Pa.s) (N/m) used (µv/γ)
2-6 0.002 0.006 0.0015 V100 966.4 5 8.32E-04 7.70E-04 0.0968 0.0227 58.10 0.0033
2-6 0.002 0.006 0.0015 V100 966.4 10 1.76E-03 1.63E-03 0.0968 0.0227 72.50 0.0069
2-6 0.002 0.006 0.0015 V100 966.4 10 2.85E-03 2.64E-03 0.0968 0.0227 74.35 0.0112
2-6 0.002 0.006 0.0015 V100 966.4 20 5.56E-03 5.14E-03 0.0968 0.0227 88.35 0.0219
2-6 0.002 0.006 0.0015 V100 966.4 30 5.84E-03 5.40E-03 0.0968 0.0227 80.80 0.0230
2-6 0.002 0.006 0.0015 V100 966.4 60 6.73E-03 6.22E-03 0.0968 0.0227 94.85 0.0265
2-6 0.002 0.006 0.0015 V100 966.4 30 7.58E-03 7.01E-03 0.0968 0.0227 90.42 0.0299
2-6 0.002 0.006 0.0015 V100 966.4 30 7.80E-03 7.22E-03 0.0968 0.0227 95.50 0.0308
2-6 0.002 0.006 0.0015 V100 966.4 45 8.51E-03 7.87E-03 0.0968 0.0227 90.61 0.0336
2-6 0.002 0.006 0.0015 V100 966.4 30 9.83E-03 9.09E-03 0.0968 0.0227 92.88 0.0388
2-6 0.002 0.006 0.0015 V100 966.4 60 9.87E-03 9.13E-03 0.0968 0.0227 101.80 0.0389
2-6 0.002 0.006 0.0015 V100 966.4 30 9.88E-03 9.14E-03 0.0968 0.0227 91.32 0.0390
2-6 0.002 0.006 0.0015 V100 966.4 30 1.04E-02 9.65E-03 0.0968 0.0227 94.10 0.0412
2-6 0.002 0.006 0.0015 V100 966.4 45 1.10E-02 1.02E-02 0.0968 0.0227 95.97 0.0435
2-6 0.002 0.006 0.0015 V100 966.4 70 1.12E-02 1.03E-02 0.0968 0.0227 103.50 0.0441
2-6 0.002 0.006 0.0015 V100 966.4 40 1.12E-02 1.04E-02 0.0968 0.0227 98.00 0.0443
2-6 0.002 0.006 0.0015 V100 966.4 80 1.37E-02 1.27E-02 0.0968 0.0227 114.00 0.0541
2-6 0.002 0.006 0.0015 V100 966.4 60 1.39E-02 1.29E-02 0.0968 0.0227 108.00 0.0549
2-6 0.002 0.006 0.0015 V100 966.4 60 1.43E-02 1.32E-02 0.0968 0.0227 99.45 0.0565
2-6 0.002 0.006 0.0015 V100 966.4 45 1.44E-02 1.33E-02 0.0968 0.0227 97.92 0.0567
2-6 0.002 0.006 0.0015 V100 966.4 45 1.46E-02 1.35E-02 0.0968 0.0227 98.75 0.0575
2-6 0.002 0.006 0.0015 V100 966.4 80 1.47E-02 1.36E-02 0.0968 0.0227 101.35 0.0580
2-6 0.002 0.006 0.0015 V100 966.4 45 1.57E-02 1.45E-02 0.0968 0.0227 98.81 0.0619
2-6 0.002 0.006 0.0015 V100 966.4 60 1.67E-02 1.54E-02 0.0968 0.0227 105.97 0.0657
2-6 0.002 0.006 0.0015 V100 966.4 60 1.73E-02 1.60E-02 0.0968 0.0227 102.88 0.0681
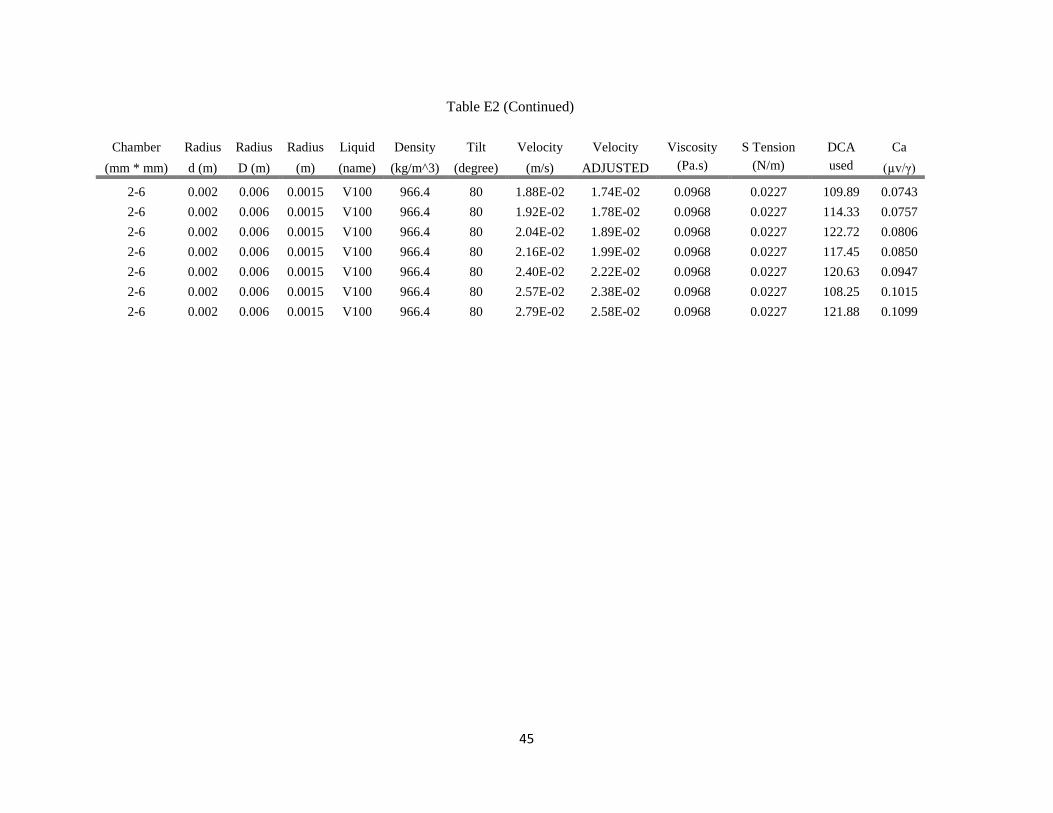
45
Table E2 (Continued)
Chamber Radius Radius Radius Liquid Density Tilt Velocity Velocity Viscosity S Tension DCA Ca
(mm * mm) d (m) D (m) (m) (name) (kg/m^3) (degree) (m/s) ADJUSTED (Pa.s) (N/m) used (µv/γ)
2-6 0.002 0.006 0.0015 V100 966.4 80 1.88E-02 1.74E-02 0.0968 0.0227 109.89 0.0743
2-6 0.002 0.006 0.0015 V100 966.4 80 1.92E-02 1.78E-02 0.0968 0.0227 114.33 0.0757
2-6 0.002 0.006 0.0015 V100 966.4 80 2.04E-02 1.89E-02 0.0968 0.0227 122.72 0.0806
2-6 0.002 0.006 0.0015 V100 966.4 80 2.16E-02 1.99E-02 0.0968 0.0227 117.45 0.0850
2-6 0.002 0.006 0.0015 V100 966.4 80 2.40E-02 2.22E-02 0.0968 0.0227 120.63 0.0947
2-6 0.002 0.006 0.0015 V100 966.4 80 2.57E-02 2.38E-02 0.0968 0.0227 108.25 0.1015
2-6 0.002 0.006 0.0015 V100 966.4 80 2.79E-02 2.58E-02 0.0968 0.0227 121.88 0.1099
46
REFERENCES
Aminzadeh, B., D. A. DiCarlo, and R. Wallach (2011), The Effect of Contact Angle on
Saturation Overshoot, Vadose Zone Journal, 10(1), 466–468, doi:10.2136/vzj2010.0047.
Bajpai, A. K., and S. Khandekar (2012), Simulation of Heat Transfer in Liquid Plugs Moving
Inside Dry Capillary Tubes, p. 6, Lyon, France. [online] Available from:
http://home.iitk.ac.in/~samkhan/Bio_data/publications/Khandekar_Conf_40.pdf
Bian, X., W. W. Schultz, and M. Perlin (2003), Liquid slug motion and contact lines in an
oscillatory capillary tube, University of Michigan. [online] Available from: http://www-
personal.umich.edu/~schultz/Manuscripts/BianSchultzPerlin.pdf
Bico, J., and D. Quéré (2001), Falling Slugs, Journal of Colloid and Interface Science, 243(1),
262–264, doi:10.1006/jcis.2001.7891.
Bico, J., and D. Quéré (2002), Self-propelling slugs, Journal of Fluid Mechanics, 467,
doi:10.1017/S002211200200126X. [online] Available from:
http://adsabs.harvard.edu/abs/2002JFM...467..101B (Accessed 30 January 2012)
Blake, T., and J. Haynes (1969), Kinetics of liquidliquid displacement, Journal of Colloid and
Interface Science, 30(3), 421–423, doi:10.1016/0021-9797(69)90411-1.
Blake, T. D. (2006), The physics of moving wetting lines., Journal of Colloid and Interface
Science, 299(1), 1–13.
Blunt, M., D. Zhou, and D. Fenwick (1995), Three-phase flow and gravity drainage in porous
media, Transport in Porous Media, 20(1), 77–103, doi:10.1007/BF00616926.
Bond, R. (1964), The influence of the microflora on the physical properties of soils. II. Field
studies on water repellent sands, Soil Res., 2(1), 123–131.
Brochard-Wyart, F., and P. G. de Gennes (1992), Dynamics of partial wetting, Advances in
Colloid and Interface Science, 39(0), 1–11, doi:10.1016/0001-8686(92)80052-Y.
Burlatsky, S. F., G. Oshanin, A. M. Cazabat, and M. Moreau (1996), Microscopic Model of
Upward Creep of an Ultrathin Wetting Film, Phys. Rev. Lett., 76(1), 86–89,
doi:10.1103/PhysRevLett.76.86.
Cherry, B. ., and C. . Holmes (1969), Kinetics of wetting of surfaces by polymers, Journal of
Colloid and Interface Science, 29(1), 174–176, doi:10.1016/0021-9797(69)90367-1.
Chuoke, R. L., P. van Meurs, and C. van der Poel (1959), The instability of slow, immiscible,
viscous liquid-liquid displacements in permeable media, Trans. Am. Inst. Min. Metall.
Pet. Eng., 216, 188– 194.

47
Clarke, A., T. D. Blake, K. Carruthers, and A. Woodward (2002), Spreading and Imbibition of
Liquid Droplets on Porous Surfaces, Langmuir, 18(8), 2980–2984,
doi:10.1021/la0117810.
Cox, R. G. (1986), The dynamics of the spreading of liquids on a solid surface. Part 1. Viscous
flow, Journal of Fluid Mechanics, 168, 169–194, doi:10.1017/S0022112086000332.
Van Dam, D. B., and C. Le Clerc (2004), Experimental study of the impact of an ink-jet printed
droplet on a solid substrate, Physics of Fluids, 16(9), 3403–3414,
doi:doi:10.1063/1.1773551.
DiCarlo, D. A. (2007), Capillary pressure overshoot as a function of imbibition flux and initial
water content, Water Resour. Res., 43(8), W08402, doi:10.1029/2006WR005550.
Dussan, E. B. (1979), On the Spreading of Liquids on Solid Surfaces: Static and Dynamic
Contact Lines, Annual Review of Fluid Mechanics, 11(1), 371–400,
doi:10.1146/annurev.fl.11.010179.002103.
Dussan V., E. B. (1976), The moving contact line: the slip boundary condition, Journal of Fluid
Mechanics, 77(04), 665–684, doi:10.1017/S0022112076002838.
Dussan V., E. B., and S. H. Davis (1974), On the Motion of a Fluid-Fluid Interface Along a Solid
Surface, Journal of Fluid Mechanics, 65(01), 71–95, doi:10.1017/S0022112074001261.
De Gennes, P. G. (1985), Wetting: statics and dynamics, Rev. Mod. Phys., 57(3), 827–863,
doi:10.1103/RevModPhys.57.827.
Extrand (2007), Retention Forces of a Liquid Slug in a Rough Capillary Tube with Symmetric or
Asymmetric Features, Langmuir, 23(4), 1867–1871, doi:10.1021/la0625289.
Fermigier, M., and P. Jenffer (1991), An experimental investigation of the dynamic contact angle
in liquid-liquid systems, Journal of Colloid and Interface Science, 146(1), 226–241,
doi:10.1016/0021-9797(91)90020-9.
Glass, R. J., T. S. Steenhuis, and J.-Y. Parlange (1989), Wetting front instability: 2. Experimental
determination of relationships between system parameters and two-dimensional unstable
flow field behavior in initially dry porous media, Water Resources Research, 25(6),
1195–1207, doi:10.1029/WR025i006p01195.
Hansen, R., and T. Toong (1971a), Dynamic contact angle and its relationship to forces of
hydrodynamic origin, Journal of Colloid and Interface Science, 37(1), 196–207,
doi:10.1016/0021-9797(71)90280-3.
Hansen, R., and T. Toong (1971b), Interface behavior as one fluid completely displaces another
from a small-diameter tube, Journal of Colloid and Interface Science, 36(3), 410–413,
doi:10.1016/0021-9797(71)90014-2.
48
Hill, D. E., and J.-Y. Parlange (1972), Wetting Front Instability in Layered Soils, Soil Science
Society of America Journal, 36(5), 697–702,
doi:10.2136/sssaj1972.03615995003600050010x.
Hillel, D., and R. S. Baker (1988), A descriptive theory of fingering during infiltration into
layered soils, Soil Science, 146(1), 51–56, doi:10.1097/00010694-198807000-00008.
Hoffman, R. L. (1975), A study of the advancing interface. I. Interface shape in liquid—gas
systems, Journal of Colloid and Interface Science, 50(2), 228–241, doi:10.1016/0021-
9797(75)90225-8.
Huh, C., and L. Scriven (1971), Hydrodynamic model of steady movement of a solid/liquid/fluid
contact line, Journal of Colloid and Interface Science, 35(1), 85–101, doi:10.1016/0021-
9797(71)90188-3.
Huh, C., and S. Mason (1977), The steady movement of a liquid meniscus in a capillary tube, J.
Fluid Mech, 81(part 3), 401–419.
Jarvis, N. J. (2007), A review of non-equilibrium water flow and solute transport in soil
macropores: principles, controlling factors and consequences for water quality, European
Journal of Soil Science, 58(3), 523–546, doi:10.1111/j.1365-2389.2007.00915.x.
Jarvis, N. J., P.-E. Jansson, P. E. Dik, and I. Messing (1991), Modelling water and solute
transport in macroporous soil. I. Model description and sensitivity analysis, Journal of
Soil Science, 42(1), 59–70, doi:10.1111/j.1365-2389.1991.tb00091.x.
Jiang, T.-S., O. . Soo-Gun, and J. C. Slattery (1979), Correlation for dynamic contact angle,
Journal of Colloid and Interface Science, 69(1), 74–77, doi:10.1016/0021-
9797(79)90081-X.
Lee, P.-S., S. V. Garimella, and D. Liu (2005), Investigation of heat transfer in rectangular
microchannels, International Journal of Heat and Mass Transfer, 48(9), 1688–1704,
doi:10.1016/j.ijheatmasstransfer.2004.11.019.
Legait, B., and P. Sourieau (1985), Effect of geometry on advancing contact angles in fine
capillaries, Journal of Colloid and Interface Science, 107(1), 14–20, doi:10.1016/0021-
9797(85)90144-4.
Liu, Y., J.-Y. Parlange, T. S. Steenhuis, and R. Haverkamp (1995), A Soil Water Hysteresis
Model for Fingered Flow Data, Water Resources Research, 31(9), 2263,
doi:10.1029/95WR01649.
Lowry, T. H. (1997), Removing Silicone Grease from Glassware, J. Chem. Educ., 74(7), 841,
doi:10.1021/ed074p841.
Lunati, I., and D. Or (2009), Gravity-driven slug motion in capillary tubes, Physics of Fluids,
21(5), 052003, doi:10.1063/1.3125262.

49
Ngan, C. G., and E. B. Dussan V. (1982), On the Nature of the Dynamic Contact Angle: An
Experimental Study, Journal of Fluid Mechanics, 118, 27–40,
doi:10.1017/S0022112082000949.
Ngan, C. G., and E. B. Dussan V. (1989), On the dynamics of liquid spreading on solid surfaces,
Journal of Fluid Mechanics, 209, 191–226, doi:10.1017/S0022112089003071.
Nieminen, J. A., D. B. Abraham, M. Karttunen, and K. Kaski (1992), Molecular dynamics of a
microscopic droplet on solid surface, Phys. Rev. Lett., 69(1), 124–127,
doi:10.1103/PhysRevLett.69.124.
Parlange, J.-Y., and D. Hill (1976), Theoretical Analysis of Wetting Frong Instability in Soils,
Soil Science October 1976, 122(4), 236–239.
Raats, P. a. C. (1973), Unstable Wetting Fronts in Uniform and Nonuniform Soils, Soil Science
Society of America Journal, 37(5), 681–685,
doi:10.2136/sssaj1973.03615995003700050017x.
Ralston, J., M. Popescu, and R. Sedev (2008), Dynamics of Wetting from an Experimental Point
of View, Annual Review of Materials Research, 38(1), 23–43,
doi:10.1146/annurev.matsci.38.060407.130231.
Rose, W., and R. W. Heins (1962), Moving interfaces and contact angle rate-dependency,
Journal of Colloid Science, 17(1), 39–48, doi:10.1016/0095-8522(62)90074-0.
Saffman, P. G., and G. Taylor (1958), The Penetration of a Fluid into a Porous Medium or Hele-
Shaw Cell Containing a More Viscous Liquid, Proc. R. Soc. Lond. A, 245(1242), 312–
329, doi:10.1098/rspa.1958.0085.
Selker, J. S., T. S. Steenhuis, and J.-Y. Parlange (1992), Wetting Front Instability in
Homogeneous Sandy Soils under Continuous Infiltration, Soil Science Society of America
Journal, 56(5), 1346–1350, doi:10.2136/sssaj1992.03615995005600050003x.
Senn, P. (2007), Spotting of Colloidal Particles, 18 July. [online] Available from:
http://www.lbb.ethz.ch/Publications/Diploma_semester_works/Spotting_Colloidal_Partic
les_PhilippSenn.pdf
Shang, J., M. Flury, J. B. Harsh, and R. L. Zollars (2008), Comparison of different methods to
measure contact angles of soil colloids, Journal of Colloid and Interface Science, 328(2),
299–307, doi:10.1016/j.jcis.2008.09.039.
Da Silva, D. L., C. J. L. Hermes, C. Melo, J. M. Gonçalves, and G. C. Weber (2009), A study of
transcritical carbon dioxide flow through adiabatic capillary tubes, International Journal
of Refrigeration, 32(5), 978–987, doi:10.1016/j.ijrefrig.2008.10.010.
Spildo, K., and J. S. Buckley (1999), Uniform and mixed wetting in square capillaries, Journal of
Petroleum Science and Engineering, 24(2–4), 145–154, doi:10.1016/S0920-
4105(99)00038-8.
50
Stadler, Mondon, and Ziegler (2003), Protein adsorption on surfaces: dynamic contact-angle
(DCA) and quartz-crystal microbalance (QCM) measurements, Analytical and
Bioanalytical Chemistry, 375(1), 53–61, doi:10.1007/s00216-002-1664-5.
Starr, J. L., H. C. DeRoo, C. R. Frink, and J.-Y. Parlange (1978), Leaching Characteristics of a
Layered Field Soil, Soil Science Society of America Journal, 42(3), 386–391,
doi:10.2136/sssaj1978.03615995004200030002x.
Stroup, W. H., R. W. Dickerson, and R. B. Read (1969), Two-Phase Slug Flow Heat Exchanger
for Microbial Thermal Inactivation Research, Appl Microbiol, 18(5), 889–892.
Taha, T., and Z. F. Cui (2006), CFD modelling of slug flow inside square capillaries, Chemical
Engineering Science, 61(2), 665–675, doi:10.1016/j.ces.2005.07.023.
Tanner, L. H. (1979), The spreading of silicone oil drops on horizontal surfaces, Journal of
Physics D: Applied Physics, 12(9), 1473–1484, doi:10.1088/0022-3727/12/9/009.
Thompson, P. A., and M. O. Robbins (1989), Simulations of contact-line motion: Slip and the
dynamic contact angle, Phys. Rev. Lett., 63(7), 766–769,
doi:10.1103/PhysRevLett.63.766.
Tsai, T. M., and M. J. Miksis (1994), Dynamics of a Drop in a Constricted Capillary Tube,
Journal of Fluid Mechanics, 274, 197–217, doi:10.1017/S0022112094002090.
Velzenberger, E., K. E. Kirat, G. Legeay, M.-D. Nagel, and I. Pezron (2009), Characterization of
biomaterials polar interactions in physiological conditions using liquid–liquid contact
angle measurements: Relation to fibronectin adsorption, Colloids and Surfaces B:
Biointerfaces, 68(2), 238–244, doi:10.1016/j.colsurfb.2008.10.022.
Voinov, O. V. (1977), Hydrodynamics of wetting, Fluid Dynamics, 11(5), 714–721,
doi:10.1007/BF01012963.
Zhang, J., and B. J. Balcom (2010), Magnetic resonance imaging of two-component liquid-liquid
flow in a circular capillary tube, Phys. Rev. E, 81(5), 056318,
doi:10.1103/PhysRevE.81.056318.

![[Hydrology] Groundwater Hydrology - David K. Todd (2005)](https://static.fdocuments.in/doc/165x107/548ce7beb47959e2288b45f9/hydrology-groundwater-hydrology-david-k-todd-2005.jpg)


![[hydrology] groundwater hydrology - david k. todd (2005).pdf](https://static.fdocuments.in/doc/165x107/577c77961a28abe0548cb0b1/hydrology-groundwater-hydrology-david-k-todd-2005pdf.jpg)