2013 ANNUAL REPORT - Parliament of Western · PDF fileRACING AND WAGERING WESTERN AUSTRALIA...
84
2013 ANNUAL REPORT
Transcript of 2013 ANNUAL REPORT - Parliament of Western · PDF fileRACING AND WAGERING WESTERN AUSTRALIA...

2 0 1 3 A N N U A L R E P O R T

ANNUAL REPORT 2012 – 2013RACING AND WAGERING WESTERN AUSTRALIA
P U R P O S ETO PROVIDE A POSITIVE SUSTAINABLE FUTURE FOR THE
WESTERN AUSTRALIAN RACING INDUSTRY
V I S I O NMAKING OUR RACING GREAT
VA L U E SCUSTOMER FIRST | TEAMWORK | ACHIEVEMENT | COMMERCIAL FOCUS

3
ANNUAL REPORT 2012 – 2013RACING AND WAGERING WESTERN AUSTRALIA
For the year ended 31 July 2013
Hon Terry Waldron, MLAMinister for Sport and Recreation; Racing and GamingIn accordance with Section 61 of the Financial Management Act 2006, we hereby submit for your information and presentation to Parliament, the Annual Report of Racing and Wagering Australia for the financial year ended 31 July 2013.The annual report has been prepared in accordance with the provisions of the Financial Management Act 2006 and the Racing and Wagering Australia Act 2003.
STATEMENT OF COMPLIANCE
Jefferey OvensRWWA Chairman
14 October 2013
James FreemantleDeputy Board Chairman and Chairman RWWA Integrity Assurance Committee
14 October 2013

4
ANNUAL REPORT 2012 – 2013RACING AND WAGERING WESTERN AUSTRALIA
Statement of Compliance 3Table of Contents 4Chapter One: Overview 5
Executive Summary 6
Operational Structure 9
Organisation Structure 11
Racing and Wagering Western Australian Board 11
Performance Management Framework 14
Chapter Two: Report on Operations 15Racing 16
Racing Integrity 23
Marketing 25
Retail 28
Information Services 29
Finance and Business Services 30
Human Resources 30
Chapter Three: Disclosures and Legal Compliance 31Opinion of the Auditor General 32
Certification of Financial Statements 34
Financial Statements 35
Statement of Comprehensive Income 35
Statement of Financial Position 36
Statement of Changes in Equity 37
Statement of Cash Flows 38
Certification of Key Performance Indicators 73
Key Performance Indicators 74
Other Financial Disclosures 78
Governance Disclosures 79
Other Legal Requirements 82
Government Policy Requirements 83
CONTENTS

ANNUAL REPORT 2012 – 2013RACING AND WAGERING WESTERN AUSTRALIA
CHAPTER ONE OVERV I EW
Image by Scott Hollands
CONTENTS

6
ANNUAL REPORT 2012 – 2013RACING AND WAGERING WESTERN AUSTRALIA
OVERVIEW
Year in Review – Financial Performance2013 was a successful year for Racing and Wagering Western Australia (RWWA) both strategically and operationally.
On the key measure of financial performance, funding to the racing industry reached a new record totalling $116M. An additional $4M was also distributed to the Sports Wagering Account used to fund community based sporting initiatives in Western Australia.
This increase in funding was made possible by the solid performance of RWWA’s wagering business the WATAB. Overall wagering margin after tax of $205.3M represented an increase of 5.2% over the previous year.
Parimutuel margin after tax grew by 3% as a result of RWWA’s new pooling agreement and its expansion into the international premium market.
As referenced in the 2012 Annual Report, RWWA entered into a new long term pooling agreement with Tabcorp in August 2012. This agreement created an improved financial and strategic outcome for RWWA and the racing industry. As a result of the agreement, RWWA expanded its comingling arrangements into SuperTAB to include First Four, Quinella, Exacta and Doubles pools. In addition, RWWA was able to combine its standalone pools on South Africa and Singapore races to provide a more attractive service to its customers. The response
from customers as expected was very positive generating significant financial return to customers and in turn RWWA.
Core Parimutuel sales remain the main contributor to the wagering business, however, during the year, customers were provided with the opportunity to bet on a greater volume of fixed odds racing markets. Whilst core parimutuel sales were predictably impacted, fixed odds margin after tax achieved a 31% increase more than offsetting the reduction in pari–mutuel margin.
Sports betting continued its year on year growth achieving a 16% increase over the prior year’s margin after tax result.
Expenses growth of 1.9%Expense growth for the provision of Wagering, Racing and Support services including depreciation were constrained to a 1.9% increase over the prior year.
In addition to the solid results from RWWA’s wagering business, the WA Racing Bets Levy (Product Fees) increased by $3.4M over 2012 to $31.1M. RWWA’s payment to interstate and overseas racing authorities totalled $33.3M realising a net gap in fees received of $2.2M in 2013.
RWWA’s overall financial result delivered a credible net surplus of $9.3M and an additional $11.6M in cash.
Executive Summary
Distributions, Grants and Subsidies
2009/10 2010/11 2011/12 2012/13
Distributions, Grants & Subsidies
Sports Distributions
120
$M
110
100
90
80
Revenue after Cost of Sales and Tax
2009/10 2010/11 2011/12 2012/13
220
$M
200
180
160
140
120
$116M distributed to the Western Australian Racing Industry
Margin after tax growth of 5.2%
OVERVIEW

77
ANNUAL REPORT 2012 – 2013RACING AND WAGERING WESTERN AUSTRALIA
OVERVIEW
Significant Issues & TrendsDuring the latter part of the 2013 financial year there was a marked change in consumer confidence, directly impacting discretionary spend on wagering. Whilst revenues grew by 5.1% for the year, the majority of this growth occurred in the first eight months. From April, wagering in Western Australia was negatively impacted by the downturn in mining together with the economic uncertainty created at a national level. The challenge leading into 2014 is the ongoing subdued state of the mining industry and the wider economy resulting in poor consumer confidence. Internal economic modelling suggests difficult trading conditions until mid 2014 providing for a conservative growth outlook for the next financial year.
Competition for wagering customers is expected to continue at current levels for the foreseeable future. English and European bookmakers continue to access the Australian wagering market either directly or through existing small to midsized operators via acquisition. The end result is continued pressure on margins and the need to invest increasing amounts on systems, products and marketing to capture and retain customers. To date, RWWA has been able to compete favourably on these fronts and plans to elevate its investment in these areas in 2014 in response to competition and also the poor economic outlook.
In October 2012, the important issue relating to retail exclusivity was addressed with a favourable outcome decided in the Full Court in the Victorian Federal Court. The matter involved a corporate bookmaker challenging the Victorian Government’s right to control betting outlets (kiosks) in that state, a decision that is equally significant for the state of Western Australia.
The changing landscape for product fees continues to impact wagering businesses nationally and in turn their capacity to fund their respective state racing industries. During 2013, a number of racing authorities changed the rate and method for calculating fees resulting in direct cost increases to RWWA. This is a critically important area that continues to be managed on a fragmented state by state basis. It is likely that this escalating trend will continue into 2014 with state racing authorities seeking additional revenues from wagering operators to supplement flat distributions from their state TAB.
In September 2012, RWWA released a report on the Western Australian racing industry which it commissioned to highlight the importance of the racing industry in terms of economic and social impact. The following information summarises the key outcomes from the report.
▪ Number of people employed and participating in the industry totals 33,686
▪ Total value added generated by racing is $594M of which $551M is direct expenditure
▪ Full time equivalent employment in racing is 6,737
▪ Over 868,000 Western Australians attended race meetings
▪ There are 55 race clubs conducting a total of 874 races
▪ The state government receives more than $40M from wagering taxes (2012/13).
Executive Summary
OVERVIEW

8
ANNUAL REPORT 2012 – 2013RACING AND WAGERING WESTERN AUSTRALIA
OVERVIEW
Executive Summary
Whilst the report highlighted the very significant contribution racing generates, an equally important outcome was the positive recreational and social benefits created by the sport. Over 114 community organisations are assisted by racing clubs and in excess of 160 community organisations share racing club facilities.
In 2012/13 grant funding to the value of $3.2M was approved by the Minister for Racing and Gaming for a total of 43 projects to address issues such as occupational health and safety and basic race day infrastructure maintenance. This investment was made possible by the State Governments establishment of a five year Racing Industry Grants Program and supplemented through Royalties for Regions funding.
While this important program has assisted many clubs in addressing ageing infrastructure, a plan to cater for larger projects such as track surfaces and public facilities remains outstanding. The current program expires at the end of 2015.
OutlookRWWA will increase it’s investment in areas such as marketing, systems development, and wagering channels and products. In the first quarter of the financial year RWWA plans a significant communication campaign highlighting to customers the culmination of recent investment in new web sites, mobile applications
and wagering products. In addition a rebranding of the WATAB and it’s fixed odds business will take place linking the important role the WATAB has in funding the Western Australian racing industry.
As previously discussed, the economic outlook is likely to remain subdued impacting consumer spend towards wagering. Additionally competition nationally is expected to continue at or around current levels. RWWA has a resilient business model to deal with these challenges and has committed to increase racing industry funding for the three codes to $120M in 2014.
As Chairman and Chief Executive Officer, we would like to take this opportunity to recognise the significant contribution made by staff, agents and racing industry participants and thank them for their efforts throughout 2013.
Our appreciation is also extended to the Minister for Racing and Gaming, the Hon. Terry Waldron and his staff for their ongoing support.
As Chairman, I would like to thank the RWWA Board members for their contribution towards the ongoing success of the organisation. During the year I replaced Mr Ross Bowe as Chairman upon his retirement. I would like to thank Ross on behalf of all stakeholders for the firm foundations he helped develop, for the good of the whole industry.
OVERVIEW
Jefferey OvensChairman
Richard BurtCEO

99
ANNUAL REPORT 2012 – 2013RACING AND WAGERING WESTERN AUSTRALIA
OVERVIEW
Enabling LegislationRacing and Wagering Western Australia commenced operations on 1 August 2003 upon the promulgation of the Racing and Wagering Western Australia Act 2003. The act established RWWA as the controlling authority for thoroughbred, harness and greyhound racing in Western Australia, together with the responsibility for off–course TAB wagering. Implementation of RWWA’s responsibilities occurred in two stages.
Effective 1 August 2003, RWWA assumed the principal club/controlling authority responsibilities of the Western Australian Turf Club, Western Australian Trotting Association and Western Australian Greyhound Racing Authority. On 30 January 2004, the Totalisator Agency Board Betting Act 1960 was repealed and RWWA assumed responsibility for the conduct of off–course TAB wagering. The Racing and Wagering Western Australia Regulations 2003 were enacted to establish key employee licensing procedures relating to RWWA’s wagering activities and to include those provisions of the
Totalisator Agency Board (Betting) Regulations 1988 needed to control RWWA wagering activities. To complement the formation of RWWA, the Betting Control Board, established under the Betting Control Act 1954, was abolished and it’s functions transferred to the Gaming Commission of Western Australia, which was re–titled the Gaming and Wagering Commission of Western Australia. Hence, the Gaming and Wagering Commission, under the Gaming and Wagering Commission Act 1987, now regulates RWWA’s gambling activities.
As part of the legislative package to establish RWWA, the Totalisator Agency Board Betting Tax Act 1960 was repealed and replaced by the Racing and Wagering Western Australia Tax Act 2003; and the Racing Restriction Act 2003. Under the Racing Restriction Act, no thoroughbred, harness or greyhound race for prize or reward (exceeding $50 in value) may be held without a licence from RWWA.
Operational Structure

10
ANNUAL REPORT 2012 – 2013RACING AND WAGERING WESTERN AUSTRALIA
OVERVIEW
LegislationThe principal legislation governing RWWA is:
▪ Racing and Wagering Western Australia Act 2003 ▪ Racing and Wagering Western Australia Tax Act 2003 ▪ Racing Restriction Act 2003 ▪ Racing Bets Levy Act 2009 ▪ Gaming and Wagering Commission Act 1987 ▪ Betting Control Act 1954
Other legislation to which RWWA must comply includes the following. The list is not exhaustive but represents the legislation which impacts on the general operation of RWWA.
▪ Anti–Money Laundering and Counter Terrorism Financing Act 2006
▪ Copyright Act 1968 (Commonwealth) ▪ Corruption and Crime Commission Act 2003 ▪ Clerk (Racing Industry Betting) Award 1987 ▪ Criminal Code Act 1913 (WA) and Criminal
Code Act 1995 (Commonwealth) ▪ Electoral Act 1907 ▪ Equal Opportunity Act 1984 ▪ Financial Management Act 2006 ▪ Freedom of Information Act 1992 ▪ Gaming and Betting (Contract Securities) Act 1985 ▪ Government Officers’ Salaries, Allowances
and Conditions Award 1989 ▪ Interactive Gambling Act 2001 ▪ Long Service Leave Act 1958 ▪ Occupational Safety and Health Act 1984 ▪ Patents Act 1990 ▪ Public Interest Disclosure Act 2003 ▪ State Superannuation Act 2000 ▪ Statutory Corporations (Liabilities of Directors) Act 1996 ▪ Superannuation Guarantee (Administration) Act 1992 ▪ Trade Marks Act 1995 ▪ Trade Practice Act 1974 ▪ Unclaimed Money Act 1990 ▪ Workers Compensation and Injury
Management Act 1981 (WA) ▪ The Fair Work (Transitional Provisions and
Consequential Amendments) Bill 2009 ▪ Fair Work Act 2009
Responsible MinisterThe Hon. Terry Waldron MLA (Minister for Sport and Recreation; Racing and Gaming) is the Minister responsible for Racing and Wagering Western Australia.
Operational Structure

11
ANNUAL REPORT 2012 – 2013RACING AND WAGERING WESTERN AUSTRALIA
OVERVIEW
Organisation StructureThe organisational structure of RWWA is based on a corporate model comprising a number of divisions which oversee the varying activities of the organisation.
Racing And Wagering Western Australian BoardThe management of RWWA’s business and affairs is under the direction of the RWWA Board.
Operational Structure
Chief Executive OfficerRichard Burt
Information ServicesGeneral Manager
Mike Meehan
MarketingGeneral Manager
Alister Shennan
Human ResourceGeneral ManagerMatthew Thomas
Finance and Business ServicesGeneral Manager
Julian Hilton–Barber
Racing – General ManagerKen Norquay
Racing IntegrityGeneral Manager Racing Integrity
Denis Borovica
Retail – General ManagerMichael Saunders
Standing (L–R): Mr James Freemantle, Mr Gary Gliddon, Mr Robert Charles Pearson, Mr John Leslie Bradshaw, Professor John YovichSeated (L–R): Dr Lianne Cretney–Barnes, Mr Jefferey Ovens, Mr Ross Cooper

12
ANNUAL REPORT 2012 – 2013RACING AND WAGERING WESTERN AUSTRALIA
OVERVIEW
Board Members
Mr Jefferey Ovens (Chairman)
First appointed 1 February 2013
Mr James Freemantle (Deputy Chairman)
First appointed 1 August 2003
Mr Ross Cooper (Nominated by Harness Racing Industry Bodies)
First appointed 1 August 2003
Mr Robert Pearson (Nominated by Thoroughbred Racing Industry Bodies)
First appointed 1 August 2003
Mr Gary Gliddon (Nominated by Greyhound Racing Industry Bodies)
First appointed 21 November 2011
Dr Lianne Cretney–Barnes (Has expertise in Business Administration, Management and Marketing)
First appointed 1 February 2011
Mr John Bradshaw (Has expertise in Regional Development)
First appointed 1 February 2011
Professor John Yovich (Specialist veterinarian with lifelong involvement in racing industry)
First appointed 1 February 2013
Mr Ross Bowe Chairman from 1 August 2003 – 31 January 2013 (retired)
Operational Structure

13
ANNUAL REPORT 2012 – 2013RACING AND WAGERING WESTERN AUSTRALIA
OVERVIEW
Board CommitteesThe Board has established committees to oversee various functions of the organisation and industry. These committees have delegated authority to perform certain functions and exercise powers of the Board. The formal committees of the Board, their terms of reference and membership are listed below:
Integrity Assurance Committee Racing Operations CommitteeThe Integrity Assurance Committee (IAC) has primary oversight of those aspects of RWWA’s functions that relate to; stewards, drug testing and control, licensing and registration, handicapping and racing appeals.
The IAC also performs the role of RWWA’s Audit Committee and has oversight for the Internal Audit Function, Risk Management, and Legislative Compliance. The IAC also reviews and approves the Annual Report.
This committee is responsible for the racing functions of RWWA. It’s responsibilities include consulting with industry bodies, programming and racing dates, loans, grants and distributions.
Members Include:• Mr James Freemantle (Chairman)• Mr John Bradshaw• Dr Lianne Cretney–Barnes• Mr Jefferey Ovens (ex–officio)• Mr Richard Burt (Deputy)
Members include:• Mr Robert Pearson (Chairman)• Mr Ross Cooper (Deputy Chairman)• Mr Gary Gliddon• Professor John Yovich• Mr Jefferey Ovens (ex–officio)• Mr Richard Burt (Deputy)
Operational Structure

14
ANNUAL REPORT 2012 – 2013RACING AND WAGERING WESTERN AUSTRALIA
Relationship to Government Goals
Results–Based Service DeliveryGreater focus on achieving results in key service delivery areas for the benefit of all Western Australians
Desired Outcomes Effectiveness Indicators Services Provided Efficiency IndicatorsTo achieve an optimum level of funding for the development of racing and sports in Western Australia
Value of grants distributed to clubs
Grants administration, evaluation and distribution
-
To efficiently administer and to provide effective leadership in the development, integrity and welfare of the racing industry in Western Australia
Distribution to Industry Administration of industry distribution to the clubs
-
% of winners swabbed / returned negative
Maintain the integrity of the Western Australian racing industry
-
Average number of starters in Western Australia races
Guarantee the ongoing welfare and sustainability of the Western Australian racing industry
-
To provide an efficient, competitive and responsible wagering service for Western Australia
Primary Betting System availability
Provision of a betting system which is efficient, reliable, maintainable and capable
-
Number of bets processed
Financial and Economic ResponsibilityResponsibly managing the State’s finances through the efficient and effective delivery of services, encouraging economic activity and reducing regulatory burdens on the private sector
Desired Outcomes Effectiveness Indicators Services Provided Efficiency IndicatorsTo efficiently administer the racing and wagering industry in Western Australia
Operating Profit (excluding the profit/loss from sale of assets) before distribution to codes
Provision of racing, stewarding, wagering, financial, marketing, human resource, IT, strategic and other services
Staff (FTE)Margin per employee
Racing and steward expenses per WA race meeting
Profit per employeeReturn on Assets (operating profit as a percentage of total assets)
To provide a competitive wagering service for Western Australia
Margin Provision of services to support wagering
-Annual growth in TAB turnover on WA racing
RWWA’s key performance indicators are aligned to the above government goals (i.e. Results–Based Service Delivery and Financial and Economic Responsibility).RWWA’s key performance indicators are also reported in the Financials section of this Annual Report.
PERFORMANCE MANAGEMENT FRAMEWORK
OVERVIEW

15
ANNUAL REPORT 2012 – 2013RACING AND WAGERING WESTERN AUSTRALIA
CHAPTER T WO REPORT ON OPER AT IONS
Image by Craig Evans
OVERVIEW

16
RACING AND WAGERING WESTERN AUSTRALIA
The Racing Division is responsible for racing operations including fixture planning, racing systems and information maintenance, handicapping and grading, programming, stakes supervision, vision contracts, industry consultation, racing industry publications, racing industry development, industry training, OSH, control of RWWA–owned animal industry training venues, major event support and the overall strategic direction of the racing industry in Western Australia.
Operations and DistributionThe 2012/13 season provided 880 race meetings across the three codes of racing, featuring a total of 8,237 races and producing 74,788 starters. Of these 8,289 individual animals raced, including 4,130 thoroughbreds, 2,331 standard breds and 1,828 greyhounds.
Funding for Race ClubsIn 2012/13 RWWA funded 51 clubs and eight training venues in total, including the following:
▪ One greyhound association (WAGRA) racing at three venues (Cannington, Mandurah and Northam);
▪ 35 thoroughbred clubs (including tenanted arrangements such as Coolgardie at Kalgoorlie);
▪ One thoroughbred training only venue at Lark Hill;
▪ 15 harness clubs (including tenanted arrangements such as York at Northam);
▪ Seven harness training only venues – Byford, Cunderdin, Dunbarton, Guildford, Jandakot, South Suburban and Wanneroo.
Total distribution funding (in the form of event and training fees) provided to Western Australian racing clubs in 2012/13 amounted to $19.8M or 17.4% of total industry distributions.
Racing
Perth Cup Talent Show (Image by Scott Hollands)
REPORT ON OPERATIONS

1717
ANNUAL REPORT 2012 – 2013
In July 2010 the Western Australian State Government announced a $13M funding program over five years towards racing infrastructure. The Western Australian State Government approved boost funding from Royalties for Regions (R4R) of $6.6M in November 2012, increasing infrastructure grant funding to the Racing Industry to $19.6M. The funding boost has provided significant impetus for non metropolitan Clubs to address infrastructure deficiencies by providing up to 90% grant funding.
RWWA administers the Racecourse Infrastructure Grants Program (RIGP) for the Minister for Racing and Gaming.
In 2012/13 grant funding to the value of $3.2M was approved by the Minister for Racing and Gaming for a total of 43 projects.
There remains a strong emphasis on infrastructure improvements to facilities to ensure Occupational Safety and Health (OSH) compliance and support for animal welfare related projects in 2012/13, with provincial clubs benefiting from grants for improvements to track surfaces, trackwork safety systems and further distributions of compliant aluminium running rails to Country Racing Association (CRA) clubs and further funding to provide outside rails at all CRA Clubs
In total, 20 clubs across the three codes were awarded grants. The more significant projects that received grant funding included (total project cost):
1. Four Provincial Thoroughbred Racing Clubs – Race track surface improvements ($407,269)
2. CRA Clubs – Outside safety rail ($132,170)
3. Bunbury Turf Club – OSH package of works ($253,562)
4. Kalgoorlie Boulder Race Club – Major electrical systems upgrade ($433,896)
5. WAGRA Mandurah – Major building renovations ($1,464,000)
6. Metropolitan Racing – Safety fencing for Trainers car park, new bore for Ascot Racecourse and Viscoride renovations ($846,298)
Infrastructure Grants
Distribution paid by RWWA for 2012/13 to Clubs and Participants is contained in the following table:
Participant Distributions
Club Distributions Total Distributions % of Distributions to Participants
Thoroughbreds $ 58,420,507 $ 10,596,623 $ 69,017,130 84.6%
Harness $ 25,010,176 $ 4,754,458 $ 29,764,634 84.0%
Greyhounds $ 10,442,360 $ 4,437,597 $ 14,879,957 70.2%
Total $ 93,873,043 $ 19,788,678 $ 113,661,721 82.6%
Total Distributions to Clubs excludes capital infrastructure funding, SKY associated costs and Western Australian product fees paid by RWWA on behalf of clubs.
RIGP/R4R Funding Allocated to RWWA
2012/13 To Date
RIGP Grants $4.5M $9.2M
R4R Boost $1.2M $1.2M
Tri Code - Thoroughbred, Greyhound and Harness © West Australian NewspapersRWWA’s BIG SCREEN at the Newman Turf Club

18
ANNUAL REPORT 2012 – 2013RACING AND WAGERING WESTERN AUSTRALIA
Lark Hill Thoroughbred Training ComplexWith the RWWA’s long–term tenure at Lark Hill now secure, a revision of master planning progress and objectives will now be undertaken. Additional land areas annexed to the site under the respective Management Order will allow for progression of key initiatives — namely on–course stabling and a straight track slow work facility. Residential stabling will require appropriate accommodation such as aqua–exercise facilities (pool or other), further additional tracks (synthetic), enhanced security monitoring, and other amenities inherent to a state–of–the–art training facility.
Implementation of a comprehensive work, health and safety (WHS) quality management system has commenced and will underpin all future planning and development at the site. WHS policy and systems will pervade all aspects of operational governance ensuring Western Australia’s primary Thoroughbred training centre meets world’s best management practices in ensuring a safe work environment for racing animals and stakeholders alike.
Byford Harness Training ComplexCompletion of a new state–of–the–art maintenance compound, sand roll, ancillary drainage infrastructure and delineated walk–on, walk–off access to the main track has further enhanced the standing of Byford as Western Australia’s primary harness training venue.
Planning approval has now been confirmed to progress the next stage of capital infrastructure works, including construction of a new parade ring, a dedicated vehicle driveway access from Briggs Road and an internal bridle path network. Additional stalls, sealed float parking and on–course stabling remain identified as longer term undertakings.
A concerted focus on work, health and safety will underpin all upcoming projects, future planning and operational systems. The safety of stakeholders through mitigation of remnant horse / traffic conflict issues remains foremost in planning considerations.
With the ongoing support of respective Track Sub–Committees at Byford and Lark Hill, RWWA remains committed to working cooperatively with stakeholders in further developing both centres as benchmark centre of excellence training facilities, for the long–term sustainment of equine racing in Western Australia.
Lark Hill and Byford Training ‘Centres of Excellence’
REPORT ON OPERATIONS
The fencing installed at Lark Hill to keep spectators off the racetrack
New round yard (sand roll facility) at Byford funded by RIGP & RWWA
1919
ANNUAL REPORT 2012 – 2013RACING AND WAGERING WESTERN AUSTRALIA
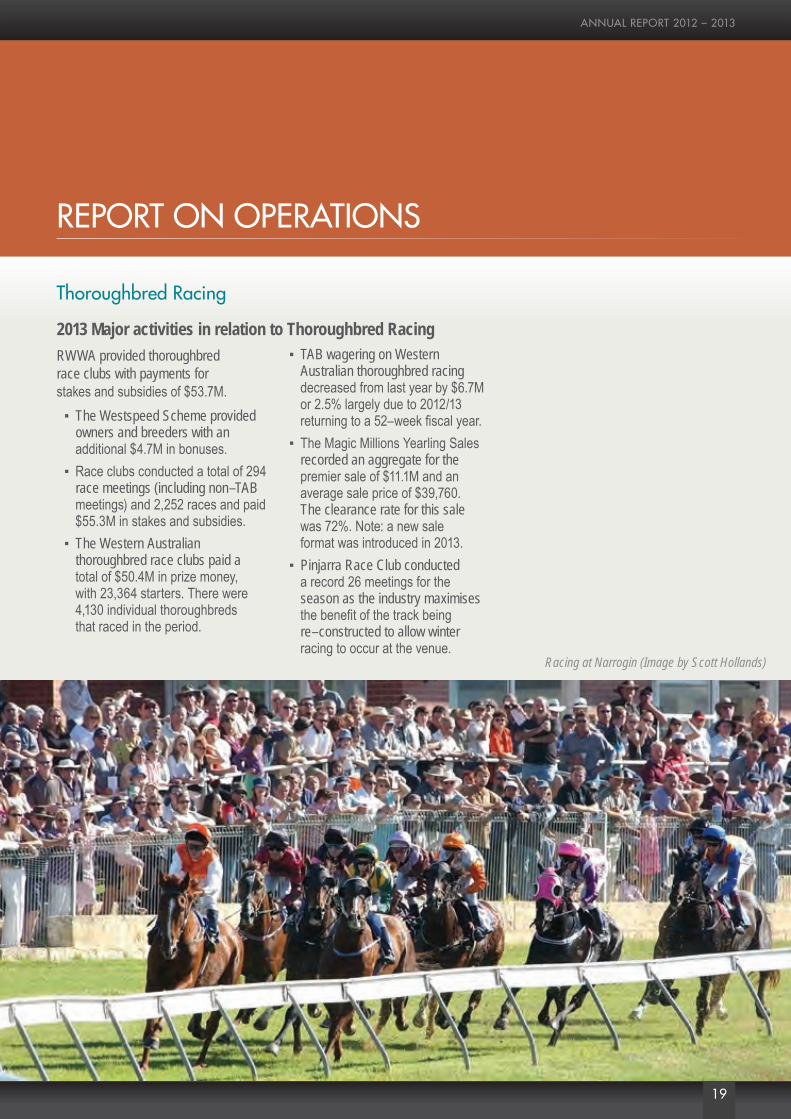
2013 Major activities in relation to Thoroughbred RacingRWWA provided thoroughbred race clubs with payments for stakes and subsidies of $53.7M.
▪ The Westspeed Scheme provided owners and breeders with an additional $4.7M in bonuses.
▪ Race clubs conducted a total of 294 race meetings (including non–TAB meetings) and 2,252 races and paid $55.3M in stakes and subsidies.
▪ The Western Australian thoroughbred race clubs paid a total of $50.4M in prize money, with 23,364 starters. There were 4,130 individual thoroughbreds that raced in the period.
▪ TAB wagering on Western Australian thoroughbred racing decreased from last year by $6.7M or 2.5% largely due to 2012/13 returning to a 52–week fiscal year.
▪ The Magic Millions Yearling Sales recorded an aggregate for the premier sale of $11.1M and an average sale price of $39,760. The clearance rate for this sale was 72%. Note: a new sale format was introduced in 2013.
▪ Pinjarra Race Club conducted a record 26 meetings for the season as the industry maximises the benefit of the track being re–constructed to allow winter racing to occur at the venue.
Thoroughbred Racing
REPORT ON OPERATIONSREPORT ON OPERATIONS
Racing at Narrogin (Image by Scott Hollands)

20
RACING AND WAGERING WESTERN AUSTRALIA
2013 Major activities in relation to Harness Racing ▪ RWWA provided harness race clubs with payments for stakes of $22.2M.
▪ RWWA paid out an additional $1.1M in WestBred bonuses.
▪ Race clubs conducted a total of 279 race meetings and 2,335 races, which provided 23,169 racing opportunities for 2,331 individual horses. There were 180 programmed races cancelled during the period and 227 races split to more than compensate for the cancelled races. There were 40,841 nominations processed to generate the 23,169 starters.
▪ The 23,169 starters were trained by 505 individual trainers with 55 trainers having 100 or more starters for the season and 23 having 200 or more starters for the season. There were 121 trainers who each had less than 10 starters for the year.
▪ TAB wagering on Western Australian harness racing decreased by $3.9M or 5% in relation to the prior year due to the return of a 52–week fiscal year.
▪ Gary Hall Snr set a new Australian stakemoney record for a Western Australian trainer with starters from his stable earning more than $3.1M for the season from a total of 181 winners.
▪ IM THEMIGHTYQUINN won a third successive Inter Dominion Final in the 2013 Championship held at Menangle in New South Wales. The performances of this gelding, which earned $941,360 during the season, helped his regular driver Gary Hall Jnr to become the first Western Australian driver to pass the $3M stakes mark in a season.
▪ Perth Junior Driver Dylan Egerton–Green won the Western Australian Rising Stars Series and represented the State in New South Wales, winning a heat of the New South Wales Rising Stars Series at Bathurst in June.
▪ The EPONA Mares Bonus scheme commenced on 1 March 2013 and until the end of the period a total of 142 WA trained mares earned at least one Epona Bonus winning 231 races and generating $142,000 in credits. Four mares each earned the maximum credit amount of $5,000.
▪ A new directions paper was developed for harness racing outlining key opportunities for 2012/13–2013/14 including Club Compliance of OHS, return to owners, club infrastructure, capital works and financial sustainability.
Harness Racing
REPORT ON OPERATIONS
Racing at Gloucester Park (Image by William Crabb)

2121
ANNUAL REPORT 2012 – 2013
2013 Major activities in relation to Greyhound Racing ▪ RWWA provided the Western Australian Greyhound Racing Association (WAGRA) with base and feature stake funding of $9.9M.
▪ The WESTCHA$E Incentive Scheme paid out $570.8K for the year, up 16.3% on 2011/12, with 285 individual greyhounds earning bonuses for their connections (up 10.5%).
▪ WAGRA conducted 3,650 races at 307 meetings, which provided 28,255 racing opportunities for 1,828 individual greyhounds.
▪ TAB wagering on Western Australian greyhound racing decreased by $0.2M or 0.2% in relation to the prior year largely due to the return of a 52–week fiscal year.
▪ As part of the initiative to increase the WA greyhound racing calendar to 6 meetings per week for the full 2012/13 year, the Northam season was extended to include night chasing in the months of November/December 2012 and again in March 2013.
▪ Consistent with RWWA’s animal welfare policies, RWWA supports the ‘homing’ of retired greyhounds, under the program known in WA as Greyhounds As Pets (GAP). RWWA funded $125K towards the cost of running the GAP program during 2012/13, during which time a total of 99 greyhounds were adopted into new homes.
▪ WA chasing sensation MIATA retired from racing in May 2013 with a career record of 42 wins from 51 starts and an Australasian stakes record of $715.5K. MIATA was announced as the Australian Greyhound Racing Association’s Australian Greyhound of the Year for 2012, the first WA greyhound ever to receive such a national accolade. She was also crowned WA Greyhound of the Year.
▪ Cannington – RWWA and WAGRA have been jointly considering the way forward for greyhound racing in Western Australia to retain a metropolitan venue presence. A number of scenarios were developed and at the conclusion of the financial year WAGRA, entered into a long term lease for a new site at Cannington. A newly constructed facility is expected to be progressed in 2013/14 and 2014/15.
Greyhound Racing
WAGRA conducted 3,650 races at 307 meetings, which provided 28,255 racing opportunities
REPORT ON OPERATIONS 2012 Greyhound of the Year MIATA (Image by Joe Mulder)
Paul Stuart (trainer) and Adele Hobby with 2012 Greyhound of the Year MIATA (Image by Joe Mulder)

22
RACING AND WAGERING WESTERN AUSTRALIA
▪ Eleven apprentice jockeys commenced including three school based in 2012/13, seven graduated into senior ranks. One Cadet Driver commenced during the year and is based in Pinjarra.
▪ RWWA again supported the National Apprentice Jockey Challenge, with a heat being held at Ascot in April, this was won by Rachael Murray representing New South Wales. WA apprentices rode in each heat, represented by Ben Paterson, Ryan Hill, Joe Azzopardi, Ellie Cockram, Chanelle O’Grady and Natasha Faithful.
▪ Harness Racing South Africa sent a young harness driver over for 12 months for training and experience. Devonne Govender has been based at Byford for most of the year and not only completed his trials as a C Grade Driver; he has also had the opportunity to drive in a number of races and has gained invaluable experience from trainers in the art of educating and training horses to win races.
▪ Ten new C Grade Drivers commenced during the season, with 11 completing and taking out B Grade Drivers.
▪ RWWA and Polytechnic West (formerly Swan TAFE) have entered into a partnership to deliver a number of the qualifications from the Racing Training Package. This includes the Certificate IV in Racing – Jockey and Driver which were previously delivered by RWWA as a Private Training Provider.
Industry Training Highlights
REPORT ON OPERATIONS

2323
ANNUAL REPORT 2012 – 2013
To assist in the maintenance of the integrity of WA Racing, following an approach by RWWA, the federal Attorney–General’s Department assessed RWWA to be an enforcement agency for the purposes of the Telecommunications (Interception and Access) Act 1979 (Cth) (TIA Act). Under the TIA Act, an enforcement agency is able to:
▪ make applications for stored communication warrants (under section 110 of the TIA Act) to a federal judicial officer or member of the Administrative Appeals Tribunal, who must consider the impact on privacy and the gravity of the conduct before issuing a warrant. Agencies using this power are required to keep records, which are independently inspected by the Commonwealth Ombudsman, and
▪ access telecommunications data (under section 179 of the TIA Act) by following the federal Attorney–General’s Department authorisation and notification process. Agencies using this power are required to keep records of authorisations for three years.
Access to such data is an important additional resource to Stewards in Integrity Management.
In January 2013, through amendment to the Betting Control Regulations 1978 and RWWA Rules of Wagering 2005 a new method for the calculation of betting deductions by on–course bookmakers following a withdrawal/
scratching was implemented. This change required various system changes for both bookmakers and Stewards in order to be able to calculate and then apply the resultant deductions as the new method utilises an algorithm to determine a deduction for each placed runner. The new method, as distinct from the previous tabulated scale of deductions, takes into account the market percentage at the time of a withdrawal of a runner when determining deductions, which invariably is a more accurate and fairer system for all, but particularly the punter.
In May 2013, Stewards met with representatives of thoroughbred eligible bodies and trainers in response to concerns regarding the integrity of Western Australian races to detail the extent of investigations undertaken and review a number of races that had received media attention. Following this meeting, these eligible bodies confirmed their “unequivocal support and confidence in the stewards’ determinations” with respect to the races in question and integrity in general. Further investigation by the Stewards of the matters in question, which included interviewing or re-interviewing all persons involved in the races of interest, as well as examining all available wagering and race form data confirmed that “based on current evidence, it had not been demonstrated that the integrity of WA racing was a systemic issue”.
Racing Integrity
REPORT ON OPERATIONS
This division which includes Stewards from all three codes and Racecourse Investigators is responsible for all matters pertaining to the proper conduct and integrity of racing in Western Australia.
RWWA has continued to incrementally increase sample rates across the codes and deploy new strategies and technologies to assist in drug control. This has included identifying and acquiring a suitable, portable blood analyser to assist as a screening tool in total carbon dioxide (TCO2) testing in the equine codes. The use of this new device at race meetings provides an on the spot reading of a horses TCO2 level and is thus an additional tool to assist in identifying horses suitable for further sampling, which has included both pre and post race sampling of certain horses.
RWWA did also make arrangements for a number of horse and greyhound race day samples, including previously stored samples, to be analysed by the Hong Kong Jockey Club’s Racing Laboratory, which is recognised internationally as a leading racing analytical laboratory. The results received reported no positive detections from the analysis conducted. RWWA also continues to work closely with it’s dedicated racing analytical laboratory, the ChemCentre (WA) in ensuring new and emerging threats in drug control are being addressed.
REPORT ON OPERATIONS

24
RACING AND WAGERING WESTERN AUSTRALIA
REPORT ON OPERATIONS
Stewards did also during this time access, where appropriate, further data including telecommunication records in accordance with the Telecommunications (Interception and Access) Act 1979 (Cth) (TIA Act). A number of the races in question were subsequently referred for peer review by the Stewards of Racing New South Wales who confirmed that on the available evidence, there was no impropriety in the races in question.
To further support and enhance RWWA’s commitment to integrity management, an additional Investigator is being sourced to further expand non–race day activities including inspections, surveillance, out of competition testing and stable/kennel visits. Various other internal process changes to focus on the generation and sourcing of race form and heightened analysis of pre and post race data in the equine codes was also undertaken.
Racing Integrity
Statistics for 2012/13 across the three codes are as follows:
Thoroughbred Samples PositivesPost Race 1992 2
TCO2 1605 0
OOCT & EPO 128 0
Human 249 6
Harness Samples PositivesPost Race 1273 4
TCO2 2904 5
OOCT & EPO 97 0
Human 135 0
Greyhound Samples PositivesPost Race 1225 1
OOCT & EPO 59 0
Stewards, media commentators and judges in the Judges Tower at the Mingenew Turf Club (Image by Lou Checker)

2525
ANNUAL REPORT 2012 – 2013
REPORT ON OPERATIONS
This division is responsible for the Internet, Mobile and Call Centre Channels, all wagering products, and the management of RWWA’s premium business. The division also manages all marketing, advertising and promotion, social media, and Loyalty CRM activities along with the wagering brands. The operation of Racing Radio and the publication of TABForm is also part of the division.
The division’s primary focus during the year has been on improving our competitiveness with improvements across the board in products, pricing and channel mix.
The year began with a new Parimutuel agreement with Tabcorp in August 2012, which enabled the combining of all Parimutuel racing products into the SuperTAB pools and the addition of flexi betting across the complete product range. This has given customers a significant lift in the number of choices as well as the stability of the larger wagering pools on each bet type including comingling into two of the world’s largest pools in Singapore and Hong Kong.
The Fixed Odds product has also undergone a major overhaul. A new arrangement with Sportingbet as our business to business supplier of pricing and book management has brought stronger product choice and pricing options. As part of this new arrangement a number of customer
frustrations around bet knock backs and the size of bets have been resolved. Customers now enjoy the widest possible range of fixed odds sporting competitions around the world. As an example customers can now bet on up to 110 world soccer competitions from Asia to Europe.
Customers now have greater choice through the side by side display of both Parimutuel and Fixed Odds price across a wide range of races in all three codes. This coupled with more aggressive race day pricing is delivering a stronger opportunity for customers to lock in a price at a point they believe gives them the best value.
A review of our product and services compared to major competitors revealed a number of gaps in our offering. These have been addressed through;
▪ The new Parimutuel pooling and fixed odds arrangements;
▪ SKY racing vision live streaming for account customers in our online media centre which includes live Great Britain Racing coverage;
▪ Trifecta, First Four and Exacta bet types have been enhanced with Roving Banker and enhanced All Up options; and
▪ Improvements in form and racing silks across both our mobile and internet channels.
A review of the year would not be complete without focusing on the success of mobile wagering. The rapid growth in mobile is expected to continue. Mobile is more than a betting channel, it is a new frontier for marketing. The ability for customers to use a device of their choice in any location whether it is inside our retail network, on–course or watching a game with friends socially is changing the way we think about wagering. The ubiquity of mobile and it’s application as a customer service centre piece in our overall strategy is delivering exciting possibilities. The TAB is working on mobile applications for all our customer segments. Understandably there has been some channel shift as mobile has grown. The most obvious is the acceleration of a downward trend in the Call Centre channel. Overall, the TAB strategy is customer centric, designed to provide the choice of channel and the range of product that best suits each customer.
As one of Western Australia’s most trusted and high profile brands, our strategy has been to re–engineer our offering and go to market with a high profile campaign to win customers. This campaign commences mid September 2013, and is designed to encourage customers to take a fresh look at the TAB offering, under a simplified brand architecture centred around the TAB as our primary brand, and TABtouch as our online brand.
Marketing
REPORT ON OPERATIONS

26
RACING AND WAGERING WESTERN AUSTRALIA
REPORT ON OPERATIONS
Racing Industry Economic & Social Impact ReportIn September 2012 RWWA released an Economic & Social Impact Report into the Western Australian Racing Industry highlighting the important economic and social role racing has on communities across Western Australia. Following the launch of the report by the Minister for Racing & Gaming, the Hon. Terry Waldron at Parliament House, each of the 10 regional reports were launched at local race clubs across the State. Television commercials aired across Western Australia in 2012/13 promoting racing as ‘the sport that’s an industry’ highlighting important economic statistics from the report. This is the first time the industry has engaged the public to raise awareness regarding the important employment, economic and social role that racing plays across the state.
RWWA & Social MediaRWWA has this year embraced social media launching videos on YouTube, providing insight into the racing industry and showcasing some of our sporting heroes. This is in addition to various Facebook pages and twitter handles (code and brand specific) all working together, providing consistent messaging to different audiences about WA’s racing industry. This strategic approach has seen the number of videos viewed steadily increase, in light of the
execution of this multi–channelled media communication strategy to raise awareness and engage with not only industry participants, but racing enthusiasts and entertainment seekers. Engaging the media via both traditional and non–traditional channels, RWWA has a better ability to build awareness and promote Western Australia’s racing industry, and defend claims that may bring the sport into disrepute.
WA Country CupsThe 2012 Kalgoorlie Round marked the 1st event to benefit from WA Country Cups promotion. WA Country Cups is supported by Eventscorp’s Regional Events Program, which is funded by Royalties for Regions, an initiative of the State Government. The funding has provided enhanced marketing and events management initiatives to create and elevate peripheral activities around regional thoroughbred race meets in Kalgoorlie, Bunbury and Broome over the next three years. WA Country Cups has partnered with Sky Racing to promote regional race meetings nationally through providing regular segments for country racing program ‘Off The Beaten Track’, which is also broadcasted internationally via Sky World. Via Sky Racing’s three channels, WA Country Cups has also promoted competitions to ‘Win a Racing Holiday to WA’ gaining exposure for the WA Country Cups brand and website that promotes all Western Australian thoroughbred race meetings.
Media and Promotional Highlights
There was a record attendance at the Broome Turf Club’s season opening race meeting - an event partnership with WA Country Cups (Image by Meredith Bell)

2727
ANNUAL REPORT 2012 – 2013
A documentary of the 2012 Kalgoorlie Round was shot and launched with much fanfare amongst State dignitaries and industry participants in late 2012. The event featured prominently across regional media outlets, and drew many to view the documentary via RWWA’s YouTube channel. WA Country Cups has this year worked with the Bunbury Turf Club to support numerous events around the South West Autumn Racing Carnival in March 2013. Some of these events include the South West Fashion Festival, an aquathon held by the Bunbury Triathlon Club and the Bayside Beat Concert featuring alternative rock act, the Cat Empire. With the success of the Broome Cup at the end of the Kimberley racing season well established, WA Country Cups worked with the Broome Turf Club to launch the 2013 opening of the race season, attracting visitors to Broome earlier than previous years. Over the WA Day long weekend in June, visitors were treated not only to a great day of racing at the turf club, but got to enjoy iconic Australian rock band Icehouse perform under the stars at the Cable Beach Amphitheatre.
TAB & the Perth Fashion FestivalThe TAB has rarely activated marketing initiatives that specifically target women, however with the identification of a solid foundation and increasing number of female account holders, this segment of the TAB’s customer base was identified to have considerable potential. This, coupled with the recent launch of the TABtouch.mobi app – created an engagement medium that had the potential to have a much greater appeal to a female demographic (more so than the TAB’s traditional betting channels). With the established association between fashion and racing, the Perth Fashion Festival (PFF) has provided the TAB with a credible and engaging foundation in which to promote it’s brand to women for the first time. As such, the TAB’s premier sponsorship of the 2012 Perth Fashion Festival was seen as a partnership to unlock the potential of this market segment, particularly as the PFF has such a strong following across social media channels. This partnership has provided TABtouch.mobi with direct exposure to our target market and helped bolster TABtouch.mobi’s brand credentials with this female audience.
WA Country Cups and the Bunbury Turf Club supported the South West Fashion Festival in 2013 which ran the week leading up to the South West Autumn Racing Carnival (Image by Rachel Barrett)
REPORT ON OPERATIONSThe Cat Empire performed in Bunbury during the South West Autumn Racing Carnival all thanks to WA Country Cups (Image by Rachel Barrett)

28
RACING AND WAGERING WESTERN AUSTRALIA
REPORT ON OPERATIONS
The Retail division is responsible for RWWA’s competitive advantage in the Western Australian wagering market — the retail TAB agency network.
As at the end of the 2012/13 Financial Year, RWWA’s retail network consisted of 319 agencies segmented into the following categories:
Service Level 1 Fulltime TAB Agencies – 90
Service Level 2 PubTAB Agencies – 119
Service Level 3 Self Service PubTAB Agencies – 110
Whilst customer preferences are constantly changing, Retail agencies remain an information rich, wagering dedicated, cash friendly and social experience for our customers. The challenge for Retail is to maintain this level of relevance in an increasing digital world.
Research undertaken throughout the year has culminated in the new Race Wall and information terminals technology (shown above) which will eventually replace the traditional teletext and paper based displays commonly seen in most agencies.
The Race Wall technology comprises ten screens that include Sky 1 and 2, the next six races to jump and two other screens that help customers manage their raceday. There is an improved level of information on all screens as compared to the historical teletext displays.
In conjunction with an investment in Self Service Terminals, the paperless agency and customer experience benefits will be shared by RWWA, TAB Agents and customers.
Retail
Retail agencies remain an information rich, wagering dedicated, cash friendly and social experience for our customers

2929
ANNUAL REPORT 2012 – 2013
REPORT ON OPERATIONS
• Major infrastructure projects during the year included:
(i) Commencement of the server, desktop and database software upgrade initiative which includes a migration to a virtual desktop.
(ii) Commencement of the replacement of RWWA’s suite of testing software.
(iii) Completion of the replacement and upgrade of the storage related to the corporate SAN and the bet engine SAN.
• Major enhancements were made to RWWA core betting system and the delivery channels to take advantage of the new pooling agreement with Tabcorp. Changes included:
(i) Combined pools on more bet types e.g. First–Four, Double, Quinella and Exacta.
(ii) Flexi on all novelty bet types.
(iii) Comingling for International pools in South Africa and Singapore via Tabcorp.
(iv) Modification of all channels to facilitate the new pooling agreement.
(v) In addition to the “Race–Wall” mentioned elsewhere in this report, another significant initiative was the new Customer Information Terminal including long form and form for greyhounds.
• Major enhancements across all channels to enhance the customer experience and the improvements include:
(i) New products in the form of “Roving Banker”, “Place–Multi”, “Enhanced FOB” and the introduction of a “Free bet” facility & an “Account Pre–commitment” facility.
(ii) Numerous enhancements to Ozbet and mobile betting including the delivery of silks, form and SKY vision.
(iii) Numerous enhancements to the wagering terminal applications.
• In another very significant development, New South Wales, South Australia, Tasmania and Northern Territory all began using the new Greyhound Racing System developed by RWWA.
Information Services
The Information Services Division is responsible for providing technical, consulting and support services for the day–to–day delivery of wagering services throughout Western Australia. The division provides technical support services for all RWWA wagering and racing information systems, ticket machines, the data communications network, information security, project delivery, Racing Radio and all wagering related technical infrastructure.
During the 2012/13 year a number of significant operational and strategic milestones were achieved including:
REPORT ON OPERATIONS

30
RACING AND WAGERING WESTERN AUSTRALIA
REPORT ON OPERATIONS
Human Resources
The Human Resources (HR) division is responsible for the development and implementation of human resource management strategy and effective management of all related workplace and employee related functions across the organisation.
The division provides support to staff and managers on all employment related matters including recruitment, induction, performance management, interpretation and application of policies and workplace conditions. Advice and support to line managers in their people management skills and workforce planning has remained a constant requirement as the organisation continues to develop and change. In addition, the delivery of Payroll services and the management of staff data and reporting sit within
this division. Since the inclusion of the Learning & Development team and OSH Advisor to the HR team back in 2011/12 their functions now play a key role within the Division, for RWWA and external stakeholders.
During the reporting period, the HR team has continued to align their focus around culture and engagement, leveraging the success of the previous year’s leadership initiatives. RWWA’s commitment to developing leadership skills to build engagement in the organisation led to a dedicated program being implemented in partnership with an external party, Modal. Some 70 managers and supervisors across the organisation were involved in this program, including the Executive Group.
This division is responsible for financial management and strategy, risk and business continuity systems, wagering compliance, audit and legal matters, the administration of licensing and registration of racing participants/animals, business intelligence functions, including data mining and
strategic analysis, and a variety of other business services. The division has continued to provide wide ranging support to the organisation in the achievement of goals and objectives whilst maintaining a focus on prudent financial management and on improving efficiency and effectiveness.
Finance and Business Services

31
ANNUAL REPORT 2012 – 2013
CHAPTER THREE D ISCLOSURES AND
LEGAL COM PL IANCE
Image by William Crabb
REPORT ON OPERATIONS

32
ANNUAL REPORT 2012 – 2013RACING AND WAGERING WESTERN AUSTRALIA
DISCLOSURES AND LEGAL COMPLIANCE
Auditor General
INDEPENDENT AUDITOR’S REPORT
To the Parliament of Western Australia
RACING AND WAGERING WESTERN AUSTRALIA
Report on the Financial StatementsI have audited the accounts and financial statements of Racing and Wagering Western Australia.
The financial statements comprise the Statement of Financial Position as at 31 July 2013, the Statement of Comprehensive Income, Statement of Changes in Equity and Statement of Cash Flows for the year then ended, and Notes comprising a summary of significant accounting policies and other explanatory information.
Board’s Responsibility for the Financial StatementsThe Board is responsible for keeping proper accounts, and the preparation and fair presentation of the financial statements in accordance with Australian Accounting Standards and the Treasurer’s Instructions, and for such internal control as the Board determines is necessary to enable the preparation of financial statements that are free from material misstatement, whether due to fraud or error.
Auditor’s ResponsibilityAs required by the Auditor General Act 2006, my responsibility is to express an opinion on the financial statements based on my audit. The audit was conducted in accordance with Australian Auditing Standards. Those Standards require compliance with relevant ethical requirements relating to audit engagements and that the audit be planned and performed to obtain reasonable assurance about whether the financial statements are free from material misstatement.
An audit involves performing procedures to obtain audit evidence about the amounts and disclosures in the financial statements. The procedures selected depend on the auditor’s judgement, including the assessment of the risks of material misstatement of the financial statements, whether due to fraud or error. In making those risk assessments, the auditor considers internal control relevant to Racing and Wagering Western Australia’s preparation and fair presentation of the financial statements in order to design audit procedures that are appropriate in the circumstances. An audit also includes evaluating the appropriateness of the accounting policies used and the reasonableness of accounting estimates made by the Board,as well as evaluating the overall presentation of the financial statements.
I believe that the audit evidence obtained is sufficient and appropriate to provide a basis for myqualified audit opinion.
Basis for Qualified OpinionFor the year ended 31 July 2013, Racing and Wagering Western Australia has reported Royalties for Regions funding of $1.2 million as Payables instead of recognising the funding as income in the Statement of Comprehensive Income, in accordance with the requirements of Australian Accounting Standard AASB 1004 “Contributions”. Accordingly, Payables are overstated by $1.015 million, and Profit for the period is understated by the same amount. Grant Income is understated by $1.2 million and Grant expenses are also understated by $185 000.
Page 1 of 3 7th Floor Albert Facey House 469 Wellington Street Perth MAIL TO: Perth BC PO Box 8489 Perth WA 6849 TEL: 08 6557 7500 FAX: 08 6557 7600
INDEPENDENT AUDITOR’S REPORTTo the Parliament of Western Australia
RACING AND WAGERING WESTERN AUSTRALIA
Report on the Financial StatementsI have audited the accounts and financial statements of Racing and Wagering Western Australia.
The financial statements comprise the Statement of Financial Position as at 31 July 2013, the Statement of Comprehensive Income, Statement of Changes in Equity and Statement of Cash Flows for the year then ended, and Notes comprising a summary of significant accounting policies and other explanatory information.
Board’s Responsibility for the Financial StatementsThe Board is responsible for keeping proper accounts, and the preparation and fair presentation of the financial statements in accordance with Australian Accounting Standards and the Treasurer’s Instructions, and for such internal control as the Board determines is necessary to enable the preparation of financial statements that are free from material misstatement, whether due to fraud or error.
Auditor’s ResponsibilityAs required by the Auditor General Act 2006, my responsibility is to express an opinion on the financial statements based on my audit. The audit was conducted in accordance with Australian Auditing Standards. Those Standards require compliance with relevant ethical requirements relating to audit engagements and that the audit be planned and performed to obtain reasonable assurance about whether the financial statements are free from material misstatement.
An audit involves performing procedures to obtain audit evidence about the amounts and disclosures in the financial statements. The procedures selected depend on the auditor’s judgement, including the assessment of the risks of material misstatement of the financial statements, whether due to fraud or error. In making those risk assessments, the auditor considers internal control relevant to Racing and Wagering Western Australia’s preparation and fair presentation of the financial statements in order to design audit procedures that are appropriate in the circumstances. An audit also includes evaluating the appropriateness of the accounting policies used and the reasonableness of accounting estimates made by the Board, as well as evaluating the overall presentation of the financial statements.
I believe that the audit evidence obtained is sufficient and appropriate to provide a basis for my qualified audit opinion.
Basis for Qualified OpinionFor the year ended 31 July 2013, Racing and Wagering Western Australia has reported Royalties for Regions funding of $1.2 million as Payables instead of recognising the funding as income in the Statement of Comprehensive Income, in accordance with the requirements of Australian Accounting Standard AASB 1004 “Contributions”. Accordingly, Payables are overstated by $1.015 million, and Profit for the period is understated by the same amount. Grant Income is understated by $1.2 million and Grant expenses are also understated by $185 000.
Qualified OpinionIn my opinion, except for the effects of the matter referred to in the Basis for Qualified Opinion paragraph, the financial statements are based on proper accounts and present fairly, in all material aspects, the financial position of Racing and Wagering Western Australia at 31 July 2013 and its financial performance and cash flows for the year then ended, and are in accordance with Australian Accounting Standards and the Treasurer’s Instructions.
Report on ControlsI have audited the controls exercised by Racing and Wagering Western Australia during the year ended 31 July 2013.
Controls exercised by Racing and Wagering Western Australia are those policies and procedures established by the Board to ensure that the receipt, expenditure and investment of money, the acquisition and disposal of property, and the incurring of liabilities have been in accordance with legislative provisions.
Board’s Responsibility for ControlsThe Board is responsible for maintaining an adequate system of internal control to ensure that the receipt, expenditure and investment of money, the acquisition and disposal of public and other property, and the incurring of liabilities are in accordance with the Financial Management Act 2006 and the Treasurer’s Instructions, and other relevant written law.
Auditor’s ResponsibilityAs required by the Auditor General Act 2006, my responsibility is to express an opinion on the controls exercised by Racing and Wagering Western Australia based on my audit conducted in accordance with Australian Auditing and Assurance Standards.
An audit involves performing procedures to obtain audit evidence about the adequacy of controls

33
ANNUAL REPORT 2012 – 2013RACING AND WAGERING WESTERN AUSTRALIA
DISCLOSURES AND LEGAL COMPLIANCE
to ensure that Racing and Wagering Western Australia complies with the legislative provisions. The procedures selected depend on the auditor’s judgement and include an evaluation of the design and implementation of relevant controls.
I believe that the audit evidence obtained is sufficient and appropriate to provide a basis for my audit opinion.
OpinionIn my opinion, the controls exercised by Racing and Wagering Western Australia are sufficiently adequate to provide reasonable assurance that the receipt, expenditure and investment of money, the acquisition and disposal of property, and the incurring of liabilities have been in accordance with legislative provisions during the year ended 31 July 2013.
Report on the Key Performance IndicatorsI have audited the key performance indicators of Racing and Wagering Western Australia for the year ended 31 July 2013.
The key performance indicators are the key effectiveness indicators and the key efficiency indicators that provide information on outcome achievement and service provision.
Board’s Responsibility for the Key Performance IndicatorsThe Board is responsible for the preparation and fair presentation of the key performance indicators in accordance with the Financial Management Act 2006 and the Treasurer’s Instructions and for such controls as the Board determines necessary to ensure that the key performance indicators fairly represent indicated performance.
Auditor’s ResponsibilityAs required by the Auditor General Act 2006, my responsibility is to express an opinion on the key performance indicators based on my audit conducted in accordance with Australian Auditing and Assurance Standards.
An audit involves performing procedures to obtain audit evidence about the key performance indicators. The procedures selected depend on the auditor’s judgement, including the assessment of the risks of material misstatement of the key performance indicators. In making these risk assessments the auditor considers internal control relevant to the Board’s preparation and fair presentation of the key performance indicators in order to design audit procedures that are appropriate in the circumstances. An audit also includes evaluating the relevance and appropriateness of the key performance indicators for
measuring the extent of outcome achievement and service provision.
I believe that the audit evidence obtained is sufficient and appropriate to provide a basis for my audit opinion.
OpinionIn my opinion, the key performance indicators of Racing and Wagering Western Australia are relevant and appropriate to assist users to assess Racing and Wagering Western Australia’s performance and fairly represent indicated performance for the year ended 31 July 2013.
IndependenceIn conducting this audit, I have complied with the independence requirements of the Auditor General Act 2006 and Australian Auditing and Assurance Standards, and other relevant ethical requirements.
Matters Relating to the Electronic Publication of the Audited Financial Statements and Key Performance IndicatorsThis auditor’s report relates to the financial statements and key performance indicators of Racing and Wagering Western Australia for the year ended 31 July 2013 included on the Racing and Wagering Western Australia’s website. The Racing and Wagering Western Australia’s management is responsible for the integrity of the Racing and Wagering Western Australia’s website. This audit does not provide assurance on the integrity of the Racing and Wagering Western Australia’s website. The auditor’s report refers only to the financial statements and key performance indicators described above. It does not provide an opinion on any other information which may have been hyperlinked to/from these financial statements or key performance indicators. If users of the financial statements and key performance indicators are concerned with the inherent risks arising from publication on a website, they are advised to refer to the hard copy of the audited financial statements and key performance indicators to confirm the information contained in this website version of the financial statements and key performance indicators.
Auditor’s ResponsibilityAs required by the Auditor General Act 2006, my responsibility is to express an opinion on the key performance indicators based on my audit conducted in accordance with Australian Auditing and Assurance Standards.
An audit involves performing procedures to obtain audit evidence about the key performance indicators. The procedures selected depend on the auditor’s judgement, including the assessment of the risks of material misstatement of the key performance indicators. In making these risk assessments the auditor considers internal control relevant to the Board’s preparation and fair presentation of the key performance indicators in order to design audit procedures that are appropriate in the circumstances. An audit also includes evaluating the relevance and appropriateness of the key performance indicators for measuring the extent of outcome achievement and service provision.
I believe that the audit evidence obtained is sufficient and appropriate to provide a basis for my audit opinion.
OpinionIn my opinion, the key performance indicators of Racing and Wagering Western Australia are relevant and appropriate to assist users to assess Racing and Wagering Western Australia’s performance and fairly represent indicated performance for the year ended 31 July 2013.
IndependenceIn conducting this audit, I have complied with the independence requirements of the Auditor General Act 2006 and Australian Auditing and Assurance Standards, and other relevant ethical requirements.
Matters Relating to the Electronic Publication of the Audited Financial Statements and Key Performance IndicatorsThis auditor’s report relates to the financial statements and key performance indicators of Racing and Wagering Western Australia for the year ended 31 July 2013 included on the Racing and Wagering Western Australia’s website. The Racing and Wagering Western Australia’s management is responsible for the integrity of the Racing and Wagering Western Australia’s website. This audit does not provide assurance on the integrity of the Racing and Wagering Western Australia’s website. The auditor’s report refers only to the financial statements and key performance indicators described above. It does not provide an opinion on any other information which may have been hyperlinked to/from these financial statements or key performance indicators. If users of the financial statements and key performance indicators are concerned with the inherent risks arising from publication on a website, they are advised to refer to the hard copy of the audited financial statements and key performance indicators to confirm the information contained in this website version of the financial statements and key performance indicators.
COLIN MURPHYAUDITOR GENERAL FOR WESTERN AUSTRALIAPerth, Western Australia16 October 2013
Page 3 of 3

34
ANNUAL REPORT 2012 – 2013RACING AND WAGERING WESTERN AUSTRALIA
DISCLOSURES AND LEGAL COMPLIANCE
FOR THE YEAR ENDED 31 JULY 2013The accompanying financial statements of Racing and Wagering Western Australia have been prepared in compliance with the provisions of the Financial Management Act 2006 from proper accounts and records to present fairly the financial transactions for the financial year ending 31 July 2013 and the financial position as at 31 July 2013.
At the date of signing we are not aware of any circumstances which would render the particulars included in the financial statements misleading or inaccurate.
Jefferey OvensRWWA Chairman
14 October 2013
James FreemantleDeputy Board Chairman and Chairman RWWA Integrity Assurance Committee
14 October 2013
Julian Hilton–BarberGeneral Manager Finance and Business Services and Chief Financial Officer
14 October 2013
Certification of Financial Statements
35
ANNUAL REPORT 2012 – 2013RACING AND WAGERING WESTERN AUSTRALIA
DISCLOSURES AND LEGAL COMPLIANCE
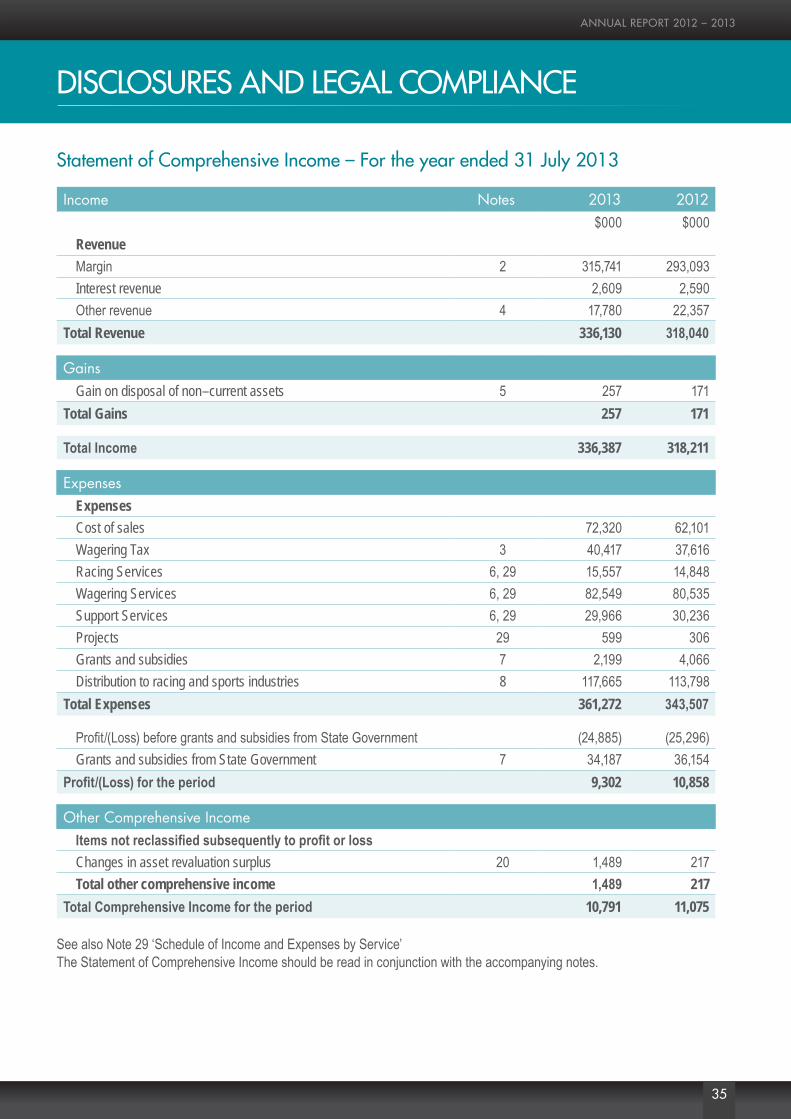
Income Notes 2013 2012$000 $000
RevenueMargin 2 315,741 293,093Interest revenue 2,609 2,590Other revenue 4 17,780 22,357
Total Revenue 336,130 318,040
GainsGain on disposal of non–current assets 5 257 171
Total Gains 257 171
Total Income 336,387 318,211
ExpensesExpensesCost of sales 72,320 62,101Wagering Tax 3 40,417 37,616Racing Services 6, 29 15,557 14,848Wagering Services 6, 29 82,549 80,535Support Services 6, 29 29,966 30,236 Projects 29 599 306Grants and subsidies 7 2,199 4,066Distribution to racing and sports industries 8 117,665 113,798
Total Expenses 361,272 343,507
Profit/(Loss) before grants and subsidies from State Government (24,885) (25,296)Grants and subsidies from State Government 7 34,187 36,154
Profit/(Loss) for the period 9,302 10,858
Other Comprehensive IncomeItems not reclassified subsequently to profit or lossChanges in asset revaluation surplus 20 1,489 217Total other comprehensive income 1,489 217
Total Comprehensive Income for the period 10,791 11,075
See also Note 29 ‘Schedule of Income and Expenses by Service’ The Statement of Comprehensive Income should be read in conjunction with the accompanying notes.
Statement of Comprehensive Income – For the year ended 31 July 2013

36
ANNUAL REPORT 2012 – 2013RACING AND WAGERING WESTERN AUSTRALIA
DISCLOSURES AND LEGAL COMPLIANCE
Assets Notes 2013 2012Current Assets $000 $000Cash and cash equivalents 21 67,745 56,174 Inventories 9 406 394 Receivables 10 2,017 2,883 Other current assets 12 5,679 2,726 Non–current assets classified as held for sale 13 900 2,298
Total Current Assets 76,747 64,475 Non–Current AssetsInvestments 11 352 352 Other Non–current assets 12 627 826 Property, plant and equipment 14 48,864 50,241 Capital works in progress 2,287 875 Intangible Assets 15 30,279 29,902
Total Non-Current Assets 82,409 82,196
Total Assets 159,156 146,671
LiabilitiesCurrent LiabilitiesPayables 17 38,703 37,020 Provisions 18 5,275 4,834 Other liabilities 19 591 552
Total Current Liabilities 44,569 42,406
Non–Current LiabilitiesPayables 17 1,000 1,010 Provisions 18 1,617 1,679 Other liabilities 19 2,680 3,077
Total Non–Current Liabilities 5,297 5,766
Total Liabilities 49,866 48,172
Net Assets 109,290 98,499
EquityContributed Equity 20 60,884 60,884 Reserves 20 48,406 37,615
Total Equity 109,290 98,499
The Statement of Financial Position should be read in conjunction with the accompanying notes.
Statement of Financial Position – For the year ended 31 July 2013

37
ANNUAL REPORT 2012 – 2013RACING AND WAGERING WESTERN AUSTRALIA
DISCLOSURES AND LEGAL COMPLIANCE
Notes Contributed Equity
General Reserves
Asset Revaluation Reserves
Retained Earnings
Total Equity
$000 $000 $000 $000 $000
Balance at 1 August 2011 20 60,884 10,553 15,987 - 87,424
Restated balance at 1 August 2011 60,884 10,553 15,987 - 87,424
Surplus/(deficit) - - - 10,858 10,858
Other comprehensive income - - 217 - 217 Total comprehensive income for the year - - 217 10,858 11,075
Transactions with owners in their capacity as owners:
Capital appropriations - - - - -
Other contributions by owners - - - - -
Transfers between reserves - 10,858 - (10,858) -
Distributions to owners - - - - -
Total - 10,858 - (10,858) -
Balance at 31 July 2012 60,884 21,411 16,204 - 98,499
Balance at 1 August 2012 60,884 21,411 16,204 - 98,499
Surplus/(deficit) - - - 9,302 9,302
Other comprehensive income - - 1,489 - 1,489 Total comprehensive income for the year - - 1,489 9,302 10,791
Transactions with owners in their capacity as owners:
Capital appropriations - - - - -
Other contributions by owners - - - - -
Transfers between reserves - 9,302 - (9,302) -
Distributions to owners - - - - -
Total - 9,302 - (9,302) -
Balance at 31 July 2013 60,884 30,713 17,693 - 109,290
The Statement of Changes in Equity should be read in conjunction with the accompanying notes.
Statement of Changes in Equity – For the year ended 31 July 2013

38
ANNUAL REPORT 2012 – 2013RACING AND WAGERING WESTERN AUSTRALIA
DISCLOSURES AND LEGAL COMPLIANCE
Cash Flows from Operating Activities Notes 2013 2012$000 $000
ReceiptsReceipts from customers 2,022,632 1,917,498 Interest received 2,609 2,590 GST receipts on sales 35,218 34,074 Other receipts 10,035 13,942
PaymentsCustomers (1,698,931) (1,612,078)Creditors (189,421) (179,495)Employee benefits (33,018) (32,892)Distributions, Grants and Subsidies (119,864) (117,865)Interest paid (28) (36)GST payments on purchases (15,021) (13,148)GST payments to taxation authority (20,272) (20,918)Other payments (6,790) (5,021)Net cash (used in)/provided by operating activities 21 (12,851) (13,349)
Cash Flows from Investing ActivitiesReceiptsProceeds from sales of non–current assets 2,671 1,622 Proceeds from sale of investments - 83 PaymentsPurchase of non–current physical assets (12,436) (7,919)Proceeds from sale of investments - -Net cash (used in)/provided by investing activities (9,765) (6,214)
Cash Flows from State GovernmentGovernment Grant reimbursement 34,187 36,154 Net cash provided by State Government 34,187 36,154
Net Increase/(decrease) in cash and cash equivalents 11,571 16,591 Cash and cash equivalents at the beginning of period 56,174 39,583 Cash and cash equivalents at the end of period 21 67,745 56,174
The Statement of Cash Flows should be read in conjunction with the accompanying notes.
Statement of Cash Flows – For the year ended 31 July 2013

39
ANNUAL REPORT 2012 – 2013RACING AND WAGERING WESTERN AUSTRALIA
DISCLOSURES AND LEGAL COMPLIANCE
For the year ending 31 July 2013
Australian Accounting Standards
GeneralRWWA’s financial statements for the year ended 31 July 2013 have been prepared in accordance with Australian Accounting Standards. The term ‘Australian Accounting Standards’ includes Standards and Interpretations issued by the Australian Accounting Standard Board (AASB).
RWWA has adopted any applicable, new and revised Australian Accounting Standards from their operative dates.
Early adoption of standardsRWWA cannot early adopt an Australian Accounting Standard unless specifically permitted by Treasurer’s Instruction (TI) 1101 ‘Application of Australian Accounting Standards and Other Pronouncements’. There has been no early adoption of Australian Accounting Standards that have been issued or amended (but not operative) by RWWA for the annual reporting period ended 31 July 2013.
1. Summary of Significant Accounting Policies
(a) General StatementRWWA prepares general purpose financial statements in accordance with the Australian Accounting Standards, the Framework, Statements of Accounting Concepts and other authoritative pronouncements of the Australian Accounting Standards Board as applied by the Treasurer’s Instructions. Several of these are modified by the Treasurer’s Instructions to vary application, disclosure, format and wording.
The Financial Management Act and the Treasurer’s Instructions impose legislative provisions that govern the preparation of financial statements and take precedence over the Australian Accounting Standards, the Framework, Statements of Accounting Concepts and other authoritative pronouncements of the AASB.
Where modification is required and has had a material or significant financial effect upon the reported results, details of that modification and the resulting financial effect are disclosed in the notes to the financial statements.
(b) Basis of PreparationThe financial statements have been prepared on the accrual basis of accounting (except for Grant Income which is recognised on a cash basis) using the historical cost convention, except for land and building which have been measured at fair value.
The accounting policies adopted in the preparation of the financial statements have been consistently applied throughout all periods presented unless otherwise stated.
Notes to the Financial Statements

40
ANNUAL REPORT 2012 – 2013RACING AND WAGERING WESTERN AUSTRALIA
DISCLOSURES AND LEGAL COMPLIANCE
The financial statements are presented in Australian dollars and all values are rounded to the nearest thousand dollars ($’000).
The preparation of financial statements requires management to make judgements about the application of accounting policies that have a significant effect on the amounts recognised in the financial statements. RWWA evaluates these judgements regularly.
Key estimates and assumptions concerning the future are based on historical experience and various other factors that have a significant risk of causing a material adjustment to the carrying amount of assets and liabilities within the next financial year.
(c) Reporting EntityThe reporting entity comprises Racing and Wagering Western Australia (RWWA).
(d) Income
Revenue RecognitionThis represents revenue earned from the sale of goods and services net of returns, allowances and duties and taxes paid. Betting receipts are only recognised as revenue when the events to which they relate are finalised.
InterestInterest income is accrued on a time basis by reference to the outstanding principal and the effective interest rate applicable.
Unclaimed DividendsBetting dividends are deducted from turnover to arrive at the commission on turnover. In accordance with the RWWA Act 2003 (Section 104), dividends that are not claimed within seven months are included as income under Other Revenue.
GainsThe gain or loss on the disposal of assets is recognised at the date the significant risks and rewards of ownership of the asset passes to the buyer, usually when the purchaser takes delivery of the asset. The gain or loss on disposal is calculated as the difference between the carrying amount of the asset at the time of disposal and the net proceeds on disposal.
Government Grants and SubsidiesThe Western Australian Government provides partial reimbursement for GST paid on the operator’s margin.
Under the Gaming and Wagering Commission Act 1987 (section 110B), the Gaming and Wagering Commission may credit RWWA with proceeds from the Western Australian Race Fields legislation. The Racing and Wagering Western Australia Act 2003 (section107A) requires these funds to be credited into a special purpose account for distribution to registered racing clubs in Western Australia. Treasurer’s Instruction 1102 requires these amounts to be disclosed as Grants from the State Government.
Notes to the Financial Statements

41
ANNUAL REPORT 2012 – 2013RACING AND WAGERING WESTERN AUSTRALIA
DISCLOSURES AND LEGAL COMPLIANCE
These grants are not recognised by RWWA until receipted, at which time certainty of control can be assumed.
RWWA receives contributions through the Racecourse Infrastructure Grants Program (RIGP). If RWWA are assisting a race club and contributing towards the overall project cost then any funding received is recognised as income. If the contribution received from Department of Racing, Gaming and Liquor (DRGL) relates to an asset that is owned by RWWA then the contribution is recorded as deferred income and recognised within the Statement of Comprehensive Income over the life of the asset that has been purchased.
(e) Product Fee ExpenseProduct Fees are generally charged to wagering operators (including RWWA) by the State controlling bodies of each racing code for the use of Race Fields listings. Additional product fees on sporting events and international racing are negotiated with the relevant controlling bodies. Permission to use Western Australian Race Fields is controlled by the Western Australian Department of Racing, Gaming and Liquor.
(f) TaxSection 102 of the RWWA Act 2003 requires RWWA to pay tax in respect of bets at the rate imposed by Sections 4 and 5.
Parimutuel and Fixed Odds Betting (FOB)The tax rate for Parimutuel Sports betting is 5% of turnover, whereas the tax rate for Parimutuel Racing is 11.9% of gross revenue. The tax rate for Fixed Odds Betting (FOB) Sports is 0.5% of turnover and FOB Racing is 2% of turnover.
(g) Goods and Services TaxRevenues, expenses and assets are recognised net of GST, except where the amount of the GST incurred is not recoverable from the Australian Taxation Office (ATO). In these circumstances, the GST is recognised as part of the cost of acquisition of the asset or as part of the expense. Receivables and payables are stated with the amount of the GST included.
The net amount of GST recoverable from, or payable to, the ATO is included as a current asset or liability in the Statement of Financial Position.
Cash Flows are included in the Statement of Cash Flows on a gross basis. The GST components of cash flows arising from investing and financing activities which are recoverable from, or payable to, the ATO are classified as operating cash flows. The GST on operator’s margin, which is reimbursed by the Western Australian Government, is classified as cash flows from State Government.
Notes to the Financial Statements

42
ANNUAL REPORT 2012 – 2013RACING AND WAGERING WESTERN AUSTRALIA
DISCLOSURES AND LEGAL COMPLIANCE
(h) Property, Plant and Equipment and Infrastructure
Capitalisation/Expensing of assetsItems of property, plant and equipment costing over $5,000 are recognised as assets and the cost of utilising assets is expensed (depreciated) over their useful lives. Items of property, plant and equipment costing less than $5,000 are expensed direct to the Statement of Comprehensive Income (other than where they form part of a group of similar items which are significant in total).
Initial recognition and measurementAll items of property, plant and equipment are initially recognised at cost.
Subsequent measurementSubsequent to initial recognition as an asset, the revaluation model is used for the measurement of land, buildings and the cost model for all other property, plant and equipment and infrastructure. Land and buildings are carried at fair value less accumulated depreciation on buildings and accumulated impairment losses. All other items of property, plant and equipment and infrastructure are carried at cost less accumulated depreciation and accumulated impairment losses.
Where market–based evidence is available, the fair value of land and buildings is determined on the basis of current market buying values determined by reference to recent market transactions. When buildings are revalued by reference to recent market transactions, the accumulated depreciation is eliminated against the gross carrying amount of the asset and the net amount restated to the revalued amount.
In the absence of market–based evidence, the fair value of land and buildings is determined on the basis of existing use. This normally applies where buildings are specialised or where land use is restricted. Fair value for existing use assets is determined by reference to the cost of replacing the remaining future economic benefits embodied in the asset (i.e. depreciated replacement cost).
Land and buildings are independently valued annually by the Western Australian Land Information Authority (Valuation Services) and recognised annually to ensure that the carrying amount does not differ materially from the assets fair value at the end of the reporting period.
DerecognitionUpon disposal or derecognition of an item of property, any revaluation relating to that asset is retained in the asset revaluation surplus.
Asset Revaluation ReserveThe asset revaluation reserve is used to record increments and decrements on the revaluation of non–current assets as described in note 14 ‘Property, Plant and Equipment’.
Notes to the Financial Statements
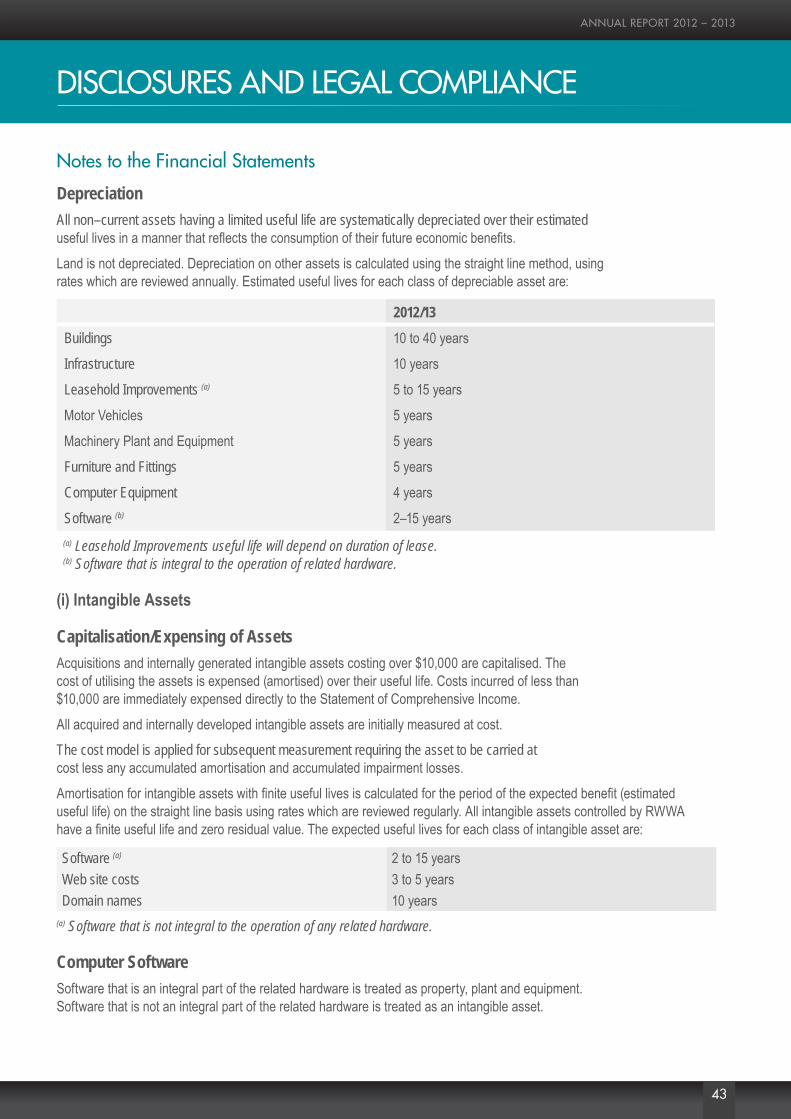
43
ANNUAL REPORT 2012 – 2013RACING AND WAGERING WESTERN AUSTRALIA
DISCLOSURES AND LEGAL COMPLIANCE
DepreciationAll non–current assets having a limited useful life are systematically depreciated over their estimated useful lives in a manner that reflects the consumption of their future economic benefits.
Land is not depreciated. Depreciation on other assets is calculated using the straight line method, using rates which are reviewed annually. Estimated useful lives for each class of depreciable asset are:
2012/13Buildings 10 to 40 years
Infrastructure 10 years
Leasehold Improvements (a) 5 to 15 years
Motor Vehicles 5 years
Machinery Plant and Equipment 5 years
Furniture and Fittings 5 years
Computer Equipment 4 years
Software (b) 2–15 years
(a) Leasehold Improvements useful life will depend on duration of lease. (b) Software that is integral to the operation of related hardware.
(i) Intangible Assets
Capitalisation/Expensing of AssetsAcquisitions and internally generated intangible assets costing over $10,000 are capitalised. The cost of utilising the assets is expensed (amortised) over their useful life. Costs incurred of less than $10,000 are immediately expensed directly to the Statement of Comprehensive Income.
All acquired and internally developed intangible assets are initially measured at cost.
The cost model is applied for subsequent measurement requiring the asset to be carried at cost less any accumulated amortisation and accumulated impairment losses.
Amortisation for intangible assets with finite useful lives is calculated for the period of the expected benefit (estimated useful life) on the straight line basis using rates which are reviewed regularly. All intangible assets controlled by RWWA have a finite useful life and zero residual value. The expected useful lives for each class of intangible asset are:
Software (a) 2 to 15 yearsWeb site costs 3 to 5 yearsDomain names 10 years
(a) Software that is not integral to the operation of any related hardware.
Computer SoftwareSoftware that is an integral part of the related hardware is treated as property, plant and equipment. Software that is not an integral part of the related hardware is treated as an intangible asset.
Notes to the Financial Statements

44
ANNUAL REPORT 2012 – 2013RACING AND WAGERING WESTERN AUSTRALIA
DISCLOSURES AND LEGAL COMPLIANCE
Web site costsWeb site costs are charged as expenses when they are incurred unless they relate to the acquisition or development of an asset when they may be capitalised and amortised. Generally, costs in relation to feasibility studies during the planning phase of a web site, and ongoing costs of maintenance during the operating phase are expensed. Costs incurred in building or enhancing a web site, to the extent that they represent probable future economic benefits that can be reliably measured, are capitalised.
Domain NamesDomain names have a finite useful life and are carried at cost less accumulated amortisation and accumulated impairment losses.
(j) Impairment of AssetsProperty, plant and equipment, infrastructure and intangible assets are tested for any indication of impairment at the end of each reporting period. Where there is an indication of impairment, the recoverable amount is estimated. Where the recoverable amount is less than the carrying amount, the asset is considered impaired and is written down to the recoverable amount and an impairment loss is recognised. Where an asset measured at cost is written down to recoverable amount, an impairment loss is recognised in profit or loss. Where a previously revalued asset is written down to recoverable amount, the loss is recognised as a revaluation decrement in other comprehensive income.
The risk of impairment is generally limited to circumstances where an asset’s depreciation is materially understated, where the replacement cost is falling or where there is a significant change in useful life. Each relevant class of assets is reviewed annually to verify that the accumulated depreciation/amortisation reflects the level of consumption or expiration of the asset’s future economic benefits and to evaluate any impairment risk from falling replacement costs.
Intangible assets with an indefinite useful life and intangible assets not yet available for use are tested for impairment at the end of the reporting period irrespective of whether there is any indication of impairment.
The recoverable amount of assets identified as surplus assets is the higher of fair value less costs to sell and the present value of future cash flows expected to be derived from the asset. Surplus assets carried at fair value have no risk of material impairment where fair value is determined by reference to market–based evidence. Where fair value is determined by reference to depreciated replacement cost, surplus assets are at risk of impairment and the recoverable amount is measured. Surplus assets at cost are tested for indications of impairment at the end of each reporting period.
(k) Non–Current Assets Classified as Held for SaleNon–current assets held for sale are recognised at the lower of carrying amount and fair value less costs to sell, and are disclosed separately from other assets in the Statement of Financial Position. Assets classified as held for sale are not depreciated or amortised.
(l) LeasesRWWA holds a number of operating leases for buildings and operating equipment. Lease payments are expensed on a straight line basis over the lease term as this represents the pattern of benefits derived from the leased properties and equipment.
Notes to the Financial Statements

45
ANNUAL REPORT 2012 – 2013RACING AND WAGERING WESTERN AUSTRALIA
DISCLOSURES AND LEGAL COMPLIANCE
(m) Financial InstrumentsIn addition to cash, RWWA has two categories of financial instrument:
• Receivables
• Financial liabilities measured at amortised cost.
These have been disaggregated into the following classes:
Financial Assets
• Cash and cash equivalents
• Receivables.
Financial Liabilities
• Payables
• Agents Deposits.
Initial recognition and measurement of financial instruments is at fair value which normally equates to the transaction cost or the face value. Subsequent measurement is at amortised cost using the effective interest method.
The fair value of short–term receivables and payables is the transaction cost or the face value because there is no interest rate applicable and subsequent measurement is not required as the effect of discounting is not material.
(n) Cash and Cash EquivalentsFor the purpose of the Statement of Cash Flows, cash and cash equivalent assets comprise cash on hand and short term deposits with original maturities of three months or less that are readily convertible to a known amount of cash and which are subject to insignificant risk of changes in value.
(o) Accrued SalariesAccrued salaries represent the amount due to staff but unpaid at the end of the financial year, as the pay date for the last pay period for that financial year does not coincide with the end of financial year. Accrued salaries are settled within a fortnight of the financial year end. RWWA considers the carrying amount of accrued salaries to be equivalent to its net fair value.
(p) InventoriesInventories are measured at the lower of cost and net realisable value. The cost of inventories is based on the first–in first–out principle, and includes expenditure incurred in acquiring the inventories and bringing them to their existing location and condition.
Inventories not held for resale are valued at cost unless they are no longer required, in which case they are valued at net realisable value.
(q) ReceivablesReceivables are recognised and carried at original invoice amount less an allowance for any uncollectible amounts. The collectability of receivables is reviewed on an ongoing basis and any receivables identified as uncollectible are written–off against the allowance account. The allowance for uncollectible amounts (doubtful debts) is raised when there is objective evidence that RWWA will not be able to collect its debts.
Notes to the Financial Statements

46
ANNUAL REPORT 2012 – 2013RACING AND WAGERING WESTERN AUSTRALIA
DISCLOSURES AND LEGAL COMPLIANCE
The carrying amount is equivalent to fair value as it is due for settlement within 30 days. Agents settle on a weekly basis.
(r) PayablesPayables are recognised when RWWA becomes obliged to make future payments as a result of a purchase of assets or services at the amounts payable. The carrying amount is equivalent to fair value, as they are generally settled within 30 days.
(s) ProvisionsProvisions are liabilities of uncertain timing and amount and are recognised where there is a present legal or constructive obligation as a result of a past event and when the outflow of resources embodying economic benefits is probable and a reliable estimate can be made of the amount of the obligation. Provisions are reviewed at the end of each reporting period.
(i) Provisions – Employee BenefitsAll annual leave and long service leave provisions are in respect of employees’ services up to the end of the reporting period.
Annual LeaveThe liability for annual leave expected to be settled within 12 months after the end of the reporting period is recognised and measured at the undiscounted amounts expected to be paid when the liabilities are settled. Annual leave that is not expected to be settled within 12 months after the end of the reporting period is measured at the present value of amounts expected to be paid when the liabilities are settled using the remuneration rate expected to apply at the time of settlement.
When assessing expected future payments consideration is given to expected future wage and salary levels including non–salary components such as employer superannuation contributions as well as the experience of employee departures and periods of service. The expected future payments are discounted to present value using market yields at the end of the reporting period on national government bonds with terms to maturity that match, as closely as possible, the estimated future cash outflows.
The provision for annual leave is classified as current liability as RWWA does not have an unconditional right to defer settlement of the liability for at least 12 months after the reporting period.
Long Service LeaveA liability for long service leave is recognised after an employee has completed two years of service based on remuneration rates current as at the end of the reporting period.
An actuarial assessment of long service leave undertaken by PWC Actuaries at 30 June 2011 determined that the liability measured using the short–hand measurement technique above was not materially different from the liability determined using the present value of expected future payments. This calculation is consistent with the Authority’s experience of employee retention and leave taken.
Unconditional long service leave provisions are classified as current liabilities as RWWA does not have an unconditional right to defer settlement of the liability for at least 12 months after the reporting period. Conditional long service leave provisions are classified as non–current liabilities because RWWA has an unconditional right to defer the settlement of the liability until the employees has completed the requisite years of service.
Notes to the Financial Statements
47
ANNUAL REPORT 2012 – 2013RACING AND WAGERING WESTERN AUSTRALIA
DISCLOSURES AND LEGAL COMPLIANCE
SuperannuationThe Government Employees Superannuation Board (GESB) and other funds administer public sector superannuation arrangements in Western Australia in accordance with legislative requirements. Eligibility criteria for membership in particular schemes for public sector employees varies according to commencement and implementation date.
Employees may contribute to the Gold State Superannuation Scheme (GSS), a defined benefit lump sum scheme now closed to new members. Employees commencing employment prior to 16 April 2007 who were not members of GSS became non–contributory members of the West State Superannuation Scheme (WSS). Employees commencing employment on or after 16 April 2007 became members of the GESB Super Scheme (GESBS). From 30 March 2012 existing members of WSS or GESBS and new employees became able to choose their preferred superannuation fund. RWWA makes concurrent contributions to GESB or other funds on behalf of employees in compliance with the Commonwealth Government’s Superannuation Guarantee (Administration) Act 1992. Contributions to these accumulation schemes extinguish RWWA’s liability for superannuation charges in respect of employees who are not members of the Pension Scheme or GSS.
The GSS Scheme, the WSS Scheme, and the GESBS Scheme, where the current service superannuation charge is paid by RWWA to the GESB, are defined contribution schemes. The liabilities for current service superannuation charges under the GSS Scheme, the WSS Scheme, and the GESBS Scheme are extinguished by the concurrent payment of employer contributions to the GESB.
The Gold State Superannuation Scheme is a defined benefit scheme for the purposes of employees and whole–of–government reporting. However, from an agency perspective, apart from the transfer benefits, it is a defined contribution plan under AASB 119.
AMP manages the AMP Custom Superannuation Fund, an accumulation fund for casual staff.
(ii) Provisions – OtherEmployment on–costs, including workers’ compensation insurance and payroll tax, are not employee benefits and are recognised separately as liabilities and expenses when the employment to which they relate has occurred. Employment on–costs are included as part of ‘Other expenses’ and are not included as part of RWWA’s ‘Employee benefits expense’. The related liability is included in ‘Employment on–costs provision.’
(t) Superannuation ExpenseThe superannuation expense of the defined contribution plans is recognised as and when the contributions fall due.
(u) Comparative FiguresComparative figures are, where appropriate, reclassified to be comparable with the figures presented in the current financial year.
Notes to the Financial Statements

48
ANNUAL REPORT 2012 – 2013RACING AND WAGERING WESTERN AUSTRALIA
DISCLOSURES AND LEGAL COMPLIANCE
Key Sources of Estimation UncertaintyKey estimates and assumptions concerning the future are based on historical experience and various other factors that have a significant risk of causing a material adjustment to the carrying amount of assets and liabilities within the next financial year.
Long Service LeaveSeveral estimations and assumptions used in calculating RWWA’s long service leave provision include expected future salary rates, discount rates, employee retention rates and expected future payments. Changes in these estimations and assumptions may impact on the carrying amount of the long service leave provision.
Disclosure of Changes in Accounting Policy and Estimates
Initial application of an Australian Accounting StandardRWWA has applied the following Australian Accounting Standards effective for annual reporting periods beginning on or after 1 August 2012 that impacted on RWWA:
AASB 2011–9 Amendments to Australian Accounting Standards – Presentation of Items of Other Comprehensive Income [AASB 1, 5, 7, 101, 112, 120, 121, 132, 133, 134, 1039 & 1049]
This Standard requires to group items presented in other comprehensive income on the basis of whether they are potentially reclassifiable to profit or loss subsequently (reclassification adjustments). There is no financial impact.
Future impact of Australian Accounting Standards not yet operative.
RWWA cannot early adopt an Australian Accounting Standard unless specifically permitted by TI 1101 ‘Applications of Australian Accounting Standards and Other Pronouncements’. Consequently, RWWA has not applied the following Australian Accounting Standards and Australian Accounting Interpretations that have been issued but are not yet effective. Where applicable, RWWA plans to apply these Standards and their interpretations from their application date:
Title Operative for reporting periods beginning on/after
AASB 9 Financial Instruments
This Standard supersedes AASB 139 Financial Instruments:
Recognition and Measurement, introducing a number of changes to accounting treatments.
AASB 2012–6 – Amendments to Australian Accounting Standards – Mandatory effective date of AASB 9 and Transition Disclosures amended the mandatory application date of this Standard to 1 January 2015.
RWWA has not yet determined the application or the potential impact of the Standard.
1 January 2015
AASB 11 Joint Arrangements
This Standard supersedes AASB 131 Interests in Joint Ventures, introducing a number of changes to accounting treatments.
AASB 2012–10 amends the mandatory application date of this Standard to 1 January 2014 for not–for–profit entities.
RWWA has not yet determined the application or the potential impact of the Standard.
1 January 2014
Notes to the Financial Statements

49
ANNUAL REPORT 2012 – 2013RACING AND WAGERING WESTERN AUSTRALIA
DISCLOSURES AND LEGAL COMPLIANCE
Disclosure of Changes in Accounting Policy and Estimates
Title Operative for reporting periods beginning on/after
AASB 12 Disclosure of Interests in Other Entities
This Standard supersedes disclosure requirements under AASB 127 Consolidated and Separate Financial Statements, AASB 128 Investments in Associates and AASB 131 Interests in Joint Ventures.
AASB 2012–10 amends the mandatory application date of this Standard to 1 January 2014 for not–for–profit entities.
RWWA has not yet determined the application or the potential impact of the Standard.
1 January 2014
AASB 13 Fair Value Measurement
This Standard defines fair value, sets out a framework for measuring fair value and requires disclosures about fair value measurements. RWWA has liaised with the Western Australian Land Information Authority (Valuation Services) to ensure that sufficient information will be provided to meet the disclosure requirements of this Standard. There is no financial impact.
1 January 2013
AASB 119 Employee Benefits
This Standard supersedes AASB 119 (October 2010) making changes to the recognition, presentation and disclosure requirements.
As the Authority does not operate a defined benefit plan, the impact of the change is limited to measuring annual leave as a long–term employee benefit. The resultant discounting of the annual leave benefit has an immaterial impact.
1 January 2013
AASB 1053 Application of Tiers of Australian Accounting Standards
This Standard establishes a differential financial reporting framework consisting of two tiers of reporting requirements for preparing general purpose financial statements. There is no financial impact.
1 July 2013
AASB 2010-2 Amendments to Australian Accounting Standards arising from Reduced Disclosure Requirements [ AASB 1, 2, 3, 5, 7, 8, 101, 102, 107, 108, 110, 111, 112, 116, 117, 119, 121, 123, 124, 127, 128, 131, 133, 134, 136, 137, 138, 140, 141, 1050 & 1052 and Int 2, 4, 5, 15, 17, 127, 129 & 1052]
This Standard makes amendments to Australian Accounting Standards and Interpretations to introduce reduced disclosure requirements for certain types of entities. There is no financial impact.
1 July 2013
AASB 2010-7 Amendments to Australian Accounting Standards arising from AASB 9 (December 2010) [AASB 1, 3, 4, 5, 7, 101, 102, 108, 112, 118, 120, 121, 127, 128, 131, 132, 136, 137, 139, 1023 & 1038 and Int 2, 5, 10, 12, 19 &127]
This Standard makes consequential amendments to other Australian Accounting Standards and Interpretations as a result of issuing AASB 9 in December 2010.
AASB 2012-6 amended the mandatory application date of this Standard to 1 January 2015. RWWA has not yet determined the application of the potential impact of the Standard.
1 January 2015
Notes to the Financial Statements

50
ANNUAL REPORT 2012 – 2013RACING AND WAGERING WESTERN AUSTRALIA
DISCLOSURES AND LEGAL COMPLIANCE
Disclosure of Changes in Accounting Policy and Estimates
Title Operative for reporting periods beginning on/after
AASB 2011-8 Amendments to Australian Accounting Standards arising from AASB 13 [AASB 1, 2, 3, 4, 5, 7, 9, 2009–11, 2010–7, 101, 102, 108, 110, 116, 117, 118, 119, 120, 121, 128, 131, 132, 133, 134, 136, 138, 139, 140, 141, 1004, 1023 & 1038 and Int 2, 4, 12, 13, 14, 17, 19, 131 & 132]
This Standard replaces the existing definition and fair value guidance in other Australian Accounting Standards and Interpretations as the result of issuing AASB 13 in September 2011. There is no financial impact.
1 January 2013
AASB 2011-10 Amendments to Australian Accounting Standards arising from AASB 119 (September 2011) [AASB 1, 8, 101, 124, 134, 1049 & 2011-8 and Int 14]
This Standard makes amendments to other Australian Accounting Standards and Interpretations as a result of issuing AASB 119 in September 2011. There is limited financial impact.
1 January 2013
AASB 2012-1 Amendments to Australian Accounting Standards – Fair Value Measurement – Reduced Disclosure Requirements [AASB 3, 7, 13, 140 & 141]
This Standard establishes and amends reduced disclosure requirements for additional and amended disclosures arising from AASB 13 and the consequential amendments implemented through AASB 2011–8. There is no financial impact.
1 July 2013
AASB 2012-2 Amendments to Australian Accounting Standards – Disclosures – Offsetting Financial Assets and Financial Liabilities [AASB 7 & 132]
This Standard amends the required disclosures in AASB 7 to include information that will enable users of an entity’s financial statements to evaluate the effect or potential effect of netting arrangements, including rights of set–off associated with the entity’s recognised financial assets and recognised financial liabilities, on the entity’s financial position. There is no financial impact.
1 Jan 2013
AASB 2012-3 Amendments to Australian Accounting Standards – Offsetting Financial Assets and Financial Liabilities [AASB 132]
This Standard adds application guidance to AASB 132 to address inconsistencies identified in applying some of the offsetting criteria, including clarifying the meaning of “currently has a legally enforceable right of set–off” and that some gross settlement systems may be considered equivalent to net settlement. There is no financial impact.
1 Jan 2014
AASB 2012-6 Amendments to Australian Accounting Standards – Mandatory Effective Date of AASB 9 and Transition Disclosures [AASB 9, 2009–11, 2010–7, 2011-7 & 2011–8]
This Standard amends the mandatory effective date of AASB 9 Financial Instruments to 1 January 2015. Further amendments are also made to consequential amendments arising from AASB 9 that will now apply from 1 January 2015 and to consequential amendments arising out of the Standards that will still apply from 1 January 2013. There is no financial impact.
1 Jan 2013
Notes to the Financial Statements

51
ANNUAL REPORT 2012 – 2013RACING AND WAGERING WESTERN AUSTRALIA
DISCLOSURES AND LEGAL COMPLIANCE
Disclosure of Changes in Accounting Policy and Estimates
Title Operative for reporting periods beginning on/after
AASB 2012–7 Amendments to Australian Accounting Standards arising from Reduced Disclosure Requirements [AASB 7, 12, 101 & 127]
This Standard adds to or amends the Australian Accounting Standards to provide further information regarding the differential reporting framework and the two tiers of reporting requirements for preparing general financial statement. There is no financial impact.
1 Jul 2013
AASB 2012–11 Amendments to Australian Accounting Standards – Reduced Disclosure Requirements and Other Amendments [AASB 1, 2, 8, 10, 107, 128, 133, 134 & 2011–4]
This Standard makes various editorial corrections to Australian Accounting Standards – Reduced Disclosure Requirements (Tier 2). These corrections ensure that the Standards reflect decisions of the AASB regarding the Tier 2 requirements.
This Standard also extends the relief from consolidation and the equity method (in the new Consolidation and Joint Arrangements Standards) to entities complying with Australian Accounting Standards – Reduced Disclosure Requirements. There is no financial impact.
1 Jul 2013
Notes to the Financial Statements

52
ANNUAL REPORT 2012 – 2013RACING AND WAGERING WESTERN AUSTRALIA
DISCLOSURES AND LEGAL COMPLIANCE
Notes to the Financial Statements
2013 2012$000 $000
2 MarginMargin on Turnover inclusive of GST 342,591 319,182 Goods and Services Tax (26,850) (26,089)
315,741 293,093
The Goods and Services Tax (GST) is not applied to the consumption of gambling services. It is however, applied to the operator’s margin defined as the subscription (wagering less sales commission) less the amount of prizes (dividends).The State provides reimbursement to gaming operators (including RWWA) for GST paid on the operator’s margin on Fixed Odds Betting and Parimutuel Sports.Treasurer’s Instruction 1102 requires the GST reimbursement to be disclosed as a grant from the State Government rather than offset against the cost to which it applies.
3 Wagering TaxTax on turnover 2,711 1,869 Tax on margin 37,706 35,747
40,417 37,616
4 Other RevenueOther Revenue 9,527 14,019 Unclaimed dividends (Racing) 8,253 8,248 Dividends - 90
17,780 22,357
5 Net gain/(loss) on disposal of Property, Plant, Equipment and VehiclesProceeds from disposal 2,672 1,623 Cost of disposal (2,415) (1,452)Net gain / (loss) 257 171
6 Racing, Wagering and Support ServicesEmployee Benefit Expense 33,397 33,200 Depreciation and Amortisation Expense 12,498 13,086 Finance Costs 28 36 Supplies and Services 45,936 44,931 Advertising and Promotions 16,955 15,732 Communications 5,088 5,119 Accommodation 7,244 7,008 Other Expenses 6,926 6,508
128,072 125,620

53
ANNUAL REPORT 2012 – 2013RACING AND WAGERING WESTERN AUSTRALIA
DISCLOSURES AND LEGAL COMPLIANCE
Notes to the Financial Statements
2013 2012$000 $000
7 Grants and subsidiesGrants and subsidies expenseGrants 451 1,673 Subsidies 1,748 2,393
2,199 4,066
Grants income (includes Racefields, RIGP and other Grant Income) 34,187 36,154
8 Distributions to Racing and Sports IndustriesThoroughbreds 69,017 66,428 Harness 29,765 30,084 Greyhounds 14,880 13,627 Sports 4,003 3,659
117,665 113,798
9 InventoriesCurrentInventories not held for resale:At Cost:Tickets 245 256 Agency Spares and Consumables 161 138
406 394
10 ReceivablesCurrentReceivables 1,571 1,108 Allowance for impairment of receivables (20) (20)Other Debtors 251 1,524 Accrued Revenue 215 271
2,017 2,883
Reconciliation of changes in the allowance for impairment of receivables:Balance at start of year 20 20 Doubtful debts expense recognised in the income statement 68 25 Amounts written off during the year (68) (25)Amount recovered during the year - - Balance at end of year 20 20
RWWA does not hold any collateral as security or other credit enhancements relating to receivables.

54
ANNUAL REPORT 2012 – 2013RACING AND WAGERING WESTERN AUSTRALIA
DISCLOSURES AND LEGAL COMPLIANCE
Notes to the Financial Statements
2013 2012$000 $000
11 InvestmentsNon currentAt cost:Unlisted Shares 352 352 Associates - -
352 352
Reconciliation
Carrying amount at start of period 352 552 Disposals - (83)Write–Offs - (117)Carrying amount at end of period 352 352
12 Other AssetsCurrentPrepayments 5,679 2,726
5,679 2,726
Non–CurrentPrepayments 627 826
627 826

55
ANNUAL REPORT 2012 – 2013RACING AND WAGERING WESTERN AUSTRALIA
DISCLOSURES AND LEGAL COMPLIANCE
Notes to the Financial Statements
2013 2012$000 $000
13 Non–current assets classified as held for saleOpening balanceFreehold land 2,220 1,100 Buildings 78 49
2,298 1,149
Assets reclassified as held for saleFreehold land 840 2,220 Buildings 60 78
900 2,298
Total assets classified as held for saleFreehold land 3,060 3,320 Buildings 138 127
3,198 3,447
Less assets soldFreehold land 2,220 1,100 Buildings 77 49
2,297 1,149
Closing balanceFreehold land 840 2,220 Buildings 60 78
900 2,298
No freehold properties are in the process of being sold.

56
ANNUAL REPORT 2012 – 2013RACING AND WAGERING WESTERN AUSTRALIA
DISCLOSURES AND LEGAL COMPLIANCE
Notes to the Financial Statements
2013 2012$000 $000
14 Property, Plant & EquipmentFreehold landAt fair value 20,086 20,211 Accumulated impairment losses - -
20,086 20,211 BuildingsAt fair value 7,162 7,188 Accumulated depreciation (327) (818)
6,835 6,370 Leasehold improvementsAt cost 9,389 8,506 Accumulated depreciation (6,579) (5,330)
2,810 3,176 InfrastructureAt cost 6,731 6,521 Accumulated depreciation (3,029) (2,374)
3,702 4,147 Machinery, Plant & EquipmentAt cost 3,172 2,523 Accumulated depreciation (2,042) (1,712)
1,130 811 Computer EquipmentAt cost 31,463 28,901 Accumulated depreciation (19,300) (15,929)
12,163 12,972 Furniture and FittingsAt cost 3,653 3,352 Accumulated depreciation (2,397) (1,881)
1,256 1,471 Motor VehiclesAt cost 2,769 2,614 Accumulated depreciation (1,887) (1,531)
882 1,083
48,864 50,241 Freehold land and buildings were revalued as at 1 July 2012 by Western Australian Land Information Authority. The valuations were performed during the year ended 31 July 2012 and recognised at 31 July 2013. The fair value of all land and buildings has been determined by reference to recent market transactions. Reconciliations of the carrying amounts of property, plant and equipment at the beginning and end of the reporting period are set out below.

57
ANNUAL REPORT 2012 – 2013RACING AND WAGERING WESTERN AUSTRALIA
DISCLOSURES AND LEGAL COMPLIANCE
Notes to the Financial Statements
Freehold Land
Buildings Leasehold Improvements
Infrastructure Machinery, Plant and
Equipment
Computer Equipment
2013 $000 $000 $000 $000 $000 $000
Carrying amount at start of period
20,211 6,370 3,176 4,147 811 12,972
Additions - 34 883 210 649 3,345
Disposals - - - - - -
Write–Offs - - - - - -
Classified as held for sale
(840) (58) - - - -
Revaluation increments/ (decrements)
715 775 - - - -
Depreciation - (286) (1,249) (655) (330) (4,154)
Carrying amount at end of period 20,086 6,835 2,810 3,702 1,130 12,163
Furniture and Fittings
Motor Vehicles
Total
$000 $000 $000
Carrying amount at start of period 1,471 1,083 50,240
Additions 301 498 5,921
Disposals - (117) (117)
Write–Offs - - -
Classified as held for sale - - (898)
Revaluation increments/ (decrements)
- - 1,490
Depreciation (516) (582) (7,771)
Carrying amount at end of period 1,256 882 48,864

58
ANNUAL REPORT 2012 – 2013RACING AND WAGERING WESTERN AUSTRALIA
DISCLOSURES AND LEGAL COMPLIANCE
Notes to the Financial Statements
Freehold Land
Buildings Leasehold Improvements
Infrastructure Machinery, Plant and
Equipment
Computer Equipment
2012 $000 $000 $000 $000 $000 $000
Carrying amount at start of period 22,073 6,812 3,000 4,103 927 15,811
Additions - 320 1,716 658 206 1,246
Disposals - - - - - -
Write–Offs - - (5) - - (43)
Classified as held for sale (2,220) (78) - - - -
Revaluation increments/ (decrements)
358 (141) - - - -
Depreciation - (544) (1,536) (615) (322) (4,042)
Carrying amount at end of period 20,211 6,370 3,176 4,147 811 12,972
Furniture and Fittings
Motor Vehicles
Total
$000 $000 $000
Carrying amount at start of period 1,013 1,400 55,139
Additions 1,000 442 5,588
Disposals - (208) (208)
Write–Offs (38) - (87)
Classified as held for sale - - (2,298)
Revaluation increments/ (decrements)
- - 217
Depreciation (504) (550) (8,112)
Carrying amount at end of period 1,471 1,083 50,241

59
ANNUAL REPORT 2012 – 2013RACING AND WAGERING WESTERN AUSTRALIA
DISCLOSURES AND LEGAL COMPLIANCE
Notes to the Financial Statements
2013 2012$000 $000
15 Intangible AssetsComputer software
At cost 49,879 44,777
Accumulated amortisation (19,609) (14,887)
30,270 29,890
Domain names
At cost 25 25
Accumulated amortisation (16) (13)
9 12
30,279 29,902
Reconciliation
Computer software
Carrying amount at start of period 29,890 31,326
Additions 5,102 3,544
Write–Offs - (8)
Amortisation (4,722) (4,972)
Carrying amount at end of period 30,270 29,890
Domain names
Carrying amount at start of period 12 15
Amortisation (3) (3)
Carrying amount at end of period 9 12
16 Impairment of AssetsThere were no indications of impairment to property, plant and equipment and intangible assets at 31 July 2013. RWWA held no intangible assets with an indefinite useful life during the reporting period. No surplus assets are held by RWWA as at 31 July 2013.

60
ANNUAL REPORT 2012 – 2013RACING AND WAGERING WESTERN AUSTRALIA
DISCLOSURES AND LEGAL COMPLIANCE
Notes to the Financial Statements
2013 2012$000 $000
17 PayablesCurrentTrade Payables 4,159 3,050
Royalties for Regions Grants payable to clubs 969 -
Other Government Grants payable to clubs 1,505 1,171
Unclaimed dividends and refunds 6,534 6,547
TAB Payables and Account betting deposits 12,288 12,568
Other Payables 4,409 4,272
GST Payable 1,811 1,886
Accrued Expenses 7,028 7,526
38,703 37,020 Non CurrentAgents deposits and property bonds 1,000 1,010
1,000 1,010

61
ANNUAL REPORT 2012 – 2013RACING AND WAGERING WESTERN AUSTRALIA
DISCLOSURES AND LEGAL COMPLIANCE
Notes to the Financial Statements
2013 2012$000 $000
18 ProvisionsCurrentEmployee benefits provisionAnnual Leave (a) 2,105 2,093 Long Service Leave (b) 2,478 2,105
4,583 4,198 Other provisionsEmployment on–costs (c ) 692 636
692 636
5,275 4,834 Non CurrentEmployee benefits provisionLong Service Leave (b) 1,411 1,465
1,411 1,465 Other provisionsEmployment on–costs (c ) 206 214
206 214 1,617 1,679
(a) Annual leave liabilities have been classified as current as there is no unconditional right to defer settlement for at least 12 months after the reporting period. Assessments indicate that actual settlement of the liabilities is expected to occur as follows:
Within 12 months of the end of the reporting period 2,105 2,093 More than 12 months after the end of the reporting period - -
2,105 2,093 (b) Long service leave liabilities have been classified as current as there is no unconditional right to defer settlement for at least 12 months after the end of the reporting period. Assessments indicate that actual settlement of the liabilities is expected to occur as follows:
Within 12 months of the end of the reporting period 546 647 More than 12 months after the end of the reporting period 3,343 2,924
3,889 3,571 (c) The settlement of annual and long service leave liabilities gives rise to the payment of employment on–costs including workers compensation premiums and payroll tax. The provision is measured at the present value of expected future payments. The associated expense, apart from the unwinding of the discount (finance cost), is included under ‘Other expenses’ at Note 6.Movements in Other provisionsMovements in each class of provisions during the financial year, other than employee benefits, are set out below.
Employment on–cost provisionCarrying amount at start of period 850 816 Additional provisions recognised 4,713 4,574 Payments/other sacrifices of economic benefits (4,665) (4,540)Carrying amount at end of period 898 850

62
ANNUAL REPORT 2012 – 2013RACING AND WAGERING WESTERN AUSTRALIA
DISCLOSURES AND LEGAL COMPLIANCE
Notes to the Financial Statements
2013 2012$000 $000
19 Other liabilitiesCurrentDeferred Income 591 552
591 552 Non CurrentDeferred Income 2,680 3,077
2,680 3,077 20 Equity
Contributed equityBalance at the start of the period 60,884 60,884 Contributions - - Distributions - - Balance at the end of the period 60,884 60,884
ReservesAsset revaluation reserve:Balance at the start of the period 16,204 15,987 Net revaluation increments/(decrements): Land 714 359 Buildings 775 (142) Infrastructure - Transfer to General Reserve - - Balance at the end of the period 17,693 16,204
General reserve:Balance at the start of the period 21,411 10,553 Transfer from Retained Earnings 9,302 10,858 Balance at the end of the period 30,713 21,411
Balance of reserves at end of the period 48,406 37,615
Retained earningsBalance at the start of the period - - Result for the period 9,302 10,858 Transfer from Asset Revaluation Reserve - - Transfer to General Reserve (9,302) (10,858)Balance at the end of the period - -
General reserveThe purpose of the general reserve is to cushion the effect of turnover fluctuations, or for supplementing payments made to the racing codes; to meet capital commitments, including the repayment of borrowings; to provide for capital development in the long term interests of RWWA; to meet contingent losses; and for the maintenance, repair, improvement and equipment of premises used by RWWA or its agencies.

63
ANNUAL REPORT 2012 – 2013RACING AND WAGERING WESTERN AUSTRALIA
DISCLOSURES AND LEGAL COMPLIANCE
Notes to the Financial Statements
2013 2012$000 $000
21 Notes to the Statement of Cash FlowsCash at bank earns interest at floating rates based on daily bank deposit rates. Short–term deposits are made for varying periods of between one and three months, depending upon the immediate cash requirements of RWWA, and earn interest at the respective short–term deposit rates. Reconciliation of cashCash at the end of the financial year as shown in the Statement of Cash Flows is reconciled to the related items in the Statement of Financial Position as follows:
Cash and cash equivalentsCash at bank 26,702 23,123 Cash on hand 43 51 Short–term deposits 41,000 33,000
67,745 56,174 Reconciliation of profit to net cash flows provided by/(used in) operating activities
Profit/(Loss) for the period 9,302 10,858
Non cash items:Depreciation and amortisation expense 12,498 13,086 Doubtful debts expense 68 25 Net (gain)/loss on sale of property, plant and equipment (257) (171)Write off of investment - 117
Grants and Subsidies from State Government (34,187) (36,154)
(Increase)/decrease in assets:Receivables / Accrued Income 797 (410)Current inventories (13) 24 Prepayments (2,753) (48)
Increase/(decrease) in liabilities:Trade creditors 956 (448)Other creditors 792 (643)Other liabilities (358) 102 Annual leave and long service leave provisions 331 272 Other current provisions 48 34 Net GST Receipts/Payments (75) 7 Change in GST Receivables/Payables 0 0
Net cash (used in)/provided by operating activities (12,851) (13,349)

64
ANNUAL REPORT 2012 – 2013RACING AND WAGERING WESTERN AUSTRALIA
DISCLOSURES AND LEGAL COMPLIANCE
Notes to the Financial Statements
2013 2012$000 $000
22 Financial Instruments
(a) Financial Risk Management objectives and policies
Financial Instruments held by RWWA are cash and cash equivalents, receivables, payables and agent deposits.RWWA has limited exposure to financial risks. RWWA’s overall risk management programme focuses on managing the risks identified below.
Credit RiskCredit risk arises when there is the possibility of RWWA’s receivables defaulting on their contractual obligations resulting in financial loss to RWWA. The majority of the authority’s trading with customers is conducted on a cash basis. In addition, receivable balances are monitored on an ongoing basis with the result that the RWWA’s exposure to bad debts is minimal. At the end of the reporting period there were no significant concentrations of credit risk.
The maximum exposure to credit risk at the end of the reporting period in relation to each class of recognised financial assets is the gross carrying amount of those assets inclusive of any provisions for impairment.
Liquidity RiskLiquidity risk arises when RWWA is unable to meet it’s financial obligations as they fall due. RWWA is exposed to liquidity risk through its trading in the normal course of business. RWWA has appropriate procedures to manage cash flows by monitoring forecast cashflows to ensure that sufficient funds are available to meet its commitments.
Market RiskMarket risk is the risk that changes in market prices such as foreign exchange rates and interest rates will affect RWWA’s income or the value of its holdings of financial instruments. RWWA does not trade in foreign currency and is not materially exposed to other price risks [for example, equity securities or commodity prices changes]. The Authority’s exposure to market risk for changes in interest rates relates primarily to the long–term debt obligations.
RWWA has limited exposure to foreign currency risk on purchases that are denominated in a currency other than Australian dollars.
Other than as detailed in the interest rate sensitivity analysis table, RWWA’s exposure to interest rate risk is limited because it does not have any borrowings.
(b) Categories of Financial Instruments
The carrying amounts of each of the following categories of financial assets and financial liabilities at the end of the reporting period are:
Financial AssetsCash and cash equivalents 67,745 56,174 Receivables (a) 2,017 2,883
Financial LiabilitiesPayables (a) 36,891 35,133 Agent Deposits 1,000 1,010
(a) The amount of receivables/payables excludes GST recoverable/payables to the ATO (statutory receivable/payable).

65
ANNUAL REPORT 2012 – 2013RACING AND WAGERING WESTERN AUSTRALIA
DISCLOSURES AND LEGAL COMPLIANCE
(c) Financial Instrument Disclosures
Credit Risk
The following table discloses RWWA’s maximum exposure to credit risk and the ageing analysis of financial assets.
RWWA’s maximum exposure to credit risk at the end of reporting period is the carrying amount of financial assets as shown below.
The table discloses the ageing of financial assets that are past due but not impaired and impaired financial assets. The table is based on information provided to senior management of RWWA.
RWWA does not hold any collateral as security or other credit enhancements relating to the financial assets it holds.
Ageing analysis of financial assetsPast due but not impaired
Carrying Amount
Not past due and not impaired
Up to 1 month
1–3 months
3 months to 1 year
1–5 years
More than 5 years
Impaired financial assets
$’000 $’000 $’000 $’000 $’000 $’000 $’000 $’0002013Cash and cash equivalents 67,745 67,745
Receivables (a) 2,017 1,204 - 813 - - 69,762 68,949 - 813 - - - -
2012Cash and cash equivalents 56,174 56,174
Receivables (a) 2,883 1,971 685 151 28 48 59,057 58,145 685 151 28 48 - -
(a) The amount of receivables excludes GST recoverable/payable to the ATO (statutory receivable/payable).
Liquidity Risk and Interest Rate Exposure
The following table details RWWA’s interest rate exposure and the contractual maturity analysis of financial assets and financial liabilities. The maturity analysis section includes interest and principal cash flows. The interest rate exposure section analyses only the carrying amounts of each item.
Notes to the Financial Statements

66
ANNUAL REPORT 2012 – 2013RACING AND WAGERING WESTERN AUSTRALIA
DISCLOSURES AND LEGAL COMPLIANCEIn
tere
st ra
te ex
posu
re an
d m
atur
ity an
alysis
of fi
nanc
ial as
sets
and
finan
cial li
abilit
ies
Inter
est R
ate E
xpos
ure
Matu
rity D
ates
Weig
hted
Aver
age E
ffecti
ve
Inter
est R
ate
Carry
ing
Amou
ntFix
ed
Inter
est
Rate
Varia
ble
Inter
est
Rate
Non
Inter
est
Bear
ing
Nomi
nal
Amou
ntUp
to 1
month
1-3
month
s3 m
onths
to
1 yea
r1-
5 yea
rsMo
re th
an
5 yea
rs
%$0
00$0
00$0
00$0
00$0
00$0
00$0
00$0
00$0
00$0
00
2013
Finan
cial A
ssets
Cash
and c
ash
equiv
alents
3.72%
67,74
5 41
,000
26
,702
43
67,74
5 26
,745
41,0
00
Rece
ivable
s (a)
2,01
7 2,
017
2,01
7 1,
204
813
- -
69,76
2 41
,000
26,70
2 2,
060
69,76
2 27
,949
41,81
3 -
- -
Finan
cial L
iabilit
iesPa
yable
s (a)
36,89
1 -
- 36
,891
36,89
1 36
,891
- -
- -
Agen
t dep
osits
2.75%
1,00
0 1,
000
1,00
0 -
- -
- 1,
000
37,89
1 -
1,00
0 36
,891
37,89
1 36
,891
- -
- 1,
000
2012
Finan
cial A
ssets
Cash
and c
ash
equiv
alents
4.71%
56,17
4 33
,000
23
,123
51
56,17
4 23
,174
33,0
00
Rece
ivable
s (a)
2,88
3 2,
883
2,88
3 2,
656
151
28
48
59,05
7 33
,000
23,12
3 2,
934
59,05
7 25
,830
33,15
1 28
48
-
Finan
cial L
iabilit
iesPa
yable
s (a)
35,13
3 -
- 35
,133
35,13
3 35
,133
Agen
t dep
osits
3.50%
1,01
0 -
1,01
0 -
1,01
0 -
- -
- 1,
010
36,14
3 -
1,01
0 35
,133
36,14
3 35
,133
- -
- 1,
010
(a) T
he am
ount
of re
ceiva
bles/p
ayab
les ex
clude
s GST
reco
vera
ble/pa
yable
to th
e ATO
(stat
utory
rece
ivable
/paya
ble).
The a
moun
ts dis
close
d are
the c
ontra
ctual
undis
coun
ted
cash
flows
of ea
ch cl
ass o
f fina
ncial
liabil
ities.
Inter
est r
ate se
nsitiv
ity an
alysis
The f
ollow
ing ta
ble re
pres
ents
a sum
mary
of th
e inte
rest
rate
sens
itivity
of R
WW
A’s fin
ancia
l ass
ets an
d liab
ilities
at th
e end
of th
e rep
ortin
g per
iod on
the s
urplu
s for
the p
eriod
for a
1% ch
ange
in in
teres
t rate
s. It i
s ass
umed
that
a cha
nge i
n inte
rest
rates
is he
ld co
nstan
t thro
ugho
ut the
repo
rting
perio
d.
Notes to the Financial Statements

67
ANNUAL REPORT 2012 – 2013RACING AND WAGERING WESTERN AUSTRALIA
DISCLOSURES AND LEGAL COMPLIANCE
Notes to the Financial Statements
-100 basis points +100 basis pointsCarrying amount
Surplus Equity Surplus Equity
$000 $000 $000 $000 $0002013Financial AssetsCash and cash equivalents 67,745 (677) (677) 677 677
Financial LiabilitiesAgent deposits 1,000 (10) (10) 10 10 Total Increase/(Decrease) (687) (687) 687 687
-100 basis points +100 basis pointsCarrying amount
Surplus Equity Surplus Equity
$000 $000 $000 $000 $0002012Financial AssetsCash and cash equivalents 56,174 (561) (561) 561 561
Financial LiabilitiesAgent deposits 1,010 (10) (10) 10 10 Total Increase/(Decrease) (571) (571) 571 571
Fair Values
All financial assets and liabilities recognised in the Statement of Financial Position, whether they are carried at cost or fair value, are recognised at amounts that represent a reasonable approximation of fair value unless otherwise stated in the applicable notes.
Inte
rest
rate
expo
sure
and
mat
urity
analy
sis o
f fina
ncial
asse
ts an
d fin
ancia
l liab
ilities
Inter
est R
ate E
xpos
ure
Matu
rity D
ates
Weig
hted
Aver
age E
ffecti
ve
Inter
est R
ate
Carry
ing
Amou
ntFix
ed
Inter
est
Rate
Varia
ble
Inter
est
Rate
Non
Inter
est
Bear
ing
Nomi
nal
Amou
ntUp
to 1
month
1-3
month
s3 m
onths
to
1 yea
r1-
5 yea
rsMo
re th
an
5 yea
rs
%$0
00$0
00$0
00$0
00$0
00$0
00$0
00$0
00$0
00$0
00
2013
Finan
cial A
ssets
Cash
and c
ash
equiv
alents
3.72%
67,74
5 41
,000
26
,702
43
67,74
5 26
,745
41,0
00
Rece
ivable
s (a)
2,01
7 2,
017
2,01
7 1,
204
813
- -
69,76
2 41
,000
26,70
2 2,
060
69,76
2 27
,949
41,81
3 -
- -
Finan
cial L
iabilit
iesPa
yable
s (a)
36,89
1 -
- 36
,891
36,89
1 36
,891
- -
- -
Agen
t dep
osits
2.75%
1,00
0 1,
000
1,00
0 -
- -
- 1,
000
37,89
1 -
1,00
0 36
,891
37,89
1 36
,891
- -
- 1,
000
2012
Finan
cial A
ssets
Cash
and c
ash
equiv
alents
4.71%
56,17
4 33
,000
23
,123
51
56,17
4 23
,174
33,0
00
Rece
ivable
s (a)
2,88
3 2,
883
2,88
3 2,
656
151
28
48
59,05
7 33
,000
23,12
3 2,
934
59,05
7 25
,830
33,15
1 28
48
-
Finan
cial L
iabilit
iesPa
yable
s (a)
35,13
3 -
- 35
,133
35,13
3 35
,133
Agen
t dep
osits
3.50%
1,01
0 -
1,01
0 -
1,01
0 -
- -
- 1,
010
36,14
3 -
1,01
0 35
,133
36,14
3 35
,133
- -
- 1,
010
(a) T
he am
ount
of re
ceiva
bles/p
ayab
les ex
clude
s GST
reco
vera
ble/pa
yable
to th
e ATO
(stat
utory
rece
ivable
/paya
ble).
The a
moun
ts dis
close
d are
the c
ontra
ctual
undis
coun
ted
cash
flows
of ea
ch cl
ass o
f fina
ncial
liabil
ities.
Inter
est r
ate se
nsitiv
ity an
alysis
The f
ollow
ing ta
ble re
pres
ents
a sum
mary
of th
e inte
rest
rate
sens
itivity
of R
WW
A’s fin
ancia
l ass
ets an
d liab
ilities
at th
e end
of th
e rep
ortin
g per
iod on
the s
urplu
s for
the p
eriod
for a
1% ch
ange
in in
teres
t rate
s. It i
s ass
umed
that
a cha
nge i
n inte
rest
rates
is he
ld co
nstan
t thro
ugho
ut the
repo
rting
perio
d.

68
ANNUAL REPORT 2012 – 2013RACING AND WAGERING WESTERN AUSTRALIA
DISCLOSURES AND LEGAL COMPLIANCE
Notes to the Financial Statements
2013 2012$000 $000
23 CommitmentsCommitments are inclusive of GST.
Capital CommitmentsCommitments in relation to capital expenditure contracted for at the reporting date but not recognised in the financial statements as liabilities are payable as follows:
Within one year 1,156 - Later than one year but not later than five years - - Later than five years - -
1,156 -
The capital commitments include amounts for:Customer Information Terminals and communications upgrade 1,156 - Other miscellaneous capital projects - - Property upgrades - - Motor vehicles - - Air conditioning - - Other miscellaneous capital - -
1,156 -
Lease CommitmentsCommitments in relation to leases contracted for at the reporting date but not recognised in the financial statements as liabilities are payable as follows:
Within one year 4,902 4,272 Later than one year but not later than five years 12,826 14,540 Later than five years 4,598 12,096
22,326 30,908
Representing:Cancellable operating leases - - Non–cancellable operating leases 22,326 30,908 Future finance charges on finance leases - -
22,326 30,908
The non–cancellable operating lease commitments include amounts for:Property 22,326 30,908 Computer and office equipment - -
22,326 30,908

69
ANNUAL REPORT 2012 – 2013RACING AND WAGERING WESTERN AUSTRALIA
DISCLOSURES AND LEGAL COMPLIANCE
Notes to the Financial Statements
2013 2012$000 $000
Other Expenditure CommitmentsOther expenditure commitments contracted for at the end of the reporting period but not recognised as liabilities, are payable as follows:
Within one year 10,354 10,253 Later than one year but not later than five years 16,365 26,779 Later than five years - -
26,719 37,032
24 Contingent liabilities Contract performance guarantees exist to the value of $29.7K over future rental payments on TAB Agencies.
25 Events occurring after the end of the reporting periodThere are no significant post reporting period events.
26 Remuneration of members of the Accountable Authority and senior officersRemuneration of members of the Accountable AuthorityThe number of members of the Accountable Authority, whose total of fees, salaries, superannuation, non-monetary benefits and other benefits for the financial year, fall within the following bands are:
$1 – $10,000 - 1 $10,001 – $20,000 1 2 $20,001 – $30,000 - 1 $30,001 – $40,000 6 4 $40,001 – $50,000 2 1 $60,001 – $70,000 - 1
Cash remuneration received in relation to 2013 314 312Annual leave and long service leave accruals 0 0Other Benefits 0 0The total remuneration of members of the Accountable Authority is: 314 312
The total remuneration includes the superannuation expense incurred by RWWA in respect of members of the accountable authority.No members of the Accountable Authority are members of the Pension Scheme.

70
ANNUAL REPORT 2012 – 2013RACING AND WAGERING WESTERN AUSTRALIA
DISCLOSURES AND LEGAL COMPLIANCE
Notes to the Financial Statements
2013 2012$000 $000
Remuneration of Senior OfficersThe number of senior officers, other than senior officers reported as members of the Accountable Authority, whose total fees, salaries, superannuation, non–monetary benefits and other benefits for the financial year, fall within the following bands are:
$40,001 – $50,000 1 - $60,001 – $70,000 1 - $90,001 – $100,000 - 1 $150,001 – $160,000 - 1 $170,001 – $180,000 1 2 $180,001 – $190,000 1 - $200,001 – $210,000 - 1 $210,001 – $220,000 - 1 $230,001 – $240,000 1 1 $260,001 – $270,000 1 1 $280,001 – $290,000 1 - $300,001 – $310,000 - 1 $310,001 – $320,000 1 - $330,001 – $340,000 1 - $340,001 – $350,000 - 1 $610,001 – $620,000 - 1 $620,001 – $630,000 1 -
Cash remuneration received in relation to 2013 2,498 2,689 Annual leave and long service leave accruals 6 97 Other Benefits 13 - The total remuneration of senior officers is: 2,517 2,786
Remuneration includes any fees, salaries, superannuation, leave entitlements (annual and long service leave taken and accrued) and other benefits due or receivable during the year. Due to the timing of pay runs, 2012 includes an additional week of salaries in comparison to 2013.No senior officers are members of the Pension Scheme.
27 Remuneration of AuditorRemuneration paid or payable to the Auditor General in respect of the audit for the current financial year is as follows:
Auditing the accounts, financial statements and Key performance indicators 124 119
28 Supplementary Financial InformationWrite–offs
Investment in CFM Pty Ltd Written off - 117 Fixed Assets Written off - 87 Intangible Assets Written off - 8 Bad Debts Written off 68 25
68 237

71
ANNUAL REPORT 2012 – 2013RACING AND WAGERING WESTERN AUSTRALIA
DISCLOSURES AND LEGAL COMPLIANCE
Notes to the Financial Statements
29 Schedule of Income and Expense by ServiceRacing Wagering Unallocated Total
2013 2012 2013 2012 2013 2012 2013 2012$000 $000 $000 $000 $000 $000 $000 $000
INCOMERevenueMargin - - 315,741 293,093 - - 315,741 293,093 Interest revenue - - - - 2,609 2,590 2,609 2,590 Other revenue 4,081 4,586 13,031 13,952 668 3,818 17,780 22,357 Gain on disposal of non–current assets - - - 239 257 (68) 257 171
Total Income 4,081 4,586 328,772 307,284 3,534 6,340 336,387 318,211
EXPENSESCost of sales - - 72,320 62,100 - - 72,320 62,100 Wagering Tax - - 40,417 37,616 - - 40,417 37,616 Racing Services 15,557 14,848 - - - - 15,557 14,848 Wagering Services - - 82,549 80,536 - - 82,549 80,536 Support Services - - - - 29,966 30,236 29,966 30,236 Projects (42) (108) 130 239 511 174 599 306 Grants and subsidies 451 1,673 1,748 2,393 - - 2,199 4,066 Distribution to racing and sports industries 113,662 110,139 - - 4,003 3,659 117,665 113,798
Loss on disposal of non–current assets - - - - - - - -
Total Expenses 129,628 126,552 197,164 182,884 34,480 34,069 361,272 343,507
Profit/(Loss) before Grants and Subsidies
(125,547) (121,966) 131,608 124,400 (30,946) (27,729) (24,885) (25,296)
Grants and subsidies from State Government (GST Reimbursement)
207 651 2,857 2,284 31,123 33,219 34,187 36,154
Profit/(Loss) for the period (125,340) (121,315) 134,465 126,684 177 5,490 9,302 10,858

72
ANNUAL REPORT 2012 – 2013RACING AND WAGERING WESTERN AUSTRALIA
DISCLOSURES AND LEGAL COMPLIANCE
Notes to the Financial Statements
30 Explanatory StatementThis statement provides details of any significant variations between the actual results for 2012 and 2013. Significant variations are considered to be those in excess of 10% or $2.5M.Significant variances between actual results for 2012 and 2013
Comment 2013 Actual 2012 Actual Variance$000 $000 $000
Revenue Margin (1) 315,741 293,093 22,648 Interest Revenue 2,609 2,590 19 Other Revenue (2) 17,780 22,357 (4,577)Gains Gain on disposals of non-current assets (3) 257 171 86 Expenses Cost of sales (1) 72,320 62,101 10,219 Wagering Tax (1) 40,417 37,616 2,801 Racing services 15,557 14,848 709 Wagering Services 82,549 80,536 2,013 Support Services 29,966 30,236 (270) Projects (4) 599 306 293 Grants and subsidies (5) 2,199 4,066 (1,867) Distribution to racing and sports industries (6) 117,665 113,798 3,867 Loss on disposal of non-current assets - - -
Grants and subsidies from State Government 34,187 36,154 (1,967)
Comment(1) Margin, and the associated Cost of Sales and Wagering Tax all increased against last year due in part to the new
pooling agreements and expansion into the international premium market. The disproportionate increase in Cost of sales is due to a proportional increase in the cost of product fees and also in acquiring new turnover.
(2) Other revenue has decreased from prior year due to a number of one off receipts in 2012 including a tax adjustment received from The ATO, and the sale of two ABL licences.
(3) While the increase in Gains on disposals of non-current assets is greater than 10% for 2013, the gain is not of a material nature for the year.
(4) Project costs by their nature vary year on year and for 2013 there has been a slight increase in activities that have been expensed.
(5) RWWA funded grants were lower than last year, however with the introduction of an additional funding source from Royalties for Regions ($1.2M for 2013) along with RIGP funding, total grants to industry from RWWA and Government combined is slightly higher than last year.
(6) RWWA Distribution Policy for 2012/13 allowed for an increase in funding over 2011/12.

73
ANNUAL REPORT 2012 – 2013RACING AND WAGERING WESTERN AUSTRALIA
DISCLOSURES AND LEGAL COMPLIANCE
For the Year Ended 31 July 2013We hereby certify that the key performance indicators for Racing and Wagering Western Australia (RWWA) are based on proper records, are relevant and appropriate for assisting users to assess the performance of RWWA and fairly represent the performance of RWWA for the financial year ended 31 July 2013.
Certification of Key Performance Indicators
Jefferey OvensRWWA Chairman
14 October 2013
James FreemantleDeputy Board Chairman and Chairman RWWA integrity Assurance Committee
14 October 2013

74
ANNUAL REPORT 2012 – 2013RACING AND WAGERING WESTERN AUSTRALIA
DISCLOSURES AND LEGAL COMPLIANCE
Key Performance Indicators for the year ended 31 July 2013
Outcome: To efficiently administer, and to provide effective leadership in the development, integrity and welfare of the racing and wagering industry in Western Australia
Effectiveness Indicators
Description 2013 Actual
2013 Target
2012 Actual
Result
Racing and Steward expenses per WA race meeting
The racing and stewarding functions performed by RWWA are paramount to both the development and integrity of the racing industry. In delivering these functions, RWWA ensures that the cost of delivery is keep under control, and the cost per meeting is an important indicator of how well RWWA is at controlling the cost of delivery.
$000 17.4 17.1 17.0 The targeted increase on 2011/12 was set at 0.7%, a result of constrained increases in budgeted costs and 13 additional races. The actual change on 2011/12 was 2.6%, primarily due to abandoned Thoroughbred meetings during the year.
% Change on prior year
2.60 0.73 2.37
Annual growth in TAB turnover on WA racing
The TAB accepts bets on racing and sports product from WA, the Eastern States and International Jurisdictions. The growth in TAB turnover on WA racing, is an indicator that the WA product is seen as an attractive proposition, demonstrating a quality product, with high levels of integrity.
% 2.93 7.86 Growth in TAB turnover on WA racing was higher in 2011/12 due to an additional (53rd) week in the year.
Other Key Performance Indicators
Description 2013 Actual
2013 Target
2012 Actual
Result
% of Winners Swabbed / Returned Negative
A key component in maintaining the integrity of the racing industry is an efficient and effective drug testing regime and the "% of winners swabbed / returned negative" is a key indicator of the of the drug testing regime impact on the industry.
Thoroughbreds % 99.8 99.9 The result is consistent with previous years. Harness % 99.4 99.3
Greyhounds % 99.8 100.0
Average number of starters in WA Races (excluding non-TAB Meetings)
The average number of starters in WA races is an indicator of a healthy population of animals available for racing in WA.
Thoroughbreds No.
10.4 10.8 While there was a slight drop in the average number of starters for all three codes in comparison to 2011/12, the average for all three codes remain at healthy, sustainable levels.
Harness No. 10.0 10.2 Greyhounds No. 7.7 7.8

75
ANNUAL REPORT 2012 – 2013RACING AND WAGERING WESTERN AUSTRALIA
DISCLOSURES AND LEGAL COMPLIANCE
Key Performance Indicators for the year ended 31 July 2013
Outcome: To provide an efficient, competitive and responsible betting service for Western Australia.Effectiveness Indicators
Description 2013 Actual
2013 Target
2012 Actual
Result
Number of Bets Processed
The number of bets processed is an indicator of the TAB's competitiveness in the wagering and gambling marketplace.
'000 173,761 172,753 168,077 The number of bets for 2013 is slightly better than the target result, primarily due to the positive result in the mobile channel despite an increasingly competitive environment.
Primary Betting System availability
The availability of the betting system is paramount to the TAB's ability to generate revenue. The high availability target reflects the importance RWWA places on this. A service that is reliable is necessary for the TAB's to attract and retain customers.
% 99.99 99.96 99.97 The availability of the betting system during the year is consistent with RWWA's target and prior year ratios.
Margin per employee
Margin per employee is a measure of the competitiveness of the business.
$000 869 822 Margin per employee is up on last year due to the increase in margin in 2013, with the FTE number being slightly down against target.
Profit per employee
Profit per employee, like margin per employee is a measure of the efficiency of the business in delivering wagering revenue and also providing racing and integrity services to the industry.
$000 349 349 Profit per employee is identical to last year, with the increase in operating profits before distributions offset by a slight increase in FTE.
Efficiency Indicators
Description 2013 Actual
2013 Target
2012 Actual
Result
Return on assets (Operating profit as a percentage of total assets)
Return on assets is a widely accepted indicator of the efficiency in the use of assets.
% 79.6 79.8 84.9 Return on Assets is lower than last year. While the operating profit for 2013 is 1.8% higher than the result in 2012, the net assets for 2013 is $10M higher than 2012, resulting in the decreased ROA ratio.

76
ANNUAL REPORT 2012 – 2013RACING AND WAGERING WESTERN AUSTRALIA
DISCLOSURES AND LEGAL COMPLIANCE
Key Performance Indicators for the year ended 31 July 2013
Outcome: To provide an efficient, competitive and responsible betting service for Western Australia. (Cont.)Staff (FTE) With staff employee
benefits expense being one of the largest costs categories at RWWA, managing the FTE levels is an important part of ensuring an efficient competitive business.
No. 363 366 357 The number of FTE at the end of 2012/13 is slightly below target for the year, in part due to vacancies during the year.
Outcome: To achieve optimum level of funding to the racing industry and for sports.Effectiveness Indicators
Description 2013 Actual
2013 Target
2012 Actual
Result
Distribution to Industry
RWWA's primary purpose is to provide a sustainable future for the Western Australian racing industry, achieved by maintaining the optimum level of funding to the racing industry.
$000 117,665 117,522 113,798 As per previous years, RWWA Distribution Policy for 2012/13 allowed for an increase in funding over 2011/12, with the aim of keeping distribution increases at sustainable levels.
% Change on prior year
3.4 3.3 5.8
Grants to Industry (RWWA Funded)
Grants to industry are essential to provide the safest possible racing environment and ensure the integrity of the racing product.
$000 244 170 1,022 RWWA funded grants are primarily focused on shared training resources, essential infrastructure and some top up funding for RIGP grants.
Grants to Industry (WA Government Funded)
$000 5,730 3,200 3,507 WA Government Funded Grants to industry includes the Racing Industry Grants Program (RIGP) which began in 2010/11 with a cap of $5M for the first year and $2M for the subsequent 4 years. This was supplemented with a further $6.6M of boost funding from the Royalties for Regions, with $1.2M targeted for 2012/13 and the remainder over the following 2 years. 2012/13 has seen a large portion of the funds made available to clubs with the remaining funds on target to be utilised in the coming two years.

77
ANNUAL REPORT 2012 – 2013RACING AND WAGERING WESTERN AUSTRALIA
DISCLOSURES AND LEGAL COMPLIANCE
Outcome: To achieve optimum level of funding to the racing industry and for sports. (Cont.)Other Key Performance Indicators
Description 2013 Actual
2013 Target
2012 Actual
Result
Margin Margin is an important indicator of the capacity of RWWA to fund the racing industry and sports.
$000 315,741 293,093 Margin increased against last year as a result of a 5% increase in the volume of national and international races, along with solid growth in the Fixed Odds product. Strong growth through the electronic channels also contributed to the increase.
Operating Profit excluding the profit/loss from sale of assets before distribution to codes.
Operating Profit excluding the profit/loss from sale of assets before distribution to codes highlights the amount of revenue that has been generated for distribution to the racing clubs.
$000 126,709 124,485 The increase on last year is primarily as a result of the growth in margin, with continued constraint in the growth of expenditure.
Key Performance Indicators for the year ended 31 July 2013

78
ANNUAL REPORT 2012 – 2013RACING AND WAGERING WESTERN AUSTRALIA
DISCLOSURES AND LEGAL COMPLIANCE
Pricing PoliciesRWWA has discretion over pricing for goods and services rendered.
Capital WorksIn Progress
Project Name Expected Yearof Completion
Expected Cost to Complete
Estimated Total Cost of Project
Racing Infrastructure 13/14 $195,000 $1,800,169Wagering Infrastructure 13/14 $1,149,322 $5,884,952Support Infrastructure 13/14 $3,162,618 $3,989,480
Employment and Industrial Relations
Staff ProfileAs at the end of the reporting year the number of people employed at RWWA was 494 (487 in 2012). The employee profile is expressed below as full time equivalent numbers (FTE) rather than as headcount. FTE indicates the number of hours worked and paid, divided by weekly hours of 38.0.
Employee Profile Full Time Equivalent (FTE)2013 2012
Full time 210 209
Part time 29 23
Casuals 59 63
Maximum–term contracts 62 61
TOTAL 360 356
Industrial RelationsWithin the reporting period we were able to successfully finalise two Employee Industrial Agreements. The RWWA General Staff Agreement 2012 was created to principally combine the provisions of the previous RWWA Betting Operator Agreement, which covered the casual Call Centre and Managed Agency employees, and RWWA General Staff Agreement 2009, which covered the rest of employees employed at RWWA, into one Agreement. The RWWA Racing Radio 2012 Agreement, which covers approximately 10 employees who work in our Racing Radio studio, was the second agreement approved by the employees. Both agreements had a three year term provision therefore re–negotiations will commence in the second half of 2014.
Safety, Health and Injury ManagementRWWA has recognised the need to take a lead role in guiding and supporting the racing industry in understanding and meeting its obligations in anticipation of the harmonisation of safety legislation being implemented in Western Australia in 2014.
To deliver this, RWWA has prioritised dedicated resources to undertake risk assessments, deliver training and develop and implement relevant safety management systems. This has involved the roll out of a training
Other Financial Disclosures

79
ANNUAL REPORT 2012 – 2013RACING AND WAGERING WESTERN AUSTRALIA
DISCLOSURES AND LEGAL COMPLIANCE
package for race clubs across the three codes which covered a range of aspects of safety and risk management, including legislation, contractor induction, hazard and incident reporting, communications and consultation, emergency procedures, accountabilities of volunteers, managing track work and maintaining records.
A standardised and simple to use OSH management system was also implemented at each race club to support them to comply with their legislative obligations and responsibilities around workplace health and safety. As the majority of race clubs will be starting from the beginning in terms of establishing an effective OSH management system this system was introduced to ensure that they are capable of maintaining legislative compliance whilst protecting the health and wellbeing of club staff, contractors and the public.
Additionally, the OSH Advisor worked with Project Manager (RIGP) to audit infrastructure issues and deficiencies across the race clubs such that costing could be undertaken to inform a plan for the prioritisation of allocation of RIGP funding in future years.
Governance DisclosuresContracts with Senior OfficersAt the date of reporting, other than contracts of employment or Directorship appointment, no Senior Officers (Directors and Executives) or firms of which Senior Officers are members or entities in which Senior Officers have substantial interests had any interests in existing or proposed contracts with RWWA.
However, it is noted that some Senior Officers own (in full and/or in part) racehorses and/or greyhounds which participate within Western Australia.
Insurance Premiums Paid to Indemnify Members of the BoardAn insurance policy was undertaken to indemnify members of the Board against any liability incurred under sections 13 or 14 of the Statutory Corporations (Liabilities of Directors) Act 1996. The amount of the insurance premium paid for 2013 was $17,190 and is a significant increase from the previous year. This is in the main due to the increase in the liability from $10,000,000 to $20,000,000.
RWWA’s Corporate Governance PrinciplesRWWA’s Board strongly supports the principles of Corporate Governance and is committed to maintaining the highest standards within the organisation. This is particularly important given that RWWA has to balance commercial decisions with the welfare and integrity of the racing industry within a heavily regulated environment. This is to ensure that RWWA and the racing industry remain viable and sustainable into the future.
Board Powers, Structure, Composition and MembershipThe management of the business and affairs of RWWA is under the direction of the RWWA Board.
RWWA Act 2003 gives RWWA broad powers in relation to the management of its affairs and also in the management and regulation of the Western Australian Racing Industry.
While Gaming and Wagering Commission of Western Australia regulates RWWA’s commercial wagering activities, RWWA’s Board is not subject to government direction.
Part 2, Division 2 of RWWA Act 2003 describes how the Board is to be structured, its composition and membership.
The Board comprises: ▪ One chairperson appointed by the Minister responsible for RWWA. ▪ Four members selected for their expertise in management, finance, business, commerce or information technology, one of which has knowledge of and experience in regional development.
▪ Three members representing each of the racing codes — one representative from each code.

80
ANNUAL REPORT 2012 – 2013RACING AND WAGERING WESTERN AUSTRALIA
DISCLOSURES AND LEGAL COMPLIANCE
Boardroom Conduct and RelationshipsThe roles and delegated authorities of the Board, Board Committees, Chairperson, CEO and Executive Members are clearly defined and understood within RWWA.
Key roles of the Board include: ▪ Strategy — set goals and objectives for the organisation and the racing industry and provide strategic direction and planning;
▪ Policies and Procedures — determine the organisation’s and industry’s policies and priorities; ▪ Leadership and selection — appoint the Chief Executive Officer; ▪ Monitor Performance — monitor the performance of the organisation and management in achieving its goals; ▪ Financial Performance — oversee the allocation of the organisation’s finances and resources; ▪ Risk Management — understand the major risks involved in the organisation’s operations; ▪ Relationship with the Minister, regulators and other key stakeholders — create a regular flow of information to and from the Board, public, employees, industry stakeholders to contribute to the marketing and maintenance of RWWA’s good reputation;
▪ Social Responsibility — consider the social, environmental, financial and ethical impact on RWWA’s stakeholders and the community when making decisions.
Regulatory Disclosure and Stakeholders CommunicationsA Board Member who has a notifiable interest in matters involving RWWA must conform to the following:
▪ disclose this interest to the Board; ▪ not vote on the matter; and ▪ must not be present while the matter or resolution is being considered at the meeting.
However, if the Board has passed a resolution that specifies the Board Member, the interest and the matter and the other Board Members voting for the resolution are satisfied, the interest should not disqualify the Board Member from considering or voting on the matter (Sections 18 & 19, Schedule 1, clause 8(1) of the RWWA Act 2003).
RWWA complies with the requirements of disclosure as required by RWWA Act 2003, Financial Management Act 2006 and applicable Australian Accounting Standards.
RWWA maintains regular communications with its stakeholders through: ▪ Racing Industry Consultative Groups ▪ TAB Agents Advisory Council ▪ Meetings with the Minister responsible for RWWA ▪ Communications with employees.
Governance Disclosures

81
ANNUAL REPORT 2012 – 2013RACING AND WAGERING WESTERN AUSTRALIA
DISCLOSURES AND LEGAL COMPLIANCE
Governance Disclosures
Robust Management and Compliance ProcessesRWWA has a sound system of Risk Management, Compliance and Internal Control. Risk Management, Compliance, Internal Control framework and Governance Structure have been implemented to ensure that risks are properly managed to ensure RWWA’s ongoing viability and sound reputation. RWWA is responsible for ensuring that high standards of Risk Management and Compliance are maintained. This is monitored by the Board’s Integrity Assurance Committee, Risk Management, Compliance, Internal Audit and Stewards functions operating within the organisation. RWWA is committed to complying with all legislative requirements, including but not limited to OSH (Occupational Safety and Health) and Equal Opportunity requirements.
Ethical Decision MakingRWWA considers the social, environmental, financial and ethical impact on RWWA’s stakeholders and the community when making decisions.
RWWA has developed a Responsible Wagering Policy to guide Board Members, Employees and TAB Agents in the responsible provision of Wagering Services and to ensure that RWWA provides customers with the highest standard of customer care.
Strategy, Planning and MonitoringTo fulfil RWWA’s Purpose, an annual Statement of Corporate Intent and a Strategic Development Plan (longer term plan) is developed which documents the plans, direction and vision for RWWA and the Racing Industry.
The Board monitors and evaluates the progress of implementing the Strategic and Business Plans of RWWA.
Encouraged Enhanced PerformanceRWWA undertakes performance appraisals of all employees, including the CEO and Executive Members as part of the Performance Management System. Annual Budgets and Business Plans are developed to meet the targets set in the Statement of Corporate Intent and the Strategic Development Plan and these are linked into RWWA’s Performance Management System.
SustainabilityRWWA considers sustainability as an important issue; not only for the organisation but also for the Western Australian Racing Industry. RWWA believes that sustainability concentrates on providing a sustainable future; focusing on economic, environmental and social elements. RWWA is continuing with the implementation of a sustainable culture within the organisation for its key stakeholders.
Key Initiatives include: ▪ Continuous OSH audits of all race clubs ▪ Responsible Wagering Program and Code of Conduct ▪ Equity and diversity within the workplace ▪ Ensuring the financial viability of the Western Australia Racing Industry through financial practices.
RWWA is committed to improving its sustainability practices and principles.

82
ANNUAL REPORT 2012 – 2013RACING AND WAGERING WESTERN AUSTRALIA
DISCLOSURES AND LEGAL COMPLIANCE
AdvertisingIn compliance with section 175ZE of the Electoral Act 1907, RWWA reports that it incurred the following expenditure in relation to advertising, market research, polling, direct mail and media advertising:
Total expenditure for 2012/13 was $4,332,044 and was incurred as follows:
Advertising Agencies $Rare Creative $400,687303 Lowe $1,308,866Professional Public Relations $5,500Raging Pixels $6,900Sumo Group $66,755Engage Digital – Silverpop $37,380Market Research AgenciesIPSOS $190,700Media Advertising OrganisationsHeritage FM $2,000Western Sports Media (Sport FM) $35,000FM 104.9 $1,500Radio West $8,005Media Tonic $1,500PR.Com $9,000The West Australian $6,475Optimum Media Decisions $148,553Scoop Magazine $2,160Media AgenciesAdcorp $7,746Dubsat $2,576Mitchell and Partners $2,047,680KEA Marketing $17,091Isentia Pty Ltd (Media Monitors) $25,970Total Expenditure $4,332,044
Record KeepingIn accordance with Section 61 of State Records Act 2000, RWWA provides the following information in support of compliance with the State Records Commission’s Standard 2 (Principle 6).
To maintain accurate records a schedule is in place to conduct testing of records integrity on an ongoing basis. This schedule was used during 2012/13 for checks of records held at offsite storage, on RWWA’s intra–web and on central databases. The process includes cross referencing of information recorded on the intra–web with permanent and temporary records archived both onsite and offsite.
Other Legal Requirements

83
ANNUAL REPORT 2012 – 2013RACING AND WAGERING WESTERN AUSTRALIA
DISCLOSURES AND LEGAL COMPLIANCE
Occupational Safety and HealthThe RWWA executive team are committed to providing a safe and healthy working environment for all staff, contractors and visitors to the organisation. RWWA’s aim is to promote the proactive management of workplace safety, health and wellbeing based around the setting of measurable objectives and targets for improvement. These objectives and targets are designed to control high risk activities and to improve the standard of occupational safety and health management throughout RWWA and the wider racing industry in Western Australia. RWWA’s formal mechanism for consultation currently resides in the OSH Advisory Committee which consists of key mandatory position holders as well as volunteer representatives from across the organisation.
RWWA’s processes are compliant with injury management requirements of the Workers’ Compensation and Injury Management Act 1981, including the development of return to work plans.
Insurance and Loss Time Injury Table
Measure Actual results Results against target2010/11 2012/13 TARGET Comment on result
Number of fatalities 0 0 0 Target achieved
Lost time injury and/or disease incidence rate 0.54 0 0 Target achieved
Lost time injury and/or disease severity rate 1.20 0 0 Target achieved
Percentage of injured workers returned to work:
Target achieved (i) within 13 weeks 100% NA Greater than or equal to 80% (ii) within 26 weeks NA NA
Percentage of managers trained in occupational safety, health and injury management responsibilities
11% 28% Greater than or equal to 80%
Greater focus in this area has
occurred, especially in the Racing
Integrity Division
Government Policy Requirements

14 Hasler RoadOsborne Park WA 6017T: (08) 9445 5333F: (08) 9244 5914www.rwwa.com.au