2013 Annual Report - About Schwab€¦ · · 2015-10-292013 Annual Report. At Schwab, ... has to...
134
THE CHARLES SCHWAB CORPORATION 2013 ANNUAL REPORT MKT10448-26 (3/14) 00105085 THE CHARLES SCHWAB CORPORATION 211 Main Street San Francisco, CA 94105 (415) 667-7000 Schwab.com AboutSchwab.com twitter.com/CharlesSchwab linkedin.com/company/CharlesSchwab facebook.com/CharlesSchwab youtube.com/user/CharlesSchwab 2013 Annual Report
Transcript of 2013 Annual Report - About Schwab€¦ · · 2015-10-292013 Annual Report. At Schwab, ... has to...

THE C
HA
RLE
S S
CH
WA
B C
OR
PO
RA
TION
2013 AN
NU
AL R
EPO
RT
MKT10448-26 (3/14)
00105085
THE CHARLES SCHWAB CORPORATION
211 Main Street San Francisco, CA 94105(415) 667-7000
Schwab.comAboutSchwab.com
twitter.com/CharlesSchwab linkedin.com/company/CharlesSchwabfacebook.com/CharlesSchwabyoutube.com/user/CharlesSchwab
2013 Annual Report

At Schwab, we believe in the power of investing to transform people’s lives. We see investing as an act of optimism and commitment to the future.
We share this belief with our clients — those individual investors and the people and institutions who serve them — who also believe that personal engagement, a sense of ownership, and a commitment to investing and the future can create personal freedom.
We also believe the industry too often gets in the way of investor success.
And so we approach things differently. We strive to see through the eyes of our clients and to constantly challenge the industry status quo on their behalf — serving and solving in ways that create a better investing experience.
We encourage our clients to ask the tough questions, get involved, and demand transparency and accountability from us. That engagement and sense of commitment helps us unlock the power of investing. That’s why we say, “Own your tomorrow™.”
Investing matters. Getting it right is more important than ever.

LETTER FROM THE CHIEF EXECUTIVE OFFICER 32 LETTER FROM THE CHIEF EXECUTIVE OFFICER
Some time ago, a close friend and I discussed the nature of the annual letters that CEOs write to their companies’ stockholders. He and I agreed the best approach was to craft the letter as if I were speaking with a colleague who had been away from the company for the entire year and to keep it free from spin or corporate-speak. Your response was so favorable we have kept that approach; only this year I’ve written that account as a series of direct responses to the questions we get from stockholders and analysts who cover our firm.
Can you briefly summarize how you look back at 2013?
It has been a special year for Schwab, our clients, our stockholders, and our employees. For the first time since the financial crisis hit in 2008, we began to see the economic environment improve. And along with this improvement, we helped our clients achieve better investing results, our stockholders benefitted from appreciation in our stock in excess of 80 percent, and our company earned top workplace awards in every one of our primary employment locations based on feedback from our employees.
What went right for Schwab in 2013?
There are two categories of things that went well: those that we have no control over, like environmental factors, and those that are a result of our strategy and execution.
Looking at the first category, what went right in the environment?
Any discussion of environmental factors in 2013 has to begin with the exceptional performance of the U.S. equity markets. The S&P 500® Index rose 30 percent from the end of 2012 through 2013. That not only fueled stronger returns for our clients but also helped lift our revenue in places where we are paid a fee based on a percentage of assets. You can see this help reflected in our asset management and administration fees revenue, which for calendar year 2013 was up 13 percent over the total for 2012.
Next, longer-term interest rates began to recover a bit in the second half of the year. The 10-year U.S. Treasury bond rose from a low of 1.76 percent at year end 2012 to about 3 percent by the end of 2013. That was helpful in that it widened the spread between the rate of interest we pay our clients on their short-term cash and the rate of
TOP WORKPLACE AWARDS 2013
NET INTEREST REVENUE (IN MILLIONS)
2009
$1,245
2013
$1,980
2012
$1,764
2010
$1,524
2011
$1,725
WALT BETTINGER PRESIDENT AND CHIEF EXECUTIVE OFFICER
$30.00
$20.00
$10.00
$25.00
$15.00
SCHW
$5.00
$-
1/2/09 1/2/10 1/2/11 1/2/12 1/2/13 12/31/13
STOCK PRICE5-YEAR HISTORY
A Special YearASSET MANAGEMENT AND ADMINISTRATION FEESREVENUE GROWTH
-20%
2009
20102011 2012 2013
-3%
6% 6%
13%
» 2013 Gallup Great Workplace Award for the second consecutive year
» Chicago Tribune Top Workplace Award
» Austin American-Statesman Top Workplace Award
» Denver Post Top Workplaces
» Indianapolis Star Top Workplaces
» Cleveland Plain Dealer Top Workplaces
» Bay Area News Group (San Francisco) Top Workplaces
» 2013 CareerBuilder Best Companies to Work for in Arizona
» Florida Trend magazine Best Companies to Work for in the State of Florida
» Military Times Edge magazine Best for Vets 2013: Employers for the fourth consecutive year
» U.S. Veterans Magazine Best of the Best 2013 Top Veteran-Friendly Companies for the second consecutive year
» Top 100 Military Friendly Employers® by Victory Media, publisher of G.I. Jobs and Military Spouse
» Best Place to Work 2013 for Lesbian, Gay, Bisexual, and Transgender Equality based on a 100 percent rating from the Human Rights Campaign’s Corporate Equality Index for the ninth consecutive year
“It has been a special year for Schwab, our clients, our stockholders, and our employees.”

LETTER FROM THE CHIEF EXECUTIVE OFFICER 54 LETTER FROM THE CHIEF EXECUTIVE OFFICER
interest we can earn by investing that cash on a slightly longer term. You can see this reflected in our net interest revenue, which in 2013 was up 12 percent over 2012. That said, long-term interest rates remained at historically low levels. And our net interest revenue is far more sensitive to short-term rates, which actually worsened slightly during the year. So while the environmental headwinds lessened a bit in 2013, they did not disappear.
Because your revenue is so impacted by environmental factors, can you just sit back and count on a rising stock market or higher interest rates to grow your revenue?
Not at all. Over time, environmental factors — whether they are positive or negative for us — tend to even out. Real long-term growth comes from winning in the marketplace. In other words, growth comes from developing and executing strategies that enable us to gain market share from our competitors, and we gain share by convincing investors and savers that Schwab is the best place for them to put their hard-earned money to work.
The core of our strategy is based on three simple words: Through Clients’ Eyes. That simple phrase means that whenever we are faced with business decisions or judgment calls at Schwab, we ask ourselves, “Which answer will encourage clients to
choose to do more business with us and to refer Schwab to their friends and family?” It means taking a long-term approach and sometimes walking away from short-term revenue opportunities as we did, for example, when we introduced Schwab ETFs with commission-free trading on schwab.com in 2009. It means striving to put clients’ interests at the forefront of our company as we did in 2013 with the introduction of our Schwab Accountability Guarantee™. It’s sort of like the Golden Rule. Some people may see that as an outdated or naïve approach to business, but it was Chuck’s vision when he founded our firm more than 40 years ago, and it’s how we continue to operate today.
Does this long-term, client-centric approach help Schwab gain market share, grow, and reward stockholders?
Yes, it does. Here are three proof points to support our belief that doing right by our clients is the right strategy for long-term growth.
In 2013, our clients added more than $140 billion in core net new assets to their accounts at Schwab, which fueled overall client asset growth that far outpaced the results of our publicly traded competitors. Our clients — whether individual investors, registered investment advisors, or companies that sponsor retirement and other
workplace plans — voted day after day to entrust Schwab with more and more of their wallets. These dollars, when added to the market appreciation from last year, meant we ended 2013 with a record $2.25 trillion of client assets held at Schwab. As client assets at Schwab grow, our revenue opportunity will grow also. It’s a virtuous cycle.
Another proof point from 2013 is the rapid growth in assets that our clients have asked Schwab to manage. The Schwab of today is a far cry from the original discount brokerage firm that was built exclusively for stock investors who wanted to trade on their own. Although we still offer world-class and award-winning services for independent investors, we also offer professional money management services for those who want either to share in the responsibility of making
investment decisions, or to turn them over entirely to Schwab or one of the thousands of independent investment advisors we serve.
During the 2013 calendar year, our individual investor clients added $5.6 billion in net new assets into Schwab managed programs, and total managed assets in these programs reached $155.1 billion by year end. Assets held at Schwab by the clients of investment advisors reached nearly $1.0 trillion by the end of 2013. Remarkably, this means that almost half of all the client assets at Schwab are receiving some form of ongoing advisory service. That’s hardly the Schwab discount brokerage of yesteryear!
And last, but maybe most important for our long-term growth, is our progress around what we refer to as Client Promoter Scores. The concept of a Promoter Score is pretty straightforward. Every day, we ask thousands of clients to rate us on a 0-10 scale based on how likely they are to refer Schwab to others within their circle of influence. Those who score us a nine or 10, we consider “promoters.” Those who give us a seven or eight, we consider “passive,” and those who score us six or below, we consider “detractors.” We total up the detractors and subtract them from the promoters. The net difference yields our Client Promoter Score. As you can tell, this is a lot tougher scale than simply asking people if they are satisfied. More importantly, we use feedback we get from all of these clients to enhance our products and services, which drives further client loyalty and improved Client Promoter Scores. By the way, we also try to contact the vast majority of clients who score us six or below to find out what we can do to change their opinion of Schwab.
Across our two largest business lines, we ended 2013 with outstanding Client Promoter Scores. Now you might ask why we care? Well, research by
TOTAL CLIENT ASSETS(IN BILLIONS AT YEAR END)
2013
$2,249
2012
$1,952
2011
$1,678
2009
$1,423
2010
$1,575
ASSETS UNDER AN ADVISORY RELATIONSHIP(IN BILLIONS AT YEAR END)
2009
$686
2013
$1,101
2012
$915
2010
$761
2011
$789
A DECADE OF CLIENT-FOCUSED INNOVATION
2002Schwab Equity Ratings®
2003Charles Schwab Bank
2009Commission-free ETFs
2005Schwab Bank Investor Checking — fully integrated with Schwab One® brokerage account
2011Schwab Independent Branch Services
2013Schwab ETF OneSource™
2004Lower and simplified pricing
2006Schwab Managed Portfolios™ 2010
$8.95 online equity trades
2012Schwab Index Advantage® 2013
Schwab Accountability Guarantee™
CLIENT PROMOTER SCORES2013
INVESTOR SERVICES ADVISOR SERVICES
5847

LETTER FROM THE CHIEF EXECUTIVE OFFICER 76 LETTER FROM THE CHIEF EXECUTIVE OFFICER
Fred Reichheld and Bain & Company, who together pioneered the concept of promoter scoring, shows that high Promoter Scores can be an effective predictor of future growth for a company. And it makes sense: If your clients feel so strongly about the service you provide that they want to refer you to others, your firm is likely to continue growing.
What are some of the things that didn’t go so well in 2013?
Just as in the area of things that went well, there are two categories here: those things that didn’t go so well that we have no control over, and those things that didn’t go so well that we need to look in the mirror and address.
While the increase in long-term interest rates in 2013 helped us, the Federal Reserve’s overall policies governing interest rates were the dominant environmental factor outside of our control that hurt our financial results. With the Fed Funds target interest rate set at near zero, we continued to waive money market fund fees — $674 million in 2013. We did so to ensure that our clients invested in Schwab managed money market funds would not experience negative returns.
These waived fees come, dollar-for-dollar, off our top-line revenue and, arguably, our bottom-line pre-tax profits. And while the Fed started to loosen up longer-term interest rates by moving toward a reduction in its program of buying $85 billion of fixed income securities every month, those long-term rates still remained at historical lows. As a
result, the spread that we could earn between what we pay clients on their idle cash and what we can invest it at was constrained. It did improve but was still quite a bit less than what we expect to earn in a more historically normal interest rate environment. In fact, we believe the positive revenue impact of a more normal interest rate environment will be measured in billions of dollars per year.
Also outside of our control in 2013, despite the outstanding year for the U.S. stock markets, was the unexpectedly low level of our clients’ stock trading. As a result, our trading revenue did not perform as well as we had expected. Although we saw some revenue growth in trading, our expectations were for higher levels of trading based on historical averages for years following a presidential election. Frankly, our projections proved to be too optimistic.
Can you discuss some of the areas that didn’t go as well in 2013 that were not a result of the environment?
At Schwab, we put a high value on humility, and we are much harder on ourselves than others might be. We set high standards for serving our clients, rewarding our stockholders with consistent and strong financial performance, and meeting the expectations of our regulators with our risk management capabilities. And sometimes we fall short. Two areas where we didn’t meet our standards in 2013 stand out to me.
First, we fell short of our goals for client access to our systems last spring. We had instances where our clients could not access our website or other electronic systems due to malicious actions by third parties. Although one could argue that this issue has affected most major financial institutions in the United States and revolves around global challenges that are beyond our control, we don’t accept that answer. We have to do better, and we will strive to be better. Every year we invest hundreds of millions of dollars in maintaining and upgrading our technology in an effort to ensure that it is available whenever and however our clients want to access Schwab. Subsequent to the downtime issues we faced in early 2013, we have invested millions more dollars in an effort to prevent the same situation from recurring. Can I assure our
clients that it will never happen again? No, I cannot. Can I assure them that all of us at Schwab, and the technology firms we work with, are working hard to avoid the situation happening again? Yes.
The second area I would highlight is related to the challenges around the overall regulatory environment. Schwab and our subsidiaries are regulated by a number of governmental entities including the Federal Reserve, the Office of the Comptroller of the Currency, and the Securities and Exchange Commission. Some of our subsidiaries are also regulated by self-regulatory organizations like the Financial Industry Regulatory Authority. Our regulators have important jobs to do, and we have deep respect for their professionalism and efforts. We have a strong culture of compliance, and compliance is inherent in most everything we do. We spend tens of millions of dollars and thousands upon thousands of hours of staff time every year in an effort to comply with the myriad rules and regulations applicable to our business. Despite these efforts, we still incur regulatory fines. While the amount of regulatory fines we incurred in 2013 was not material, and almost all of it was from a recently acquired subsidiary, I am still disappointed that we were subject to any fines at all. While I know that it is unrealistic to ever expect this amount to be zero, I will always be disappointed if it isn’t. We take our compliance obligations seriously, and as the regulatory environment continues to increase in complexity, our people will continue to strive to do great work on behalf of our clients while meeting our regulatory responsibilities.
What stands out to you as particularly innovative actions you undertook in 2013?
Last year was a huge year for innovation at Schwab. But at Schwab, we strive to innovate not just for the sake of it, but for the benefit of our clients. Advancements that come to mind from 2013 are:
» The launch of ETF OneSource™, offering Schwab clients commission-free, online access to 119 ETFs from Schwab and five other providers;
» The introduction of the Schwab Accountability Guarantee™, which offers a refund of program fees paid by clients if, for any
reason, they are not happy with one of our participating investment advisory services;
» Additions to our lineup of low-cost Schwab-managed ETFs while our clients’ balances in those ETFs nearly doubled to $16.9 billion;
» The growing reach of our brand through expansion of our independent branch model, ending the year with 24 independent branches with strong momentum in leads and assets;
» The introduction of the Schwab Advisor Center® app for Android™ devices to better serve our independent investment advisor clients;
» The launch of the Schwab Retirement Income Variable Annuity® to help people at or near retirement;
» The introduction of the ThomasPartners® dividend equity investment strategy to our clients;
» Continued integration of optionsXpress into Schwab and expansion of its capabilities;
» Growth of our groundbreaking Schwab Index Advantage® 401(k) plan and preparation for the launch of our full-service 401(k) program that offers ETFs with real-time pricing and investing, the first major firm to do so;
» The introduction of Schwab OpenView MarketSquare™, a review site that compiles feedback and ratings from independent RIAs on some of the leading technology vendors and products in the industry, and our online advisor directory to help individuals find an advisor who meets their needs;
» The launch of our new brand and advertising campaign — Own your tomorrow™;
» Delivery of more than 100,000 financial plans for our clients, up 84 percent from 2012.
When you look to the future, what do you see for Schwab and its stockholders?
I see a bright future for all our constituencies: our clients, our stockholders, and our employees.
The multiyear strategy we began in 2009 to rebuild investments in our client capabilities is paying off. We are building trust with our clients and
MONEY MARKET FUND FEE WAIVERS(IN MILLIONS)
2009
$224
2013
$674
2012
$587
2010
$433
2011
$568

LETTER FROM THE CHIEF FINANCIAL OFFICER 98 LETTER FROM THE CHIEF EXECUTIVE OFFICER
Finally, in 2013, our financial story began to get simple again in a way it hasn’t been since the financial crisis. Client assets grew by 15 percent, and we turned that into 11 percent revenue growth and delivered a 31.4 percent pre-tax profit margin, leading to a 15 percent increase in net income. No need to dig past the environmental drag on our revenues in order to see our growing earnings power. No need to parse our spending decisions — as we invested to drive long-term growth and stockholder value — in order to grade our near-term performance. Just solid business growth, solid revenue growth through diversified sources, and continued expense discipline leading to improved financial performance. How did our financial results suddenly get back on track?
Importantly, we’ve been on track in terms of strategy and execution for a long time. Our evolving full-service investing model and success with clients enabled us to grow total client assets at Schwab by $815 billion, or 72 percent, in just four years, from 2009 through 2012. The challenge for us during that period was an operating environment that included a fragile economic recovery and a series of declines in interest rates that hobbled our main sources of
income. Despite our progress in growing the client franchise, our highest annual revenue total during those four years was still more than $250 million below the $5.2 billion we generated in 2008.
Our financial story for 2009 through 2012 included a focus on making smart trade-offs between the investments necessary to drive long-term growth and stockholder value, and the level of near-term profitability appropriate for maintaining a healthy
JOE MARTINETTO EXECUTIVE VICE PRESIDENT AND CHIEF FINANCIAL OFFICER
Simply, Growth
“The simple story remains the right one for Schwab
— solid business growth, solid revenue growth through diversified sources, and continued expense discipline.”
are winning in the marketplace by gaining share from our competitors. We operate the company with exceptional scale and efficiency. And we are well positioned to benefit from the likely increase in interest rates over the coming years.
Many of the strong headwinds that have impacted our earnings over the last few years are slowly dissolving. Although we are not yet experiencing the tailwinds that will come from higher short-term interest rates, we have proven with our 2013 financial results that we can deliver for stockholders long before tailwinds gather.
No publicly traded competitor has generated client asset growth at the dollar level that Schwab has. And as a result, our market share has continued to grow, and the resulting scale benefits that help separate us from other firms has widened and widened.
Going forward, our strategies remain consistent. We will challenge the traditional investing services model to create a better way to serve investors and their advisors and to earn their trust. Our clients count on us to champion their financial goals. We will speak up on their behalf, striving to change what needs to be changed and to reinvent what no longer works. As I said a year ago, Schwab has never been about the status quo and never will be.
It’s a bright day for Schwab, our clients, our stockholders, and our employees … and I truly believe the best is yet to come!
Thank you for your confidence.
Warmly,
WALT BETTINGER March 7, 2014
NET REVENUES(IN MILLIONS)
2013201220112009 2010
$4,883$4,691
$4,193 $4,248
$5,435
EXPENSES AS A PERCENTAGE OF AVERAGE CLIENT ASSETS2013
Morgan Stanley1
Bank of America2
0.64%
Schwab
0.18%
Ameritrade
0.33%
0.58%
E-Trade Financial
0.55%
1. Morgan Stanley Global Wealth Management2. Bank of America Global Wealth Management

Our only debt issuance in 2013 was $275 million of five-year notes with a 2.20 percent coupon, which completed a complex set of actions begun in 2012 to restructure outstanding long-term debt at lower rates. Otherwise, even though retained earnings remained constrained given the still-tough environment in 2013, our pace of capital formation exceeded the amount needed to fuel the growth of the business, and we began to expand the cushion in our capital ratios above internal target levels. We’d expect the pace of capital formation to pick up further relative to our balance sheet growth in 2014, and the company continues to have the resources and flexibility to pursue profitable growth in all environments.
Can we keep it simple again in 2014? We think so. With the economy continuing to recover, the Fed has at least “begun the process of beginning” to throttle back its monetary easing, and while the short end of the yield curve hasn’t budged, long-term rates have started to regain some ground. Assuming the environment doesn’t back up on us yet again, we believe we can translate stable interest rates, long-term average equity market returns, and trading activity that grows in line with our client base into revenue growth in the high single digits. With our investments to drive long-term growth already filled out and a cap on overall headcount at current levels, we expect to limit overall expense growth in 2014 and achieve a pre-tax profit margin of around
34 percent. That improved performance for stockholders should result in employee bonus funding at or above target for the first time since 2008. We know the simple story remains the right one for Schwab — solid business growth, solid revenue growth through diversified sources, and continued expense discipline leading to improved financial performance.
As I close, I want to recognize the critical role your patience and support as owners has played in our ability to stay focused on managing the company for long-term client and stockholder value through the financial crisis and its aftermath. As stewards of your capital, we remain committed to continue building that value over the long run, and to do so in a transparent and clearly communicated manner. We intend to earn your ongoing support as we pursue the opportunities ahead.
JOE MARTINETTO March 7, 2014
balance sheet. In hindsight, we believe we made the right choices — we partially offset the hit to our revenues with aggressive spending cuts, and then began to rebuild our investments for growth to levels more consistent with the opportunities we saw as revenues improved. As a result, there was no practical difference between our 2009 and 2012 pre-tax profit margins and earnings per share of approximately 30 percent and $0.68 - $0.69, respectively. Solid performance under the circumstances, but as I said a year ago, more or less sideways. This is a growth company. We do not aspire to sideways.
In my seven years as CFO of Schwab, I’ve probably uttered some version of the company’s basic operating model, or formula, a thousand times. It really is pretty simple — client growth turns into earnings growth as long as economic drivers are stable to improving. As we came into 2013, we were encouraged by signs of sustained economic recovery. We planned for a year of solid business growth, with stable interest rates, modest equity market gains, and a recovery in trading activity driving year-over-year improvement in all three major sources of revenue and overall revenue growth at or near a double-digit percentage. That revenue growth would support the process of rebuilding our investments to drive long-term growth to more sustainable levels while still allowing us to show a modest degree of financial leverage, thereby delivering an improved profit margin and earnings growth at the same time. In short, we saw 2013 as the year when the environment might stop covering up what the operating model produced.
As we all know now, it was.
We met or exceeded each of our financial expectations for the year. Revenue grew 11 percent as I noted above; expense growth was just over 2 percentage points slower than the rise in revenue; our pre-tax profit margin was 170 basis points higher than 2012; and our earnings per share rose by 13 percent to $0.78, our biggest increase since 2008.
Our path to that destination, though, was somewhat different than planned. The economic recovery persisted and interest rates did generally stabilize, even beginning to recover a bit on the long end of the yield curve while certain short-term rates actually got a bit worse for us. Client trading activity did improve from 2012 levels, just not nearly as much as we originally thought, and the equity markets rose
significantly beyond the average mid-single-digit type returns we assumed. All told, net interest revenue and asset management fees were well above expectations even as trading revenue and money market fund fees were well below; the final tally included increases in asset management and administration fees, net interest revenue, and trading revenue of 13, 12, and 5 percent, respectively. On the expense side, we offset higher incentive compensation expense with adjustments to our planned investments for growth, recognizing that we could grow those outlays more slowly given the levels they had reached. Still, we increased project spending by 6 percent and advertising and market development expense by 7 percent in 2013, to a total of approximately $430 million. This is why I emphasize our diversified revenue streams and disciplined but flexible expense management — they give us the power to adapt, to make the most of what the environment throws at us while driving the business forward.
Balance sheet management was also relatively simple for us in 2013. We’ve been working for years on a strategy to migrate idle client cash — also referred to as “sweep cash” given our practice of automatically sweeping cash balances to an interest-bearing feature each day — to the most appropriate venue at Schwab based on the client’s relationship with the company. Sweep cash is housed on the balance sheet as Schwab One® brokerage balances and Schwab Bank deposits; it’s also housed off-balance sheet in certain money market funds. Most of that migration work was completed before 2013. We moved just under $3 billion from the money funds, as well as $3.7 billion from Schwab One®, to the Bank last year, and for the first time since the Bank’s inception in 2003, we are essentially fully executed against our cash strategy. We’d expect to perform modest migrations from time to time going forward, including 2014, to reflect clients’ updated account status.
LETTER FROM THE CHIEF FINANCIAL OFFICER 11
PRE-TAX PROFIT MARGIN
2012
29.7%
2011
29.7%
2009
30.4%
2013
31.4%
2010
18.3%
10 LETTER FROM THE CHIEF FINANCIAL OFFICER

12 FINANCIAL HIGHLIGHTS GROWTH IN CLIENT ASSETS AND ACCOUNTS 13
(In Billions, at Year End, Except as Noted) 2009-13 2012-13 2013 2012 2011 2010 2009
Assets in client accountsSchwab One®, other cash equivalents
and deposits from banking clients 18% 7% $ 127.3 $ 119.0 $ 96.4 $ 81.1 $ 65.1
Proprietary funds (Schwab Funds®
and Laudus Funds®):
Money market funds (1%) — 167.7 167.9 159.8 154.5 171.2
Equity and bond funds 14% 44% 71.2 49.6 38.2 46.0 41.6
Total proprietary funds 3% 10% 238.9 217.5 198.0 200.5 212.8
Mutual Fund Marketplace® (1):
Mutual Fund OneSource® (2) 10% 17% 260.5 223.2 198.6 208.6 175.0
Mutual fund clearing services 16% (7%) 147.4 159.1 104.2 42.1 81.8
Other third-party mutual funds 13% 12% 404.1 360.1 305.9 291.8 243.8
Total Mutual Fund Marketplace 13% 9% 812.0 742.4 608.7 542.5 500.6
Total mutual fund assets 10% 9% 1,050.9 959.9 806.7 743.0 713.4
Equity and other securities(1) 17% 29% 906.3 702.4 607.9 589.4 485.0
Fixed income securities 2% (2%) 177.5 181.8 176.9 171.3 167.0
Margin loans outstanding 12% 10% (12.6) (11.5) (10.2) (10.3) (7.9)
Total client assets 12% 15% $ 2,249.4 $ 1,951.6 $ 1,677.7 $ 1,574.5 $ 1,422.6
Client assets by business(3)
Investor Services 13% 12% $ 1,241.5 $ 1,112.1 $ 955.3 $ 825.1 $ 752.8
Advisor Services 11% 20% 1,007.9 839.5 722.4 749.4 669.8
Total client assets 12% 15% $ 2,249.4 $ 1,951.6 $ 1,677.7 $ 1,574.5 $ 1,422.6
Net growth in assets in client accounts (for the year ended)
Net new assets by business(3)
Investor Services (4, 5) N/M N/M $ (18.2) $ 79.7 $ 97.4 $ (25.6) $ 40.3
Advisor Services (6) 6% — 59.8 60.0 48.5 52.2 47.0
Total net new assets (17%) (70%) $ 41.6 $ 139.7 $ 145.9 $ 26.6 $ 87.3
Net market gains ( losses) 7% 91% 256.2 134.2 (42.7) 125.3 198.3
Net growth 1% 9% $ 297.8 $ 273.9 $ 103.2 $ 151.9 $ 285.6
New brokerage accounts (7)
( in thousands, for the year ended) 5% 7% 960 900 1,138 829 787
Clients ( in thousands)
Active Brokerage Accounts (8) 4% 3% 9,093 8,787 8,552 7,998 7,701
Banking Accounts (9) 13% 6% 916 865 780 690 567
Corporate Retirement
Plan Participants (4) (3%) (17%) 1,305 1,571 1,492 1,477 1,465
GROWTH RATES
ANNUAL1-YEAR
COMPOUNDED4-YEAR
(2)
GROWTH IN CLIENT ASSETS AND ACCOUNTS
(In Millions, Except Per Share Amounts and as Noted) 2012-13 2013 2012 2011Net revenues 11% $ 5,435 $ 4,883 $ 4,691
Expenses excluding interest 9% $ 3,730 $ 3,433 $ 3,299
Net income available to common stockholders 14% $ 1,010 $ 883 $ 864
Basic earnings per common share 13% $ .78 $ .69 $ .70
Diluted earnings per common share 13% $ .78 $ .69 $ .70
Dividends declared per common share — $ .24 $ .24 $ .24
Weighted-average common shares
outstanding — diluted 1% 1,293 1,275 1,229
Closing market price per share (at year end) 81% $ 26.00 $ 14.36 $ 11.26
Book value per common share (at year end) 7% $ 7.33 $ 6.83 $ 6.07
Net revenue growth 11% 4% 10%
Pre-tax profit margin 31.4% 29.7% 29.7%
Return on average common stockholders’ equity 11% 11% 12%
Full-time equivalent employees
( in thousands, at year end) — 13.8 13.8 14.1
Net revenues per average
full-time equivalent employee ( in thousands) 10% $ 391 $ 354 $ 350
GROWTH RATE1-YEAR
FINANCIAL HIGHLIGHTS
(1) Excludes all proprietary money market, equity, and bond funds. (2) Certain client assets at December 31, 2009, have been reclassified from Mutual Fund OneSource® to other third-party mutual funds.(3) In 2013, the Company realigned its reportable segments as a result of organizational changes. The segment formerly reported as Institutional Services was
renamed to Advisor Services. Additionally, the Retirement Plan Services and Corporate Brokerage Services business units are now part of the Investor Services segment. Prior period segment information has been recast to reflect these changes.
(4) In 2013, the Company reduced its reported totals for overall client assets and retirement plan participants by $24.7 billion and 317,000, respectively, to reflect the estimated impact of the consolidation of its retirement plan recordkeeping platforms and subsequent resignation from certain retirement plan clients.
(5) 2013 includes outflows of $74.5 billion relating to the planned transfer of a mutual fund clearing services client and $2.1 billion from another mutual fund clearing services client. 2013 also includes inflows of $35.8 billion from certain mutual fund clearing services clients. 2012 includes inflows of $33.1 billion from certain mutual fund clearing services clients. 2012 also includes outflows of approximately $100 million from the sale of Open E Cry, LLC, and $900 million relating to a planned transfer from Corporate Brokerage Services. 2011 includes inflows of $56.1 billion from a mutual fund clearing services client and $7.5 billion from the acquisition of optionsXpress Holdings, Inc. 2010 includes outflows of $51.5 billion relating to the planned deconversion of a mutual fund clearing services client, and inflows of $500 million from the acquisition of Windhaven Investment Management, Inc., and $1.2 billion from a mutual fund clearing services client.
(6) 2012 includes inflows of approximately $900 million from the acquisition of ThomasPartners, Inc., and outflows of $1.2 billion from the closure of brokersXpress LLC. 2010 includes inflows of $1.5 billion from the acquisition of Windhaven Investment Management, Inc.
(7) 2011 includes 315,000 new brokerage accounts from the acquisition of optionsXpress Holdings, Inc.(8) In 2012, the Company removed approximately 30,000 brokerage accounts due to escheatment and other factors and reduced accounts by 19,000 from the
sale of Open E Cry, LLC, and the closure of brokersXpress LLC.(9) Effective 2010, the number of banking accounts excludes credit cards. 2009 has been recast to reflect this change.
N/M — Not Meaningful

14 EXECUTIVE MANAGEMENT
CHARLES R. SCHWABChairman of the Board
WALTER W. BETTINGER IIPresident and Chief Executive Officer
JAY L. ALLENExecutive Vice President, HumanResources and Employee Services
STEVEN H. ANDERSONExecutive Vice President,Retirement Plan Services
RON CARTERExecutive Vice President,Operational Services
MARIE A. CHANDOHAPresident and Chief ExecutiveOfficer, Charles Schwab InvestmentManagement, Inc.
BERNARD J. CLARKExecutive Vice President,Advisor Services
JOHN S. CLENDENINGExecutive Vice President,Investor Services
JONATHAN M. CRAIGExecutive Vice President andChief Marketing Officer
CARRIE E. DWYERExecutive Vice President, GeneralCounsel and Corporate Secretary
G. ANDREW GILLExecutive Vice President,Investor Services
LISA KIDD HUNTExecutive Vice President,International Services andSpecial Business Development
JOSEPH R. MARTINETTOExecutive Vice President andChief Financial Officer
JAMES D. McCOOLExecutive Vice President,Client Solutions
JIM McGUIREExecutive Vice President andChief Information Officer
NIGEL J. MURTAGHExecutive Vice President,Corporate Risk
LEONA TANGExecutive Vice President,Internal Audit
PAUL V. WOOLWAYExecutive Vice President andPresident, Charles Schwab Bank

UNITED STATES SECURITIES AND EXCHANGE COMMISSION
Washington, D.C. 20549
FORM 10-K
ANNUAL REPORT PURSUANT TO SECTION 13 OR 15(d) OF THE SECURITIES EXCHANGE ACT OF 1934
For the fiscal year ended December 31, 2013 Commission file number 1-9700
THE CHARLES SCHWAB CORPORATION (Exact name of registrant as specified in its charter)
Delaware
(State or other jurisdiction of incorporation or organization)
94-3025021 (I.R.S. Employer Identification No.)
211 Main Street, San Francisco, CA 94105 (Address of principal executive offices and zip code)
Registrant’s telephone number, including area code: (415) 667-7000
Securities registered pursuant to Section 12(b) of the Act:
Title of each class Name of each exchange on which registered Common Stock - $.01 par value per share New York Stock Exchange Depository Shares, each representing a 1/40th ownership interest
in a share of 6.0% Non-Cumulative Preferred Stock, Series B
New York Stock Exchange
Securities registered pursuant to Section 12(g) of the Act: None
Indicate by check mark if the registrant is a well-known seasoned issuer, as defined in Rule 405 of the Securities Act. Yes ⌧ No
Indicate by check mark if the registrant is not required to file reports pursuant to Section 13 or Section 15(d) of the Exchange Act. Yes No ⌧
Indicate by check mark whether the registrant (1) has filed all reports required to be filed by Section 13 or 15(d) of the Securities Exchange Act of 1934
during the preceding 12 months (or for such shorter period that the registrant was required to file such reports), and (2) has been subject to such filing
requirements for the past 90 days. Yes ⌧ No
Indicate by check mark whether the registrant has submitted electronically and posted on its corporate Website, if any, every Interactive Data File required to
be submitted and posted pursuant to Rule 405 of Regulation S-T during the preceding 12 months (or for such shorter period that the registrant was required
to submit and post such files). Yes ⌧ No
Indicate by check mark if disclosure of delinquent filers pursuant to Item 405 of Regulation S-K is not contained herein, and will not be contained, to the
best of registrant’s knowledge, in definitive proxy or information statements incorporated by reference in Part III of this Form 10-K or any amendment to
this Form 10-K. ⌧
Indicate by check mark whether the registrant is a large accelerated filer, an accelerated filer, a non-accelerated filer, or a smaller reporting company. See the
definitions of “large accelerated filer,” “accelerated filer” and “smaller reporting company” in Rule 12b-2 of the Exchange Act.
Large accelerated filer ⌧ Accelerated filer
Non-accelerated filer (Do not check if a smaller reporting company) Smaller reporting company
Indicate by check mark whether the registrant is a shell company (as defined in Rule 12b-2 of the Exchange Act). Yes No ⌧
As of June 30, 2013, the aggregate market value of the voting stock held by non-affiliates of the registrant was $23.7 billion. For purposes of this information,
the outstanding shares of Common Stock owned by directors and executive officers of the registrant, and certain investment companies managed by Charles
Schwab Investment Management, Inc. were deemed to be shares of the voting stock held by affiliates.
The number of shares of Common Stock outstanding as of January 31, 2014, was 1,298,566,869.
DOCUMENTS INCORPORATED BY REFERENCE
Part III of this Form 10-K incorporates certain information contained in the registrant’s definitive proxy statement for its annual meeting of stockholders, to be held May 15, 2014, by reference to that document.

THE CHARLES SCHWAB CORPORATION
Annual Report On Form 10-K For Fiscal Year Ended December 31, 2013
TABLE OF CONTENTS
Part I Item 1. Business 1 General Corporate Overview 1 Business Acquisitions 1 Business Strategy and Competitive Environment 2 Products and Services 2 Regulation 5 Sources of Net Revenues 6 Available Information 6 Item 1A. Risk Factors 7 Item 1B. Unresolved Securities and Exchange Commission Staff Comments 13 Item 2. Properties 14 Item 3. Legal Proceedings 14 Part II Item 4. Mine Safety Disclosures 15 Item 5. Market for Registrant’s Common Equity, Related Stockholder Matters and Issuer
Purchases of Equity Securities 15 Item 6. Selected Financial Data 17 Item 7. Management’s Discussion and Analysis of Financial Condition and Results of Operations 18 Overview 18 Current Market and Regulatory Environment and Other Developments 20 Results of Operations 22 Liquidity and Capital Resources 30 Risk Management 37 Fair Value of Financial Instruments 44 Critical Accounting Estimates 44 Forward-Looking Statements 46 Item 7A. Quantitative and Qualitative Disclosures About Market Risk 48 Item 8. Financial Statements and Supplementary Data 50 Item 9. Changes in and Disagreements With Accountants on Accounting and Financial Disclosure 97 Item 9A. Controls and Procedures 97 Item 9B. Other Information 97 Part III Item 10. Directors, Executive Officers, and Corporate Governance 97 Item 11. Executive Compensation 99 Item 12. Security Ownership of Certain Beneficial Owners and Management and Related Stockholder Matters 99 Item 13. Certain Relationships and Related Transactions, and Director Independence 99 Item 14. Principal Accountant Fees and Services 99 Part IV Item 15. Exhibits and Financial Statement Schedule 100 Exhibit Index 100 Signatures 105 Index to Financial Statement Schedule F-1

THE CHARLES SCHWAB CORPORATION
- 1 -
PART I Item 1. Business
General Corporate Overview The Charles Schwab Corporation (CSC), headquartered in San Francisco, California, was incorporated in 1986 and engages, through its subsidiaries (together referred to as the Company, and located in San Francisco except as indicated), in securities brokerage, banking, money management, and financial advisory services. At December 31, 2013, the Company had $2.25 trillion in client assets, 9.1 million active brokerage accounts(a), 1.3 million corporate retirement plan participants, and 916,000 banking accounts. Significant business subsidiaries of CSC include:
Charles Schwab & Co., Inc. (Schwab), which was incorporated in 1971, is a securities broker-dealer with over 300 domestic branch offices in 45 states, as well as a branch in each of the Commonwealth of Puerto Rico and London, England, and serves clients in Hong Kong through one of CSC’s subsidiaries;
Charles Schwab Bank (Schwab Bank), which commenced operations in 2003, is a federal savings bank located in Reno, Nevada; and
Charles Schwab Investment Management, Inc. (CSIM), which is the investment advisor for Schwab’s proprietary mutual funds, referred to as the Schwab Funds®, and Schwab’s exchange-traded funds, referred to as the Schwab ETFs™.
The Company provides financial services to individuals and institutional clients through two segments – Investor Services and Advisor Services. The Investor Services segment provides retail brokerage and banking services to individual investors, retirement plan services, and corporate brokerage services. The Advisor Services segment provides custodial, trading, and support services to independent investment advisors (IAs), and retirement business services to independent retirement plan advisors and recordkeepers whose plan assets are held at Schwab Bank. These services are further described in the segment discussion below. For financial information by segment for the three years ended December 31, 2013, see “Item 8 – Financial Statements and Supplementary Data – Notes to Consolidated Financial Statements – 23. Segment Information.” As of December 31, 2013, the Company had full-time, part-time and temporary employees, and persons employed on a contract basis that represented the equivalent of about 13,800 full-time employees. Business Acquisitions On December 14, 2012, the Company acquired ThomasPartners, Inc., a growth and dividend income-focused asset management firm. In September 2011, the Company acquired optionsXpress Holdings, Inc. (optionsXpress), an online brokerage firm primarily focused on equity options and futures. The optionsXpress® brokerage platform provides active investors and traders trading tools, analytics and education to execute a variety of investment strategies. optionsXpress, Inc., a wholly-owned subsidiary of optionsXpress, is a securities broker-dealer. In November 2010, the Company acquired substantially all of the assets of Windward Investment Management, Inc., an investment advisory firm that managed diversified investment portfolios comprised primarily of exchange-traded fund securities. As a result of the acquisition, Windhaven Investment Management, Inc. (Windhaven®) was formed as a wholly-owned subsidiary of Schwab Holdings, Inc. For additional information pertaining to the Company’s business acquisitions, see “Item 8 – Financial Statements and Supplementary Data – Notes to Consolidated Financial Statements – 24. Business Acquisitions.” (a) Accounts with balances or activity within the preceding eight months.

THE CHARLES SCHWAB CORPORATION
- 2 -
Business Strategy and Competitive Environment The Company’s stated purpose is to champion every client’s goals with passion and integrity, believing the best long-term strategy is one that puts clients first. Because investing plays a fundamental role in building financial security, the Company strives to deliver a better investing experience for its clients – individual investors and the people and institutions who serve them – by disrupting longstanding industry practices on their behalf and providing superior service. The Company aims to offer a broad range of products and solutions to choose from, including relevant and actionable advice, with a focus on transparency and convenience. In addition, management works to leverage Company scale and resources, as well as expense discipline, to help keep costs low and ensure that client solutions are both affordable and responsive to needs. The Company’s competition in serving individual investors includes a wide range of brokerage, wealth management, and asset management firms, as well as banks and trust companies. In serving these investors and competing for a growing percentage of the investable wealth in the U.S., the Company offers a multi-channel service delivery model, which includes online, mobile, telephonic, and branch capabilities. Under this model, the Company can offer personalized service at competitive prices while giving clients the choice of where, when, and how they do business with the Company. Schwab’s branches and regional telephone service centers are staffed with trained and experienced financial consultants (FCs) focused on building and sustaining client relationships. The Company offers the ability to meet client investing needs through a single ongoing point of contact, even as those needs change over time. In particular, management believes that the Company’s ability to provide those clients seeking help, guidance, or advice with an integrated, individually tailored solution – ranging from occasional consultations to an ongoing relationship with a Schwab FC or an IA – is a competitive strength compared to the more fragmented or limited offerings of other firms. The Company’s online, mobile, and telephonic channels provide quick and efficient access to an extensive array of information, research, tools, trade execution, and administrative services, which clients can access according to their needs. For example, clients that trade more actively can use these channels to access highly competitive pricing, expert tools, and extensive service capabilities – including experienced, knowledgeable teams of trading specialists and integrated product offerings. Individuals investing for retirement through 401(k) plans can take advantage of the Company’s bundled offering of multiple investment choices, education, and third-party advice. Management also believes the Company is able to compete with the wide variety of financial services firms striving to attract individual client relationships by complementing these capabilities with the extensive array of investment, banking, and lending products and services described in the following section. In the IA arena, the Company competes with institutional custodians, traditional and discount brokers, banks, investment advisory firms, and trust companies. Management believes that its Advisor Services segment can maintain its market leadership position primarily through the efforts of its expanded sales and support teams, which are dedicated to helping IAs grow, compete, and succeed in serving their clients. In addition to focusing on superior service, Advisor Services competes by utilizing technology to provide IAs with a highly-developed, scalable platform for administering their clients’ assets easily and efficiently. Advisor Services sponsors a variety of national, regional, and local events designed to help IAs identify and implement better ways to grow and manage their practices efficiently. Another important aspect of the Company’s ability to compete is its ongoing focus on efficiency and productivity, as lower costs give the Company greater flexibility in its approach to pricing and investing for growth. Management believes that this flexibility remains important in light of the competitive environment, in which a number of competitors offer reduced online trading commission rates and low expense ratios on certain classes of mutual funds and exchange-traded funds. Additionally, the Company’s nationwide marketing effort is an important competitive tool because it reinforces the attributes of the Schwab® brand. Products and Services The Company offers a broad range of products to address individuals’ varying investment and financial needs. Examples of these product offerings include:
Brokerage – an array of full-feature brokerage accounts; individual retirement accounts; retirement plans for small to large businesses; 529 college savings accounts; designated brokerage accounts; equity incentive plan accounts; and margin loans, as well as access to fixed income securities, equity and debt offerings, options, and futures;

THE CHARLES SCHWAB CORPORATION
- 3 -
Mutual funds – third-party mutual funds through Mutual Fund Marketplace®, including no-load mutual funds through the Mutual Fund OneSource® service, proprietary mutual funds from two fund families – Schwab Funds® and Laudus Funds®, other third-party mutual funds, and mutual fund trading and clearing services to broker-dealers;
Exchange-traded funds (ETFs) – third-party and proprietary ETFs, including Schwab ETFs, Schwab ETF OneSource™, and separately managed portfolios of ETFs;
Advice solutions – separately managed accounts, customized personal advice for tailored portfolios, and specialized planning and full-time portfolio management;
Banking – checking accounts linked to brokerage accounts, savings accounts, certificates of deposit, demand deposit accounts, first lien residential real estate mortgage loans (First Mortgages), home equity lines of credit (HELOCs), personal loans and entity lending collateralized by securities; and
Trust – trust custody services, personal trust reporting services, and administrative trustee services.
These products, and the Company’s full array of investing services, are made available through its two segments – Investor Services and Advisor Services. The Company’s major sources of revenues are generated by both of the Company’s reportable segments. Revenue is attributable to a reportable segment based on which segment has the primary responsibility for serving the client. The accounting policies of the Company’s reportable segments are the same as those described in “Item 8 – Financial Statements and Supplementary Data – Notes to Consolidated Financial Statements – 2. Summary of Significant Accounting Policies.” For financial information related to the Company’s reportable segments, see “Item 7 – Management’s Discussion and Analysis of Financial Condition and Results of Operations – Results of Operations – Segment Information,” and “Item 8 – Financial Statement and Supplementary Data – Notes to the Consolidated Financial Statements – 23. Segment Information.” Investor Services Through the Investor Services segment, the Company provides retail brokerage and banking services to individual investors. The Company offers research, analytic tools, performance reports, market analysis, and educational material to all clients. Clients looking for more guidance have access to online portfolio planning tools, professional advice from Schwab’s portfolio consultants who can help develop an investment strategy and carry out investment and portfolio management decisions, as well as a range of fully delegated managed solutions that provide ongoing portfolio management. Schwab strives to educate and assist clients in the development of investment plans. Educational tools include workshops, interactive courses, and online information about investing, from which Schwab does not earn revenue. Additionally, Schwab provides various internet-based research and analysis tools that are designed to help clients achieve better investment outcomes. As an example of such tools, Schwab Equity Ratings® is a quantitative model-based stock rating system that provides all clients with ratings on approximately 3,000 stocks, assigning each equity a single grade: A, B, C, D, or F. Schwab Equity Ratings International®, an international ranking methodology, covers approximately 4,000 stocks in 27 foreign equity markets. Clients may need specific investment recommendations, either from time to time or on an ongoing basis. The Company provides clients seeking advice with customized solutions. The Company’s approach to advice is based on long-term investment strategies and guidance on portfolio diversification and asset allocation. This approach is designed to be offered consistently across all of Schwab’s delivery channels. Schwab Private ClientTM features a personal advice relationship with a designated portfolio consultant, supported by a team of investment professionals who provide individualized service, a customized investment strategy developed in collaboration with the client, and ongoing guidance and execution. For clients seeking a relationship in which investment decisions are fully delegated to a financial professional, the Company offers several alternatives. The Company provides investors access to professional investment management in a diversified account that is invested exclusively in either mutual funds or ETFs through the Schwab Managed PortfoliosTM and Windhaven, or equity securities through ThomasPartners® programs. The Company also refers investors who want to utilize a specific third-party money manager to direct a portion of their investment assets to the Schwab Managed Account program. In addition, clients who want the assistance of an independent professional in managing their financial affairs may be referred to IAs in the Schwab Advisor Network®. These IAs provide personalized portfolio management, financial planning, and wealth management solutions.

THE CHARLES SCHWAB CORPORATION
- 4 -
To meet the specific needs of clients who trade actively, Schwab and optionsXpress, Inc. both offer integrated Web- and software-based trading platforms, which incorporate intelligent order routing technology, real-time market data, options trading, premium stock or futures research, and multi-channel access, as well as sophisticated account and trade management features, risk management tools, decision support tools, and dedicated personal support. For clients wishing to invest in foreign equities, the Company offers a suite of global investing capabilities, including online access to certain foreign equity markets with the ability to trade in their local currencies. In addition, the Company serves both foreign investors and non-English-speaking U.S. clients who wish to trade or invest in U.S. dollar-based securities. In the U.S., the Company serves Chinese-, Spanish-, and Vietnamese-speaking clients through a combination of its branch offices and Web-based and telephonic services. The Investor Services segment also includes the Retirement Plan Services, Corporate Brokerage Services, Stock Plan Services, and Compliance Solutions business units. Retirement Plan Services offers a bundled 401(k) retirement plan product that provides plan sponsors a wide array of investment options, trustee or custodial services, and participant-level recordkeeping. Plan design features, which increase plan efficiency and achieve employer goals, are also offered, such as automatic enrollment, automatic fund mapping at conversion, and automatic contribution increases. In 2012, the Company launched Schwab Index Advantage®, a unique 401(k) plan offer designed to lower costs, simplify investing and help workers better prepare for retirement. Services also include support for Roth 401(k) accounts and profit sharing and defined benefit plans. The Company provides a robust suite of tools to plan sponsors to manage their plans, including plan-specific reports, studies and research, access to legislative updates and benchmarking reports that provide perspective on their plan’s features compared with overall industry and segment-specific plans. Participants in bundled plans serviced by the Company receive targeted education materials, have access to electronic tools and resources, may attend onsite and virtual seminars, and can receive third-party advice delivered by Schwab. This third-party advice service is delivered online, by phone, or in person, including recommendations based on the core investment fund choices in their retirement plan and specific recommended savings rates. Corporate Brokerage Services provides specialty brokerage-related services to corporate clients through its Corporate Brokerage Retirement Services business and mutual fund clearing services to banks, brokerage firms and trust companies, and also offers proprietary mutual funds, ETFs, collective trust funds, and investment management outside the Company to institutional channels. Corporate Brokerage Retirement Services serves independent recordkeepers seeking a custodian for retirement plan assets. Schwab provides custody services tailored for retirement plans seeking a low-cost solution. Plans held at Schwab are either self-trusteed or trusteed by a separate, independent trustee. Corporate Brokerage Retirement Services also offers the Schwab Personal Choice Retirement Account®, a self-directed brokerage offering for retirement plans and the Company Retirement Account, a brokerage account designed to hold the assets of an individually designed business retirement plan. Stock Plan Services offers equity compensation plan sponsors full-service recordkeeping for stock plans: stock options, restricted stock, performance shares and stock appreciation rights. Specialized services for executive transactions and reporting, grant acceptance tracking and other services are offered to employers to meet the needs of administering the reporting and compliance aspects of an equity compensation plan. Compliance Solutions provides solutions for compliance departments of regulated companies and firms with special requirements to monitor employee personal trading, including trade surveillance technology. Advisor Services Through the Advisor Services segment, the Company provides custodial, trading, and support services to IAs. To attract and serve IAs, the Company has a dedicated sales force and service teams assigned to meet their needs. IAs who custody client accounts at Schwab may use proprietary software that provides them with up-to-date client account information, as well as trading capabilities. The Advisor Services website is the core platform for IAs to conduct daily business activities online with Schwab, including submitting and retrieving client account information and viewing news and market information. This platform provides IAs with a comprehensive suite of electronic and paper-based reporting capabilities. The Company offers online cashiering services, as well as internet-based eDocuments sites for both IAs and

THE CHARLES SCHWAB CORPORATION
- 5 -
their clients that provide multi-year archiving of online statements, trade confirms and tax reports, along with document search capabilities. To help IAs grow and manage their practices, the Company offers a variety of services, including marketing and business development, business strategy and planning, and transition support. Regulatory compliance consulting and support services are available, as well as website design and development capabilities. The Company maintains a website that provides interactive tools, educational content, and research reports to assist advisors thinking about establishing their own independent practices. The Company offers an array of services to help advisors establish their own independent practices through the Business Start-up Solutions package. For some IAs this includes access to dedicated service teams and outsourcing of back-office operations, as well as third-party firms who provide assistance with real estate, errors and omissions insurance, and company benefits. The Company offers a variety of educational materials and events to IAs seeking to expand their knowledge of industry issues and trends, as well as sharpen their individual expertise and practice management skills. The Company updates and shares market research on an ongoing basis, and it holds a series of events and conferences every year to discuss topics of interest to IAs, including business strategies and best practices. The Company sponsors the annual IMPACT® conference, which provides a national forum for the Company, IAs, and other industry participants to gather and share information and insights. IAs and their clients have access to a broad range of the Company’s products and services, including individual securities, mutual funds, ETFs, managed accounts, and cash products. The Advisor Services segment also includes the Retirement Business Services business unit. Retirement Business Services provides trust, custody, and retirement business services to independent retirement plan advisors and independent recordkeepers. Plan assets are held at the Business Trust division of Schwab Bank. The Company and independent retirement plan providers work together to serve plan sponsors, combining the consulting and administrative expertise of the administrator with the Company’s investment, technology, trust, and custodial services. Retirement Business Services also offers the Schwab Personal Choice Retirement Account® for retirement plans. Regulation CSC is a savings and loan holding company and Schwab Bank, CSC’s depository institution subsidiary, is a federal savings bank. CSC is subject to supervision and regulation by the Board of Governors of the Federal Reserve System (the Federal Reserve). CSC is currently not subject to specific statutory capital requirements; however, CSC is required to serve as a source of strength for Schwab Bank. Under the “Dodd-Frank Wall Street Reform and Consumer Protection Act” (the Dodd-Frank Act), CSC will be subject to new minimum leverage and minimum risk-based capital ratio requirements that will be set by the Federal Reserve that are at least as stringent as the current requirements generally applicable to insured depository institutions. These requirements will be phased in beginning January 1, 2015. For further information, see “Item 7 – Management’s Discussion and Analysis of Financial Condition and Results of Operations – Current Market and Regulatory Environment and Other Developments.” Schwab Bank is subject to supervision and regulation by the Office of the Comptroller of the Currency (OCC), as well as various requirements and restrictions under federal and state laws, including regulatory capital guidelines. For additional information on the regulations applicable to CSC, Schwab, Schwab Bank, and optionsXpress, Inc., see “Item 8 – Financial Statements and Supplementary Data – Notes to Consolidated Financial Statements – 22. Regulatory Requirements.” The securities industry in the United States is subject to extensive regulation under both federal and state laws. CSC’s principal U.S. broker-dealers are Schwab and optionsXpress, Inc. Schwab is registered as a broker-dealer with the United States Securities and Exchange Commission (SEC), the fifty states, and the District of Columbia and Puerto Rico. optionsXpress, Inc. is registered as a broker-dealer with the SEC, the fifty states, the District of Columbia, Puerto Rico, and the Virgin Islands. Schwab and CSIM are registered as investment advisors with the SEC. Additionally, Schwab and optionsXpress, Inc. are regulated by the Commodities Futures Trading Commission (CFTC) with respect to the commodity

THE CHARLES SCHWAB CORPORATION
- 6 -
futures and commodities trading activities they conduct as an introducing broker and futures commission merchant, respectively. Much of the regulation of broker-dealers has been delegated to self-regulatory organizations (SROs). Schwab and optionsXpress, Inc. are members of the Financial Industry Regulatory Authority, Inc. (FINRA), the Municipal Securities Rulemaking Board (MSRB), NYSE Arca, and the Chicago Board Options Exchange (CBOE). optionsXpress, Inc. is also a member of other exchanges. The primary regulators of Schwab are FINRA and, for municipal securities, the MSRB. The primary regulators of optionsXpress, Inc. are FINRA, CBOE, and for municipal securities, the MSRB. The National Futures Association (NFA) is Schwab and optionsXpress, Inc.’s primary regulator for futures and commodities trading activities. The Company’s business is also subject to oversight by regulatory bodies in other countries in which the Company operates. The principal purpose of regulating broker-dealers and investment advisors is the protection of clients and the securities markets. The regulations, to which broker-dealers and investment advisors are subject, cover all aspects of the securities business, including, among other things, sales and trading practices, publication of research, margin lending, uses and safekeeping of clients’ funds and securities, capital adequacy, recordkeeping and reporting, fee arrangements, disclosure to clients, fiduciary duties owed to advisory clients, and the conduct of directors, officers and employees. Schwab and optionsXpress, Inc. are both subject to Rule 15c3-1 under the Securities Exchange Act of 1934 (the Uniform Net Capital Rule) and related SRO requirements. The CFTC and NFA also impose net capital requirements. The Uniform Net Capital Rule specifies minimum capital requirements that are intended to ensure the general financial soundness and liquidity of broker-dealers. Because CSC itself is not a registered broker-dealer, it is not subject to the Uniform Net Capital Rule. However, if Schwab fails to maintain specified levels of net capital, such failure would constitute a default by CSC under debt covenants under CSC’s credit agreement. The Uniform Net Capital Rule limits broker-dealers’ ability to transfer capital to parent companies and other affiliates. Compliance with the Uniform Net Capital Rule could limit Schwab’s operations and its ability to repay subordinated debt to CSC, which in turn could limit CSC’s ability to repay debt, pay cash dividends, and purchase shares of its outstanding stock. In addition to net capital requirements, as self-clearing broker-dealers, Schwab and optionsXpress, Inc. are subject to cash deposit and collateral requirements with clearing houses, such as the Depository Trust & Clearing Corporation (DTCC) and Options Clearing Corporation, which may fluctuate significantly from time to time based upon the nature and size of clients’ trading activity. Sources of Net Revenues The Company’s major sources of net revenues are asset management and administration fees, net interest revenue, and trading revenue. The Company generates asset management and administration fees through its proprietary and third-party mutual fund offerings, as well as fee-based advisory solutions. Net interest revenue is the difference between interest earned on interest-earning assets and interest paid on funding sources. The Company generates trading revenue through commissions earned for executing trades for clients and principal transaction revenue primarily from trading activity in client fixed income securities. For revenue information by source for the three years ended December 31, 2013, see “Item 7 – Management’s Discussion and Analysis of Financial Condition and Results of Operations – Results of Operations – Net Revenues.” Available Information The Company files annual, quarterly, and current reports, proxy statements, and other information with the SEC. The Company’s SEC filings are available to the public over the Internet on the SEC’s website at http://www.sec.gov. You may read and copy any document that the Company files with the SEC at the SEC’s Public Reference Room at 100 F Street, NE, Washington, DC 20549. You may obtain information on the operation of the Public Reference Room by calling the SEC at 1-800-SEC-0330. On the Company’s website, http://www.aboutschwab.com, the Company posts the following recent filings as soon as reasonably practicable after they are electronically filed with or furnished to the SEC: the Company’s annual reports on

THE CHARLES SCHWAB CORPORATION
- 7 -
Form 10-K, the Company’s quarterly reports on Form 10-Q, the Company’s current reports on Form 8-K, and any amendments to those reports filed or furnished pursuant to Section 13(a) or 15(d) of the Securities Exchange Act of 1934. All such filings are available free of charge either on the Company’s website or by request via email ([email protected]), telephone (415-667-1959), or mail (Charles Schwab Investor Relations at 211 Main Street, San Francisco, CA 94105). Item 1A. Risk Factors
The Company faces a variety of risks that may affect its operations or financial results, and many of those risks are driven by factors that the Company cannot control or predict. The following discussion addresses those risks that management believes are the most significant, although there may be other risks that could arise, or may prove to be more significant than expected, that may affect the Company’s operations or financial results. For a discussion of the Company’s risk management, including operational risk, credit risk, market risk, liquidity risk, compliance risk, and legal risk, see “Item 7 – Management’s Discussion and Analysis of Financial Condition and Results of Operations – Risk Management.” Developments in the business, economic, and geopolitical environment could negatively impact the Company’s business. The Company’s business can be adversely affected by the general environment – economic, corporate, securities market, regulatory, and geopolitical developments all play a role in client asset valuations, trading activity, interest rates and overall investor engagement, and are outside of the Company’s control. Deterioration in the housing and credit markets, reductions in short-term interest rates, and decreases in securities valuations negatively impact the Company’s net interest revenue, asset management and administration fees, and capital resources. Extensive regulation of the Company’s businesses limits the Company’s activities and may subject it to significant penalties. As a participant in the securities, banking and financial services industries, the Company is subject to extensive regulation under both federal and state laws by governmental agencies, supervisory authorities, and SROs. Such regulation continues to grow more extensive and complex, and regulatory proceedings continue to become more frequent and sanctions more severe. The requirements imposed by the Company’s regulators are designed to ensure the integrity of the financial markets, the safety and soundness of financial institutions, and the protection of clients. These regulations often serve to limit the Company’s activities by way of capital, customer protection and market conduct requirements, and restrictions on the businesses activities that the Company may conduct. Despite the Company’s efforts to comply with applicable regulations, there are a number of risks, particularly in areas where applicable regulations may be unclear or where regulators revise their previous guidance. Any enforcement actions or other proceedings brought by the Company’s regulators against the Company or its affiliates, officers or employees could result in fines, penalties, cease and desist orders, enforcement actions, suspension or expulsion, or other disciplinary sanctions, including limitations on the Company’s business activities, any of which could harm the Company’s reputation and adversely affect the Company’s results of operations and financial condition. The Company maintains systems and procedures designed to ensure that it complies with applicable laws and regulations. However, some legal/regulatory frameworks provide for the imposition of fines or penalties for noncompliance even though the noncompliance was inadvertent or unintentional and even though there was in place at the time systems and procedures reasonably designed to prevent violations. There may be other negative consequences resulting from a finding of noncompliance, including restrictions on certain activities. Such a finding may also damage the Company’s reputation and could restrict the ability of institutional investment managers to invest in the Company’s securities. Legislation or changes in rules and regulations could negatively impact the Company’s business and financial results. New legislation, rule changes, or changes in the interpretation or enforcement of existing federal, state and SRO rules and regulations, including changes relating to money market mutual funds, broker-dealer fiduciary duties and mortgage products and services, may directly affect the operation and profitability of the Company or its specific business lines. The profitability

THE CHARLES SCHWAB CORPORATION
- 8 -
of the Company could also be affected by rules and regulations which impact the business and financial communities generally, including changes to the laws governing taxation, electronic commerce, client privacy and security of client data. In addition, the rules and regulations could result in limitations on the lines of business the Company conducts, modifications to the Company’s business practices, increased capital requirements, or additional costs. Financial reforms and related regulations may affect the Company’s business activities, financial position and profitability. The Dodd-Frank Act was signed into law in July 2010 and implementation is ongoing. This legislation makes extensive changes to the laws regulating financial services firms and significant rule-making and interpretation remains. In addition, the legislation mandates multiple studies, which could result in additional legislative or regulatory action. Among other things, the legislation authorizes various assessments and fees and requires the establishment of minimum leverage and risk-based capital requirements for insured depository institutions, and requires the SEC to complete studies and develop rules regarding various investor protection issues. The legislation also charges the Federal Reserve with drafting enhanced regulatory requirements for non-bank financial institutions designated as “systemically important.” CSC has not been designated as “systemically important,” but could be designated in the future. The legislation also eliminated the Office of Thrift Supervision (OTS) effective July 21, 2011 and, as a result, the Federal Reserve became CSC’s primary regulator and the OCC became the primary regulator of Schwab Bank. CSC will continue to review the impact that proposed rule-making will have on the Company’s business, financial condition, and results of operations, as such rule-making is issued. In July 2013, the U.S. banking agencies issued regulatory capital rules that implement Basel III and relevant provisions of the Dodd-Frank Act which are applicable to savings and loan holding companies, such as CSC, and federal savings banks, such as Schwab Bank. The rules, which will be phased in beginning on January 1, 2015, will subject CSC to consolidated capital requirements. The rules also establish more restrictive capital definitions, higher risk-weightings for certain asset classes, higher minimum capital ratios and capital buffers. Failure to meet the minimum capital requirements could result in certain mandatory and possibly additional discretionary actions by regulators that, if undertaken, could have a negative impact on the Company. In October 2013, the Federal Reserve, in collaboration with the OCC and the Federal Deposit Insurance Corporation, issued a joint notice of proposed rulemaking that would implement a quantitative liquidity requirement generally consistent with the liquidity coverage ratio (LCR) standard established by Basel III. The LCR would apply to all internationally active banking organizations. The Federal Reserve also proposed a modified LCR standard, which would apply to the Company. Under the modified LCR, a depository institution holding company would be required to maintain high-quality liquid assets in an amount related to its total net cash outflows over a prospective period. The proposed transition period for the rule would begin on January 1, 2015, and institutions would be required to be fully compliant by January 1, 2017. The Company is currently evaluating the impact of the proposed rule, which may be subject to further modification. The legislation also established a new independent Consumer Financial Protection Bureau (CFPB), which has broad rulemaking, supervisory and enforcement authority over consumer products, including mortgages, home-equity loans and credit cards. States will be permitted to adopt stricter consumer protection laws and state attorney generals can enforce consumer protection rules issued by the CFPB. These rules may negatively impact the range of products offered and profitability of our loan products. The legislation gives the SEC discretion to adopt rules regarding standards of conduct for broker-dealers providing investment advice to retail customers. The various studies required by the legislation could result in additional rulemaking or legislative action, which could impact the Company’s business and financial results. The changes resulting from the legislation may impact the profitability of the Company’s business activities, require changes to certain of its business practices, impose upon the Company more stringent capital, liquidity and leverage ratio requirements or otherwise adversely affect the Company’s business. These changes may also require the Company to invest significant management attention and resources to evaluate and make necessary changes.

THE CHARLES SCHWAB CORPORATION
- 9 -
Technology and operational failures or errors could subject the Company to losses, litigation, and regulatory actions. The Company faces operational risk, which is the potential for loss due to inadequate or failed internal processes, systems, and firms or exchanges handling client orders, or from external events and relationships impacting the Company and/or any of its key business partners and vendors. This risk also includes the risk of human error, execution errors, employee misconduct, unauthorized trading, external fraud, computer viruses, distributed denial of service attacks, terrorist attacks, natural disaster, power outage, capacity constraints, software flaws and similar events. For example, the Company and other financial institutions have been the target of various denial of service attacks that have, in certain circumstances, made websites, mobile applications and email unavailable for periods of time. It could take several hours or more to restore full functionality to the Company’s technology or other operating systems in the event of an unforeseen event which could affect the Company’s ability to process and settle client transactions. Moreover, instances of fraud or other misconduct, including improper use or disclosure of confidential client, employee, or company information, might also negatively impact the Company’s reputation and client confidence in the Company, in addition to any direct losses that might result from such instances. Despite the Company’s efforts to identify areas of risk, oversee operational areas involving risk, and implement policies and procedures designed to manage these risks, there can be no assurance that the Company will not suffer unexpected losses, reputational damage or regulatory action due to technology or other operational failures or errors, including those of its vendors or other third parties. While the Company devotes substantial attention and resources to the reliability, capacity and scalability of its systems, extraordinary trading volumes could cause the Company’s computer systems to operate at unacceptably slow speeds or even fail, affecting the Company’s ability to process client transactions and potentially resulting in some clients’ orders being executed at prices they did not anticipate. Disruptions in service and slower system response times could result in substantial losses and decreased client satisfaction. The Company is also dependent on the integrity and performance of securities exchanges, clearing houses and other intermediaries to which client orders are routed for execution and settlement. Systems failures and constraints and transaction error at such intermediaries could result in delays and erroneous or unanticipated execution prices, cause substantial losses for the Company and for its clients, and subject the Company to claims from its clients for damages. A significant decrease in the Company’s liquidity could negatively affect the Company’s business and financial management as well as reduce client confidence in the Company. Maintaining adequate liquidity is crucial to the business operations of the Company, including margin lending, mortgage lending, and transaction settlement, among other liquidity needs. The Company meets its liquidity needs primarily through cash generated by client activity and operating earnings, as well as cash provided by external financing. Fluctuations in client cash or deposit balances, as well as changes in market conditions, may affect the Company’s ability to meet its liquidity needs. A reduction in the Company’s liquidity position could reduce client confidence in the Company, which could result in the loss of client accounts. In addition, if the Company’s broker-dealer or depository institution subsidiaries fail to meet regulatory capital guidelines, regulators could limit the subsidiaries’ operations or their ability to upstream funds to CSC, which could reduce CSC’s liquidity and adversely affect its ability to repay debt and pay cash dividends. In addition, CSC may need to provide additional funding to such subsidiaries. Factors which may adversely affect the Company’s liquidity position include a reduction in cash held in banking or brokerage client accounts, a dramatic increase in the Company’s client lending activities (including margin, mortgage-related, and personal lending), unanticipated outflows of company cash, increased capital requirements, other regulatory changes or a loss of market or customer confidence in the Company. Schwab may also experience temporary liquidity demands due to timing differences between clients’ transaction settlements and the availability of segregated cash balances. When cash generated by client activity and operating earnings is not sufficient for the Company’s liquidity needs, the Company must seek external financing. During periods of disruptions in the credit and capital markets, potential sources of external financing could be reduced, and borrowing costs could increase. Although CSC and Schwab maintain committed and uncommitted, unsecured bank credit lines and CSC has a commercial paper issuance program, as well as a universal shelf registration statement filed with the SEC, financing may not be available on acceptable terms or at all due to market conditions or disruptions in the credit markets. In addition, a significant downgrade in the Company’s credit ratings could increase its borrowing costs and limit its access to the capital markets.

THE CHARLES SCHWAB CORPORATION
- 10 -
The Company may suffer significant losses from its credit exposures. The Company’s businesses are subject to the risk that a client, counterparty or issuer will fail to perform its contractual obligations, or that the value of collateral held to secure obligations will prove to be inadequate. While the Company has policies and procedures designed to manage this risk, the policies and procedures may not be fully effective. The Company’s exposure mainly results from margin lending, clients’ options trading, securities lending, mortgage lending, its role as a counterparty in financial contracts and investing activities, and indirectly from the investing activities of certain of the proprietary funds that the Company sponsors. When clients purchase securities on margin or trade options, the Company is subject to the risk that clients may default on their obligations when the value of the securities and cash in their accounts falls below the amount of clients’ indebtedness. Abrupt changes in securities valuations and the failure of clients to meet margin calls could result in substantial losses. The Company has exposure to credit risk associated with its securities available for sale and securities held to maturity portfolios, which include U.S. agency and non-agency mortgage-backed securities, asset-backed securities, corporate debt securities, U.S. agency notes, certificates of deposit, and commercial paper among other investments. These instruments are also subject to price fluctuations as a result of changes in the financial market’s assessment of issuer credit quality, increases in the unemployment rate, delinquency and default rates, housing price declines, changes in prevailing interest rates and other economic factors. A failure to raise the U.S. debt limit and/or a downgrade of the U.S. government’s credit rating could decrease the value of the Company’s securities in both the available for sale and held to maturity portfolios. Loss of value of securities available for sale and securities held to maturity can negatively affect earnings if management determines that such securities are other than temporarily impaired. The evaluation of whether other-than-temporary impairment exists is a matter of judgment, which includes the assessment of several factors. See “Item 7 – Management’s Discussion and Analysis of Financial Condition and Results of Operations – Critical Accounting Estimates.” If management determines that a security is other-than-temporarily impaired, the cost basis of the security may be adjusted and a corresponding loss may be recognized in current earnings. Certain securities available for sale experienced continued credit deterioration in 2013, which resulted in impairment charges. Deterioration in the performance of securities available for sale and securities held to maturity could result in the recognition of future impairment charges. The Company’s loans to banking clients primarily consist of First Mortgages and HELOCs. Increases in delinquency and default rates, housing price declines, increases in the unemployment rate, and other economic factors can result in charges for loan loss reserves and write downs on such loans. Heightened credit exposures to specific counterparties or instruments (concentration risk) can increase the Company’s risk of loss. Examples of the Company’s credit concentration risk include:
large positions in financial instruments collateralized by assets with similar economic characteristics or in securities of a single issuer or industry;
mortgage loans and HELOCs to banking clients which are secured by properties in the same geographic region; and margin and securities lending activities collateralized by securities of a single issuer or industry.
The Company may also be subject to concentration risk when lending to a particular counterparty, borrower or issuer. The Company sponsors a number of proprietary money market mutual funds and other proprietary funds. Although the Company has no obligation to do so, the Company may decide for competitive or other reasons to provide credit, liquidity or other support to its funds in the event of significant declines in valuation of fund holdings or significant redemption activity that exceeds available liquidity. Such support could cause the Company to take significant charges, could reduce the Company’s liquidity and, in certain situations, could, with respect to proprietary funds other than money market mutual funds, result in the Company having to consolidate a supported fund in its financial statements. If the Company chose not to provide credit, liquidity or other support in such a situation, the Company could suffer reputational damage and its business could be adversely affected.

THE CHARLES SCHWAB CORPORATION
- 11 -
Significant interest rate changes could affect the Company’s profitability and financial condition. The Company is exposed to interest rate risk primarily from changes in the interest rates on its interest-earning assets (such as cash equivalents, short- and long-term investments, and mortgage and margin loans) relative to changes in the costs of its funding sources (including deposits in banking and uninvested cash in brokerage accounts, short-term borrowings, and long-term debt). Changes in interest rates generally affect the interest earned on interest-earning assets differently than the interest the Company pays on its interest-bearing liabilities. In addition, certain funding sources do not bear interest and their cost therefore does not vary. Overall, the Company is positioned to benefit from a rising interest rate environment; the Company could be adversely affected by a decline in interest rates if the rates that the Company earns on interest-earning assets decline more than the rates that the Company pays on its funding sources, or if prepayment rates increase on the mortgages and mortgage-backed securities that the Company holds. The Company may also be limited in the amount it can reduce interest rates on funding sources, such as deposit accounts, and still offer a competitive return. As a result of the low interest rate environment, the Company has been waiving and may continue to waive a portion of its management fees for certain Schwab-sponsored money market mutual funds. To the extent the overall yield on certain Schwab-sponsored money market mutual funds falls to a level at or below the management fees on those funds, the Company may waive a portion of its fee in order to continue providing some return to clients. Such fee waivers negatively impact the Company’s asset management and administration fees. The Company is subject to litigation and regulatory investigations and proceedings and may not be successful in defending itself against claims or proceedings. The financial services industry faces substantial litigation and regulatory risks. The Company is subject to claims and lawsuits in the ordinary course of business, including arbitrations, class actions and other litigation, some of which include claims for substantial or unspecified damages. The Company is also the subject of inquiries, investigations, and proceedings by regulatory and other governmental agencies. Litigation and arbitration claims include those brought by the Company’s clients and the clients of third party advisors whose assets are custodied at the Company. Claims from clients of third party advisors may allege losses due to investment decisions made by the third party advisors or the advisors’ misconduct. Litigation claims also include claims from third parties alleging infringement of their intellectual property rights (e.g., patents). Such litigation can require the expenditure of significant Company resources. If the Company were found to have infringed a third-party patent, or other intellectual property rights, it could incur substantial damages, and in some circumstances could be enjoined from using certain technology, or providing certain products or services. Actions brought against the Company may result in settlements, awards, injunctions, fines, penalties or other results adverse to the Company including reputational harm. Even if the Company is successful in defending against these actions, the defense of such matters may result in the Company incurring significant expenses. Predicting the outcome of matters is inherently difficult, particularly where claims are brought on behalf of various classes of claimants, claimants seek substantial or unspecified damages, or when investigations or legal proceedings are at an early stage. A substantial judgment, settlement, fine, or penalty could be material to the Company’s operating results or cash flows for a particular future period, depending on the Company’s results for that period. In market downturns, the volume of legal claims and amount of damages sought in litigation and regulatory proceedings against financial services companies have historically increased. See “Item 8 – Financial Statements and Supplementary Data – Notes to Consolidated Financial Statements – 14. Commitments and Contingencies.” The Company relies on outsourced service providers to perform key functions. The Company relies on external service providers to perform certain key technology, processing, servicing, and support functions. These service providers face technology, operating, business, and economic risks, and any significant failures by them, including the improper use or disclosure of the Company’s confidential client, employee, or company information, could cause the Company to incur losses and could harm the Company’s reputation. An interruption in or the cessation of service by any external service provider as a result of systems failures, capacity constraints, financial difficulties or for any other reason, and the Company’s inability to make alternative arrangements in a timely manner could disrupt the Company’s

THE CHARLES SCHWAB CORPORATION
- 12 -
operations, impact the Company’s ability to offer certain products and services, and result in financial losses to the Company. Switching to an alternative service provider may require a transition period and result in less efficient operations. Security breaches of the Company’s systems, or those of its clients or third parties, may subject the Company to significant liability and damage the Company’s reputation. The Company’s business involves the secure processing, storage and transmission of confidential information about the Company and its clients. Information security risks for financial institutions are increasing, in part because of the use of the internet and mobile technologies to conduct financial transactions, and the increased sophistication and activities of organized crime, activists, hackers and other external parties. The Company’s systems and those of other financial institutions have been and are likely to continue to be the target of cyber attacks, malicious code, computer viruses and denial of service attacks that could result in unauthorized access, misuse, loss or destruction of data (including confidential customer information), account takeovers, unavailability of service or other events. Despite the Company’s efforts to ensure the integrity of its systems, the Company may not be able to anticipate or to implement effective preventive measures against all security breaches of these types, especially because the techniques used change frequently or are not recognized until launched, and because security attacks can originate from a wide variety of sources. Data security breaches may also result from non-technical means, for example, actions by a suborned employee. Security breaches, including breaches of the Company’s security measures or those of the Company’s third-party service providers or clients, could result in a violation of applicable privacy and other laws and could subject the Company to significant liability or loss that may not be covered by insurance, actions by the Company’s regulators, damage to the Company’s reputation, or a loss of confidence in the Company’s security measures which could harm the Company’s business. The Company may be required to expend significant additional resources to modify its protective measures or to investigate and remediate vulnerabilities or other exposures. The Company also faces risk related to external fraud involving the compromise of clients’ personal electronic devices that can facilitate the unauthorized access to login and password information for their various online financial accounts, including those at the Company. Such risk has grown in recent years due to the increased sophistication and activities of organized crime and other external parties, including foreign state-sponsored parties. For example, these parties send fraudulent “phishing” emails to the Company’s clients in order to misappropriate user names, passwords or other personal information. Losses reimbursed to clients under the Company’s guarantee against unauthorized account activity could have a negative impact on the Company’s business, financial condition and results of operations. Potential strategic transactions could have a negative impact on the Company’s financial position. The Company evaluates potential strategic transactions, including business combinations, acquisitions, and dispositions. Any such transaction could have a material impact on the Company’s financial position, results of operations, or cash flows. The process of evaluating, negotiating, and effecting any such strategic transaction may divert management’s attention from other business concerns, and might cause the loss of key clients, employees, and business partners. Moreover, integrating businesses and systems may result in unforeseen expenditures as well as numerous risks and uncertainties, including the need to integrate operational, financial, and management information systems and management controls, integrate relationships with clients and business partners, and manage facilities and employees in different geographic areas. In addition, an acquisition may cause the Company to assume liabilities or become subject to litigation or regulatory proceedings. Further, the Company may not realize the anticipated benefits from an acquisition, and any future acquisition could be dilutive to the Company’s current stockholders’ percentage ownership or to earnings per common share. The Company’s acquisitions and dispositions are typically subject to closing conditions, including regulatory approvals and the absence of material adverse changes in the business, operations or financial condition of the entity being acquired or sold. To the extent the Company enters into an agreement to buy or sell an entity, there can be no guarantee that the transaction will close when expected, or at all. If a material transaction does not close, the Company’s stock price could decline. The Company’s industry is characterized by aggressive price competition. The Company continually monitors its pricing in relation to competitors and periodically adjusts trade commission rates, interest rates on deposits and loans, fees for advisory services, and other fee structures to enhance its competitive position.

THE CHARLES SCHWAB CORPORATION
- 13 -
Increased price competition from other financial services firms, such as reduced commissions to attract trading volume or higher deposit rates to attract client cash balances, could impact the Company’s results of operations and financial condition. The industry in which the Company competes has undergone a period of consolidation. The Company faces intense competition for the clients that it serves and the products and services it offers. There has been significant consolidation as financial institutions with which the Company competes have been acquired by or merged into or acquired other firms. This consolidation may continue. Competition is based on many factors, including the range of products and services offered, pricing, customer service, brand recognition, reputation, and perceived financial strength. Consolidations may enable other firms to offer a broader range of products and services than the Company does, or offer such products at more competitive prices. The Company faces competition in hiring and retaining qualified employees, especially for employees who are key to the Company’s ability to build and enhance client relationships. The market for quality professionals and other personnel in the Company’s business is highly competitive. Competition is particularly strong for financial consultants who build and sustain the Company’s client relationships. The Company’s ability to continue to compete effectively will depend upon its ability to attract new employees and retain existing employees while managing compensation costs. The Company’s stock price has fluctuated historically, and may continue to fluctuate. The Company’s stock price can be volatile. Among the factors that may affect the volatility of the Company’s stock price are the following:
speculation in the investment community or the press about, or actual changes in, the Company’s competitive position, organizational structure, executive team, operations, financial condition, financial reporting and results, effectiveness of cost reduction initiatives, or strategic transactions;
the announcement of new products, services, acquisitions, or dispositions by the Company or its competitors; increases or decreases in revenue or earnings, changes in earnings estimates by the investment community, and
variations between estimated financial results and actual financial results. Changes in the stock market generally or as it concerns the Company’s industry, as well as geopolitical, economic, and business factors unrelated to the Company, may also affect the Company’s stock price. Future sales of CSC’s equity securities may adversely affect the market price of CSC’s common stock and result in dilution. CSC’s certificate of incorporation authorizes CSC’s Board of Directors to, among other things, issue additional shares of common or preferred stock or securities convertible or exchangeable into equity securities, without stockholder approval. CSC may issue additional equity or convertible securities to raise additional capital or for other purposes. The issuance of any additional equity or convertible securities could be substantially dilutive to holders of CSC’s common stock and may adversely affect the market price of CSC’s common stock. Item 1B. Unresolved Securities and Exchange Commission Staff Comments
None.

THE CHARLES SCHWAB CORPORATION
- 14 -
Item 2. Properties
A summary of the Company’s significant locations at December 31, 2013, is presented in the following table. Locations are leased or owned as noted below. The square footage amounts are presented net of space that has been subleased to third parties.
Square Footage (amounts in thousands) Leased Owned
Location Corporate office space:
San Francisco, CA (1) 779 -
Service centers: Phoenix, AZ (2) 37 669Denver, CO 383 -Indianapolis, IN - 274Austin, TX 252 -Orlando, FL 148 -Richfield, OH - 117
(1) Includes the Company’s headquarters.
(2) Includes two data centers.
Substantially all of the Company’s branch offices are located in leased premises. The corporate headquarters, data centers, offices, and service centers support both of the Company’s segments.
Item 3. Legal Proceedings
For a discussion of legal proceedings, see “Item 8 – Financial Statements and Supplementary Data – Notes to Consolidated Financial Statements – 14. Commitments and Contingencies.”

THE CHARLES SCHWAB CORPORATION
- 15 -
PART II Item 4. Mine Safety Disclosures
Not applicable. Item 5. Market for Registrant’s Common Equity, Related Stockholder Matters and Issuer
Purchases of Equity Securities CSC’s common stock is listed on The New York Stock Exchange under the ticker symbol SCHW. The number of common stockholders of record as of January 31, 2014, was 7,191. The closing market price per share on that date was $24.82. The quarterly high and low sales prices for CSC’s common stock and the other information required to be furnished pursuant to this item are included in “Item 8 – Financial Statements and Supplementary Data – Notes to Consolidated Financial Statements – 27. Quarterly Financial Information (Unaudited) and 19. Employee Incentive, Retirement, and Deferred Compensation Plans.” The following graph shows a five-year comparison of cumulative total returns for CSC’s common stock, the Dow Jones U.S. Investment Services Index, and the Standard & Poor’s 500 Index, each of which assumes an initial investment of $100 and reinvestment of dividends.
December 31, 2008 2009 2010 2011 2012 2013
The Charles Schwab Corporation $ 100 $ 118 $ 109 $ 73 $ 95 $ 173 Dow Jones U.S. Investment Services Index $ 100 $ 160 $ 165 $ 108 $ 137 $ 222 Standard & Poor’s 500 Index $ 100 $ 126 $ 146 $ 149 $ 172 $ 228
$0
$50
$100
$150
$200
$250
12/31/08 12/31/09 12/31/10 12/31/11 12/31/12 12/31/13
The Charles Schwab Corporation
Dow Jones U.S. Investment Services Index
Standard & Poor’s 500 Index

THE CHARLES SCHWAB CORPORATION
- 16 -
Issuer Purchases of Equity Securities The following table summarizes purchases made by or on behalf of CSC of its common stock for each calendar month in the fourth quarter of 2013:
Total Number of Approximate Dollar Shares Purchased Value of Shares that Total Number of Average as Part of Publicly May Yet be Purchased Shares Purchased Price Paid Announced Program (1) under the Program Month (in thousands) per Share (in thousands) (in millions)
October: Share Repurchase Program (1) - $ - - $ 596 Employee transactions (2) 21 $ 21.24 N/A N/A
November: Share Repurchase Program (1) - $ - - $ 596 Employee transactions (2) 1,052 $ 22.96 N/A N/A
December: Share Repurchase Program (1) - $ - - $ 596 Employee transactions (2) 7 $ 24.82 N/A N/A
Total: Share Repurchase Program (1) - $ - - $ 596 Employee transactions (2) 1,080 $ 22.94 N/A N/A
N/A Not applicable. (1) There were no share repurchases under the Share Repurchase Program during the fourth quarter. Repurchases under this
program would occur under two authorizations by CSC’s Board of Directors, each covering up to $500 million of common stock that were publicly announced by the Company on April 25, 2007, and March 13, 2008. The remaining authorizations do not have an expiration date.
(2) Includes restricted shares withheld (under the terms of grants under employee stock incentive plans) to offset tax withholding obligations that occur upon vesting and release of restricted shares. The Company may receive shares delivered or attested to pay the exercise price and/or to satisfy tax withholding obligations by employees who exercise stock options (granted under employee stock incentive plans), which are commonly referred to as stock swap exercises.

THE CHARLES SCHWAB CORPORATION
- 17 -
Item 6. Selected Financial Data
Selected Financial and Operating Data (In Millions, Except Per Share Amounts, Ratios, or as Noted)
Growth Rates Compounded Annual 4-Year (1) 1-Year 2009-2013 2012-2013 2013 2012 2011 2010 2009
Results of Operations Net revenues 7 % 11 % $ 5,435 $ 4,883 $ 4,691 $ 4,248 $ 4,193 Expenses excluding interest 6 % 9 % $ 3,730 $ 3,433 $ 3,299 $ 3,469 $ 2,917 Net income 8 % 15 % $ 1,071 $ 928 $ 864 $ 454 $ 787 Net income available to common stockholders 6 % 14 % $ 1,010 $ 883 $ 864 $ 454 $ 787 Basic earnings per common share 3 % 13 % $ .78 $ .69 $ .70 $ .38 $ .68 Diluted earnings per common share 3 % 13 % $ .78 $ .69 $ .70 $ .38 $ .68 Dividends declared per common share - - $ .24 $ .24 $ .24 $ .24 $ .24 Weighted-average common shares outstanding — diluted 3 % 1 % 1,293 1,275 1,229 1,194 1,160 Asset management and administration fees as a
percentage of net revenues 43 % 42 % 41 % 43 % 45 %Net interest revenue as a percentage of net revenues 36 % 36 % 37 % 36 % 30 %Trading revenue as a percentage of net revenues (2) 17 % 18 % 20 % 20 % 24 %Effective income tax rate 37.2 % 36.0 % 37.9 % 41.7 % 38.3 %Capital expenditures — purchases of equipment,
office facilities, and property, net 18 % 95 % $ 269 $ 138 $ 190 $ 127 $ 139 Capital expenditures, net, as a percentage of net revenues 5 % 3 % 4 % 3 % 3 %
Performance Measures Net revenue growth (decline) 11 % 4 % 10 % 1 % (19)%Pre-tax profit margin 31.4 % 29.7 % 29.7 % 18.3 % 30.4 %Return on average common stockholders’ equity (3) 11 % 11 % 12 % 8 % 17 %
Financial Condition (at year end) Total assets 17 % 8 % $ 143,642 $ 133,617 $ 108,553 $ 92,568 $ 75,431 Long-term debt 6 % 17 % $ 1,903 $ 1,632 $ 2,001 $ 2,006 $ 1,512 Stockholders’ equity (4) 20 % 8 % $ 10,381 $ 9,589 $ 7,714 $ 6,226 $ 5,073 Assets to stockholders’ equity ratio 14 14 14 15 15 Long-term debt to total financial capital
(long-term debt plus stockholders’ equity) 15 % 15 % 21 % 24 % 23 %
Employee Information Full-time equivalent employees (in thousands,
at year end) 3 % - 13.8 13.8 14.1 12.8 12.4 Net revenues per average full-time equivalent
employee (in thousands) 4 % 10 % $ 391 $ 354 $ 350 $ 337 $ 338
(1) The compounded 4-year growth rate is computed using the following formula: Compound annual growth rate = (Ending Value / Beginning Value) .25 - 1. (2) Trading revenue includes commission and principal transaction revenues. (3) Return on average common stockholders’ equity is calculated using net income available to common stockholders divided by average common stockholders’ equity. (4) In 2012, the Company issued non-cumulative perpetual preferred stock, Series B, for a total liquidation preference of $485 million and non-cumulative perpetual preferred
stock, Series A, with a total liquidation preference of $400 million.

THE CHARLES SCHWAB CORPORATION Management’s Discussion and Analysis of Financial Condition and Results of Operations
(Tabular Amounts in Millions, Except Ratios, or as Noted)
- 18 -
Item 7. Management’s Discussion and Analysis of Financial Condition and Results of Operations OVERVIEW Management of the Company focuses on several key client activity and financial metrics in evaluating the Company’s financial position and operating performance. Management believes that earnings per common share, net revenue growth, pre-tax profit margin, and return on common stockholders’ equity provide broad indicators of the Company’s overall financial health, operating efficiency, and ability to generate acceptable returns within the context of a given operating environment. Expenses excluding interest as a percentage of average client assets is considered by management to be a measure of operating efficiency. Results for the years ended December 31, 2013, 2012, and 2011 are:
Growth Rate 1-Year Year Ended December 31, 2012-2013 2013 2012 2011
Client Activity Metrics: Net new client assets (1) (in billions) (70)% $ 41.6 $ 139.7 $ 145.9 Client assets (2) (in billions, at year end) 15 % $ 2,249.4 $ 1,951.6 $ 1,677.7 New brokerage accounts (3) (in thousands) 7 % 960 900 1,138 Active brokerage accounts (4) (in thousands, at year end) 3 % 9,093 8,787 8,552
Company Financial Metrics: Net revenues 11 % $ 5,435 $ 4,883 $ 4,691 Expenses excluding interest 9 % 3,730 3,433 3,299 Income before taxes on income 18 % 1,705 1,450 1,392 Taxes on income 21 % 634 522 528 Net income 15 % $ 1,071 $ 928 $ 864 Net income available to common stockholders 14 % $ 1,010 $ 883 $ 864 Earnings per common share – diluted 13 % $ .78 $ .69 $ .70 Net revenue growth from prior year 11 % 4 % 10 % Pre-tax profit margin 31.4 % 29.7 % 29.7 % Return on common stockholders’ equity (5) 11 % 11 % 12 % Expenses excluding interest as a percentage of
average client assets 0.18 % 0.19 % 0.20 %
(1) Net new client assets is defined as the total inflows of client cash and securities to the firm less client outflows. Management believes that this metric along with core net new assets depicts how well the Company’s products and services appeal to new and existing clients in a given operating environment. Core net new assets totaled $140.8 billion, $112.4 billion, and $82.3 billion in 2013, 2012, and 2011, respectively. See below for items excluded from core net new assets.
(2) Client assets is the market value of all client assets custodied at the Company. Management considers client assets to be indicative of the Company’s appeal in the marketplace. Additionally, fluctuations in certain components of client assets (e.g., Mutual Fund OneSource funds) directly impact asset management and administration fees.
(3) New brokerage accounts include all brokerage accounts opened during the period, as well as any accounts added via acquisition. This metric measures the Company’s effectiveness in attracting new clients and building stronger relationships with existing clients. See below comparisons of 2013 to 2012 and 2012 to 2011 for additional detail.
(4) Active brokerage accounts include accounts with balances or activity within the preceding eight months. This metric is an indicator of the Company’s success in both attracting and retaining clients. See below comparisons of 2013 to 2012 and 2012 to 2011 for additional detail.
(5) Calculated as net income available to common stockholders divided by common stockholders’ equity. N/M Not meaningful.

THE CHARLES SCHWAB CORPORATION Management’s Discussion and Analysis of Financial Condition and Results of Operations
(Tabular Amounts in Millions, Except Ratios, or as Noted)
- 19 -
Core net new client assets is defined as net new client assets before significant one-time flows. Management considers this to be a useful metric when comparing period-to-period client asset flows. The following one-time flows were excluded from core net new assets.
2013 excludes outflows of $74.5 billion relating to the planned transfer of a mutual fund clearing services client. The Company also reduced its reported total for overall client assets by $24.7 billion in 2013 to reflect the estimated impact of the consolidation of its retirement plan recordkeeping technology platforms and subsequent resignation from certain retirement plan clients.
2012 excludes inflows of $27.7 billion from mutual fund clearing services clients and $900 million from the acquisition of ThomasPartners, Inc., and outflows of $1.3 billion from the closure and/or sale of certain subsidiaries of optionsXpress.
2011 excludes inflows of $56.1 billion from a mutual fund clearing services client and $7.5 billion from the acquisition of optionsXpress.
The Company’s major sources of net revenues are asset management and administration fees, net interest revenue, and trading revenue. The Company generates asset management and administration fees through its proprietary and third-party mutual fund offerings, as well as fee-based advisory solutions. Net interest revenue is the difference between interest earned on interest-earning assets and interest paid on funding sources. Asset management and administration fees and net interest revenue are impacted by securities valuations, interest rates, the amount and mix of interest-earning assets and interest-bearing funding sources, the Company’s ability to attract new clients, and client activity levels. The Company generates trading revenue through commissions earned for executing trades for clients and principal transaction revenue primarily from trading activity in client fixed income securities. Trading revenue is impacted by trading volumes, the volatility of prices in the equity and fixed income markets, and commission rates. 2013 Compared to 2012 Valuations in the broad equity markets improved during 2013 compared to 2012, as the Nasdaq Composite Index, Standard & Poor’s 500 Index, and Dow Jones Industrial Average increased 38%, 30%, and 26%, respectively. While the federal funds target rate remained unchanged at a range of zero to 0.25%, the average 10-year Treasury yield increased by 55 basis points to 2.33% during 2013 compared to 2012. In the same period however, the average three-month Treasury Bill yield decreased by 3 basis points to 0.05%. The Company continued to experience growth in its client base during 2013 – core net new client assets totaled $140.8 billion, up 25% from $112.4 billion in 2012. Total client assets ended the year at a record $2.25 trillion, up 15% from 2012. In addition, the Company added almost 1 million new brokerage accounts during 2013, and active brokerage accounts reached 9.1 million, up 3% from 2012. As a result of the Company’s strong key client activity metrics, the Company achieved a pre-tax profit margin of 31.4% in 2013. Overall, net income increased by 15% in 2013 from 2012 and the return on average common stockholders’ equity was 11% in 2013. Along with the growth in its client base, enrollments in client advisory solutions and stability in the economic environment helped the Company achieve increases in all three major revenue lines in 2013 compared to 2012. Overall, net revenues increased by 11% in 2013 from 2012, primarily due to increases in asset management and administration fees, net interest revenue, and trading revenue, partially offset by a decrease in other revenue – net. Asset management and administration fees increased primarily due to increases in mutual fund service fees and advice solutions fees. Net interest revenue increased primarily due to higher balances of interest-earning assets and higher interest rates on new fixed-rate investments. This increase was partially offset by the effect lower average short-term interest rates and the maturity of short-term interest-earning assets had on the Company’s average net interest margin. Trading revenue increased primarily due to higher daily average revenue trades and two additional trading days during the year. Other revenue – net decreased primarily due to a non-recurring gain of $70 million relating to a confidential resolution of a vendor dispute in 2012. Expenses excluding interest increased by 9% in 2013 from 2012 primarily due to increases in compensation and benefits, professional services, advertising and market development, and other expense. Compensation and benefits expense increased

THE CHARLES SCHWAB CORPORATION Management’s Discussion and Analysis of Financial Condition and Results of Operations
(Tabular Amounts in Millions, Except Ratios, or as Noted)
- 20 -
in 2013 from 2012 primarily due to higher incentive compensation relating to the transition to a new payout schedule for field incentive plans, increased individual sales performance compensation as a result of field sales volume, increased and accelerated health savings account (HSA) contributions, equity incentive plan changes to vesting for retirement-eligible employees, and increased funding for the corporate bonus plan commensurate with achieving higher earnings per common share. Advertising and market development expense increased primarily due to investment in the Company’s new advertising and branding initiative, Own your tomorrow™. 2012 Compared to 2011 Valuations in the broad equity markets improved during 2012 compared to 2011, as the Nasdaq Composite Index, Standard & Poor’s 500 Index, and Dow Jones Industrial Average increased 16%, 13%, and 7%, respectively. While the federal funds target rate remained unchanged at a range of zero to 0.25%, the average three-month Treasury Bill yield increased by 4 basis points to 0.08% during 2012 compared to 2011. At the same time, the average 10-year Treasury yield decreased by 98 basis points to 1.78%. Despite continuing economic and interest rate challenges during the year, the Company’s sustained client focus helped deliver strong key client activity metrics in 2012. While net new client assets decreased slightly by 4% to $139.7 billion in 2012, core net new client assets totaled $112.4 billion, up 37% from $82.3 billion in 2011. Total client assets ended the year at a record $1.95 trillion, up 16% from 2011. In addition, the Company added 900,000 new brokerage accounts to its client base during 2012, a decrease of 21% from the prior year due to the removal of approximately 30,000 accounts due to escheatment and other factors in 2012, and the addition of 315,000 new brokerage accounts from the acquisition of optionsXpress in 2011. Active brokerage accounts reached a record 8.8 million, up 3% from 2011. Net revenues increased by 4% in 2012 from 2011 primarily due to increases in asset management and administration fees, net interest revenue, and other revenue – net, partially offset by a decrease in trading revenue. Asset management and administration fees increased primarily due to increases in advice solutions fees and other asset management and administration fees. Net interest revenue increased primarily due to higher average balances of interest-earning assets, partially offset by the effect of low overall interest rates and higher amortization of premiums relating to mortgage-backed securities. Other revenue – net increased primarily due to a non-recurring gain of $70 million relating to a confidential resolution of a vendor dispute in the second quarter of 2012. Trading revenue decreased primarily due to lower daily average revenue trades, partially offset by the inclusion of optionsXpress’ trading activity from its acquisition in September 2011. Expenses excluding interest were higher by 4% in 2012 compared to 2011 primarily due to the inclusion of a full year of optionsXpress’ expenses. Taxes on income in 2012 include a non-recurring state tax benefit of $20 million recorded in the third quarter of 2012. Overall, growth in the Company’s client base and ongoing expense discipline helped the Company increase net income by 7% in 2012 from 2011, and achieve a pre-tax profit margin of 29.7% and return on common stockholders’ equity of 11% in 2012. CURRENT MARKET AND REGULATORY ENVIRONMENT AND OTHER DEVELOPMENTS To the extent short-term interest rates remain at current low levels, the Company’s net interest revenue will continue to be constrained, even as growth in average balances helps to increase such revenue. The low short-term interest rate environment also affects asset management and administration fees. The Company continues to waive a portion of its management fees, as the overall yields on certain Schwab-sponsored money market mutual funds have remained at levels at or below the management fees on those funds. These and certain other Schwab-sponsored money market mutual funds may not be able to replace maturing securities with securities of equal or higher yields. As a result, the yields on such funds may remain around or decline from their current levels, and therefore below the stated management fees on those funds. To the extent this occurs, asset management and administration fees may continue to be negatively affected. In July 2013, the U.S. banking agencies issued regulatory capital rules that implemented BASEL III and relevant provisions of the Dodd-Frank Act (Final Regulatory Capital Rules), which are applicable to savings and loan holding companies, such as CSC, and federal savings banks, such as Schwab Bank. The rules will be phased in beginning on January 1, 2015.

THE CHARLES SCHWAB CORPORATION Management’s Discussion and Analysis of Financial Condition and Results of Operations
(Tabular Amounts in Millions, Except Ratios, or as Noted)
- 21 -
The Final Regulatory Capital Rules, among other things:
subject savings and loan holding companies to consolidated capital requirements; revise the required minimum risk-based and leverage capital requirements by (1) establishing a new minimum
Common Equity Tier 1 Risk-Based Capital Ratio (common equity Tier 1 capital to total risk-weighted assets) of 4.5%; (2) raising the minimum Tier 1 Risk-Based Capital Ratio from 4.0% to 6.0%; (3) maintaining the minimum Total Risk-Based Capital Ratio of 8.0%; and (4) maintaining a minimum Tier 1 Leverage Ratio (Tier 1 capital to adjusted average consolidated assets) of 4.0%;
add a requirement to maintain a minimum capital conservation buffer, composed of common equity Tier 1 capital, of 2.5% of risk-weighted assets, which means that banking organizations, on a fully phased-in basis no later than January 1, 2019, must maintain a Common Equity Tier 1 Risk-Based Capital Ratio greater than 7.0%; a Tier 1 Risk-Based Capital Ratio greater than 8.5% and a Total Risk-Based Capital Ratio greater than 10.5%; and
change the definition of capital categories for insured depository: to be considered “well-capitalized”, Schwab Bank must have a Common Equity Tier 1 Risk-Based Capital Ratio of at least 6.5%, a Tier 1 Risk-Based Capital Ratio of at least 8%, a Total Risk-Based Capital Ratio of at least 10% and a Tier 1 Leverage Ratio of at least 5%.
The new minimum regulatory capital ratios and changes to the calculation of risk-weighted assets are effective beginning January 1, 2015. The required minimum capital conservation buffer will be phased in incrementally, starting at 0.625% on January 1, 2016 and increasing to 1.25% on January 1, 2017, 1.875% on January 1, 2018 and 2.5% on January 1, 2019. The Final Regulatory Capital Rules provide that the failure to maintain the minimum capital conservation buffer will result in restrictions on capital distributions and discretionary cash bonus payments to executive officers. The Company does not expect the Final Regulatory Capital Rules to have a material impact on the Company’s business, financial condition, and results of operations. On October 24, 2013, the Federal Reserve, in collaboration with the OCC and the Federal Deposit Insurance Corporation, issued a joint notice of proposed rulemaking that would implement a quantitative liquidity requirement generally consistent with the LCR standard established by Basel III. The LCR would apply to all internationally active banking organizations. The Federal Reserve also proposed a modified LCR standard, which would apply to the Company. Under the modified LCR, a depository institution holding company would be required to maintain high-quality liquid assets in an amount related to its total net cash outflows over a prospective period. The proposed transition period for the rule would begin on January 1, 2015, and institutions would be required to be fully compliant by January 1, 2017. The Company is currently evaluating the impact of the proposed rule, which may be subject to further modification. In April 2013, the SEC published notice of a National Securities Clearing Corporation (NSCC) proposed rule change that would impose a supplemental liquidity funding obligation on certain NSCC participants. The NSCC is a subsidiary of DTCC. The stated purpose was to provide the NSCC with sufficient liquidity and financial resources to withstand a default by one of its members. The rule change, as proposed, could have required the Company to provide a supplemental liquidity deposit relating to options activity (Special SLD) and a supplemental liquidity deposit relating to equities activity (Regular SLD). The proposed rule change with regard to the Special SLD was approved and went into effect on February 1, 2014, and the Company does not expect the rule change to have a material impact on the Company’s business, financial condition, and results of operations. However, the proposed rule change with regard to the Regular SLD was withdrawn and alternative proposals are currently being discussed. The Company is pursuing lawsuits in state court in San Francisco for rescission and damages against issuers, underwriters, and dealers of individual non-agency residential mortgage-backed securities on which the Company has experienced realized and unrealized losses. The lawsuits allege that offering documents for the securities contained material untrue and misleading statements about the securities and the underwriting standards and credit quality of the underlying loans. On January 27, 2012, and July 24, 2012, the court denied defendants’ motions to dismiss the claims with respect to all but 3 of the 51 securities, and discovery is proceeding.

THE CHARLES SCHWAB CORPORATION Management’s Discussion and Analysis of Financial Condition and Results of Operations
(Tabular Amounts in Millions, Except Ratios, or as Noted)
- 22 -
RESULTS OF OPERATIONS The following discussion is an analysis of the Company’s results of operations for the years ended December 31, 2013, 2012, and 2011. Net Revenues The Company’s major sources of net revenues are asset management and administration fees, net interest revenue, and trading revenue. Asset management and administration fees, net interest revenue, and trading revenue all increased in 2013 as compared to 2012. Asset management and administration fees and net interest revenue increased, while trading revenue decreased in 2012 as compared to 2011.
Year Ended December 31, 2013 2012 2011 % of % of % of Growth Rate Total Net Total Net Total Net 2012-2013 Amount Revenues Amount Revenues Amount Revenues
Asset management and administration fees Schwab money market funds before fee waivers 5 % $ 936 $ 891 $ 865 Fee waivers 15 % (674) (587) (568)Schwab money market funds after fee waivers (14)% 262 5 % 304 6 % 297 6 % Equity and bond funds 26 % 157 3 % 125 3 % 118 3 % Mutual Fund OneSource® 14 % 774 14 % 680 14 % 680 14 %
Total mutual fund service fees 8 % 1,193 22 % 1,109 23 % 1,095 23 % Advice solutions 24 % 718 13 % 580 12 % 522 11 % Other 14 % 404 8 % 354 7 % 311 7 %
Asset management and administration fees 13 % 2,315 43 % 2,043 42 % 1,928 41 %
Net interest revenue Interest revenue 9 % 2,085 38 % 1,914 39 % 1,900 41 % Interest expense (30)% (105) (2)% (150) (3)% (175) (4)%
Net interest revenue 12 % 1,980 36 % 1,764 36 % 1,725 37 %
Trading revenue Commissions 6 % 864 16 % 816 17 % 866 19 % Principal transactions (6)% 49 1 % 52 1 % 61 1 %
Trading revenue 5 % 913 17 % 868 18 % 927 20 %
Other – net (8)% 236 4 % 256 5 % 160 3 % Provision for loan losses (106)% 1 - (16) - (18) - Net impairment losses on securities (69)% (10) - (32) (1)% (31) (1)%
Total net revenues 11 % $ 5,435 100 % $ 4,883 100 % $ 4,691 100 %
Asset Management and Administration Fees Asset management and administration fees include mutual fund service fees and fees for other asset-based financial services provided to individual and institutional clients. The Company earns mutual fund service fees for shareholder services, administration, and investment management provided to its proprietary funds, and recordkeeping and shareholder services provided to third-party funds. These fees are based upon the daily balances of client assets invested in these funds. The Company also earns asset management fees for advice solutions, which include advisory and managed account services that are based on the daily balances of client assets subject to the specific fee for service. The fair values of client assets included in proprietary and third-party mutual funds are based on quoted market prices and other observable market data. Other asset management and administration fees include various asset based fees, such as third-party mutual fund service fees, trust fees, 401(k) record keeping fees, and mutual fund clearing and other service fees. Asset management and administration fees vary with changes in the balances of client assets due to market fluctuations and client activity. For a discussion of the impact of current market conditions on asset management and administration fees, see “Current Market and Regulatory Environment and Other Developments.” Asset management and administration fees increased by $272 million, or 13%, in 2013 from 2012 primarily due to increases in mutual fund service fees and advice solutions fees. Asset management and administration fees increased by $115 million,

THE CHARLES SCHWAB CORPORATION Management’s Discussion and Analysis of Financial Condition and Results of Operations
(Tabular Amounts in Millions, Except Ratios, or as Noted)
- 23 -
or 6%, in 2012 from 2011 primarily due to an increase in advice solutions fees and other asset management and administration fees. Mutual fund service fees increased by $84 million, or 8%, in 2013 from 2012, due to market appreciation and growth in client assets invested in the Company’s Mutual Fund OneSource funds and equity and bond funds, partially offset by a decrease in net money market mutual fund fees as a result of lower yields on fund assets. Mutual fund service fees were relatively flat in 2012 from 2011, which reflected growth in client assets invested in money market mutual funds, equity and bond funds, and Mutual Fund OneSource funds, offset by the effect of lower yields on certain fund assets. Advice solutions fees increased by $138 million, or 24%, in 2013 from 2012 and by $58 million, or 11%, in 2012 from 2011 primarily due to growth in client assets enrolled in advisory and managed account programs, including Windhaven®, Schwab Private ClientTM, and ThomasPartners. Other asset management and administration fees increased by $50 million, or 14%, in 2013 from 2012 and $43 million, or 14%, in 2012 from 2011 primarily due to an increase in third-party mutual fund service fees as a result of an increase in client asset balances invested in other third-party mutual funds. Net Interest Revenue Net interest revenue is the difference between interest earned on interest-earning assets and interest paid on funding sources. Net interest revenue is affected by changes in the volume and mix of these assets and liabilities, as well as by fluctuations in interest rates and portfolio management strategies. The majority of the Company’s interest-earnings assets and interest-bearing liabilities are sensitive to changes in short-term interest rates. The Company’s investment strategy is structured to produce an increase in net interest revenue when interest rates rise and, conversely, a decrease in net interest revenue when interest rates fall. When interest rates fall, the Company may attempt to mitigate some of this negative impact by extending the maturities of assets in investment portfolios to lock in asset yields, and by lowering rates paid to clients on interest-bearing liabilities. Since the Company establishes the rates paid on certain brokerage client cash balances and deposits from banking clients, as well as the rates charged on receivables from brokerage clients, and also controls the composition of its investment securities, it has some ability to manage its net interest spread. However, the spread is influenced by external factors such as the interest rate environment and competition. The current low interest rate environment limits the extent to which the Company can reduce interest expense paid on funding sources. To a lesser degree, the Company is sensitive to changes in long-term interest rates through some of its investment portfolios. To mitigate the related risk, the Company may alter the types of investments purchased. For discussion of the impact of current market conditions on net interest revenue, see “Current Market and Regulatory Environment and Other Developments.” The Company’s interest-earning assets are financed primarily by brokerage client cash balances and deposits from banking clients. Non-interest-bearing funding sources include non-interest-bearing brokerage client cash balances, stockholders’ equity, and proceeds from stock-lending activities. Revenue from stock-lending activities is included in other interest revenue. Schwab Bank maintains available for sale and held to maturity investment portfolios for liquidity as well as to invest funds from deposits that are in excess of loans to banking clients and liquidity requirements. Schwab Bank lends funds to banking clients primarily in the form of mortgage loans, HELOCs, and personal loans secured by securities. These loans are largely funded by interest-bearing deposits from banking clients. In clearing their clients’ trades, Schwab and optionsXpress, Inc. hold cash balances payable to clients. In most cases, Schwab and optionsXpress, Inc. pay their clients interest on cash balances awaiting investment, and in turn invest these funds and earn interest revenue. Receivables from brokerage clients consist primarily of margin loans to brokerage clients. Margin loans are loans made to clients on a secured basis to purchase securities. Pursuant to applicable regulations, client cash balances that are not used for margin lending are generally segregated into investment accounts that are maintained for the exclusive benefit of clients, which are recorded in cash and investments segregated on the Company’s consolidated balance sheets. When investing segregated client cash balances, Schwab and optionsXpress, Inc. must adhere to applicable regulations that restrict investments to securities guaranteed by the full faith and credit of the U.S. government, participation

THE CHARLES SCHWAB CORPORATION Management’s Discussion and Analysis of Financial Condition and Results of Operations
(Tabular Amounts in Millions, Except Ratios, or as Noted)
- 24 -
certificates, mortgage-backed securities guaranteed by the Government National Mortgage Association, deposits held at U.S. banks and thrifts, and resale agreements collateralized by qualified securities. Additionally, Schwab and optionsXpress, Inc. have established policies for the minimum credit quality and maximum maturity of these investments. The following table presents net interest revenue information corresponding to interest-earning assets and funding sources on the consolidated balance sheets:
Year Ended December 31, 2013 2012 2011 Interest Average Interest Average Interest Average Average Revenue/ Yield/ Average Revenue/ Yield/ Average Revenue/ Yield/ Balance Expense Rate Balance Expense Rate Balance Expense Rate
Interest-earning assets: Cash and cash equivalents $ 6,943 $ 16 0.23 % $ 7,130 $ 18 0.25 % $ 5,554 $ 13 0.23 % Cash and investments segregated 25,419 35 0.14 % 25,263 46 0.18 % 25,831 39 0.15 % Broker-related receivables (1) 377 - 0.04 % 351 - 0.04 % 310 - 0.05 % Receivables from brokerage clients 11,800 434 3.68 % 10,928 446 4.08 % 10,637 467 4.39 % Securities available for sale (2) 49,114 557 1.13 % 39,745 583 1.47 % 27,486 456 1.66 % Securities held to maturity 24,915 610 2.45 % 15,371 397 2.58 % 16,050 492 3.07 % Loans to banking clients 11,758 329 2.80 % 10,053 309 3.07 % 9,472 310 3.27 % Loans held for sale - - - 18 1 4.12 % 65 3 4.62 %
Total interest-earning assets 130,326 1,981 1.52 % 108,859 1,800 1.65 % 95,405 1,780 1.87 % Other interest revenue 104 114 120 Total interest-earning assets $ 130,326 $ 2,085 1.60 % $ 108,859 $ 1,914 1.76 % $ 95,405 $ 1,900 1.99 %
Funding sources: Deposits from banking clients $ 85,465 $ 31 0.04 % $ 65,546 $ 42 0.06 % $ 52,701 $ 62 0.12 % Payables to brokerage clients 30,258 3 0.01 % 29,831 3 0.01 % 29,992 3 0.01 % Long-term debt 1,751 69 3.94 % 1,934 103 5.33 % 2,004 108 5.39 %
Total interest-bearing liabilities 117,474 103 0.09 % 97,311 148 0.15 % 84,697 173 0.20 % Non-interest-bearing funding sources 12,852 11,548 10,708 Other interest expense 2 2 2 Total funding sources $ 130,326 $ 105 0.08 % $ 108,859 $ 150 0.14 % $ 95,405 $ 175 0.18 % Net interest revenue $ 1,980 1.52 % $ 1,764 1.62 % $ 1,725 1.81 %
(1) Interest revenue was less than $500,000 in the period or periods presented. (2) Amounts have been calculated based on amortized cost.
Net interest revenue increased in 2013 from 2012 primarily due to higher balances of interest-earning assets and higher interest rates on new fixed-rate investments, including securities available for sale and securities held to maturity, partially offset by the effect lower average short-term interest rates and the maturity of short-term interest-earning assets had on the Company’s average net interest margin. The growth in the average balance of deposits from banking clients funded the increase in the balance of securities available for sale and securities held to maturity. Net interest revenue also increased due to the redemption of higher rate trust preferred securities and the exchange of higher rate Senior Notes during the third quarter of 2012. Net interest revenue increased in 2012 from 2011 primarily due to higher balances of interest-earning assets, primarily securities available for sale, partially offset by the effect of low overall interest rates and higher amortization of premiums relating to mortgage-backed securities. Growth in the average balance of deposits from banking clients funded the increase in the balance of securities available for sale. Trading Revenue Trading revenue includes commission and principal transaction revenues. Commission revenue is affected by the number of revenue trades executed and the average revenue earned per revenue trade. Principal transaction revenue is primarily comprised of revenue from trading activity in client fixed income securities. To accommodate clients’ fixed income trading activity, the Company maintains positions in fixed income securities, including state and municipal debt obligations, U.S. Government, corporate debt, and other securities. The difference between the price at which the Company buys and sells securities to and from its clients and other broker-dealers is recognized as principal transaction revenue. Principal transaction

THE CHARLES SCHWAB CORPORATION Management’s Discussion and Analysis of Financial Condition and Results of Operations
(Tabular Amounts in Millions, Except Ratios, or as Noted)
- 25 -
revenue also includes adjustments to the fair value of these securities positions. Factors that influence principal transaction revenue include the volume of client trades and market price volatility. Trading revenue increased by $45 million, or 5%, in 2013 from 2012 primarily due to higher daily average revenue trades and two additional trading days in 2013. Trading revenue decreased by $59 million, or 6%, in 2012 from 2011 primarily due to lower daily average revenue trades, partially offset by the inclusion of optionsXpress’ trading activity for the full year. Daily average revenue trades increased by 4% in 2013 from 2012 primarily due to a higher volume of equity and mutual fund trades, partially offset by a lower volume of future and option trades. Daily average revenue trades decreased by 7% in 2012 from 2011 primarily due to a lower volume of equity and mutual fund trades, partially offset by a higher volume of option and future trades as a result of the inclusion of optionsXpress. Average revenue per revenue trade remained relatively flat from 2011 to 2013.
Growth Rate Year Ended December 31, 2012-2013 2013 2012 2011
Daily average revenue trades (1) (in thousands) 4 % 295.0 282.7 303.8
Clients’ daily average trades (2) (in thousands) 11 % 490.5 440.9 451.1
Number of trading days (3) 1 % 250.5 248.5 251.5
Average revenue per revenue trade - $ 12.31 $ 12.35 $ 12.15
(1) Includes all client trades that generate trading revenue (i.e., commission revenue or principal transaction revenue). (2) Includes daily average revenue trades, trades by clients in asset-based pricing relationships, and all commission-free
trades, including the Company’s Mutual Fund OneSource funds and ETFs, and other proprietary products. Clients’ daily average trades is an indicator of client engagement with securities markets.
(3) October 29 and 30, 2012, were not included as trading days due to weather-related market closures. Other Revenue – Net Other revenue – net includes order flow revenue, nonrecurring gains, software fees from the Company’s portfolio management services, exchange processing fees, realized gains or losses on sales of securities available for sale, and other service fees. Other revenue – net decreased by $20 million, or 8%, in 2013 compared to 2012 primarily due to a non-recurring gain of $70 million relating to a confidential resolution of a vendor dispute in the second quarter of 2012 and realized gains of $35 million from the sales of securities available for sale in 2012, partially offset by an increase in order flow revenue that Schwab began receiving in November 2012. Other revenue – net increased by $96 million, or 60%, in 2012 compared to 2011 primarily due to a non-recurring gain of $70 million relating to a confidential resolution of a vendor dispute mentioned above. In November 2012, the Company began receiving additional order flow rebates from market venues to which client orders are routed for execution. Order flow revenue increased by $23 million due to this revenue and the inclusion of a full year of optionsXpress’ order flow revenue. In December 2012, CSC redeemed the remaining outstanding portion of its 4.950% Senior Notes of $494 million that were due in 2014, which resulted in the payment of a make-whole premium of $31 million that was recorded in other revenue – net. Other revenue – net also included realized gains of $35 million from the sales of securities available for sale. Provision for Loan Losses The provision for loan losses decreased by $17 million in 2013, from $16 million to $(1) million in 2012 and 2013, respectively, primarily due to improved residential real estate mortgage and HELOC credit quality in the Company’s loan portfolio. The provision for loan losses was relatively flat in 2012 from 2011, reflecting stable levels of delinquencies and nonaccrual loans experienced in 2012. Charge-offs were $11 million, $16 million, and $19 million in 2013, 2012, and 2011, respectively. For further discussion on the Company’s credit risk and the allowance for loan losses, see “Risk Management – Credit Risk” and “Item 8 – Financial Statements and Supplementary Data – Notes to Consolidated Financial Statements – 6. Loans to Banking Clients and Related Allowance for Loan Losses.”

THE CHARLES SCHWAB CORPORATION Management’s Discussion and Analysis of Financial Condition and Results of Operations
(Tabular Amounts in Millions, Except Ratios, or as Noted)
- 26 -
Net Impairment Losses on Securities Net impairment losses on securities were $10 million, $32 million, and $31 million in 2013, 2012, and 2011, respectively. These charges were lower in 2013 compared to 2012, reflecting a stabilization of the credit characteristics of certain non-agency residential mortgage-backed securities’ underlying loans. For further discussion, see “Item 8 – Financial Statements and Supplementary Data – Notes to Consolidated Financial Statements – 5. Securities Available for Sale and Securities Held to Maturity.” Expenses Excluding Interest As shown in the table below, expenses excluding interest were higher in 2013 compared to 2012 primarily due to increases in compensation and benefits, professional services, advertising and market development, and other expense. Expenses excluding interest were higher in 2012 compared to 2011, which was primarily due to the inclusion of a full year of optionsXpress’ expenses and amortization of intangible assets relating to the optionsXpress acquisition.
Growth Rate Year Ended December 31, 2012-2013 2013 2012 2011
Compensation and benefits 12 % $ 2,027 $ 1,803 $ 1,732 Professional services 7 % 415 388 387 Occupancy and equipment (1)% 309 311 301 Advertising and market development 7 % 257 241 228 Communications - 220 220 220 Depreciation and amortization 3 % 202 196 155 Class action litigation and regulatory reserve (1) - - - 7 Other 9 % 300 274 269
Total expenses excluding interest 9 % $ 3,730 $ 3,433 $ 3,299 Expenses as a percentage of total net revenues:
Total expenses excluding interest 69 % 70 % 70 % Advertising and market development 5 % 5 % 5 %
(1) Relates to Schwab YieldPlus Fund®.
Compensation and Benefits Compensation and benefits expense includes salaries and wages, incentive compensation, and related employee benefits and taxes. Incentive compensation includes variable compensation, discretionary bonuses, and stock-based compensation. Variable compensation includes payments to certain individuals based on their sales performance. Discretionary bonuses are based on the Company’s overall performance as measured by earnings per common share, and therefore will fluctuate with this measure. Stock-based compensation primarily includes employee and board of director stock options, restricted stock units, and restricted stock awards.

THE CHARLES SCHWAB CORPORATION Management’s Discussion and Analysis of Financial Condition and Results of Operations
(Tabular Amounts in Millions, Except Ratios, or as Noted)
- 27 -
Compensation and benefits expense increased by $224 million, or 12%, in 2013 from 2012, and $471 million, or 4%, in 2012 from 2011, due to increases in salaries and wages, incentive compensation and employee benefits and other expense. The following table shows a comparison of certain compensation and benefits components and employee data:
Growth Rate
Year Ended December 31, 2012-2013 2013 2012 2011
Salaries and wages 6 % $ 1,110 $ 1,043 $ 1,012 Incentive compensation 29 % 599 466 444 Employee benefits and other 8 % 318 294 276
Total compensation and benefits expense 12 % $ 2,027 $ 1,803 $ 1,732
Compensation and benefits expense as a percentage of total net revenues: Salaries and wages 20 % 21 % 22 % Incentive compensation 11 % 10 % 9 % Employee benefits and other 6 % 6 % 6 % Total compensation and benefits expense 37 % 37 % 37 %
Full-time equivalent employees (in thousands) (1) At year end - 13.8 13.8 14.1 Average 1 % 13.9 13.8 13.4
(1) Includes full-time, part-time and temporary employees, and persons employed on a contract basis, and excludes employees of outsourced service providers.
Salaries and wages increased in 2013 from 2012 primarily due to annual salary increases. Incentive compensation increased in 2013 from 2012 primarily due to the transition to a new payout schedule for field incentive plans, increased individual sales performance compensation as a result of higher field sales volume, and increased funding for the corporate bonus plan commensurate with achieving higher earnings per common share. Employee benefits and other expense increased in 2013 from 2012 primarily due to payroll taxes related to the increase in incentive compensation, and increased contributions to new employee HSAs. The Company was converting to HSA-based healthcare and employee enrollment in these plans rose significantly in 2013. Salaries and wages increased in 2012 from 2011 primarily due to an increase in average full-time employees from the inclusion of a full year of optionsXpress’ employees. The increase in salaries and wages was partially offset by a decrease in persons employed on a contract basis. Incentive compensation increased in 2012 from 2011 primarily due to higher variable compensation resulting from product sales performance in the Company’s branch offices. Employee benefits and other expense increased in 2012 from 2011 primarily due to increases in payroll taxes and the Company’s 401(k) plan expense due to increases in average full-time employees and incentive compensation, and an increase in the Company’s deferred compensation plan expense as a result of improvement in the broad equity markets. Expenses Excluding Compensation and Benefits Professional services expense increased in 2013 from 2012 primarily due to an increase in fees paid to outsourced service providers and consultants and higher spending on printing and fulfillment services. Professional services expense was relatively flat in 2012 compared to 2011. Occupancy and equipment expense was relatively flat in 2013 compared to 2012. Occupancy and equipment expense increased in 2012 from 2011 primarily due to an increase in software maintenance expense relating to the Company’s information technology systems. Advertising and market development expense increased in 2013 from 2012 primarily due to higher spending on media relating to the launch of the Company’s new advertising and branding initiative, Own your tomorrowTM. Advertising and market development expense increased in 2012 from 2011 primarily due to the inclusion of a full year of optionsXpress’ expenses, which includes media, and the Company’s increased spending on customer promotions.

THE CHARLES SCHWAB CORPORATION Management’s Discussion and Analysis of Financial Condition and Results of Operations
(Tabular Amounts in Millions, Except Ratios, or as Noted)
- 28 -
Depreciation and amortization expense was relatively flat in 2013 compared to 2012. Depreciation and amortization expense increased in 2012 from 2011 primarily due to the amortization of intangible assets relating to the optionsXpress acquisition. Other expense increased in 2013 from 2012 primarily due to an increase in regulatory assessments. Other expense was relatively flat in 2012 compared to 2011. Taxes on Income The Company’s effective income tax rate on income before taxes was 37.2% in 2013, 36.0% in 2012, and 37.9% in 2011. The increase in 2013 from 2012 was primarily due to the impact of a non-recurring state tax benefit of $20 million in 2012, partially offset by the recognition of an additional state tax benefit of $4 million in 2013. The decrease in 2012 from 2011 was primarily due to the recognition of the non-recurring state tax benefit discussed above. Segment Information The Company provides financial services to individuals and institutional clients through two segments – Investor Services and Advisor Services. The Investor Services segment provides retail brokerage and banking services to individual investors, retirement plan services, and corporate brokerage services. The Advisor Services segment provides custodial, trading, and support services to independent investment advisors, and retirement business services to independent retirement plan advisors and recordkeepers whose plan assets are held at Schwab Bank. Banking revenues and expenses are allocated to the Company’s two segments based on which segment services the client. The Company evaluates the performance of its segments on a pre-tax basis, excluding items such as significant nonrecurring gains, impairment charges on non-financial assets, discontinued operations, extraordinary items, and significant restructuring and other charges. Segment assets and liabilities are not used for evaluating segment performance or in deciding how to allocate resources to segments.
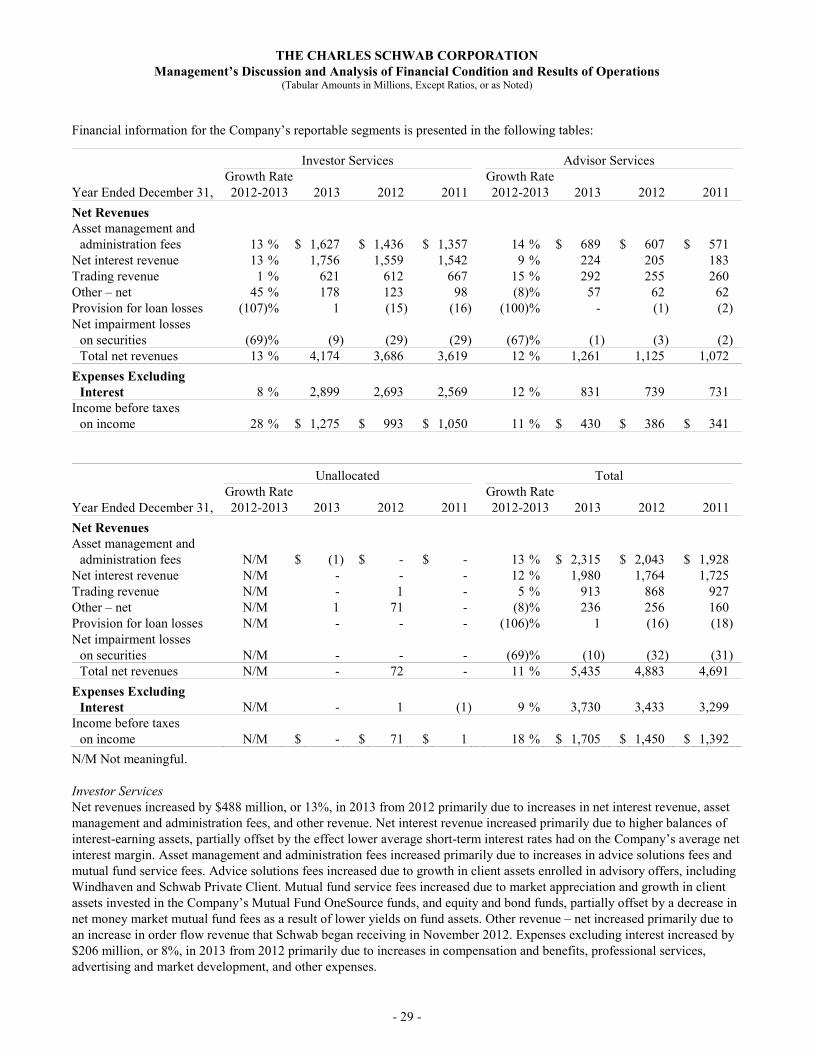
THE CHARLES SCHWAB CORPORATION Management’s Discussion and Analysis of Financial Condition and Results of Operations
(Tabular Amounts in Millions, Except Ratios, or as Noted)
- 29 -
Financial information for the Company’s reportable segments is presented in the following tables:
Investor Services Advisor Services Growth Rate Growth Rate Year Ended December 31, 2012-2013 2013 2012 2011 2012-2013 2013 2012 2011
Net Revenues Asset management and
administration fees 13 % $ 1,627 $ 1,436 $ 1,357 14 % $ 689 $ 607 $ 571Net interest revenue 13 % 1,756 1,559 1,542 9 % 224 205 183Trading revenue 1 % 621 612 667 15 % 292 255 260Other – net 45 % 178 123 98 (8)% 57 62 62Provision for loan losses (107) % 1 (15) (16) (100)% - (1) (2)Net impairment losses
on securities (69) % (9) (29) (29) (67)% (1) (3) (2)Total net revenues 13 % 4,174 3,686 3,619 12 % 1,261 1,125 1,072
Expenses Excluding Interest 8 % 2,899 2,693 2,569 12 % 831 739 731
Income before taxes on income 28 % $ 1,275 $ 993 $ 1,050 11 % $ 430 $ 386 $ 341
Unallocated Total Growth Rate Growth Rate Year Ended December 31, 2012-2013 2013 2012 2011 2012-2013 2013 2012 2011
Net Revenues Asset management and
administration fees N/M $ (1) $ - $ - 13 % $ 2,315 $ 2,043 $ 1,928Net interest revenue N/M - - - 12 % 1,980 1,764 1,725Trading revenue N/M - 1 - 5 % 913 868 927Other – net N/M 1 71 - (8)% 236 256 160Provision for loan losses N/M - - - (106)% 1 (16) (18)Net impairment losses
on securities N/M - - - (69)% (10) (32) (31)Total net revenues N/M - 72 - 11 % 5,435 4,883 4,691
Expenses Excluding Interest N/M - 1 (1) 9 % 3,730 3,433 3,299
Income before taxes on income N/M $ - $ 71 $ 1 18 % $ 1,705 $ 1,450 $ 1,392
N/M Not meaningful. Investor Services Net revenues increased by $488 million, or 13%, in 2013 from 2012 primarily due to increases in net interest revenue, asset management and administration fees, and other revenue. Net interest revenue increased primarily due to higher balances of interest-earning assets, partially offset by the effect lower average short-term interest rates had on the Company’s average net interest margin. Asset management and administration fees increased primarily due to increases in advice solutions fees and mutual fund service fees. Advice solutions fees increased due to growth in client assets enrolled in advisory offers, including Windhaven and Schwab Private Client. Mutual fund service fees increased due to market appreciation and growth in client assets invested in the Company’s Mutual Fund OneSource funds, and equity and bond funds, partially offset by a decrease in net money market mutual fund fees as a result of lower yields on fund assets. Other revenue – net increased primarily due to an increase in order flow revenue that Schwab began receiving in November 2012. Expenses excluding interest increased by $206 million, or 8%, in 2013 from 2012 primarily due to increases in compensation and benefits, professional services, advertising and market development, and other expenses.

THE CHARLES SCHWAB CORPORATION Management’s Discussion and Analysis of Financial Condition and Results of Operations
(Tabular Amounts in Millions, Except Ratios, or as Noted)
- 30 -
Net revenues were relatively flat in 2012 compared to 2011 as the increases in asset management and administration fees, net interest revenue, and other revenue – net were largely offset by a decrease in trading revenue. Asset management and administration fees increased primarily due to an increase in advice solutions fees relating to Windhaven, partially offset by a decrease in net money market mutual fund fees. Net interest revenue increased primarily due to higher average balances of interest-earning assets, partially offset by the effect of low overall interest rates and higher amortization of premiums relating to mortgage-backed securities. Other revenue – net increased primarily due to the inclusion of a full year of optionsXpress’ order flow revenue and other fees. Trading revenue decreased primarily due to lower daily average revenue trades, partially offset by the inclusion of optionsXpress’ trading activity for the full year. Expenses excluding interest increased by $124 million, or 5%, in 2012 from 2011 primarily due to the inclusion of a full year of optionsXpress’ compensation and benefits, depreciation and amortization, and advertising and market development expenses. Advisor Services Net revenues increased by $136 million, or 12%, in 2013 from 2012 primarily due to increases in asset management and administration fees, trading revenue, and net interest revenue. Asset management and administration fees increased primarily due to increases in mutual fund service fees and advice solutions fees. Mutual fund service fees increased due to market appreciation and growth in client assets invested in the Company’s Mutual Fund OneSource funds, and equity and bond funds. Advice solutions fees increased due to growth in client assets enrolled in advisory offers. Trading revenue increased primarily due to higher daily average revenue trades and two additional trading days in 2013. Net interest revenue increased primarily due to higher balances of interest-earning assets, partially offset by the effect lower average short-term interest rates had on the Company’s average net interest margin. Expenses excluding interest increased by $92 million, or 12%, in 2013 from 2012 primarily due to increases in compensation and benefits, professional services, advertising and market development expenses, and other expenses. Net revenues increased by $53 million, or 5%, in 2012 from 2011 primarily due to increases in asset management and administration fees and net interest revenue, partially offset by a decrease in trading revenue. Asset management and administration fees increased primarily due to an increase in third-party mutual fund service fees. Net interest revenue increased primarily due to higher average balances of interest-earning assets, partially offset by the effect of low overall interest rates and higher amortization of premiums relating to mortgage-backed securities. Trading revenue decreased primarily due to lower daily average revenue trades. Expenses excluding interest were relatively flat in 2012 compared to 2011. Unallocated Other revenue – net in 2012 includes a non-recurring gain of $70 million relating to a confidential resolution of a vendor dispute. LIQUIDITY AND CAPITAL RESOURCES CSC conducts substantially all of its business through its wholly-owned subsidiaries. The Company’s capital structure is designed to provide each subsidiary with capital and liquidity to meet its operational needs and regulatory requirements. CSC is a savings and loan holding company and Schwab Bank, CSC’s depository institution, is a federal savings bank. CSC is subject to supervision and regulation by the Federal Reserve and Schwab Bank is subject to supervision and regulation by the OCC. Liquidity CSC CSC’s liquidity needs arise from funding its subsidiaries’ operations, including margin and mortgage lending, and transaction settlement, in addition to funding cash dividends, acquisitions, investments, short- and long-term debt, and managing statutory capital requirements.

THE CHARLES SCHWAB CORPORATION Management’s Discussion and Analysis of Financial Condition and Results of Operations
(Tabular Amounts in Millions, Except Ratios, or as Noted)
- 31 -
CSC’s liquidity needs are generally met through cash generated by its subsidiaries, as well as cash provided by external financing. CSC has a universal automatic shelf registration statement (Shelf Registration Statement) on file with the SEC which enables CSC to issue debt, equity, and other securities. CSC maintains excess liquidity in the form of overnight cash deposits and short-term investments to cover daily funding needs and to support growth in the Company’s business. Generally, CSC does not hold liquidity at its subsidiaries in excess of amounts deemed sufficient to support the subsidiaries’ operations, including any regulatory capital requirements. Schwab, Schwab Bank, and optionsXpress, Inc. are subject to regulatory requirements that may restrict them from certain transactions with CSC, as further discussed below. Management believes that funds generated by the operations of CSC’s subsidiaries will continue to be the primary funding source in meeting CSC’s liquidity needs, providing adequate liquidity to meet Schwab Bank’s capital guidelines, and maintaining Schwab and optionsXpress, Inc.’s net capital. On July 25, 2013, CSC issued $275 million of Senior Notes that mature in 2018 under its Shelf Registration Statement. The Senior Notes have a fixed interest rate of 2.20% with interest payable semi-annually. While CSC is not currently subject to specific statutory capital requirements, CSC is required to serve as a source of strength for Schwab Bank and must have the ability to provide financial assistance if Schwab Bank experiences financial distress. To manage capital adequacy, the Company currently utilizes a target Tier 1 Leverage Ratio for CSC, as currently defined by the Federal Reserve, of at least 6%. At December 31, 2013, CSC’s Tier 1 Leverage Ratio was 6.4%, Tier 1 Capital Ratio was 16.7%, and Total Capital Ratio was 16.8%. The following are details of CSC’s long-term debt:
Par Standard December 31, 2013 Outstanding Maturity Interest Rate Moody’s & Poor’s Fitch
Senior Notes $ 1,581 2015 – 2022 0.850% to 4.45% fixed A2 A A Medium Term Notes $ 250 2017 6.375% fixed A2 A A CSC has authorization from its Board of Directors to issue unsecured commercial paper notes (Commercial Paper Notes) not to exceed $1.5 billion. Management has set a current limit for the commercial paper program of $800 million. The maturities of the Commercial Paper Notes may vary, but are not to exceed 270 days from the date of issue. The commercial paper is not redeemable prior to maturity and cannot be voluntarily prepaid. The proceeds of the commercial paper program are to be used for general corporate purposes. There were no borrowings of Commercial Paper Notes outstanding at December 31, 2013. CSC’s ratings for these short-term borrowings are P1 by Moody’s, A1 by Standard & Poor’s, and F1 by Fitch. CSC maintains an $800 million committed, unsecured credit facility with a group of 12 banks, which is scheduled to expire in June 2014. This facility replaced a similar facility that expired in June 2013 and both facilities were unused in 2013. The funds under this facility are available for general corporate purposes. The financial covenants under this facility require Schwab to maintain a minimum net capital ratio, as defined, Schwab Bank to be well capitalized, as defined, and CSC to maintain a minimum level of stockholders’ equity. At December 31, 2013, the minimum level of stockholders’ equity required under this facility was $7.1 billion (CSC’s stockholders’ equity at December 31, 2013, was $10.4 billion). Management believes that these restrictions will not have a material effect on CSC’s ability to meet foreseeable dividend or funding requirements. CSC also has direct access to $647 million of the $942 million uncommitted, unsecured bank credit lines discussed below, that are primarily utilized by Schwab to manage short-term liquidity. These lines were not used by CSC during 2013. In addition, Schwab provides CSC with a $1.0 billion credit facility, which is scheduled to expire in December 2014. There were no funds drawn under this facility at December 31, 2013.

THE CHARLES SCHWAB CORPORATION Management’s Discussion and Analysis of Financial Condition and Results of Operations
(Tabular Amounts in Millions, Except Ratios, or as Noted)
- 32 -
Schwab Schwab’s liquidity needs relating to client trading and margin borrowing activities are met primarily through cash balances in brokerage client accounts, which were $33.2 billion and $37.4 billion at December 31, 2013 and 2012, respectively. Management believes that brokerage client cash balances and operating earnings will continue to be the primary sources of liquidity for Schwab. Schwab is subject to regulatory requirements of Rule 15c3-1 under the Securities Exchange Act of 1934 (the Uniform Net Capital Rule) that are intended to ensure the general financial soundness and liquidity of broker-dealers. These regulations prohibit Schwab from repaying subordinated borrowings from CSC, paying cash dividends, or making unsecured advances or loans to its parent company or employees if such payment would result in a net capital amount of less than 5% of aggregate debit balances or less than 120% of its minimum dollar requirement of $250,000. At December 31, 2013, Schwab’s net capital was $1.4 billion (10% of aggregate debit balances), which was $1.2 billion in excess of its minimum required net capital and $707 million in excess of 5% of aggregate debit balances. Schwab is also subject to Rule 15c3-3 under the Securities Exchange Act of 1934 and other applicable regulations that require it to maintain cash or qualified securities in a segregated reserve account for the exclusive benefit of clients. These funds are included in cash and investments segregated and on deposit for regulatory purposes in the Company’s consolidated balance sheets and are not available as a general source of liquidity. Most of Schwab’s assets are readily convertible to cash, consisting primarily of short-term (i.e., less than 150 days) investment-grade, interest-earning investments (the majority of which are segregated for the exclusive benefit of clients pursuant to regulatory requirements), receivables from brokerage clients, and receivables from brokers, dealers, and clearing organizations. Client margin loans are demand loan obligations secured by readily marketable securities. Receivables from and payables to brokers, dealers, and clearing organizations primarily represent current open transactions, which usually settle, or can be closed out, within a few business days. Schwab has a finance lease obligation related to an office building and land under a 20-year lease. The remaining finance lease obligation of $89 million at December 31, 2013, is being reduced by a portion of the lease payments over the remaining lease term of 11 years. To manage short-term liquidity, Schwab maintains uncommitted, unsecured bank credit lines with a group of six banks totaling $942 million at December 31, 2013. The need for short-term borrowings arises primarily from timing differences between cash flow requirements, scheduled liquidation of interest-earnings investments, and movements of cash to meet regulatory brokerage client cash segregation requirements. Schwab used such borrowings for ten days in 2013, with average daily amounts borrowed of $64 million. There were no borrowings outstanding under these lines at December 31, 2013. To partially satisfy the margin requirement of client option transactions with the Options Clearing Corporation, Schwab has unsecured standby letter of credit agreements (LOCs) with five banks in favor of the Options Clearing Corporation aggregating $225 million at December 31, 2013. There were no funds drawn under any of these LOCs during 2013. In connection with its securities lending activities, Schwab is required to provide collateral to certain brokerage clients. Schwab satisfies the collateral requirements by providing cash as collateral. To manage Schwab’s regulatory capital requirement, CSC provides Schwab with a $1.4 billion subordinated revolving credit facility, which is scheduled to expire in March 2014. Schwab plans to renew this facility when it expires. The amount outstanding under this facility at December 31, 2013, was $315 million. Borrowings under this subordinated lending arrangement qualify as regulatory capital for Schwab. In addition, CSC provides Schwab with a $2.5 billion credit facility, which is scheduled to expire in December 2014. Borrowings under this facility do not qualify as regulatory capital for Schwab. The amount outstanding under this facility at December 31, 2013, was $605 million.

THE CHARLES SCHWAB CORPORATION Management’s Discussion and Analysis of Financial Condition and Results of Operations
(Tabular Amounts in Millions, Except Ratios, or as Noted)
- 33 -
Schwab Bank Schwab Bank’s liquidity needs are met through deposits from banking clients and equity capital. Deposits from banking clients at December 31, 2013 were $93.0 billion, which includes the excess cash held in certain Schwab and optionsXpress, Inc. brokerage accounts that is swept into deposit accounts at Schwab Bank. At December 31, 2013, these balances totaled $72.2 billion. Schwab Bank is subject to regulatory requirements that restrict and govern the terms of affiliate transactions, such as extensions of credit and repayment of loans between Schwab Bank and CSC or CSC’s other subsidiaries. In addition, Schwab Bank is required to provide notice to and may be required to obtain approval of the OCC and the Federal Reserve to declare dividends to CSC. Schwab Bank is required to maintain capital levels as specified in federal banking laws and regulations. Failure to meet the minimum levels could result in certain mandatory, and possibly additional discretionary actions by the regulators that, if undertaken, could have a direct material effect on Schwab Bank. The Company currently utilizes a target Tier 1 Leverage Ratio for Schwab Bank of at least 6.25%. Based on its regulatory capital ratios at December 31, 2013, Schwab Bank is considered well capitalized. Schwab Bank’s regulatory capital and ratios are as follows:
Minimum to be Minimum Capital Actual Well Capitalized Requirement December 31, 2013 Amount Ratio Amount Ratio Amount Ratio
Tier 1 Risk-Based Capital $ 6,550 19.0 % $ 2,074 6.0 % $ 1,383 4.0 % Total Risk-Based Capital $ 6,599 19.1 % $ 3,457 10.0 % $ 2,766 8.0 % Tier 1 Leverage $ 6,550 6.6 % $ 4,993 5.0 % $ 3,994 4.0 % Tangible Equity $ 6,550 6.6 % N/A $ 1,997 2.0 %
N/A Not applicable. Schwab Bank has access to traditional funding sources such as deposits, federal funds purchased, and repurchase agreements. Additionally, Schwab Bank has access to short-term funding through the Federal Reserve Bank (FRB) discount window. Amounts available under the FRB discount window are dependent on the fair value of certain of Schwab Bank’s securities available for sale and/or securities held to maturity that are pledged as collateral to the FRB. Schwab Bank maintains policies and procedures necessary to access this funding and tests discount window borrowing procedures annually. At December 31, 2013, $2.6 billion was available under this arrangement. There were no funds drawn under this arrangement during 2013. Schwab Bank maintains a credit facility with the Federal Home Loan Bank System. Amounts available under this facility are dependent on the amount of Schwab Bank’s residential real estate mortgages and HELOCs that are pledged as collateral. Schwab Bank maintains policies and procedures necessary to access this funding and tests borrowing procedures annually. At December 31, 2013, $6.8 billion was available under this facility. There were no funds drawn under this facility during 2013. optionsXpress, Inc. optionsXpress, Inc.’s liquidity needs relating to client trading and margin borrowing activities are met primarily through cash balances in brokerage client accounts, which were $1.1 billion at December 31, 2013. Management believes that brokerage client cash balances and operating earnings will continue to be the primary sources of liquidity for optionsXpress, Inc. optionsXpress, Inc., is subject to regulatory requirements of the Uniform Net Capital Rule that are intended to ensure the general financial soundness and liquidity of broker-dealers. These regulations prohibit optionsXpress, Inc. from paying cash dividends or making unsecured advances or loans to its parent company or employees if such payment would result in a net capital amount of less than 5% of aggregate debit balances or less than 120% of its minimum dollar requirement of $250,000. At December 31, 2013, optionsXpress Inc.’s net capital was $102 million (36% of aggregate debit balances), which was $96 million in excess of its minimum required net capital and $88 million in excess of 5% of aggregate debit balances.

THE CHARLES SCHWAB CORPORATION Management’s Discussion and Analysis of Financial Condition and Results of Operations
(Tabular Amounts in Millions, Except Ratios, or as Noted)
- 34 -
optionsXpress, Inc. is also subject to Commodity Futures Trading Commission Regulation 1.17 (Reg. 1.17) under the Commodity Exchange Act, which also requires the maintenance of minimum net capital. optionsXpress, Inc. as a futures commission merchant, is required to maintain minimum net capital equal to the greater of its net capital requirement under Reg. 1.17 ($1 million), or the sum of 8% of the total risk margin requirements for all positions carried in customer accounts and 8% of the total risk margin requirements for all positions carried in non-customer accounts (as defined in Reg. 1.17). At December 31, 2013, optionsXpress, Inc. met the requirements of Reg. 1.17. Additionally, optionsXpress, Inc. is subject to Rule 15c3-3 under the Securities Exchange Act of 1934 and other applicable regulations that require it to maintain cash or qualified securities in a segregated reserve account for the exclusive benefit of clients. These funds are included in cash and investments segregated and on deposit for regulatory purposes in the Company’s consolidated balance sheets and are not available as a general source of liquidity. To partially satisfy the margin requirement of client option transactions with the Options Clearing Corporation, optionsXpress, Inc. has an unsecured standby LOC with one bank in favor of the Options Clearing Corporation in the amount of $15 million at December 31, 2013. There were no funds drawn under this LOC during 2013. CSC provides optionsXpress, Inc. with a $200 million credit facility, which is scheduled to expire in December 2014. The amount outstanding under this facility at December 31, 2013, was $25 million. Borrowings under this facility do not qualify as regulatory capital for optionsXpress, Inc. optionsXpress Holdings, Inc., optionsXpress, Inc.’s parent company, has a term loan with CSC, of which $35 million was outstanding at December 31, 2013, and it matures in December 2017. Capital Resources The Company monitors both the relative composition and absolute level of its capital structure. Management is focused on optimizing the Company’s use of capital and currently targets a long-term debt to total financial capital ratio not to exceed 30%. The Company’s total financial capital (long-term debt plus stockholders’ equity) at December 31, 2013 was $12.3 billion, up $1.1 billion, or 9%, from December 31, 2012. The Company’s cash position (reported as cash and cash equivalents on its consolidated balance sheets) and cash flows are affected by changes in brokerage client cash balances and the associated amounts required to be segregated under regulatory guidelines. Timing differences between cash and investments actually segregated on a given date and the amount required to be segregated for that date may arise in the ordinary course of business and are addressed by the Company in accordance with applicable regulations. Other factors which affect the Company’s cash position and cash flows include investment activity in security portfolios, levels of capital expenditures, acquisition and divestiture activity, banking client deposit activity, brokerage and banking client loan activity, financing activity in long-term debt, payments of dividends, and repurchases and issuances of CSC’s preferred and common stock. The combination of these factors can cause significant fluctuations in the cash position during specific time periods. Long-term Debt At December 31, 2013, the Company had long-term debt of $1.9 billion, or 15% of total financial capital, that bears interest at a weighted-average rate of 3.61%. At December 31, 2012, the Company had long-term debt of $1.6 billion, or 15% of total financial capital. On July 25, 2013, CSC issued $275 million of Senior Notes that mature in 2018 under its Shelf Registration Statement. The Senior Notes have a fixed interest rate of 2.20% with interest payable semi-annually. The Company repaid $6 million of other long-term debt in 2013. For further discussion of the Company’s long-term debt, see “Liquidity and Capital Resources – Liquidity” and “Item 8 – Financial Statements and Supplementary Data – Notes to Consolidated Financial Statements – 13. Borrowings.”

THE CHARLES SCHWAB CORPORATION Management’s Discussion and Analysis of Financial Condition and Results of Operations
(Tabular Amounts in Millions, Except Ratios, or as Noted)
- 35 -
Capital Expenditures The Company’s capital expenditures were $270 million (5% of net revenues) and $138 million (3% of net revenues) in 2013 and 2012, respectively. Capital expenditures in 2013 were primarily for buildings and land, capitalized costs for developing internal-use software, and software and equipment relating to the Company’s information technology systems. Capital expenditures in 2012 were primarily for capitalized costs for developing internal-use software, software and equipment relating to the Company’s information technology systems, and leasehold improvements. Capitalized costs for developing internal-use software were $74 million and $61 million in 2013 and 2012, respectively. Management currently anticipates that 2014 capital expenditures will be approximately 20% higher than 2013 primarily due to increased spending on buildings and land, furniture and equipment, and leasehold improvements. A majority of this planned increase is related to the continued consolidation and relocation of the Company’s existing office campus in Denver, Colorado. As in recent years, the Company adjusts its capital expenditures periodically as business conditions change. Management believes that funds generated by its operations will continue to be the primary funding source of its capital expenditures. Equity Offerings In January 2012, the Company issued and sold 400,000 shares of fixed-to-floating rate (currently fixed at 7.000%) non-cumulative perpetual preferred stock, Series A, with a liquidation preference of $1,000 per share for net proceeds of $394 million (Series A Preferred Stock). In June 2012, the Company issued and sold 485,000 shares of 6.00% non-cumulative perpetual preferred stock, Series B, with a liquidation preference of $1,000 per share for net proceeds of $469 million (Series B Preferred Stock). Net proceeds received from these sales were used for general corporate purposes. For further discussion of these equity offerings, see “Item 8 – Financial Statements and Supplementary Data – Notes to Consolidated Financial Statements – 17. Stockholders’ Equity.” Dividends CSC paid common stock cash dividends of $311 million ($0.24 per share) and $308 million ($0.24 per share) in 2013 and 2012, respectively. Since the initial dividend in 1989, CSC has paid 99 consecutive quarterly dividends and has increased the quarterly dividend rate 19 times, resulting in a 22% compounded annual growth rate, excluding the special cash dividend of $1.00 per common share in 2007. While the payment and amount of dividends are at the discretion of the Board of Directors, subject to certain regulatory and other restrictions, the Company currently targets its common stock cash dividend at approximately 20% to 30% of net income. CSC paid Series A Preferred Stock cash dividends of $28 million ($70.00 per share) and $14 million ($36.17 per share) in 2013 and 2012, respectively. CSC paid Series B Preferred Stock cash dividends of $29 million ($60.00 per share) and $14 million ($29.17 per share) in 2013 and 2012, respectively. Share Repurchases There were no repurchases of CSC’s common stock in 2013 or 2012. As of December 31, 2013, CSC had remaining authority from the Board of Directors to repurchase up to $596 million of its common stock, which does not have an expiration date. Business Acquisitions On December 14, 2012, the Company acquired ThomasPartners, Inc., a growth and dividend income-focused asset management firm, for $85 million in cash. On September 1, 2011, the Company acquired optionsXpress, an online brokerage firm primarily focused on equity option securities and futures, for total consideration of $714 million. Under the terms of the merger agreement, optionsXpress stockholders received 1.02 shares of the Company’s common stock for each share of optionsXpress stock. As a result, the

THE CHARLES SCHWAB CORPORATION Management’s Discussion and Analysis of Financial Condition and Results of Operations
(Tabular Amounts in Millions, Except Ratios, or as Noted)
- 36 -
Company issued 59 million shares of the Company’s common stock valued at $710 million, based on the closing price of the Company’s common stock on September 1, 2011. The Company also assumed optionsXpress’ stock-based compensation awards valued at $4 million. For more information on these acquisitions, see “Item 8 – Financial Statements and Supplementary Data – Notes to Consolidated Financial Statements – 24. Business Acquisitions.” Off-Balance Sheet Arrangements The Company enters into various off-balance sheet arrangements in the ordinary course of business, primarily to meet the needs of its clients. These arrangements include firm commitments to extend credit. Additionally, the Company enters into guarantees and other similar arrangements as part of transactions in the ordinary course of business. For information on each of these arrangements, see “Item 8 – Financial Statements and Supplementary Data – Notes to Consolidated Financial Statements – 14. Commitments and Contingencies. and “Item 8 – Financial Statements and Supplementary Data – Notes to Consolidated Financial Statements – 15. Financial Instruments Subject to Off-Balance Sheet Credit Risk or Concentration Risk.” Contractual Obligations The Company’s principal contractual obligations as of December 31, 2013, are shown in the following table. Management believes that funds generated by its continuing operations, as well as cash provided by external financing, will continue to be the primary funding sources in meeting these obligations. Excluded from this table are liabilities recorded on the consolidated balance sheet that are generally short-term in nature (e.g., payables to brokers, dealers, and clearing organizations) or without contractual payment terms (e.g., deposits from banking clients, payables to brokerage clients, and deferred compensation).
Less than 1-3 3-5 More than 1 Year Years Years 5 Years Total
Credit-related financial instruments (1) $ 732 $ 1,054 $ 1,967 $ 2,269 $ 6,022 Long-term debt (2) 64 476 632 1,051 2,223 Leases (3) 100 156 113 158 527 Purchase obligations (4) 233 172 9 1 415
Total $ 1,129 $ 1,858 $ 2,721 $ 3,479 $ 9,187
(1) Represents Schwab Bank’s commitments to extend credit to banking clients and purchase mortgage loans.
(2) Includes estimated future interest payments through 2017 for Medium-Term Notes and through 2022 for Senior Notes. Amounts exclude maturities under a finance lease obligation and unamortized discounts and premiums.
(3) Represents minimum rental commitments, net of sublease commitments, and includes facilities under the Company’s past restructuring initiatives and rental commitments under a finance lease obligation.
(4) Consists of purchase obligations for services such as advertising and marketing, telecommunications, professional services, and hardware- and software-related agreements. Includes purchase obligations that can be canceled by the Company without penalty.

THE CHARLES SCHWAB CORPORATION Management’s Discussion and Analysis of Financial Condition and Results of Operations
(Tabular Amounts in Millions, Except Ratios, or as Noted)
- 37 -
RISK MANAGEMENT The Company’s business activities expose it to a variety of risks, including operational, credit, market, liquidity, compliance and legal risk. The Company has a comprehensive risk management program to identify and manage these risks and their associated potential for financial and reputational impact. Despite the Company’s efforts to identify areas of risk and implement risk management policies and procedures, there can be no assurance that the Company will not suffer unexpected losses due to these risks. The Company’s risk management process is comprised of risk identification and assessment, risk measurement, risk monitoring and reporting and risk mitigation. The activities and organizations that comprise the risk management process are described below. Risk Culture The Company’s Board of Directors sets the tone for effective risk management and has approved an Enterprise Risk Management (ERM) Framework commensurate with the size, risk profile, complexity, and continuing growth of the Company. The ERM Framework and governance structure constitute a comprehensive approach to managing risks encountered by the Company in its business activities. Risk appetite, which is defined as the amount of risk the Company is willing to accept in pursuit of its corporate strategy, is set by executive management and approved by the Board of Directors. The Company has established risk metrics and reporting that enable the measurement of the impact of strategy execution against risk appetite. The risk metrics, with risk limits and tolerance levels, are established for key risk categories by the Global Risk Committee and its functional risk sub-committees. Risk Governance Senior management takes an active role in the risk management process and has developed policies and procedures under which specific business and control units are responsible for identifying, measuring and controlling risks. The Global Risk Committee, which is comprised of senior executives from each major business and control function, is responsible for the oversight of risk management. This includes identifying emerging risks, assessing risk management practices and the control environment, reinforcing business accountability for risk management, supervisory controls and regulatory compliance, supporting resource prioritization across the Company, and escalating significant issues to the Board of Directors. The Global Risk Committee reports regularly to the Risk Committee of the Board of Directors. The Risk Committee assists the Board of Directors in fulfilling its oversight responsibilities with respect to the Company’s risk management program, including approving risk appetite statements and reviewing reports relating to risk issues from functional areas of risk management, legal, compliance, and internal audit. Functional risk sub-committees focusing on specific areas of risk report into the Global Risk Committee. These sub-committees include the:
Asset-Liability Management and Pricing Committee, which establishes strategies and policies for the management of corporate capital, liquidity, interest rate risk, and investments;
Credit and Market Risk Oversight Committee, which provides oversight of and approves credit and market risk policies, limits, and exposures in loan, investment, and positioning portfolios;
New Products and Services Risk Oversight Committee, which provides oversight of, and approves corporate policy and procedures relating to the risk governance of new products and services; and the
Operational Risk Oversight Committee, which provides oversight of and approves operational risk management policies, risk tolerance levels, and operational risk governance processes, and includes the following sub-committees:
o Information Security and Privacy Sub-Committee, which provides oversight of the information security and privacy programs and policies;

THE CHARLES SCHWAB CORPORATION Management’s Discussion and Analysis of Financial Condition and Results of Operations
(Tabular Amounts in Millions, Except Ratios, or as Noted)
- 38 -
o Model Governance Sub-Committee, which provides oversight of model risk throughout the Company; and the
o Vendor Management Sub-Committee, which provides oversight of the Company’s vendor management and outsourcing program and policies.
The Company’s compliance, finance, internal audit, legal, and corporate risk management departments assist management and the various risk committees in evaluating, testing, and monitoring the Company’s risk management. In addition, the Company’s Disclosure Committee is responsible for monitoring and evaluating the effectiveness of the Company’s (a) disclosure controls and procedures and (b) internal control over financial reporting as of the end of each fiscal quarter. The Disclosure Committee reports on this evaluation to the CEO and CFO prior to their certification required by Sections 302 and 906 of the Sarbanes Oxley Act of 2002. Operational Risk Operational risks arise due to potentially inadequate or failed internal processes, people, and systems or from external events and relationships impacting the Company and/or any of its key business partners and vendors. Operational risk includes model and fiduciary risk, and each is also described in detail below. The Company’s operations are highly dependent on the integrity of its technology systems and the Company’s success depends, in part, on its ability to make timely enhancements and additions to its technology in anticipation of evolving client needs. To the extent the Company experiences system interruptions, errors or downtime (which could result from a variety of causes, including changes in client use patterns, technological failure, changes to its systems, linkages with third-party systems, and power failures), the Company’s business and operations could be significantly negatively impacted. To minimize business interruptions, Schwab has two data centers intended, in part, to further improve the recovery of business processing in the event of an emergency. The Company is committed to an ongoing process of upgrading, enhancing, and testing its technology systems. This effort is focused on meeting client needs, meeting market and regulatory changes, and deploying standardized technology platforms. Operational risk also includes the risk of human error, employee misconduct, external fraud, computer viruses, distributed denial of service attacks, terrorist attacks, and natural disaster. Employee misconduct could include fraud and misappropriation of client or Company assets, improper use or disclosure of confidential client or Company information, and unauthorized activities, such as transactions exceeding acceptable risks or authorized limits. External fraud includes misappropriation of client or Company assets by third parties, including through unauthorized access to Company systems and data and client accounts. The frequency and sophistication of such fraud attempts continue to increase. Operational risk is mitigated through a system of internal controls and risk management practices that are designed to keep operational risk and operational losses at levels appropriate to the inherent risk of the business in which the Company operates. The Company has specific policies and procedures to identify and manage operational risk, and uses periodic risk self-assessments and internal audit reviews to evaluate the effectiveness of these internal controls. The Company maintains backup and recovery functions, including facilities for backup and communications, and conducts periodic testing of disaster recovery plans. The Company also maintains policies and procedures and technology to protect against fraud and unauthorized access to systems and data. Despite the Company’s risk management efforts, it is not always possible to deter or prevent technological or operational failure, or fraud or other misconduct, and the precautions taken by the Company may not be effective in all cases. The Company may be subject to litigation, losses, and regulatory actions in such cases, and may be required to expend significant additional resources to remediate vulnerabilities or other exposures. The Company also faces operational risk when it employs the services of various external vendors, including domestic and international outsourcing of certain technology, processing, servicing, and support functions. The Company manages its exposure to external vendor risk through contractual provisions, control standards, and ongoing monitoring of vendor performance. The Company maintains policies and procedures regarding the standard of care expected with Company data,

THE CHARLES SCHWAB CORPORATION Management’s Discussion and Analysis of Financial Condition and Results of Operations
(Tabular Amounts in Millions, Except Ratios, or as Noted)
- 39 -
whether the data is internal company information, employee information, or non-public client information. The Company clearly defines for employees, contractors, and vendors the Company’s expected standards of care for confidential data. Regular training is provided by the Company in regard to data security. The Company is actively engaged in the research and development of new technologies, services, and products. The Company endeavors to protect its research and development efforts, and its brands, through the use of copyrights, patents, trade secrets, and contracts. Model Risk Model risk is the potential for adverse consequences from decisions based on incorrect or misused model outputs and reports. Models are owned by several business units throughout the Company, and are used for a variety of purposes. Model use includes, but is not limited to, calculating capital requirements for hypothetical stressful environments, estimating interest and credit risk for loans and other balance sheet assets, and providing guidance in the management of client portfolios. The Company has established a policy to describe the roles and responsibilities of all key stakeholders in model development, management, and use. All models at the Company are registered in a centralized database and classified into different risk ratings depending on their potential financial, reputational, or regulatory impact to the Company. The model risk rating informs the scope of all model governance activities. Fiduciary Risk Fiduciary risk is the potential for financial or reputational loss through breach of fiduciary duties to a client. Fiduciary activities include, but are not limited to, individual and institutional trust, investment management, custody, and cash and securities processing. The Company attempts to manage this risk by establishing procedures to ensure that obligations to clients are discharged faithfully and in compliance with applicable legal and regulatory requirements. Business units have the primary responsibility for adherence to the procedures applicable to their business. Guidance and control are provided through the creation, approval, and ongoing review of applicable policies by business units and various risk committees. Credit Risk Credit risk is the potential for loss due to a borrower, counterparty, or issuer failing to perform its contractual obligations. The Company’s direct exposure to credit risk mainly results from margin lending and client option activities, securities lending activities, mortgage lending activities, its role as a counterparty in financial contracts and other investing activities. To manage the risks of such losses, the Company has established policies and procedures which include: establishing and reviewing credit limits, monitoring of credit limits and quality of counterparties, and adjusting margin and option requirements for certain securities. Collateral arrangements relating to margin loans, option positions, securities lending agreements, and resale agreements include provisions that require additional collateral in the event that market fluctuations result in declines in the value of collateral received. Additionally, for margin loan and securities lending agreements, collateral arrangements require that the fair value of such collateral exceeds the amounts loaned. The Company’s credit risk exposure related to loans to banking clients is actively managed through individual and portfolio reviews performed by management. Management regularly reviews asset quality, including concentrations, delinquencies, nonaccrual loans, charge-offs, and recoveries. All are factors in management’s quarterly determination of an appropriate allowance for loan losses. The Company’s mortgage loan portfolios primarily include First Mortgages of $8.0 billion and HELOCs of $3.0 billion at December 31, 2013. The Company’s underwriting guidelines include maximum loan-to-value (LTV) ratios, cash out limits, and minimum Fair Isaac Corporation (FICO) credit scores. The specific guidelines are dependent on the individual characteristics of a loan (for example, whether the property is a primary or secondary residence, whether the loan is for investment property, whether the loan is for an initial purchase of a home or refinance of an existing home, and whether the loan is conforming or jumbo). These credit underwriting standards have limited the exposure to the types of loans that experienced high foreclosures and loss rates elsewhere in the industry in recent years. There were no significant changes to the LTV ratio or FICO credit score underwriting guidelines related to the Company’s First Mortgage or HELOC portfolios during 2013. In January 2014, the

THE CHARLES SCHWAB CORPORATION Management’s Discussion and Analysis of Financial Condition and Results of Operations
(Tabular Amounts in Millions, Except Ratios, or as Noted)
- 40 -
Company revised its First Mortgage underwriting criteria in conformance with the CFPB’s new guidance on Qualified Mortgage lending and a borrower’s ability to repay. Revisions were made to requirements affecting Debt to Income Ratio, Loan to Value Ratio, and liquid asset holdings. The Company does not purchase loans that allow for negative amortization and does not purchase subprime loans (generally defined as extensions of credit to borrowers with a FICO score of less than 620 at origination), unless the borrower has compensating credit factors. At December 31, 2013, approximately 1% of both the First Mortgage and HELOC portfolios consisted of loans to borrowers with updated FICO scores of less than 620. At December 31, 2013, the weighted-average originated LTV ratio was 59% for both the First Mortgage and HELOC portfolios. The computation of the origination LTV ratio for a HELOC includes any first lien mortgage outstanding on the same property at the time of origination. At December 31, 2013, 22% of HELOCs ($680 million of the HELOC portfolio) were in a first lien position. The weighted-average originated FICO credit score was 769 and 768 for the First Mortgage and HELOC portfolios, respectively. The Company monitors the estimated current LTV ratios of its First Mortgage and HELOC portfolios on an ongoing basis. At December 31, 2013, the weighted-average estimated current LTV ratios were 53% and 59% for the First Mortgage and HELOC portfolios, respectively. The computation of the estimated current LTV ratio for a HELOC includes any first lien mortgage outstanding on the same property at the time of the HELOC’s origination. The Company estimates the current LTV ratio for each loan by reference to a home price appreciation index. The Company also monitors updated borrower FICO scores, delinquency trends, and verified liquid assets held by individual borrowers. At December 31, 2013, the weighted-average updated FICO scores were 772 and 769 for the First Mortgage and HELOC portfolios, respectively. A portion of the Company’s HELOC portfolio is secured by second liens on the associated properties. Second lien mortgage loans possess a higher degree of credit risk given the subordination to the first lien holder in the event of default. At December 31, 2013, $2.4 billion, or 78%, of the HELOC portfolio was in a second lien position. In addition to the credit monitoring activities described above, the Company also monitors credit risk on second lien HELOC loans by reviewing the delinquency status of the first lien loan on the associated property. Additionally, at December 31, 2013, approximately 30% of the HELOC borrowers that had a balance only paid the minimum amount due. For more information on the Company’s credit quality indicators relating to its First Mortgage and HELOC portfolios, including delinquency characteristics, borrower FICO scores at origination, updated borrower FICO scores, LTV ratios at origination, and estimated current LTV ratios, see “Item 8 – Financial Statements and Supplementary Data – Notes to Consolidated Financial Statements – 6. Loans to Banking Clients and Related Allowance for Loan Losses.” The following table presents certain of the Company’s loan quality metrics as a percentage of total outstanding loans:
December 31, 2013 2012
Loan delinquencies (1) 0.48 % 0.77 % Nonaccrual loans 0.39 % 0.45 % Allowance for loan losses 0.39 % 0.52 %
(1) Loan delinquencies include loans that are 30 days or more past due and other nonaccrual loans.
The Company has exposure to credit risk associated with its securities available for sale and securities held to maturity portfolios, whose fair values totaled $51.6 billion and $29.5 billion at December 31, 2013, respectively. These portfolios include U.S. agency and non-agency mortgage-backed securities, asset-backed securities, corporate debt securities, U.S. agency notes, certificates of deposit, and other securities. U.S. agency mortgage-backed securities do not have explicit credit ratings; however, management considers these to be of the highest credit quality and rating given the guarantee of principal and interest by the U.S. government-sponsored enterprises. At December 31, 2013, with the exception of one corporate bond (with an amortized cost of $100 million) and certain non-agency residential mortgage-backed securities, all securities in the available for sale and held to maturity portfolios were rated investment grade (defined as a rating equivalent to a Moody’s rating of “Baa” or higher, or a Standard & Poor’s rating of “BBB-” or higher). The one non-investment grade corporate bond, which matures in April 2014, was not considered other than temporarily impaired at December 31, 2013. Although the Company has recognized net impairment losses on certain

THE CHARLES SCHWAB CORPORATION Management’s Discussion and Analysis of Financial Condition and Results of Operations
(Tabular Amounts in Millions, Except Ratios, or as Noted)
- 41 -
non-agency residential mortgage-backed securities, at December 31, 2013 the amortized cost of all non-agency residential mortgage-backed securities represented less than 1% of the securities available for sale and securities held to maturity portfolios. Schwab performs clearing services for all securities transactions in its client accounts. Schwab has exposure to credit risk due to its obligation to settle transactions with clearing corporations, mutual funds, and other financial institutions even if Schwab’s client or a counterparty fails to meet its obligations to Schwab. Concentration Risk The Company has exposure to concentration risk when holding large positions in financial instruments collateralized by assets with similar economic characteristics or in securities of a single issuer or industry. The fair value of the Company’s investments in mortgage-backed securities totaled $48.9 billion at December 31, 2013. Of these, $47.1 billion were issued by U.S. agencies and $1.8 billion were issued by private entities (non-agency securities). These U.S. agency and non-agency securities are included in securities available for sale and securities held to maturity. The fair value of the Company’s investments in corporate debt securities and commercial paper totaled $9.2 billion at December 31, 2013, with the majority issued by institutions in the financial services industry. These securities are included in securities available for sale, securities held to maturity, cash and cash equivalents, and other securities owned in the Company’s consolidated balance sheets. Issuer, geographic, and sector concentrations are controlled by established credit policy limits to each concentration type. The Company’s loans to banking clients include $7.3 billion of adjustable rate first lien residential real estate mortgage loans at December 31, 2013. The Company’s adjustable rate mortgages have initial fixed interest rates for three to ten years and interest rates that adjust annually thereafter. Approximately 40% of these mortgages consisted of loans with interest-only payment terms. The interest rates on approximately 70% of these interest-only loans are not scheduled to reset for three or more years. The Company’s mortgage loans do not include interest terms described as temporary introductory rates below current market rates. At December 31, 2013, 46% of the residential real estate mortgages and 51% of the HELOC balances were secured by properties which are located in California. The Company’s HELOC product has a 30-year loan term with an initial draw period of 10 years from the date of origination. After the initial draw period, the balance outstanding at such time is converted to a 20-year amortizing loan. The interest rate during the initial draw period and the 20-year amortizing period is a floating rate based on the prime rate plus a margin. The following table presents when current outstanding HELOCs will convert to amortizing loans:
December 31, 2013 Balance
Converted to amortizing loan as of period end $ 134
Within 1 year 227 > 1 year – 3 years 498 > 3 years – 5 years 1,185 > 5 years 997
Total $ 3,041 The Company also has exposure to concentration risk from its margin and securities lending activities collateralized by securities of a single issuer or industry. This concentration risk is mitigated by collateral arrangements that require the fair value of such collateral exceeds the amounts loaned. The Company has indirect exposure to U.S. Government and agency securities held as collateral to secure its resale agreements. The Company’s primary credit exposure on these resale transactions is with its counterparty. The Company would have exposure to the U.S. Government and agency securities only in the event of the counterparty’s default on the resale agreements. The fair value of U.S. Government and agency securities held as collateral for resale agreements totaled $14.3 billion at December 31, 2013.

THE CHARLES SCHWAB CORPORATION Management’s Discussion and Analysis of Financial Condition and Results of Operations
(Tabular Amounts in Millions, Except Ratios, or as Noted)
- 42 -
European Holdings The Company has exposure to non-sovereign financial and non-financial institutions in Europe. The following table shows the balances of this exposure by each country in Europe in which the issuer or counterparty is domiciled. The Company has no direct exposure to sovereign governments in Europe. The Company does not have unfunded commitments to counterparties in Europe, nor does it have exposure as a result of credit default protection purchased or sold separately as of December 31, 2013. The determination of the domicile of exposure varies by the type of investment. For time deposits and certificates of deposit, the exposure is grouped in the country in which the financial institution is chartered under the regulatory framework of the European country. For asset-backed commercial paper, the exposure is grouped by the country of the sponsoring bank that provides the credit and liquidity support for such instruments. For corporate debt securities, the exposure is grouped by the country in which the issuer is domiciled. In situations in which the Company invests in a corporate debt security of a U.S. subsidiary of a European parent company, such holdings will be attributable to the European country only if significant reliance is placed on the European parent company for credit support underlying the security. For substantially all of the holdings listed below, the issuers or counterparties were financial institutions. All of the Company’s resale agreements, which are included in investments segregated and on deposit for regulatory purposes, are collateralized by U.S. government securities. Additionally, the Company’s securities lending activities are collateralized by cash. Therefore, the Company’s resale agreements and securities lending activities are not included in the table below even if the counterparty is a European institution.
Fair Value as of December 31, 2013
United France Germany Italy Netherlands Norway Sweden Switzerland Kingdom Total
Cash equivalents $ - $ - $ - $ - $ - $ - $ - $ 200 $ 200 Cash and investments
segregated and on deposit for regulatory purposes - 400 - - - - - - 400
Securities available for sale 356 - 100 235 175 1,247 725 1,202 4,040 Securities held to maturity - - - - - - 100 - 100 Total fair value $ 356 $ 400 $ 100 $ 235 $ 175 $ 1,247 $ 825 $ 1,402 $ 4,740 Total amortized cost $ 355 $ 400 $ 100 $ 234 $ 175 $ 1,245 $ 825 $ 1,401 $ 4,735
Maturities: Overnight $ - $ 400 $ - $ - $ - $ - $ - $ 200 $ 600 1 day – < 6 months - - 100 - 100 100 75 692 1,067 6 months – < 1 year 200 - - 100 - 300 200 123 923 1 year – 2 years - - - - - 426 400 387 1,213 > 2 years 156 - - 135 75 421 150 - 937 Total fair value $ 356 $ 400 $ 100 $ 235 $ 175 $ 1,247 $ 825 $ 1,402 $ 4,740
In addition to the direct holdings of European companies listed above, the Company also has indirect exposure to Europe through its investments in Schwab sponsored money market funds (collectively, the Funds) resulting from clearing activities. At December 31, 2013, the Company had $261 million in investments in these Funds. Certain of the Funds’ positions include certificates of deposits, time deposits, commercial paper and corporate debt securities issued by counterparties in Europe. Management mitigates exposure to European holdings by employing a separate team of credit analysts that evaluate each issuer, counterparty, and country. Management monitors its exposure to European issuers by 1) performing risk assessments of the foreign countries, which include evaluating the size of the country and economy, currency trends, political landscape and the countries’ regulatory environment and developments; 2) performing ad hoc stress tests that evaluate the impact of sovereign governments’ debt write-downs on financial issuers and counterparties the Company has exposure to through its investments; 3) reviewing publicly available stress tests that are published by various regulators in the European market; 4) establishing credit and maturity limits by issuer; and 5) establishing and monitoring aggregate credit limits by geography and sector.

THE CHARLES SCHWAB CORPORATION Management’s Discussion and Analysis of Financial Condition and Results of Operations
(Tabular Amounts in Millions, Except Ratios, or as Noted)
- 43 -
Market Risk Market risk is the potential for changes in earnings or the value of financial instruments held by the Company as a result of fluctuations in interest rates, equity prices or market conditions. Included in market risk is interest rate risk, which is the risk to earnings or capital arising from movement of interest rates. For discussion of the Company’s market risk, see “Item 7A – Quantitative and Qualitative Disclosures About Market Risk.” Liquidity Risk Liquidity risk arises from the inability to meet obligations when they come due without incurring unacceptable losses. It is the risk that valuations will be negatively affected by changes in demand and the underlying market for a financial instrument. Limits and contingency funding scenarios have been established for the Company to support liquidity levels and quality during both expected and stressed scenarios. The Company seeks to maintain client confidence in its balance sheet and the safety of client assets by maintaining liquidity and diversity of funding sources to allow the firm to meet its obligations under both expected and stressed scenarios. See Item 7 – Management’s Discussion and Analysis – Liquidity and Capital Resources” for additional detail on the Company’s liquidity requirements. Compliance Risk The Company faces significant compliance risk in its business, that is, the risk of legal or regulatory sanctions, fines or penalties, financial loss, or damage to reputation resulting from the failure to comply with laws, regulations, rules, or other regulatory requirements. Among other things, compliance risks relate to the suitability of client investments, conflicts of interest, disclosure obligations and performance expectations for Company products and services, supervision of employees, and the adequacy of the Company’s controls. The Company and its affiliates are subject to extensive regulation by federal, state and foreign regulatory authorities, including SROs. Such regulation is becoming increasingly extensive and complex, regulatory proceedings and sanctions against financial services firms continue to increase. The Company attempts to manage compliance risk through policies, procedures and controls reasonably designed to achieve and/or monitor compliance with applicable legal and regulatory requirements. These procedures address issues such as business conduct and ethics, sales and trading practices, marketing and communications, extension of credit, client funds and securities, books and records, anti-money laundering, client privacy, and employment policies. Despite the Company’s efforts to maintain an effective compliance program and internal controls, legal breaches and rule violations could result in reputational harm, significant losses and disciplinary sanctions, including limitations on the Company’s business activities. Legal Risk Legal risk is a consequence of operational failure – the risk of a claim for damages brought by clients, employees or other third parties, alleging error that amounts to a breach of legal requirements or other duties under law. The financial services industry is subject to substantial litigation risk, and the firm incurs legal claims in the ordinary course of business. Increased litigation costs or substantial legal liability relating to an extraordinary claim or incidence of claims could have a material adverse effect on the Company’s business and financial condition. For information about the Company’s legal risk, see “Item 1A – Risk Factors,” and “Item 8 – Financial Statements and Supplementary Data – Notes to Consolidated Financial Statements – 14. Commitments and Contingencies.” Capital Planning The capital plan considers significant risks to meeting the Company’s capital goals over time and through evolving economic, financial, and business environments. Internal guidelines are set, for both the Company and regulated subsidiaries, to ensure continued regulatory compliance as well as to meet expectations of investors and rating agencies. The capital plan also considers the potential effects of a sudden and sustained systemic economic downturn, idiosyncratic events which are uniquely impactful to the Company, and sensitivity analyses applied to significant assumptions that are either quantitative or qualitative in nature. The comprehensive Capital Contingency Plan was developed by the Company to

THE CHARLES SCHWAB CORPORATION Management’s Discussion and Analysis of Financial Condition and Results of Operations
(Tabular Amounts in Millions, Except Ratios, or as Noted)
- 44 -
address the action plans for certain capital events with low probability, but high severity, that the Company might face. The Capital Contingency Plan is issued under the authority of the Asset-Liability Management and Pricing Committee and provides guidelines for sustained capital events. It does not specifically address every contingency, but is designed to provide a framework for responding to any capital stress. Capital forecasts are reviewed monthly at Capital Planning and Asset-Liability Management and Pricing Committee meetings and semi-annually at the Company’s Board of Directors meetings. Exceptions to internal guidelines are also reviewed at quarterly Global Risk Committee meetings. FAIR VALUE OF FINANCIAL INSTRUMENTS The Company uses the market and income approaches to determine the fair value of certain financial assets and liabilities recorded at fair value, and to determine fair value disclosures. See “Item 8 – Financial Statements and Supplementary Data – Notes to Consolidated Financial Statements – 2. Summary of Significant Accounting Policies and 16. Fair Values of Assets and Liabilities” for more information on the Company’s assets and liabilities recorded at fair value. When available, the Company uses quoted prices in active markets to measure the fair value of assets and liabilities. When utilizing market data with a bid-ask spread, the Company uses the price within the bid-ask spread that best represents fair value. When quoted prices do not exist, the Company uses prices obtained from independent third-party pricing services to measure the fair value of investment assets. The Company generally obtains prices from at least three independent pricing sources for assets recorded at fair value and may obtain up to five prices on assets with higher risk of limited observable information, such as non-agency residential mortgage-backed securities. The Company’s primary independent pricing service provides prices based on observable trades and discounted cash flows that incorporate observable information such as yields for similar types of securities (a benchmark interest rate plus observable spreads) and weighted-average maturity for the same or similar “to-be-issued” securities. The Company compares the prices obtained from its primary independent pricing service to the prices obtained from the additional independent pricing services to determine if the price obtained from the primary independent pricing service is reasonable. The Company does not adjust the prices received from independent third-party pricing services unless such prices are inconsistent with the definition of fair value and result in a material difference in the recorded amounts. At December 31, 2013 and 2012, the Company did not adjust prices received from the primary independent third-party pricing service. CRITICAL ACCOUNTING ESTIMATES The consolidated financial statements of the Company have been prepared in accordance with accounting principles generally accepted in the U.S. While the majority of the Company’s revenues, expenses, assets and liabilities are not based on estimates, there are certain accounting principles that require management to make estimates regarding matters that are uncertain and susceptible to change where such change may result in a material adverse impact on the Company’s financial position and reported financial results. These critical accounting estimates are described below. Management regularly reviews the estimates and assumptions used in the preparation of the Company’s financial statements for reasonableness and adequacy. Other-than-Temporary Impairment of Securities Available for Sale and Securities Held to Maturity Management evaluates whether securities available for sale and securities held to maturity are other-than-temporarily impaired (OTTI) on a quarterly basis. Debt securities with unrealized losses are considered OTTI if the Company intends to sell the security or if it is more likely than not that the Company will be required to sell such security before any anticipated recovery. If management determines that a security is OTTI under these circumstances, the impairment recognized in earnings is measured as the entire difference between the amortized cost and the then-current fair value. A security is also OTTI if management does not expect to recover the amortized cost of the security. In this circumstance, the impairment recognized in earnings represents estimated credit loss, and is measured by the difference between the present

THE CHARLES SCHWAB CORPORATION Management’s Discussion and Analysis of Financial Condition and Results of Operations
(Tabular Amounts in Millions, Except Ratios, or as Noted)
- 45 -
value of expected cash flows and the amortized cost of the security. Management utilizes cash flow models to estimate the expected future cash flow from the securities and to estimate the credit loss. Expected cash flows are discounted using the security’s effective interest rate. The evaluation of whether the Company expects to recover the amortized cost of a security is inherently judgmental. The evaluation includes the assessment of several bond performance indicators including: the portion of the underlying loans that are delinquent (30 days, 60 days, 90+ days), in bankruptcy, in foreclosure or converted to real estate owned; the actual amount of loss incurred on the underlying loans in which the property has been foreclosed and sold; the amount of credit support provided by the structure of the security available to absorb credit losses on the underlying loans; the current price and magnitude of the unrealized loss; and whether the Company has received all scheduled principal and interest payments. Management uses cash flow models to further assess the likelihood of other-than-temporary impairment for the Company’s non-agency residential mortgage-backed securities. To develop the cash flow models, the Company uses forecasted loss severity, prepayment speeds (i.e. the rate at which the principal on underlying loans are paid down), and default rates over the securities’ expected remaining maturities. Valuation of Goodwill The Company tests goodwill for impairment at least annually, or whenever indications of impairment exist. Impairment exists when the carrying amount of goodwill exceeds its implied fair value, resulting in an impairment charge for this excess. Adverse changes in the Company’s planned business operations such as unanticipated competition, a loss of key personnel, the sale of a reporting unit or a significant portion of a reporting unit, or other unforeseen developments could result in an impairment of the Company’s recorded goodwill. The Company’s annual goodwill impairment testing date is April 1st. In testing for a potential impairment of goodwill on April 1, 2013, management performed a qualitative assessment of each of the Company’s reporting units (generally defined as the Company’s businesses for which financial information is available and reviewed regularly by management) and concluded that goodwill was not impaired. Allowance for Loan Losses The appropriateness of the allowance is reviewed quarterly by management, taking into consideration current economic conditions, the existing loan portfolio composition, past loss experience, and risks inherent in the portfolio. The methodology to establish an allowance for loan losses related to the First Mortgage and HELOC portfolio utilizes statistical models that estimate prepayments, defaults, and probable losses for the loan segments based on predicted behavior of individual loans within the segments. The methodology considers the effects of borrower behavior and a variety of factors including, but not limited to, interest rates, housing price movements as measured by a housing price index, economic conditions, estimated defaults and foreclosures measured by historical and expected delinquencies, changes in prepayment speeds, LTV ratios, past loss experience, estimates of future loss severities, borrower credit risk measured by FICO scores, and the adequacy of collateral. The methodology also evaluates concentrations in the loan segments including loan products, year of origination, and geographical distribution of collateral. Probable losses are forecast using a loan-level simulation of the delinquency status of the loans over the term of the loans. The simulation starts with the current relevant risk indicators, including the current delinquent status of each loan, the estimated current LTV ratio of each loan, the term and structure of each loan, current key interest rates including U.S. Treasury and London Interbank Offered Rate (LIBOR) rates, and borrower FICO scores. The more significant variables in the simulation include delinquency roll rates, loss severity, housing prices, and interest rates. Delinquency roll rates (i.e., the rates at which loans transition through delinquency stages and ultimately result in a loss) are estimated from the Company’s historical loss experience adjusted for current trends and market information. Further, the delinquency roll rates within the loan-level simulation discussed above are calibrated to match a moving average of the delinquency roll rates actually experienced in the respective First Mortgage and HELOC portfolios. Loss severity estimates are based on the Company’s historical loss experience and market trends. The estimated loss severity (i.e. loss given default) used in the allowance for loan loss methodology for HELOCs is higher than that used in the methodology for First Mortgages. Housing price trends are

THE CHARLES SCHWAB CORPORATION Management’s Discussion and Analysis of Financial Condition and Results of Operations
(Tabular Amounts in Millions, Except Ratios, or as Noted)
- 46 -
derived from historical home price indices and econometric forecasts of future home values. Factors affecting the home price index include: housing inventory, unemployment, interest rates, and inflation expectations. Interest rate projections are based on the current term structure of interest rates and historical volatilities to project various possible future interest rate paths. As a result, the current state of house prices and the current state of delinquencies unique to the Company’s First Mortgage and HELOC portfolios are considered in the allowance for loan loss methodology. This methodology results in loss factors that are applied to the outstanding balances to determine the allowance for loan loss for each loan segment. The allowance for personal loans secured by securities is established on a loan by loan basis. The market value of collateral pledged by borrowers is regularly reviewed to ensure the Company’s commitment to extend credit is over-collateralized. If collateral is in danger of falling below specified levels, the Company may reduce a borrower’s committed line or may liquidate collateral. At December 31, 2013 and 2012, the allowance for loan losses related to personal loans secured by securities was immaterial. Legal and Regulatory Reserves Reserves for legal and regulatory claims and proceedings reflect an estimate of probable losses for each matter, after considering, among other factors, the progress of the case, prior experience and the experience of others in similar cases, available defenses, insurance coverage and indemnification, and the opinions and views of legal counsel. In many cases, including most class action lawsuits, it is not possible to determine whether a loss will be incurred, or to estimate the range of that loss, until the matter is close to resolution, in which case no accrual is made until that time. Reserves are adjusted as more information becomes available or when an event occurs requiring a change. Significant judgment is required in making these estimates, and the actual cost of resolving a matter may ultimately differ materially from the amount reserved. The Company’s management has discussed the development and selection of these critical accounting estimates with the Audit Committee. Additionally, management has reviewed with the Audit Committee the Company’s significant estimates discussed in this Management’s Discussion and Analysis of Financial Condition and Results of Operations. FORWARD-LOOKING STATEMENTS In addition to historical information, this Annual Report on Form 10-K contains “forward-looking statements” within the meaning of Section 27A of the Securities Act, and Section 21E of the Securities Exchange Act of 1934. Forward-looking statements are identified by words such as “believe,” “anticipate,” “expect,” “intend,” “plan,” “will,” “may,” “estimate,” “appear,” “aim,” “target,” “could,” and other similar expressions. In addition, any statements that refer to expectations, projections, or other characterizations of future events or circumstances are forward-looking statements. These forward-looking statements, which reflect management’s beliefs, objectives, and expectations as of the date hereof, are necessarily estimates based on the best judgment of the Company’s senior management. These statements relate to, among other things:
the Company’s ability to pursue its business strategy and maintain its market leadership position (see “Part I – Item 1. – Business – Business Strategy and Competitive Environment”);
the expected impact of the final regulatory capital rules, which implemented Basel III and relevant provisions of the Dodd-Frank Act, the Federal Reserve notice of proposed rulemaking regarding quantitative liquidity requirements, and the NSCC rule issuance (see “Part I – Item 1A. – Risk Factors” and “Current Market and Regulatory Environment and Other Developments”);
the impact of legal proceedings and regulatory matters (see “Part I – Item 3. – Legal Proceedings” and “Item 8 – Financial Statements and Supplementary Data – Notes to Consolidated Financial Statements –14. Commitments and Contingencies – Legal contingencies”);
the impact of current market conditions on the Company’s results of operations (see “Current Market and Regulatory Environment and Other Developments,” “Results of Operations – Net Interest Revenue,” and “Item 8 – Financial Statements and Supplementary Data – Notes to Consolidated Financial Statements – 5. Securities Available for Sale and Securities Held to Maturity”);

THE CHARLES SCHWAB CORPORATION Management’s Discussion and Analysis of Financial Condition and Results of Operations
(Tabular Amounts in Millions, Except Ratios, or as Noted)
- 47 -
sources of liquidity, capital, and level of dividends (see “Part I – Item 1. – Business – Regulation,” “Liquidity and Capital Resources,” “Contractual Obligations,” and “Item 8 – Financial Statements and Supplementary Data – Notes to Consolidated Financial Statements – 22. Regulatory Requirements”);
target capital and debt ratios (see “Liquidity and Capital Resources” and “Item 8 – Financial Statements and Supplementary Data – Notes to Consolidated Financial Statements – 22. Regulatory Requirements”);
capital expenditures (see “Liquidity and Capital Resources – Capital Resources – Capital Expenditures”); the impact of changes in management’s estimates on the Company’s results of operations (see “Critical Accounting
Estimates”); the impact of changes in the likelihood of indemnification and guarantee payment obligations on the Company’s
results of operations (see “Item 8 – Financial Statements and Supplementary Data – Notes to Consolidated Financial Statements – 14. Commitments and Contingencies”); and
the impact on the Company’s results of operations of recording stock option expense (see “Item 8 – Financial Statements and Supplementary Data – Notes to Consolidated Financial Statements – 19. Employee Incentive, Retirement, and Deferred Compensation Plans”).
Achievement of the expressed beliefs, objectives and expectations described in these statements is subject to certain risks and uncertainties that could cause actual results to differ materially from the expressed beliefs, objectives, and expectations. Readers are cautioned not to place undue reliance on these forward-looking statements, which speak only as of the date of this Annual Report on Form 10-K or, in the case of documents incorporated by reference, as of the date of those documents. Important factors that may cause actual results to differ include, but are not limited to:
changes in general economic and financial market conditions; changes in revenues and profit margin due to changes in interest rates; adverse developments in litigation or regulatory matters; the extent of any charges associated with litigation and regulatory matters; amounts recovered on insurance policies; the Company’s ability to attract and retain clients and grow client assets and relationships; the Company’s ability to develop and launch new products, services and capabilities in a timely and successful
manner; fluctuations in client asset values due to changes in equity valuations; the Company’s ability to monetize client assets; the performance or valuation of securities available for sale and securities held to maturity; trading activity; the level of interest rates, including yields available on money market mutual fund eligible instruments; the adverse impact of financial reform legislation and related regulations; the amount of loans to the Company’s brokerage and banking clients; the level of the Company’s stock repurchase activity; the level of brokerage client cash balances and deposits from banking clients; the availability and terms of external financing; capital needs and management; the level of field sales volume and related incentive compensation; level of expenses; the Company’s ability to manage expenses; regulatory guidance; the level of client assets, including cash balances; competitive pressures on rates and fees; acquisition integration costs; the timing and impact of changes in the Company’s level of investments in buildings, land, and leasehold
improvements; and potential breaches of contractual terms for which the Company has indemnification and guarantee obligations.
Certain of these factors, as well as general risk factors affecting the Company, are discussed in greater detail in this Annual Report on Form 10-K, including “Item 1A – Risk Factors.”

THE CHARLES SCHWAB CORPORATION
- 48 -
Item 7A. Quantitative and Qualitative Disclosures About Market Risk Market risk is the potential for changes in earnings or the value of financial instruments held by the Company as a result of fluctuations in interest rates, equity prices or market conditions. The Company is exposed to interest rate risk primarily from changes in market interest rates on its interest-earning assets relative to changes in the costs of its funding sources that finance these assets. The majority of the Company’s interest-earning assets and interest-bearing liabilities are sensitive to changes in short-term interest rates. To a lesser degree, the Company is sensitive to changes in long-term interest rates through some of its investment portfolios. To manage the Company’s market risk related to interest rates, management utilizes simulation models, which include the net interest revenue sensitivity analysis described below. Net interest revenue is affected by various factors, such as the distribution and composition of interest-earning assets and interest-bearing liabilities, the spread between yields earned on interest-earning assets and rates paid on interest-bearing liabilities, which may reprice at different times or by different amounts, and the spread between short and long-term interest rates. Interest-earning assets include residential real estate loans and mortgage-backed securities. These assets are sensitive to changes in interest rates and to changes to prepayment levels, which tend to increase in a declining rate environment. Because the Company establishes the rates paid on certain brokerage client cash balances and deposits from banking clients and the rates charged on margin loans and loans to banking clients, and controls the composition of its investment securities, it has some ability to manage its net interest spread, depending on competitive factors and market conditions. To mitigate the risk of loss, the Company has established policies and procedures that include setting guidelines on the amount of net interest revenue at risk, and monitoring the net interest margin and average maturity of its interest-earning assets and funding sources. To remain within these guidelines, the Company manages the maturity, repricing, and cash flow characteristics of the investment portfolios. The Company is also subject to market risk as a result of fluctuations in option and equity prices. The Company’s direct holdings of option and equity securities and its associated exposure to option and equity prices are not material. The Company is indirectly exposed to option and equity market fluctuations in connection with client option accounts, securities collateralizing margin loans to brokerage customers, and customer securities loaned out as part of the Company’s securities lending activities. Equity market valuations may also affect the level of brokerage client trading activity, margin borrowing, and overall client engagement with the Company. Additionally, the Company earns mutual fund service fees and asset management fees based upon daily balances of certain client assets. Fluctuations in these client asset balances caused by changes in equity valuations directly impact the amount of fee revenue earned by the Company. Financial instruments held by the Company are also subject to liquidity risk – that is, the risk that valuations will be negatively affected by changes in demand and the underlying market for a financial instrument. Recent conditions in the credit markets have significantly reduced market liquidity in a wide range of financial instruments, including certain instruments held by the Company, and fair value can differ significantly from the value implied by the credit quality and actual performance of the instrument’s underlying cash flows. For discussion of the impact of current market conditions on asset management and administration fees and net interest revenue, see “Item 7 – Management’s Discussion and Analysis of Financial Condition and Results of Operations – Current Market and Regulatory Environment and Other Developments.” The Company’s market risk related to financial instruments held for trading is not material. Net Interest Revenue Simulation For the Company’s net interest revenue sensitivity analysis, the Company uses net interest revenue simulation modeling techniques to evaluate and manage the effect of changing interest rates. The simulation includes all interest-sensitive assets and liabilities. Key variables in the simulation include the repricing of financial instruments, prepayment, reinvestment, and product pricing assumptions. The Company uses constant balances and market rates in the simulation assumptions in order to

THE CHARLES SCHWAB CORPORATION
- 49 -
minimize the number of variables and to better isolate risks. The simulations involve assumptions that are inherently uncertain and, as a result, cannot precisely estimate net interest revenue or predict the impact of changes in interest rates on net interest revenue. Actual results may differ from simulated results due to balance growth or decline and the timing, magnitude, and frequency of interest rate changes, as well as changes in market conditions and management strategies, including changes in asset and liability mix. If the Company’s guidelines for its net interest revenue sensitivity are breached, management must report the breach to the Company’s Corporate Asset-Liability Management and Pricing Committee (Corporate ALCO) and establish a plan to address the interest rate risk. This plan could include, but is not limited to, rebalancing certain investment portfolios or using derivative instruments to mitigate the interest rate risk. Depending on the severity and expected duration of the breach, as well as the then current interest rate environment, the plan could also be to take no action. Any plan that recommends taking action is required to be approved by the Company’s Corporate ALCO. There were no breaches of the Company’s net interest revenue sensitivity guidelines during the years ending December 31, 2013 or 2012. As represented by the simulations presented below, the Company’s investment strategy is structured to produce an increase in net interest revenue when interest rates rise and, conversely, a decrease in net interest revenue when interest rates fall. The simulations in the following table assume that the asset and liability structure of the consolidated balance sheet would not be changed as a result of the simulated changes in interest rates. As the Company actively manages its consolidated balance sheet and interest rate exposure, in all likelihood the Company would take steps to manage any additional interest rate exposure that could result from changes in the interest rate environment. The following table shows the results of a gradual 100 basis point increase or decrease in market interest rates relative to the Company’s current market rates forecast on simulated net interest revenue over the next 12 months beginning December 31, 2013 and 2012.
December 31, 2013 2012
Increase of 100 basis points 11.0 % 19.2 % Decrease of 100 basis points (4.5) % (10.0)% The sensitivities shown in the simulation reflect the fact that short-term interest rates in 2013 remained at historically low levels, including the federal funds target rate, which was unchanged at a range of zero to 0.25%. The year-over-year decrease in net interest income sensitivity reflects the baseline assumption of higher medium and longer-term rates at December 31, 2013 relative to those assumed at December 31, 2012 resulting in a higher basis for comparison. The current low interest rate environment limits the extent to which the Company can reduce interest expense paid on funding sources in a declining interest rate scenario. A decline in interest rates could therefore negatively impact the yield on the Company’s investment portfolio to a greater degree than any offsetting reduction in interest expense, further compressing net interest margin. Any increases in short-term interest rates result in a greater impact as yields on interest-earning assets are expected to rise faster than the cost of funding sources.

THE CHARLES SCHWAB CORPORATION
- 50 -
Item 8. Financial Statements and Supplementary Data
TABLE OF CONTENTS
Consolidated Statements of Income 51Consolidated Statements of Comprehensive Income 52Consolidated Balance Sheets 53Consolidated Statements of Cash Flows 54Consolidated Statements of Stockholders’ Equity 55Notes to Consolidated Financial Statements 56Note 1. Introduction and Basis of Presentation 56Note 2. Summary of Significant Accounting Policies 56Note 3. Receivables from Brokerage Clients 62Note 4. Other Securities Owned 62Note 5. Securities Available for Sale and Securities Held to Maturity 63Note 6. Loans to Banking Clients and Related Allowance for Loan Losses 66Note 7. Equipment, Office Facilities, and Property 70Note 8. Intangible Assets and Goodwill 70Note 9. Other Assets 71Note 10. Deposits from Banking Clients 71Note 11. Payables to Brokers, Dealers, and Clearing Organizations 71Note 12. Payables to Brokerage Clients 72Note 13. Borrowings 72Note 14. Commitments and Contingencies 74Note 15. Financial Instruments Subject to Off-Balance Sheet Credit Risk or Concentration Risk 76Note 16. Fair Values of Assets and Liabilities 78Note 17. Stockholders’ Equity 81Note 18. Accumulated Other Comprehensive Income 82Note 19. Employee Incentive, Retirement, and Deferred Compensation Plans 83Note 20. Taxes on Income 85Note 21. Earnings Per Common Share 87Note 22. Regulatory Requirements 87Note 23. Segment Information 89Note 24. Business Acquisitions 90Note 25. Subsequent Events 91Note 26. The Charles Schwab Corporation – Parent Company Only Financial Statements 91Note 27. Quarterly Financial Information (Unaudited) 94Report of Independent Registered Public Accounting Firm 95Management’s Report on Internal Control Over Financial Reporting 96

THE CHARLES SCHWAB CORPORATION
- 51 -
Consolidated Statements of Income (In Millions, Except Per Share Amounts) Year Ended December 31, 2013 2012 2011
Net Revenues
Asset management and administration fees $ 2,315 $ 2,043 $ 1,928
Interest revenue 2,085 1,914 1,900Interest expense (105) (150) (175)
Net interest revenue 1,980 1,764 1,725
Trading revenue 913 868 927Other — net 236 256 160Provision for loan losses 1 (16) (18)Net impairment losses on securities (1) (10) (32) (31)
Total net revenues 5,435 4,883 4,691
Expenses Excluding Interest Compensation and benefits 2,027 1,803 1,732Professional services 415 388 387Occupancy and equipment 309 311 301Advertising and market development 257 241 228Communications 220 220 220Depreciation and amortization 202 196 155Class action litigation and regulatory reserve - - 7Other 300 274 269
Total expenses excluding interest 3,730 3,433 3,299
Income before taxes on income 1,705 1,450 1,392Taxes on income 634 522 528
Net Income 1,071 928 864
Preferred stock dividends 61 45 -
Net Income Available to Common Stockholders $ 1,010 $ 883 $ 864
Weighted-Average Common Shares Outstanding — Diluted 1,293 1,275 1,229
Earnings Per Common Share — Basic $ .78 $ .69 $ .70
Earnings Per Common Share — Diluted $ .78 $ .69 $ .70
Dividends Declared Per Common Share $ .24 $ .24 $ .24
(1) Net impairment losses on securities include total other-than-temporary impairment losses of $2 million, $15 million, and $18 million recognized in other comprehensive (loss) income, net of $(8) million, $(17) million, and $(13) million reclassified from other comprehensive (loss) income in 2013, 2012, and 2011, respectively.
See Notes to Consolidated Financial Statements.

THE CHARLES SCHWAB CORPORATION
- 52 -
Consolidated Statements of Comprehensive Income (In Millions) Year Ended December 31, 2013 2012 2011
Net income $ 1,071 $ 928 $ 864
Other comprehensive (loss) income, before tax: Change in net unrealized gain on securities available for sale:
Net unrealized (loss) gain (468) 470 (43)Reclassification of impairment charges included in net
impairment losses on securities 10 32 31Other reclassifications included in other revenue (7) (38) 1
Other 1 1 (1)
Other comprehensive (loss) income, before tax (464) 465 (12)Income tax effect 175 (175) 4
Other comprehensive (loss) income, net of tax (289) 290 (8)
Comprehensive Income $ 782 $ 1,218 $ 856 See Notes to Consolidated Financial Statements.

THE CHARLES SCHWAB CORPORATION
- 53 -
Consolidated Balance Sheets (In Millions, Except Per Share and Share Amounts)
December 31, 2013 2012
Assets Cash and cash equivalents $ 7,728 $ 12,663Cash and investments segregated and on deposit for regulatory purposes
(including resale agreements of $14,016 and $19,325 at December 31, 2013 and 2012, respectively) 23,553 28,469
Receivables from brokers, dealers, and clearing organizations 509 333Receivables from brokerage clients — net 13,951 13,458Other securities owned — at fair value 517 636Securities available for sale 51,618 46,123Securities held to maturity (fair value — $29,490 and $18,732 at December 31,
2013 and 2012, respectively) 30,318 18,194Loans to banking clients — net 12,419 10,726Equipment, office facilities, and property — net 790 675Goodwill 1,227 1,228Intangible assets — net 266 319Other assets 746 813
Total assets $ 143,642 $ 133,637
Liabilities and Stockholders’ Equity Deposits from banking clients $ 92,972 $ 79,377Payables to brokers, dealers, and clearing organizations 1,467 1,068Payables to brokerage clients 35,333 40,330Accrued expenses and other liabilities 1,586 1,641Long-term debt 1,903 1,632
Total liabilities 133,261 124,048
Stockholders’ equity: Preferred stock — $.01 par value per share; aggregated liquidation
preference of $885 869 865Common stock — 3 billion shares authorized; $.01 par value per share;
1,487,543,446 shares issued 15 15Additional paid-in capital 3,951 3,881Retained earnings 9,253 8,554Treasury stock, at cost — 190,657,263 shares and 210,014,305 shares
at December 31, 2013 and 2012, respectively (3,716) (4,024)Accumulated other comprehensive income 9 298
Total stockholders’ equity 10,381 9,589Total liabilities and stockholders’ equity $ 143,642 $ 133,637
See Notes to Consolidated Financial Statements.

THE CHARLES SCHWAB CORPORATION
- 54 -
Consolidated Statements of Cash Flows (In Millions)
Year Ended December 31, 2013 2012 2011Cash Flows from Operating Activities
Net income $ 1,071 $ 928 $ 864 Adjustments to reconcile net income to net cash provided by operating activities:
Provision for loan losses (1) 16 18 Net impairment losses on securities 10 32 31 Stock-based compensation 116 105 99 Depreciation and amortization 202 196 155 (Benefit) provision for deferred income taxes (21) 5 52 Premium amortization, net, on securities available for sale and securities held to maturity 162 222 136 Other 15 26 9
Originations of loans held for sale - (441) (1,574)Proceeds from sales of loans held for sale - 513 1,703 Net change in:
Cash and investments segregated and on deposit for regulatory purposes 4,916 (2,549) (2,211)Receivables from brokers, dealers, and clearing organizations (175) (104) 220 Receivables from brokerage clients (496) (2,391) 341 Other securities owned 119 (43) (231)Other assets 17 10 (15)Payables to brokers, dealers, and clearing organizations 318 28 (357)Payables to brokerage clients (4,997) 4,950 3,407 Accrued expenses and other liabilities 400 (237) (183)
Net cash provided by operating activities 1,656 1,266 2,464 Cash Flows from Investing Activities
Purchases of securities available for sale (22,942) (29,035) (18,434)Proceeds from sales of securities available for sale 6,167 3,336 500 Principal payments on securities available for sale 10,772 13,867 7,978 Purchases of securities held to maturity (16,061) (8,678) (2,253)Principal payments on securities held to maturity 3,895 5,453 4,786 Net increase in loans to banking clients (1,634) (978) (1,125)Purchase of equipment, office facilities, and property (249) (148) (180)Cash (paid) acquired in business acquisitions — net - (80) 54 Other investing activities 2 3 7
Net cash used for investing activities (20,050) (16,260) (8,667)Cash Flows from Financing Activities
Net change in deposits from banking clients 13,595 18,523 10,264 Issuance of commercial paper - 300 -Repayment of commercial paper (300) - -Issuance of long-term debt 275 350 -Repayment of long-term debt (6) (732) (116)Premium paid on debt exchange - (19) -Net proceeds from preferred stock offerings - 863 -Dividends paid (368) (337) (295)Proceeds from stock options exercised and other 258 35 96 Other financing activities 5 (5) 2
Net cash provided by financing activities 13,459 18,978 9,951 (Decrease) Increase in Cash and Cash Equivalents (4,935) 3,984 3,748 Cash and Cash Equivalents at Beginning of Year 12,663 8,679 4,931 Cash and Cash Equivalents at End of Year $ 7,728 $ 12,663 $ 8,679
Supplemental Cash Flow Information Cash paid during the year for:
Interest $ 99 $ 143 $ 168 Income taxes $ 624 $ 508 $ 517
Non-cash investing activities: Common stock issued and equity awards assumed for business acquisitions (See note
“24 – Business Acquisitions”) $ - $ - $ 714 Securities purchased during the year but settled after year end $ 81 $ - $ 58
Non-cash financing activity: Exchange of Senior Notes (See note “13 – Borrowings”) $ - $ 256 $ -
See Notes to Consolidated Financial Statements.

THE CHARLES SCHWAB CORPORATION
- 55 -
Consolidated Statements of Stockholders’ Equity (In Millions)
Accumulated
Additional Other Preferred Common Stock Paid-In Retained Treasury Stock, Comprehensive Stock Shares Amount Capital Earnings at cost Income (Loss) Total
Balance at December 31, 2010 $ - 1,429 $ 14 $ 3,034 $ 7,409 $ (4,247) $ 16 $ 6,226 Net income - - - - 864 - - 864Other comprehensive income, net of tax - - - - - - (8) (8)Issuance of common stock for business
acquisition - 59 1 713 - - - 714 Dividends declared on common stock - - - - (295) - - (295)Stock option exercises and other - - - (24) - 122 - 98 Stock-based compensation and
related tax effects - - - 99 - - - 99 Other - - - 4 - 12 - 16 Balance at December 31, 2011 - 1,488 15 3,826 7,978 (4,113) 8 7,714 Net income - - - - 928 - - 928Other comprehensive income, net of tax - - - - - - 290 290 Issuance of preferred stock 863 - - - - - - 863 Dividends declared on preferred stock - - - - (43) - - (43)Dividends declared on common stock - - - - (308) - - (308)Stock option exercises and other - - - (40) - 76 - 36 Stock-based compensation and
related tax effects - - - 98 - - - 98 Other 2 - - (3) (1) 13 - 11 Balance at December 31, 2012 865 1,488 15 3,881 8,554 (4,024) 298 9,589 Net income - - - - 1,071 - - 1,071Other comprehensive loss, net of tax - - - - - - (289) (289)Dividends declared on preferred stock - - - - (57) - - (57)Dividends declared on common stock - - - - (311) - - (311)Stock option exercises and other - - - (54) - 314 - 260 Stock-based compensation and
related tax effects - - - 119 - - - 119 Other 4 - - 5 (4) (6) - (1)Balance at December 31, 2013 $ 869 1,488 $ 15 $ 3,951 $ 9,253 $ (3,716) $ 9 $ 10,381
See Notes to Consolidated Financial Statements.

THE CHARLES SCHWAB CORPORATION Notes to Consolidated Financial Statements
(Tabular Amounts in Millions, Except Per Share Data, Option Price Amounts, Ratios, or as Noted)
- 56 -
1. Introduction and Basis of Presentation The Charles Schwab Corporation (CSC) is a savings and loan holding company engaged, through its subsidiaries, in securities brokerage, banking, money management, and financial advisory services. Charles Schwab & Co., Inc. (Schwab) is a securities broker-dealer with over 300 domestic branch offices in 45 states, as well as a branch in each of the Commonwealth of Puerto Rico and London, England. In addition, Schwab serves clients in Hong Kong through one of CSC’s subsidiaries. Other subsidiaries include Charles Schwab Bank (Schwab Bank), a federal savings bank, and Charles Schwab Investment Management, Inc. (CSIM), the investment advisor for Schwab’s proprietary mutual funds, which are referred to as the Schwab Funds®, and for Schwab’s exchange-traded funds, which are referred to as the Schwab ETFsTM. The accompanying consolidated financial statements include CSC and its majority-owned subsidiaries (collectively referred to as the Company). Intercompany balances and transactions have been eliminated. These consolidated financial statements have been prepared in conformity with accounting principles generally accepted in the United States (U.S.), which require management to make certain estimates and assumptions that affect the reported amounts in the accompanying financial statements. Certain estimates relate to other-than-temporary impairment of securities available for sale and securities held to maturity, valuation of goodwill, allowance for loan losses, and legal and regulatory reserves. Actual results may differ from those estimates. 2. Summary of Significant Accounting Policies Asset management and administration fees Asset management and administration fees include mutual fund service fees and fees for other asset-based financial services provided to individual and institutional clients, and are recognized as revenue over the period that the related service is provided, based upon average asset balances. The Company’s policy is to recognize revenue subject to refunds because management can estimate refunds based on Company specific experience. Actual refunds were not material as of December 31, 2013. The Company earns mutual fund service fees for shareholder services, administration, and investment management provided to its proprietary funds, and recordkeeping and shareholder services provided to third-party funds. These fees are based upon the daily balances of client assets invested in these funds. The Company also earns asset management fees for advice solutions, which include advisory and managed account services that are based on the daily balances of client assets subject to the specific fee for service. The fair values of client assets included in proprietary and third-party mutual funds are based on quoted market prices and other observable market data. Other asset management and administration fees include various asset based fees, such as third-party mutual fund service fees, trust fees, 401(k) record keeping fees, and mutual fund clearing and other service fees. In 2013, 2012, and 2011, the Company waived a portion of its asset management fees earned from certain Schwab-sponsored money market mutual funds in order to provide a positive return to clients. Under agreements with these funds, the Company may recover such fee waivers depending on the future performance of the funds and approval by the boards of the respective funds until the third anniversary of the end of the fiscal year in which such fee waiver occurs, subject to certain limitations. Recoveries of previously-waived asset management fees are recognized as revenue when substantially all uncertainties about timing and amount of realization are resolved. Interest revenue Interest revenue represents interest earned on cash and cash equivalents, cash and investments segregated, receivables from brokers, dealers, and clearing organizations, receivables from brokerage clients, other securities owned, securities available for sale, securities held to maturity, and loans to banking clients. Interest revenue is recognized in the period earned based upon average or daily asset balances and respective interest rates. Trading revenue Trading revenue includes commission and principal transaction revenues. Clients’ securities transactions are recorded on the date that they settle, while the related commission revenues and expenses are recorded on the date that the trade occurs.

THE CHARLES SCHWAB CORPORATION Notes to Consolidated Financial Statements
(Tabular Amounts in Millions, Except Per Share Data, Option Price Amounts, Ratios, or as Noted)
- 57 -
Principal transaction revenue is primarily comprised of revenue from trading activity in client fixed income securities, which is recorded on a trade date basis. To accommodate clients’ fixed income trading activity, the Company maintains positions in fixed income securities, including state and municipal debt obligations, U.S. Government, corporate debt and other securities. The difference between the price at which the Company buys and sells securities to and from its clients and other broker-dealers is recognized as principal transaction revenue. Principal transaction revenue also includes adjustments to the fair value of these securities positions. Cash and cash equivalents The Company considers all highly liquid investments with original maturities of three months or less that are not segregated and on deposit for regulatory purposes to be cash equivalents. Cash and cash equivalents include money market funds, deposits with banks, certificates of deposit, commercial paper, and treasury securities. Cash and cash equivalents also include balances that Schwab Bank maintains at the Federal Reserve Bank. Cash and investments segregated and on deposit for regulatory purposes Cash and investments segregated and on deposit for regulatory purposes include securities purchased under agreements to resell (resale agreements), which are collateralized by U.S. Government and agency securities. Resale agreements are accounted for as collateralized investing transactions that are recorded at their contractual amounts plus accrued interest. The Company obtains control of collateral with a market value equal to or in excess of the principal amount loaned and accrued interest under resale agreements. Collateral is valued daily by the Company, with additional collateral obtained to ensure full collateralization. Cash and investments segregated also include certificates of deposit and U.S. Government securities. Certificates of deposit and U.S. Government securities are recorded at fair value. Pursuant to applicable regulations, client cash balances that are not used for margin lending are generally segregated into investment accounts that are maintained for the exclusive benefit of clients. Receivables from brokerage clients Receivables from brokerage clients include margin loans to clients and are recorded net of an allowance for doubtful accounts. Receivables from brokerage clients that remain unsecured or partially secured for more than 30 days are fully reserved. Other securities owned Other securities owned are recorded at fair value based on quoted market prices or other observable market data. Unrealized gains and losses are included in trading revenue. Securities available for sale and securities held to maturity Securities available for sale are recorded at fair value and unrealized gains and losses are reported, net of taxes, in accumulated other comprehensive income (loss) included in stockholders’ equity. Securities held to maturity are recorded at amortized cost based on the Company’s positive intent and ability to hold these securities to maturity. Realized gains and losses from sales of securities available for sale are determined on a specific identification basis and are included in other revenue – net. Management evaluates whether securities available for sale and securities held to maturity are other-than-temporarily impaired (OTTI) on a quarterly basis. Debt securities with unrealized losses are considered OTTI if the Company intends to sell the security or if it is more likely than not that the Company will be required to sell such security before any anticipated recovery. If management determines that a security is OTTI under these circumstances, the impairment recognized in earnings is measured as the entire difference between the amortized cost and the then-current fair value. A security is also OTTI if management does not expect to recover all of the amortized cost of the security. In this circumstance, the impairment recognized in earnings represents estimated credit loss, and is measured by the difference between the present value of expected cash flows and the amortized cost of the security. Management utilizes cash flow

THE CHARLES SCHWAB CORPORATION Notes to Consolidated Financial Statements
(Tabular Amounts in Millions, Except Per Share Data, Option Price Amounts, Ratios, or as Noted)
- 58 -
models to estimate the expected future cash flow from the securities to estimate the credit loss. Expected cash flows are discounted using the security’s effective interest rate. The evaluation of whether the Company expects to recover the amortized cost of a security is inherently judgmental. The evaluation includes the assessment of several bond performance indicators including: the portion of the underlying loans that are delinquent (30 days, 60 days, 90+ days), in bankruptcy, in foreclosure or converted to real estate owned; the actual amount of loss incurred on the underlying loans in which the property has been foreclosed and sold; the amount of credit support provided by the structure of the security available to absorb credit losses on the underlying loans; the current price and magnitude of the unrealized loss; and whether the Company has received all scheduled principal and interest payments. Management uses cash flow models to further assess the likelihood of other-than-temporary impairment for the Company’s non-agency residential mortgage-backed securities. To develop the cash flow models, the Company uses forecasted loss severity, prepayment speeds (i.e. the rate at which the principal on underlying loans are paid down), and default rates over the securities’ expected remaining maturities. Securities borrowed and securities loaned Securities borrowed require the Company to deliver cash to the lender in exchange for securities and are included in receivables from brokers, dealers, and clearing organizations. For securities loaned, the Company receives collateral in the form of cash in an amount equal to or greater than the market value of securities loaned. Securities loaned are included in payables to brokers, dealers, and clearing organizations. The Company monitors the market value of securities borrowed and loaned, with additional collateral obtained or refunded to ensure full collateralization. Fees received or paid are recorded in interest revenue or interest expense. Loans to banking clients and related allowance for loan losses Loans to banking clients are recorded at their contractual principal amounts and include unamortized direct origination costs or net purchase premiums. Additionally, loans are recorded net of an allowance for loan losses. The Company’s loan portfolio includes four loan segments: residential real estate mortgages, home equity lines of credit (HELOC), personal loans secured by securities and other loans. Residential real estate mortgages include two loan classes: first mortgages and purchased first mortgages. Loan segments are defined as the level to which the Company disaggregates its loan portfolio when developing and documenting a methodology for determining the allowance for loan losses. A loan class is defined as a group of loans within a loan segment that has homogeneous risk characteristics. The Company records an allowance for loan losses through a charge to earnings based on management’s estimate of probable losses in the existing portfolio. Management reviews the allowance for loan losses quarterly, taking into consideration current economic conditions, the composition of the existing loan portfolio, past loss experience, and risks inherent in the portfolio to ensure that the allowance for loan losses is maintained at an appropriate level. The methodology to establish an allowance for loan losses utilizes statistical models that estimate prepayments, defaults, and probable losses for the loan segments based on predicted behavior of individual loans within the segments. The methodology considers the effects of borrower behavior and a variety of factors including, but not limited to, interest rates, housing price movements as measured by a housing price index, economic conditions, estimated defaults and foreclosures measured by historical and expected delinquencies, changes in prepayment speeds, loan-to-value (LTV) ratios, past loss experience, estimates of future loss severities, borrower credit risk measured by Fair Isaac Corporation (FICO) scores, and the adequacy of collateral. The methodology also evaluates concentrations in the loan segments, including loan products, year of origination, and geographical distribution of collateral. Probable losses are forecast using a loan-level simulation of the delinquency status of the loans over the term of the loans. The simulation starts with the current relevant risk indicators, including the current delinquent status of each loan, the estimated current LTV ratio of each loan, the term and structure of each loan, current key interest rates including U.S. Treasury and London Interbank Offered Rate (LIBOR) rates, and borrower FICO scores. The more significant variables in the simulation include delinquency roll rates, loss severity, housing prices, and interest rates. Delinquency roll rates (i.e., the rates at which loans transition through delinquency stages and ultimately result in a loss) are estimated from the Company’s historical loss experience adjusted for current trends and market information. Further, the delinquency roll rates within the

THE CHARLES SCHWAB CORPORATION Notes to Consolidated Financial Statements
(Tabular Amounts in Millions, Except Per Share Data, Option Price Amounts, Ratios, or as Noted)
- 59 -
loan-level simulation discussed above are calibrated to match a moving average of the delinquency roll rates actually experienced in the respective first lien residential real estate mortgage loan (First Mortgage) and home equity line of credit (HELOC) portfolios. Loss severity estimates are based on the Company’s historical loss experience and market trends. The estimated loss severity (i.e. loss given default) used in the allowance for loan loss methodology for HELOC loans is higher than that used in the methodology for First Mortgages. Housing price trends are derived from historical home price indices and econometric forecasts of future home values. Factors affecting the home price index include: housing inventory, unemployment, interest rates, and inflation expectations. Interest rate projections are based on the current term structure of interest rates and historical volatilities to project various possible future interest rate paths. As a result, the current state of house prices, including the decrease in general house prices experienced over the last several years, as well as the current state of delinquencies unique to the Company’s First Mortgage and HELOC portfolios, are considered in the allowance for loan loss methodology. This methodology results in loss factors that are applied to the outstanding balances to determine the allowance for loan loss for each loan segment. The Company considers loan modifications in which it makes an economic concession to a borrower experiencing financial difficulty to be a troubled debt restructuring. Nonaccrual loans Residential real estate mortgages, HELOC, personal, and other loans are placed on nonaccrual status upon becoming 90 days past due as to interest or principal (unless the loans are well-secured and in the process of collection), or when the full timely collection of interest or principal becomes uncertain, including loans to borrowers who have filed for bankruptcy. For the portion of the HELOC portfolio for which the Company is able to track the delinquency status on the associated first lien loan, the Company places a HELOC on non-accrual status if the associated first mortgage is 90 days or more delinquent, regardless of the payment status of the HELOC. When a loan is placed on nonaccrual status, the accrued and unpaid interest receivable is reversed and the loan is accounted for on the cash or cost recovery method thereafter, until qualifying for return to accrual status. Generally, a nonaccrual loan may be returned to accrual status when all delinquent interest and principal is repaid and the borrower demonstrates a sustained period of performance, or when the loan is both well-secured and in the process of collection and collectability is no longer doubtful. Loan Charge-Offs The Company charges off a loan in the period that it is deemed uncollectible and records a reduction in the allowance for loan losses and the loan balance. The Company’s charge-off policy for residential real estate first mortgages and HELOC loans is to assess the value of the property when the loan has been delinquent for 180 days or has been discharged in bankruptcy proceedings, regardless of whether or not the property is in foreclosure, and charge-off the amount of the loan balance in excess of the estimated current value of the underlying property less estimated costs to sell. Equipment, office facilities, and property Equipment, office facilities, and property are recorded at cost net of accumulated depreciation and amortization, except for land, which is recorded at cost. Equipment and office facilities are depreciated on a straight-line basis over an estimated useful life of five to ten years. Buildings are depreciated on a straight-line basis over 20 to 40 years. Leasehold improvements are amortized on a straight-line basis over the shorter of the estimated useful life of the asset or the term of the lease. Software and certain costs incurred for purchasing or developing software for internal use are amortized on a straight-line basis over an estimated useful life of three or five years. Equipment, office facilities, and property are reviewed for impairment whenever events or changes in circumstances indicate that the carrying amount of such assets may not be recoverable. Goodwill Goodwill represents the fair value of acquired businesses in excess of the fair value of the individually identified net assets acquired. Goodwill is not amortized but is tested for impairment annually or whenever indications of impairment exist. The

THE CHARLES SCHWAB CORPORATION Notes to Consolidated Financial Statements
(Tabular Amounts in Millions, Except Per Share Data, Option Price Amounts, Ratios, or as Noted)
- 60 -
Company’s annual impairment testing date is April 1st. The Company can elect to qualitatively assess goodwill for impairment if it is more likely than not that the fair value of a reporting unit exceeds its carrying value. A qualitative assessment may consider macroeconomic and other industry-specific factors, such as trends in short-term and long-term interest rates and the ability to access capital, or Company specific factors such as market capitalization in excess of net assets, trends in revenue generating activities, and merger or acquisition activity. If the Company elects to bypass qualitatively assessing goodwill, or it is not more likely than not that the fair value of a reporting unit exceeds its carrying value, management estimates the fair values of each of the Company’s reporting units (defined as the Company’s businesses for which financial information is available and reviewed regularly by management) and compares it to their carrying values. The estimated fair values of the reporting units are established using an income approach based on a discounted cash flow model that includes significant assumptions about the future operating results and cash flows of each reporting unit, a market approach which compares each reporting unit to comparable companies in their respective industries, and a market capitalization analysis. Intangible assets Intangible assets are amortized over their useful lives in a manner that best reflects their economic benefit. Intangible assets are reviewed for impairment whenever events or changes in circumstances indicate that the carrying amount of such assets may not be recoverable. The Company does not have any indefinite-lived intangible assets. Guarantees and indemnifications The Company recognizes, at the inception of a guarantee, a liability equal to the estimated fair value of the obligation undertaken in issuing the guarantee. The fair values of the obligations relating to standby letter of credit agreements (LOCs) are estimated based on fees charged to enter into similar agreements, considering the creditworthiness of the counterparties. The fair values of the obligations relating to other guarantees are estimated based on transactions for similar guarantees or expected present value measures. Income taxes The Company provides for income taxes on all transactions that have been recognized in the consolidated financial statements. Accordingly, deferred tax assets are adjusted to reflect the tax rates at which future taxable amounts will likely be settled or realized. The effects of tax rate changes on future deferred tax assets and deferred tax liabilities, as well as other changes in income tax laws, are recorded in earnings in the period during which such changes are enacted. The Company’s unrecognized tax benefits, which are included in accrued expenses and other liabilities, represent the difference between positions taken on tax return filings and estimated potential tax settlement outcomes. Interest and penalties relating to unrecognized tax benefits are recorded in income tax expense. Stock-based compensation Stock-based compensation includes employee and board of director stock options, restricted stock units, and restricted stock awards. The Company measures compensation expense for these share-based payment arrangements based on their estimated fair values as of the awards’ grant date. The fair value of the share-based award is recognized over the vesting period as stock-based compensation. Stock-based compensation expense is based on awards expected to vest and therefore is reduced for estimated forfeitures. Forfeitures are estimated at the time of grant based on the Company’s historical forfeiture experience and revised in subsequent periods if actual forfeitures differ from those estimates. The excess tax benefits from the exercise of stock options and the vesting of restricted stock awards are recorded in additional paid-in capital. Fair values of assets and liabilities Fair value is defined as the price that would be received to sell an asset or the price paid to transfer a liability in an orderly transaction between market participants at the measurement date. Fair value measurement accounting guidance describes the fair value hierarchy for disclosing assets and liabilities measured at fair value based on the inputs used to value them. The fair value hierarchy maximizes the use of observable inputs and minimizes the use of unobservable inputs. Observable inputs are

THE CHARLES SCHWAB CORPORATION Notes to Consolidated Financial Statements
(Tabular Amounts in Millions, Except Per Share Data, Option Price Amounts, Ratios, or as Noted)
- 61 -
based on market pricing data obtained from sources independent of the Company. A quoted price in an active market provides the most reliable evidence of fair value and is generally used to measure fair value whenever available. Unobservable inputs reflect management’s judgment about the assumptions market participants would use in pricing the asset or liability. Where inputs used to measure fair value of an asset or liability are from different levels of the hierarchy, the asset or liability is categorized based on the lowest level input that is significant to the fair value measurement in its entirety. Assessing the significance of a particular input requires judgment. The fair value hierarchy includes three levels based on the objectivity of the inputs as follows:
Level 1 inputs are quoted prices in active markets as of the measurement date for identical assets or liabilities that the Company has the ability to access.
Level 2 inputs are inputs other than quoted prices included in Level 1 that are observable for the asset or liability,
either directly or indirectly. Level 2 inputs include quoted prices for similar assets and liabilities in active markets, and inputs other than quoted prices that are observable for the asset or liability, such as interest rates, benchmark yields, issuer spreads, new issue data, and collateral performance.
Level 3 inputs are unobservable inputs for the asset or liability, and include situations where there is little, if any,
market activity for the asset or liability. Assets and liabilities recorded at fair value The Company uses the market and income approaches to determine the fair value of assets and liabilities. When available, the Company uses quoted prices in active markets to measure the fair value of assets and liabilities. When utilizing market data and bid-ask spread, the Company uses the price within the bid-ask spread that best represents fair value. When quoted prices do not exist, the Company uses prices obtained from independent third-party pricing services to measure the fair value of investment assets. The Company generally obtains prices from at least three independent pricing sources for assets recorded at fair value and may obtain up to five prices on assets with higher risk of limited observable information, such as non-agency residential mortgage-backed securities. The Company’s primary independent pricing service provides prices based on observable trades and discounted cash flows that incorporate observable information such as yields for similar types of securities (a benchmark interest rate plus observable spreads) and weighted-average maturity for the same or similar “to-be-issued” securities. The Company compares the prices obtained from its primary independent pricing service to the prices obtained from the additional independent pricing services to determine if the price obtained from the primary independent pricing service is reasonable. The Company does not adjust the prices received from independent third-party pricing services unless such prices are inconsistent with the definition of fair value and result in a material difference in the recorded amounts. Financial instruments not recorded at fair value Descriptions of the valuation methodologies and assumptions used to estimate the fair value of financial instruments not recorded at fair value are described below. The Company’s financial instruments not recorded at fair value but for which fair value can be approximated and disclosed include:
Cash and cash equivalents are short-term in nature and accordingly are recorded at amounts that approximate fair value.
Cash and investments segregated and on deposit for regulatory purposes include cash and securities purchased
under resale agreements. Securities purchased under resale agreements are short-term in nature and are backed by collateral that both exceeds the carrying value of the resale agreement and is highly liquid in nature. Accordingly, the carrying value approximates fair value.
Receivables from/payables to brokers, dealers, and clearing organizations are recorded at contractual amounts and
historically have been settled at those values and are short-term in nature, and therefore approximate fair value.
Receivables from/payables to brokerage clients — net are recorded at contractual amounts and historically have been settled at those values and are short-term in nature, and therefore approximate fair value.

THE CHARLES SCHWAB CORPORATION Notes to Consolidated Financial Statements
(Tabular Amounts in Millions, Except Per Share Data, Option Price Amounts, Ratios, or as Noted)
- 62 -
Securities held to maturity – The fair values of securities held to maturity are obtained using an independent third-
party pricing service similar to investment assets recorded at fair value as discussed above.
Loans to banking clients – The fair values of the Company’s loans to banking clients are estimated based on prices of mortgage-backed securities collateralized by similar types of loans.
Financial instruments included in other assets primarily consist of cost method investments and Federal Home Loan
Bank (FHLB) stock, whose carrying values approximate their fair values. FHLB stock is recorded at par, which approximates fair value.
Deposits from banking clients have no stated maturity and are recorded at the amount payable on demand as of the
balance sheet date. The Company considers the carrying value of these deposits to approximate their fair values.
Financial instruments included in accrued expenses and other liabilities consist of commercial paper, drafts payable and certain amounts due under contractual obligations which are short-term in nature and accordingly are recorded at amounts that approximate fair value.
Long-term debt – Except for the finance lease obligation, the fair values of long-term debt are estimated using
indicative, non-binding quotes from independent brokers. The Company validates indicative prices for its debt through comparison to other independent non-binding quotes. The finance lease obligation is recorded at carrying value, which approximates fair value.
Firm commitments to extend credit – The Company extends credit to banking clients through HELOC and personal
loans secured by securities. The Company considers the fair value of these unused commitments to be not material because the interest rates earned on these balances are based on floating interest rates that reset monthly. The Company does not charge a fee to maintain a HELOC or personal loan.
3. Receivables from Brokerage Clients Receivables from brokerage clients consist primarily of margin loans to brokerage clients of $12.8 billion and $11.6 billion at December 31, 2013 and 2012, respectively. Securities owned by brokerage clients are held as collateral for margin loans. Such collateral is not reflected in the consolidated financial statements. The average yield earned on margin loans was 3.68% and 4.08% in 2013 and 2012, respectively. 4. Other Securities Owned A summary of other securities owned is as follows:
December 31, 2013 2012
Schwab Funds® money market funds $ 261 $ 329 Equity and bond mutual funds 208 217 State and municipal debt obligations 32 48 Equity, U.S. Government and corporate debt, and other securities 16 42
Total other securities owned $ 517 $ 636 The Company’s positions in Schwab Funds® money market funds arise from certain overnight funding of clients’ redemption, check-writing, and debit card activities. Equity and bond mutual funds include mutual fund investments held at CSC, investments made by the Company relating to its deferred compensation plan, and inventory maintained to facilitate certain Schwab Funds and third-party mutual fund clients’ transactions. State and municipal debt obligations, equity, U.S. Government and corporate debt, and other securities include securities held to meet clients’ trading activities.

THE CHARLES SCHWAB CORPORATION Notes to Consolidated Financial Statements
(Tabular Amounts in Millions, Except Per Share Data, Option Price Amounts, Ratios, or as Noted)
- 63 -
5. Securities Available for Sale and Securities Held to Maturity The amortized cost, gross unrealized gains and losses, and fair value of securities available for sale and securities held to maturity are as follows:
Gross Gross Amortized Unrealized Unrealized Fair December 31, 2013 Cost Gains Losses Value
Securities available for sale: U.S. agency mortgage-backed securities $ 18,554 $ 140 $ 49 $ 18,645Asset-backed securities 15,201 42 37 15,206Corporate debt securities 8,973 49 15 9,007U.S. agency notes 4,239 1 104 4,136Certificates of deposit 3,650 4 2 3,652Non-agency residential mortgage-backed securities 616 11 34 593Non-agency commercial mortgage-backed securities 271 8 - 279Other securities 100 - - 100
Total securities available for sale $ 51,604 $ 255 $ 241 $ 51,618
Securities held to maturity: U.S. agency mortgage-backed securities $ 29,260 $ 161 $ 921 $ 28,500Non-agency commercial mortgage-backed securities 958 - 68 890Other securities 100 - - 100
Total securities held to maturity $ 30,318 $ 161 $ 989 $ 29,490
Gross Gross Amortized Unrealized Unrealized Fair December 31, 2012 Cost Gains Losses Value
Securities available for sale: U.S. agency mortgage-backed securities $ 20,080 $ 396 $ - $ 20,476Asset-backed securities 8,104 62 2 8,164Corporate debt securities 6,197 61 2 6,256Certificates of deposit 6,150 12 1 6,161U.S. agency notes 3,465 2 3 3,464Non-agency residential mortgage-backed securities 796 2 65 733Commercial paper 574 - - 574Other securities 278 17 - 295
Total securities available for sale $ 45,644 $ 552 $ 73 $ 46,123
Securities held to maturity: U.S. agency mortgage-backed securities $ 17,750 $ 558 $ 19 $ 18,289Other securities 444 - 1 443
Total securities held to maturity $ 18,194 $ 558 $ 20 $ 18,732

THE CHARLES SCHWAB CORPORATION Notes to Consolidated Financial Statements
(Tabular Amounts in Millions, Except Per Share Data, Option Price Amounts, Ratios, or as Noted)
- 64 -
A summary of securities with unrealized losses, aggregated by category and period of continuous unrealized loss, is as follows:
Less than 12 months 12 months or longer Total Fair Unrealized Fair Unrealized Fair UnrealizedDecember 31, 2013 Value Losses Value Losses Value Losses
Securities available for sale: U.S agency mortgage-backed securities $ 5,044 $ 47 $ 93 $ 2 $ 5,137 $ 49Asset-backed securities 6,391 33 591 4 6,982 37Corporate debt securities 1,802 14 499 1 2,301 15U.S. agency notes 3,636 104 - - 3,636 104Certificates of deposit - - 299 2 299 2Non-agency residential mortgage-backed
securities 89 2 374 32 463 34Total $ 16,962 $ 200 $ 1,856 $ 41 $ 18,818 $ 241
Securities held to maturity: U.S. agency mortgage-backed securities $ 19,175 $ 698 $ 2,345 $ 223 $ 21,520 $ 921Non-agency commercial mortgage-backed
securities 630 43 260 25 890 68Total $ 19,805 $ 741 $ 2,605 $ 248 $ 22,410 $ 989
Total securities with unrealized losses (1) $ 36,767 $ 941 $ 4,461 $ 289 $ 41,228 $ 1,230
(1) The number of investment positions with unrealized losses totaled 273 for securities available for sale and 193 for securities held to maturity.
Less than 12 months 12 months or longer Total Fair Unrealized Fair Unrealized Fair UnrealizedDecember 31, 2012 Value Losses Value Losses Value Losses
Securities available for sale: Asset-backed securities $ - $ - $ 801 $ 2 $ 801 $ 2Corporate debt securities 878 2 - - 878 2Certificates of deposit 599 1 - - 599 1U.S. agency notes 2,102 3 - - 2,102 3Non-agency residential mortgage-backed
securities 46 1 549 64 595 65Total $ 3,625 $ 7 $ 1,350 $ 66 $ 4,975 $ 73
Securities held to maturity: U.S. agency mortgage-backed securities $ 2,680 $ 19 $ - $ - $ 2,680 $ 19Other securities 240 1 - - 240 1
Total $ 2,920 $ 20 $ - $ - $ 2,920 $ 20Total securities with unrealized losses (1) $ 6,545 $ 27 $ 1,350 $ 66 $ 7,895 $ 93
(1) The number of investment positions with unrealized losses totaled 139 for securities available for sale and 24 for securities held to maturity.
Management evaluates whether securities available for sale and securities held to maturity are other-than-temporarily impaired (OTTI) on a quarterly basis as described in note “2 – Summary of Significant Accounting Policies.” Non-agency residential mortgage-backed securities include securities collateralized by loans that are considered to be “Prime” (defined as loans to borrowers with a Fair Isaac Corporation (FICO) credit score of 620 or higher at origination), and “Alt-A” (defined as Prime loans with reduced documentation at origination). Management determined that it does not expect to recover all of the amortized cost of certain of its Alt-A and Prime residential mortgage-backed securities and therefore

THE CHARLES SCHWAB CORPORATION Notes to Consolidated Financial Statements
(Tabular Amounts in Millions, Except Per Share Data, Option Price Amounts, Ratios, or as Noted)
- 65 -
determined that these securities were OTTI. The Company does not intend to sell these securities and it is not “more likely than not” that the Company will be required to sell these securities before anticipated recovery of the unrealized losses on these securities. The Company recognized an impairment charge equal to the securities’ expected credit losses of $10 million in 2013. The expected credit losses were measured as the difference between the present value of expected cash flows and the amortized cost of the securities. Further deterioration in the performance of the underlying loans in the Company’s non-agency residential mortgage-backed securities portfolio could result in the recognition of additional impairment losses.
The following table is a rollforward of the amount of credit losses recognized in earnings for OTTI securities held by the Company during the period for which a portion of the impairment was reclassified from or recognized in other comprehensive (loss) income:
Year Ended December 31, 2013 2012 2011
Balance at beginning of year $ 159 $ 127 $ 96
Credit losses recognized into current year earnings on debt securities for
which an other-than-temporary impairment was not previously recognized 1 6 6
Credit losses recognized into current year earnings on debt securities for
which an other-than-temporary impairment was previously recognized 9 26 25
Balance at end of year $ 169 $ 159 $ 127
The maturities of securities available for sale and securities held to maturity at December 31, 2013, are as follows:
After 1 year After 5 years Within through through After 1 year 5 years 10 years 10 years Total
Securities available for sale: U.S. agency mortgage-backed securities (1) $ - $ 508 $ 4,458 $ 13,679 $ 18,645Asset-backed securities - 1,219 3,284 10,703 15,206Corporate debt securities 1,348 7,554 105 - 9,007U.S. agency notes - 3,896 240 - 4,136Certificates of deposit 1,826 1,826 - - 3,652Non-agency residential mortgage-backed
securities (1) - 4 - 589 593Non-agency commercial mortgage-backed
securities (1) - - - 279 279Other securities 100 - - - 100
Total fair value $ 3,274 $ 15,007 $ 8,087 $ 25,250 $ 51,618Total amortized cost $ 3,270 $ 15,062 $ 8,041 $ 25,231 $ 51,604
Securities held to maturity: U.S. agency mortgage-backed securities (1) $ - $ 555 $ 11,985 $ 15,960 $ 28,500Non-agency commercial mortgage-backed
securities (1) - - 337 553 890Other securities 100 - - - 100
Total fair value $ 100 $ 555 $ 12,322 $ 16,513 $ 29,490Total amortized cost $ 100 $ 550 $ 12,894 $ 16,774 $ 30,318
(1) Mortgage-backed securities have been allocated to maturity groupings based on final contractual maturities. Actual maturities will differ from final contractual maturities because borrowers on a certain portion of loans underlying these securities have the right to prepay their obligations.

THE CHARLES SCHWAB CORPORATION Notes to Consolidated Financial Statements
(Tabular Amounts in Millions, Except Per Share Data, Option Price Amounts, Ratios, or as Noted)
- 66 -
Proceeds and gross realized gains from sales of securities available for sale are as follows:
Year Ended December 31, 2013 2012 2011 Proceeds $ 6,167 $ 3,336 $ 500 Gross realized gains $ 7 $ 35 $ 1 There were no realized losses from the sales of securities available for sale in 2013, 2012, or 2011. 6. Loans to Banking Clients and Related Allowance for Loan Losses The composition of loans to banking clients by loan segment is as follows:
December 31, 2013 2012
Residential real estate mortgages $ 8,006 $ 6,507 Home equity lines of credit 3,041 3,287 Personal loans secured by securities 1,384 963 Other 36 25
Total loans to banking clients (1) 12,467 10,782 Allowance for loan losses (48) (56)
Total loans to banking clients – net $ 12,419 $ 10,726
(1) Loans are evaluated for impairment by loan segment.
The Company has commitments to extend credit related to unused HELOCs, personal loans secured by securities, and other lines of credit, which totaled $5.7 billion and $5.4 billion at December 31, 2013 and 2012, respectively. Changes in the allowance for loan losses were as follows:
Year Ended December 31, 2013 December 31, 2012 December 31, 2011 Residential Home Residential Home Residential Home real estate equity lines real estate equity lines real estate equity lines mortgages of credit Total mortgages of credit Total mortgages of credit Total
Balance at beginning of year $ 36 $ 20 $ 56 $ 40 $ 14 $ 54 $ 38 $ 15 $ 53 Charge-offs (5) (6) (11) (7) (9) (16) (11) (8) (19)Recoveries 2 2 4 2 - 2 1 1 2 Provision for loan losses 1 (2) (1) 1 15 16 12 6 18 Balance at end of year $ 34 $ 14 $ 48 $ 36 $ 20 $ 56 $ 40 $ 14 $ 54
Included in the loan portfolio are nonaccrual loans totaling $48 million at December 31, 2013 and 2012, respectively. There were no loans accruing interest that were contractually 90 days or more past due at December 31, 2013 or 2012. Nonperforming assets, which include nonaccrual loans and other real estate owned, totaled $53 million and $54 million at December 31, 2013 and 2012, respectively. Troubled debt restructurings were not material at December 31, 2013 or 2012, respectively. As of December 31, 2012, Schwab Bank no longer originates First Mortgage loans or HELOCs. In 2012, Schwab Bank launched a co-branded loan origination program for Schwab Bank clients (the Program) with Quicken Loans, Inc. (Quicken® Loans®). Pursuant to the Program, Quicken Loans originates and services First Mortgages and HELOCs for Schwab Bank clients. Under the Program, Schwab Bank purchases certain First Mortgages and HELOCs that are originated by Quicken Loans. Schwab Bank sets the underwriting guidelines and pricing for all loans it intends to purchase for its portfolio. Schwab Bank purchased First Mortgages of $3.5 billion and $3.0 billion during 2013 and 2012, respectively. Schwab Bank purchased HELOCs with commitments of $917 million and $411 million during 2013 and 2012, respectively. The First Mortgages purchased under the Program are included in the First mortgages loan class in the table below.

THE CHARLES SCHWAB CORPORATION Notes to Consolidated Financial Statements
(Tabular Amounts in Millions, Except Per Share Data, Option Price Amounts, Ratios, or as Noted)
- 67 -
The delinquency analysis by loan class is as follows:
>90 days past 30-59 days 60-89 days due and other Total Total December 31, 2013 Current past due past due nonaccrual loans past due loans
Residential real estate mortgages: First mortgages $ 7,808 $ 3 $ 4 $ 30 $ 37 $ 7,845Purchased first mortgages 154 1 - 6 7 161
Home equity lines of credit 3,025 2 2 12 16 3,041Personal loans secured by securities 1,384 - - - - 1,384Other 36 - - - - 36
Total loans to banking clients $ 12,407 $ 6 $ 6 $ 48 $ 60 $ 12,467
December 31, 2012
Residential real estate mortgages: First mortgages $ 6,291 $ 22 $ 2 $ 33 $ 57 $ 6,348Purchased first mortgages 154 1 - 4 5 159
Home equity lines of credit 3,269 5 2 11 18 3,287Personal loans secured by securities 963 - - - - 963Other 22 3 - - 3 25
Total loans to banking clients $ 10,699 $ 31 $ 4 $ 48 $ 83 $ 10,782
In addition to monitoring delinquency, the Company monitors the credit quality of residential real estate mortgages and HELOCs by stratifying the portfolios by the year of origination, borrower FICO scores at origination (Origination FICO), updated borrower FICO scores (Updated FICO), LTV ratios at origination (Origination LTV), and estimated current LTV ratios (Estimated Current LTV), as presented in the following tables. Borrowers’ FICO scores are provided by an independent third party credit reporting service and were last updated in December 2013. The Origination LTV and Estimated Current LTV ratios for a HELOC include any first lien mortgage outstanding on the same property at the time of the HELOC’s origination. The Estimated Current LTV for each loan is estimated by reference to a home price appreciation index.

THE CHARLES SCHWAB CORPORATION Notes to Consolidated Financial Statements
(Tabular Amounts in Millions, Except Per Share Data, Option Price Amounts, Ratios, or as Noted)
- 68 -
Residential real estate mortgages First Purchased Home equity December 31, 2013 mortgages first mortgages Total lines of credit
Year of origination Pre-2009 $ 674 $ 51 $ 725 $ 2,0442009 185 4 189 2602010 503 7 510 1912011 733 38 771 1552012 2,403 26 2,429 1622013 3,347 35 3,382 229
Total $ 7,845 $ 161 $ 8,006 $ 3,041
Origination FICO <620 $ 10 $ 1 $ 11 $ -620 – 679 96 14 110 20680 – 739 1,352 32 1,384 576>740 6,387 114 6,501 2,445
Total $ 7,845 $ 161 $ 8,006 $ 3,041
Updated FICO <620 $ 50 $ 5 $ 55 $ 42620 – 679 209 10 219 106680 – 739 1,012 29 1,041 453>740 6,574 117 6,691 2,440
Total $ 7,845 $ 161 $ 8,006 $ 3,041
Origination LTV <70% $ 5,306 $ 110 $ 5,416 $ 2,040 >70% – <90% 2,523 45 2,568 977 >90% – <100% 16 6 22 24
Total $ 7,845 $ 161 $ 8,006 $ 3,041
Percent of Loans that are 90+ Days Past Due and Weighted Less than 90 Days Average Utilization Past Due but onDecember 31, 2013 Balance Updated FICO Rate (1) Nonaccrual Status
Residential real estate mortgages: Estimated Current LTV
<70% $ 6,649 775 N/A 0.05 % >70% – <90% 1,181 763 N/A 0.34 % >90% – <100% 86 732 N/A 4.77 % >100% 90 730 N/A 10.50 %
Total $ 8,006 772 N/A 0.26 %
Home equity lines of credit: Estimated Current LTV
<70% $ 2,127 773 36 % 0.13 % >70% – <90% 664 762 48 % 0.22 % >90% – <100% 127 752 59 % 1.22 % >100% 123 743 63 % 1.34 %
Total $ 3,041 769 39 % 0.24 %
(1) The Utilization Rate is calculated using the outstanding HELOC balance divided by the associated total line of credit. N/A Not applicable.

THE CHARLES SCHWAB CORPORATION Notes to Consolidated Financial Statements
(Tabular Amounts in Millions, Except Per Share Data, Option Price Amounts, Ratios, or as Noted)
- 69 -
Residential real estate mortgages First Purchased Home equity December 31, 2012 mortgages first mortgages Total lines of credit
Year of origination Pre-2009 $ 867 $ 62 $ 929 $ 2,3382009 305 6 311 3382010 909 12 921 2492011 1,270 53 1,323 1982012 2,997 26 3,023 164
Total $ 6,348 $ 159 $ 6,507 $ 3,287
Origination FICO
<620 $ 10 $ 1 $ 11 $ -620 – 679 98 16 114 23680 – 739 1,141 40 1,181 633>740 5,099 102 5,201 2,631
Total $ 6,348 $ 159 $ 6,507 $ 3,287
Updated FICO
<620 $ 54 $ 6 $ 60 $ 49620 – 679 191 13 204 117680 – 739 940 34 974 510>740 5,163 106 5,269 2,611
Total $ 6,348 $ 159 $ 6,507 $ 3,287
Origination LTV
<70% $ 4,189 $ 97 $ 4,286 $ 2,225>70% – <90% 2,142 54 2,196 1,036>90% – <100% 17 8 25 26
Total $ 6,348 $ 159 $ 6,507 $ 3,287
Percent of Loans that are 90+ Days Past Due and Weighted Less than 90 Days Average Utilization Past Due but onDecember 31, 2012 Balance Updated FICO Rate (1) Nonaccrual Status
Residential real estate mortgages: Estimated Current LTV
<70% $ 4,162 772 N/A 0.05 % >70% – <90% 1,841 764 N/A 0.22 % >90% – <100% 168 750 N/A 0.51 % >100% 336 741 N/A 5.34 %
Total $ 6,507 768 N/A 0.38 %
Home equity lines of credit: Estimated Current LTV
<70% $ 1,559 773 36 % 0.14 % >70% – <90% 1,020 766 46 % 0.18 % >90% – <100% 267 759 54 % 0.44 % >100% 441 753 59 % 1.06 %
Total $ 3,287 767 42 % 0.31 %
(1) The Utilization Rate is calculated using the outstanding HELOC balance divided by the associated total line of credit.
N/A Not applicable.

THE CHARLES SCHWAB CORPORATION Notes to Consolidated Financial Statements
(Tabular Amounts in Millions, Except Per Share Data, Option Price Amounts, Ratios, or as Noted)
- 70 -
The Company monitors the credit quality of personal loans secured by securities by reviewing the fair value of collateral to ensure adequate collateralization of at least 100% of the principal amount of the loans. All of these personal loans were fully collateralized by securities with fair values in excess of borrowings at December 31, 2013 and 2012. 7. Equipment, Office Facilities, and Property Equipment, office facilities, and property are detailed below:
December 31, 2013 2012
Software $ 1,177 $ 1,067 Buildings 460 456 Leasehold improvements 300 287 Information technology equipment 245 398 Furniture and equipment 131 133 Telecommunications equipment 102 95 Construction in progress 95 7 Land 70 59
Total equipment, office facilities, and property 2,580 2,502 Accumulated depreciation and amortization (1,790) (1,827)
Total equipment, office facilities, and property – net $ 790 $ 675 Depreciation and amortization expense for equipment, office facilities, and property was $154 million, $149 million, $135 million in 2013, 2012, and 2011, respectively. 8. Intangible Assets and Goodwill The gross carrying value of intangible assets and accumulated amortization was:
December 31, 2013 December 31, 2012 Gross Net Gross Net Carrying Accumulated Carrying Carrying Accumulated Carrying Value Amortization Value Value Amortization Value
Customer relationships $ 274 $ 84 $ 190 $ 279 $ 51 $ 228Technology 89 27 62 89 16 73Trade name 17 4 13 17 2 15Other 2 1 1 5 2 3
Total intangible assets $ 382 $ 116 $ 266 $ 390 $ 71 $ 319 Amortization expense for intangible assets was $48 million, $47 million, and $20 million in 2013, 2012, and 2011, respectively. Estimated future annual amortization expense for intangible assets as of December 31, 2013, is as follows:
2014 $ 44 2015 $ 402016 $ 372017 $ 342018 $ 31Thereafter $ 80
Total intangible assets $ 266

THE CHARLES SCHWAB CORPORATION Notes to Consolidated Financial Statements
(Tabular Amounts in Millions, Except Per Share Data, Option Price Amounts, Ratios, or as Noted)
- 71 -
Goodwill impairment charges since January 1, 2002 are immaterial. The changes in the carrying amount of goodwill, as allocated to the Company’s reportable segments for purposes of testing goodwill for impairment going forward, are presented in the following table:
Investor Advisor Services Services Total
Balance at December 31, 2011 $ 1,083 $ 78 $ 1,161 Goodwill acquired and other changes during the period 45 22 67 Balance at December 31, 2012 1,128 100 1,228 Goodwill acquired and other changes during the period (1) - (1) Balance at December 31, 2013 $ 1,127 $ 100 $ 1,227 In testing for potential impairment of goodwill on April 1, 2013, management performed a qualitative assessment of each of the Company’s reporting units. As a result of this assessment, management concluded that goodwill was not impaired. The Company did not recognize any goodwill impairment in 2012 or 2011. 9. Other Assets The components of other assets are as follows:
December 31, 2013 2012
Accounts receivable (1) $ 328 $ 417 Interest and dividends receivable 171 150 Prepaid expenses 85 114 Other investments 59 59 Deferred tax asset – net 28 - Other 75 73
Total other assets $ 746 $ 813
(1) Accounts receivable includes accrued service fee income and a receivable from the Company’s loan servicer.
10. Deposits from Banking Clients Deposits from banking clients consist of interest-bearing and non-interest-bearing deposits as follows:
December 31, 2013 2012
Interest-bearing deposits: Deposits swept from brokerage accounts $ 72,166 $ 58,229 Checking 12,053 11,632 Savings and other 8,232 9,089
Total interest-bearing deposits 92,451 78,950 Non-interest-bearing deposits 521 427
Total deposits from banking clients $ 92,972 $ 79,377 11. Payables to Brokers, Dealers, and Clearing Organizations Payables to brokers, dealers, and clearing organizations include securities loaned of $1.2 billion and $882 million at December 31, 2013 and 2012, respectively. The cash collateral received from counterparties under securities lending transactions was equal to or greater than the market value of the securities loaned at December 31, 2013 and 2012.

THE CHARLES SCHWAB CORPORATION Notes to Consolidated Financial Statements
(Tabular Amounts in Millions, Except Per Share Data, Option Price Amounts, Ratios, or as Noted)
- 72 -
12. Payables to Brokerage Clients The principal source of funding for Schwab’s margin lending is cash balances in brokerage client accounts, which are included in payables to brokerage clients. Cash balances in interest-bearing brokerage client accounts were $28.8 billion and $32.6 billion at December 31, 2013 and 2012, respectively. The average rate paid on cash balances in interest-bearing brokerage client accounts was 0.01% in 2013 and 2012. 13. Borrowings Long-term debt including unamortized debt discounts and premiums, where applicable, consists of the following:
December 31, 2013 2012
Senior Notes $ 1,565 $ 1,288 Senior Medium-Term Notes, Series A 249 249 Finance lease obligation 89 95
Total long-term debt $ 1,903 $ 1,632 CSC has a universal automatic shelf registration statement (Shelf Registration Statement) on file with the Securities and Exchange Commission (the SEC), which enables CSC to issue debt, equity, and other securities. The Senior Notes outstanding at December 31, 2013, have maturities ranging from 2015 to 2022 and fixed interest rates ranging from 0.850% to 4.45% with interest payable semi-annually. On July 25, 2013, CSC issued $275 million of Senior Notes that mature in 2018 under its Shelf Registration Statement. The Senior Notes have a fixed interest rate of 2.20% with interest payable semi-annually. In August 2012, CSC completed an exchange offer with certain eligible holders of its 4.950% Senior Notes due 2014 (Old Senior Notes), whereby Old Senior Notes in an aggregate principal amount of $256 million were exchanged for the same aggregate principal amount of 3.225% Senior Notes due 2022 (New Senior Notes) and cash consideration of $19 million. Pursuant to an exchange and registration rights agreement (Registration Rights Agreement), CSC filed an exchange registration with the SEC and launched an exchange offer on December 11, 2012, to allow the holders of the New Senior Notes to exchange such New Senior Notes for an equal principal amount of notes with substantially identical terms, except that they are generally freely transferable under the Securities Act of 1933. The exchange offer was completed on January 23, 2013 and substantially all of the New Senior Notes were exchanged. These notes have a fixed interest rate of 3.225% with interest payable semiannually. On December 6, 2012, CSC issued $350 million of additional Senior Notes that mature in 2015 under the Shelf Registration Statement, which have a fixed interest rate of 0.850% with interest payable semi-annually. On December 21, 2012, CSC redeemed all of its remaining outstanding Old Senior Notes of $494 million. In connection with the redemption, CSC paid the holders of the Old Senior Notes a make-whole premium of $31 million in addition to the $494 million principal payment. The make-whole premium was recorded in other revenue – net. The Senior Medium-Term Notes, Series A (Medium-Term Notes) outstanding at December 31, 2013, mature in 2017 and have a fixed interest rate of 6.375% with interest payable semi-annually. CSC and Schwab Capital Trust I, a statutory trust formed under the laws of the State of Delaware (Trust), previously closed a public offering of $300 million of the Trust’s fixed to floating-rate trust preferred securities. The proceeds from the sale of the trust preferred securities were invested by the Trust in fixed to floating rate Junior Subordinated Notes issued by CSC, of which $202 million remained outstanding at August 30, 2012. On August 31, 2012, CSC redeemed all of the outstanding fixed-to-floating rate trust preferred securities issued by the Trust for $207 million. The trust preferred securities were redeemed, along with the common securities issued by the Trust and held by CSC, as a result of the concurrent redemption in whole by CSC of the Junior Subordinated Notes held by the Trust which underlay the trust preferred securities. The

THE CHARLES SCHWAB CORPORATION Notes to Consolidated Financial Statements
(Tabular Amounts in Millions, Except Per Share Data, Option Price Amounts, Ratios, or as Noted)
- 73 -
redemption price represented 100% of the liquidation amount of each trust preferred security, plus accumulated and unpaid distributions up to and including the redemption date. Schwab has a finance lease obligation related to an office building and land under a 20-year lease. The remaining finance lease obligation of $89 million at December 31, 2013, is being reduced by a portion of the lease payments over the remaining lease term of 11 years. Annual maturities on long-term debt outstanding at December 31, 2013, are as follows:
2014 $ 6 2015 357 2016 7 2017 258 2018 283 Thereafter 1,009 Total maturities 1,920 Unamortized discount, net (17)
Total long-term debt $ 1,903 CSC has authorization from its Board of Directors to issue unsecured commercial paper notes (Commercial Paper Notes) not to exceed $1.5 billion. Management has set a current limit for the commercial paper program of $800 million. The maturities of the Commercial Paper Notes may vary, but are not to exceed 270 days from the date of issue. The commercial paper is not redeemable prior to maturity and cannot be voluntarily prepaid. The proceeds of the commercial paper program are to be used for general corporate purposes. There were no borrowings of Commercial Paper Notes outstanding at December 31, 2013. At December 31, 2012, the amount of Commercial Paper Notes outstanding was $300 million, which is included in accrued expenses and other liabilities. The amount outstanding was repaid on January 2, 2013. CSC maintains an $800 million committed, unsecured credit facility with a group of 12 banks, which is scheduled to expire in June 2014. This facility replaced a similar facility that expired in June 2013. The funds under this facility are available for general corporate purposes. The financial covenants under this facility require Schwab to maintain a minimum net capital ratio, as defined, Schwab Bank to be well capitalized, as defined, and CSC to maintain a minimum level of stockholders’ equity. At December 31, 2013, the minimum level of stockholders’ equity required under this facility was $7.1 billion (CSC’s stockholders’ equity at December 31, 2013, was $10.4 billion). There were no borrowings outstanding under these facilities at December 31, 2013 or 2012. To manage short-term liquidity, Schwab maintains uncommitted, unsecured bank credit lines with a group of six banks totaling $942 million at December 31, 2013. CSC has direct access to $647 million of these credit lines. There were no borrowings outstanding under these lines at December 31, 2013 or 2012. To partially satisfy the margin requirement of client option transactions with the Options Clearing Corporation, Schwab has unsecured standby LOCs with five banks in favor of the Options Clearing Corporation aggregating $225 million at December 31, 2013. There were no funds drawn under any of these LOCs at December 31, 2013 or 2012. In connection with its securities lending activities, Schwab is required to provide collateral to certain brokerage clients. Schwab satisfies the collateral requirements by providing cash as collateral. In 2013, to partially satisfy the margin requirement of client option transactions with the Options Clearing Corporation, optionsXpress, Inc. issued an unsecured standby LOC with one bank in favor of the Options Clearing Corporation in the amount of $15 million. There were no funds drawn under this LOC at December 31, 2013.

THE CHARLES SCHWAB CORPORATION Notes to Consolidated Financial Statements
(Tabular Amounts in Millions, Except Per Share Data, Option Price Amounts, Ratios, or as Noted)
- 74 -
14. Commitments and Contingencies Operating leases: The Company has non-cancelable operating leases for office space and equipment. Future annual minimum rental commitments under these leases, net of contractual subleases, at December 31, 2013, are as follows:
Operating Leases Subleases Net
2014 $ 123 $ 34 $ 89 2015 108 34 74 2016 96 34 62 2017 81 28 53 2018 45 6 39 Thereafter 107 8 99
Total $ 560 $ 144 $ 416 Certain leases contain provisions for renewal options, purchase options, and rent escalations based on increases in certain costs incurred by the lessor. Rent expense was $208 million, $203 million, and $187 million in 2013, 2012, and 2011, respectively. Purchase obligations: The Company has purchase obligations for services such as advertising and marketing, telecommunications, professional services, and hardware- and software-related agreements. At December 31, 2013, the Company has purchase obligations as follows:
2014 $ 233 2015 108 2016 64 2017 8 2018 1 Thereafter 1
Total $ 415 Guarantees and indemnifications: In the normal course of business, the Company provides certain indemnifications (i.e., protection against damage or loss) to counterparties in connection with the disposition of certain of its assets. Such indemnifications are generally standard contractual terms with various expiration dates and typically relate to title to the assets transferred, ownership of intellectual property rights (e.g., patents), accuracy of financial statements, compliance with laws and regulations, failure to pay, satisfy or discharge any liability, or to defend claims, as well as errors, omissions, and misrepresentations. The maximum potential future liability under these indemnifications cannot be estimated. The Company has not recorded a liability for these indemnifications and believes that the occurrence of events that would trigger payments under these agreements is remote. The Company has clients that sell (i.e., write) listed option contracts that are cleared by the Options Clearing Corporation – a clearing house that establishes margin requirements on these transactions. The Company partially satisfies the margin requirements by arranging unsecured standby LOCs, in favor of the Options Clearing Corporation, which are issued by multiple banks. At December 31, 2013, the aggregate face amount of these LOCs totaled $240 million. There were no funds drawn under any of these LOCs at December 31, 2013. In connection with its securities lending activities, the Company is required to provide collateral to certain brokerage clients. The Company satisfies the collateral requirements by providing cash as collateral. The Company also provides guarantees to securities clearing houses and exchanges under standard membership agreements, which require members to guarantee the performance of other members. Under the agreements, if another member becomes unable to satisfy its obligations to the clearing houses and exchanges, other members would be required to meet shortfalls. The Company’s liability under these arrangements is not quantifiable and may exceed the cash and securities it has posted as collateral. However, the potential requirement for the Company to make payments under these arrangements is remote. Accordingly, no liability has been recognized for these guarantees.

THE CHARLES SCHWAB CORPORATION Notes to Consolidated Financial Statements
(Tabular Amounts in Millions, Except Per Share Data, Option Price Amounts, Ratios, or as Noted)
- 75 -
Legal contingencies: The Company is subject to claims and lawsuits in the ordinary course of business, including arbitrations, class actions and other litigation, some of which include claims for substantial or unspecified damages. The Company is also the subject of inquiries, investigations, and proceedings by regulatory and other governmental agencies. The Company believes it has strong defenses in all significant matters currently pending and is contesting liability and any damages claimed. Nevertheless, some of these matters may result in adverse judgments or awards, including penalties, injunctions or other relief, and the Company may also determine to settle a matter because of the uncertainty and risks of litigation. Described below are certain matters in which there is a reasonable possibility that a material loss could be incurred or where the matter may otherwise be of significant interest to stockholders. With respect to all other pending matters, based on current information and consultation with counsel, it does not appear that the outcome of any such matter could be material to the financial condition, operating results or cash flows of the Company. However, predicting the outcome of a litigation or regulatory matter is inherently difficult, requiring significant judgment and evaluation of various factors, including the procedural status of the matter and any recent developments; prior experience and the experience of others in similar cases; available defenses, including potential opportunities to dispose of a case on the merits or procedural grounds before trial (e.g., motions to dismiss or for summary judgment); the progress of fact discovery; the opinions of counsel and experts regarding potential damages; potential opportunities for settlement and the status of any settlement discussions; and potential insurance coverage and indemnification. Often, as in the case of the Auction Rate Securities Regulatory Inquiries and Total Bond Market Fund Litigation matters described below, it is not possible to reasonably estimate potential liability, if any, or a range of potential liability until the matter is closer to resolution – pending, for example, further proceedings, the outcome of key motions or appeals, or discussions among the parties. Numerous issues may have to be developed, such as discovery of important factual matters and determination of threshold legal issues, which may include novel or unsettled questions of law. Reserves are established or adjusted or further disclosure and estimates of potential loss are provided as the matter progresses and more information becomes available. Auction Rate Securities Regulatory Inquiries: Schwab has been responding to industry wide inquiries from federal and state regulators regarding sales of auction rate securities to clients who were unable to sell their holdings when the normal auction process for those securities froze unexpectedly in February 2008. On August 17, 2009, a civil complaint was filed against Schwab in New York state court by the Attorney General of the State of New York (NYAG) alleging material misrepresentations and omissions by Schwab regarding the risks of auction rate securities, and seeking restitution, disgorgement, penalties and other relief, including repurchase of securities held in client accounts. As reflected in a statement issued August 17, 2009, Schwab has responded that the allegations are without merit, and has been contesting all charges. By order dated October 24, 2011, the court granted Schwab’s motion to dismiss the complaint with prejudice. The NYAG appealed, and in a decision issued August 29, 2013, the Appellate Division reinstated two of the NYAG’s four causes of action. On December 31, 2013, the Appellate Division denied a petition by the NYAG for reconsideration and reinstatement of one of the other two causes of action. Total Bond Market Fund Litigation: On August 28, 2008, a class action lawsuit was filed in the U.S. District Court for the Northern District of California on behalf of investors in the Schwab Total Bond Market Fund™ (Northstar lawsuit). The lawsuit, which alleges violations of state law and federal securities law in connection with the fund’s investment policy, names Schwab Investments (registrant and issuer of the fund’s shares) and CSIM as defendants. Allegations include that the fund improperly deviated from its stated investment objectives by investing in collateralized mortgage obligations (CMOs) and investing more than 25% of fund assets in CMOs and mortgage-backed securities without obtaining a shareholder vote. Plaintiffs seek unspecified compensatory and rescission damages, unspecified equitable and injunctive relief, costs and attorneys’ fees. Plaintiffs’ federal securities law claim and certain of plaintiffs’ state law claims were dismissed in proceedings before the court and following a successful petition by defendants to the Ninth Circuit Court of Appeals. On August 8, 2011, the court dismissed plaintiffs’ remaining claims with prejudice. Plaintiffs have again appealed to the Ninth Circuit, where the case is currently pending. optionsXpress Regulatory Matters: optionsXpress entities and individual employees have been responding to certain pending regulatory matters which predate the Company’s acquisition of optionsXpress. On April 16, 2012, optionsXpress, Inc. was charged by the SEC in an administrative proceeding alleging violations of the firm’s close-out obligations under Regulation SHO (short sale delivery rules) in connection with certain customer trading activity. Following trial, in a decision issued June 7, 2013, the judge held that optionsXpress violated Regulation SHO and aided and abetted fraudulent trading activity by

THE CHARLES SCHWAB CORPORATION Notes to Consolidated Financial Statements
(Tabular Amounts in Millions, Except Per Share Data, Option Price Amounts, Ratios, or as Noted)
- 76 -
its customer, and ordered the firm to pay disgorgement and penalties. The Company continues to dispute the allegations and is appealing the decision. The Company has a contingent liability associated with this matter, which was not material at December 31, 2013. 15. Financial Instruments Subject to Off-Balance Sheet Credit Risk or Concentration Risk Off-Balance Sheet Credit Risk Securities lending: The Company loans client securities temporarily to other brokers in connection with its securities lending activities and receives cash as collateral for the securities loaned. Increases in security prices may cause the fair value of the securities loaned to exceed the amount of cash received as collateral. In the event the counterparty to these transactions does not return the loaned securities or provide additional cash collateral, the Company may be exposed to the risk of acquiring the securities at prevailing market prices in order to satisfy its client obligations. The Company mitigates this risk by requiring credit approvals for counterparties, monitoring the fair value of securities loaned, and requiring additional cash as collateral when necessary. The fair value of client securities pledged in securities lending transactions to other broker-dealers was $1.1 billion and $852 million at December 31, 2013 and 2012, respectively. The Company has also pledged a portion of its securities owned in connection with securities lending transactions to other broker-dealers. Additionally, the Company borrows securities from other broker-dealers to fulfill short sales by clients. The fair value of these borrowed securities was $276 million and $121 million at December 31, 2013 and 2012, respectively. All of the Company’s securities lending transactions are subject to enforceable master netting arrangements with other broker-dealers. However, the Company does not net securities lending transactions and therefore, the Company’s securities loaned and securities borrowed are presented gross in the consolidated balance sheets. Client trade settlement: The Company is obligated to settle transactions with brokers and other financial institutions even if the Company’s clients fail to meet their obligations to the Company. Clients are required to complete their transactions on settlement date, generally three business days after the trade date. If clients do not fulfill their contractual obligations, the Company may incur losses. The Company has established procedures to reduce this risk by requiring deposits from clients in excess of amounts prescribed by regulatory requirements for certain types of trades, and therefore the potential to make payments under these client transactions is remote. Accordingly, no liability has been recognized for these transactions. Margin lending: The Company provides margin loans to its clients which are collateralized by securities in their brokerage accounts and may be liable for the margin requirement of its client margin securities transactions. As clients write options or sell securities short, the Company may incur losses if the clients do not fulfill their obligations and the collateral in client accounts is insufficient to fully cover losses which clients may incur from these strategies. To mitigate this risk, the Company monitors required margin levels and requires clients to deposit additional collateral, or reduce positions to meet minimum collateral requirements. The contractual value of margin loans to clients was $12.8 billion and $11.6 billion at December 31, 2013 and 2012, respectively. Clients with margin loans have agreed to allow the Company to pledge collateralized securities in their brokerage accounts in accordance with federal regulations. Under such regulations, the Company was allowed to pledge securities with a fair value of $18.2 billion and $17.1 billion at December 31, 2013 and 2012, respectively. The fair value of client securities pledged to fulfill the short sales of its clients was $1.6 billion and $1.2 billion at December 31, 2013 and 2012, respectively. The fair value of client securities pledged to fulfill the Company’s proprietary short sales, which resulted from facilitating clients’ dividend reinvestment elections, was $130 million and $109 million at December 31, 2013 and 2012, respectively. The Company may also pledge client securities to fulfill client margin requirements for open option contracts established with the OCC. The fair value of these pledged securities to the OCC was $1.3 billion and $1.9 billion at December 31, 2013 and 2012, respectively. Resale and repurchase agreements: Schwab enters into collateralized resale agreements principally with other broker-dealers, which could result in losses in the event the counterparty fails to purchase the securities held as collateral for the cash advanced and the fair value of the securities declines. To mitigate this risk, Schwab requires that the counterparty deliver securities to a custodian, to be held as collateral, with a fair value in excess of the resale price. Schwab also sets standards for the credit quality of the counterparty, monitors the fair value of the underlying securities as compared to the related

THE CHARLES SCHWAB CORPORATION Notes to Consolidated Financial Statements
(Tabular Amounts in Millions, Except Per Share Data, Option Price Amounts, Ratios, or as Noted)
- 77 -
receivable, including accrued interest, and requires additional collateral where deemed appropriate. At December 31, 2013 and 2012, the fair value of collateral received in connection with resale agreements that are available to be repledged or sold was $14.3 billion and $19.7 billion, respectively. Schwab utilizes the collateral provided under repurchase agreements to meet obligations under broker-dealer client protection rules, which place limitations on its ability to access such segregated securities. For Schwab to repledge or sell this collateral, it would be required to deposit cash and/or securities of an equal amount into its segregated reserve bank accounts in order to meet its segregated cash and investment requirement. The Company’s resale agreements are not subject to master netting arrangements. Commitments to extend credit: Schwab Bank enters into commitments to extend credit to banking clients. Schwab Bank also has commitments to purchase certain First Mortgage loans and HELOCs under the Program with Quicken Loans, which began in 2012. The credit risk associated with these commitments varies depending on the creditworthiness of the client and the value of any collateral expected to be held. Collateral requirements vary by type of loan. At December 31, 2013 and 2012, the Company had commitments to purchase First Mortgage loans of $208 million and $867 million, respectively. Schwab Bank also has commitments to extend credit related to its clients’ unused HELOCs, personal loans secured by securities, and other lines of credit, which totaled $5.7 billion and $5.4 billion at December 31, 2013 and 2012, respectively. See also note “6 – Loans to Banking Clients and Related Allowance for Loan Losses.” Financial Guarantees: See note “14 – Commitments and Contingencies.” Concentration Risk The Company has exposure to concentration risk when holding large positions of financial instruments collateralized by assets with similar economic characteristics or in securities of a single issuer or industry. The fair value of the Company’s investments in mortgage-backed securities totaled $48.9 billion at December 31, 2013. Of these, $47.1 billion were issued by U.S. agencies and $1.8 billion were issued by private entities (non-agency securities). The fair value of the Company’s investments in mortgage-backed securities totaled $39.5 billion at December 31, 2012. Of these, $38.8 billion were issued by U.S. agencies and $733 million were non-agency securities. These U.S. agency and non-agency securities are included in securities available for sale and securities held to maturity. The fair value of the Company’s investments in corporate debt securities and commercial paper totaled $9.2 billion and $8.0 billion at December 31, 2013 and 2012, respectively, with the majority issued by institutions in the financial services industry. These securities are included in securities available for sale, securities held to maturity, cash and cash equivalents, and other securities owned. The fair value of the Company’s investments in asset-backed securities totaled $15.2 billion and $8.2 billion at December 31, 2013 and 2012, respectively, with the majority serviced by a single servicer. The Company’s loans to banking clients include $7.3 billion and $6.0 billion of adjustable rate first lien residential real estate mortgage loans at December 31, 2013 and 2012, respectively. At December 31, 2013, approximately 40% of these mortgages consisted of loans with interest-only payment terms. At December 31, 2013, the interest rates on approximately 70% of these interest-only loans are not scheduled to reset for three or more years. At December 31, 2013, 46% of the residential real estate mortgages and 51% of the HELOC balances were secured by properties which are located in California. At December 31, 2012, 45% of the residential real estate mortgages and 50% of the HELOC balances were secured by properties which are located in California. For additional detail on concentrations in loans to banking clients, see note “6 – Loans to Banking Clients and Related Allowance for Loan Losses.” The Company also has exposure to concentration risk from its margin and securities lending activities collateralized by securities of a single issuer or industry. This concentration risk is mitigated by collateral arrangements that require the fair value of such collateral exceeds the amounts loaned, as described above.

THE CHARLES SCHWAB CORPORATION Notes to Consolidated Financial Statements
(Tabular Amounts in Millions, Except Per Share Data, Option Price Amounts, Ratios, or as Noted)
- 78 -
16. Fair Values of Assets and Liabilities For a description of the fair value hierarchy and the Company’s fair value methodologies, including the use of independent third-party pricing services, see note “2 – Summary of Significant Accounting Policies.” The Company did not transfer any assets or liabilities between Level 1 and Level 2 during 2013 or 2012. In addition, the Company did not adjust prices received from the primary independent third-party pricing service at December 31, 2013 or 2012. Financial Instruments Recorded at Fair Value The following tables present the fair value hierarchy for assets measured at fair value. Liabilities recorded at fair value were not material, and therefore are not included in the following tables:
Quoted Prices in Active Markets Significant Significant for Identical Other Observable Unobservable Assets Inputs Inputs Balance at December 31, 2013 (Level 1) (Level 2) (Level 3) Fair Value
Cash equivalents: Money market funds $ 1,141 $ - $ - $ 1,141 Commercial paper - 22 - 22
Total cash equivalents 1,141 22 - 1,163 Investments segregated and on deposit for
regulatory purposes: Certificates of deposit - 2,737 - 2,737 U.S. Government securities - 2,539 - 2,539
Total investments segregated and on deposit for regulatory purposes - 5,276 - 5,276
Other securities owned: Schwab Funds® money market funds 261 - - 261 Equity and bond mutual funds 208 - - 208 State and municipal debt obligations - 32 - 32 Equity, U.S. Government and corporate debt, and
other securities 1 15 - 16 Total other securities owned 470 47 - 517
Securities available for sale: U.S. agency mortgage-backed securities - 18,645 - 18,645 Asset-backed securities - 15,206 - 15,206 Corporate debt securities - 9,007 - 9,007 U.S. agency notes - 4,136 - 4,136 Certificates of deposit - 3,652 - 3,652 Non-agency residential mortgage-backed securities - 593 - 593 Non-agency commercial mortgage-backed securities - 279 - 279 Other securities - 100 - 100
Total securities available for sale - 51,618 - 51,618 Total $ 1,611 $ 56,963 $ - $ 58,574

THE CHARLES SCHWAB CORPORATION Notes to Consolidated Financial Statements
(Tabular Amounts in Millions, Except Per Share Data, Option Price Amounts, Ratios, or as Noted)
- 79 -
Quoted Prices in Active Markets Significant Significant for Identical Other Observable Unobservable Assets Inputs Inputs Balance at December 31, 2012 (Level 1) (Level 2) (Level 3) Fair Value
Cash equivalents: Money market funds $ 413 $ - $ - $ 413 Commercial paper - 1,076 - 1,076
Total cash equivalents 413 1,076 - 1,489 Investments segregated and on deposit for
regulatory purposes: Certificates of deposit - 2,976 - 2,976 U.S. Government securities - 1,767 - 1,767
Total investments segregated and on deposit for
regulatory purposes - 4,743 - 4,743 Other securities owned:
Schwab Funds® money market funds 329 - - 329 Equity and bond mutual funds 217 - - 217 State and municipal debt obligations - 48 - 48 Equity, U.S. Government and corporate debt, and
other securities 2 40 - 42 Total other securities owned 548 88 - 636
Securities available for sale: U.S. agency mortgage-backed securities - 20,476 - 20,476 Asset-backed securities - 8,164 - 8,164 Corporate debt securities - 6,256 - 6,256 Certificates of deposit - 6,161 - 6,161 U.S. agency notes - 3,464 - 3,464 Non-agency residential mortgage-backed securities - 733 - 733 Commercial paper - 574 - 574 Other securities - 295 - 295
Total securities available for sale - 46,123 - 46,123 Total $ 961 $ 52,030 $ - $ 52,991

THE CHARLES SCHWAB CORPORATION Notes to Consolidated Financial Statements
(Tabular Amounts in Millions, Except Per Share Data, Option Price Amounts, Ratios, or as Noted)
- 80 -
Financial Instruments Not Recorded at Fair Value Descriptions of the valuation methodologies and assumptions used to estimate the fair value of financial instruments not recorded at fair value are also described in note “2 – Summary of Significant Accounting Policies.” There were no significant changes in these methodologies or assumptions during 2013. The following table presents the fair value hierarchy for financial instruments not recorded at fair value at December 31, 2013:
Quoted Prices in Active Markets Significant Significant for Identical Other Observable Unobservable Carrying Assets Inputs Inputs Balance atDecember 31, 2013 Amount (Level 1) (Level 2) (Level 3) Fair Value
Assets: Cash and cash equivalents $ 6,565 $ - $ 6,565 $ - $ 6,565 Cash and investments segregated and
on deposit for regulatory purposes 18,273 - 18,273 - 18,273 Receivables from brokers, dealers, and
clearing organizations 509 - 509 - 509 Receivables from brokerage clients – net 13,949 - 13,949 - 13,949 Securities held to maturity:
U.S. agency mortgage-backed securities 29,260 - 28,500 - 28,500 Non-agency commercial mortgage-backed
securities 958 - 890 - 890 Other securities 100 - 100 - 100
Total securities held to maturity 30,318 - 29,490 - 29,490 Loans to banking clients – net:
Residential real estate mortgages 8,006 - 7,930 - 7,930 Home equity lines of credit 3,041 - 3,043 - 3,043 Personal loans secured by securities 1,384 - 1,384 - 1,384 Other 36 - 35 - 35
Total loans to banking clients – net 12,467 - 12,392 - 12,392 Other assets 64 - 64 - 64
Total $ 82,145 $ - $ 81,242 $ - $ 81,242
Liabilities: Deposits from banking clients $ 92,972 $ - $ 92,972 $ - $ 92,972 Payables to brokers, dealers, and clearing
organizations 1,467 - 1,467 - 1,467 Payables to brokerage clients 35,333 - 35,333 - 35,333 Accrued expenses and other liabilities 680 - 680 - 680 Long-term debt 1,903 - 1,989 - 1,989
Total $ 132,355 $ - $ 132,441 $ - $ 132,441

THE CHARLES SCHWAB CORPORATION Notes to Consolidated Financial Statements
(Tabular Amounts in Millions, Except Per Share Data, Option Price Amounts, Ratios, or as Noted)
- 81 -
Quoted Prices in Active Markets Significant Significant for Identical Other Observable Unobservable Carrying Assets Inputs Inputs Balance atDecember 31, 2012 Amount (Level 1) (Level 2) (Level 3) Fair Value
Assets: Cash and cash equivalents $ 11,174 $ - $ 11,174 $ - $ 11,174 Cash and investments segregated and
on deposit for regulatory purposes 23,723 - 23,723 - 23,723 Receivables from brokers, dealers, and
clearing organizations 333 - 333 - 333 Receivables from brokerage clients – net 13,453 - 13,453 - 13,453 Securities held to maturity:
U.S. agency mortgage-backed securities 17,750 - 18,289 - 18,289 Other securities 444 - 443 - 443
Total securities held to maturity 18,194 - 18,732 - 18,732 Loans to banking clients – net:
Residential real estate mortgages 6,471 - 6,687 - 6,687 Home equity lines of credit 3,267 - 3,295 - 3,295 Personal loans secured by securities 963 - 963 - 963 Other 25 - 24 - 24
Total loans to banking clients – net 10,726 - 10,969 - 10,969 Other assets 64 - 64 - 64
Total $ 77,667 $ - $ 78,448 $ - $ 78,448
Liabilities: Deposits from banking clients $ 79,377 $ - $ 79,377 $ - $ 79,377 Payables to brokers, dealers, and clearing
organizations 1,068 - 1,068 - 1,068 Payables to brokerage clients 40,330 - 40,330 - 40,330 Accrued expenses and other liabilities 353 - 353 - 353 Long-term debt 1,632 - 1,782 - 1,782
Total $ 122,760 $ - $ 122,910 $ - $ 122,910
17. Stockholders’ Equity The Company did not issue any shares of common stock during 2013, 2012, or 2011, respectively. The Company was authorized to issue 9,940,000 shares of preferred stock, $0.01 par value, at December 31, 2013 and 2012. The Company’s preferred stock issued and outstanding is as follows:
December 31, 2013 2012 Shares Shares Issued and Liquidation Issued and Liquidation Outstanding Preference Liquidation Carrying Outstanding Preference Liquidation Carrying (In thousands) Per Share Preference Value (In thousands) Per Share Preference Value
Series A 400 $ 1,000 $ 400 $ 395 400 $ 1,000 $ 400 $ 394 Series B 485 $ 1,000 485 474 485 $ 1,000 485 471 Total Preferred Stock 885 $ 885 $ 869 885 $ 885 $ 865
In January 2012, the Company issued and sold 400,000 shares of fixed-to-floating rate non-cumulative perpetual preferred stock, Series A (Series A Preferred Stock). Net proceeds received from the sale were $394 million. The Series A Preferred Stock has no stated maturity and has a fixed dividend rate of 7.000% until February 2022 and a floating rate equal to three-month LIBOR plus 4.820% thereafter. During the fixed rate period, dividends, if declared, will be payable semi-annually in arrears. During the floating rate period, dividends, if declared, will be payable quarterly in arrears. Dividends are not

THE CHARLES SCHWAB CORPORATION Notes to Consolidated Financial Statements
(Tabular Amounts in Millions, Except Per Share Data, Option Price Amounts, Ratios, or as Noted)
- 82 -
cumulative. Under the terms of the Series A Preferred Stock, the Company’s ability to pay dividends on, make distributions with respect to, or to repurchase, redeem or acquire its common stock or any preferred stock ranking on parity with or junior to the Series A Preferred Stock, is subject to restrictions in the event that the Company does not declare and either pay or set aside a sum sufficient for payment of dividends on the Series A Preferred Stock for the immediately preceding dividend period. The Series A Preferred Stock is redeemable at the Company’s option, in whole or in part, on any dividend payment date on or after February 1, 2022 or, in whole but not in part, within 90 days following a regulatory capital treatment event as defined in its Certificate of Designations. In June 2012, the Company issued and sold 19,400,000 depositary shares, each representing a 1/40th ownership interest in a share of 6.00% non-cumulative perpetual preferred stock, Series B, equivalent to $25 per depositary share (Series B Preferred Stock). Net proceeds received from the sale were $469 million. The Series B Preferred Stock has no stated maturity and has a fixed dividend rate of 6.00%. Dividends, if declared, will be payable quarterly in arrears. Dividends are not cumulative. Under the terms of the Series B Preferred Stock, the Company’s ability to pay dividends on, make distributions with respect to, or to repurchase, redeem or acquire its common stock or any preferred stock ranking on parity with or junior to the Series B Preferred Stock, is subject to restrictions in the event that the Company does not declare and either pay or set aside a sum sufficient for payment of dividends on the Series B Preferred Stock for the immediately preceding dividend period. The Series B Preferred Stock is redeemable at the Company’s option, in whole or in part, on any dividend payment date on or after September 1, 2017 or, in whole but not in part, within 90 days following a regulatory capital treatment event as defined in its Certificate of Designations. 18. Accumulated Other Comprehensive Income Accumulated other comprehensive income represents cumulative gains and losses that are not reflected in earnings. The components of other comprehensive (loss) income are as follows:
Year Ended December 31, 2013 2012 2011 Before Tax Net of Before Tax Net of Before Tax Net of tax effect tax tax effect tax tax effect tax
Change in net unrealized gain on securities available for sale: Net unrealized (loss) gain $ (468) $ 176 $ (292) $ 470 $ (177) $ 293 $ (43) $ 16 $ (27)Reclassification of impairment charges
included in net impairment losses on securities 10 (4) 6 32 (12) 20 31 (12) 19
Other reclassifications included in other revenue (7) 3 (4) (38) 14 (24) 1 - 1
Change in net unrealized gain on securities available for sale (465) 175 (290) 464 (175) 289 (11) 4 (7)
Other 1 - 1 1 - 1 (1) - (1)Other comprehensive (loss) income $ (464) $ 175 $ (289) $ 465 $ (175) $ 290 $ (12) $ 4 $ (8)

THE CHARLES SCHWAB CORPORATION Notes to Consolidated Financial Statements
(Tabular Amounts in Millions, Except Per Share Data, Option Price Amounts, Ratios, or as Noted)
- 83 -
Accumulated other comprehensive income balances are as follows:
Net unrealized Total gain on securities accumulated other available for sale Other comprehensive income
Balance at December 31, 2010 $ 17 $ (1) $ 16 Other net changes (7) (1) (8)
Balance at December 31, 2011 $ 10 $ (2) $ 8 Other net changes 289 1 290
Balance at December 31, 2012 $ 299 $ (1) $ 298 Other net changes (290) 1 (289)
Balance at December 31, 2013 $ 9 $ - $ 9 19. Employee Incentive, Retirement, and Deferred Compensation Plans The Company’s stock incentive plans provide for granting options, restricted stock units, and restricted stock awards to employees, officers, and directors. In addition, the Company offers retirement and employee stock purchase plans to eligible employees and sponsors deferred compensation plans for eligible officers and non-employee directors. A summary of the Company’s stock-based compensation and related income tax benefit is as follows:
Year Ended December 31, 2013 2012 2011
Stock option expense $ 52 $ 57 $ 61 Restricted stock unit expense 60 40 23 Restricted stock award expense - 5 12 Employee stock purchase plan expense 4 3 3
Total stock-based compensation expense $ 116 $ 105 $ 99 Income tax benefit on stock-based compensation $ (43) $ (39) $ (37) The Company issues shares for stock options and restricted stock awards from treasury stock. At December 31, 2013, the Company was authorized to grant up to 67 million common shares under its existing stock incentive plans. Additionally, at December 31, 2013, the Company had 42 million shares reserved for future issuance under its employee stock purchase plan. As of December 31, 2013, there was $189 million of total unrecognized compensation cost, net of forfeitures, related to outstanding stock options, restricted stock awards, and restricted stock units, which is expected to be recognized through 2017 with a remaining weighted-average service period of 2.8 years. Stock Option Plan Options are granted for the purchase of shares of common stock at an exercise price not less than market value on the date of grant, and expire within seven or ten years from the date of grant. Options generally vest annually over a three- to five-year period from the date of grant. Certain options were granted at an exercise price above the market value of common stock on the date of grant (i.e., premium-priced options).

THE CHARLES SCHWAB CORPORATION Notes to Consolidated Financial Statements
(Tabular Amounts in Millions, Except Per Share Data, Option Price Amounts, Ratios, or as Noted)
- 84 -
The Company’s stock option activity is summarized below:
Weighted-
Weighted- Average
Average Remaining Aggregate
Number Exercise Price Contractual Intrinsic
of Options per Share Life (in years) Value
Outstanding at December 31, 2012 57 $ 16.04
Granted 7 $ 21.71
Exercised (16) $ 16.47
Forfeited (1) $ 13.39
Expired (1) $ 19.96
Outstanding at December 31, 2013 46 $ 16.74 6.83 $ 427
Vested and expected to vest at December 31, 2013 44 $ 16.76 6.74 $ 406
Vested and exercisable December 31, 2013 25 $ 17.17 5.33 $ 220
The aggregate intrinsic value in the table above represents the difference between CSC’s closing stock price and the exercise price of each in-the-money option on the last trading day of the period presented. Information on stock options granted and exercised is presented below:
Year Ended December 31, 2013 2012 2011
Weighted-average fair value of options granted per share $ 6.33 $ 4.07 $ 4.16 Cash received from options exercised $ 258 $ 35 $ 96 Tax benefit realized on options exercised $ - $ 1 $ 7 Aggregate intrinsic value of options exercised $ 82 $ 9 $ 38 Management uses a binomial option pricing model to estimate the fair value of options granted. The binomial model takes into account the contractual term of the stock option, expected volatility, dividend yield, and risk-free interest rate. Expected volatility is based on the implied volatility of publicly-traded options on CSC’s stock. Dividend yield is based on the average historical CSC dividend yield. The risk-free interest rate is based on the yield of a U.S. Treasury zero-coupon issue with a remaining term similar to the contractual term of the option. Management uses historical option exercise data, which includes employee termination data to estimate the probability of future option exercises. Management uses the Black-Scholes model to solve for the expected life of options valued with the binomial model presented below. The assumptions used to value the Company’s options granted during the years presented and their expected lives were as follows:
Year Ended December 31, 2013 2012 2011
Weighted-average expected dividend yield 1.13 % .99 % .85 % Weighted-average expected volatility 28 % 31 % 36 % Weighted-average risk-free interest rate 2.5 % 1.8 % 2.1 % Expected life (in years) 4.6 – 7.9 3.0 – 6.7 0.0 – 6.3 Restricted Stock Units Restricted stock units are awards that entitle the holder to receive shares of CSC’s common stock following a vesting period. Restricted stock units are restricted from transfer or sale and generally vest annually over a three- to five-year period, while some vest based upon the Company achieving certain financial or other measures. The fair value of restricted stock units is based on the market price of the Company’s stock on the date of grant. The grant date fair value is amortized to compensation expense on a straight-line basis over the requisite service period. The fair value of the restricted stock units that vested during each of the years 2013, 2012, and 2011 was $78 million, $30 million, and $13 million, respectively.

THE CHARLES SCHWAB CORPORATION Notes to Consolidated Financial Statements
(Tabular Amounts in Millions, Except Per Share Data, Option Price Amounts, Ratios, or as Noted)
- 85 -
The Company’s restricted stock units activity is summarized below:
Weighted- Average Grant Number Date Fair Value of Units per Unit
Outstanding at December 31, 2012 11 $ 13.34 Granted 4 $ 21.32 Vested (3) $ 22.44 Forfeited (1) $ 14.17
Outstanding at December 31, 2013 11 $ 16.11 Retirement Plan Upon completing three months of consecutive service, employees of the Company can participate in the Company’s qualified retirement plan, the SchwabPlan® Retirement Savings and Investment Plan. The Company may match certain employee contributions or make additional contributions to this plan at its discretion. The Company’s total expense was $63 million, $59 million, and $53 million in 2013, 2012, and 2011, respectively. Deferred Compensation Plans The Company’s deferred compensation plan for officers permits participants to defer the receipt of certain cash compensation. The deferred compensation liability was $135 million and $127 million at December 31, 2013 and 2012, respectively. The Company’s deferred compensation plan for non-employee directors permits participants to defer receipt of all or a portion of their director fees and to receive either a grant of stock options, or upon ceasing to serve as a director, the number of shares of CSC’s common stock that would have resulted from investing the deferred fee amount into CSC’s common stock. 20. Taxes on Income The components of income tax expense are as follows:
Year Ended December 31, 2013 2012 2011
Current: Federal $ 598 $ 489 $ 424 State 57 28 52
Total current 655 517 476
Deferred: Federal (20) 5 44 State (1) - 8
Total deferred (21) 5 52 Taxes on income $ 634 $ 522 $ 528

THE CHARLES SCHWAB CORPORATION Notes to Consolidated Financial Statements
(Tabular Amounts in Millions, Except Per Share Data, Option Price Amounts, Ratios, or as Noted)
- 86 -
The temporary differences that created deferred tax assets and liabilities are detailed below:
December 31, 2013 2012
Deferred tax assets: Employee compensation, severance, and benefits $ 190 $ 189Facilities lease commitments 33 35Reserves and allowances 30 37State and local taxes 12 -Net operating loss carryforwards 6 6
Total deferred tax assets 271 267Valuation allowance (4) (3)Deferred tax assets – net of valuation allowance 267 264
Deferred tax liabilities: Depreciation and amortization (142) (166)Capitalized internal-use software development costs (62) (50)Deferred cancellation of debt income (11) (11)Deferred loan costs (10) (15)Deferred Senior Note exchange (7) (6)Net unrealized gain on securities available for sale (5) (179)Other (2) (7)
Total deferred tax liabilities (239) (434)Deferred tax asset (liability) – net (1) $ 28 $ (170)
(1) Amounts are included in other assets and in accrued expenses and other liabilities at December 31, 2013 and 2012, respectively.
A reconciliation of the federal statutory income tax rate to the effective income tax rate is as follows:
Year Ended December 31, 2013 2012 2011
Federal statutory income tax rate 35.0 % 35.0 % 35.0 % State income taxes, net of federal tax benefit (1) 2.3 1.2 2.5 Other (0.1) (0.2) 0.4
Effective income tax rate 37.2 % 36.0 % 37.9 %
(1) Includes the impact of a non-recurring state tax benefit of which $4 million and $20 million were recorded in 2013 and 2012, respectively.
A reconciliation of the beginning and ending amount of unrecognized tax benefits is as follows:
December 31, 2013 2012
Balance at beginning of year $ 12 $ 13Additions for tax positions related to the current year 1 1Additions for tax positions related to prior years - 1Reductions due to lapse of statute of limitations (2) (2)Reductions for settlements with tax authorities (1) (1)
Balance at end of year $ 10 $ 12 The federal returns for 2010 through 2012 remain open to Federal tax examinations. The years open to examination by state and local governments vary by jurisdiction.

THE CHARLES SCHWAB CORPORATION Notes to Consolidated Financial Statements
(Tabular Amounts in Millions, Except Per Share Data, Option Price Amounts, Ratios, or as Noted)
- 87 -
21. Earnings Per Common Share Basic EPS is computed by dividing net income available to common stockholders by the weighted-average number of common shares outstanding during the period. The computation of diluted EPS is similar to the computation of basic EPS except that the denominator is increased to include the number of additional common shares that would have been outstanding if dilutive potential common shares had been issued. Dilutive potential common shares include the effect of outstanding stock options and unvested restricted stock awards and units. EPS under the basic and diluted computations is as follows:
Year Ended December 31, 2013 2012 2011
Net income $ 1,071 $ 928 $ 864Preferred stock dividends (61) (45) -
Net income available to common stockholders $ 1,010 $ 883 $ 864
Weighted-average common shares outstanding — basic 1,285 1,274 1,227Common stock equivalent shares related to stock incentive plans 8 1 2
Weighted-average common shares outstanding — diluted (1) 1,293 1,275 1,229Basic EPS $ .78 $ .69 $ .70Diluted EPS $ .78 $ .69 $ .70
(1) Antidilutive stock options and restricted stock awards excluded from the calculation of diluted EPS totaled 34 million, 74 million, and 63 million shares in 2013, 2012, and 2011, respectively.
22. Regulatory Requirements CSC is a savings and loan holding company and Schwab Bank, CSC’s depository institution subsidiary, is a federal savings bank. CSC is subject to supervision and regulation by the Board of Governors of the Federal Reserve System (the Federal Reserve) and Schwab Bank is subject to supervision and regulation by the Office of the Comptroller of the Currency (the OCC). CSC is currently not subject to specific statutory capital requirements, however CSC is required to serve as a source of strength for Schwab Bank. Under the “Dodd-Frank Wall Street Reform and Consumer Protection Act,” CSC will be subject to new minimum leverage and minimum risk-based capital ratio requirements that will be set by the Federal Reserve that are at least as stringent as the current requirements generally applicable to insured depository institutions. Schwab Bank is subject to regulation and supervision and to various requirements and restrictions under federal and state laws, including regulatory capital guidelines. Among other things, these requirements also restrict and govern the terms of affiliate transactions, such as extensions of credit and repayment of loans between Schwab Bank and CSC or CSC’s other subsidiaries. In addition, Schwab Bank is required to provide notice to and may be required to obtain approval of the OCC and the Federal Reserve to declare dividends to CSC. The federal banking agencies have broad powers to enforce these regulations, including the power to terminate deposit insurance, impose substantial fines and other civil and criminal penalties, and appoint a conservator or receiver. Under the Federal Deposit Insurance Act, Schwab Bank could be subject to restrictive actions if it were to fall within one of the lowest three of five capital categories. Schwab Bank is required to maintain minimum capital levels as specified in federal banking laws and regulations. Failure to meet the minimum levels could result in certain mandatory, and possibly additional discretionary actions by the regulators that, if undertaken, could have a direct material effect on Schwab Bank. At December 31, 2013, CSC and Schwab Bank met the capital level requirements.

THE CHARLES SCHWAB CORPORATION Notes to Consolidated Financial Statements
(Tabular Amounts in Millions, Except Per Share Data, Option Price Amounts, Ratios, or as Noted)
- 88 -
The regulatory capital and ratios for Schwab Bank are as follows:
Minimum to be Minimum Capital Actual Well Capitalized Requirement Amount Ratio Amount Ratio Amount Ratio
December 31, 2013 Tier 1 Risk-Based Capital $ 6,550 19.0 % $ 2,074 6.0 % $ 1,383 4.0 % Total Risk-Based Capital $ 6,599 19.1 % $ 3,457 10.0 % $ 2,766 8.0 % Tier 1 Leverage $ 6,550 6.6 % $ 4,993 5.0 % $ 3,994 4.0 % Tangible Equity $ 6,550 6.6 % N/A $ 1,997 2.0 %
December 31, 2012 Tier 1 Risk-Based Capital $ 5,707 20.0 % $ 1,709 6.0 % $ 1,139 4.0 % Total Risk-Based Capital $ 5,760 20.2 % $ 2,848 10.0 % $ 2,279 8.0 % Tier 1 Leverage $ 5,707 6.7 % $ 4,266 5.0 % $ 3,412 4.0 % Tangible Equity $ 5,707 6.7 % N/A $ 1,706 2.0 %
N/A Not applicable. Based on its regulatory capital ratios at December 31, 2013 and 2012, Schwab Bank is considered well capitalized (the highest category) pursuant to banking regulatory guidelines. There are no conditions or events since December 31, 2013, that management believes have changed Schwab Bank’s capital category. The Federal Reserve requires Schwab Bank to maintain reserve balances at the Federal Reserve Bank based on certain deposit levels. Schwab Bank’s average reserve requirement was $1.2 billion and $1.1 billion in 2013 and 2012, respectively. CSC’s principal U.S. broker-dealers are Schwab and optionsXpress, Inc. optionsXpress, Inc. is a wholly-owned subsidiary of optionsXpress. Schwab and optionsXpress, Inc. are both subject to Rule 15c3-1 under the Securities Exchange Act of 1934 (the Uniform Net Capital Rule). Schwab and optionsXpress, Inc. compute net capital under the alternative method permitted by the Uniform Net Capital Rule. This method requires the maintenance of minimum net capital, as defined, of the greater of 2% of aggregate debit balances arising from client transactions or a minimum dollar requirement ($250,000 for Schwab), which is based on the type of business conducted by the broker-dealer. Under the alternative method, a broker-dealer may not repay subordinated borrowings, pay cash dividends, or make any unsecured advances or loans to its parent company or employees if such payment would result in a net capital amount of less than 5% of aggregate debit balances or less than 120% of its minimum dollar requirement. optionsXpress, Inc. is also subject to Commodity Futures Trading Commission Regulation 1.17 (Reg. 1.17) under the Commodity Exchange Act, which also requires the maintenance of minimum net capital. optionsXpress, Inc., as a futures commission merchant, is required to maintain minimum net capital equal to the greater of its net capital requirement under Reg. 1.17 ($1 million), or the sum of 8% of the total risk margin requirements for all positions carried in client accounts and 8% of the total risk margin requirements for all positions carried in non-client accounts (as defined in Reg. 1.17). Net capital and net capital requirements for Schwab and optionsXpress, Inc. at December 31, 2013, are as follows:
Net Capital Net Capital % of Minimum 2% of in Excess of in Excess of 5% Aggregate Net Capital Aggregate Required of Aggregate Net Capital Debit Balances Required Debit Balances Net Capital Debit Balances
Schwab $ 1,446 10 % $ 0.250 $ 295 $ 1,151 $ 707
optionsXpress, Inc. $ 102 36 % $ 1 $ 6 $ 96 $ 88
Schwab and optionsXpress, Inc. are also subject to Rule 15c3-3 under the Securities Exchange Act of 1934 and other applicable regulations, which require them to maintain cash or qualified securities in a segregated reserve account for the exclusive benefit of clients. In accordance with Rule 15c3-3, Schwab and optionsXpress, Inc. had portions of their cash and investments segregated for the exclusive benefit of clients at December 31, 2013. Amounts included in cash and investments

THE CHARLES SCHWAB CORPORATION Notes to Consolidated Financial Statements
(Tabular Amounts in Millions, Except Per Share Data, Option Price Amounts, Ratios, or as Noted)
- 89 -
segregated and on deposit for regulatory purposes represent actual balances on deposit, whereas cash and investments required to be segregated and on deposit for regulatory purposes at December 31, 2013 for Schwab and optionsXpress, Inc. totaled $24.0 billion. On January 3, 2014, Schwab and optionsXpress, Inc. deposited a net amount of $965 million of cash into their segregated reserve bank accounts. Cash and investments required to be segregated and on deposit for regulatory purposes at December 31, 2012 for Schwab and optionsXpress, Inc. totaled $29.2 billion. On January 3, 2013, Schwab and optionsXpress, Inc. deposited a net amount of $1.2 billion of cash into their segregated reserve bank accounts. 23. Segment Information The Company’s two reportable segments are Investor Services and Advisor Services. The Company structures its operating segments according to its clients and the services provided to those clients. The Investor Services segment provides retail brokerage and banking services to individual investors, retirement plan services, and corporate brokerage services. The Advisor Services segment provides custodial, trading, and support services to independent investment advisors, and retirement business services to independent retirement plan advisors and recordkeepers whose plan assets are held at Schwab Bank. Revenues and expenses are allocated to the Company’s two segments based on which segment services the client. The accounting policies of the segments are the same as those described in note “2 – Summary of Significant Accounting Policies.” Financial information for the Company’s reportable segments is presented in the following table. For the computation of its segment information, the Company utilizes an activity-based costing model to allocate traditional income statement line item expenses (e.g., compensation and benefits, depreciation and amortization, and professional services) to the business activities driving segment expenses (e.g., client service, opening new accounts, or business development) and a funds transfer pricing methodology to allocate certain revenues. The Company evaluates the performance of its segments on a pre-tax basis, excluding extraordinary or significant non-recurring items and results of discontinued operations. Segment assets and liabilities are not used for evaluating segment performance or in deciding how to allocate resources to segments. However, capital expenditures are used in resource allocation and are therefore disclosed. There are no revenues from transactions between the segments. Capital expenditures are reported gross, and are not net of proceeds from the sale of fixed assets. Financial information for the Company’s reportable segments is presented in the following table:
Investor Services Advisor Services Unallocated Total
Year Ended December 31, 2013 2012 2011 2013 2012 2011 2013 2012 2011 2013 2012 2011
Net Revenues:
Asset management and
administration fees $ 1,627 $ 1,436 $ 1,357 $ 689 $ 607 $ 571 $ (1) $ - $ - $ 2,315 $ 2,043 $ 1,928
Net interest revenue 1,756 1,559 1,542 224 205 183 - - - 1,980 1,764 1,725
Trading revenue 621 612 667 292 255 260 - 1 - 913 868 927
Other – net (1) 178 123 98 57 62 62 1 71 - 236 256 160
Provision for loan losses 1 (15) (16) - (1) (2) - - - 1 (16) (18)
Net impairment losses
on securities (9) (29) (29) (1) (3) (2) - - - (10) (32) (31)
Total net revenues 4,174 3,686 3,619 1,261 1,125 1,072 - 72 - 5,435 4,883 4,691
Expenses Excluding Interest 2,899 2,693 2,569 831 739 731 - 1 (1) 3,730 3,433 3,299
Income before taxes on income $ 1,275 $ 993 $ 1,050 $ 430 $ 386 $ 341 $ - $ 71 $ 1 $ 1,705 $ 1,450 $ 1,392
Capital expenditures $ 190 $ 98 $ 134 $ 80 $ 40 $ 56 $ - $ - $ - $ 270 $ 138 $ 190
Depreciation and amortization $ 155 $ 157 $ 122 $ 47 $ 39 $ 33 $ - $ - $ - $ 202 $ 196 $ 155
(1) Unallocated amount includes a non-recurring gain of $70 million relating to a confidential resolution of a vendor dispute in 2012.
Fees received from Schwab’s proprietary mutual funds represented 9% of the Company’s net revenues in 2013 and 10% in both 2012 and 2011. Except for Schwab’s proprietary mutual funds, which are considered a single client for purposes of this computation, no single client accounted for more than 10% of the Company’s net revenues in 2013, 2012, or 2011. Substantially all of the Company’s revenues and assets are generated or located in the U.S. The percentage of Schwab’s total client accounts located in California was 23% at December 31, 2013, 2012, and 2011.

THE CHARLES SCHWAB CORPORATION Notes to Consolidated Financial Statements
(Tabular Amounts in Millions, Except Per Share Data, Option Price Amounts, Ratios, or as Noted)
- 90 -
24. Business Acquisitions optionsXpress Holdings, Inc. On September 1, 2011, the Company acquired optionsXpress Holdings, Inc. (optionsXpress) for total consideration of $714 million. optionsXpress is an online brokerage firm primarily focused on equity option securities and futures. The optionsXpress® brokerage platform provides active investors and traders trading tools, analytics and education to execute a variety of investment strategies. The combination of optionsXpress and Schwab offers active investors an additional level of service and platform capabilities. Under the terms of the merger agreement, optionsXpress stockholders received 1.02 shares of the Company’s common stock for each share of optionsXpress stock. As a result, the Company issued 59 million shares of the Company’s common stock valued at $710 million, based on the closing price of the Company’s common stock on September 1, 2011. The Company also assumed optionsXpress’ stock-based compensation awards valued at $4 million. The results of optionsXpress’ operations have been included in the Company’s consolidated statement of income for the year ended December 31, 2013, 2012, and 2011, from the date of acquisition. optionsXpress’ net revenues were $142 million and $179 million in 2013 and 2012, respectively, and net income was $8 million and $6 million in 2013 and 2012, respectively. optionsXpress’ net revenues were $68 million and their net loss was not material for the period September 1, 2011 through December 31, 2011. The Company recorded intangible assets of $285 million, which are subject to amortization and are being amortized over their estimated useful lives using accelerated and straight-line methods of amortization. The following table summarizes the estimated fair value and useful lives of the intangible assets.
Estimated Estimated Useful Life September 1, 2011 Fair Value (In Years)
Customer relationships $ 200 11 Technology 70 9 Trade name 15 9
Total intangible assets $ 285
Pro Forma Financial Information (Unaudited) The following table presents unaudited pro forma financial information as if optionsXpress had been acquired prior to January 1, 2011. Pro forma net income for the year ended December 31, 2011, was adjusted to exclude $16 million, after tax, of acquisition related costs incurred by the Company in 2011. Additionally, pro forma net income below excludes $15 million, before tax, of acquisition related costs because these costs were incurred by optionsXpress prior to the acquisition date. Pro forma net income also reflects the impact of amortizing purchase accounting adjustments relating to intangible assets, net of tax, of $20 million, for the year ended December 31, 2011.
Year Ended December 31, 2011
Net revenues $ 4,857 Net income $ 896 Basic EPS $ .71 Diluted EPS $ .71 The unaudited pro forma financial information above is presented for illustrative purposes only and is not necessarily indicative of the results that actually would have occurred had the acquisition been completed prior to January 1, 2011, nor is it indicative of the results of operations for future periods.

THE CHARLES SCHWAB CORPORATION Notes to Consolidated Financial Statements
(Tabular Amounts in Millions, Except Per Share Data, Option Price Amounts, Ratios, or as Noted)
- 91 -
Other Business Acquisition On December 14, 2012, the Company acquired ThomasPartners, Inc., a growth and dividend income-focused asset management firm, for $85 million in cash. The Company recorded goodwill of $68 million and intangible assets of $32 million. The intangible assets primarily relate to customer relationships and are being amortized over 11 years. The goodwill was allocated to the Investor Services and Advisor Services segments in the amounts of $54 million and $14 million, respectively. 25. Subsequent Events The Company has evaluated the impact of events that have occurred subsequent to December 31, 2013, through the date the consolidated financial statements were filed with the SEC. Based on this evaluation, other than as recorded or disclosed within these consolidated financial statements and related notes, the Company has determined none of these events were required to be recognized or disclosed. 26. The Charles Schwab Corporation – Parent Company Only Financial Statements Condensed Statements of Income
Year Ended December 31, 2013 2012 2011
Interest revenue $ 4 $ 6 $ 4 Interest expense (65) (97) (103)
Net interest revenue (61) (91) (99) Other revenue – net - (30) 8 Expenses excluding interest (28) (23) (30) Loss before income tax benefit and equity in net income of subsidiaries (89) (144) (121) Income tax benefit 38 58 43 Loss before equity in net income of subsidiaries (51) (86) (78) Equity in net income of subsidiaries:
Equity in undistributed net income of subsidiaries 830 662 600 Dividends from bank subsidiary 163 50 150 Dividends from non-bank subsidiaries 129 302 192
Net Income 1,071 928 864 Preferred stock dividends 61 45 - Net Income Available to Common Stockholders $ 1,010 $ 883 $ 864

THE CHARLES SCHWAB CORPORATION Notes to Consolidated Financial Statements
(Tabular Amounts in Millions, Except Per Share Data, Option Price Amounts, Ratios, or as Noted)
- 92 -
Condensed Balance Sheets
December 31, 2013 2012
Assets Cash and cash equivalents $ 700 $ 1,339 Receivables from subsidiaries 162 80 Other securities owned – at fair value 80 74 Loans to non-bank subsidiaries 980 404 Investment in non-bank subsidiaries 3,828 3,615 Investment in bank subsidiary 6,576 6,022 Other assets 65 88
Total assets $ 12,391 $ 11,622
Liabilities and Stockholders’ Equity Accrued expenses and other liabilities $ 187 $ 482 Payables to subsidiaries 9 14 Long-term debt 1,814 1,537 Total liabilities 2,010 2,033 Stockholders’ equity 10,381 9,589
Total liabilities and stockholders’ equity $ 12,391 $ 11,622

THE CHARLES SCHWAB CORPORATION Notes to Consolidated Financial Statements
(Tabular Amounts in Millions, Except Per Share Data, Option Price Amounts, Ratios, or as Noted)
- 93 -
Condensed Statements of Cash Flows
Year Ended December 31, 2013 2012 2011
Cash Flows from Operating Activities Net income $ 1,071 $ 928 $ 864 Adjustments to reconcile net income to net cash provided by
operating activities: Equity in undistributed earnings of subsidiaries (830) (662) (591) Provision for deferred income taxes (11) 9 3 Other (4) 39 1
Net change in: Other securities owned (5) 3 6 Other assets 29 (21) 26 Accrued expenses and other liabilities 13 (5) (76)
Net cash provided by operating activities 263 291 233
Cash Flows from Investing Activities Due from subsidiaries – net (546) 43 24 Increase in investments in subsidiaries (225) (307) (366) Other investing activities (1) - 8 Net cash used for investing activities (772) (264) (334)
Cash Flows from Financing Activities Issuance of commercial paper - 300 - Repayment of commercial paper (300) - - Issuance of long-term debt 275 350 - Repayment of long-term debt - (727) - Premium paid on debt exchange - (19) - Net proceeds from preferred stock offering - 863 - Dividends paid (368) (337) (295) Proceeds from stock options exercised and other 258 35 96 Other financing activities 5 (5) 3 Net cash (used for) provided by financing activities (130) 460 (196) (Decrease) Increase in Cash and Cash Equivalents (639) 487 (297) Cash and Cash Equivalents at Beginning of Year 1,339 852 1,149
Cash and Cash Equivalents at End of Year $ 700 $ 1,339 $ 852

THE CHARLES SCHWAB CORPORATION Notes to Consolidated Financial Statements
(Tabular Amounts in Millions, Except Per Share Data, Option Price Amounts, Ratios, or as Noted)
- 94 -
27. Quarterly Financial Information (Unaudited)
Fourth Third Second First Quarter Quarter Quarter Quarter
Year Ended December 31, 2013: Net Revenues $ 1,435 $ 1,373 $ 1,337 $ 1,290 Expenses Excluding Interest $ 937 $ 909 $ 925 $ 959 Net Income $ 319 $ 290 $ 256 $ 206 Net Income Available to Common Stockholders $ 297 $ 282 $ 233 $ 198 Weighted Average Common Shares Outstanding – Diluted 1,304 1,296 1,288 1,282 Basic Earnings Per Common Share $ .23 $ .22 $ .18 $ .15Diluted Earnings Per Common Share $ .23 $ .22 $ .18 $ .15Dividends Declared Per Common Share $ .06 $ .06 $ .06 $ .06Range of Common Stock Price Per Share:
High $ 26.00 $ 22.69 $ 21.23 $ 18.11 Low $ 20.57 $ 20.74 $ 16.21 $ 15.05
Range of Price/Earnings Ratio (1): High 33 32 32 26 Low 26 30 24 22
Year Ended December 31, 2012: Net Revenues $ 1,215 $ 1,196 $ 1,283 $ 1,189 Expenses Excluding Interest $ 871 $ 835 $ 851 $ 876 Net Income $ 211 $ 247 $ 275 $ 195 Net Income Available to Common Stockholders $ 189 $ 238 $ 261 $ 195 Weighted Average Common Shares Outstanding – Diluted 1,278 1,275 1,274 1,273 Basic Earnings Per Common Share $ .15 $ .19 $ .20 $ .15Diluted Earnings Per Common Share $ .15 $ .19 $ .20 $ .15Dividends Declared Per Common Share $ .06 $ .06 $ .06 $ .06Range of Common Stock Price Per Share:
High $ 14.47 $ 14.43 $ 14.76 $ 15.38 Low $ 12.50 $ 12.14 $ 11.83 $ 11.61
Range of Price/Earnings Ratio (1): High 21 22 22 23 Low 18 18 18 18
(1) Price/earnings ratio is computed by dividing the high and low market prices by diluted earnings per common share for the preceding 12-month period ending on the last day of the quarter presented.

- 95 -
Report of Independent Registered Public Accounting Firm To the Board of Directors and Stockholders of The Charles Schwab Corporation: We have audited the accompanying consolidated balance sheets of The Charles Schwab Corporation and subsidiaries (the Company) as of December 31, 2013 and 2012, and the related consolidated statements of income, comprehensive income, stockholders’ equity, and cash flows for each of the three years in the period ended December 31, 2013. Our audits also included the financial statement schedule of the Company on page F-2. We also have audited the Company’s internal control over financial reporting as of December 31, 2013, based on criteria established in Internal Control – Integrated Framework (1992) issued by the Committee of Sponsoring Organizations of the Treadway Commission. The Company’s management is responsible for these financial statements and financial statement schedule, for maintaining effective internal control over financial reporting, and for its assessment of the effectiveness of internal control over financial reporting, included in the accompanying Management’s Report on Internal Control over Financial Reporting. Our responsibility is to express an opinion on these financial statements and financial statement schedule and an opinion on the Company’s internal control over financial reporting based on our audits. We conducted our audits in accordance with the standards of the Public Company Accounting Oversight Board (United States). Those standards require that we plan and perform the audit to obtain reasonable assurance about whether the financial statements are free of material misstatement and whether effective internal control over financial reporting was maintained in all material respects. Our audits of the financial statements included examining, on a test basis, evidence supporting the amounts and disclosures in the financial statements, assessing the accounting principles used and significant estimates made by management, and evaluating the overall financial statement presentation. Our audit of internal control over financial reporting included obtaining an understanding of internal control over financial reporting, assessing the risk that a material weakness exists, and testing and evaluating the design and operating effectiveness of internal control based on the assessed risk. Our audits also included performing such other procedures as we considered necessary in the circumstances. We believe that our audits provide a reasonable basis for our opinions. A company’s internal control over financial reporting is a process designed by, or under the supervision of, the company’s principal executive and principal financial officers, or persons performing similar functions, and effected by the company’s board of directors, management, and other personnel to provide reasonable assurance regarding the reliability of financial reporting and the preparation of financial statements for external purposes in accordance with generally accepted accounting principles. A company’s internal control over financial reporting includes those policies and procedures that (1) pertain to the maintenance of records that, in reasonable detail, accurately and fairly reflect the transactions and dispositions of the assets of the company; (2) provide reasonable assurance that transactions are recorded as necessary to permit preparation of financial statements in accordance with generally accepted accounting principles and that receipts and expenditures of the company are being made only in accordance with authorizations of management and directors of the company; and (3) provide reasonable assurance regarding prevention or timely detection of unauthorized acquisition, use, or disposition of the company’s assets that could have a material effect on the financial statements. Because of the inherent limitations of internal control over financial reporting, including the possibility of collusion or improper management override of controls, material misstatements due to error or fraud may not be prevented or detected on a timely basis. Also, projections of any evaluation of the effectiveness of the internal control over financial reporting to future periods are subject to the risk that the controls may become inadequate because of changes in conditions, or that the degree of compliance with the policies or procedures may deteriorate. In our opinion, the consolidated financial statements referred to above present fairly, in all material respects, the financial position of The Charles Schwab Corporation and subsidiaries as of December 31, 2013 and 2012, and the results of their operations and their cash flows for each of the three years in the period ended December 31, 2013, in conformity with accounting principles generally accepted in the United States of America. Also, in our opinion, such financial statement schedule, when considered in relation to the basic consolidated financial statements taken as a whole, presents fairly, in all material respects, the information set forth therein. Also, in our opinion, the Company maintained, in all material respects, effective internal control over financial reporting as of December 31, 2013, based on the criteria established in Internal Control – Integrated Framework (1992) issued by the Committee of Sponsoring Organizations of the Treadway Commission. /s/ Deloitte & Touche LLP
San Francisco, California February 24, 2014

THE CHARLES SCHWAB CORPORATION
- 96 -
Management’s Report on Internal Control Over Financial Reporting Management of The Charles Schwab Corporation, together with its subsidiaries (the Company), is responsible for establishing and maintaining adequate internal control over financial reporting. The Company’s internal control over financial reporting is a process designed under the supervision of and effected by the Company’s chief executive officer and chief financial officer to provide reasonable assurance regarding the reliability of financial reporting and the preparation of published financial statements in accordance with accounting principles generally accepted in the United States of America. As of December 31, 2013, management conducted an assessment of the effectiveness of the Company’s internal control over financial reporting based on the framework established in Internal Control – Integrated Framework (1992) issued by the Committee of Sponsoring Organizations of the Treadway Commission. Based on this assessment, management has determined that the Company’s internal control over financial reporting was effective as of December 31, 2013. The Company’s internal control over financial reporting includes policies and procedures that pertain to the maintenance of records that, in reasonable detail, accurately and fairly reflect transactions and dispositions of assets; provide reasonable assurance that transactions are recorded as necessary to permit preparation of financial statements in accordance with accounting principles generally accepted in the United States of America, and that receipts and expenditures are being made only in accordance with authorizations of management and the directors of the Company; and provide reasonable assurance regarding prevention or timely detection of unauthorized acquisition, use or disposition of the Company’s assets that could have a material effect on the Company’s financial statements. The Company’s internal control over financial reporting as of December 31, 2013, has been audited by Deloitte & Touche LLP, an independent registered public accounting firm, as stated in their report appearing on the previous page.

THE CHARLES SCHWAB CORPORATION
- 97 -
Item 9. Changes in and Disagreements With Accountants on Accounting and Financial Disclosure None. Item 9A. Controls and Procedures Evaluation of disclosure controls and procedures: The management of the Company, with the participation of the Company’s Chief Executive Officer and Chief Financial Officer, has evaluated the effectiveness of the Company’s disclosure controls and procedures (as defined in Rule 13a-15(e) under the Securities Exchange Act of 1934) as of December 31, 2013. Based on this evaluation, the Company’s Chief Executive Officer and Chief Financial Officer have concluded that the Company’s disclosure controls and procedures were effective as of December 31, 2013. Changes in internal control over financial reporting: No change in the Company’s internal control over financial reporting (as defined in Rule 13a-15(f) under the Securities Exchange Act of 1934) was identified during the quarter ended December 31, 2013, that has materially affected, or is reasonably likely to materially affect, the Company’s internal control over financial reporting. Management’s Report on Internal Control Over Financial Reporting and the Report of Independent Registered Public Accounting Firm are included in “Item 8 – Financial Statements and Supplementary Data.” Item 9B. Other Information None.
PART III Item 10. Directors, Executive Officers, and Corporate Governance The information relating to directors of CSC required to be furnished pursuant to this item is incorporated by reference from portions of the Company’s definitive proxy statement for its annual meeting of stockholders to be filed with the SEC pursuant to Regulation 14A by April 30, 2014 (the Proxy Statement) under “Members of the Board of Directors,” “Corporate Governance Information,” “Director Nominations,” and “Section 16(a) Beneficial Ownership Reporting Compliance.” The Company’s Code of Conduct and Business Ethics, applicable to directors and all employees, including senior financial officers, is available on the Company’s website at http://www.aboutschwab.com/governance. If the Company makes any amendments to or grants any waivers from its Code of Conduct and Business Ethics, which are required to be disclosed pursuant to the Securities Exchange Act of 1934, the Company will make such disclosures on this website.

THE CHARLES SCHWAB CORPORATION
- 98 -
Schwab Executive Officers of the Registrant The following table provides certain information about each of the Company’s executive officers as of December 31, 2013.
Executive Officers of the Registrant
Name Age Title
Charles R. Schwab 76 Chairman of the Board
Walter W. Bettinger II 53 President and Chief Executive Officer
Jay L. Allen 57 Executive Vice President – Human Resources and Employee Services
Bernard J. Clark 55 Executive Vice President – Advisor Services
John S. Clendening 50 Executive Vice President – Investor Services
Carrie E. Dwyer 63 Executive Vice President, General Counsel and Corporate Secretary
George A. (Andy) Gill 51 Executive Vice President – Investor Services
Joseph R. Martinetto 51 Executive Vice President and Chief Financial Officer
James D. McCool 54 Executive Vice President – Client Solutions
Mr. Schwab has been Chairman of the Board and a director of CSC since its incorporation in 1986. He also served as Chief Executive Officer of CSC from 1986 to 1997, and as Co-Chief Executive Officer from 1998 until 2003. He was re-appointed Chief Executive Officer in 2004 and served in that role until 2008. Mr. Schwab is also Chairman of Charles Schwab & Co., Inc. and Charles Schwab Bank, and a trustee of The Charles Schwab Family of Funds, Schwab Investments, Schwab Capital Trust, Schwab Annuity Portfolios, Laudus Trust, and Laudus Institutional Trust, all registered investment companies. Mr. Bettinger has been President and Chief Executive Officer of CSC since 2008. He also serves on the Board of Directors of CSC, Charles Schwab & Co., Inc. and Charles Schwab Bank, and as a trustee of The Charles Schwab Family of Funds, Schwab Investments, Schwab Capital Trust, Schwab Annuity Portfolios, Laudus Trust, Laudus Institutional Trust, and Schwab Strategic Trust, all registered investment companies. Prior to assuming his current role, Mr. Bettinger served as President and Chief Operating Officer of CSC from 2007 until 2008 and as Executive Vice President and President – Schwab Investor Services of CSC and Schwab from 2005 to 2007. He served as Executive Vice President and Chief Operating Officer – Individual Investor Enterprise of CSC and Schwab from 2004 until 2005, and Executive Vice President – Corporate Services of Schwab from 2002 until 2004. Mr. Bettinger joined Schwab in 1995. Mr. Allen has been Executive Vice President – Human Resources and Employee Services of CSC and Schwab since 2007. He served as Senior Vice President – Human Resources of Schwab Investor Services from 2004 to 2007. Mr. Allen joined Schwab in 2003 as Vice President – Human Resources of Schwab Investor Services. Mr. Clark has been Executive Vice President – Advisor Services of CSC since 2012. Mr. Clark has served as Executive Vice President – Advisor Services of Schwab since 2010. From 2006 until 2010, Mr. Clark served as Senior Vice President – Schwab Institutional Sales of Schwab. During 2005 and 2006, he served as Senior Vice President – Client Service of Schwab. Mr. Clark joined Schwab in 1998. Mr. Clendening has been Executive Vice President and co-leader – Investor Services of CSC since 2012. Mr. Clendening served as Executive Vice President – Shared Strategic Services of CSC and Schwab from 2009 to 2012. He served as Executive Vice President – Solution Services of CSC and Schwab from 2008 to 2009 and as Executive Vice President – Client Experience, Schwab Investor Services of CSC in 2007 and of Schwab from 2006 to 2008. Mr. Clendening served as Executive Vice President and President – Individual Investor Enterprise Marketing of Schwab from 2005 to 2007. He joined Schwab in 2004 as Senior Vice President – Individual Investor Enterprise Marketing.
THE CHARLES SCHWAB CORPORATION
- 99 -
Ms. Dwyer has been Executive Vice President, General Counsel and Corporate Secretary of CSC and Executive Vice President – Corporate Oversight of Schwab since 1996. Ms. Dwyer joined Schwab in 1996. Mr. Gill has been Executive Vice President and co-leader – Investor Services of CSC since 2012. He has served as Executive Vice President – Investor Services of Schwab since 2011. Mr. Gill served as Senior Vice President – Fixed Income of Schwab from 2009 until 2011 and as Senior Vice President – Investor Services of Schwab from 2006 until 2009. Mr. Gill joined Schwab in 2001. Mr. Martinetto has been Executive Vice President and Chief Financial Officer of CSC and Schwab since 2007. He has served as Chief Executive Officer of Charles Schwab Bank since December 2012. Mr. Martinetto served as Senior Vice President and Treasurer of CSC and Schwab from 2003 to 2007 and Senior Vice President – Individual Investor Finance of Schwab from 2002 to 2003. Mr. Martinetto joined Schwab in 1997. Mr. McCool has been Executive Vice President – Clients Solutions of CSC and Schwab since 2012. He served as Executive Vice President – Institutional Services of CSC and Schwab from 2008 until 2012. Mr. McCool served as Executive Vice President – Schwab Corporate and Retirement Services of CSC from 2007 until 2008 and of Schwab from 2006 until 2008. Mr. McCool served as Senior Vice President – Corporate Services of Schwab from 2004 until 2006. Mr. McCool also served as President and Chief Executive Officer of The Charles Schwab Trust Company (CSTC) from 2005 until 2007. Mr. McCool served as Senior Vice President – Plan Administrative Services of CSTC from 2004 until 2005, Chief Operating Officer of CSTC from 2003 until 2004, and Vice President – Development and Business Technology of CSTC from 2002 until 2003. Mr. McCool joined Schwab in 1995. Item 11. Executive Compensation The information required to be furnished pursuant to this item is incorporated by reference from portions of the Proxy Statement under “Compensation Discussion and Analysis,” “Executive Compensation Tables – 2013 Summary Compensation Table,” “Executive Compensation Tables – 2013 Grants of Plan-Based Awards Table,” “Executive Compensation Tables – Narrative to Summary Compensation and Grants of Plan-Based Awards Tables,” “Executive Compensation Tables – 2013 Termination and Change in Control Benefits Table,” “Executive Compensation Tables – Outstanding Equity Awards as of December 31, 2013,” “Executive Compensation Tables – 2013 Option Exercises and Stock Vested Table,” “Executive Compensation Tables – 2013 Nonqualified Deferred Compensation Table,” “Director Compensation,” and “Compensation Committee Interlocks and Insider Participation.” In addition, the information from a portion of the Proxy Statement under “Compensation Committee Report,” is incorporated by reference from the Proxy Statement and furnished on this Form 10-K, and shall not be deemed “filed” for purposes of Section 18 of the Securities Exchange Act of 1934, nor shall it be deemed incorporated by reference in any filing under the Securities Act of 1933. Item 12. Security Ownership of Certain Beneficial Owners and Management and Related Stockholder Matters The information required to be furnished pursuant to this item is incorporated by reference from portions of the Proxy Statement under “Security Ownership of Certain Beneficial Owners and Management,” and “Securities Authorized for Issuance under Equity Compensation Plans.” Item 13. Certain Relationships and Related Transactions, and Director Independence The information required to be furnished pursuant to this item is incorporated by reference from portions of the Proxy Statement under “Transactions with Related Persons” and “Director Independence.” Item 14. Principal Accountant Fees and Services The information required to be furnished pursuant to this item is incorporated by reference from a portion of the Proxy Statement under “Auditor Fees.”

THE CHARLES SCHWAB CORPORATION
- 100 -
PART IV Item 15. Exhibits and Financial Statement Schedule (a) Documents filed as part of this Report 1. Financial Statements The financial statements and independent auditors’ report are included in “Item 8 – Financial Statements and Supplementary Data” and are listed below:
Consolidated Statements of Income Consolidated Statements of Comprehensive Income Consolidated Balance Sheets Consolidated Statements of Cash Flows Consolidated Statements of Stockholders’ Equity Notes to Consolidated Financial Statements Report of Independent Registered Public Accounting Firm
2. Financial Statement Schedule The financial statement schedule required to be furnished pursuant to this item is listed in the accompanying index appearing on page F-1. (b) Exhibits The exhibits listed below are filed as part of this annual report on Form 10-K.
Exhibit Number
Exhibit
2.1 Agreement and Plan of Merger, dated March 18, 2011, by and among The Charles Schwab Corporation, Neon Acquisition Corp. and optionsXpress Holdings, Inc., filed as Exhibit 2.1 to the Registrant’s Form 8-K dated March 18, 2011, and incorporated herein by reference.
3.11 Fifth Restated Certificate of Incorporation, effective May 7, 2001, of the Registrant, filed as Exhibit 3.11 to the Registrant’s Form 10-Q for the quarter ended September 30, 2011, and incorporated herein by reference.
3.14 Fourth Restated Bylaws, as amended on January 27, 2010, of the Registrant, filed as Exhibit 3.1 to the Registrant’s Form 8-K dated January 27, 2010, and incorporated herein by reference.
3.15 Certificate of Designations of Fixed to Floating Rate Non-Cumulative Perpetual Preferred Stock, Series A of The Charles Schwab Corporation filed as Exhibit 3.15 to the Registrant’s Form 8-K dated January 24, 2012, and incorporated herein by reference.
THE CHARLES SCHWAB CORPORATION
- 101 -
Exhibit Number
Exhibit
3.16 Certificate of Designations of 6.00% Non-Cumulative Perpetual Preferred Stock, Series B, of the Charles Schwab Corporation filed as Exhibit 3.1 to the Registrant’s Form 8-K dated May 31, 2012, and incorporated herein by reference.
4.1 Deposit Agreement, dated June 6, 2012, between the Company and Wells Fargo Bank, N.A., as Depositary (including the form of Depositary Share Receipt attached as Exhibit A thereto), filed as Exhibit 4.1 to the Registrant’s Form 8-K dated May 31, 2012, and incorporated herein by reference.
4.2 Neither the Registrant nor its subsidiaries are parties to any instrument with respect to long-term debt for which securities authorized thereunder exceed 10% of the total assets of the Registrant and its subsidiaries on a consolidated basis. Copies of instruments with respect to long-term debt of lesser amounts will be provided to the SEC upon request.
10.4 Form of Release Agreement dated as of March 31, 1987 among BAC, Registrant, Schwab Holdings, Inc., Charles Schwab & Co., Inc. and former shareholders of Schwab Holdings, Inc., filed as the identically-numbered exhibit to Registrant’s Registration Statement No. 33-16192 on Form S-1 and incorporated herein by reference.
10.57 Registration Rights and Stock Restriction Agreement, dated as of March 31, 1987, between the Registrant and the holders of the Common Stock, filed as Exhibit 4.23 to Registrant’s Registration Statement No. 33-16192 on Form S-1 and incorporated herein by reference.
10.72 Restatement of Assignment and License, as amended January 25, 1988, among Charles Schwab & Co., Inc., Charles R. Schwab and the Registrant, filed as Exhibit 10.72 to the Registrant’s Form 10-K for the year ended December 31, 2009, and incorporated herein by reference.
10.271 The Charles Schwab Corporation Directors’ Deferred Compensation Plan, as amended through December 8, 2004, filed as Exhibit 10.271 to the Registrant’s Form 10-K for the year ended December 31, 2009, and incorporated herein by reference.
10.272 The Charles Schwab Corporation Deferred Compensation Plan, as amended through December 8, 2004, filed as Exhibit 10.272 to the Registrant’s Form 10-K for the year ended December 31, 2009, and incorporated herein by reference.
(2)
10.295 Form of Notice and Nonqualified Stock Option Agreement for Joseph R. Martinetto under The Charles Schwab Corporation 2004 Stock Incentive Plan dated May 18, 2007, filed as Exhibit 10.295 to the Registrant’s Form 10-Q for the quarter ended June 30, 2012, and incorporated herein by reference.
(2)
10.298 Directed Employee Benefit Trust Agreement under the SchwabPlan Retirement Savings and Investment Plan dated August 17, 2007, filed as Exhibit 10.298 to the Registrant’s Form 10-Q for the quarter ended September 30, 2012, and incorporated herein by reference.
(2)
10.302 The Charles Schwab Corporation 2001 Stock Incentive Plan, as amended and restated as of December 12, 2007, filed as Exhibit 10.302 to the Registrant’s Form 10-K for the year ended December 31, 2012, and incorporated herein by reference.
(2)

THE CHARLES SCHWAB CORPORATION
- 102 -
Exhibit Number
Exhibit
10.307 Form of Notice and Restricted Stock Agreement under The Charles Schwab Corporation 2004 Stock Incentive Plan, filed as Exhibit 10.307 to the Registrant’s Form 10-K for the year ended December 31, 2012, and incorporated herein by reference.
10.309 Form of Notice and Premium-Priced Stock Option Agreement under The Charles Schwab Corporation 2004 Stock Incentive Plan, filed as Exhibit 10.309 to the Registrant’s Form 10-K for the year ended December 31, 2012, and incorporated herein by reference.
(2)
10.314 Employment Agreement dated as of March 13, 2008, between the Registrant and Charles R. Schwab, filed as Exhibit 10.314 to the Registrant’s Form 10-Q for the quarter ended March 31, 2013, and incorporated herein by reference.
(2)
10.317 Form of Notice and Nonqualified Stock Option Agreement for Walter W. Bettinger under The Charles Schwab Corporation 2004 Stock Incentive Plan dated October 1, 2008, filed as Exhibit 10.317 to the Registrant’s Form 10-Q for the quarter ended September 30, 2013, and incorporated herein by reference.
(2)
10.322 The Charles Schwab Corporation Deferred Compensation Plan II, as amended and restated as of October 23, 2008.
(2)
10.323 The Charles Schwab Corporation Directors’ Deferred Compensation Plan II, as amended and restated as of October 23, 2008, filed as Exhibit 10.323 to the Registrant’s Form 10-K for the year ended December 31, 2008, and incorporated herein by reference.
(2)
10.331 The Charles Schwab Corporation Corporate Executive Bonus Plan, restated to include amendments approved at the Annual Meeting of Stockholders on May 13, 2010, filed as Exhibit 10.331 to the Registrant’s Form 10-Q for the quarter ended June 30, 2010, and incorporated herein by reference.
(2)
10.338 The Charles Schwab Corporation 2004 Stock Incentive Plan, as approved at the Annual Meeting of Stockholders on May 17, 2011, filed as Exhibit 10.338 to the Registrant’s Form 10-Q for the quarter ended June 30, 2011, and incorporated herein by reference.
(2)
10.349 The Charles Schwab Severance Pay Plan, as Amended and Restated Effective May 1, 2012, filed as Exhibit 10.349 to the Registrant’s Form 10-Q for the quarter ended June 30, 2012, and incorporated herein by reference.
(2)
10.350 Credit Agreement (364 – Day Commitment) dated as of June 8, 2012, between the Registrant and financial institutions listed therein, filed as Exhibit 10.350 to the Registrant’s Form 10-Q for the quarter ended June 30, 2012, and incorporated herein by reference.
10.351 Summary of Non-Employee Director Compensation , filed as Exhibit 10.351 to the Registrant’s Form 10-K for the year ended December 31, 2012, and incorporated herein by reference.
(2)
10.352 Form of Performance-Based Cash Long-Term Incentive Award Agreement under The Charles Schwab Corporation 2004 Stock Incentive Plan and successor plans, filed as Exhibit 10.352 to the Registrant’s Form 8-K dated January 24, 2013, and incorporated herein by reference.
(2)

THE CHARLES SCHWAB CORPORATION
- 103 -
Exhibit Number
Exhibit
10.353 Form of Notice and Performance-Based Restricted Stock Unit Agreement under The Charles Schwab Corporation 2004 Stock Incentive Plan and successor plans, filed as Exhibit 10.353 to the Registrant’s Form 8-K dated January 24, 2013, and incorporated herein by reference.
(2)
10.354 Form of Notice and Nonqualified Stock Option Agreement under The Charles Schwab Corporation 2004 Stock Incentive Plan and successor plans, filed as Exhibit 10.354 to the Registrant’s Form 8-K dated January 24, 2013, and incorporated herein by reference.
(2)
10.355 Form of Notice and Restricted Stock Unit Agreement under The Charles Schwab Corporation 2004 Stock Incentive Plan and successor plans, filed as Exhibit 10.355 to the Registrant’s Form 8-K dated January 24, 2013, and incorporated herein by reference.
(2)
10.356 Form of Notice and Retainer Stock Option Agreement for Non-Employee Directors under The Charles Schwab Corporation 2004 Stock Incentive Plan and successor plans, filed as Exhibit 10.356 to the Registrant’s Form 8-K dated January 24, 2013, and incorporated herein by reference.
(2)
10.357 Form of Notice and Retainer Restricted Stock Unit Agreement for Non-Employee Directors under The Charles Schwab Corporation 2004 Stock Incentive Plan and successor plans, filed as Exhibit 10.357 to the Registrant’s Form 8-K dated January 24, 2013, and incorporated herein by reference.
(2)
10.358 Form of Notice and Stock Option Agreement for Non-Employee Directors under The Charles Schwab Corporation Directors’ Deferred Compensation Plan II and The Charles Schwab Corporation 2004 Stock Incentive Plan and successor plans, filed as Exhibit 10.358 to the Registrant’s Form 8-K dated January 24, 2013, and incorporated herein by reference.
(2)
10.359 Form of Notice and Restricted Stock Unit Agreement for Non-Employee Directors under The Charles Schwab Corporation Directors’ Deferred Compensation Plan II and The Charles Schwab Corporation 2004 Stock Incentive Plan and successor plans, filed as Exhibit 10.359 to the Registrant’s Form 8-K dated January 24, 2013, and incorporated herein by reference.
(2)
10.360 The Charles Schwab Corporation 2013 Stock Incentive Plan, as approved at the Annual Meeting of Stockholders on May 16, 2013, filed as Exhibit 10.360 to the Registrant’s Form 8-K dated May 16, 2013, and incorporated herein by reference.
(2)
10.361 Credit Agreement (364 – Day Commitment) dated as of June 7, 2013, between the Registrant and financial institutions therein (supersedes Exhibit 10.350), filed as Exhibit 10.361 to the Registrant’s Form 10-Q for the quarter ended June 30, 2013, and incorporated herein by reference.
10.362 The Charles Schwab Corporation Directors’ Deferred Compensation Plan II, as amended and restated as of April 24, 2013 (supersedes Exhibit 10.323), filed as Exhibit 10.362 to the Registrant’s Form 10-Q for the quarter ended June 30, 2013, and incorporated herein by reference.
(2)
12.1 Computation of Ratio of Earnings to Fixed Charges and Ratio of Earnings to Fixed Charges and Preferred Stock Dividends.
21.1 Subsidiaries of the Registrant.
23.1 Independent Registered Public Accounting Firm’s Consent.
31.1 Certification Pursuant to Rule 13a-14(a)/15d-14(a), As Adopted Pursuant to Section 302 of The Sarbanes-Oxley Act of 2002.
31.2 Certification Pursuant to Rule 13a-14(a)/15d-14(a), As Adopted Pursuant to Section 302 of The Sarbanes-Oxley Act of 2002.

THE CHARLES SCHWAB CORPORATION
- 104 -
Exhibit Number
Exhibit
32.1 Certification Pursuant to 18 U.S.C. Section 1350, As Adopted Pursuant to Section 906 of The Sarbanes-Oxley Act of 2002.
(1)
32.2 Certification Pursuant to 18 U.S.C. Section 1350, As Adopted Pursuant to Section 906 of The Sarbanes-Oxley Act of 2002.
(1)
101.INS XBRL Instance Document (3)
101.SCH XBRL Taxonomy Extension Schema (3)
101.CAL XBRL Taxonomy Extension Calculation (3)
101.DEF XBRL Extension Definition (3)
101.LAB XBRL Taxonomy Extension Label (3)
101.PRE XBRL Taxonomy Extension Presentation (3)
(1) Furnished as an exhibit to this annual report on Form 10-K.
(2) Management contract or compensatory plan.
(3) Attached as Exhibit 101 to this Annual Report on Form 10-K for the annual period ended December 31, 2013, are the following materials formatted in XBRL (Extensible Business Reporting Language) (i) the Consolidated Statements of Income,(ii) the Consolidated Statements of Comprehensive Income, (iii) the Consolidated Balance Sheets, (iv) the Consolidated Statements of Cash Flows, (v) the Consolidated Statements of Stockholders’ Equity, and (vi) Notes to Consolidated Financial Statements.

THE CHARLES SCHWAB CORPORATION
- 105 -
SIGNATURES Pursuant to the requirements of Section 13 or 15(d) of the Securities Exchange Act of 1934, the registrant has duly caused this report to be signed on its behalf by the undersigned, thereunto duly authorized, on February 24, 2014. THE CHARLES SCHWAB CORPORATION (Registrant) BY: /s/ Walter W. Bettinger II Walter W. Bettinger II President and Chief Executive Officer Pursuant to the requirements of the Securities Exchange Act of 1934, this report has been signed below by the following persons on behalf of the registrant and in the capacities indicated, on February 24, 2014.
Signature / Title Signature / Title
/s/ Walter W. Bettinger II /s/ Joseph R. Martinetto Walter W. Bettinger II, Joseph R. Martinetto, President and Chief Executive Officer Executive Vice President
and Chief Financial Officer (principal financial and accounting officer)
/s/ Charles R. Schwab /s/ Nancy H. Bechtle Charles R. Schwab, Chairman of the Board Nancy H. Bechtle, Director
/s/ C. Preston Butcher /s/ Stephen A. Ellis C. Preston Butcher, Director Stephen A. Ellis, Director
/s/ Mark A. Goldfarb /s/ Frank C. Herringer Mark A. Goldfarb, Director Frank C. Herringer, Director
/s/ Stephen T. McLin /s/ Arun Sarin Stephen T. McLin, Director Arun Sarin, Director
/s/ Paula A. Sneed /s/ Roger O. Walther Paula A. Sneed, Director Roger O. Walther, Director
/s/ Robert N. Wilson Robert N. Wilson, Director

THE CHARLES SCHWAB CORPORATION
F-1
Index to Financial Statement Schedule
Page
Schedule II - Valuation and Qualifying Accounts F-2 Supplemental Financial Data for Charles Schwab Bank (Unaudited) F-3 – F-9
Schedules not listed are omitted because of the absence of the conditions under which they are required or because the information is included in the Company’s consolidated financial statements and notes in “Item 8 – Financial Statements and Supplementary Data.”

THE CHARLES SCHWAB CORPORATION
F-2
SCHEDULE II
Valuation and Qualifying Accounts (In millions)
Balance at Additions Balance at Beginning Charged End Description of Year to Expense Other (1) Written off of Year For the year ended December 31, 2013:
Allowance for doubtful accounts of brokerage clients (2) $ 1 $ 2 $ 1 $ (4) $ -
For the year ended December 31, 2012: Allowance for doubtful accounts of
brokerage clients (2) $ 2 $ 4 $ - $ (5) $ 1
For the year ended December 31, 2011: Allowance for doubtful accounts of
brokerage clients (2) $ 1 $ 6 $ 3 $ (8) $ 2
(1) Includes collections of previously written-off accounts.
(2) Excludes banking-related valuation and qualifying accounts. See “Item 8 – Financial Statements and Supplementary Data – Notes to Consolidated Financial Statements – 6. Loans to Banking Clients and Related Allowance for Loan Losses.”

THE CHARLES SCHWAB CORPORATION Supplemental Financial Data for Charles Schwab Bank (Unaudited)
(Dollars in Millions)
F-3
The following supplemental financial data is consistent with the Securities Exchange Act of 1934, Industry Guide 3 – Statistical Disclosure by Bank Holding Companies. The accompanying unaudited financial information represents Charles Schwab Bank (Schwab Bank), which is a subsidiary of The Charles Schwab Corporation (CSC). CSC is a savings and loan holding company and Schwab Bank is a federal savings bank. The following information excludes intercompany balances and transactions with CSC and its affiliates. 1. Three-year Net Interest Revenue and Average Balances
For the Year Ended December 31, 2013 2012 2011 Average Average Average Average Average Average Balance Interest Rate Balance Interest Rate Balance Interest Rate
Assets: Cash and cash equivalents (1) $ 5,626 $ 15 0.27 % $ 5,575 $ 15 0.27 % $ 4,142 $ 11 0.27 %Securities available for sale (2) 49,112 557 1.13 % 39,739 583 1.47 % 27,477 456 1.66 %Securities held to maturity 24,915 610 2.45 % 15,371 397 2.58 % 16,050 492 3.07 %Loans to banking clients (3) 11,756 329 2.80 % 10,050 309 3.07 % 9,468 310 3.27 %Loans held for sale - - - 18 1 4.12 % 65 3 4.62 %Other interest-earning assets 53 2 3.77 % 54 1 1.85 % 50 1 2.00 %Total interest-earning assets 91,462 1,513 1.65 % 70,807 1,306 1.84 % 57,252 1,273 2.22 %
Net unrealized gain on securities available for sale 252 275 64
Noninterest-earning assets 671 566 212 Total Assets $ 92,385 $ 71,648 $ 57,528
Liabilities and Stockholder’s Equity: Interest-bearing banking deposits $ 85,465 31 0.04 % $ 65,546 42 0.06 % $ 52,701 62 0.12 %Total sources on which interest is paid 85,465 31 0.04 % 65,546 42 0.06 % 52,701 62 0.12 %
Noninterest-bearing liabilities 650 577 345 Stockholder's equity 6,270 5,525 4,482 Total Liabilities and Stockholder’s Equity $ 92,385 $ 71,648 $ 57,528 Net interest revenue $ 1,482 $ 1,264 $ 1,211
Net yield on interest-earning assets 1.62 % 1.79 % 2.12 %
(1) Includes deposits with banks, short-term investments, and federal funds sold. (2) Amounts have been calculated based on amortized cost. (3) Includes average principal balances of nonaccrual loans.

THE CHARLES SCHWAB CORPORATION Supplemental Financial Data for Charles Schwab Bank (Unaudited)
(Dollars in Millions)
F-4
2. Analysis of Change in Net Interest Revenue An analysis of the year-to-year changes in the categories of interest revenue and interest expense resulting from changes in volume and rate is as follows:
2013 Compared to 2012 2012 Compared to 2011 Increase (Decrease) Due to Increase (Decrease) Due to Change in: Change in: Average Average Average Average Volume Rate Total Volume Rate Total
Interest-earning assets: Cash and cash equivalents (1) $ - $ - $ - $ 4 $ - $ 4Securities available for sale (2) 137 (163) (26) 203 (76) 127Securities held to maturity 247 (34) 213 (21) (74) (95)Loans to banking clients (3) 52 (32) 20 19 (20) (1)Loans held for sale (1) - (1) (2) - (2)Other interest-earning assets - 1 1 - - -Total interest-earning assets $ 435 $ (228) $ 207 $ 203 $ (170) $ 33
Interest-bearing sources of funds: Interest-bearing banking deposits $ 12 $ (23) $ (11) $ 15 $ (35) $ (20)Total sources on which interest is paid $ 12 $ (23) $ (11) $ 15 $ (35) $ (20)
Change in net interest revenue $ 423 $ (205) $ 218 $ 188 $ (135) $ 53 Changes that are not due solely to volume or rate have been allocated to rate.
(1) Includes deposits with banks and short-term investments.
(2) Amounts have been calculated based on amortized cost. (3) Includes average principal balances of nonaccrual loans.

THE CHARLES SCHWAB CORPORATION Supplemental Financial Data for Charles Schwab Bank (Unaudited)
(Dollars in Millions)
F-5
3. Securities Available for Sale and Securities Held to Maturity The amortized cost, gross unrealized gains and losses, and fair value of securities available for sale and securities held to maturity are as follows:
Gross Gross Amortized Unrealized Unrealized Fair December 31, 2013 Cost Gains Losses Value
Securities available for sale: U.S. agency mortgage-backed securities $ 18,554 $ 140 $ 49 $ 18,645Asset-backed securities 15,201 42 37 15,206Corporate debt securities 8,973 49 15 9,007U.S. agency notes 4,239 1 104 4,136Certificates of deposit 3,650 4 2 3,652Non-agency residential mortgage-backed securities 616 11 34 593Non-agency commercial mortgage-backed securities 271 8 - 279Other securities 100 - - 100
Total securities available for sale $ 51,604 $ 255 $ 241 $ 51,618
Securities held to maturity: U.S. agency mortgage-backed securities $ 29,260 $ 161 $ 921 $ 28,500Non-agency commercial mortgage-backed securities 958 - 68 890Other securities 100 - - 100
Total securities held to maturity $ 30,318 $ 161 $ 989 $ 29,490
Gross Gross Amortized Unrealized Unrealized Fair December 31, 2012 Cost Gains Losses Value
Securities available for sale: U.S. agency mortgage-backed securities $ 20,080 $ 396 $ - $ 20,476Asset-backed securities 8,104 62 2 8,164Corporate debt securities 6,197 61 2 6,256Certificates of deposit 6,150 12 1 6,161U.S. agency notes 3,465 2 3 3,464Non-agency residential mortgage-backed securities 796 2 65 733Commercial paper 574 - - 574Other securities 273 16 - 289
Total securities available for sale $ 45,639 $ 551 $ 73 $ 46,117
Securities held to maturity: U.S. agency mortgage-backed securities $ 17,750 $ 558 $ 19 $ 18,289Other securities 444 - 1 443
Total securities held to maturity $ 18,194 $ 558 $ 20 $ 18,732

THE CHARLES SCHWAB CORPORATION Supplemental Financial Data for Charles Schwab Bank (Unaudited)
(Dollars in Millions)
F-6
Gross Gross Amortized Unrealized Unrealized Fair December 31, 2011 Cost Gains Losses Value
Securities available for sale: U.S. agency mortgage-backed securities $ 20,666 $ 269 $ 14 $ 20,921Asset-backed securities 2,638 4 7 2,635Corporate debt securities 3,592 5 26 3,571Certificates of deposit 3,623 2 3 3,622U.S. agency notes 1,795 5 - 1,800Non-agency residential mortgage-backed securities 1,130 - 223 907Commercial paper 225 - - 225Other securities 273 3 - 276
Total securities available for sale $ 33,942 $ 288 $ 273 $ 33,957
Securities held to maturity: U.S. agency mortgage-backed securities $ 14,770 $ 430 $ 2 $ 15,198Other securities 338 3 - 341
Total securities held to maturity $ 15,108 $ 433 $ 2 $ 15,539
The maturities and related weighted-average yields of securities available for sale and securities held to maturity at December 31, 2013, are as follows:
After 1 year After 5 years Within through through 10 After 1 year 5 years years 10 years Total
Securities available for sale: U.S. agency mortgage-backed securities (1) $ - $ 508 $ 4,458 $ 13,679 $ 18,645 Asset-backed securities - 1,219 3,284 10,703 15,206 Corporate debt securities 1,348 7,554 105 - 9,007 U.S. agency notes - 3,896 240 - 4,136 Certificates of deposit 1,826 1,826 - - 3,652 Non-agency residential mortgage-backed
securities (1) - 4 - 589 593 Non-agency commercial mortgage-backed
securities (1) - - - 279 279 Other securities 100 - - - 100 Total fair value $ 3,274 $ 15,007 $ 8,087 $ 25,250 $ 51,618 Total amortized cost $ 3,270 $ 15,062 $ 8,041 $ 25,231 $ 51,604 Weighted-average yield (2) 0.86 % 1.01 % 1.11 % 1.20 % 1.11 %
Securities held to maturity: U.S. agency mortgage-backed securities (1) $ - $ 555 $ 11,985 $ 15,960 $ 28,500 Non-agency commercial mortgage-backed
securities (1) - - 337 553 890 Other securities 100 - - - 100 Total fair value $ 100 $ 555 $ 12,322 $ 16,513 $ 29,490 Total amortized cost $ 100 $ 550 $ 12,894 $ 16,774 $ 30,318 Weighted-average yield (2) 1.25 % 2.26 % 2.49 % 2.43 % 2.45 %
(1) Mortgage-backed securities have been allocated to maturity groupings based on final contractual maturities. Actual maturities will differ from final contractual maturities because borrowers on a certain portion of loans underlying these securities have the right to prepay their obligations.
(2) The weighted-average yield is computed using the amortized cost at December 31, 2013.

THE CHARLES SCHWAB CORPORATION Supplemental Financial Data for Charles Schwab Bank (Unaudited)
(Dollars in Millions)
F-7
4. Cross-border Holdings The tables below set forth the amount of Schwab Bank’s cross-border holdings, based on carrying value, as of December 31, 2013, 2012, and 2011. Such holdings, by country, that exceed 1% of total assets are disclosed separately, and such holdings, by country, that are between 0.75% and 1% of total assets are listed in the aggregate. Cross-border holdings are comprised of cash equivalents, securities available for sale, and securities held to maturity.
Banks and other Commercial and Exposure as a %December 31, 2013 financial institutions industrial institutions Total of total assets
Country:
Canada $ 2,408 $ - $ 2,408 2.4 % Australia 1,563 - 1,563 1.6 % United Kingdom 1,262 140 1,402 1.4 % Sweden 1,247 - 1,247 1.2 % Switzerland 825 - 825 0.8 %
Total $ 7,305 $ 140 $ 7,445 Banks and other Commercial and Exposure as a %December 31, 2012 financial institutions industrial institutions Total of total assets
Country:
Australia $ 2,300 $ - $ 2,300 2.7 % United Kingdom 1,556 351 1,907 2.2 % Canada 1,732 - 1,732 2.0 % Sweden 1,302 - 1,302 1.5 % Switzerland 902 - 902 1.1 % Japan 800 - 800 0.9 %
Total $ 8,592 $ 351 $ 8,943
Banks and other Exposure as a %December 31, 2011 financial institutions of total assets
Country:
United Kingdom $ 1,450 2.2 % Canada 1,098 1.7 % Sweden 712 1.1 % Switzerland, France and Australia 1,849 2.8 %
Total $ 5,109 5. Loans to Banking Clients and Related Allowance for Loan Losses The composition of the loan portfolio is as follows:
December 31, 2013 2012 2011 2010 2009
Residential real estate mortgages $ 8,006 $ 6,507 $ 5,596 $ 4,695 $ 3,710Home equity lines of credit 3,041 3,287 3,509 3,500 3,304Personal loans secured by securities 1,384 963 742 562 366Other 34 22 16 16 11
Total loans to banking clients $ 12,465 $ 10,779 $ 9,863 $ 8,773 $ 7,391

THE CHARLES SCHWAB CORPORATION Supplemental Financial Data for Charles Schwab Bank (Unaudited)
(Dollars in Millions)
F-8
An analysis of nonaccrual loans is as follows:
December 31, 2013 2012 2011 2010 2009
Nonaccrual loans $ 48 $ 48 $ 52 $ 51 $ 34Average nonaccrual loans $ 43 $ 48 $ 51 $ 40 $ 17 Changes in the allowance for loan losses were as follows:
December 31, 2013 2012 2011 2010 2009
Balance at beginning of year $ 56 $ 54 $ 53 $ 45 $ 20Charge-offs (11) (16) (19) (20) (13)Recoveries 4 2 2 1 -Provision for loan losses (1) 16 18 27 38
Balance at end of year $ 48 $ 56 $ 54 $ 53 $ 45 The maturities of the loan portfolio at December 31, 2013, are as follows:
After 1 year Within through After 1 year 5 years 5 years Total
Residential real estate mortgages (1) $ - $ - $ 8,006 $ 8,006Home equity lines of credit (2) 358 1,705 978 3,041Personal loans secured by securities 81 1,303 - 1,384Other 7 21 6 34
Total $ 446 $ 3,029 $ 8,990 $ 12,465
(1) Maturities are based upon the contractual terms of the loans.
(2) Maturities are based on an initial draw period of 10 years. The interest sensitivity of loans with contractual maturities in excess of one year at December 31, 2013, is as follows:
After 1 year
Loans with predetermined interest rates $ 716Loans with floating or adjustable interest rates 11,303
Total $ 12,019 6. Summary of Loan Loss on Banking Loans Experience
December 31, 2013 2012 2011 2010 2009
Average loans $ 11,756 $ 10,050 $ 9,468 $ 7,983 $ 6,668 Allowance to year end loans .39 % .52 % .55 % .60 % .61 % Allowance to nonperforming loans 100 % 117 % 104 % 104 % 132 % Nonperforming assets to average loans
and real estate owned .45 % .54 % .59 % .68 % .51 %

THE CHARLES SCHWAB CORPORATION Supplemental Financial Data for Charles Schwab Bank (Unaudited)
(Dollars in Millions)
F-9
7. Deposits from Banking Clients The following table presents the average amount of and the average rate paid on deposit categories that are in excess of ten percent of average total deposits from banking clients:
2013 2012 2011 Amount Rate Amount Rate Amount Rate
Analysis of average daily deposits: Money market and other savings deposits $ 73,167 0.03 % $ 54,318 0.05 % $ 42,342 0.09 % Interest-bearing demand deposits 12,298 0.10 % 11,227 0.13 % 10,359 0.22 %
Total $ 85,465 $ 65,545 $ 52,701 At December 31, 2013, deposits from banking clients included one domestic-issued certificate of deposit of $100,000 or more, in the amount of $517,004, with a contractual maturity of over twelve months. 8. Ratios
December 31, 2013 2012 2011
Return on average stockholder’s equity 12.46 % 11.82 % 13.99 % Return on average total assets 0.85 % 0.91 % 1.10 % Average stockholder’s equity as a percentage of average total assets 6.79 % 7.71 % 7.83 %

THE CHARLES SCHWAB CORPORATION
EXHIBIT 12.1
Computation of Ratio of Earnings to Fixed Charges and Ratio of Earnings to Fixed Charges and Preferred Stock Dividends
(Dollar amounts in millions) (Unaudited)
Year Ended December 31, 2013 2012 2011 2010 2009
Earnings before taxes on earnings $ 1,705 $ 1,450 $ 1,392 $ 779 $ 1,276
Fixed charges Interest expense:
Deposits from banking clients 31 42 62 105 107 Payables to brokerage clients 3 3 3 2 3 Long-term debt 69 103 108 92 71 Other 2 2 2 - 2
Total 105 150 175 199 183 Interest portion of rental expense 69 68 62 56 71
Total fixed charges (A) 174 218 237 255 254
Earnings before taxes on earnings and fixed charges (B) $ 1,879 $ 1,668 $ 1,629 $ 1,034 $ 1,530
Ratio of earnings to fixed charges (B) ÷ (A) (1) 10.8 7.7 6.9 4.1 6.0
Ratio of earnings to fixed charges, excluding deposits from banking clients and payables to brokerage clients interest expense (2) 13.2 9.4 9.1 6.3 9.9
Total fixed charges $ 174 $ 218 $ 237 $ 255 $ 254
Preferred stock dividends (3) 97 70 - - -Total fixed charges and preferred stock dividends (C) $ 271 $ 288 $ 237 $ 255 $ 254
Ratio of earnings to fixed charges and preferred stock dividends (B) ÷ (C) (1)
6.9 5.8 6.9 4.1 6.0
Ratio of earnings to fixed charges and preferred stock dividends, excluding deposits from banking clients and payables to brokerage clients interest expense (2)
7.8 6.7 9.1 6.3 9.9
(1) The ratios of earnings to fixed charges and earnings to fixed charges and preferred stock dividends are calculated in accordance with SEC requirements. For such purposes, “earnings” consist of earnings before taxes on earnings and fixed charges. “Fixed charges” consist of interest expense as listed above, and one-third of rental expense, which is estimated to be representative of the interest factor.
(2) Because interest expense incurred in connection with both deposits from banking clients and payables to brokerage clients is
completely offset by interest revenue on related investments and loans, the Company considers such interest to be an operating expense. Accordingly, the ratio of earnings to fixed charges, excluding deposits from banking clients and payables to brokerage clients interest expense, and the ratio of earnings to fixed charges and preferred stock dividends, excluding deposits from banking clients and payables to brokerage clients interest expense, reflect the elimination of such interest expense as a fixed charge.
(3) The preferred stock dividend amounts represent the pre-tax earnings that would be required to pay the dividends on outstanding
preferred stock.

THE CHARLES SCHWAB CORPORATION
EXHIBIT 21.1
Subsidiaries of the Registrant
Pursuant to Item 601 (b)(21)(ii) of Regulation S-K, certain subsidiaries of the Registrant have been omitted which, considered in the aggregate as a single subsidiary, would not constitute a significant subsidiary (as defined in Rule 1-02(w) of Regulation S-X) as of December 31, 2013.
The following is a listing of the significant subsidiaries of the Registrant: Schwab Holdings, Inc. (holding company for Charles Schwab & Co., Inc.), a Delaware corporation Charles Schwab & Co., Inc., a California corporation Charles Schwab Bank, a Federal Savings Association Charles Schwab Investment Management, Inc., a Delaware corporation

THE CHARLES SCHWAB CORPORATION
EXHIBIT 23.1 CONSENT OF INDEPENDENT REGISTERED PUBLIC ACCOUNTING FIRM We consent to the incorporation by reference in the following Registration Statements of our report dated February 24, 2014, relating to the consolidated financial statements and financial statement schedule of The Charles Schwab Corporation and the effectiveness of The Charles Schwab Corporation’s internal control over financial reporting appearing in this Annual Report on Form 10-K of The Charles Schwab Corporation for the year ended December 31, 2013. Filed on Form S-3:
Registration Statement No. 333-178525 (Debt Securities, Preferred Stock, Depository Shares, Common Stock, Purchase Contracts, Warrants, and Units Consisting of Two or More Securities)
Filed on Form S-8:
Registration Statement No. 333-192893 (The Charles Schwab Corporation Financial Consultant Career Achievement Award Program)
Registration Statement No. 333-189553 (The Charles Schwab Corporation 2013 Stock Incentive Plan)
Registration Statement No. 333-175862 (The Charles Schwab Corporation 2004 Stock Incentive Plan)
Registration Statement No. 333-173635 (optionsXpress Holdings, Inc. 2008 Equity Incentive Plan, optionsXpress Holdings, Inc. 2005 Equity Incentive Plan, and optionsXpress, Inc. 2001 Equity Incentive Plan)
Registration Statement No. 333-144303 (The Charles Schwab Corporation Employee Stock Purchase Plan)
Registration Statement No. 333-131502 (The Charles Schwab Corporation Deferred Compensation Plan II)
Registration Statement No. 333-101992 (The Charles Schwab Corporation 2004 Stock Incentive Plan)
Registration Statement No. 333-71322 (The SchwabPlan Retirement Savings and Investment Plan)
Registration Statement No. 333-63448 (The Charles Schwab Corporation 2004 Stock Incentive Plan)
Registration Statement No. 333-47107 (The Charles Schwab Corporation 2004 Stock Incentive Plan)
Registration Statement No. 333-44793 (Charles Schwab Profit Sharing and Employee Stock Ownership Plan) /s/ Deloitte & Touche LLP
San Francisco, California February 24, 2014

THE CHARLES SCHWAB CORPORATION
EXHIBIT 31.1
CERTIFICATION PURSUANT TO RULE 13a-14(a)/15d-14(a), AS ADOPTED PURSUANT TO SECTION 302 OF THE SARBANES-OXLEY ACT OF 2002
I, Walter W. Bettinger II, certify that:
1. I have reviewed this Annual Report on Form 10-K of The Charles Schwab Corporation;
2. Based on my knowledge, this report does not contain any untrue statement of a material fact or omit to state a material fact necessary to make the statements made, in light of the circumstances under which such statements were made, not misleading with respect to the period covered by this report;
3. Based on my knowledge, the financial statements, and other financial information included in this report, fairly present in all material respects the financial condition, results of operations and cash flows of the registrant as of, and for, the periods presented in this report;
4. The registrant’s other certifying officer and I are responsible for establishing and maintaining disclosure controls and procedures (as defined in Exchange Act Rules 13a-15(e) and 15d-15(e)) and internal control over financial reporting (as defined in Exchange Act Rules 13a-15(f) and 15d-15(f)) for the registrant and have:
a) Designed such disclosure controls and procedures, or caused such disclosure controls and procedures to be designed under our supervision, to ensure that material information relating to the registrant, including its consolidated subsidiaries, is made known to us by others within those entities, particularly during the period in which this report is being prepared;
b) Designed such internal control over financial reporting, or caused such internal control over financial reporting to be designed under our supervision, to provide reasonable assurance regarding the reliability of financial reporting and the preparation of financial statements for external purposes in accordance with generally accepted accounting principles;
c) Evaluated the effectiveness of the registrant’s disclosure controls and procedures and presented in this report our conclusions about the effectiveness of the disclosure controls and procedures, as of the end of the period covered by this report based on such evaluation; and
d) Disclosed in this report any change in the registrant’s internal control over financial reporting that occurred during the registrant’s most recent fiscal quarter (the registrant’s fourth fiscal quarter in the case of an annual report) that has materially affected, or is reasonably likely to materially affect, the registrant’s internal control over financial reporting; and
5. The registrant’s other certifying officer and I have disclosed, based on our most recent evaluation of internal control over financial reporting, to the registrant’s auditors and the audit committee of registrant’s board of directors (or persons performing the equivalent functions):
a) All significant deficiencies and material weaknesses in the design or operation of internal control over financial reporting which are reasonably likely to adversely affect the registrant’s ability to record, process, summarize and report financial information; and
b) Any fraud, whether or not material, that involves management or other employees who have a significant role in the registrant’s internal control over financial reporting.
Date: February 24, 2014 /s/ Walter W. Bettinger II Walter W. Bettinger II President and Chief Executive Officer

THE CHARLES SCHWAB CORPORATION
EXHIBIT 31.2
CERTIFICATION PURSUANT TO RULE 13a-14(a)/15d-14(a), AS ADOPTED PURSUANT TO SECTION 302 OF THE SARBANES-OXLEY ACT OF 2002
I, Joseph R. Martinetto, certify that:
1. I have reviewed this Annual Report on Form 10-K of The Charles Schwab Corporation;
2. Based on my knowledge, this report does not contain any untrue statement of a material fact or omit to state a material fact necessary to make the statements made, in light of the circumstances under which such statements were made, not misleading with respect to the period covered by this report;
3. Based on my knowledge, the financial statements, and other financial information included in this report, fairly present in all material respects the financial condition, results of operations and cash flows of the registrant as of, and for, the periods presented in this report;
4. The registrant’s other certifying officer and I are responsible for establishing and maintaining disclosure controls and procedures (as defined in Exchange Act Rules 13a-15(e) and 15d-15(e)) and internal control over financial reporting (as defined in Exchange Act Rules 13a-15(f) and 15d-15(f)) for the registrant and have:
a) Designed such disclosure controls and procedures, or caused such disclosure controls and procedures to be designed under our supervision, to ensure that material information relating to the registrant, including its consolidated subsidiaries, is made known to us by others within those entities, particularly during the period in which this report is being prepared;
b) Designed such internal control over financial reporting, or caused such internal control over financial reporting to be designed under our supervision, to provide reasonable assurance regarding the reliability of financial reporting and the preparation of financial statements for external purposes in accordance with generally accepted accounting principles;
c) Evaluated the effectiveness of the registrant’s disclosure controls and procedures and presented in this report our conclusions about the effectiveness of the disclosure controls and procedures, as of the end of the period covered by this report based on such evaluation; and
d) Disclosed in this report any change in the registrant’s internal control over financial reporting that occurred during the registrant’s most recent fiscal quarter (the registrant’s fourth fiscal quarter in the case of an annual report) that has materially affected, or is reasonably likely to materially affect, the registrant’s internal control over financial reporting; and
5. The registrant’s other certifying officer and I have disclosed, based on our most recent evaluation of internal control over financial reporting, to the registrant’s auditors and the audit committee of registrant’s board of directors (or persons performing the equivalent functions):
a) All significant deficiencies and material weaknesses in the design or operation of internal control over financial reporting which are reasonably likely to adversely affect the registrant’s ability to record, process, summarize and report financial information; and
b) Any fraud, whether or not material, that involves management or other employees who have a significant role in the registrant’s internal control over financial reporting.
Date: February 24, 2014 /s/ Joseph R. Martinetto Joseph R. Martinetto Executive Vice President and Chief Financial Officer

THE CHARLES SCHWAB CORPORATION
EXHIBIT 32.1
CERTIFICATION PURSUANT TO 18 U.S.C. SECTION 1350, AS ADOPTED PURSUANT TO
SECTION 906 OF THE SARBANES-OXLEY ACT OF 2002 In connection with the Annual Report of The Charles Schwab Corporation (the Company) on Form 10-K for the year ended December 31, 2013 (the Report), I, Walter W. Bettinger II, President and Chief Executive Officer of the Company, hereby certify, pursuant to 18 U.S.C. section 1350, as adopted pursuant to section 906 of the Sarbanes-Oxley Act of 2002, that to the best of my knowledge:
(1) The Report fully complies with the requirements of section 13(a) or 15(d) of the Securities Exchange Act of 1934; and
(2) The information contained in the Report fairly presents, in all material respects, the financial
condition and results of operations of the Company for the periods presented therein. /s/ Walter W. Bettinger II
Date: February 24, 2014
Walter W. Bettinger II President and Chief Executive Officer A signed original of this written statement required by Section 906 has been provided to The Charles Schwab Corporation and will be retained by The Charles Schwab Corporation and furnished to the Securities and Exchange Commission or its staff upon request.

THE CHARLES SCHWAB CORPORATION
EXHIBIT 32.2
CERTIFICATION PURSUANT TO 18 U.S.C. SECTION 1350, AS ADOPTED PURSUANT TO
SECTION 906 OF THE SARBANES-OXLEY ACT OF 2002 In connection with the Annual Report of The Charles Schwab Corporation (the Company) on Form 10-K for the year ended December 31, 2013 (the Report), I, Joseph R. Martinetto, Executive Vice President and Chief Financial Officer of the Company, hereby certify, pursuant to 18 U.S.C. section 1350, as adopted pursuant to section 906 of the Sarbanes-Oxley Act of 2002, that to the best of my knowledge:
(1) The Report fully complies with the requirements of section 13(a) or 15(d) of the Securities Exchange Act of 1934; and
(2) The information contained in the Report fairly presents, in all material respects, the financial
condition and results of operations of the Company for the periods presented therein. /s/ Joseph R. Martinetto
Date: February 24, 2014 Joseph R. Martinetto Executive Vice President
and Chief Financial Officer A signed original of this written statement required by Section 906 has been provided to The Charles Schwab Corporation and will be retained by The Charles Schwab Corporation and furnished to the Securities and Exchange Commission or its staff upon request.

CHARLES R. SCHWABChairman of the Board, The Charles Schwab CorporationAge: 76. Director since 1986. Term expires in 2016.
NANCY H. BECHTLEChairman, Sugar Bowl Corporation, a ski resort operatorAge: 76. Director since 1992.Term expires in 2015. Member of the CompensationCommittee; Nominating andCorporate Governance Committee.
WALTER W. BETTINGER IIPresident and Chief Executive Officer, The Charles Schwab Corporation Age: 53. Director since 2008. Term expires in 2015.
C. PRESTON BUTCHERChairman and Chief Executive Officer, Legacy Partners, a real estate development and management firmAge: 75. Director since 1988. Term expires in 2015. Member of the Audit Committee; Nominating and Corporate Governance Committee.
STEPHEN A. ELLISChief Executive Officer, Asurion, LLC, a provider of consumer technology protection servicesAge: 51. Director since 2012.Term expires in 2016.Member of the Nominating and Corporate Governance Committee; Risk Committee.
MARK A. GOLDFARBManaging Director, SS&G, Inc., an independent accounting and business consulting firmAge: 62. Director since 2012.Term expires in 2015.Chairman of the Audit Committee; member of the Nominating and Corporate Governance Committee.
FRANK C. HERRINGERChairman of the Board, Transamerica Corporation, a financial services companyAge: 71. Director since 1996. Term expires in 2014. Chairman of the Nominating and Corporate Governance Committee; member of the Compensation Committee.
STEPHEN T. McLINChairman and Chief Executive Officer, STM Holdings LLC, which offers merger and acquisition adviceAge: 67. Director since 1988. Term expires in 2014. Chairman of the Risk Committee; member of the Audit Committee (through December 31, 2013); Nominating and Corporate Governance Committee.
ARUN SARINFormer Chief Executive Officer, Vodafone Group Plc, a mobile telecommunications companyAge: 59. Director since 2009. Term expires in 2016.Member of the Audit Committee; Nominating and Corporate Governance Committee.
PAULA A. SNEEDChairman and Chief Executive Officer, Phelps Prescott Group, LLC, a strategy and management consulting firmAge: 66. Director since 2002. Term expires in 2016. Member of the CompensationCommittee; Nominating andCorporate Governance Committee.
ROGER O. WALTHERChairman and Chief Executive Officer, Tusker Corporation, a real estate and business management companyAge: 78. Director since 1989. Term expires in 2014. Chairman of the Compensation Committee; member of the Nominating and Corporate Governance Committee.
ROBERT N. WILSONChairman, Mevion Medical Systems, Inc., a medical device companyAge: 73. Director since 2003. Term expires in 2014. Member of the Compensation Committee; Nominating and Corporate Governance Committee; Risk Committee.
i BOARD OF DIRECTORS

Str
ateg
y +
Des
ign
by U
nbou
ndar
y, In
c., A
tlan
ta, G
A |
Pri
ntin
g by
Lit
hogr
aphi
x, In
c. |
Thi
s re
port
incl
udes
rec
ycle
d pa
per.
THE CHARLES SCHWAB CORPORATION 211 Main Street San Francisco, CA 94105 (415) 667-7000 www.aboutschwab.com
The Charles Schwab Corporation (NYSE: SCHW) is a leading provider of financial services, with more than 300 offices and 9.1 million active brokerage accounts, 1.3 million corporate retirement plan participants, 916,000 banking accounts, and $2.25 trillion in client assets as of December 31, 2013. Through its operating subsidiaries, the company provides a full range of securities brokerage, banking, money management, and financial advisory services to individual investors and independent investment advisors.
Office of the Corporate Secretary (415) 667-9807
ANNUAL MEETING The annual meeting of stockholders will be conducted at 2:00 p.m. (Pacific Time) on May 15, 2014, at 211 Main Street, San Francisco, CA, and via the Internet. To register, visit: www.schwabevents.com/corporation
PUBLICATIONS To obtain the company’s annual report, 10-K, 10-Q, quarterly earnings release, or monthly activity report without charge, contact:
Charles Schwab Investor Relations 211 Main Street San Francisco, CA 94105 (415) 667-1959
These documents may also be viewed in the Investor Relations section of the company’s website at www.aboutschwab.com.
STOCK OWNERSHIP SERVICES All stockholders of record are welcome to participate in The Charles Schwab Corporation Dividend Reinvestment and Stock Purchase Plan, managed by Wells Fargo Bank, N.A. For information on the Dividend Reinvestment and Stock Purchase Plan, or for assistance on stock ownership questions, contact: Transfer Agent & Registrar Wells Fargo Bank, N.A.
Shareowner Services P.O. Box 64854 St. Paul, MN 55164 (877) 778-6753 www.shareowneronline.com
ABOUT THIS ANNUAL REPORT CEO and CFO Certifications: The Charles Schwab Corporation has included as exhibits to its Annual Report, on Form 10-K for the year ended December 31, 2013, filed with the Securities and Exchange Commission, certificates of its Chief Executive Officer and Chief Financial Officer certifying the quality of the company’s public disclosure.
TRADEMARKS OR REGISTERED TRADEMARKS Charles Schwab, Schwab, Schwab Bank, and other trademarks appearing herein, which may be indicated by “®” and “™,” are registered trademarks or trademarks of Charles Schwab & Co., Inc., or an affiliated entity in the U.S. and/or other countries. These trademarks and registered trademarks are proprietary to Charles Schwab & Co., Inc., or an affiliated entity in the U.S. and/or other countries.
Android is a trademark of Google Inc.
CHARLES SCHWAB FOUNDATION Carrie Schwab-Pomerantz, President of Charles Schwab Foundation and Senior Vice President, Charles Schwab & Co., Inc. www.aboutschwab.com/community Email: charlesschwabfoundation @schwab.com
CUSTOMER SERVICE Investor Services: (800) 435-4000 www.aboutschwab.com Advisor Services: (877) 687-4085 www.schwabadvisorcenter.com/public
INVESTOR RELATIONS Richard G. Fowler, Senior Vice President (415) 667-1841 Email: [email protected]
LEGISLATIVE & REGULATORY AFFAIRS Jeffrey T. Brown, Senior Vice President 325 7th Street NW, Suite 200 Washington, DC 20004 (202) 662-4902
MEDIA RELATIONS Greg Gable, Senior Vice President Media Hotline: (888) 767-5432 Email: [email protected]
INDEPENDENT AUDITORS Deloitte & Touche LLP 555 Mission Street San Francisco, CA 94105 (415) 783-4000 www.deloitte.com
OUTSIDE COUNSEL Arnold & Porter LLP Three Embarcadero Center, 10th Floor San Francisco, CA 94111-4024 www.arnoldporter.com
CORPORATE INFORMATION ii
© 2014 The Charles Schwab Corporation. All rights reserved.
The Charles Schwab Corporation (NYSE: SCHW) is an investing services firm with a history of innovating and advocating for individual investors and the advisors and institutions who serve them.
TABLE OF CONTENTS
Letter From the CEO Letter From the CFO Financial Highlights Growth in Client Assets and Accounts Executive Management Form 10-K Board of Directors Corporate Information
29
12 131415
i ii
In addition to historical information, this Annual Report to Stockholders contains “forward-looking statements,” which are identified by words such as “believe,” “expect,” “will,” “may,” “should,” “growth,” “commit,” “build,” “deliver,” “continue,” “remain,” “gain,” “can,” “likely,” “improve,” “drive,” “achieve,” and other similar expressions. In addition, any statements that refer to expectations, projections, or other characterizations of future events or circumstances are forward-looking statements. These forward-looking statements, which reflect management’s beliefs, objectives, and expectations as of the date hereof, are necessarily estimates based on the best judgment of the company’s senior management. These statements relate to, among other things, the company’s growth in client assets, market share, revenues, earnings, and profits (See “Letter from the Chief Executive Officer” and “Letter from the Chief Financial Officer”); increase in interest rates and revenue impact; headwinds (See “Letter from the Chief Executive Officer”); expenses; earnings power; capital formation outpacing balance sheet growth; and pre-tax profit margin (See “Letter from the Chief Financial Officer”). Achievement of the expressed beliefs, objectives, and expectations described in these statements is subject to certain risks and uncertainties that could cause actual results to differ materially from the expressed beliefs, objectives, and expectations. Readers are cautioned not to place undue reliance on these forward-looking statements, which speak only as of the date of this Annual Report to Stockholders. See “Forward-Looking Statements” in Management’s Discussion and Analysis of Financial Condition and Results of Operations on page 46 in the Form 10-K for a discussion of important factors that may cause such differences.