2013-14 School Performance Grade, School...
116
LEA Name School Code School Name SBE Region SPG Grade SPG Score Reading SPG Grade Reading SPG Score Math SPG Grade Math SPG Score EVAAS Growth Status EVAAS Growth Score Overall Achievement Score* Read Score* Math Score* Science Score* Math I Score* English II Score* Biology Score* The ACT Score* ACT WorkKeys Score* Math Course Rigor Score* Alamance-Burlington Schools 010303 Alamance-Burlington Middle College 5 A 85 85 61 57 >95 Alamance-Burlington Schools 010304 Alexander Wilson Elementary 5 C 67 C 66 C 65 Exceeded 85.4 63 62 60 73 Alamance-Burlington Schools 010308 Altamahaw Ossipee Elem 5 C 67 C 69 C 65 Met 77.3 65 65 65 65 Alamance-Burlington Schools 010310 Broadview Middle 5 F 36 D 42 F 30 NotMet 58.6 31 34 22 41 >95 Alamance-Burlington Schools 010311 Career Technical Education Center 5 I Alamance-Burlington Schools 010312 Highland Elementary 5 B 74 B 74 B 72 Exceeded 85.0 71 73 68 76 Alamance-Burlington Schools 010320 E M Yoder Elementary 5 C 69 B 72 C 62 Met 84.1 65 68 58 78 Alamance-Burlington Schools 010324 Eastern Alamance High 5 C 69 Met 84.2 65 57 52 62 58 86 88 Alamance-Burlington Schools 010326 Eastlawn Elementary 5 F 33 F 33 F 36 Met 74.7 23 22 24 20 Alamance-Burlington Schools 010328 Edwin M Holt Elementary 5 C 64 C 65 C 65 NotMet 68.6 63 61 65 65 Alamance-Burlington Schools 010340 Elon Elementary 5 C 66 C 63 C 62 Met 81.3 62 60 57 85 Alamance-Burlington Schools 010346 B Everett Jordan Elem 5 D 50 C 55 D 49 NotMet 59.1 47 50 47 39 Alamance-Burlington Schools 010347 Garrett Elementary 5 C 62 C 59 C 63 Met 81.8 57 53 59 63 Alamance-Burlington Schools 010348 Graham High 5 D 51 NotMet 56.4 49 31 39 31 31 62 >95 Alamance-Burlington Schools 010350 Graham Middle 5 D 42 D 43 F 35 Met 78.4 33 34 23 45 91 Alamance-Burlington Schools 010351 Grove Park Elementary 5 D 48 D 48 D 45 Met 84.6 39 40 35 47 Alamance-Burlington Schools 010353 Hawfields Middle 5 C 58 C 58 D 47 Met 76.5 53 53 42 78 93 Alamance-Burlington Schools 010354 Harvey R Newlin Elementary 5 F 38 F 39 F 37 Met 81.9 27 28 26 25 Alamance-Burlington Schools 010357 Haw River Elementary 5 F 39 F 39 D 40 NotMet 63.1 33 31 34 37 Alamance-Burlington Schools 010358 Hillcrest Elementary 5 D 50 D 49 D 46 Met 71.2 44 41 42 58 Alamance-Burlington Schools 010360 Hugh M Cummings High 5 C 58 Exceeded 89.2 50 48 39 41 28 72 81 Alamance-Burlington Schools 010362 Marvin B Smith Elementary 5 C 68 C 69 C 65 NotMet 54.4 71 70 69 84 Alamance-Burlington Schools 010364 North Graham Elementary 5 D 40 D 44 D 42 NotMet 58.3 36 37 37 29 Alamance-Burlington Schools 010372 Pleasant Grove Elementary 5 D 46 D 49 F 39 NotMet 69.4 40 43 32 54 Alamance-Burlington Schools 010374 R Homer Andrews Elementary 5 D 48 D 43 D 52 Met 81.8 40 34 44 46 Alamance-Burlington Schools 010378 Ray Street Academy 5 N/A N/A N/A Alamance-Burlington Schools 010380 South Graham Elementary 5 D 47 D 48 D 45 Met 77.6 39 40 36 44 Alamance-Burlington Schools 010384 South Mebane Elementary 5 B 73 B 74 B 70 Met 77.4 72 72 70 75 Alamance-Burlington Schools 010388 Southern High 5 C 66 Met 71.8 64 47 54 55 58 74 93 Alamance-Burlington Schools 010390 Southern Middle 5 C 56 C 57 D 53 NotMet 68.3 53 52 47 62 >95 Alamance-Burlington Schools 010392 Sylvan Elementary 5 C 59 C 58 C 60 NotMet 56.8 60 57 60 68 Alamance-Burlington Schools 010394 Turrentine Middle 5 D 47 D 52 F 39 NotMet 52.0 46 48 36 57 91 Alamance-Burlington Schools 010396 Walter M Williams High 5 C 66 Met 80.0 63 51 57 39 55 74 92 Alamance-Burlington Schools 010400 Western Alamance High 5 C 69 NotMet 68.6 70 55 60 54 64 76 >95 Alamance-Burlington Schools 010403 Western Middle 5 C 61 C 63 D 53 Met 76.5 57 59 47 70 >95 Alamance-Burlington Schools 010406 Woodlawn Middle 5 C 65 C 61 C 63 Met 84.5 60 56 57 69 >95 2013-14 School Performance Grade, School Performance Score and Growth Status by District/School N/A or I (Insufficient data) or a blank cell indicates a school does not have tested grades/sufficient data for reporting. *Percentages greater than 95 are displayed as >95 and percentages less than 5 are displayed as <5. NCDPI/Division of Accountability Services 1 of 116 February 5, 2015
Transcript of 2013-14 School Performance Grade, School...

LEA Name
School
Code School Name
SBE
Region
SPG
Grade
SPG
Score
Reading
SPG
Grade
Reading
SPG
Score
Math
SPG
Grade
Math
SPG
Score
EVAAS
Growth
Status
EVAAS
Growth
Score
Overall
Achievement
Score*
Read
Score*
Math
Score*
Science
Score*
Math I
Score*
English II
Score*
Biology
Score*
The
ACT
Score*
ACT
WorkKeys
Score*
Math
Course
Rigor
Score*
Alamance-Burlington Schools 010303 Alamance-Burlington Middle College 5 A 85 85 61 57 >95Alamance-Burlington Schools 010304 Alexander Wilson Elementary 5 C 67 C 66 C 65 Exceeded 85.4 63 62 60 73Alamance-Burlington Schools 010308 Altamahaw Ossipee Elem 5 C 67 C 69 C 65 Met 77.3 65 65 65 65Alamance-Burlington Schools 010310 Broadview Middle 5 F 36 D 42 F 30 NotMet 58.6 31 34 22 41 >95Alamance-Burlington Schools 010311 Career Technical Education Center 5 IAlamance-Burlington Schools 010312 Highland Elementary 5 B 74 B 74 B 72 Exceeded 85.0 71 73 68 76Alamance-Burlington Schools 010320 E M Yoder Elementary 5 C 69 B 72 C 62 Met 84.1 65 68 58 78Alamance-Burlington Schools 010324 Eastern Alamance High 5 C 69 Met 84.2 65 57 52 62 58 86 88Alamance-Burlington Schools 010326 Eastlawn Elementary 5 F 33 F 33 F 36 Met 74.7 23 22 24 20Alamance-Burlington Schools 010328 Edwin M Holt Elementary 5 C 64 C 65 C 65 NotMet 68.6 63 61 65 65Alamance-Burlington Schools 010340 Elon Elementary 5 C 66 C 63 C 62 Met 81.3 62 60 57 85Alamance-Burlington Schools 010346 B Everett Jordan Elem 5 D 50 C 55 D 49 NotMet 59.1 47 50 47 39Alamance-Burlington Schools 010347 Garrett Elementary 5 C 62 C 59 C 63 Met 81.8 57 53 59 63Alamance-Burlington Schools 010348 Graham High 5 D 51 NotMet 56.4 49 31 39 31 31 62 >95Alamance-Burlington Schools 010350 Graham Middle 5 D 42 D 43 F 35 Met 78.4 33 34 23 45 91Alamance-Burlington Schools 010351 Grove Park Elementary 5 D 48 D 48 D 45 Met 84.6 39 40 35 47Alamance-Burlington Schools 010353 Hawfields Middle 5 C 58 C 58 D 47 Met 76.5 53 53 42 78 93Alamance-Burlington Schools 010354 Harvey R Newlin Elementary 5 F 38 F 39 F 37 Met 81.9 27 28 26 25Alamance-Burlington Schools 010357 Haw River Elementary 5 F 39 F 39 D 40 NotMet 63.1 33 31 34 37Alamance-Burlington Schools 010358 Hillcrest Elementary 5 D 50 D 49 D 46 Met 71.2 44 41 42 58Alamance-Burlington Schools 010360 Hugh M Cummings High 5 C 58 Exceeded 89.2 50 48 39 41 28 72 81Alamance-Burlington Schools 010362 Marvin B Smith Elementary 5 C 68 C 69 C 65 NotMet 54.4 71 70 69 84Alamance-Burlington Schools 010364 North Graham Elementary 5 D 40 D 44 D 42 NotMet 58.3 36 37 37 29Alamance-Burlington Schools 010372 Pleasant Grove Elementary 5 D 46 D 49 F 39 NotMet 69.4 40 43 32 54Alamance-Burlington Schools 010374 R Homer Andrews Elementary 5 D 48 D 43 D 52 Met 81.8 40 34 44 46Alamance-Burlington Schools 010378 Ray Street Academy 5 N/A N/A N/AAlamance-Burlington Schools 010380 South Graham Elementary 5 D 47 D 48 D 45 Met 77.6 39 40 36 44Alamance-Burlington Schools 010384 South Mebane Elementary 5 B 73 B 74 B 70 Met 77.4 72 72 70 75Alamance-Burlington Schools 010388 Southern High 5 C 66 Met 71.8 64 47 54 55 58 74 93Alamance-Burlington Schools 010390 Southern Middle 5 C 56 C 57 D 53 NotMet 68.3 53 52 47 62 >95Alamance-Burlington Schools 010392 Sylvan Elementary 5 C 59 C 58 C 60 NotMet 56.8 60 57 60 68Alamance-Burlington Schools 010394 Turrentine Middle 5 D 47 D 52 F 39 NotMet 52.0 46 48 36 57 91Alamance-Burlington Schools 010396 Walter M Williams High 5 C 66 Met 80.0 63 51 57 39 55 74 92Alamance-Burlington Schools 010400 Western Alamance High 5 C 69 NotMet 68.6 70 55 60 54 64 76 >95Alamance-Burlington Schools 010403 Western Middle 5 C 61 C 63 D 53 Met 76.5 57 59 47 70 >95Alamance-Burlington Schools 010406 Woodlawn Middle 5 C 65 C 61 C 63 Met 84.5 60 56 57 69 >95
2013-14 School Performance Grade, School Performance Score and Growth Status by District/School
N/A or I (Insufficient data) or a blank cell indicates a school does not have tested grades/sufficient data for reporting.*Percentages greater than 95 are displayed as >95 and percentages less than 5 are displayed as <5.
NCDPI/Division of Accountability Services 1 of 116 February 5, 2015

Alexander County Schools 020302 Alexander Central High 7 B 73 Exceeded 87.9 69 56 57 60 64 66 94Alexander County Schools 020304 Bethlehem Elementary 7 C 66 C 68 C 66 NotMet 59.9 67 68 66 69Alexander County Schools 020306 East Alexander Middle 7 D 54 C 63 F 37 NotMet 66.2 51 58 33 71 >95Alexander County Schools 020308 Ellendale Elementary 7 C 63 C 67 C 64 NotMet 59.7 64 64 65 58Alexander County Schools 020316 Hiddenite Elementary 7 C 66 C 59 B 70 Met 80.4 62 55 67 70Alexander County Schools 020320 Stony Point Elementary 7 C 56 C 61 D 54 NotMet 59.7 56 59 52 56Alexander County Schools 020324 Sugar Loaf Elementary 7 C 68 C 65 C 67 Met 80.5 65 61 63 77Alexander County Schools 020328 Taylorsville Elementary 7 C 58 C 61 D 54 NotMet 60.4 57 57 54 66Alexander County Schools 020330 West Alexander Middle 7 C 65 C 68 D 50 Exceeded 91.5 58 62 43 83 >95Alexander County Schools 020332 Wittenburg Elementary 7 C 64 C 65 C 58 NotMet 67.5 64 61 59 84Alleghany County Schools 030304 Alleghany High 7 B 71 Met 82.5 68 54 62 60 66 52 87Alleghany County Schools 030308 Glade Creek Elementary 7 C 64 C 55 C 64 Met 84.2 59 50 58 79 >95Alleghany County Schools 030316 Piney Creek Elementary 7 B 80 B 76 B 80 Met 81.3 79 75 79 91 83Alleghany County Schools 030320 Sparta Elementary 7 D 54 C 57 D 47 NotMet 59.9 53 53 44 75 89Anson County Schools 040304 Anson Co. Early College High 6 C 65 Met 81.1 61 33 64 51 62 >95Anson County Schools 040305 Anson Academy 6 N/A N/A N/AAnson County Schools 040306 Anson High School 6 C 55 Met 81.3 49 17 36 28 28 26 >95Anson County Schools 040308 Ansonville Elementary 6 C 61 C 62 C 59 Exceeded 90.1 53 55 53 51Anson County Schools 040309 Anson Middle 6 D 40 D 44 F 30 NotMet 57.2 36 38 24 57Anson County Schools 040311 Wadesboro Primary 6 F 35 D 43 F 30 NotMet 59.4 30 39 21Anson County Schools 040316 Lilesville Elementary 6 D 49 D 50 D 46 Exceeded 91.5 38 41 35 41Anson County Schools 040324 Morven Elementary 6 D 43 F 38 D 47 Exceeded 91.7 31 27 34 35Anson County Schools 040328 Peachland-Polkton Elem 6 C 60 C 59 C 59 Exceeded 86.5 53 54 51 59Anson County Schools 040330 Wadesboro Elementary 6 F 37 F 39 F 35 Exceeded 85.8 25 28 22 26Anson County Schools 040700 Anson New Tech High 6 D 49 NotMet 59.5 46 11 46 33 46 >95Ashe County Schools 050302 Ashe County High 7 C 69 NotMet 65.2 71 54 67 70 57 72 95Ashe County Schools 050305 Ashe County Middle 7 B 70 B 71 C 62 Exceeded 89.2 66 67 56 83Ashe County Schools 050310 Blue Ridge Elementary 7 C 59 C 59 D 54 Exceeded 86.4 52 53 47 71Ashe County Schools 050330 Mountain View Elementary 7 B 73 B 70 B 71 Exceeded 97.6 66 64 65 81Ashe County Schools 050335 Westwood Elementary 7 B 71 B 71 C 69 Exceeded 88.9 66 66 65 71Avery County Schools 060302 Avery County High 7 C 66 NotMet 68.2 66 <5 37 42 58 78 >95Avery County Schools 060304 Banner Elk Elementary 7 C 69 C 64 C 68 Met 84.7 65 59 64 82Avery County Schools 060310 Cranberry Middle 7 B 71 B 72 C 66 Exceeded 94.0 66 68 59 83Avery County Schools 060316 Crossnore Elementary 7 B 79 B 74 B 77 Exceeded 93.4 75 72 73 88Avery County Schools 060318 Avery Middle 7 C 58 C 58 D 45 Met 80.0 53 53 38 81 >95Avery County Schools 060322 Freedom Trail Elementary 7 C 61 C 62 C 55 Exceeded 86.4 55 56 49 71Avery County Schools 060328 Newland Elementary 7 C 56 C 59 D 53 Met 80.4 50 54 45 54Avery County Schools 060332 Riverside Elementary 7 C 59 C 57 C 55 Exceeded 86.6 52 50 46 70Avery County Schools 060334 Blue Ridge Academy 7 N/A N/A N/AAvery County Schools 060700 Avery High STEM Academy 7 A 88 Met 81.3 89 60 78 93 >95 >95Avery County Schools 060701 Avery High Viking Academy 7 C 66 Met 71.4 65 58 >95Beaufort County Schools 070302 Eastern Elementary 1 IBeaufort County Schools 070308 Bath Elementary 1 B 70 C 69 C 67 NotMet 64.9 71 69 68 83 >95Beaufort County Schools 070310 B C Ed Tech Center 1 N/A N/A N/ABeaufort County Schools 070311 Beaufort Co Early College High 1 A 88 Exceeded 89.8 88 80 80 86 >95 >95
NCDPI/Division of Accountability Services 2 of 116 February 5, 2015

Beaufort County Schools 070325 Chocowinity Middle 1 D 51 D 54 D 41 NotMet 56.5 49 52 36 65 79Beaufort County Schools 070326 Chocowinity Primary 1 B 78 B 76 B 80 Met 82.0 77 75 79Beaufort County Schools 070327 John C Tayloe Elementary 1 C 56 C 56 D 51 Met 80.4 50 50 51Beaufort County Schools 070328 John Small Elementary 1 D 44 D 50 F 39 NotMet 50.0 42 46 36 46Beaufort County Schools 070329 Northeast Elementary 1 C 59 C 55 D 53 Met 84.0 53 50 45 78 95Beaufort County Schools 070330 Northside High 1 C 61 NotMet 59.3 62 58 51 34 51 70 >95Beaufort County Schools 070338 P S Jones Middle 1 D 50 D 45 D 44 Met 76.0 43 41 34 64 79Beaufort County Schools 070339 Southside High 1 C 66 Met 81.1 62 57 51 29 42 70 >95Beaufort County Schools 070340 S W Snowden Elementary 1 D 40 D 40 F 34 Met 72.1 32 31 24 47 60Beaufort County Schools 070342 Washington High 1 C 62 Met 74.2 59 38 49 47 53 60 >95Bertie County Schools 080311 Bertie Early College High 1 B 71 Met 74.9 70 51 71 55 61 85 >95Bertie County Schools 080312 Bertie High 1 D 46 NotMet 58.4 43 21 25 18 16 34 >95Bertie County Schools 080314 Bertie Middle 1 D 47 D 49 F 35 Exceeded 88.8 37 39 24 66 86Bertie County Schools 080348 Aulander Elementary 1 D 43 D 45 D 42 Met 77.2 35 39 31 33Bertie County Schools 080356 West Bertie Elementary 1 F 35 F 39 F 34 NotMet 67.5 27 30 23 27Bertie County Schools 080360 Colerain Elementary 1 F 38 D 46 F 34 Met 70.1 30 38 24 27Bertie County Schools 080362 Windsor Elementary 1 D 48 D 43 D 47 Met 76.8 41 37 39 61Bertie County Schools 080375 Bertie Academy 1 N/A N/A N/ABertie County Schools 080700 Bertie STEM High 1 B 83 Met 80.1 84 65 80 85 67 86 >95Bladen County Schools 090304 B T Washington Primary 4 D 54 D 48 C 62 Met 70.5 50 44 56 50Bladen County Schools 090315 Bladenboro Middle 4 F 39 D 45 F 30 NotMet 58.2 34 38 23 48 54Bladen County Schools 090317 Bladenboro Primary 4 C 55 D 54 C 57 NotMet 68.5 52 49 54Bladen County Schools 090318 Bladen Lakes Primary 4 D 52 D 52 D 51 Exceeded 85.3 44 46 41Bladen County Schools 090320 Clarkton School of Discovery 4 D 54 C 63 D 42 NotMet 58.8 52 60 37 65 >95Bladen County Schools 090324 Dublin Primary 4 C 65 C 62 C 68 Exceeded 86.8 60 56 63Bladen County Schools 090328 East Arcadia Elementary 4 D 40 D 40 F 35 Met 78.9 30 30 24 46 83Bladen County Schools 090330 East Bladen High 4 C 56 NotMet 66.1 53 33 52 33 32 64 >95Bladen County Schools 090332 Elizabethtown Middle 4 D 43 D 43 F 36 Met 82.8 33 33 24 50 47Bladen County Schools 090333 Elizabethtown Primary 4 D 50 D 51 D 49 Met 84.5 42 43 41Bladen County Schools 090352 Plain View Primary 4 C 57 C 55 C 59 Met 78.6 51 49 54Bladen County Schools 090365 Tar Heel Middle 4 D 44 D 49 F 31 Met 73.8 37 41 21 56 70Bladen County Schools 090368 West Bladen High 4 C 56 NotMet 66.5 53 22 50 39 34 52 >95Brunswick County Schools 100302 Belville Elementary 2 C 55 C 63 D 51 NotMet 54.8 56 60 51 59Brunswick County Schools 100304 Bolivia Elementary 2 C 63 C 65 C 65 NotMet 65.5 63 62 64 58Brunswick County Schools 100307 Brunswick County Early College 2 A 94 Met 84.4 >95 95 >95 82 >95 >95Brunswick County Schools 100308 Brunswick County Academy 2 N/A N/A N/ABrunswick County Schools 100309 Cedar Grove Middle 2 C 57 C 59 D 49 Exceeded 86.0 50 53 39 68 >95Brunswick County Schools 100310 Jessie Mae Monroe Elementary 2 D 52 D 52 D 53 Met 70.5 47 46 46 52Brunswick County Schools 100316 Leland Middle 2 D 50 C 57 F 38 NotMet 68.1 46 51 32 68 >95Brunswick County Schools 100320 Lincoln Elementary 2 C 60 D 54 C 58 Exceeded 90.7 52 47 50 72Brunswick County Schools 100326 North Brunswick High 2 C 64 Met 76.7 61 40 48 52 49 74 >95Brunswick County Schools 100332 Shallotte Middle 2 C 69 B 72 C 56 Exceeded 96.7 62 67 47 81 >95Brunswick County Schools 100334 South Brunswick High 2 C 69 NotMet 68.1 69 52 61 55 60 52 95Brunswick County Schools 100335 South Brunswick Middle 2 C 58 C 61 D 49 NotMet 59.9 57 60 44 71 94Brunswick County Schools 100336 Southport Elementary 2 C 58 C 65 C 56 NotMet 59.9 57 63 53 51
NCDPI/Division of Accountability Services 3 of 116 February 5, 2015

Brunswick County Schools 100338 Supply Elementary 2 D 48 D 51 D 47 NotMet 59.6 45 47 43 44Brunswick County Schools 100339 Town Creek Elementary 2 D 51 C 59 D 47 NotMet 61.4 48 55 44 40Brunswick County Schools 100340 Union Elementary 2 B 75 B 75 B 71 Exceeded 90.1 71 72 67 81Brunswick County Schools 100342 Virginia Williamson Elem 2 C 56 C 64 D 52 NotMet 58.9 55 60 50 58Brunswick County Schools 100344 Waccamaw 2 C 59 C 61 C 56 NotMet 69.1 57 57 52 69 82Brunswick County Schools 100348 West Brunswick High 2 B 71 Exceeded 88.5 67 55 64 60 57 40 >95Buncombe County Schools 110303 Community High School 8 N/A N/A N/ABuncombe County Schools 110304 Reynolds High 8 B 72 NotMet 68.4 74 58 72 64 67 71 >95Buncombe County Schools 110306 Reynolds Middle 8 C 67 C 60 C 63 Met 84.1 62 60 56 74 >95Buncombe County Schools 110308 Barnardsville Elementary 8 C 64 C 66 C 60 Met 83.7 59 63 54Buncombe County Schools 110318 Black Mountain Elementary 8 C 68 C 65 C 68 NotMet 62.7 69 67 68 76Buncombe County Schools 110320 Black Mountain Primary 8 B 72 B 75 C 66 Met 82.5 70 73 66Buncombe County Schools 110322 Buncombe County Early College 8 A 92 Met 82.3 94 93 >95 88 >95 >95Buncombe County Schools 110323 Buncombe County Middle College 8 N/A N/A N/ABuncombe County Schools 110324 Candler Elementary 8 C 61 C 68 C 59 NotMet 63.7 60 64 58 53Buncombe County Schools 110326 Cane Creek Middle 8 B 75 B 72 B 70 Met 82.3 74 72 67 85 >95Buncombe County Schools 110332 Bell Elementary 8 C 67 C 65 C 69 Met 80.7 64 61 67 63Buncombe County Schools 110336 Owen High 8 B 70 Met 77.4 68 54 64 52 60 69 >95Buncombe County Schools 110338 Owen Middle 8 C 58 C 58 D 47 NotMet 66.7 55 57 41 78 93Buncombe County Schools 110340 Erwin High 8 C 58 NotMet 59.5 58 46 50 39 42 70 95Buncombe County Schools 110342 Erwin Middle 8 C 55 C 56 D 43 NotMet 57.6 54 54 39 75 80Buncombe County Schools 110348 Emma Elementary 8 D 52 D 45 C 57 Exceeded 88.9 43 37 49Buncombe County Schools 110352 Enka High 8 C 58 NotMet 50.0 60 42 56 41 53 69 >95Buncombe County Schools 110356 Fairview Elementary 8 C 69 C 65 C 66 Exceeded 89.4 64 61 61 80Buncombe County Schools 110366 Glen Arden Elementary 8 B 78 B 76 B 79 Met 81.0 77 76 79Buncombe County Schools 110368 Haw Creek Elementary 8 C 65 C 62 C 67 NotMet 63.7 66 62 66 75Buncombe County Schools 110370 Hominy Valley Elementary 8 C 68 C 62 B 71 Met 71.6 67 62 68 74Buncombe County Schools 110372 Johnston Elementary 8 D 48 D 54 D 42 Met 78.0 40 48 33Buncombe County Schools 110376 Leicester Elementary 8 C 66 C 63 C 68 Exceeded 90.3 60 57 63Buncombe County Schools 110379 North Buncombe Elementary 8 C 64 C 61 C 66 Met 83.0 59 58 60Buncombe County Schools 110380 North Buncombe High 8 B 75 Met 82.0 73 63 66 65 62 74 >95Buncombe County Schools 110381 North Buncombe Middle 8 C 61 C 63 D 52 NotMet 56.1 63 64 49 76 81Buncombe County Schools 110382 North Windy Ridge Intermediate 8 C 68 C 65 B 72 Met 78.6 65 63 67 65Buncombe County Schools 110384 Oakley Elementary 8 C 56 C 56 D 54 Met 78.6 50 50 47 62Buncombe County Schools 110388 Pisgah Elementary 8 B 80 B 79 B 81 Exceeded 89.9 78 77 79 75Buncombe County Schools 110401 Enka Middle 8 C 58 C 58 D 53 NotMet 55.7 58 58 50 72 >95Buncombe County Schools 110408 Sand Hill-Venable Elem 8 C 57 C 63 C 58 NotMet 58.8 57 60 57 46Buncombe County Schools 110410 Avery's Creek Elementary 8 C 60 C 62 C 60 NotMet 60.3 60 61 59Buncombe County Schools 110412 Williams Elementary 8 C 59 C 57 C 59 NotMet 69.4 56 55 55 61Buncombe County Schools 110416 Roberson High 8 B 75 NotMet 66.2 77 72 72 60 70 72 >95Buncombe County Schools 110420 Valley Springs Middle 8 B 71 C 63 C 66 Exceeded 86.3 67 63 60 76 >95Buncombe County Schools 110422 Estes Elementary 8 C 68 B 70 C 68 NotMet 59.7 70 70 70Buncombe County Schools 110428 Weaverville Elementary 8 B 70 B 72 C 69 Met 75.9 69 71 67Buncombe County Schools 110432 Weaverville Primary 8 IBuncombe County Schools 110436 West Buncombe Elementary 8 B 73 B 71 B 74 Exceeded 87.3 69 69 69
NCDPI/Division of Accountability Services 4 of 116 February 5, 2015

Buncombe County Schools 110444 Woodfin Elementary 8 D 53 D 51 C 56 NotMet 69.5 49 46 52Buncombe County Schools 110450 Koontz Intermediate 8 C 62 C 62 C 62 NotMet 56.0 63 63 60 70Buncombe County Schools 110451 Eblen Intermediate 8 D 51 D 51 D 51 NotMet 61.9 48 46 47 55Asheville City Schools 111302 Asheville High 8 C 69 NotMet 59.6 71 56 68 57 66 49 >95Asheville City Schools 111304 Hall Fletcher Elementary 8 C 58 D 54 C 58 Met 78.4 53 47 53 66Asheville City Schools 111306 Isaac Dickson Elementary 8 B 80 B 79 B 78 Met 78.7 80 79 79 85Asheville City Schools 111312 Claxton Elementary 8 B 76 B 73 B 74 Exceeded 87.7 73 70 72 87Asheville City Schools 111332 Ira B Jones Elementary 8 C 69 C 69 C 66 Met 74.4 68 68 64 81Asheville City Schools 111356 Asheville Middle 8 C 65 C 65 C 58 Met 72.4 63 63 54 78 >95Asheville City Schools 111360 Vance Elementary 8 B 78 B 77 B 76 Exceeded 90.8 74 74 73 80Asheville City Schools 111700 School of Inquiry and Life Sciences 8 A 90 Exceeded 86.9 90 78 88 >95 >95 >95Burke County Schools 120304 Chesterfield Elementary 7 C 63 C 60 C 57 Met 83.6 57 57 50 76Burke County Schools 120308 Hallyburton Academy 7 N/A N/A N/ABurke County Schools 120310 Burke Middle College 7 A 99 >95 >95 >95Burke County Schools 120312 Drexel Elementary 7 C 58 C 62 D 50 Met 76.5 53 57 44 66Burke County Schools 120314 East Burke High 7 C 64 NotMet 50.0 67 51 57 61 57 54 >95Burke County Schools 120315 East Burke Middle 7 B 74 B 72 C 67 Exceeded 91.5 69 69 62 86 >95Burke County Schools 120316 Forest Hill Elementary 7 C 66 C 64 C 66 Met 83.0 62 61 61 69Burke County Schools 120318 Freedom High 7 C 61 NotMet 51.1 64 49 58 40 46 64 >95Burke County Schools 120320 George Hildebrand Elementary 7 C 68 C 63 C 66 Met 74.8 66 63 63 85Burke County Schools 120324 Glen Alpine Elementary 7 B 70 C 69 C 67 Exceeded 87.3 65 65 62 73Burke County Schools 120334 Heritage Middle 7 C 69 C 66 C 65 Exceeded 97.8 62 59 57 84 >95Burke County Schools 120338 Hildebran Elementary 7 B 76 B 74 B 71 Exceeded 95.9 70 69 65 90Burke County Schools 120340 Mountain Crest Elementary 7 C 57 D 49 C 57 Exceeded 89.9 49 42 48 74Burke County Schools 120344 Icard Elementary 7 C 66 C 60 C 63 Met 80.5 62 58 59 82Burke County Schools 120346 Jimmy C Draughn High School 7 B 79 Met 80.1 79 77 65 77 63 65 >95Burke County Schools 120350 Liberty Middle 7 C 68 C 69 C 62 Exceeded 90.0 62 64 55 73 >95Burke County Schools 120352 North Liberty 7 N/A N/A N/ABurke County Schools 120360 Mull Elementary 7 C 69 B 71 C 58 Exceeded 86.5 65 68 53 92Burke County Schools 120364 Oak Hill Elementary 7 C 63 C 60 C 56 Exceeded 86.1 57 56 50 82Burke County Schools 120368 Ray Childers Elementary 7 C 61 C 60 C 60 NotMet 58.1 62 58 61 74Burke County Schools 120370 Robert L. Patton High School 7 C 67 NotMet 56.9 70 60 62 46 67 78 >95Burke County Schools 120372 Rutherford College Elem 7 A 86 A 88 B 81 Exceeded 91.3 85 88 80 >95Burke County Schools 120374 Salem Elementary 7 B 72 C 69 C 67 Exceeded 91.3 67 66 60 93Burke County Schools 120376 Table Rock Middle 7 C 62 C 61 C 57 Exceeded 86.7 56 56 50 71 >95Burke County Schools 120380 Valdese Elementary 7 B 70 B 71 C 66 Exceeded 86.2 66 67 62 74Burke County Schools 120386 W A Young Elementary 7 C 60 C 60 D 52 Exceeded 87.0 54 54 45 78Burke County Schools 120390 Walter R Johnson Middle 7 C 69 C 65 C 63 Exceeded 95.8 62 59 55 81 >95Cabarrus County Schools 130304 A T Allen Elementary 6 C 62 C 60 C 63 NotMet 67.8 61 56 62 69Cabarrus County Schools 130307 Cox Mill High School 6 B 80 Met 83.9 79 65 74 67 76 79 >95Cabarrus County Schools 130308 Bethel Elementary 6 C 58 C 60 D 53 NotMet 64.1 57 56 52 76Cabarrus County Schools 130309 Beverly Hills Elementary 6 C 61 C 64 C 61 Met 82.8 55 58 55 47Cabarrus County Schools 130310 Central Cabarrus High 6 B 71 Exceeded 89.0 66 55 60 55 54 79 94Cabarrus County Schools 130311 Coltrane-Webb Elementary 6 C 64 C 64 C 63 Met 74.4 61 60 62 61Cabarrus County Schools 130312 Harrisburg Elementary 6 B 75 B 76 B 75 Met 80.2 74 75 73 74
NCDPI/Division of Accountability Services 5 of 116 February 5, 2015

Cabarrus County Schools 130313 Concord Middle 6 D 45 D 44 F 36 NotMet 68.4 39 37 29 62 94Cabarrus County Schools 130314 Concord High 6 C 61 NotMet 56.0 62 48 54 49 62 69 81Cabarrus County Schools 130315 J N Fries Magnet School 6 A 87 A 92 B 78 Met 82.4 89 93 81 >95 92Cabarrus County Schools 130316 Jay M Robinson High 6 C 64 NotMet 56.4 66 47 57 43 61 72 >95Cabarrus County Schools 130317 Cabarrus Co Opportunity School 6 N/A N/A N/ACabarrus County Schools 130318 C C Griffin Middle 6 D 46 D 53 F 31 NotMet 63.0 42 48 25 66 >95Cabarrus County Schools 130319 Cox Mill Elementary 6 B 81 B 80 A 86 Met 79.6 81 80 85 74Cabarrus County Schools 130320 Harris Road Middle 6 B 79 B 77 B 74 Exceeded 100.0 74 74 68 87 >95Cabarrus County Schools 130321 Carl A Furr Elementary 6 C 65 C 64 C 67 Met 76.0 63 60 65 66Cabarrus County Schools 130322 Mount Pleasant Elementary 6 B 72 C 68 C 67 Exceeded 89.8 67 65 62 86Cabarrus County Schools 130323 Mount Pleasant Middle 6 C 68 C 69 D 53 Exceeded 90.1 62 64 49 84 >95Cabarrus County Schools 130324 Mount Pleasant High 6 C 65 NotMet 59.0 66 45 51 45 62 79 >95Cabarrus County Schools 130325 Charles E Boger Elementary 6 C 64 C 66 C 63 NotMet 68.9 63 63 62 65Cabarrus County Schools 130326 Northwest Cabarrus High 6 B 72 Exceeded 86.4 69 55 58 58 60 66 >95Cabarrus County Schools 130327 Northwest Cabarrus Middle 6 C 62 C 62 D 52 Exceeded 90.7 55 57 44 76 >95Cabarrus County Schools 130328 Royal Oaks Elementary 6 D 53 D 50 C 55 Met 79.1 47 44 48 52Cabarrus County Schools 130329 Rocky River Elementary 6 D 53 C 55 D 52 NotMet 69.0 49 50 47 53Cabarrus County Schools 130330 R Brown McAllister Elementary 6 B 72 C 66 B 72 Exceeded 93.5 66 62 66 77Cabarrus County Schools 130331 Pitts School Road Elementary 6 C 64 C 66 C 64 NotMet 56.8 66 65 66 69Cabarrus County Schools 130332 Hickory Ridge High 6 B 83 Exceeded 93.9 80 73 75 68 75 80 >95Cabarrus County Schools 130333 Performance Learning Center 6 C 62 62 35 23 52 42 82Cabarrus County Schools 130335 Long School 6 ICabarrus County Schools 130336 W R Odell Elementary 6 B 76 B 75 B 76 Met 78.6 75 73 77 78Cabarrus County Schools 130338 Weddington Hills Elementary 6 C 63 C 61 C 66 Met 82.4 58 56 61 55Cabarrus County Schools 130340 Winecoff Elementary 6 D 47 D 51 D 51 NotMet 58.7 44 43 49 32Cabarrus County Schools 130342 W M Irvin Elementary 6 D 47 D 53 D 52 NotMet 66.3 43 47 46 21Cabarrus County Schools 130344 Wolf Meadow Elementary 6 D 52 D 52 C 57 Met 74.1 47 46 51 33Cabarrus County Schools 130345 Patriots Elementary 6 C 69 B 70 C 65 Met 82.9 65 66 62 71Cabarrus County Schools 130346 Hickory Ridge Middle 6 B 74 B 72 C 68 Exceeded 91.1 69 70 62 82 >95Cabarrus County Schools 130350 Cabarrus-Kannapolis Early Coll 6 A 87 Met 81.0 89 77 92 86 91 >95Cabarrus County Schools 130355 Harold E. Winkler Middle 6 C 62 C 60 D 52 Exceeded 88.8 55 55 44 76 >95Kannapolis City Schools 132304 A L Brown High 3 C 59 NotMet 55.2 60 42 52 44 54 68 >95Kannapolis City Schools 132308 Forest Park Elementary 3 C 60 C 59 C 61 Exceeded 90.0 53 52 53Kannapolis City Schools 132312 Fred L Wilson Elementary 3 C 55 D 48 C 60 Exceeded 86.6 47 40 54Kannapolis City Schools 132328 Jackson Park Elementary 3 C 55 D 54 C 55 Met 80.8 49 47 51Kannapolis City Schools 132329 Kannapolis Intermediate 3 D 44 D 46 D 41 NotMet 55.6 41 42 36 52Kannapolis City Schools 132330 Kannapolis Middle 3 D 45 D 50 F 34 NotMet 57.0 42 42 29 61 >95Kannapolis City Schools 132332 Shady Brook Elementary 3 C 58 C 56 C 60 Met 81.1 52 49 56Kannapolis City Schools 132336 Woodrow Wilson Elementary 3 D 54 D 51 C 57 Met 80.1 48 44 52Caldwell County Schools 140304 Baton Elementary 7 B 71 C 69 C 66 Exceeded 90.0 66 65 63 80Caldwell County Schools 140305 Caldwell Career Cen Mid. Coll. 7 B 81 Met 77.3 82 79 92 55 78 90 >95Caldwell County Schools 140306 Gateway School 7 N/A N/A N/ACaldwell County Schools 140307 Horizons Elementary 7 N/A N/A N/ACaldwell County Schools 140308 Collettsville School 7 B 77 B 76 B 71 Exceeded 90.3 74 74 67 88 >95Caldwell County Schools 140309 Caldwell Early College 7 A 93 Exceeded 89.4 94 90 91 85 >95 >95
NCDPI/Division of Accountability Services 6 of 116 February 5, 2015

Caldwell County Schools 140312 Davenport A+ School 7 C 64 C 66 C 58 Exceeded 86.6 58 62 52 66Caldwell County Schools 140316 Dudley Shoals Elementary 7 C 66 B 70 C 55 Exceeded 87.4 61 64 50 80Caldwell County Schools 140324 Gamewell Elementary 7 C 61 C 62 C 55 Exceeded 95.2 52 55 45 63Caldwell County Schools 140332 Gamewell Middle 7 C 56 C 57 D 45 Exceeded 92.4 47 50 34 70 >95Caldwell County Schools 140336 Granite Falls Middle 7 C 69 C 69 C 62 Exceeded 94.9 63 64 54 77 >95Caldwell County Schools 140340 Granite Falls Elementary 7 B 72 B 71 C 69 Exceeded 90.2 67 68 64 76Caldwell County Schools 140344 Happy Valley Elementary 7 C 63 C 63 C 55 Met 84.4 58 58 49 80 82Caldwell County Schools 140348 Hibriten High 7 B 72 Met 81.1 70 42 69 61 59 72 >95Caldwell County Schools 140352 Hudson Elementary 7 C 67 C 68 C 63 Exceeded 90.3 62 63 57 71Caldwell County Schools 140356 Hudson Middle 7 C 69 C 69 C 58 Exceeded 93.2 63 65 50 87 >95Caldwell County Schools 140360 Kings Creek Elementary 7 C 65 C 69 C 55 Met 80.0 62 65 51 79Caldwell County Schools 140368 William Lenoir Middle 7 C 65 C 64 C 55 Exceeded 93.2 58 59 46 80 >95Caldwell County Schools 140372 Lower Creek Elementary 7 C 67 C 68 C 62 Met 81.1 63 65 57 77Caldwell County Schools 140376 Oak Hill Elementary 7 C 58 C 67 D 40 Met 82.8 51 62 30 76Caldwell County Schools 140384 Sawmills Elementary 7 C 56 C 65 D 54 Met 79.7 50 61 46 30Caldwell County Schools 140386 South Caldwell High 7 B 71 Met 71.6 71 63 59 55 60 79 >95Caldwell County Schools 140388 Valmead Elementary 7 D 49 C 55 F 37 Met 80.8 41 48 28 56Caldwell County Schools 140390 West Caldwell High 7 C 64 Met 70.7 63 42 49 49 49 60 >95Caldwell County Schools 140392 West Lenoir Elementary 7 D 46 D 48 D 40 NotMet 68.1 40 42 33 57Caldwell County Schools 140396 Whitnel Elementary 7 C 57 C 56 C 55 Met 81.2 51 49 49 64Camden County Schools 150304 Camden County High 1 B 80 Exceeded 90.7 77 68 74 68 65 84 >95Camden County Schools 150308 Grandy Primary 1 B 83 B 79 A 85 Exceeded 90.0 81 77 85Camden County Schools 150310 Camden Intermediate 1 C 68 B 75 D 53 Met 80.2 66 73 50 87Camden County Schools 150312 Camden Middle 1 C 65 C 65 D 49 Met 76.1 62 64 42 92 >95Camden County Schools 150700 CamTech High 1 B 76 Met 80.0 75 65 82 66 76 >95 >95Carteret County Public Schools 160304 Atlantic Elementary 2 B 75 B 80 C 65 Met 82.9 73 80 61 81 >95Carteret County Public Schools 160306 Bogue Sound Elementary 2 C 61 C 64 C 63 NotMet 65.7 59 62 60 51Carteret County Public Schools 160308 Beaufort Elementary 2 B 72 B 74 B 70 Met 79.4 70 72 69 68Carteret County Public Schools 160309 Bridges School 2 N/A N/A N/ACarteret County Public Schools 160310 Beaufort Middle 2 C 63 C 68 D 52 Met 83.0 59 64 45 71 >95Carteret County Public Schools 160311 Broad Creek Middle 2 B 76 B 77 C 68 Exceeded 97.6 70 74 62 78 >95Carteret County Public Schools 160313 East Carteret High 2 B 80 F 0 F 0 Exceeded 92.3 77 <5 <5 <5 62 66 85 67 79 >95Carteret County Public Schools 160314 Croatan High 2 A 89 Exceeded 96.6 87 85 83 77 88 94 >95Carteret County Public Schools 160316 Harkers Island Elementary 2 B 78 B 79 B 71 Met 82.1 76 79 70 80 >95Carteret County Public Schools 160317 Morehead Elem at Camp Glenn 2 C 61 C 62 D 53 Met 73.8 57 57 50 73Carteret County Public Schools 160318 Morehead City Middle 2 B 70 B 72 C 60 Exceeded 86.8 66 69 54 86 >95Carteret County Public Schools 160322 Morehead City Primary 2 B 74 B 76 C 69 Met 84.8 72 74 69Carteret County Public Schools 160324 Newport Elementary 2 C 69 C 69 B 70 Met 74.9 68 68 69 66Carteret County Public Schools 160326 Newport Middle 2 C 65 C 67 C 56 Met 76.7 62 63 51 81 >95Carteret County Public Schools 160332 Smyrna Elementary 2 B 70 B 72 C 61 Exceeded 88.7 66 68 55 85 >95Carteret County Public Schools 160344 West Carteret High 2 B 84 Exceeded 100.0 80 79 73 68 79 84 >95Carteret County Public Schools 160352 White Oak Elementary 2 B 71 B 74 C 69 Met 82.3 68 72 66 66Caswell County Schools 170316 Bartlett Yancey High 5 D 50 NotMet 50.0 50 27 44 28 37 60 >95Caswell County Schools 170334 North Elementary 5 C 64 C 58 C 62 Met 81.6 60 54 59 81Caswell County Schools 170338 N L Dillard Middle 5 D 51 C 57 F 33 Met 77.2 44 50 27 71 64
NCDPI/Division of Accountability Services 7 of 116 February 5, 2015

Caswell County Schools 170339 Oakwood Elementary 5 D 53 D 51 D 51 Met 83.5 45 46 42 51Caswell County Schools 170342 South Elementary 5 C 58 D 54 C 55 Met 78.2 52 49 49 71Caswell County Schools 170344 Stoney Creek Elementary 5 C 58 C 55 D 54 Met 77.2 53 51 49 67Catawba County Schools 180302 Harry M Arndt Middle 7 C 65 C 65 D 54 Exceeded 98.1 57 58 44 76 >95Catawba County Schools 180304 Balls Creek Elementary 7 C 65 C 58 C 68 Met 83.7 60 55 63 68Catawba County Schools 180308 Bandys High 7 B 80 Exceeded 91.2 77 72 76 66 66 57 >95Catawba County Schools 180312 Banoak Elementary 7 C 68 C 66 C 68 Exceeded 87.9 63 62 62 75Catawba County Schools 180316 Blackburn Elementary 7 C 68 C 66 C 67 Met 82.1 64 62 63 76Catawba County Schools 180320 Bunker Hill High 7 C 69 Exceeded 86.1 65 50 61 49 43 60 92Catawba County Schools 180323 Catawba Rosenwald Education Center 7 N/A N/A N/ACatawba County Schools 180324 Catawba Elementary School 7 C 58 C 61 C 56 Met 82.9 51 56 49 44Catawba County Schools 180325 Challenger Early College High 7 A 98 Exceeded 99.0 >95 >95 93 >95 >95 >95Catawba County Schools 180326 Charles H Tuttle Elementary 7 C 68 C 67 C 67 Exceeded 86.2 63 64 62 65Catawba County Schools 180332 Claremont Elementary 7 C 65 C 59 C 65 Exceeded 91.0 59 54 58 80Catawba County Schools 180336 Clyde Campbell Elementary 7 B 75 B 76 B 72 Exceeded 97.7 69 73 65 73Catawba County Schools 180340 Fred T Foard High 7 B 75 NotMet 67.5 77 62 70 63 77 84 >95Catawba County Schools 180342 Jacobs Fork Middle 7 C 66 C 69 C 56 Met 82.4 62 65 50 76 >95Catawba County Schools 180343 Lyle Creek Elementary 7 D 53 D 51 D 52 Exceeded 92.8 44 42 42 58Catawba County Schools 180344 Maiden Elementary 7 C 58 C 58 C 59 Exceeded 90.2 50 51 51 49Catawba County Schools 180346 Maiden Middle School 7 C 65 C 63 C 57 Exceeded 91.8 59 57 48 73 >95Catawba County Schools 180348 Maiden High 7 B 72 Met 83.7 70 59 63 58 56 76 >95Catawba County Schools 180352 Mill Creek Middle 7 C 69 C 68 C 58 Exceeded 87.3 64 62 52 84 95Catawba County Schools 180356 Mountain View Elementary 7 B 73 B 70 B 73 Exceeded 87.9 69 67 69 75Catawba County Schools 180360 Oxford Elementary 7 C 65 C 62 C 61 Exceeded 90.9 58 56 55 75Catawba County Schools 180364 River Bend Middle 7 C 58 C 58 D 49 Exceeded 93.2 49 50 38 63 >95Catawba County Schools 180368 Sherrills Ford Elementary 7 B 76 B 73 B 73 Exceeded 93.5 71 70 68 89Catawba County Schools 180372 Saint Stephens Elementary 7 D 48 D 51 D 43 Met 75.4 41 42 38 53Catawba County Schools 180376 Saint Stephens High 7 B 70 Met 74.8 69 63 67 59 57 65 80Catawba County Schools 180379 Snow Creek Elementary 7 B 70 C 66 C 68 Exceeded 91.8 64 61 62 85Catawba County Schools 180380 Startown Elementary 7 C 68 C 65 B 70 Exceeded 97.1 61 59 63 59Catawba County Schools 180388 Webb A Murray Elementary 7 C 57 C 56 C 57 Met 83.6 50 50 50 55Hickory City Schools 181312 Northview Middle 7 B 70 C 68 C 60 Exceeded 100.0 62 62 52 83 >95Hickory City Schools 181316 Grandview Middle 7 D 52 C 55 D 44 NotMet 62.7 49 50 38 59 92Hickory City Schools 181318 Hickory Career Arts Magnet High School 7 D 44 D 40 F 0 NotMet 57.4 40 40 <5 40 24 44 19 29 77 >95Hickory City Schools 181322 Hickory High 7 C 63 NotMet 54.9 65 45 62 56 59 53 95Hickory City Schools 181326 W M Jenkins Elementary 7 B 73 C 69 B 73 Exceeded 90.4 68 65 68 77Hickory City Schools 181332 Longview Elementary 7 D 51 D 48 C 56 Met 75.0 45 40 51 39Hickory City Schools 181336 Oakwood Elementary 7 C 64 C 66 C 65 Met 81.6 60 63 59 55Hickory City Schools 181342 Southwest Elementary 7 D 47 D 46 D 47 Met 78.0 39 39 38 44Hickory City Schools 181344 Viewmont Elementary 7 C 57 C 59 C 57 Met 73.0 53 54 53 54Newton Conover City Schools 182304 Conover Special Education 7 N/A N/A N/ANewton Conover City Schools 182316 Newton-Conover High 7 C 67 Met 73.2 66 45 65 45 54 82 95Newton Conover City Schools 182321 Newton-Conover Middle 7 C 57 C 60 D 50 Met 76.1 52 54 41 66 89Newton Conover City Schools 182322 Shuford Elementary 7 C 65 C 62 C 67 NotMet 69.4 64 57 68 73Newton Conover City Schools 182324 South Newton Elementary 7 C 58 C 60 C 60 Met 80.1 52 55 54 41
NCDPI/Division of Accountability Services 8 of 116 February 5, 2015

Newton Conover City Schools 182328 North Newton Elementary 7 D 52 D 53 D 47 NotMet 62.6 49 48 44 67Newton Conover City Schools 182700 Discovery High School 7 B 79 Met 75.1 80 74 83 54 81 >95Chatham County Schools 190304 Bennett School 5 C 67 B 71 C 61 Exceeded 89.1 61 67 53 67Chatham County Schools 190308 Bonlee School 5 C 61 C 57 C 61 Met 80.5 56 52 56 69 >95Chatham County Schools 190310 SAGE Academy 5 N/A N/A N/AChatham County Schools 190312 Chatham Middle 5 D 47 D 47 F 39 Exceeded 90.0 36 35 27 45 93Chatham County Schools 190316 Chatham Central High 5 B 74 Exceeded 85.3 72 74 61 57 55 69 >95Chatham County Schools 190328 Horton Middle 5 C 59 C 67 D 48 Met 72.2 56 62 44 61 >95Chatham County Schools 190332 J S Waters School 5 C 66 C 65 C 62 Exceeded 87.8 61 60 56 68 >95Chatham County Schools 190336 Jordan Matthews High 5 C 67 Exceeded 90.2 62 55 55 42 47 79 >95Chatham County Schools 190339 Margaret B. Pollard Middle 5 B 76 B 73 B 71 Exceeded 100.0 70 69 64 73 >95Chatham County Schools 190340 Moncure School 5 C 68 C 69 C 64 Exceeded 89.3 63 64 59 64 86Chatham County Schools 190341 North Chatham Elementary 5 C 63 C 61 D 54 Exceeded 90.6 56 54 47 86Chatham County Schools 190342 Northwood High 5 B 79 Exceeded 93.6 75 60 76 73 72 67 >95Chatham County Schools 190346 Perry W Harrison Elementary 5 B 74 B 75 B 70 Met 82.9 72 72 68 80Chatham County Schools 190348 Pittsboro Elementary 5 C 62 C 65 C 58 Met 80.5 58 60 55Chatham County Schools 190350 Siler City Elementary 5 D 54 D 52 C 56 Met 82.0 48 44 49 53Chatham County Schools 190352 Silk Hope School 5 B 70 C 67 B 70 Met 84.5 67 64 66 72 >95Chatham County Schools 190370 Virginia Cross Elementary 5 D 50 D 48 D 47 Met 82.0 42 40 40 53Cherokee County Schools 200304 Andrews Elementary 8 D 54 C 57 D 47 Exceeded 91.2 44 49 37 55Cherokee County Schools 200308 Andrews High 8 C 64 NotMet 59.2 65 50 53 46 71 50 >95Cherokee County Schools 200310 Andrews Middle 8 D 51 C 56 D 45 NotMet 64.7 47 51 37 58 68Cherokee County Schools 200312 Hiwassee Dam Elementary/Middle 8 D 51 C 58 D 46 Met 72.6 46 52 39 44Cherokee County Schools 200314 Hiwassee Dam High 8 B 74 Met 80.6 73 50 84 37 69 80 >95Cherokee County Schools 200316 Marble Elementary 8 C 61 C 55 C 62 Met 74.6 58 49 59 86Cherokee County Schools 200320 Martins Creek Elementary/Mid 8 C 64 C 65 C 60 Met 77.5 61 62 55 71 88Cherokee County Schools 200322 Mountain Youth School 8 N/A N/A N/ACherokee County Schools 200324 Murphy Elementary 8 C 65 C 68 C 58 Met 81.5 61 64 54 73Cherokee County Schools 200328 Murphy High 8 B 79 Exceeded 86.6 77 60 72 69 73 67 >95Cherokee County Schools 200330 Murphy Middle 8 C 60 C 68 D 48 Met 78.5 56 65 40 65 >95Cherokee County Schools 200332 Peachtree Elementary 8 C 64 C 61 C 65 Met 81.9 59 55 61 67Cherokee County Schools 200336 Ranger Elementary/Middle 8 C 68 B 72 C 61 Exceeded 85.1 64 69 55 72 69Cherokee County Schools 200350 Tri-County Early College High 8 B 79 NotMet 68.7 82 71 77 77 >95 >95Edenton-Chowan Schools 210304 Chowan Middle 1 D 51 C 55 D 40 NotMet 69.2 47 49 34 69 72Edenton-Chowan Schools 210306 D F Walker Elementary 1 D 54 C 57 D 53 NotMet 64.0 52 52 50 55Edenton-Chowan Schools 210312 John A Holmes High 1 C 58 NotMet 56.5 58 41 45 47 43 71 >95Edenton-Chowan Schools 210316 White Oak Elementary 1 IClay County Schools 220308 Hayesville Elementary 8 C 59 C 65 D 54 NotMet 68.6 57 60 53Clay County Schools 220310 Hayesville High 8 B 72 Met 73.7 71 59 66 48 66 74 >95Clay County Schools 220312 Hayesville Middle 8 C 61 C 58 D 54 Met 84.7 55 54 46 72Cleveland County Schools 230304 Bethware Elementary 6 C 68 B 72 C 67 NotMet 59.7 70 71 70Cleveland County Schools 230308 Boiling Springs Elementary 6 B 78 B 73 B 78 Exceeded 91.4 75 69 76 85Cleveland County Schools 230312 Burns High 6 C 66 Met 73.5 64 45 60 52 48 65 >95Cleveland County Schools 230316 Burns Middle 6 C 58 C 63 D 42 Met 81.4 52 57 36 79 89Cleveland County Schools 230320 Casar Elementary 6 B 70 C 65 B 70 Exceeded 86.4 66 60 67 77
NCDPI/Division of Accountability Services 9 of 116 February 5, 2015

Cleveland County Schools 230322 Cleveland ECHS 6 B 82 Met 80.8 82 66 76 86 79 >95Cleveland County Schools 230324 Crest High 6 B 70 Met 81.0 67 67 57 53 48 72 93Cleveland County Schools 230328 Crest Middle 6 C 61 C 65 D 53 Met 79.6 56 60 45 67 >95Cleveland County Schools 230330 Turning Point Academy 6 N/A N/A N/ACleveland County Schools 230334 East Elementary 6 B 77 C 68 A 86 Met 83.2 75 64 86Cleveland County Schools 230336 Shelby Intermediate 6 D 54 C 58 D 52 NotMet 69.4 50 52 47 53Cleveland County Schools 230340 Fallston Elementary 6 C 66 C 61 C 68 Met 84.4 62 56 64 72Cleveland County Schools 230342 Graham Elementary 6 D 42 D 48 F 38 Met 70.9 35 40 30Cleveland County Schools 230344 Grover Elementary 6 C 66 C 65 C 67 Met 77.4 63 62 65Cleveland County Schools 230346 James Love Elementary 6 D 50 C 55 D 45 NotMet 65.0 46 51 41Cleveland County Schools 230348 Jefferson Elementary 6 C 67 C 69 C 65 Met 78.4 64 65 63Cleveland County Schools 230350 Kings Mountain High 6 B 75 Met 84.2 73 64 61 66 65 69 >95Cleveland County Schools 230351 Kings Mountain Intermediate 6 C 66 C 66 C 60 Met 73.8 64 63 58 80Cleveland County Schools 230352 Kings Mountain Middle 6 C 63 C 67 D 50 NotMet 67.0 62 63 48 78 >95Cleveland County Schools 230355 Marion Elementary 6 C 59 C 60 C 59 Met 72.2 56 55 58Cleveland County Schools 230357 North Elementary 6 B 77 B 74 B 79 Met 81.8 75 72 79Cleveland County Schools 230359 North Shelby 6 N/A N/A N/ACleveland County Schools 230361 Shelby High 6 C 64 NotMet 68.9 62 41 57 45 51 52 >95Cleveland County Schools 230362 Shelby Middle 6 C 55 C 57 D 46 NotMet 64.9 53 51 39 68 >95Cleveland County Schools 230364 Springmore Elementary 6 B 75 B 74 C 69 Exceeded 93.1 70 70 65 85Cleveland County Schools 230368 Township Three Elementary 6 C 59 C 61 C 55 Met 72.2 56 56 53 63Cleveland County Schools 230370 Union Elementary 6 C 64 C 61 C 62 Met 78.2 61 57 59 77Cleveland County Schools 230376 Washington Elementary 6 C 61 C 57 C 60 Met 70.6 59 55 57 78Cleveland County Schools 230380 West Elementary 6 B 77 B 75 B 80 Met 81.6 76 74 79Columbus County Schools 240304 Acme Delco Middle 4 D 40 D 44 F 34 Met 80.0 30 35 23 35Columbus County Schools 240308 Acme Delco Elementary 4 D 44 D 46 D 41 Met 73.9 37 37 33 48Columbus County Schools 240328 Cerro Gordo Elementary 4 C 58 C 63 D 51 Exceeded 86.8 51 56 44 60Columbus County Schools 240330 Chadbourn Middle 4 D 41 D 43 F 39 Met 81.5 31 34 28 32Columbus County Schools 240332 Chadbourn Elementary 4 F 36 D 40 F 37 Met 73.7 27 32 26 15Columbus County Schools 240334 East Columbus High 4 C 62 Met 82.0 57 39 49 35 31 53 >95Columbus County Schools 240344 Evergreen Elementary 4 D 46 D 54 D 44 NotMet 55.3 43 49 41 32Columbus County Schools 240352 Guideway Elementary 4 D 47 D 46 D 50 Exceeded 87.4 37 36 40 34Columbus County Schools 240354 Hallsboro-Artesia Elementary 4 F 38 D 41 F 32 Met 77.2 28 31 20 41Columbus County Schools 240356 Hallsboro Middle 4 C 55 C 59 D 47 Exceeded 90.2 46 52 36 57Columbus County Schools 240368 Nakina Middle 4 C 59 C 62 D 49 Exceeded 90.1 52 55 40 73 73Columbus County Schools 240370 Old Dock Elementary 4 C 60 C 61 C 59 Met 80.5 55 57 53 57Columbus County Schools 240371 South Columbus High 4 C 65 Met 82.9 61 46 54 47 40 56 >95Columbus County Schools 240372 Tabor City Elementary 4 D 54 D 52 D 46 Exceeded 87.9 45 44 36 75Columbus County Schools 240373 CCCA - Southeastern Campus 4 C 68 Met 76.0 66 43 73 55 61 >95Columbus County Schools 240376 Tabor City Middle 4 D 41 D 46 F 36 NotMet 58.7 37 39 30 49Columbus County Schools 240380 West Columbus High 4 C 64 Met 77.0 61 45 59 51 47 29 >95Columbus County Schools 240388 Williams Township 4 C 57 C 58 D 53 Met 84.1 51 52 45 65Whiteville City Schools 241304 Central Middle 4 C 57 C 56 C 55 Met 72.6 53 50 50 65 >95Whiteville City Schools 241308 Edgewood Elementary 4 C 55 C 58 D 54 Met 74.3 50 52 48 50Whiteville City Schools 241312 North Whiteville Academy 4 N/A N/A N/A
NCDPI/Division of Accountability Services 10 of 116 February 5, 2015

Whiteville City Schools 241316 Whiteville High 4 C 65 Met 80.3 62 58 63 18 45 83 >95Whiteville City Schools 241320 Whiteville Primary 4 ICraven County Schools 250304 Albert H Bangert Elementary 2 C 64 C 61 C 60 Met 78.7 60 56 58 77Craven County Schools 250306 Ben D Quinn Elementary 2 B 73 C 69 B 75 Exceeded 92.1 69 66 70 74Craven County Schools 250308 Bridgeton Elementary 2 C 65 C 61 C 66 Exceeded 93.4 59 53 60 68Craven County Schools 250312 Brinson Memorial Elementary 2 B 71 C 67 B 72 Met 80.1 68 66 68 76Craven County Schools 250314 Craven Early College High 2 B 81 Met 84.8 80 70 87 72 74 >95Craven County Schools 250316 Creekside Elementary 2 B 74 B 70 B 74 Exceeded 90.1 70 67 70 81Craven County Schools 250320 Vanceboro-Farm Life Elementary 2 D 53 D 54 D 47 Met 76.2 47 48 41 65Craven County Schools 250321 Early College EAST High 2 B 74 Met 73.3 74 77 81 58 75 >95Craven County Schools 250324 Grover C Fields Middle 2 C 64 C 63 C 57 Exceeded 87.0 58 59 49 74 >95Craven County Schools 250328 Graham A Barden Elementary 2 C 69 C 67 C 69 Met 77.4 67 64 66 78Craven County Schools 250332 H J MacDonald Middle 2 C 55 C 62 D 48 NotMet 50.0 57 61 46 63 94Craven County Schools 250336 Havelock Elementary 2 C 65 C 66 C 58 Met 80.7 61 62 53 77Craven County Schools 250340 Havelock High 2 B 75 Exceeded 86.8 72 58 62 61 63 81 >95Craven County Schools 250344 Havelock Middle 2 C 62 C 60 C 56 Exceeded 95.5 54 54 45 68 >95Craven County Schools 250348 J T Barber Elementary 2 C 58 D 50 C 61 Exceeded 86.5 51 43 55 62Craven County Schools 250350 James W Smith Elementary 2 D 51 D 45 D 50 Exceeded 90.0 42 36 40 64Craven County Schools 250356 New Bern High 2 C 59 NotMet 53.4 60 43 51 40 53 76 94Craven County Schools 250360 Oaks Road Elementary 2 D 48 D 51 D 40 Met 77.6 41 43 32 61Craven County Schools 250362 Roger R Bell Elementary 2 D 52 D 53 D 47 Met 83.1 45 45 41 55Craven County Schools 250364 Trent Park Elementary 2 C 56 C 56 D 51 Met 76.2 51 51 47 64Craven County Schools 250368 Tucker Creek Middle 2 B 71 B 70 C 63 Exceeded 85.3 67 67 59 85 >95Craven County Schools 250372 West Craven High 2 C 67 Met 81.9 63 41 54 55 55 71 >95Craven County Schools 250376 West Craven Middle 2 C 56 D 54 D 48 Exceeded 91.4 48 48 37 72 94Craven County Schools 250378 W Jesse Gurganus Elementary 2 B 83 B 79 B 81 Exceeded 94.4 80 76 79 93Craven County Schools 250380 Arthur W Edwards Elementary 2 C 67 C 64 C 69 Met 75.6 65 63 66 69Cumberland County Schools 260302 Alma O Easom Elementary 4 ICumberland County Schools 260306 Armstrong Elementary 4 C 67 C 68 C 64 Met 82.6 63 64 60 65Cumberland County Schools 260308 Ashley Elementary 4 C 61 C 61 C 56 Met 80.6 56 57 50 67Cumberland County Schools 260310 Loyd E Auman Elementary 4 D 51 C 56 D 44 Met 73.6 45 49 39 50Cumberland County Schools 260312 Beaver Dam Elementary 4 A 85 B 81 A 88 Met 80.3 86 82 90 89Cumberland County Schools 260316 Lillian Black Elementary 4 D 47 D 54 D 41 NotMet 65.6 43 48 36 48Cumberland County Schools 260318 Jack Britt High 4 A 87 Exceeded 100.0 83 75 82 82 76 77 >95Cumberland County Schools 260320 Brentwood Elementary 4 C 60 C 60 C 60 Met 82.7 55 53 55 59Cumberland County Schools 260321 Douglas Byrd Middle 4 D 44 D 43 F 34 Met 79.1 35 36 22 63 43Cumberland County Schools 260322 Douglas Byrd High 4 C 58 Met 83.1 51 31 46 29 27 51 >95Cumberland County Schools 260325 Cape Fear High 4 B 75 Exceeded 99.0 70 55 65 65 60 76 90Cumberland County Schools 260326 Elizabeth M Cashwell Elementary 4 D 53 C 55 D 46 Exceeded 91.9 43 46 35 59Cumberland County Schools 260332 Eastover Central Elementary 4 B 79 B 79 B 74 Exceeded 89.8 76 78 71 87Cumberland County Schools 260336 Anne Chesnutt Middle 4 C 56 C 58 D 47 Exceeded 90.3 47 52 35 63 >95Cumberland County Schools 260338 Cliffdale Elementary 4 D 50 D 49 D 52 Met 80.6 42 41 44 41Cumberland County Schools 260340 College Lakes Elementary 4 C 55 D 50 C 57 Exceeded 89.4 47 41 48 59Cumberland County Schools 260342 C Wayne Collier Elementary 4 C 58 C 57 C 56 Exceeded 86.3 51 50 48 62Cumberland County Schools 260344 J W Coon Elementary 4 D 54 C 55 D 51 Met 84.8 46 48 42 52
NCDPI/Division of Accountability Services 11 of 116 February 5, 2015

Cumberland County Schools 260347 Cumberland International Early CollegeHS 4 B 82 Met 83.9 82 76 79 91 84Cumberland County Schools 260348 Cumberland Mills Elementary 4 C 57 D 53 C 58 Met 81.1 51 46 52 66Cumberland County Schools 260352 Cumberland Road Elementary 4 D 51 D 54 D 53 NotMet 64.9 48 50 49 42Cumberland County Schools 260354 Cross Creek Early College 4 A 89 Met 84.3 90 79 89 84 94 >95Cumberland County Schools 260356 District No 7 Elementary 4 B 84 B 83 B 82 Met 84.8 84 82 84 93Cumberland County Schools 260357 Gray's Creek High 4 C 69 Met 78.6 67 50 58 58 58 73 >95Cumberland County Schools 260358 Luther 'Nick' Jeralds Middle 4 D 45 D 48 F 33 NotMet 68.2 39 41 26 66 90Cumberland County Schools 260359 E E Smith High 4 C 62 Exceeded 88.7 55 36 49 47 33 56 90Cumberland County Schools 260361 Ferguson-Easley Elementary 4 C 59 C 56 D 52 Exceeded 90.0 51 49 44 80Cumberland County Schools 260362 Gray's Creek Middle 4 C 66 C 67 C 57 Exceeded 90.3 60 62 49 77 85Cumberland County Schools 260363 Glendale Acres Elementary 4 ICumberland County Schools 260364 Alderman Road Elementary 4 C 58 C 64 D 49 Met 80.0 52 59 43 56Cumberland County Schools 260365 R Max Abbott Middle 4 D 52 C 57 D 41 NotMet 57.9 51 56 36 71 91Cumberland County Schools 260366 Howard L Hall Elementary 4 C 68 B 70 C 66 Met 77.3 66 69 62 67Cumberland County Schools 260367 Bill Hefner Elementary 4 C 60 C 58 C 58 Exceeded 87.4 53 52 50 66Cumberland County Schools 260368 Hope Mills Middle 4 C 57 C 60 D 43 Exceeded 86.3 49 54 33 74 90Cumberland County Schools 260369 John R Griffin Middle 4 B 75 B 72 C 67 Exceeded 97.8 69 68 60 87 >95Cumberland County Schools 260370 Ed V Baldwin Elementary 4 C 58 D 54 D 53 Met 82.5 52 49 47 80Cumberland County Schools 260371 Ireland Drive Middle 4 F 35 D 43 F 29 NotMet 57.2 29 36 23Cumberland County Schools 260372 Lewis Chapel Middle 4 D 43 D 47 F 25 Met 70.3 36 39 18 71 76Cumberland County Schools 260373 Gallberry Farm Elementary 4 C 64 C 61 C 62 Met 81.9 60 58 57 74Cumberland County Schools 260374 Alger B. Wilkins High School PLC 4 N/A N/A N/ACumberland County Schools 260375 Gray's Creek Elementary 4 C 61 C 60 C 58 Met 82.7 56 56 51 69Cumberland County Schools 260380 Long Hill Elementary 4 B 74 B 75 B 74 Met 83.9 72 73 71 69Cumberland County Schools 260382 Lucile Souders Elementary 4 D 48 D 52 D 44 Met 70.8 43 46 37 51Cumberland County Schools 260383 Mac Williams Middle 4 C 57 C 59 D 48 NotMet 62.6 55 58 42 71 88Cumberland County Schools 260386 Margaret Willis Elementary 4 C 60 C 57 C 61 Exceeded 87.3 53 52 54 57Cumberland County Schools 260388 Massey Hill Classical High 4 B 82 Exceeded 90.4 79 67 79 70 72 >95Cumberland County Schools 260396 Mary McArthur Elementary 4 C 55 C 56 D 52 Met 77.1 49 51 44 57Cumberland County Schools 260397 E Melvin Honeycutt Elementary 4 B 74 B 76 B 74 Exceeded 85.1 72 74 71 70Cumberland County Schools 260398 E E Miller Elementary 4 C 61 C 66 C 56 Met 71.9 58 62 53 61Cumberland County Schools 260400 Montclair Elementary 4 C 61 C 59 C 62 Met 73.0 58 55 60 60Cumberland County Schools 260401 Morganton Road Elementary 4 D 53 D 53 D 50 Met 81.3 46 46 43 56Cumberland County Schools 260402 Manchester Elementary 4 D 53 D 49 D 52 Exceeded 89.4 44 40 43 62Cumberland County Schools 260403 New Century International Elementary 4 C 60 C 62 C 55 Met 72.1 57 61 49 67Cumberland County Schools 260404 William H Owen Elementary 4 C 64 C 61 C 64 Met 81.3 60 56 60 70Cumberland County Schools 260405 Walker Spivey Elementary 4 D 48 D 47 D 50 Met 79.9 41 39 42 40Cumberland County Schools 260406 Pine Forest Middle 4 C 66 B 71 D 49 Exceeded 88.4 61 67 43 83 95Cumberland County Schools 260407 Lake Rim Elementary 4 C 64 C 64 C 63 Exceeded 87.9 58 59 58 56Cumberland County Schools 260408 Pine Forest High 4 C 67 Exceeded 87.8 62 50 57 50 42 65 >95Cumberland County Schools 260410 Ponderosa Elementary 4 C 62 C 59 C 56 Exceeded 91.7 54 53 48 80Cumberland County Schools 260411 Reid Ross Classical High 4 B 73 Exceeded 89.4 69 71 44 36 58 68 >95Cumberland County Schools 260412 Raleigh Road Elementary 4 ICumberland County Schools 260413 Pauline Jones Middle 4 N/A N/A N/ACumberland County Schools 260414 Benjamin J Martin Elementary 4 D 50 D 49 D 50 Met 75.4 44 43 43 51
NCDPI/Division of Accountability Services 12 of 116 February 5, 2015

Cumberland County Schools 260415 Rockfish Elementary 4 B 73 B 73 B 70 Met 76.2 72 72 70 78Cumberland County Schools 260416 J W Seabrook Elementary 4 C 59 C 59 C 57 Met 83.2 54 54 50 60Cumberland County Schools 260417 New Century International Middle 4 C 63 C 67 D 50 Met 77.4 59 65 42 85 >95Cumberland County Schools 260418 Seventy-First Classical Middle 4 B 74 B 78 C 62 Exceeded 87.0 71 75 58 88 >95Cumberland County Schools 260419 Reid Ross Classical Middle 4 C 62 C 68 D 46 Exceeded 86.9 56 65 36 79 80Cumberland County Schools 260424 Seventy-First High 4 C 60 Exceeded 89.3 53 27 50 46 28 55 >95Cumberland County Schools 260425 South View Middle 4 D 47 D 50 F 35 Met 71.2 41 46 27 61 94Cumberland County Schools 260426 Sherwood Park Elementary 4 D 52 D 48 D 51 Met 83.5 44 42 42 57Cumberland County Schools 260427 South View High 4 C 62 Met 82.1 57 36 54 45 45 63 >95Cumberland County Schools 260428 Spring Lake Middle 4 D 40 D 45 F 33 Met 72.6 32 36 22 41 >95Cumberland County Schools 260430 Stedman Elementary 4 B 76 B 74 B 73 Met 77.1 76 72 74 90Cumberland County Schools 260432 Stedman Primary 4 ICumberland County Schools 260434 Stoney Point Elementary 4 B 77 B 74 B 77 Exceeded 88.0 75 72 74 84Cumberland County Schools 260440 Sunnyside Elementary 4 C 64 C 59 C 62 Exceeded 85.4 58 54 56 75Cumberland County Schools 260444 Teresa C Berrien Elementary 4 D 47 D 46 D 47 Met 84.7 38 37 37 44Cumberland County Schools 260446 Terry Sanford High 4 B 73 Exceeded 87.5 69 52 62 60 68 74 >95Cumberland County Schools 260448 Vanstory Hills Elementary 4 B 75 B 79 C 66 Met 70.2 76 80 68 88Cumberland County Schools 260449 Ramsey Street High 4 N/A N/A N/ACumberland County Schools 260450 Warrenwood Elementary 4 D 45 D 51 D 42 NotMet 68.8 39 47 33 37Cumberland County Schools 260452 Westarea Elementary 4 C 59 D 54 C 56 Exceeded 92.1 51 45 48 75Cumberland County Schools 260454 Westover Middle 4 D 47 D 53 F 31 Met 82.7 38 44 22 63 86Cumberland County Schools 260455 Westover High 4 C 56 Exceeded 88.3 49 29 55 31 20 45 >95Cumberland County Schools 260459 William T Brown Elementary 4 D 44 D 47 F 37 NotMet 69.4 37 39 30 55Cumberland County Schools 260700 Howard Health & Life Sciences 4 B 82 Exceeded 85.9 81 44 88 65 >95 38 >95Currituck County Schools 270304 Central Elementary 1 D 54 C 58 D 50 Met 80.5 47 52 42 48Currituck County Schools 270306 Currituck County High 1 C 61 NotMet 50.9 63 46 60 43 70 61 83Currituck County Schools 270308 Currituck County Middle 1 C 64 C 68 D 53 Met 75.4 62 64 49 81 >95Currituck County Schools 270309 Jarvisburg Elementary 1 C 58 C 60 D 50 NotMet 69.5 55 56 46 80Currituck County Schools 270310 Shawboro Elementary School 1 C 66 C 68 C 60 Met 75.3 63 64 61 71Currituck County Schools 270311 The JP Knapp ECH (i)School 1 B 77 Met 72.1 78 64 71 67 88 >95Currituck County Schools 270312 Knotts Island Elementary 1 B 71 B 76 C 69 NotMet 60.0 74 77 71 74Currituck County Schools 270316 Moyock Elementary 1 C 68 B 73 C 65 NotMet 65.6 68 72 65 66Currituck County Schools 270318 Moyock Middle 1 C 65 B 71 D 49 Met 83.4 61 68 41 88 >95Currituck County Schools 270320 W T Griggs Elementary 1 C 60 C 58 C 60 Met 72.9 56 53 57 62Dare County Schools 280302 Cape Hatteras Elementary School 1 B 70 C 66 B 74 Met 81.3 68 64 71 69Dare County Schools 280304 Cape Hatteras Secondary School 1 C 68 C 64 C 61 NotMet 64.1 69 64 59 84 69 67 63 50 88 >95Dare County Schools 280306 Dare County Alternative School 1 N/A N/A N/ADare County Schools 280308 Kitty Hawk Elementary School 1 B 76 B 78 C 67 Exceeded 89.6 72 76 63 87Dare County Schools 280310 Nags Head Elementary School 1 B 74 C 68 B 72 Met 80.7 72 68 70 90Dare County Schools 280312 Manteo Elementary School 1 C 58 D 54 C 61 Met 81.7 52 49 55 52Dare County Schools 280316 Manteo High School 1 B 79 Exceeded 90.8 77 68 66 65 65 62 >95Dare County Schools 280320 Manteo Middle School 1 C 61 C 62 D 53 Met 72.3 59 62 46 80 >95Dare County Schools 280324 First Flight Elementary School 1 B 72 C 68 B 74 Exceeded 85.5 69 64 70 76Dare County Schools 280328 First Flight Middle School 1 B 71 B 75 C 58 Met 72.9 70 74 57 89 95Dare County Schools 280330 First Flight High School 1 B 84 Exceeded 90.2 82 73 86 73 75 79 93
NCDPI/Division of Accountability Services 13 of 116 February 5, 2015

Davidson County Schools 290302 Brier Creek Elementary 5 D 53 C 56 D 52 NotMet 59.8 51 53 50 52Davidson County Schools 290306 Northwest Elementary 5 B 72 C 67 B 73 Exceeded 88.6 68 63 69 82Davidson County Schools 290307 Southmont Elementary 5 C 61 C 58 C 62 Met 83.5 55 52 56 63Davidson County Schools 290308 Central Davidson High 5 C 69 Met 78.8 67 42 58 58 61 65 >95Davidson County Schools 290309 Central Davidson Middle 5 C 60 C 67 D 47 Met 73.4 56 62 43 69 93Davidson County Schools 290310 Stoner-Thomas School 5 N/A N/A N/ADavidson County Schools 290312 Churchland Elementary 5 C 60 C 55 C 66 NotMet 64.0 59 51 66 61Davidson County Schools 290314 Davidson County High School 5 N/A N/A N/ADavidson County Schools 290315 Davidson Early College 5 A 87 Met 75.4 87 76 >95 60 >95 >95Davidson County Schools 290316 Davis-Townsend Elementary 5 C 67 C 68 B 70 Met 71.5 66 64 69 60Davidson County Schools 290320 Denton Elementary 5 D 41 D 49 F 37 NotMet 55.8 38 43 32 40Davidson County Schools 290322 E Lawson Brown Middle 5 C 67 C 64 D 54 Exceeded 86.7 62 58 51 86 >95Davidson County Schools 290324 East Davidson High 5 C 67 NotMet 58.0 69 53 63 58 56 79 >95Davidson County Schools 290328 Fair Grove Elementary 5 C 65 C 60 C 67 Met 81.5 61 56 62 72Davidson County Schools 290330 Friedberg Elementary 5 B 73 C 68 B 71 Met 78.2 72 66 72 89Davidson County Schools 290332 Hasty Elementary 5 C 68 C 58 B 72 Exceeded 88.9 63 52 69 78Davidson County Schools 290333 Friendship Elementary 5 B 74 C 69 B 78 Exceeded 86.5 71 65 76 75Davidson County Schools 290334 Ledford Middle 5 C 67 B 70 C 57 Met 80.2 64 67 51 81 83Davidson County Schools 290336 Ledford Senior High 5 B 76 Exceeded 87.2 74 59 69 65 63 74 >95Davidson County Schools 290344 Midway Elementary 5 C 65 C 59 C 66 Met 80.6 61 56 61 75Davidson County Schools 290348 North Davidson High 5 B 77 Met 80.2 76 69 71 60 70 76 >95Davidson County Schools 290350 North Davidson Middle 5 C 68 C 69 C 56 Met 81.4 65 66 52 88 87Davidson County Schools 290351 Oak Grove Middle 5 B 74 B 74 C 64 Exceeded 94.8 69 70 57 87 94Davidson County Schools 290352 Pilot Elementary 5 C 63 C 60 C 64 Met 82.9 58 54 61 60Davidson County Schools 290356 Reeds Elementary 5 C 69 C 66 B 72 Met 83.7 65 62 69 64Davidson County Schools 290364 Silver Valley Elementary 5 D 53 D 51 D 53 Met 78.3 47 44 47 52Davidson County Schools 290365 South Davidson High 5 C 62 NotMet 59.0 63 51 52 44 52 64 >95Davidson County Schools 290366 Southwood Elementary 5 D 54 D 50 C 56 NotMet 69.8 50 46 50 60Davidson County Schools 290367 South Davidson Middle 5 C 61 C 65 D 48 Exceeded 93.4 53 57 39 63 85Davidson County Schools 290375 Tyro Elementary 5 C 66 C 66 C 63 Exceeded 92.5 60 59 57 68Davidson County Schools 290376 Tyro Middle 5 C 61 C 58 D 51 Met 81.2 56 54 43 84 85Davidson County Schools 290380 Wallburg Elementary 5 C 68 B 70 C 64 NotMet 69.9 67 68 64 75Davidson County Schools 290384 Welcome Elementary 5 C 63 C 60 C 63 Met 80.1 59 56 59 71Davidson County Schools 290388 West Davidson High 5 C 64 NotMet 57.5 66 53 57 51 65 58 >95Davidson County Schools 290389 Yadkin Valley Regional Career Academy 5 C 56 NotMet 65.0 54 50 76 38Lexington City Schools 291308 Charles England Elementary School 5 D 48 D 45 D 52 Met 74.6 41 38 43 44Lexington City Schools 291332 Lexington Middle School 5 D 46 D 45 D 40 Met 80.0 37 38 29 55 69Lexington City Schools 291336 Lexington Senior High 5 C 65 Exceeded 93.4 58 40 48 45 36 55 94Lexington City Schools 291340 Pickett Elementary School 5 C 66 C 61 C 67 Exceeded 91.4 60 56 61 71Lexington City Schools 291348 South Lexington School 5 ILexington City Schools 291350 South Lexington Development Center 5 N/A N/A N/ALexington City Schools 291352 Southwest Elementary School 5 C 65 D 54 B 72 Exceeded 93.8 58 48 65 63Thomasville City Schools 292316 Liberty Drive Elementary 5 C 55 D 42 C 62 Exceeded 92.4 45 32 54 54Thomasville City Schools 292318 Thomasville Primary 5 D 50 D 45 D 49 Met 79.4 43 37 49Thomasville City Schools 292320 Thomasville Middle 5 D 51 D 49 D 43 Exceeded 91.3 41 41 31 60 80
NCDPI/Division of Accountability Services 14 of 116 February 5, 2015

Thomasville City Schools 292324 Thomasville High 5 C 57 Met 84.6 50 32 44 35 28 55 >95Deaf and Blind Schools 298202 Eastern NC School for the Deaf 6 N/A N/A N/ADeaf and Blind Schools 298203 Gov. Morehead School for the Blind 6 N/A N/A N/ADeaf and Blind Schools 298204 NC School for the Deaf 6 N/A N/A N/ADavie County Schools 300306 Central Davie Academy 7 N/A N/A N/ADavie County Schools 300308 Cooleemee Elementary 7 D 48 D 49 D 44 NotMet 68.2 43 43 38 57Davie County Schools 300310 Cornatzer Elementary 7 B 70 C 66 C 66 Exceeded 91.2 65 61 62 85Davie County Schools 300312 Davie County High 7 B 74 Met 73.6 74 61 73 62 66 78 >95Davie County Schools 300314 Davie County Early College High 7 A 94 Met 84.2 >95 >95 91 95 >95Davie County Schools 300320 Mocksville Elementary 7 C 69 C 69 C 65 Met 82.0 66 66 62 77Davie County Schools 300325 North Davie Middle 7 B 71 C 68 C 65 Exceeded 91.0 66 64 60 85 >95Davie County Schools 300326 Pinebrook Elementary 7 C 66 B 70 C 62 NotMet 59.8 68 70 63 75Davie County Schools 300328 Shady Grove Elementary 7 B 75 B 76 B 72 Met 70.7 76 76 72 88Davie County Schools 300330 South Davie Middle 7 C 68 C 65 C 66 Exceeded 88.0 63 61 59 72 >95Davie County Schools 300336 William R Davie Elementary 7 C 64 C 64 C 63 Met 80.6 60 59 59 60Davie County Schools 300337 William Ellis Middle 7 B 75 B 72 C 69 Exceeded 89.3 71 71 63 86 >95Duplin County Schools 310304 B F Grady Elementary 2 D 45 D 45 D 42 NotMet 68.2 40 37 36 53 >95Duplin County Schools 310308 Beulaville Elementary 2 D 54 C 57 D 43 Met 76.0 48 51 38 60 >95Duplin County Schools 310324 Charity Middle 2 D 48 D 54 F 37 NotMet 69.9 43 47 29 65 >95Duplin County Schools 310330 Chinquapin Elementary 2 C 62 C 64 D 54 Met 83.8 56 58 49 70 >95Duplin County Schools 310336 Warsaw Elementary 2 D 46 D 40 D 44 Met 80.2 38 33 35 67Duplin County Schools 310338 Duplin Early College High 2 B 79 Exceeded 85.5 77 62 75 63 69 >95Duplin County Schools 310340 E E Smith Middle 2 D 43 D 43 F 35 Met 71.3 36 35 27 61 87Duplin County Schools 310344 East Duplin High 2 C 59 NotMet 55.0 60 42 52 41 53 66 >95Duplin County Schools 310352 James Kenan High 2 D 47 NotMet 62.8 43 29 38 14 39 60 >95Duplin County Schools 310356 Kenansville Elementary 2 D 54 D 54 D 53 Met 79.3 48 48 46 55Duplin County Schools 310360 North Duplin Elementary 2 C 61 C 58 C 56 Met 82.4 55 53 51 83Duplin County Schools 310364 North Duplin Jr Sr High 2 C 61 C 58 D 52 Met 78.7 57 53 44 67 49 59 45 45 73 >95Duplin County Schools 310384 Rose Hill-Magnolia Elementary 2 D 45 F 39 D 49 Met 83.2 35 29 41 38Duplin County Schools 310388 Wallace Elementary 2 D 49 D 54 D 46 NotMet 58.4 47 49 43 52Duplin County Schools 310392 Wallace-Rose Hill High 2 C 55 NotMet 64.9 52 35 49 36 40 64 >95Duplin County Schools 310396 Warsaw Middle 2 D 40 D 47 F 27 Met 74.9 31 37 17 43 79Durham Public Schools 320304 Bethesda Elementary 3 D 49 D 43 D 48 Exceeded 85.5 40 35 38 60Durham Public Schools 320306 Brogden Middle 3 D 41 D 44 F 33 NotMet 68.4 35 36 24 54 93Durham Public Schools 320308 Burton Elementary 3 D 50 D 44 D 48 Exceeded 87.0 40 34 38 67Durham Public Schools 320309 J D Clement Early College HS 3 A 91 Exceeded 98.3 89 86 81 71 85 >95Durham Public Schools 320310 Eastway Elementary 3 F 26 F 25 F 27 NotMet 58.5 18 15 18 29Durham Public Schools 320312 C E Jordan High 3 B 71 Exceeded 87.5 67 43 63 60 59 82 >95Durham Public Schools 320313 Easley Elementary 3 C 65 B 70 C 64 Met 71.0 63 68 59 60Durham Public Schools 320314 The School for Creative Studies 3 C 55 C 60 D 54 Exceeded 91.2 46 52 44 35Durham Public Schools 320315 Eno Valley Elementary 3 F 38 F 34 D 41 NotMet 65.9 31 25 33 42Durham Public Schools 320316 George L Carrington Middle 3 D 52 D 45 D 45 Met 84.6 44 41 33 68 92Durham Public Schools 320317 City of Medicine Academy 3 B 82 Exceeded 92.1 80 59 83 58 79 >95Durham Public Schools 320318 Club Boulevard Elementary 3 D 53 C 55 D 48 Exceeded 87.2 44 48 38 51Durham Public Schools 320319 Creekside Elementary 3 C 66 C 64 C 65 Exceeded 85.6 61 58 62 65
NCDPI/Division of Accountability Services 15 of 116 February 5, 2015

Durham Public Schools 320320 Glenn Elementary 3 D 40 F 35 D 41 NotMet 69.6 33 26 35 49Durham Public Schools 320322 Durham's Performance Learning Center 3 N/A N/A N/ADurham Public Schools 320323 Durham School of the Arts 3 B 78 B 72 C 65 Exceeded 100.0 73 69 59 85 64 87 66 82 92 90Durham Public Schools 320324 Hillandale Elementary 3 C 61 C 60 C 63 Exceeded 85.6 55 54 56 52Durham Public Schools 320325 Hillside High 3 C 61 Exceeded 89.4 54 24 44 39 38 50 94Durham Public Schools 320327 Hope Valley Elementary 3 C 62 C 59 C 61 Exceeded 95.7 54 51 53 63Durham Public Schools 320328 Holt Elementary 3 C 59 D 53 C 58 Exceeded 91.1 52 45 50 73Durham Public Schools 320329 Holton Career and Resource Center 3 IDurham Public Schools 320332 Forest View Elementary 3 C 63 C 59 C 64 Met 83.8 58 55 59 62Durham Public Schools 320336 DPS Hospital School 3 F 6 F 8 F 0 6 8 <5 11Durham Public Schools 320338 James E Shepard Middle 3 F 37 D 42 F 30 NotMet 55.3 32 36 23 44 71Durham Public Schools 320339 Lakewood Elementary 3 D 43 F 34 D 49 Met 80.6 33 26 39 39Durham Public Schools 320340 Little River Elementary 3 C 68 B 72 C 66 Met 70.9 67 69 67 62Durham Public Schools 320341 Lakeview School 3 N/A N/A N/ADurham Public Schools 320342 Lakewood Montessori Middle 3 C 55 C 63 D 42 NotMet 67.2 52 58 37 68 91Durham Public Schools 320343 Lucas Middle 3 D 45 D 51 F 37 NotMet 62.1 41 44 31 58 92Durham Public Schools 320344 Fayetteville Street Elementary 3 F 38 F 35 D 41 Met 84.6 26 23 29 27Durham Public Schools 320346 Lowe's Grove Middle 3 F 32 F 39 F 23 NotMet 54.9 26 29 17 43 67Durham Public Schools 320347 George Watts Elementary 3 C 65 C 67 C 64 Met 78.7 62 64 59 63Durham Public Schools 320348 Mangum Elementary 3 B 78 B 76 B 77 Exceeded 88.8 75 73 75 80Durham Public Schools 320352 Merrick-Moore Elementary 3 F 37 D 40 F 34 Met 70.8 28 30 25 33Durham Public Schools 320353 Middle College HS @ DTCC 3 A 92 92 79 >95Durham Public Schools 320354 Morehead Montessori 3 C 61 C 61 C 58 Met 83.1 56 57 52 66Durham Public Schools 320355 Neal Middle 3 F 33 F 34 F 26 NotMet 56.5 27 28 18 44 80Durham Public Schools 320356 Northern High 3 C 60 Exceeded 85.6 54 35 46 32 37 54 >95Durham Public Schools 320360 Oak Grove Elementary 3 C 58 D 51 C 59 Met 82.9 51 45 52 68Durham Public Schools 320362 Parkwood Elementary 3 D 48 D 49 D 46 Met 79.5 40 42 38 40Durham Public Schools 320363 E K Powe Elementary 3 D 51 D 46 D 51 Exceeded 87.0 42 36 43 59Durham Public Schools 320364 Pearsontown Elementary 3 B 76 B 76 B 74 Met 80.7 75 73 76 79Durham Public Schools 320365 Riverside High 3 C 67 Met 82.3 63 51 49 42 49 89 92Durham Public Schools 320366 Sherwood Githens Middle 3 D 43 D 47 F 31 Met 70.9 36 38 24 52 83Durham Public Schools 320367 R N Harris Elementary 3 C 60 C 56 C 57 Exceeded 89.3 52 48 50 70Durham Public Schools 320368 Southern School of Energy and Sustainabi 3 D 50 NotMet 69.7 45 27 33 18 17 41 93Durham Public Schools 320369 Sandy Ridge Elementary 3 D 49 D 49 D 48 NotMet 66.1 45 43 44 54Durham Public Schools 320370 Rogers-Herr Middle 3 C 66 C 66 C 58 Exceeded 89.4 61 62 50 74 >95Durham Public Schools 320372 Southwest Elementary 3 D 49 D 50 D 48 NotMet 62.9 46 45 45 50Durham Public Schools 320374 C C Spaulding Elementary 3 F 38 D 40 F 37 Met 77.4 28 30 26 30Durham Public Schools 320376 Spring Valley Elementary 3 D 53 D 54 D 52 Met 78.5 47 46 46 54Durham Public Schools 320388 W G Pearson Elementary 3 F 38 F 37 F 35 Exceeded 85.0 26 25 23 39Durham Public Schools 320389 WG Pearson Magnet Middle 3 D 51 D 41 F 36 Exceeded 94.4 40 30 23 66Durham Public Schools 320400 Y E Smith Elementary 3 D 41 F 34 D 40 Exceeded 89.1 29 22 28 49Durham Public Schools 320700 Southern School of Engineering 3 D 53 NotMet 61.3 51 39 56 18 34 49 >95Durham Public Schools 320701 Hillside New Tech High 3 D 53 NotMet 55.4 52 33 51 24 36 93Edgecombe County Public School 330304 G W Bulluck Elementary 3 C 55 D 48 C 58 Met 84.0 48 39 53 62Edgecombe County Public School 330308 G W Carver Elementary 3 D 46 D 46 D 44 Met 77.7 38 35 37 44
NCDPI/Division of Accountability Services 16 of 116 February 5, 2015

Edgecombe County Public School 330312 Coker-Wimberly Elementary 3 F 35 F 37 F 33 Met 79.1 24 26 21 30Edgecombe County Public School 330324 C B Martin Middle 3 F 27 F 34 F 19 NotMet 51.6 21 24 10 33 70Edgecombe County Public School 330326 Edgecombe Early College High 3 B 83 Met 84.2 83 77 88 76 70 >95Edgecombe County Public School 330328 North Edgecombe High 3 D 48 Met 82.5 40 28 31 18 19 36 70Edgecombe County Public School 330330 W A Pattillo School 3 F 30 F 32 F 25 NotMet 69.7 20 19 17 38Edgecombe County Public School 330332 Phillips Middle 3 F 34 F 37 F 29 Met 82.8 22 26 15 31Edgecombe County Public School 330334 Princeville Elementary 3 F 31 F 32 F 35 NotMet 68.6 22 20 27 11Edgecombe County Public School 330340 South Edgecombe Middle 3 D 44 D 53 F 33 Met 74.7 36 46 21 42 61Edgecombe County Public School 330348 West Edgecombe Middle 3 F 36 D 44 F 31 NotMet 62.6 30 34 23 33 65Edgecombe County Public School 330350 SouthWest Edgecombe High 3 C 61 Exceeded 92.2 54 33 53 42 39 47 79Edgecombe County Public School 330354 Stocks Elementary 3 D 49 D 49 D 42 Met 77.9 42 42 42Edgecombe County Public School 330358 Tarboro High 3 C 56 Met 75.5 51 18 55 18 34 40 90Forsyth County Schools 340308 Ashley Elementary 5 D 40 D 40 D 42 Met 81.9 30 28 32 28Forsyth County Schools 340311 Atkins Academic & Tech High 5 B 81 Exceeded 86.2 79 69 76 72 79 92 >95Forsyth County Schools 340314 Bolton Elementary 5 C 55 D 46 C 57 Exceeded 91.6 46 37 48 65Forsyth County Schools 340320 Brunson Elementary 5 B 76 B 74 B 75 Exceeded 85.3 73 72 73 78Forsyth County Schools 340326 Caleb's Creek Elementary 5 B 70 C 66 B 71 Met 81.3 67 64 68 73Forsyth County Schools 340330 Carver High 5 D 48 Met 80.7 40 22 26 10 19 56 >95Forsyth County Schools 340332 Career Center 5 IForsyth County Schools 340334 Cash Elementary 5 B 78 B 75 B 73 Exceeded 90.5 75 72 71 93Forsyth County Schools 340336 Carter High School 5 N/A N/A N/AForsyth County Schools 340344 Childrens Center 5 N/A N/A N/AForsyth County Schools 340348 Clemmons Elementary 5 B 84 B 80 B 84 Exceeded 86.8 83 80 84 89Forsyth County Schools 340350 Clemmons Middle School 5 C 61 C 61 D 50 Exceeded 87.9 55 55 42 76 84Forsyth County Schools 340351 Cook Elementary 5 F 22 F 23 F 24 NotMet 68.2 11 9 12 12Forsyth County Schools 340354 The Downtown School 5 A 85 B 83 B 84 Exceeded 91.5 84 83 82 86 >95Forsyth County Schools 340362 Early College of Forsyth Co 5 A 94 Met 83.2 >95 89 >95 >95 >95 >95Forsyth County Schools 340364 East Forsyth High 5 B 70 NotMet 69.9 70 54 59 52 59 86 >95Forsyth County Schools 340366 East Forsyth Middle School 5 D 42 D 46 F 31 NotMet 58.8 38 39 25 61 82Forsyth County Schools 340368 Easton Elementary School 5 F 34 F 29 F 37 Met 75.9 24 19 26 32Forsyth County Schools 340372 Flat Rock Middle 5 D 41 D 43 F 34 NotMet 69.4 34 37 23 51 91Forsyth County Schools 340376 Forest Park Elementary 5 D 47 F 36 D 52 Met 81.6 38 26 45 53Forsyth County Schools 340380 Gibson Elementary 5 F 35 F 31 F 38 NotMet 56.2 30 24 33 37Forsyth County Schools 340382 Robert B Glenn High School 5 D 54 NotMet 50.0 55 39 42 34 53 70 >95Forsyth County Schools 340384 Griffith Elementary 5 D 44 D 42 D 48 Met 71.7 37 36 40 36Forsyth County Schools 340385 Main Street Academy 5 N/A N/A N/AForsyth County Schools 340390 Hall-Woodward Elementary 5 D 40 F 36 D 45 NotMet 66.3 33 26 39 35Forsyth County Schools 340392 Hanes Middle School 5 B 74 B 73 C 67 Met 84.1 72 70 64 80 95Forsyth County Schools 340398 Homebound/ Hospital Education 5 IForsyth County Schools 340400 Ibraham Elementary 5 D 50 D 44 D 52 Exceeded 88.6 41 33 43 54Forsyth County Schools 340403 Jefferson Elementary 5 B 83 B 81 B 82 Exceeded 90.2 81 80 81 82Forsyth County Schools 340406 Thomas Jefferson Middle 5 B 72 B 75 C 64 NotMet 59.5 75 76 65 92 95Forsyth County Schools 340416 Kernersville Elementary 5 C 60 C 56 C 59 Exceeded 91.4 52 49 52 64Forsyth County Schools 340420 Kernersville Middle 5 C 58 C 60 D 50 NotMet 60.6 58 59 47 72 90Forsyth County Schools 340424 Kimberley Park Elementary 5 D 40 F 36 F 37 Exceeded 88.3 29 25 24 56
NCDPI/Division of Accountability Services 17 of 116 February 5, 2015

Forsyth County Schools 340426 Kimmel Farm Elementary 5 D 46 D 54 D 42 NotMet 57.7 43 49 38 39Forsyth County Schools 340427 Kingswood School 5 N/A N/A N/AForsyth County Schools 340428 Konnoak Elementary 5 F 37 F 35 D 42 NotMet 54.0 33 27 39 33Forsyth County Schools 340430 Diggs-Latham Elementary 5 D 47 D 43 D 46 Met 77.3 39 34 40 49Forsyth County Schools 340432 Lewisville Elementary 5 A 85 B 81 A 88 Met 75.9 88 83 90 92Forsyth County Schools 340436 Lowrance Middle 5 N/A N/A N/AForsyth County Schools 340440 Meadowlark Elementary 5 B 80 B 78 B 80 Exceeded 90.5 77 76 77 80Forsyth County Schools 340442 Meadowlark Middle 5 B 73 B 74 C 61 Met 80.9 71 74 59 93 91Forsyth County Schools 340446 Middle College of Forsyth Cnty 5 A 92 92 71 >95Forsyth County Schools 340447 Middle Fork Elementary 5 D 53 D 49 D 53 Met 80.6 46 41 47 58Forsyth County Schools 340448 Mineral Springs Elementary 5 C 59 D 51 C 60 Exceeded 94.4 50 43 51 65Forsyth County Schools 340452 Mineral Springs Middle 5 F 32 F 38 F 25 NotMet 55.5 26 29 17 39 57Forsyth County Schools 340453 Moore Magnet Elementary 5 C 55 C 55 C 62 NotMet 57.2 54 53 59 45Forsyth County Schools 340454 Mount Tabor High School 5 B 72 Met 70.4 72 54 66 51 70 73 >95Forsyth County Schools 340457 Frank Morgan Elementary 5 B 72 C 68 B 74 Met 78.7 71 67 73 77Forsyth County Schools 340460 North Forsyth High 5 C 56 NotMet 53.9 56 32 36 40 40 54 >95Forsyth County Schools 340462 North Hills Elementary 5 D 41 D 40 D 41 Met 73.1 33 30 33 40Forsyth County Schools 340464 Northwest Middle 5 D 52 D 53 D 41 Exceeded 88.8 43 43 32 65 85Forsyth County Schools 340472 Old Richmond Elementary 5 C 68 C 67 C 66 Met 79.5 65 66 62 72Forsyth County Schools 340476 Old Town Elementary 5 D 43 D 41 D 46 NotMet 57.4 39 35 43 40Forsyth County Schools 340480 Paisley IB Magnet School 5 C 62 C 63 D 49 Met 81.4 58 57 45 72 81 94 87Forsyth County Schools 340486 Parkland High 5 C 59 Met 82.8 54 30 33 35 45 35 >95Forsyth County Schools 340488 J F Kennedy High 5 F 36 F 38 F 23 Met 79.9 25 27 11 36 14 24 21 11 33 85Forsyth County Schools 340490 Petree Elementary 5 F 35 F 37 F 35 Met 83.5 23 25 23 21Forsyth County Schools 340492 Philo-Hill Magnet Academy 5 F 24 F 27 F 20 NotMet 50.6 18 19 12 30 38Forsyth County Schools 340494 Piney Grove Elementary 5 B 74 B 72 B 75 Exceeded 87.0 71 69 72 75Forsyth County Schools 340495 Ronald W Reagan High School 5 B 79 NotMet 69.9 82 70 78 71 81 85 >95Forsyth County Schools 340496 R J Reynolds High 5 C 61 NotMet 53.3 62 41 60 45 63 52 92Forsyth County Schools 340504 Rural Hall Elementary 5 C 63 C 61 C 65 Exceeded 91.3 56 55 57 54Forsyth County Schools 340508 Sedge Garden Elementary 5 C 56 D 54 C 59 NotMet 66.2 53 49 56 58Forsyth County Schools 340512 Sherwood Forest Elementary 5 A 85 B 80 A 88 Exceeded 87.5 84 79 88 88Forsyth County Schools 340514 Smith Farm Elementary 5 C 69 C 69 C 65 Met 84.5 65 65 65Forsyth County Schools 340516 Southeast Middle 5 C 62 C 62 D 53 Met 82.7 57 57 46 76 89Forsyth County Schools 340520 South Fork Elementary 5 D 53 D 50 D 52 Exceeded 87.9 44 42 43 55Forsyth County Schools 340528 Southwest Elementary 5 B 72 B 72 C 68 Met 80.0 70 69 67 80Forsyth County Schools 340530 Speas Elementary 5 D 48 D 44 D 52 Met 81.1 40 35 45 40Forsyth County Schools 340531 The Special Children's School 5 N/A N/A N/AForsyth County Schools 340532 Union Cross Traditional Acad 5 C 56 C 55 D 52 Met 76.4 50 50 47 61Forsyth County Schools 340536 Vienna Elementary 5 A 85 B 82 B 81 Met 73.5 85 86 83 92Forsyth County Schools 340540 Walkertown Elementary 5 C 55 D 52 C 63 NotMet 59.5 54 50 58 56Forsyth County Schools 340542 Walkertown High 5 D 52 NotMet 56.8 51 34 52 29 47 67 >95Forsyth County Schools 340544 Walkertown Middle 5 D 45 D 52 F 31 NotMet 63.9 40 44 24 59 78Forsyth County Schools 340548 Ward Elementary 5 C 63 C 59 C 64 Met 82.6 58 54 59 66Forsyth County Schools 340556 West Forsyth High 5 B 81 Exceeded 92.1 78 64 79 66 74 89 >95Forsyth County Schools 340560 Whitaker Elementary 5 A 91 A 90 A 91 Exceeded 93.5 90 91 90 91
NCDPI/Division of Accountability Services 18 of 116 February 5, 2015

Forsyth County Schools 340564 Wiley Middle 5 D 46 D 49 F 34 Met 73.3 40 40 28 63 94Forsyth County Schools 340568 Winston-Salem Preparatory Acad 5 F 39 F 35 F 26 Met 75.8 29 24 13 46 25 23 13 34 >95Forsyth County Schools 340703 Jacket Academy at Carver 5 A 97 >95 83 >95Franklin County Schools 350304 Bunn Elementary 3 C 57 C 58 D 50 Met 80.1 51 52 45 68Franklin County Schools 350308 Bunn High 3 C 69 Exceeded 91.6 63 42 69 46 59 72 89Franklin County Schools 350310 Bunn Middle 3 D 52 C 58 F 37 Met 71.7 48 52 30 73 81Franklin County Schools 350312 Cedar Creek Middle 3 C 59 C 58 D 54 Met 84.7 53 53 45 73 63Franklin County Schools 350316 Edward Best Elementary 3 B 73 B 70 C 68 Exceeded 87.0 69 68 64 87Franklin County Schools 350317 Franklin County Early College 3 C 68 Met 73.9 66 62 80 24 72 >95Franklin County Schools 350318 Franklinton Elementary 3 D 48 D 52 D 45 Met 76.3 41 45 36 44Franklin County Schools 350321 Franklinton High 3 C 61 NotMet 61.6 61 45 52 42 52 63 94Franklin County Schools 350324 Franklinton Middle 3 D 51 D 53 D 42 Exceeded 85.7 43 46 30 66 91Franklin County Schools 350330 Laurel Mill Elementary 3 D 46 D 46 D 44 NotMet 69.2 41 40 36 54Franklin County Schools 350331 Long Mill Elementary 3 C 63 C 63 C 59 Met 84.3 58 58 53 73Franklin County Schools 350332 Louisburg Elementary 3 D 52 D 52 D 46 Exceeded 89.7 42 44 36 59Franklin County Schools 350336 Louisburg High 3 C 68 Met 84.1 64 52 57 40 52 81 >95Franklin County Schools 350338 Terrell Lane Middle 3 D 48 D 48 F 38 Met 83.9 39 40 27 63 >95Franklin County Schools 350339 Royal Elementary 3 D 54 C 55 D 53 Met 70.4 49 50 48 54Franklin County Schools 350340 Youngsville Elementary 3 B 75 B 79 C 68 Exceeded 86.5 72 78 64 75Gaston County Schools 360310 Ashbrook High 6 C 68 Exceeded 92.2 62 49 54 44 45 44 >95Gaston County Schools 360320 Belmont Central Elementary 6 B 78 B 75 B 78 Exceeded 93.5 74 72 74 82Gaston County Schools 360324 Belmont Middle 6 B 71 B 72 C 62 Exceeded 89.9 67 68 56 83 88Gaston County Schools 360332 Bessemer City Central Elem 6 D 48 D 50 D 47 Exceeded 85.9 39 41 37 41Gaston County Schools 360336 Bessemer City High 6 C 62 Exceeded 90.2 55 35 46 47 32 60 >95Gaston County Schools 360337 Gaston Early College High School 6 B 81 Exceeded 85.9 80 80 89 71 67 >95Gaston County Schools 360338 Bessemer City Primary 6 IGaston County Schools 360339 W B Beam Intermediate School 6 C 59 C 62 C 59 Met 70.3 56 57 55 58Gaston County Schools 360340 Brookside Elementary 6 D 52 C 58 D 51 NotMet 62.2 49 53 48 45Gaston County Schools 360344 Carr Elementary 6 D 51 D 50 D 54 Met 82.5 44 41 46 43Gaston County Schools 360348 Catawba Heights Elementary 6 C 57 C 58 C 55 Exceeded 86.8 50 51 47 53Gaston County Schools 360352 Chapel Grove Elementary 6 D 54 D 54 D 53 Met 72.2 49 48 48 53Gaston County Schools 360360 Cherryville High 6 B 72 Exceeded 90.6 67 48 58 51 61 57 >95Gaston County Schools 360364 Cherryville Elementary 6 C 65 C 64 C 62 Met 76.8 62 61 62Gaston County Schools 360372 Warlick Academy 6 N/A N/A N/AGaston County Schools 360376 Costner Elementary 6 C 61 C 62 C 68 NotMet 67.2 60 59 65 50Gaston County Schools 360378 Stuart W Cramer High 6 C 61 Met 70.0 59 54 66 58Gaston County Schools 360380 Cramerton Middle 6 C 68 B 71 C 56 Met 72.3 67 68 55 83 95Gaston County Schools 360390 East Gaston High 6 B 72 Exceeded 85.2 68 49 61 53 60 65 >95Gaston County Schools 360392 Edward D Sadler Jr Elementary School 6 F 37 F 39 D 41 Met 74.6 28 28 32 16Gaston County Schools 360394 Webb Street School 6 N/A N/A N/AGaston County Schools 360396 Forestview High 6 B 72 Met 83.2 69 59 59 52 58 82 >95Gaston County Schools 360400 Gardner Park Elementary 6 C 61 C 58 C 61 Exceeded 90.1 54 51 53 63Gaston County Schools 360408 W P Grier Middle School 6 D 44 D 45 F 33 Met 71.0 37 37 26 53 95Gaston County Schools 360416 Hawks Nest Intermediate 6 C 66 C 64 B 70 Met 77.7 63 62 66 62Gaston County Schools 360418 Highland Sch of Technology 6 A 94 Exceeded 96.7 93 92 94 89 86 94 >95
NCDPI/Division of Accountability Services 19 of 116 February 5, 2015

Gaston County Schools 360426 Holbrook Middle 6 D 54 C 56 D 51 NotMet 68.7 50 50 44 58 >95Gaston County Schools 360428 Hunter Huss High 6 D 50 NotMet 65.9 46 33 35 24 39 31 >95Gaston County Schools 360430 J B Page Primary School 6 IGaston County Schools 360431 John Chavis Middle School 6 C 58 C 59 D 51 Met 73.6 54 55 43 72 74Gaston County Schools 360432 Kiser Elementary 6 C 58 C 59 C 56 Exceeded 86.4 50 52 49 50Gaston County Schools 360436 Bessemer City Middle 6 D 43 D 43 F 24 Met 71.1 36 37 16 77 84Gaston County Schools 360438 Lingerfeldt Elementary 6 F 36 F 39 F 33 Met 71.0 27 29 24 33Gaston County Schools 360440 Lowell Elementary 6 C 55 C 55 C 56 Met 74.2 50 49 50 48Gaston County Schools 360448 McAdenville Elementary 6 D 52 C 55 D 49 Met 74.0 47 49 43 54Gaston County Schools 360456 Mount Holly Middle 6 C 63 C 63 D 53 Met 84.0 58 58 46 75 >95Gaston County Schools 360460 Forest Heights Elementary 6 D 40 D 42 D 44 NotMet 69.2 33 33 36 24Gaston County Schools 360464 New Hope Elementary 6 B 79 B 80 B 75 Met 77.8 80 80 76 91Gaston County Schools 360468 North Belmont Elementary 6 D 49 D 46 D 47 Met 80.6 41 39 39 57Gaston County Schools 360470 North Gaston High 6 B 70 Exceeded 90.2 65 36 53 64 56 65 >95Gaston County Schools 360478 Pinewood Elementary 6 C 63 C 62 C 62 Exceeded 86.9 57 57 55 63Gaston County Schools 360480 Pleasant Ridge Elementary 6 D 44 D 45 D 43 Exceeded 90.0 33 34 32 33Gaston County Schools 360482 Ida Rankin Elementary School 6 C 60 C 58 C 62 Met 79.6 55 55 56 57Gaston County Schools 360484 Rhyne Elementary 6 F 32 F 32 F 33 Met 80.1 20 20 21 17Gaston County Schools 360488 Robinson Elementary 6 C 63 C 66 C 55 Met 82.6 58 62 55Gaston County Schools 360490 Sherwood Elementary 6 D 46 D 48 D 50 NotMet 66.5 41 42 42 32Gaston County Schools 360492 H H Beam Elementary 6 F 39 D 41 D 43 NotMet 66.1 33 33 34 29Gaston County Schools 360494 South Point High 6 B 77 Exceeded 86.4 75 54 65 71 67 69 >95Gaston County Schools 360498 Southwest Middle 6 D 42 D 46 F 36 NotMet 59.1 38 40 29 45 89Gaston County Schools 360499 Springfield Primary 6 IGaston County Schools 360500 Stanley Middle 6 C 56 C 58 D 48 Met 75.4 51 53 39 68 92Gaston County Schools 360504 Tryon Elementary 6 D 52 D 50 D 50 Met 80.7 44 42 42 59Gaston County Schools 360510 W A Bess Elementary School 6 B 78 B 73 B 79 Exceeded 100.0 73 69 73 85Gaston County Schools 360514 W C Friday Middle School 6 D 48 C 56 F 36 NotMet 63.4 45 49 31 67 81Gaston County Schools 360520 Woodhill Elementary 6 D 51 D 46 D 54 Met 80.8 44 39 47 47Gaston County Schools 360526 York Chester Middle 6 F 33 F 36 F 33 NotMet 63.2 26 26 24 25 68Gates County Schools 370304 Buckland Elementary 1 B 75 C 69 B 74 Exceeded 88.0 72 66 70 93Gates County Schools 370308 Central Middle 1 C 58 C 62 D 47 Met 83.8 52 57 38 71 93Gates County Schools 370312 Gates County Senior High 1 B 71 Exceeded 90.5 66 53 61 48 56 72 >95Gates County Schools 370316 Gatesville Elementary 1 C 65 C 64 C 57 Met 84.0 60 58 55 86Gates County Schools 370324 T S Cooper Elementary 1 C 64 C 56 B 73 Met 77.6 61 51 70 61Graham County Schools 380306 Robbinsville Elementary 8 C 61 C 61 C 57 Met 80.5 56 57 52 70Graham County Schools 380308 Robbinsville High 8 C 67 Met 80.5 64 59 50 43 61 62 >95Graham County Schools 380310 Robbinsville Middle 8 C 56 D 53 D 46 Exceeded 86.0 48 47 35 66 91Granville County Schools 390309 Butner-Stem Middle 3 D 40 D 52 F 27 NotMet 57.9 35 45 19 49 46Granville County Schools 390311 Butner-Stem Elementary 3 C 55 D 52 D 52 Met 84.2 47 44 45 63Granville County Schools 390312 C. G. Credle Elementary 3 D 40 D 40 F 35 Met 74.3 32 31 27 55Granville County Schools 390314 Center For Innovative Learning 3 N/A N/A N/AGranville County Schools 390316 Creedmoor Elementary 3 F 38 D 41 F 35 NotMet 58.6 33 35 28 39Granville County Schools 390320 G. C. Hawley Middle 3 D 51 C 59 F 38 NotMet 55.0 49 55 34 73 56Granville County Schools 390322 Granville Central High 3 C 65 Exceeded 87.1 59 25 48 57 49 78 >95
NCDPI/Division of Accountability Services 20 of 116 February 5, 2015

Granville County Schools 390323 Granville Early College High 3 B 82 Exceeded 97.8 78 50 90 87 76 >95Granville County Schools 390324 J. F. Webb High 3 D 49 NotMet 56.8 47 22 39 28 24 62 >95Granville County Schools 390328 Granville Magnet School 3 F 30 F 31 F 22 Met 82.3 16 16 10 32Granville County Schools 390331 Mary Potter Middle 3 C 55 D 50 D 51 Met 83.9 48 43 42 63 86Granville County Schools 390333 Mount Energy Elementary 3 C 67 C 66 B 70 Met 82.3 63 62 66 58Granville County Schools 390334 Northern Granville Middle 3 D 41 D 46 F 29 NotMet 64.3 36 37 21 54 72Granville County Schools 390336 Joe Toler-Oak Hill Elementary 3 D 49 D 52 D 41 Met 80.6 41 44 32 58Granville County Schools 390360 Stovall-Shaw Elementary 3 C 55 D 52 D 54 Met 80.2 49 45 48 67Granville County Schools 390362 Tar River Elementary 3 C 68 C 67 B 74 NotMet 68.5 68 65 74 59Granville County Schools 390364 West Oxford Elementary 3 F 37 D 43 F 35 NotMet 68.9 30 33 28 24Granville County Schools 390368 Wilton Elementary 3 C 66 C 60 C 62 Met 84.7 61 56 57 88Granville County Schools 390700 JF Webb HS Of Health And Life Sciences 3 B 76 Met 74.4 76 61 75 68 69 76 >95Granville County Schools 390704 S Granville HS Of Health Life Sciences 3 C 66 Met 79.9 63 27 60 52 51 90 >95Granville County Schools 390705 S Granville HS of Integ Tech & Lead 3 C 61 Met 73.7 58 20 50 56 47 72 >95Greene County Schools 400308 Greene Central High 2 C 55 Met 77.9 50 28 36 24 37 59 92Greene County Schools 400312 Greene County Middle 2 D 47 D 53 F 33 Met 80.1 38 44 23 61 87Greene County Schools 400315 Greene Early College High 2 B 84 Exceeded 93.7 82 68 91 86 73Greene County Schools 400318 Greene County Intermediate 2 D 47 D 42 D 48 Exceeded 89.7 36 33 36 44Greene County Schools 400321 Snow Hill Primary 2 IGreene County Schools 400332 West Greene Elementary 2 D 42 D 44 F 31 Met 70.5 35 38 31Guilford County Schools 410304 Alamance Elementary 5 C 57 C 61 C 59 NotMet 66.6 55 57 55 50Guilford County Schools 410307 Edwin A Alderman Elementary 5 D 50 D 51 D 50 Met 73.2 44 44 45 40Guilford County Schools 410310 Allen Jay Elementary 5 C 55 D 53 D 51 Exceeded 90.2 46 45 42 62Guilford County Schools 410311 Allen Jay Middle Preparatory Academy 5 D 47 D 52 C 58 NotMet 57.0 44 45 53 35Guilford County Schools 410313 Southern Guilford Middle 5 D 46 D 48 D 42 NotMet 58.7 43 42 38 58 91Guilford County Schools 410316 Allen Middle 5 D 51 D 47 D 48 Exceeded 94.2 40 37 36 56 58Guilford County Schools 410319 T Wingate Andrews High 5 C 65 Exceeded 93.5 58 45 44 37 29 61 >95Guilford County Schools 410322 Archer Elementary 5 D 54 D 47 C 61 Exceeded 87.3 46 38 54 42Guilford County Schools 410325 Aycock Middle 5 D 46 D 49 F 39 Met 70.5 40 41 32 52 >95Guilford County Schools 410326 Middle College High at Bennett 5 B 71 Met 84.5 68 82 70 27 47 >95Guilford County Schools 410328 Bessemer Elementary 5 F 37 F 39 F 38 Met 76.7 27 28 28 23Guilford County Schools 410331 Bluford Elementary 5 D 43 D 43 D 40 Met 79.0 34 34 31 41Guilford County Schools 410334 Brightwood Elementary 5 D 43 D 46 D 43 NotMet 69.7 37 37 38 35Guilford County Schools 410337 Brooks Global Elementary 5 B 78 B 78 B 77 Met 80.5 78 78 76 82Guilford County Schools 410340 Monticello-Brown Summit Elem 5 C 58 C 61 C 56 NotMet 59.0 58 58 56 68Guilford County Schools 410341 Brown Summit Middle 5 A 90 A 94 A 89 NotMet 61.6 >95 >95 95 >95 >95Guilford County Schools 410343 Claxton Elementary 5 B 70 B 72 C 65 Met 84.0 67 70 61 73Guilford County Schools 410346 Colfax Elementary 5 C 64 B 71 C 64 NotMet 66.8 64 67 65 51Guilford County Schools 410349 Ceasar Cone Elementary 5 F 31 F 32 F 34 Met 73.4 21 21 22 15Guilford County Schools 410355 James B Dudley High 5 C 55 Met 80.8 49 23 43 25 24 50 >95Guilford County Schools 410358 Eastern Guilford High 5 C 66 Exceeded 91.7 59 47 50 49 41 48 >95Guilford County Schools 410361 Erwin Montessori 5 B 71 B 70 B 72 Met 84.9 68 65 69 71Guilford County Schools 410364 Fairview Elementary 5 F 33 F 30 F 34 Met 71.9 23 20 23 35Guilford County Schools 410366 Waldo C Falkener Sr Elementary 5 F 39 F 37 D 41 NotMet 65.3 32 30 32 40Guilford County Schools 410367 Ferndale Middle 5 F 38 D 41 F 32 NotMet 53.3 34 34 26 46 80
NCDPI/Division of Accountability Services 21 of 116 February 5, 2015

Guilford County Schools 410370 Florence Elementary 5 B 72 B 71 B 73 Exceeded 88.3 69 67 70 68Guilford County Schools 410373 Julius I Foust Elementary 5 D 45 D 47 D 44 Exceeded 92.7 33 35 32 28Guilford County Schools 410376 Cyrus P Frazier Elementary 5 F 34 D 40 F 34 Met 73.3 25 31 22 14Guilford County Schools 410379 Gateway Education Center 5 N/A N/A N/AGuilford County Schools 410382 Gibsonville Elementary 5 C 59 D 54 C 57 Met 81.8 53 49 51 68Guilford County Schools 410385 Gillespie Park Elementary 5 D 40 F 39 D 47 Met 78.1 31 28 39 9Guilford County Schools 410388 General Greene Elementary 5 C 68 C 66 B 72 Met 76.7 66 65 69 64Guilford County Schools 410390 GC Middle College High 5 A 89 89 73 >95Guilford County Schools 410391 Penn-Griffin Schools 5 C 63 C 56 D 53 Met 78.0 60 53 45 70 78 93 81 82 >95Guilford County Schools 410394 Grimsley High 5 B 80 Exceeded 93.6 77 59 77 66 74 69 95Guilford County Schools 410395 Early College at Guilford 5 A 93 NotMet 64.1 >95 >95 >95 >95 >95 >95Guilford County Schools 410396 High School Ahead Academy 5 N/A N/A N/AGuilford County Schools 410397 Guilford Middle 5 C 55 C 55 D 52 Met 71.1 51 49 45 67 76Guilford County Schools 410398 Doris Henderson Newcomers Sch 5 F 18 F 0 F 20 18 <5 20 20Guilford County Schools 410399 Middle College at GTCC-GSO 5 A 85 Exceeded 94.1 83 70 81 70 68 >95Guilford County Schools 410400 Guilford Elementary 5 D 51 D 46 C 56 Met 70.9 46 40 51 51Guilford County Schools 410401 GTCC Middle College High 5 B 78 Met 76.3 78 70 69 47 80 >95Guilford County Schools 410402 Otis L Hairston Sr Middle 5 F 34 D 40 F 28 Met 70.9 25 29 18 37 44Guilford County Schools 410403 Hampton Elem Univ Partnership 5 D 43 F 38 D 47 Met 82.3 34 29 37 38Guilford County Schools 410406 High Point Central High 5 C 67 Exceeded 97.0 60 49 49 42 50 49 89Guilford County Schools 410407 The Academy at Central 5 B 72 Exceeded 90.7 67 40 50 66 50 70 >95Guilford County Schools 410408 Middle College GTCC High Point 5 B 77 Met 80.1 77 58 77 35 79 >95Guilford County Schools 410409 Hunter Elementary 5 D 54 D 49 C 60 Met 82.9 46 41 53 42Guilford County Schools 410412 Irving Park Elementary 5 C 55 C 56 D 52 Met 82.5 48 49 45 51Guilford County Schools 410415 Jackson Middle 5 F 36 D 41 F 29 NotMet 59.9 30 31 22 46 62Guilford County Schools 410418 Jamestown Elementary 5 D 53 C 56 D 52 Met 77.8 47 48 46 47Guilford County Schools 410421 Jamestown Middle 5 C 66 C 62 C 61 Exceeded 88.8 60 57 54 74 >95Guilford County Schools 410423 Jefferson Elementary 5 C 68 C 63 C 67 Exceeded 93.1 61 57 61 74Guilford County Schools 410424 Jesse Wharton Elem 5 C 66 B 70 C 62 NotMet 67.1 65 67 62 69Guilford County Schools 410427 Johnson Street Global Studies 5 D 52 D 53 D 47 NotMet 69.3 47 48 40 53 >95Guilford County Schools 410430 David D Jones Elementary 5 C 56 C 62 C 56 NotMet 55.7 56 60 55 44Guilford County Schools 410436 James Y Joyner Elementary 5 C 55 D 54 C 55 Met 84.9 47 47 47 50Guilford County Schools 410437 Kernodle Middle 5 B 81 B 81 B 73 Exceeded 99.3 77 79 67 90 >95Guilford County Schools 410439 Kirkman Park Elementary 5 D 43 D 46 D 42 Met 76.7 35 38 32 31Guilford County Schools 410442 Kiser Middle 5 C 58 C 55 D 51 Met 72.6 54 52 46 73 91Guilford County Schools 410448 Lincoln Academy 5 B 70 B 74 C 61 NotMet 69.4 70 73 60 82 86Guilford County Schools 410451 John Van Lindley Elementary 5 C 66 C 66 C 67 Met 73.6 64 64 64 64Guilford County Schools 410454 Madison Elementary 5 D 40 D 51 F 37 NotMet 57.1 36 44 33 26Guilford County Schools 410457 Herbin Metz Education Center 5 N/A N/A N/AGuilford County Schools 410458 C Joyner Greene Education Center 5 N/A N/A N/AGuilford County Schools 410460 Eastern Guilford Middle 5 D 49 D 48 D 46 Met 81.6 40 40 36 51 90Guilford County Schools 410461 McLeansville Elementary 5 C 55 D 45 C 64 Met 75.3 50 41 58 51Guilford County Schools 410462 Ronald E. McNair Elementary 5 D 45 D 49 F 39 Met 76.2 37 40 31 44Guilford County Schools 410463 Mendenhall Middle 5 C 61 C 63 D 54 Exceeded 85.4 56 57 45 67 88Guilford County Schools 410464 Haynes Inman Education Center 5 N/A N/A N/A
NCDPI/Division of Accountability Services 22 of 116 February 5, 2015

Guilford County Schools 410466 Millis Road Elementary 5 B 71 B 70 B 72 Met 84.4 68 66 69 70Guilford County Schools 410469 Montlieu Academy of Technology 5 D 51 D 47 C 56 Met 76.8 45 39 51 43Guilford County Schools 410472 Morehead Elementary 5 B 74 B 71 B 73 Met 78.0 73 70 73 83Guilford County Schools 410478 Murphey Traditional Academy 5 D 48 D 49 D 45 Met 77.8 40 41 38 46Guilford County Schools 410481 Nathanael Greene Elementary 5 D 53 D 54 C 58 NotMet 59.8 51 50 56 42Guilford County Schools 410483 Middle College High @ NC A&T 5 C 62 Met 72.8 59 30 52 50 27 55 >95Guilford County Schools 410484 Northeast Guilford High 5 C 59 Met 73.1 55 32 41 28 36 68 >95Guilford County Schools 410486 Northern Guilford Elementary 5 B 78 B 81 B 76 Met 70.7 80 81 79 83Guilford County Schools 410487 Northeast Guilford Middle 5 D 45 D 42 D 40 Met 71.7 38 38 30 53 >95Guilford County Schools 410488 Northern Guilford Middle 5 B 78 B 75 B 75 Exceeded 86.6 75 73 72 84 >95Guilford County Schools 410489 Northern Guilford High 5 B 84 Exceeded 87.4 84 71 79 75 76 89 >95Guilford County Schools 410490 Northwest Guilford High 5 A 86 Exceeded 95.4 84 79 83 72 84 84 95Guilford County Schools 410491 EP Pearce Elementary 5 B 76 B 76 B 81 Met 71.4 78 77 82 68Guilford County Schools 410493 Northwest Guilford Middle 5 B 81 B 79 B 79 Met 83.3 80 78 77 85 >95Guilford County Schools 410496 Northwood Elementary 5 D 50 D 47 D 46 Met 75.4 44 39 43 63Guilford County Schools 410499 Oak Hill Elementary 5 D 53 D 43 C 57 NotMet 67.4 50 36 56 75Guilford County Schools 410502 Oak Ridge Elementary 5 A 86 B 84 A 86 Met 82.3 86 84 87 91Guilford County Schools 410505 Oak View Elementary 5 D 52 D 54 D 49 NotMet 67.4 48 49 45 56Guilford County Schools 410508 Page High 5 B 75 Exceeded 96.0 70 52 64 60 64 55 >95Guilford County Schools 410511 Parkview Village Elementary 5 D 45 D 42 D 51 Exceeded 91.4 34 31 40 22Guilford County Schools 410514 Clara J Peck Elementary 5 D 54 D 51 C 62 Exceeded 87.6 45 43 55 21Guilford County Schools 410517 Peeler Open Elementary 5 F 38 D 43 D 40 Met 73.7 29 33 29 14Guilford County Schools 410522 Pilot Elementary 5 C 57 C 57 C 56 Met 73.9 53 51 53 62Guilford County Schools 410523 Pleasant Garden Elementary 5 B 70 C 68 C 67 Exceeded 85.8 66 64 64 80Guilford County Schools 410529 Lucy Ragsdale High 5 C 69 NotMet 65.8 70 56 63 59 60 73 >95Guilford County Schools 410530 Reedy Fork Elementary 5 D 49 D 46 D 46 Met 80.2 41 38 38 62Guilford County Schools 410532 Rankin Elementary 5 D 42 F 37 D 48 Met 83.6 32 27 38 25Guilford County Schools 410533 SCALE School 5 N/A N/A N/AGuilford County Schools 410534 Pruette SCALE Academy 5 N/A N/A N/AGuilford County Schools 410535 Sedalia Elementary 5 C 58 C 59 C 57 NotMet 63.5 56 56 56 58Guilford County Schools 410538 Sedgefield Elementary 5 D 50 D 47 D 51 Exceeded 88.1 41 38 41 51Guilford County Schools 410541 Shadybrook Elementary 5 C 56 C 59 C 59 NotMet 60.2 55 57 57 42Guilford County Schools 410544 Ben L. Smith High School 5 D 54 Met 81.3 48 21 34 36 22 42 >95Guilford County Schools 410545 The Academy at Smith 5 B 81 Exceeded 88.2 79 68 74 69 53 88 >95Guilford County Schools 410547 Southeast Guilford High 5 B 78 Exceeded 100.0 72 56 63 63 65 57 >95Guilford County Schools 410550 Southeast Guilford Middle 5 C 55 C 60 D 46 NotMet 66.1 53 56 39 71 79Guilford County Schools 410553 Southern Elementary 5 B 70 C 67 C 67 Met 80.9 67 63 65 80Guilford County Schools 410556 Southern Guilford High 5 B 72 Exceeded 99.8 66 42 51 59 52 71 >95Guilford County Schools 410559 Southwest Elementary 5 B 79 B 78 B 75 Met 81.6 78 77 77 86Guilford County Schools 410562 Southwest Guilford High 5 B 77 Exceeded 90.1 73 54 69 62 67 63 >95Guilford County Schools 410565 Southwest Guilford Middle 5 C 61 C 63 D 54 NotMet 55.7 62 61 54 72 94Guilford County Schools 410568 Sternberger Elementary 5 B 76 B 78 B 72 Met 74.3 76 78 73 79Guilford County Schools 410569 STEM Early College @ NC A&T SU 5 A 96 Exceeded 89.2 >95 >95 >95 >95Guilford County Schools 410571 Stokesdale Elementary 5 B 70 B 73 B 70 NotMet 63.7 72 74 70 69Guilford County Schools 410574 Summerfield Elementary 5 B 79 B 79 B 77 Exceeded 85.7 78 78 75 84
NCDPI/Division of Accountability Services 23 of 116 February 5, 2015

Guilford County Schools 410577 Sumner Elementary 5 D 53 D 47 C 56 Exceeded 87.9 44 38 48 52Guilford County Schools 410578 Triangle Lake Montessori Elem 5 C 58 C 64 C 59 Met 75.0 54 59 55 36Guilford County Schools 410579 UNCG Early/Middle College 5 C 67 Met 74.6 65 70 84 51 53Guilford County Schools 410580 Union Hill Elementary 5 F 37 D 40 F 39 NotMet 68.0 29 30 31 21Guilford County Schools 410583 Vandalia Elementary 5 D 43 D 43 D 47 Met 82.1 33 35 36 19Guilford County Schools 410586 Washington Elementary 5 D 43 D 47 D 46 Met 71.4 36 39 38 21Guilford County Schools 410589 Philip J Weaver Ed Center 5 A 91 Met 80.4 94 86 94 88 91 >95Guilford County Schools 410592 Welborn Middle 5 D 44 D 44 F 37 NotMet 68.4 38 36 28 60 89Guilford County Schools 410595 Western Guilford High 5 B 75 Exceeded 93.3 71 54 58 66 63 69 >95Guilford County Schools 410598 Wiley Accel/Enrichment 5 D 46 D 46 D 45 Met 83.6 36 37 35 38Halifax County Schools 420304 Aurelian Springs Elementary 3 D 41 D 41 D 43 Met 70.5 33 33 34 29Halifax County Schools 420316 Dawson Elementary 3 F 32 F 33 F 37 Met 72.6 22 23 26 11Halifax County Schools 420324 Enfield Middle 3 F 25 F 29 F 19 Met 74.4 13 15 7 21 29Halifax County Schools 420328 Everetts Elementary 3 F 28 F 35 F 26 NotMet 66.9 19 24 15 14Halifax County Schools 420336 Hollister Elementary 3 F 38 F 36 D 43 NotMet 58.3 33 28 39 28Halifax County Schools 420340 Inborden Elementary 3 F 32 F 33 F 35 Met 73.7 22 22 24 16Halifax County Schools 420346 Northwest Halifax High 3 C 57 Exceeded 98.4 47 34 23 39 33 50 93Halifax County Schools 420348 Pittman Elementary 3 D 48 D 42 D 54 Exceeded 86.3 38 31 47 35Halifax County Schools 420356 Scotland Neck Primary 3 D 49 D 51 D 41 Met 76.5 43 44 41Halifax County Schools 420358 Southeast Halifax High 3 C 58 Exceeded 97.3 48 31 29 35 17 36 >95Halifax County Schools 420376 William R Davie Middle 3 D 42 D 44 F 37 Exceeded 85.1 31 33 25 33 76Roanoke Rapids City Schools 421304 Belmont Elementary 3 D 52 D 49 D 52 Met 82.6 45 42 44 54Roanoke Rapids City Schools 421306 Chaloner Middle 3 C 55 D 54 D 46 Exceeded 86.8 47 45 38 69 82Roanoke Rapids City Schools 421316 Roanoke Rapids High 3 C 63 NotMet 65.2 63 46 57 50 58 67 >95Roanoke Rapids City Schools 421328 William L Manning Elementary 3 C 68 C 60 B 71 Exceeded 93.3 62 54 65 73Weldon City Schools 422310 Roanoke Valley Early College 3 C 63 C 60 F 38 NotMet 68.6 61 55 27 68 52 69 48 58 >95Weldon City Schools 422314 Weldon Elementary 3 F 35 F 38 F 32 Met 70.7 26 28 24Weldon City Schools 422315 Weldon High 3 C 65 Exceeded 85.5 59 29 47 40 31 42 >95Weldon City Schools 422318 Weldon Middle 3 F 34 F 33 F 28 Exceeded 85.7 21 20 14 35Harnett County Schools 430304 Anderson Creek Primary 4 IHarnett County Schools 430308 Angier Elementary 4 D 52 D 48 D 50 Exceeded 85.9 43 40 42 56Harnett County Schools 430312 Benhaven Elementary 4 C 56 C 56 C 58 Met 81.2 50 49 52 47Harnett County Schools 430316 Boone Trail Elementary 4 D 50 D 52 D 50 NotMet 67.3 46 45 46 50Harnett County Schools 430320 Buies Creek Elementary 4 B 72 C 67 B 71 Met 83.0 69 63 69 90Harnett County Schools 430328 Coats Elementary 4 C 56 D 53 C 55 Met 74.8 51 46 52 65Harnett County Schools 430330 Coats-Erwin Middle 4 D 53 D 48 D 47 Met 78.1 47 45 38 73 91Harnett County Schools 430332 Dunn Middle 4 D 46 D 45 F 39 Met 83.8 36 37 27 52 89Harnett County Schools 430336 Erwin Elementary 4 C 56 D 49 C 57 Exceeded 87.1 48 42 49 62Harnett County Schools 430340 Gentry Primary 4 IHarnett County Schools 430344 Harnett Primary 4 D 46 D 48 F 37 Met 77.1 39 40 37Harnett County Schools 430345 STAR Academy 4 N/A N/A N/AHarnett County Schools 430346 Harnett Central High 4 B 71 Exceeded 85.7 67 43 55 62 67 67 >95Harnett County Schools 430347 Harnett Central Middle 4 C 56 D 54 D 49 Exceeded 86.2 49 48 39 71 >95Harnett County Schools 430348 Johnsonville Elementary 4 F 38 D 45 F 37 NotMet 54.2 34 38 32 25Harnett County Schools 430349 Highland Elementary 4 C 66 C 66 C 63 Exceeded 85.5 62 62 57 73
NCDPI/Division of Accountability Services 24 of 116 February 5, 2015

Harnett County Schools 430352 LaFayette Elementary 4 B 70 C 66 C 69 Met 76.6 68 64 69 81Harnett County Schools 430358 Lillington-Shawtown Elementary 4 D 47 D 45 D 43 Met 83.3 38 36 33 55Harnett County Schools 430368 North Harnett Primary 4 IHarnett County Schools 430369 Overhills Elementary 4 C 59 C 59 C 56 Met 81.0 53 53 50 64Harnett County Schools 430370 Overhills Middle 4 D 49 D 49 D 43 NotMet 62.1 46 47 34 72 86Harnett County Schools 430371 Overhills High 4 C 59 NotMet 53.5 60 42 52 32 55 80 >95Harnett County Schools 430376 South Harnett Elementary 4 C 55 D 50 D 52 Exceeded 87.3 46 45 43 62Harnett County Schools 430378 Triton High 4 C 61 NotMet 69.3 59 42 46 35 50 56 >95Harnett County Schools 430380 Wayne Avenue Elem 4 F 33 F 35 F 31 NotMet 58.8 26 27 22 33Harnett County Schools 430384 Western Harnett High 4 C 61 Met 70.1 59 35 57 44 47 71 >95Harnett County Schools 430386 Western Harnett Middle 4 C 55 D 54 D 45 Exceeded 88.4 47 49 34 73 >95Haywood County Schools 440314 Bethel Elementary 8 B 77 B 74 B 83 Exceeded 85.7 75 72 81 69Haywood County Schools 440318 Bethel Middle 8 B 71 B 71 C 61 Exceeded 91.6 66 67 55 90 >95Haywood County Schools 440320 Canton Middle 8 C 64 C 65 C 56 Met 73.2 61 62 52 78 >95Haywood County Schools 440324 Central Elementary 8 C 68 C 67 C 69 Met 81.8 64 63 65 64Haywood County Schools 440326 Central Haywood High 8 N/A N/A N/AHaywood County Schools 440328 Clyde Elementary 8 C 69 C 67 C 67 Exceeded 92.2 63 61 62 75Haywood County Schools 440332 Riverbend Elementary 8 A 89 A 85 A 90 Exceeded 91.9 88 85 89 92Haywood County Schools 440346 Haywood Early College 8 A 85 Met 84.3 85 84 83 78 90 >95Haywood County Schools 440348 Hazelwood Elementary 8 C 64 C 64 C 66 NotMet 59.8 65 61 67 69Haywood County Schools 440349 Jonathan Valley Elementary 8 B 77 B 73 B 78 Met 81.6 75 71 77 83Haywood County Schools 440350 Junaluska Elementary 8 B 81 B 80 B 80 Exceeded 90.1 78 78 78 78Haywood County Schools 440364 Meadowbrook Elementary 8 C 68 C 67 C 63 Met 82.3 65 62 61 85Haywood County Schools 440368 North Canton Elementary 8 B 72 C 67 B 72 Exceeded 93.7 67 61 68 79Haywood County Schools 440378 Pisgah High 8 C 69 NotMet 69.1 69 57 65 56 64 66 91Haywood County Schools 440390 Tuscola High 8 C 66 NotMet 57.7 68 50 66 48 70 66 92Haywood County Schools 440396 Waynesville Middle 8 C 66 C 67 D 54 Met 84.5 62 63 49 85 >95Henderson County Schools 450301 Apple Valley Middle 8 D 52 C 60 D 42 NotMet 57.0 51 56 38 66 86Henderson County Schools 450302 Atkinson Elementary 8 B 71 B 73 C 67 Met 83.4 68 71 64 75Henderson County Schools 450306 Bruce Drysdale Elementary 8 C 60 C 59 C 57 Met 80.5 55 55 51 67Henderson County Schools 450307 Clear Creek Elementary 8 B 74 C 67 B 76 Met 77.8 73 67 75 81Henderson County Schools 450308 Dana Elementary 8 C 64 C 56 C 67 Met 83.9 59 51 62 71Henderson County Schools 450316 East Henderson High 8 B 70 NotMet 67.4 71 66 54 60 67 77 >95Henderson County Schools 450322 Edneyville Elementary 8 D 51 C 60 D 47 NotMet 54.9 50 56 45 44Henderson County Schools 450324 Etowah Elementary 8 B 73 B 77 C 69 NotMet 66.0 74 77 72 76Henderson County Schools 450328 Flat Rock Middle 8 B 70 C 66 C 65 Exceeded 91.8 64 62 59 84 >95Henderson County Schools 450332 Fletcher Elementary 8 C 65 C 65 C 63 NotMet 59.3 66 65 65 73Henderson County Schools 450333 Hendersonville Elementary 8 C 69 C 68 C 68 NotMet 65.0 70 70 67 81Henderson County Schools 450334 Hendersonville High 8 B 82 Met 84.0 81 61 69 79 85 75 >95Henderson County Schools 450335 Hendersonville Middle 8 B 75 B 76 C 64 Exceeded 94.4 70 73 58 90 >95Henderson County Schools 450336 Hillandale Elementary 8 C 67 C 64 C 65 Exceeded 88.1 62 59 59 78Henderson County Schools 450339 Glenn C Marlow Elementary 8 A 85 B 81 A 88 Exceeded 86.8 85 81 89 88Henderson County Schools 450340 Mills River Elementary 8 B 73 B 70 B 75 Met 82.7 71 68 72 77Henderson County Schools 450341 North Henderson High 8 B 75 Exceeded 94.4 70 56 58 67 62 76 >95Henderson County Schools 450342 Rugby Middle 8 B 77 B 77 C 67 Exceeded 90.9 73 75 64 89 >95
NCDPI/Division of Accountability Services 25 of 116 February 5, 2015

Henderson County Schools 450343 Balfour Education Center 8 N/A N/A N/AHenderson County Schools 450344 Sugarloaf Elementary 8 C 58 C 59 C 57 Met 80.2 52 54 51 52Henderson County Schools 450346 Upward Elementary 8 D 50 D 48 D 48 NotMet 59.4 48 42 46 66Henderson County Schools 450352 West Henderson High 8 B 74 NotMet 61.8 78 65 71 68 73 85 >95Henderson County Schools 450354 Henderson County Early College 8 A 92 Exceeded 89.8 93 95 90 93 92 >95Hertford County Schools 460308 Ahoskie Elementary 1 F 39 D 42 D 43 NotMet 62.0 33 35 34 29Hertford County Schools 460312 Bearfield Primary 1 D 46 D 50 F 32 Met 80.6 38 43 32Hertford County Schools 460318 Hertford County Middle 1 F 36 F 38 F 23 NotMet 56.0 31 32 15 59 46Hertford County Schools 460320 Hertford County High 1 C 60 Exceeded 93.2 52 17 37 52 30 63 >95Hertford County Schools 460322 Hertford Co Early College 1 B 84 Exceeded 90.4 82 58 64 86 95 >95Hertford County Schools 460332 Riverview Elementary 1 D 46 D 44 D 45 Met 77.7 38 36 36 50Hertford County Schools 460340 CS Brown High 1 C 69 Met 81.3 66 52 80 >95Hoke County Schools 470310 Don D Steed Elementary 4 C 58 C 61 D 53 NotMet 55.9 58 57 54 83Hoke County Schools 470312 Hoke County High 4 C 62 Exceeded 85.7 56 42 49 40 39 58 >95Hoke County Schools 470316 J W McLauchlin Elementary 4 D 48 D 45 D 46 Met 80.1 41 35 40 58Hoke County Schools 470320 West Hoke Middle 4 D 44 D 47 F 33 Met 76.2 36 38 24 64 32Hoke County Schools 470328 Scurlock Elementary 4 F 37 D 40 D 40 NotMet 59.3 32 31 35 24Hoke County Schools 470330 Hawk Eye Elementary 4 D 43 F 38 D 44 Met 80.0 34 28 36 51Hoke County Schools 470332 East Hoke Middle 4 D 48 D 53 F 35 NotMet 67.0 43 48 28 73 59Hoke County Schools 470336 West Hoke Elementary 4 D 40 D 43 F 36 Met 75.6 32 34 28 35Hoke County Schools 470340 Rockfish Hoke Elementary 4 C 67 C 61 C 65 Met 77.0 65 57 66 86Hoke County Schools 470342 J W Turlington School 4 N/A N/A N/AHoke County Schools 470346 Upchurch Elementary 4 C 57 D 52 C 55 Met 77.5 51 45 52 69Hoke County Schools 470441 Sandy Grove Elementary 4 D 52 D 54 D 50 Met 79.0 45 47 44 47Hoke County Schools 470442 Sandy Grove Middle 4 C 58 C 57 D 49 Exceeded 97.9 48 48 37 78 >95Hoke County Schools 470443 SandHoke Early College High 4 B 73 NotMet 68.4 74 58 73 62 80 >95Hyde County Schools 480306 Mattamuskeet Elementary 1 C 57 C 59 C 56 Met 80.3 52 53 51 50Hyde County Schools 480316 Ocracoke School 1 A 86 B 80 A 86 Exceeded 86.8 86 80 86 88 75 91 90 >95 >95Hyde County Schools 480318 Mattamuskeet Early College High 1 D 45 D 46 F 36 NotMet 65.0 40 38 24 43 39 31 5 39 50 95Iredell-Statesville Schools 490308 Brawley Middle 7 B 74 B 72 C 68 Exceeded 86.6 71 71 63 86 >95Iredell-Statesville Schools 490310 Career Academy and Technical School 7 B 80 80 >95Iredell-Statesville Schools 490312 Celeste Henkel Elementary 7 C 63 C 63 C 61 Met 83.7 58 58 55 69Iredell-Statesville Schools 490316 Central Elementary 7 B 75 B 71 B 75 Exceeded 88.2 72 68 72 82Iredell-Statesville Schools 490318 Coddle Creek Elementary 7 B 72 B 71 B 70 Met 77.6 70 69 69 74Iredell-Statesville Schools 490319 Cloverleaf Elementary 7 D 52 D 51 D 50 Exceeded 87.0 43 43 40 53Iredell-Statesville Schools 490320 Collaborative College for Technology 7 A 86 Met 83.6 87 78 91 77 81 >95Iredell-Statesville Schools 490324 Cool Spring Elementary 7 B 74 C 66 B 75 Met 83.0 72 65 73 89Iredell-Statesville Schools 490326 East Iredell Elementary 7 D 46 D 45 D 47 Met 81.9 37 36 37 38Iredell-Statesville Schools 490327 East Iredell Middle 7 D 52 D 44 D 42 Exceeded 88.1 43 37 31 82 95Iredell-Statesville Schools 490332 Harmony Elementary 7 C 55 D 54 C 56 NotMet 65.0 52 52 51 58Iredell-Statesville Schools 490335 Lake Norman High 7 B 83 Met 82.3 83 70 84 69 82 74 >95Iredell-Statesville Schools 490336 Lake Norman Elementary 7 B 77 B 73 B 77 Met 81.1 76 72 76 84Iredell-Statesville Schools 490337 Lakeshore Elementary 7 B 70 C 69 B 71 Met 80.1 68 68 67 70Iredell-Statesville Schools 490338 Lakeshore Middle 7 C 69 C 63 C 65 Met 76.4 67 62 64 81 >95Iredell-Statesville Schools 490342 Monticello School 7 N/A N/A N/A
NCDPI/Division of Accountability Services 26 of 116 February 5, 2015

Iredell-Statesville Schools 490344 Mount Mourne School 7 A 93 A 94 A 89 Met 83.4 95 >95 91 >95 >95Iredell-Statesville Schools 490345 N B Mills Elementary 7 F 39 F 39 D 42 NotMet 58.9 34 32 36 35Iredell-Statesville Schools 490346 North Iredell High 7 C 59 NotMet 50.0 61 45 47 49 50 56 >95Iredell-Statesville Schools 490347 Northview School 7 A 89 A 89 B 82 Exceeded 89.0 89 90 82 >95 >95Iredell-Statesville Schools 490348 Scotts Elementary 7 D 50 D 51 C 55 NotMet 59.1 48 47 53 34Iredell-Statesville Schools 490349 North Iredell Middle 7 C 58 C 59 D 47 Met 79.1 53 55 39 80 >95Iredell-Statesville Schools 490350 Pressly School 7 N/A N/A N/AIredell-Statesville Schools 490352 Statesville Middle 7 F 38 D 47 F 23 Met 80.1 28 36 11 44 79Iredell-Statesville Schools 490354 Statesville High 7 C 56 NotMet 58.5 56 34 52 31 45 60 >95Iredell-Statesville Schools 490355 Visual and Performing Arts Center 7 B 79 Met 75.9 80 67 80 65 79 >95Iredell-Statesville Schools 490356 Sharon Elementary 7 B 70 C 66 B 72 Met 81.2 67 62 69 76Iredell-Statesville Schools 490360 Shepherd Elementary 7 B 72 B 71 B 71 Met 80.1 70 70 68 78Iredell-Statesville Schools 490362 South Iredell High 7 B 73 NotMet 67.5 75 74 71 63 65 73 95Iredell-Statesville Schools 490363 Third Creek Elementary 7 D 52 D 46 D 51 Met 84.4 44 40 41 63Iredell-Statesville Schools 490364 Troutman Elementary 7 C 60 D 54 C 59 Met 82.1 55 49 54 72Iredell-Statesville Schools 490366 Troutman Middle 7 C 58 C 65 D 53 NotMet 66.9 56 61 47 58 93Iredell-Statesville Schools 490368 Union Grove Elementary 7 C 64 C 65 C 60 Met 81.8 60 60 57 67Iredell-Statesville Schools 490380 West Iredell High 7 C 58 NotMet 55.2 58 32 54 43 45 60 >95Iredell-Statesville Schools 490384 West Iredell Middle 7 D 47 D 51 F 34 NotMet 66.3 43 47 27 72 95Iredell-Statesville Schools 490390 Woodland Heights Elementary 7 B 81 B 84 B 75 Met 76.0 82 83 79 87Mooresville City Schools 491303 East Mooresville Intermediate 7 B 73 B 71 B 71 Met 84.1 70 67 70 80Mooresville City Schools 491305 NF Woods Adv Tech and Arts Center 7 IMooresville City Schools 491306 Mooresville Intermediate 7 B 71 C 69 B 71 Exceeded 90.1 67 64 67 73Mooresville City Schools 491308 Mooresville Middle 7 B 71 B 70 C 60 Met 80.6 69 67 60 84 >95Mooresville City Schools 491312 Mooresville Senior High 7 B 81 Exceeded 90.8 78 66 68 80 75 78 >95Mooresville City Schools 491316 Park View Elementary 7 A 89 A 86 A 90 Exceeded 94.2 87 85 90Mooresville City Schools 491318 Rocky River Elementary 7 B 83 B 80 A 87 Met 83.2 83 80 87Mooresville City Schools 491320 South Elementary 7 B 84 B 80 A 88 Exceeded 89.2 83 78 88Jackson County Schools 500302 Blue Ridge Early College 8 D 53 C 55 F 28 NotMet 57.9 51 51 20 65 45 50 49 30 40 >95Jackson County Schools 500304 Cullowhee Valley School 8 C 61 C 57 C 59 Met 82.2 55 55 50 66 >95Jackson County Schools 500314 Fairview Elementary 8 C 68 C 67 C 59 Exceeded 88.1 63 64 53 83 >95Jackson County Schools 500316 Blue Ridge School 8 D 51 D 52 D 46 Met 80.5 43 44 38 56Jackson County Schools 500323 Jackson Co Early College 8 A 87 Met 81.7 89 74 80 86 94 >95Jackson County Schools 500324 Jackson Co Sch of Alternatives 8 N/A N/A N/AJackson County Schools 500332 Scotts Creek Elementary 8 C 62 C 64 C 56 Met 80.3 57 61 48 66 >95Jackson County Schools 500337 Smokey Mountain Elementary 8 D 51 D 54 D 45 Met 83.9 43 47 35 61Jackson County Schools 500340 Smoky Mountain High 8 C 65 NotMet 62.7 66 48 63 56 53 67 >95Johnston County Schools 510308 Benson Elementary 3 C 61 C 59 C 62 Exceeded 87.9 54 55 54Johnston County Schools 510310 Benson Middle 3 C 55 D 54 D 45 Exceeded 87.5 47 46 35 68 74Johnston County Schools 510324 Clayton High 3 C 66 NotMet 57.6 68 48 67 57 59 71 >95Johnston County Schools 510326 West Clayton Elementary 3 C 59 C 64 C 57 NotMet 68.2 57 59 55 59Johnston County Schools 510327 Cleveland High 3 B 78 Exceeded 91.6 75 70 70 63 61 83 >95Johnston County Schools 510328 Cleveland Elementary 3 B 80 B 77 B 80 Exceeded 85.6 78 76 78 83Johnston County Schools 510329 Cleveland Middle 3 B 79 B 79 B 70 Exceeded 100.0 74 76 63 94 >95Johnston County Schools 510330 Cooper Elementary 3 D 51 C 55 D 51 NotMet 55.6 49 50 50 48
NCDPI/Division of Accountability Services 27 of 116 February 5, 2015

Johnston County Schools 510332 Corinth-Holders Elementary 3 C 57 C 55 C 60 Exceeded 90.5 49 46 52 47Johnston County Schools 510333 Corinth Holders High 3 B 74 Met 79.5 72 58 70 61 68 79 >95Johnston County Schools 510334 Dixon Road Elementary 3 C 64 C 60 C 63 Exceeded 85.1 59 55 57 72Johnston County Schools 510336 East Clayton Elementary 3 B 73 B 74 B 70 Exceeded 92.1 69 70 65 75Johnston County Schools 510340 Four Oaks Elementary 3 D 54 D 54 D 52 Met 71.0 49 50 45 58Johnston County Schools 510342 Four Oaks Middle 3 C 59 C 63 D 44 Exceeded 85.9 53 57 36 77 94Johnston County Schools 510344 North Johnston Middle 3 C 59 C 63 D 43 Exceeded 89.6 51 56 34 77 >95Johnston County Schools 510356 Glendale-Kenly Elementary 3 C 58 C 56 C 61 NotMet 63.7 57 53 59 61Johnston County Schools 510357 Johnston Co Middle College 3 A 95 95 75 91 >95Johnston County Schools 510358 McGee's Crossroads Elem 3 C 64 C 64 C 66 Met 79.6 60 62 60 54Johnston County Schools 510359 McGee's Crossroads Middle 3 C 67 C 68 C 55 Exceeded 92.4 61 63 47 86 >95Johnston County Schools 510360 Meadow School 3 C 58 C 57 D 53 Met 78.7 52 53 46 70 83Johnston County Schools 510364 Archer Lodge Middle 3 C 61 B 70 D 46 Met 70.7 59 65 43 83 78Johnston County Schools 510367 Johnston Co Early College Academy 3 A 91 Exceeded 89.4 91 83 90 79 >95 >95Johnston County Schools 510368 North Johnston High 3 B 71 Exceeded 86.7 68 58 52 55 62 84 93Johnston County Schools 510372 Micro-Pine Level Elementary 3 C 56 D 51 C 59 Met 83.7 49 45 52 53Johnston County Schools 510373 Powhatan Elementary 3 B 81 B 79 B 81 Exceeded 90.2 78 78 79 79Johnston County Schools 510374 Princeton Elementary 3 C 68 C 60 B 72 Exceeded 87.1 63 56 68 71Johnston County Schools 510376 Princeton High 3 B 70 C 63 D 54 Exceeded 91.2 65 59 47 88 60 73 62 58 77 >95Johnston County Schools 510377 River Dell Elementary 3 B 77 B 75 B 76 Exceeded 85.8 75 73 74 87Johnston County Schools 510378 Riverwood Elementary 3 B 73 B 74 B 73 Met 71.6 73 73 72 77Johnston County Schools 510379 Riverwood Middle 3 B 76 B 78 C 63 Exceeded 100.0 70 74 55 91 >95Johnston County Schools 510380 South Campus Community High 3 N/A N/A N/AJohnston County Schools 510381 South Campus Community Middle 3 N/A N/A N/AJohnston County Schools 510388 Selma Elementary 3 D 41 D 45 F 39 Met 73.8 33 35 32 33Johnston County Schools 510390 Selma Middle School 3 D 42 D 45 F 35 Met 74.6 33 39 23 41 >95Johnston County Schools 510396 West Smithfield Elementary 3 D 43 F 38 F 39 Exceeded 87.6 32 27 27 58Johnston County Schools 510397 Smithfield Middle 3 D 49 D 52 D 40 Met 75.2 42 45 32 59 >95Johnston County Schools 510399 Smithfield-Selma High 3 D 53 NotMet 52.3 53 39 44 33 33 54 90Johnston County Schools 510402 South Johnston High 3 C 63 NotMet 62.0 64 50 53 50 43 60 >95Johnston County Schools 510404 South Smithfield Elementary 3 D 51 D 54 D 49 Met 80.7 44 47 41 44Johnston County Schools 510406 West Johnston High 3 C 66 NotMet 59.2 68 53 68 51 65 75 >95Johnston County Schools 510408 Wilson's Mills Elementary 3 C 67 C 58 C 65 Exceeded 100.0 58 49 57 87Johnston County Schools 510410 Polenta Elementary 3 C 63 C 64 C 63 Exceeded 87.9 57 58 56 58Johnston County Schools 510412 Clayton Middle 3 C 61 C 66 D 52 Met 77.3 57 63 45 72 89Johnston County Schools 510414 West View Elementary 3 B 72 B 70 C 69 Met 82.1 69 68 66 80Jones County Schools 520304 Pollocksville Elementary 2 D 45 D 50 D 40 Met 82.8 36 42 29 36Jones County Schools 520308 Comfort Elementary 2 D 54 C 59 D 49 Met 83.4 46 53 40 44Jones County Schools 520320 Jones Senior High 2 C 66 Met 75.4 64 57 54 44 61 47 >95Jones County Schools 520324 Jones Middle 2 C 65 C 66 C 60 Exceeded 89.3 59 61 52 55 >95Jones County Schools 520328 Maysville Elementary 2 C 66 B 71 C 59 Exceeded 86.5 61 68 52 71Jones County Schools 520336 Trenton Elementary 2 C 59 C 63 C 57 Exceeded 92.0 51 56 48 44Lee County Schools 530302 Benjamin T Bullock Elem 4 C 60 C 58 C 59 Exceeded 85.5 53 52 53 59Lee County Schools 530306 Bragg Street Academy 4 N/A N/A N/ALee County Schools 530308 Broadway Elementary 4 D 53 D 52 C 56 Met 84.3 45 44 48 41
NCDPI/Division of Accountability Services 28 of 116 February 5, 2015

Lee County Schools 530312 Deep River Elementary 4 D 53 D 50 D 54 Met 72.0 48 45 49 56Lee County Schools 530314 East Lee Middle 4 D 45 D 53 D 41 NotMet 52.2 44 46 37 48 60Lee County Schools 530316 Floyd L Knight Children Center 4 N/A N/A N/ALee County Schools 530320 Greenwood Elementary 4 C 57 C 56 C 57 Met 83.6 51 49 50 56Lee County Schools 530335 Lee Early College 4 B 75 NotMet 58.3 80 67 69 67 91 >95Lee County Schools 530336 Lee County High 4 C 56 NotMet 50.0 57 37 49 40 44 57 >95Lee County Schools 530340 J Glenn Edwards Elementary 4 C 60 D 50 C 66 Met 80.5 55 46 61 66Lee County Schools 530341 SanLee Middle School 4 D 53 D 53 C 56 NotMet 57.8 52 49 51 55 66Lee County Schools 530343 Southern Lee High School 4 C 58 NotMet 50.0 59 44 46 41 47 67 >95Lee County Schools 530346 Tramway Elementary 4 B 72 B 71 B 73 Met 82.4 69 69 70 67Lee County Schools 530354 J R Ingram Jr Elementary 4 C 61 C 55 C 63 Met 74.8 57 53 58 63Lee County Schools 530356 West Lee Middle 4 D 49 C 56 D 40 NotMet 50.5 48 51 38 63 57Lee County Schools 530358 Warren Williams Elementary Alternative 4 N/A N/A N/ALenoir County Public Schools 540304 Banks Elementary 2 B 70 C 66 C 69 Met 71.0 70 66 68 85Lenoir County Public Schools 540308 Contentnea-Savannah School 2 D 54 C 56 D 47 Met 81.7 47 50 37 63 87Lenoir County Public Schools 540312 E B Frink Middle 2 D 50 C 59 F 35 NotMet 56.3 48 54 31 75 88Lenoir County Public Schools 540315 Kinston High 2 D 49 NotMet 59.0 46 23 39 26 27 26 94Lenoir County Public Schools 540316 La Grange Elementary 2 C 56 C 57 C 55 Exceeded 88.7 48 50 47 47Lenoir County Public Schools 540317 Lenoir County Early College High 2 B 79 Met 82.3 78 56 76 81 >95Lenoir County Public Schools 540318 Lenoir County Learning Academy 2 N/A N/A N/ALenoir County Public Schools 540320 Moss Hill Elementary 2 C 58 C 60 C 59 NotMet 65.4 56 56 56 52Lenoir County Public Schools 540324 North Lenoir High 2 D 50 NotMet 50.0 50 30 46 33 46 49 89Lenoir County Public Schools 540325 Northeast Elementary 2 D 43 D 43 D 41 Met 75.8 34 33 34 39Lenoir County Public Schools 540326 Northwest Elementary 2 D 49 D 50 D 45 Met 82.4 40 42 36 47Lenoir County Public Schools 540328 Pink Hill Elementary 2 D 51 D 51 D 44 Exceeded 86.4 42 42 35 66Lenoir County Public Schools 540330 Rochelle Middle 2 F 32 D 40 F 23 NotMet 67.1 23 30 11 37 77Lenoir County Public Schools 540336 South Lenoir High 2 C 60 NotMet 53.3 62 45 54 36 55 72 >95Lenoir County Public Schools 540338 Southeast Elementary 2 F 30 F 35 F 26 Met 79.1 18 23 12 18Lenoir County Public Schools 540340 Southwood Elementary 2 C 61 C 57 C 59 Exceeded 87.8 54 51 52 70Lenoir County Public Schools 540344 Woodington Middle 2 D 48 C 61 F 34 NotMet 51.7 47 57 31 57 91Lincoln County Schools 550308 Asbury School 6 N/A N/A N/ALincoln County Schools 550312 Battleground Elementary 6 D 50 D 50 D 46 NotMet 67.2 46 46 46Lincoln County Schools 550314 Catawba Springs Elementary 6 B 81 B 82 B 77 Exceeded 91.3 78 81 74 80Lincoln County Schools 550316 GE Massey Elementary 6 C 60 C 60 C 55 Met 81.9 55 55 55Lincoln County Schools 550320 East Lincoln High 6 C 69 NotMet 56.7 72 63 70 50 68 80 94Lincoln County Schools 550322 East Lincoln Middle 6 C 66 C 66 C 62 NotMet 62.9 67 66 60 85 >95Lincoln County Schools 550324 Kiser Intermediate 6 D 52 D 50 D 48 NotMet 58.5 51 46 46 68Lincoln County Schools 550328 Iron Station Elementary 6 B 74 C 68 B 73 Exceeded 89.0 70 66 69 89Lincoln County Schools 550330 LCST 6 ILincoln County Schools 550332 Lincolnton High 6 C 66 NotMet 65.2 66 43 52 54 64 73 >95Lincoln County Schools 550334 Lincolnton Middle 6 C 60 C 60 D 48 Exceeded 89.9 52 54 39 76 >95Lincoln County Schools 550336 Love Memorial Elementary 6 C 67 C 68 C 60 Exceeded 91.8 60 64 52 76Lincoln County Schools 550340 Childers Elementary 6 B 78 B 72 B 76 Exceeded 89.7 75 68 75 91Lincoln County Schools 550342 North Brook Elementary 6 C 69 C 65 C 68 Met 80.1 66 64 64 74Lincoln County Schools 550344 North Lincoln High 6 B 80 Met 80.0 80 77 72 68 75 68 >95
NCDPI/Division of Accountability Services 29 of 116 February 5, 2015
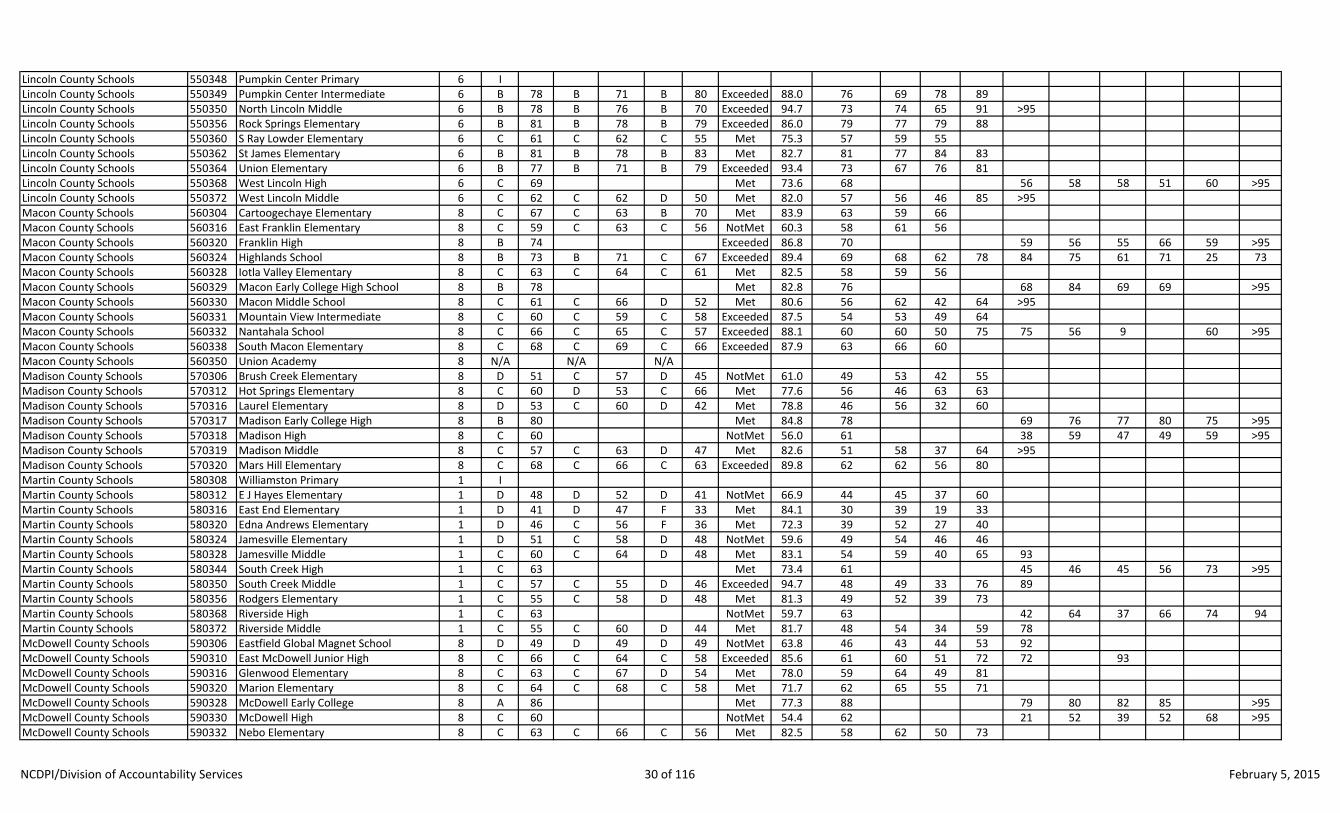
Lincoln County Schools 550348 Pumpkin Center Primary 6 ILincoln County Schools 550349 Pumpkin Center Intermediate 6 B 78 B 71 B 80 Exceeded 88.0 76 69 78 89Lincoln County Schools 550350 North Lincoln Middle 6 B 78 B 76 B 70 Exceeded 94.7 73 74 65 91 >95Lincoln County Schools 550356 Rock Springs Elementary 6 B 81 B 78 B 79 Exceeded 86.0 79 77 79 88Lincoln County Schools 550360 S Ray Lowder Elementary 6 C 61 C 62 C 55 Met 75.3 57 59 55Lincoln County Schools 550362 St James Elementary 6 B 81 B 78 B 83 Met 82.7 81 77 84 83Lincoln County Schools 550364 Union Elementary 6 B 77 B 71 B 79 Exceeded 93.4 73 67 76 81Lincoln County Schools 550368 West Lincoln High 6 C 69 Met 73.6 68 56 58 58 51 60 >95Lincoln County Schools 550372 West Lincoln Middle 6 C 62 C 62 D 50 Met 82.0 57 56 46 85 >95Macon County Schools 560304 Cartoogechaye Elementary 8 C 67 C 63 B 70 Met 83.9 63 59 66Macon County Schools 560316 East Franklin Elementary 8 C 59 C 63 C 56 NotMet 60.3 58 61 56Macon County Schools 560320 Franklin High 8 B 74 Exceeded 86.8 70 59 56 55 66 59 >95Macon County Schools 560324 Highlands School 8 B 73 B 71 C 67 Exceeded 89.4 69 68 62 78 84 75 61 71 25 73Macon County Schools 560328 Iotla Valley Elementary 8 C 63 C 64 C 61 Met 82.5 58 59 56Macon County Schools 560329 Macon Early College High School 8 B 78 Met 82.8 76 68 84 69 69 >95Macon County Schools 560330 Macon Middle School 8 C 61 C 66 D 52 Met 80.6 56 62 42 64 >95Macon County Schools 560331 Mountain View Intermediate 8 C 60 C 59 C 58 Exceeded 87.5 54 53 49 64Macon County Schools 560332 Nantahala School 8 C 66 C 65 C 57 Exceeded 88.1 60 60 50 75 75 56 9 60 >95Macon County Schools 560338 South Macon Elementary 8 C 68 C 69 C 66 Exceeded 87.9 63 66 60Macon County Schools 560350 Union Academy 8 N/A N/A N/AMadison County Schools 570306 Brush Creek Elementary 8 D 51 C 57 D 45 NotMet 61.0 49 53 42 55Madison County Schools 570312 Hot Springs Elementary 8 C 60 D 53 C 66 Met 77.6 56 46 63 63Madison County Schools 570316 Laurel Elementary 8 D 53 C 60 D 42 Met 78.8 46 56 32 60Madison County Schools 570317 Madison Early College High 8 B 80 Met 84.8 78 69 76 77 80 75 >95Madison County Schools 570318 Madison High 8 C 60 NotMet 56.0 61 38 59 47 49 59 >95Madison County Schools 570319 Madison Middle 8 C 57 C 63 D 47 Met 82.6 51 58 37 64 >95Madison County Schools 570320 Mars Hill Elementary 8 C 68 C 66 C 63 Exceeded 89.8 62 62 56 80Martin County Schools 580308 Williamston Primary 1 IMartin County Schools 580312 E J Hayes Elementary 1 D 48 D 52 D 41 NotMet 66.9 44 45 37 60Martin County Schools 580316 East End Elementary 1 D 41 D 47 F 33 Met 84.1 30 39 19 33Martin County Schools 580320 Edna Andrews Elementary 1 D 46 C 56 F 36 Met 72.3 39 52 27 40Martin County Schools 580324 Jamesville Elementary 1 D 51 C 58 D 48 NotMet 59.6 49 54 46 46Martin County Schools 580328 Jamesville Middle 1 C 60 C 64 D 48 Met 83.1 54 59 40 65 93Martin County Schools 580344 South Creek High 1 C 63 Met 73.4 61 45 46 45 56 73 >95Martin County Schools 580350 South Creek Middle 1 C 57 C 55 D 46 Exceeded 94.7 48 49 33 76 89Martin County Schools 580356 Rodgers Elementary 1 C 55 C 58 D 48 Met 81.3 49 52 39 73Martin County Schools 580368 Riverside High 1 C 63 NotMet 59.7 63 42 64 37 66 74 94Martin County Schools 580372 Riverside Middle 1 C 55 C 60 D 44 Met 81.7 48 54 34 59 78McDowell County Schools 590306 Eastfield Global Magnet School 8 D 49 D 49 D 49 NotMet 63.8 46 43 44 53 92McDowell County Schools 590310 East McDowell Junior High 8 C 66 C 64 C 58 Exceeded 85.6 61 60 51 72 72 93McDowell County Schools 590316 Glenwood Elementary 8 C 63 C 67 D 54 Met 78.0 59 64 49 81McDowell County Schools 590320 Marion Elementary 8 C 64 C 68 C 58 Met 71.7 62 65 55 71McDowell County Schools 590328 McDowell Early College 8 A 86 Met 77.3 88 79 80 82 85 >95McDowell County Schools 590330 McDowell High 8 C 60 NotMet 54.4 62 21 52 39 52 68 >95McDowell County Schools 590332 Nebo Elementary 8 C 63 C 66 C 56 Met 82.5 58 62 50 73
NCDPI/Division of Accountability Services 30 of 116 February 5, 2015
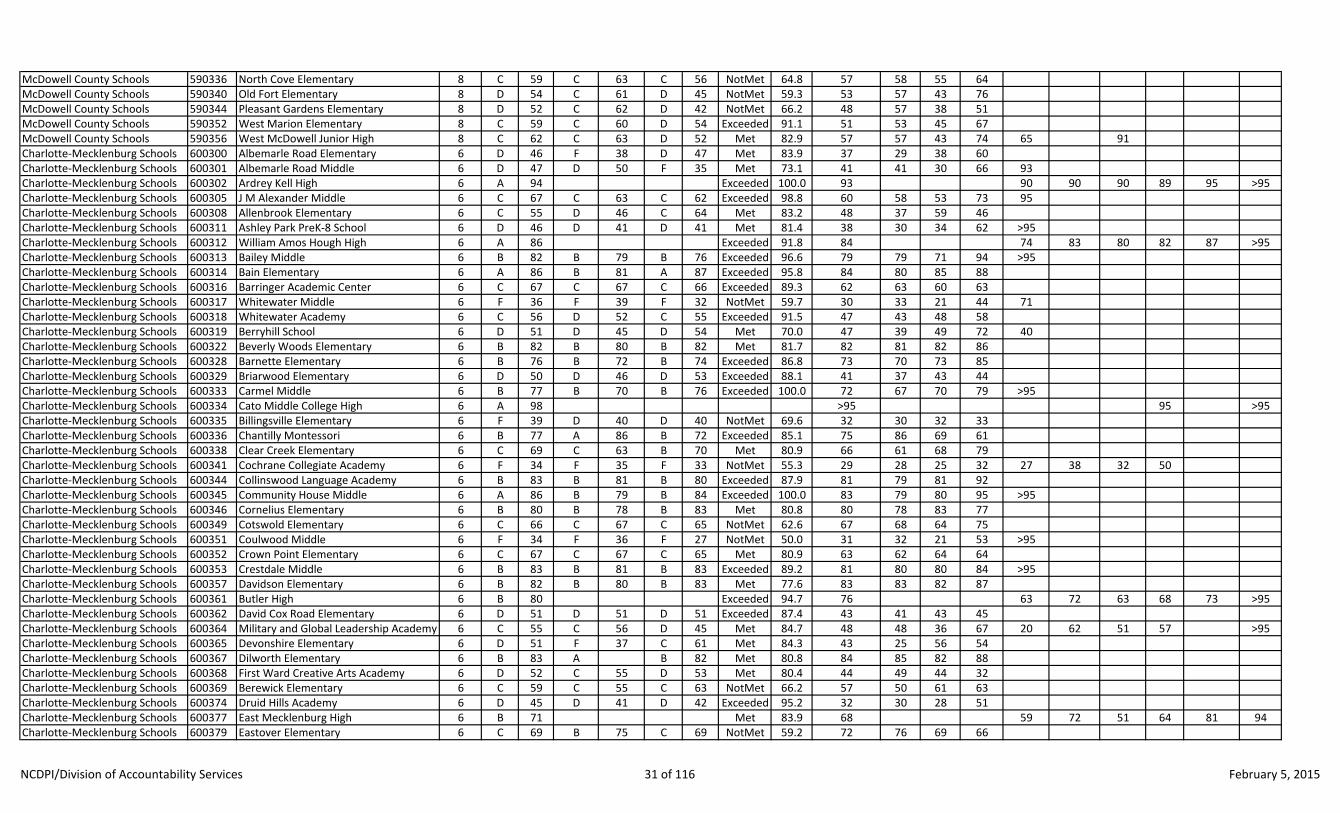
McDowell County Schools 590336 North Cove Elementary 8 C 59 C 63 C 56 NotMet 64.8 57 58 55 64McDowell County Schools 590340 Old Fort Elementary 8 D 54 C 61 D 45 NotMet 59.3 53 57 43 76McDowell County Schools 590344 Pleasant Gardens Elementary 8 D 52 C 62 D 42 NotMet 66.2 48 57 38 51McDowell County Schools 590352 West Marion Elementary 8 C 59 C 60 D 54 Exceeded 91.1 51 53 45 67McDowell County Schools 590356 West McDowell Junior High 8 C 62 C 63 D 52 Met 82.9 57 57 43 74 65 91Charlotte-Mecklenburg Schools 600300 Albemarle Road Elementary 6 D 46 F 38 D 47 Met 83.9 37 29 38 60Charlotte-Mecklenburg Schools 600301 Albemarle Road Middle 6 D 47 D 50 F 35 Met 73.1 41 41 30 66 93Charlotte-Mecklenburg Schools 600302 Ardrey Kell High 6 A 94 Exceeded 100.0 93 90 90 90 89 95 >95Charlotte-Mecklenburg Schools 600305 J M Alexander Middle 6 C 67 C 63 C 62 Exceeded 98.8 60 58 53 73 95Charlotte-Mecklenburg Schools 600308 Allenbrook Elementary 6 C 55 D 46 C 64 Met 83.2 48 37 59 46Charlotte-Mecklenburg Schools 600311 Ashley Park PreK-8 School 6 D 46 D 41 D 41 Met 81.4 38 30 34 62 >95Charlotte-Mecklenburg Schools 600312 William Amos Hough High 6 A 86 Exceeded 91.8 84 74 83 80 82 87 >95Charlotte-Mecklenburg Schools 600313 Bailey Middle 6 B 82 B 79 B 76 Exceeded 96.6 79 79 71 94 >95Charlotte-Mecklenburg Schools 600314 Bain Elementary 6 A 86 B 81 A 87 Exceeded 95.8 84 80 85 88Charlotte-Mecklenburg Schools 600316 Barringer Academic Center 6 C 67 C 67 C 66 Exceeded 89.3 62 63 60 63Charlotte-Mecklenburg Schools 600317 Whitewater Middle 6 F 36 F 39 F 32 NotMet 59.7 30 33 21 44 71Charlotte-Mecklenburg Schools 600318 Whitewater Academy 6 C 56 D 52 C 55 Exceeded 91.5 47 43 48 58Charlotte-Mecklenburg Schools 600319 Berryhill School 6 D 51 D 45 D 54 Met 70.0 47 39 49 72 40Charlotte-Mecklenburg Schools 600322 Beverly Woods Elementary 6 B 82 B 80 B 82 Met 81.7 82 81 82 86Charlotte-Mecklenburg Schools 600328 Barnette Elementary 6 B 76 B 72 B 74 Exceeded 86.8 73 70 73 85Charlotte-Mecklenburg Schools 600329 Briarwood Elementary 6 D 50 D 46 D 53 Exceeded 88.1 41 37 43 44Charlotte-Mecklenburg Schools 600333 Carmel Middle 6 B 77 B 70 B 76 Exceeded 100.0 72 67 70 79 >95Charlotte-Mecklenburg Schools 600334 Cato Middle College High 6 A 98 >95 95 >95Charlotte-Mecklenburg Schools 600335 Billingsville Elementary 6 F 39 D 40 D 40 NotMet 69.6 32 30 32 33Charlotte-Mecklenburg Schools 600336 Chantilly Montessori 6 B 77 A 86 B 72 Exceeded 85.1 75 86 69 61Charlotte-Mecklenburg Schools 600338 Clear Creek Elementary 6 C 69 C 63 B 70 Met 80.9 66 61 68 79Charlotte-Mecklenburg Schools 600341 Cochrane Collegiate Academy 6 F 34 F 35 F 33 NotMet 55.3 29 28 25 32 27 38 32 50Charlotte-Mecklenburg Schools 600344 Collinswood Language Academy 6 B 83 B 81 B 80 Exceeded 87.9 81 79 81 92Charlotte-Mecklenburg Schools 600345 Community House Middle 6 A 86 B 79 B 84 Exceeded 100.0 83 79 80 95 >95Charlotte-Mecklenburg Schools 600346 Cornelius Elementary 6 B 80 B 78 B 83 Met 80.8 80 78 83 77Charlotte-Mecklenburg Schools 600349 Cotswold Elementary 6 C 66 C 67 C 65 NotMet 62.6 67 68 64 75Charlotte-Mecklenburg Schools 600351 Coulwood Middle 6 F 34 F 36 F 27 NotMet 50.0 31 32 21 53 >95Charlotte-Mecklenburg Schools 600352 Crown Point Elementary 6 C 67 C 67 C 65 Met 80.9 63 62 64 64Charlotte-Mecklenburg Schools 600353 Crestdale Middle 6 B 83 B 81 B 83 Exceeded 89.2 81 80 80 84 >95Charlotte-Mecklenburg Schools 600357 Davidson Elementary 6 B 82 B 80 B 83 Met 77.6 83 83 82 87Charlotte-Mecklenburg Schools 600361 Butler High 6 B 80 Exceeded 94.7 76 63 72 63 68 73 >95Charlotte-Mecklenburg Schools 600362 David Cox Road Elementary 6 D 51 D 51 D 51 Exceeded 87.4 43 41 43 45Charlotte-Mecklenburg Schools 600364 Military and Global Leadership Academy 6 C 55 C 56 D 45 Met 84.7 48 48 36 67 20 62 51 57 >95Charlotte-Mecklenburg Schools 600365 Devonshire Elementary 6 D 51 F 37 C 61 Met 84.3 43 25 56 54Charlotte-Mecklenburg Schools 600367 Dilworth Elementary 6 B 83 A B 82 Met 80.8 84 85 82 88Charlotte-Mecklenburg Schools 600368 First Ward Creative Arts Academy 6 D 52 C 55 D 53 Met 80.4 44 49 44 32Charlotte-Mecklenburg Schools 600369 Berewick Elementary 6 C 59 C 55 C 63 NotMet 66.2 57 50 61 63Charlotte-Mecklenburg Schools 600374 Druid Hills Academy 6 D 45 D 41 D 42 Exceeded 95.2 32 30 28 51Charlotte-Mecklenburg Schools 600377 East Mecklenburg High 6 B 71 Met 83.9 68 59 72 51 64 81 94Charlotte-Mecklenburg Schools 600379 Eastover Elementary 6 C 69 B 75 C 69 NotMet 59.2 72 76 69 66
NCDPI/Division of Accountability Services 31 of 116 February 5, 2015

Charlotte-Mecklenburg Schools 600381 Eastway Middle 6 F 39 F 39 F 39 NotMet 65.8 33 30 31 45 70Charlotte-Mecklenburg Schools 600382 Elizabeth Lane Elementary 6 A 85 A A Met 82.4 85 85 85 88Charlotte-Mecklenburg Schools 600383 Elon Park Elementary 6 B 83 B 81 A 86 Met 75.9 84 81 88 86Charlotte-Mecklenburg Schools 600384 Elizabeth Traditional Elementary 6 B 73 B 73 B 71 Met 75.3 73 73 70 83Charlotte-Mecklenburg Schools 600385 Endhaven Elementary 6 B 77 B 76 B 76 Exceeded 91.0 74 73 73 80Charlotte-Mecklenburg Schools 600386 Hawthorne High 6 D 51 Met 81.5 44 59 16 10 5 >95Charlotte-Mecklenburg Schools 600392 Polo Ridge Elementary 6 A 87 B 83 A 88 Met 83.1 88 84 90 95Charlotte-Mecklenburg Schools 600394 Francis Bradley Middle 6 B 73 B 71 C 69 Exceeded 94.0 68 66 63 81 >95Charlotte-Mecklenburg Schools 600397 Garinger High 6 C 59 Exceeded 93.3 51 28 31 41 19 67 88Charlotte-Mecklenburg Schools 600398 Greenway Park Elementary 6 C 58 D 52 C 59 Exceeded 90.2 50 46 50 59Charlotte-Mecklenburg Schools 600399 Alexander Graham Middle 6 B 77 B 72 B 71 Exceeded 98.9 71 69 65 85 >95Charlotte-Mecklenburg Schools 600405 Harding University High 6 C 59 Exceeded 85.1 53 30 40 43 34 50 >95Charlotte-Mecklenburg Schools 600406 Hawk Ridge Elementary 6 A 85 B 82 A 86 Met 76.8 88 84 89 95Charlotte-Mecklenburg Schools 600410 Hickory Grove Elementary 6 D 53 D 48 D 53 Met 82.9 46 40 47 65Charlotte-Mecklenburg Schools 600411 Highland Creek Elementary 6 B 70 C 68 B 70 NotMet 60.7 73 69 73 80Charlotte-Mecklenburg Schools 600412 Hidden Valley Elementary 6 D 50 D 44 D 52 Exceeded 85.7 41 33 45 53Charlotte-Mecklenburg Schools 600413 Highland Mill Montessori 6 B 74 B 73 C 69 Exceeded 89.9 69 71 64 84Charlotte-Mecklenburg Schools 600414 Highland Renaissance Academy 6 C 60 D 50 C 64 Exceeded 87.0 53 43 58 65Charlotte-Mecklenburg Schools 600415 Hopewell High 6 C 65 NotMet 68.8 64 45 67 39 51 75 >95Charlotte-Mecklenburg Schools 600416 Hornets Nest Elementary 6 C 55 D 43 C 63 Exceeded 90.6 46 34 55 57Charlotte-Mecklenburg Schools 600418 Croft Community Elementary 6 C 67 C 66 C 63 Exceeded 89.8 62 63 57 74Charlotte-Mecklenburg Schools 600420 Huntersville Elementary 6 A 86 B 82 A 85 Met 74.2 86 84 87 88Charlotte-Mecklenburg Schools 600422 Huntingtowne Farms Elementary 6 D 49 D 45 D 50 NotMet 67.2 45 37 47 61Charlotte-Mecklenburg Schools 600424 Idlewild Elementary 6 C 62 C 58 C 67 Met 81.4 58 53 62 58Charlotte-Mecklenburg Schools 600426 Independence High 6 B 77 Exceeded 100.0 72 64 75 63 51 71 91Charlotte-Mecklenburg Schools 600428 James Martin Middle 6 D 48 D 45 F 39 Exceeded 91.9 38 37 27 68 92Charlotte-Mecklenburg Schools 600429 Morehead STEM Academy 6 B 72 B 70 C 66 Met 73.0 72 69 67 94 69Charlotte-Mecklenburg Schools 600431 Jay M Robinson Middle 6 A 91 A 89 A 90 Exceeded 100.0 89 89 88 90 >95Charlotte-Mecklenburg Schools 600432 Joseph W Grier Academy 6 C 65 C 56 C 68 Met 81.7 61 53 64 78Charlotte-Mecklenburg Schools 600433 J.V. Washam Elementary 6 B 78 B 77 B 79 Met 74.9 78 76 80 79Charlotte-Mecklenburg Schools 600434 Kennedy Middle 6 D 50 D 48 D 40 Met 80.0 42 43 30 74 61Charlotte-Mecklenburg Schools 600436 Lake Wylie Elementary 6 C 60 C 62 C 55 Met 80.2 55 58 48 69Charlotte-Mecklenburg Schools 600437 Ballantyne Elementary 6 B 84 B 80 B 83 Exceeded 88.4 83 79 82 94Charlotte-Mecklenburg Schools 600438 Lansdowne Elementary 6 C 58 C 60 C 57 NotMet 68.4 56 58 53 62Charlotte-Mecklenburg Schools 600439 Turning Point Academy 6 N/A N/A N/ACharlotte-Mecklenburg Schools 600440 Lebanon Road Elementary 6 C 62 C 55 C 68 Exceeded 87.7 56 47 63 57Charlotte-Mecklenburg Schools 600442 Blythe Elementary 6 C 69 C 65 B 72 Exceeded 88.5 64 60 68 66Charlotte-Mecklenburg Schools 600444 Long Creek Elementary 6 C 64 C 63 C 62 Exceeded 89.2 58 58 55 66Charlotte-Mecklenburg Schools 600445 Mallard Creek High 6 B 76 Exceeded 100.0 71 54 75 56 51 73 >95Charlotte-Mecklenburg Schools 600446 Mallard Creek Elementary 6 B 70 C 66 C 69 Exceeded 91.2 65 62 63 78Charlotte-Mecklenburg Schools 600447 Matthews Elementary 6 B 77 B 74 B 78 Exceeded 85.7 75 73 75 80Charlotte-Mecklenburg Schools 600448 Martin Luther King Jr Middle 6 D 40 F 32 F 37 Met 77.6 31 25 25 61 >95Charlotte-Mecklenburg Schools 600449 McAlpine Elementary 6 B 75 B 73 B 74 Met 83.1 74 73 72 83Charlotte-Mecklenburg Schools 600450 McClintock Middle 6 F 38 D 43 F 33 NotMet 61.8 33 36 24 44 77Charlotte-Mecklenburg Schools 600451 McKee Road Elementary 6 A 85 A B 82 Met 82.8 86 85 83 >95
NCDPI/Division of Accountability Services 32 of 116 February 5, 2015
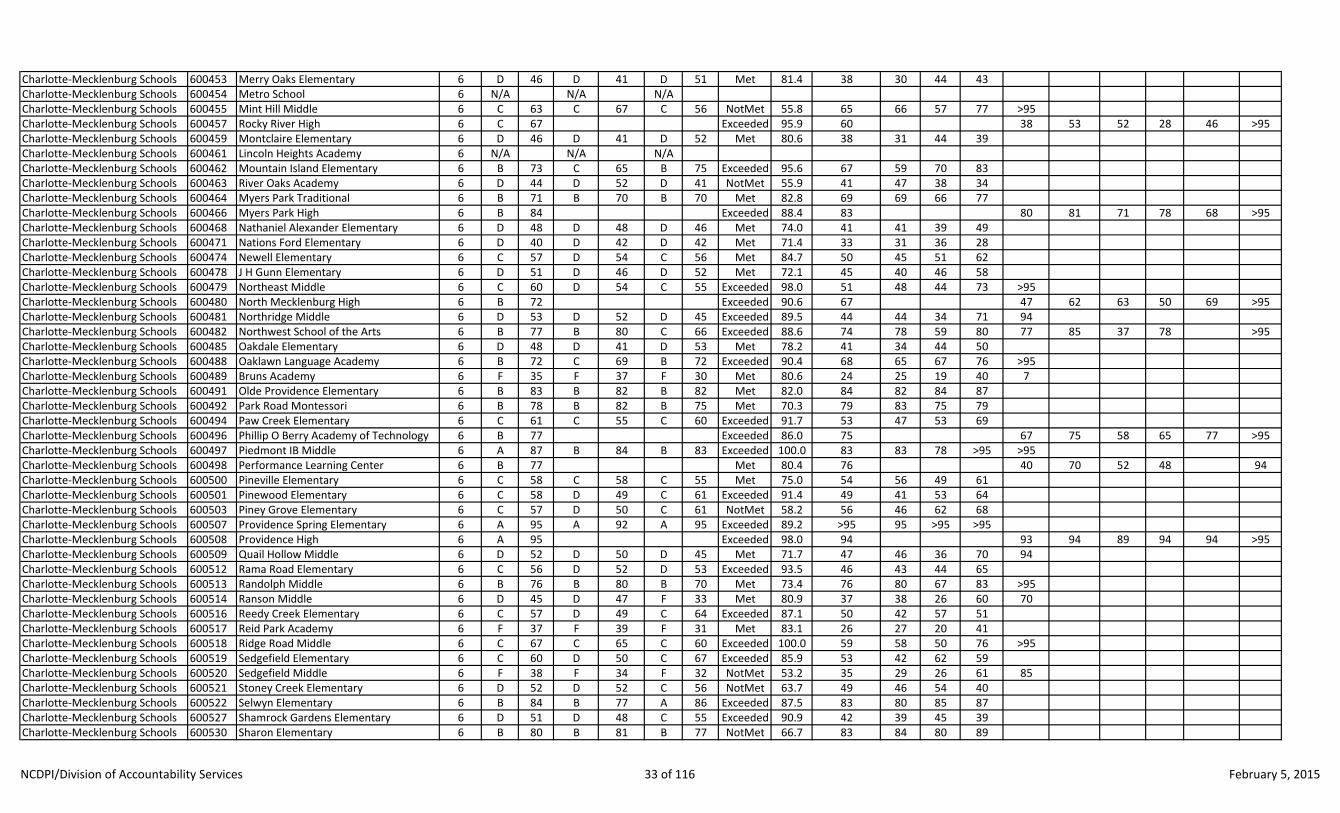
Charlotte-Mecklenburg Schools 600453 Merry Oaks Elementary 6 D 46 D 41 D 51 Met 81.4 38 30 44 43Charlotte-Mecklenburg Schools 600454 Metro School 6 N/A N/A N/ACharlotte-Mecklenburg Schools 600455 Mint Hill Middle 6 C 63 C 67 C 56 NotMet 55.8 65 66 57 77 >95Charlotte-Mecklenburg Schools 600457 Rocky River High 6 C 67 Exceeded 95.9 60 38 53 52 28 46 >95Charlotte-Mecklenburg Schools 600459 Montclaire Elementary 6 D 46 D 41 D 52 Met 80.6 38 31 44 39Charlotte-Mecklenburg Schools 600461 Lincoln Heights Academy 6 N/A N/A N/ACharlotte-Mecklenburg Schools 600462 Mountain Island Elementary 6 B 73 C 65 B 75 Exceeded 95.6 67 59 70 83Charlotte-Mecklenburg Schools 600463 River Oaks Academy 6 D 44 D 52 D 41 NotMet 55.9 41 47 38 34Charlotte-Mecklenburg Schools 600464 Myers Park Traditional 6 B 71 B 70 B 70 Met 82.8 69 69 66 77Charlotte-Mecklenburg Schools 600466 Myers Park High 6 B 84 Exceeded 88.4 83 80 81 71 78 68 >95Charlotte-Mecklenburg Schools 600468 Nathaniel Alexander Elementary 6 D 48 D 48 D 46 Met 74.0 41 41 39 49Charlotte-Mecklenburg Schools 600471 Nations Ford Elementary 6 D 40 D 42 D 42 Met 71.4 33 31 36 28Charlotte-Mecklenburg Schools 600474 Newell Elementary 6 C 57 D 54 C 56 Met 84.7 50 45 51 62Charlotte-Mecklenburg Schools 600478 J H Gunn Elementary 6 D 51 D 46 D 52 Met 72.1 45 40 46 58Charlotte-Mecklenburg Schools 600479 Northeast Middle 6 C 60 D 54 C 55 Exceeded 98.0 51 48 44 73 >95Charlotte-Mecklenburg Schools 600480 North Mecklenburg High 6 B 72 Exceeded 90.6 67 47 62 63 50 69 >95Charlotte-Mecklenburg Schools 600481 Northridge Middle 6 D 53 D 52 D 45 Exceeded 89.5 44 44 34 71 94Charlotte-Mecklenburg Schools 600482 Northwest School of the Arts 6 B 77 B 80 C 66 Exceeded 88.6 74 78 59 80 77 85 37 78 >95Charlotte-Mecklenburg Schools 600485 Oakdale Elementary 6 D 48 D 41 D 53 Met 78.2 41 34 44 50Charlotte-Mecklenburg Schools 600488 Oaklawn Language Academy 6 B 72 C 69 B 72 Exceeded 90.4 68 65 67 76 >95Charlotte-Mecklenburg Schools 600489 Bruns Academy 6 F 35 F 37 F 30 Met 80.6 24 25 19 40 7Charlotte-Mecklenburg Schools 600491 Olde Providence Elementary 6 B 83 B 82 B 82 Met 82.0 84 82 84 87Charlotte-Mecklenburg Schools 600492 Park Road Montessori 6 B 78 B 82 B 75 Met 70.3 79 83 75 79Charlotte-Mecklenburg Schools 600494 Paw Creek Elementary 6 C 61 C 55 C 60 Exceeded 91.7 53 47 53 69Charlotte-Mecklenburg Schools 600496 Phillip O Berry Academy of Technology 6 B 77 Exceeded 86.0 75 67 75 58 65 77 >95Charlotte-Mecklenburg Schools 600497 Piedmont IB Middle 6 A 87 B 84 B 83 Exceeded 100.0 83 83 78 >95 >95Charlotte-Mecklenburg Schools 600498 Performance Learning Center 6 B 77 Met 80.4 76 40 70 52 48 94Charlotte-Mecklenburg Schools 600500 Pineville Elementary 6 C 58 C 58 C 55 Met 75.0 54 56 49 61Charlotte-Mecklenburg Schools 600501 Pinewood Elementary 6 C 58 D 49 C 61 Exceeded 91.4 49 41 53 64Charlotte-Mecklenburg Schools 600503 Piney Grove Elementary 6 C 57 D 50 C 61 NotMet 58.2 56 46 62 68Charlotte-Mecklenburg Schools 600507 Providence Spring Elementary 6 A 95 A 92 A 95 Exceeded 89.2 >95 95 >95 >95Charlotte-Mecklenburg Schools 600508 Providence High 6 A 95 Exceeded 98.0 94 93 94 89 94 94 >95Charlotte-Mecklenburg Schools 600509 Quail Hollow Middle 6 D 52 D 50 D 45 Met 71.7 47 46 36 70 94Charlotte-Mecklenburg Schools 600512 Rama Road Elementary 6 C 56 D 52 D 53 Exceeded 93.5 46 43 44 65Charlotte-Mecklenburg Schools 600513 Randolph Middle 6 B 76 B 80 B 70 Met 73.4 76 80 67 83 >95Charlotte-Mecklenburg Schools 600514 Ranson Middle 6 D 45 D 47 F 33 Met 80.9 37 38 26 60 70Charlotte-Mecklenburg Schools 600516 Reedy Creek Elementary 6 C 57 D 49 C 64 Exceeded 87.1 50 42 57 51Charlotte-Mecklenburg Schools 600517 Reid Park Academy 6 F 37 F 39 F 31 Met 83.1 26 27 20 41Charlotte-Mecklenburg Schools 600518 Ridge Road Middle 6 C 67 C 65 C 60 Exceeded 100.0 59 58 50 76 >95Charlotte-Mecklenburg Schools 600519 Sedgefield Elementary 6 C 60 D 50 C 67 Exceeded 85.9 53 42 62 59Charlotte-Mecklenburg Schools 600520 Sedgefield Middle 6 F 38 F 34 F 32 NotMet 53.2 35 29 26 61 85Charlotte-Mecklenburg Schools 600521 Stoney Creek Elementary 6 D 52 D 52 C 56 NotMet 63.7 49 46 54 40Charlotte-Mecklenburg Schools 600522 Selwyn Elementary 6 B 84 B 77 A 86 Exceeded 87.5 83 80 85 87Charlotte-Mecklenburg Schools 600527 Shamrock Gardens Elementary 6 D 51 D 48 C 55 Exceeded 90.9 42 39 45 39Charlotte-Mecklenburg Schools 600530 Sharon Elementary 6 B 80 B 81 B 77 NotMet 66.7 83 84 80 89
NCDPI/Division of Accountability Services 33 of 116 February 5, 2015

Charlotte-Mecklenburg Schools 600532 Waddell Language Academy 6 B 79 B 80 B 74 Exceeded 88.1 77 77 74 84 >95Charlotte-Mecklenburg Schools 600534 Smithfield Elementary 6 B 72 B 71 B 70 Exceeded 86.6 69 68 66 77Charlotte-Mecklenburg Schools 600535 South Mecklenburg High 6 B 80 Exceeded 100.0 75 60 74 70 66 67 >95Charlotte-Mecklenburg Schools 600537 South Charlotte Middle 6 A 85 B 82 B 80 Exceeded 93.2 83 83 77 >95 >95Charlotte-Mecklenburg Schools 600538 Southwest Middle School 6 C 61 C 58 D 53 Exceeded 93.9 53 52 44 70 >95Charlotte-Mecklenburg Schools 600546 Statesville Road Elementary 6 C 55 D 52 C 58 Exceeded 94.2 46 44 48 42Charlotte-Mecklenburg Schools 600549 Steele Creek Elementary 6 D 53 D 52 C 57 NotMet 59.0 51 47 56 49Charlotte-Mecklenburg Schools 600550 Sterling Elementary 6 F 37 D 41 F 36 NotMet 68.6 29 32 26 30Charlotte-Mecklenburg Schools 600553 Thomasboro Academy 6 D 42 F 39 F 37 Met 80.1 32 29 28 58Charlotte-Mecklenburg Schools 600557 Torrence Creek Elementary 6 B 77 B 72 B 77 Exceeded 91.8 73 69 74 88Charlotte-Mecklenburg Schools 600558 Grand Oak Elementary 6 A 86 B 82 A 87 Exceeded 88.8 86 83 87 >95Charlotte-Mecklenburg Schools 600562 Tuckaseegee Elementary 6 D 45 D 47 D 47 NotMet 67.0 39 41 39 34Charlotte-Mecklenburg Schools 600565 University Park Creative Arts 6 D 50 D 49 D 47 NotMet 64.8 46 45 42 63Charlotte-Mecklenburg Schools 600566 University Meadows Elementary 6 C 55 D 53 C 62 NotMet 65.1 52 49 58 45Charlotte-Mecklenburg Schools 600571 Irwin Academic Center 6 A 88 A 86 A 86 Met 70.3 88 87 89 84Charlotte-Mecklenburg Schools 600574 Walter G Byers School 6 D 41 F 39 F 38 Exceeded 85.1 30 28 27 45Charlotte-Mecklenburg Schools 600576 West Charlotte High 6 D 52 Met 80.1 45 28 36 21 18 53 >95Charlotte-Mecklenburg Schools 600577 Westerly Hills Academy 6 D 42 D 44 F 36 Exceeded 90.0 30 35 22 42Charlotte-Mecklenburg Schools 600579 West Mecklenburg High 6 C 62 Exceeded 90.0 55 30 41 50 35 48 94Charlotte-Mecklenburg Schools 600586 Winding Springs Elementary 6 D 42 D 44 D 46 NotMet 61.5 37 38 39 30Charlotte-Mecklenburg Schools 600587 Windsor Park Elementary 6 C 68 C 56 B 73 Exceeded 91.3 62 49 68 82Charlotte-Mecklenburg Schools 600588 Winget Park Elementary 6 C 69 C 67 B 70 Exceeded 87.9 65 63 65 69Charlotte-Mecklenburg Schools 600589 Winterfield Elementary 6 F 35 F 33 F 37 NotMet 66.0 27 24 29 30Charlotte-Mecklenburg Schools 600590 River Gate Elementary 6 C 66 C 63 C 63 Met 82.3 62 60 59 80Charlotte-Mecklenburg Schools 600592 Vance High 6 C 65 Exceeded 93.6 57 42 50 35 34 64 >95Charlotte-Mecklenburg Schools 600693 Olympic High - Renaissance School 6 B 71 Met 81.3 68 48 69 55 49 93Charlotte-Mecklenburg Schools 600694 Olympic High-Math Eng Tech Science 6 B 82 Exceeded 88.2 81 68 79 81 70 80 >95Charlotte-Mecklenburg Schools 600695 Olympic High - Intl Study, Global Econ 6 C 66 Exceeded 88.2 61 34 62 45 37 >95Charlotte-Mecklenburg Schools 600696 Olympic High -Intl Bus and Comm Studies 6 C 62 Exceeded 88.6 56 35 47 53 23 46 94Charlotte-Mecklenburg Schools 600697 Olympic High - Biotech Health Pub Admin 6 B 77 Exceeded 96.4 72 57 80 68 53 >95Mitchell County Schools 610302 Bowman Middle 8 C 68 C 68 C 60 Exceeded 85.9 63 64 53 74 >95Mitchell County Schools 610310 Deyton Elementary 8 C 69 C 63 C 69 Exceeded 92.9 63 59 63 77Mitchell County Schools 610320 Gouge Elementary 8 D 52 C 61 D 42 Exceeded 85.0 43 55 32Mitchell County Schools 610322 Greenlee Primary 8 IMitchell County Schools 610326 Harris Middle 8 C 61 C 65 D 53 NotMet 64.1 60 62 49 77 >95Mitchell County Schools 610332 Mayland Early College 8 B 76 Met 80.9 75 67 80 71 >95Mitchell County Schools 610334 Mitchell High 8 B 75 Exceeded 85.2 72 58 71 57 64 74 >95Montgomery County Schools 620310 Montgomery Learning Academy 4 N/A N/A N/AMontgomery County Schools 620312 Candor Elementary 4 D 53 D 49 D 53 NotMet 63.8 50 42 51 71Montgomery County Schools 620314 East Middle 4 D 49 D 45 D 47 Met 78.9 41 38 38 59Montgomery County Schools 620316 East Montgomery High 4 B 72 Exceeded 95.6 66 64 47 48 52 67 >95Montgomery County Schools 620318 Green Ridge Elementary 4 D 47 D 45 D 45 Met 84.2 38 36 35 55Montgomery County Schools 620324 Mount Gilead Elementary 4 D 50 D 54 D 46 Met 81.6 43 46 38 46Montgomery County Schools 620330 Page Street Elementary 4 C 62 C 60 C 67 Exceeded 85.5 57 54 62 51Montgomery County Schools 620334 Star Elementary 4 C 59 C 59 C 64 Met 82.2 54 54 59 38
NCDPI/Division of Accountability Services 34 of 116 February 5, 2015

Montgomery County Schools 620336 Troy Elementary 4 IMontgomery County Schools 620339 West Middle 4 D 49 D 54 F 39 NotMet 68.0 45 48 34 67Montgomery County Schools 620340 West Montgomery High 4 C 56 NotMet 53.3 57 44 49 14 47 60 >95Moore County Schools 630304 Aberdeen Primary 4 IMoore County Schools 630308 Aberdeen Elementary 4 D 51 D 53 D 47 Exceeded 85.8 42 45 37 48Moore County Schools 630312 Cameron Elementary 4 C 59 C 63 C 59 NotMet 69.4 56 59 56 47Moore County Schools 630316 Carthage Elementary 4 C 64 C 63 C 61 Exceeded 98.2 56 58 51 66Moore County Schools 630317 Crain's Creek Middle 4 D 53 C 61 D 41 Met 71.5 48 56 33 60 90Moore County Schools 630320 Elise Middle 4 C 57 D 54 D 47 Exceeded 93.6 47 45 36 81 >95Moore County Schools 630324 Sandhills Farm Life Elementary 4 B 78 B 76 B 75 Exceeded 88.0 75 74 73 85Moore County Schools 630328 Highfalls Elementary 4 C 69 C 65 C 65 Exceeded 86.4 65 61 60 91 75Moore County Schools 630330 The Community Learning Center @ Pinckney4 N/A N/A N/AMoore County Schools 630331 New Century Middle 4 C 69 B 72 C 66 Met 72.0 69 71 63 77 >95Moore County Schools 630332 North Moore High 4 C 67 Met 80.3 63 55 56 47 54 50 >95Moore County Schools 630336 Pinecrest High 4 C 69 NotMet 57.1 72 56 65 60 69 47 >95Moore County Schools 630342 Pinehurst Elementary 4 B 83 B 81 B 83 Met 82.1 83 82 83 90Moore County Schools 630348 Robbins Elementary 4 D 48 D 52 D 43 Met 84.7 39 44 33 46Moore County Schools 630350 Southern Middle 4 D 47 D 53 F 38 NotMet 58.4 44 48 32 58 75Moore County Schools 630352 Southern Pines Primary 4 IMoore County Schools 630356 Southern Pines Elementary 4 B 70 C 65 C 69 Exceeded 91.1 64 61 63 79Moore County Schools 630360 Union Pines High 4 B 75 Met 82.3 73 49 68 60 73 80 >95Moore County Schools 630364 Vass-Lakeview Elementary 4 C 64 C 63 C 66 Met 84.3 59 58 61 56Moore County Schools 630368 West End Elementary 4 C 66 C 69 C 68 NotMet 61.7 67 70 66 64Moore County Schools 630373 West Pine Elementary 4 B 81 B 78 B 82 Met 81.7 81 79 82 85Moore County Schools 630374 West Pine Middle 4 B 77 B 79 C 69 Met 80.1 76 79 69 85 >95 >95Moore County Schools 630376 Westmoore Elementary 4 D 54 C 61 D 46 NotMet 64.2 52 56 41 62 83Nash-Rocky Mount Schools 640302 Fairview Elementary 3 INash-Rocky Mount Schools 640304 Bailey Elementary 3 C 56 C 55 D 51 Exceeded 85.8 49 49 43 65Nash-Rocky Mount Schools 640306 Baskerville Elementary 3 D 46 D 53 D 41 NotMet 67.6 40 47 35 38Nash-Rocky Mount Schools 640308 Benvenue Elementary 3 D 48 D 52 D 44 NotMet 61.5 45 48 38 54Nash-Rocky Mount Schools 640316 Cedar Grove Elementary 3 D 53 C 57 D 52 Exceeded 85.7 45 50 43 38Nash-Rocky Mount Schools 640320 Nash Central Middle 3 D 47 D 51 D 41 NotMet 55.9 45 48 34 54 84Nash-Rocky Mount Schools 640324 Coopers Elementary 3 C 63 C 66 C 57 Met 73.1 60 63 56 68Nash-Rocky Mount Schools 640326 D S Johnson Elementary 3 F 35 F 35 F 35 Met 83.0 23 21 23 25Nash-Rocky Mount Schools 640328 Englewood Elementary 3 D 47 D 46 D 46 NotMet 66.6 42 42 39 50Nash-Rocky Mount Schools 640329 G R Edwards Middle 3 D 50 D 54 D 44 NotMet 63.9 46 48 37 54 78Nash-Rocky Mount Schools 640332 M B Hubbard Elementary 3 D 41 D 42 F 39 NotMet 59.6 37 37 32 50Nash-Rocky Mount Schools 640334 J W Parker Middle 3 F 26 F 32 F 19 NotMet 54.7 18 23 9 33 19Nash-Rocky Mount Schools 640335 Rocky Mount Middle 3 F 32 F 36 F 22 NotMet 52.1 27 30 14 46 54Nash-Rocky Mount Schools 640336 Middlesex Elementary 3 F 38 D 42 F 38 NotMet 59.5 33 35 33 31Nash-Rocky Mount Schools 640340 Tar River Academy 3 N/A N/A N/ANash-Rocky Mount Schools 640346 Nash Central High 3 D 52 NotMet 50.0 52 32 42 19 42 71 92Nash-Rocky Mount Schools 640347 NRM Early College High School 3 B 73 NotMet 66.7 75 61 78 59 82 >95Nash-Rocky Mount Schools 640348 Nashville Elementary 3 C 59 C 58 C 60 Met 77.3 55 53 53 66Nash-Rocky Mount Schools 640350 Northern Nash High 3 C 56 NotMet 50.0 57 38 51 34 45 67 >95
NCDPI/Division of Accountability Services 35 of 116 February 5, 2015

Nash-Rocky Mount Schools 640354 O R Pope Elementary 3 F 29 F 30 F 28 Met 71.5 18 19 14 26Nash-Rocky Mount Schools 640358 Red Oak Middle 3 D 48 D 49 D 41 NotMet 56.0 46 47 33 70 62Nash-Rocky Mount Schools 640360 Red Oak Elementary 3 INash-Rocky Mount Schools 640361 Rocky Mount High 3 D 46 NotMet 52.3 45 29 36 19 34 44 87Nash-Rocky Mount Schools 640362 Southern Nash Middle 3 D 47 D 46 D 40 NotMet 58.8 44 43 30 75 65Nash-Rocky Mount Schools 640364 Southern Nash High 3 C 58 NotMet 50.0 60 43 50 39 51 76 >95Nash-Rocky Mount Schools 640376 Spring Hope Elementary 3 D 42 D 49 D 40 Met 72.2 35 42 30 31Nash-Rocky Mount Schools 640384 Swift Creek Elementary 3 D 53 C 56 D 52 NotMet 57.5 52 53 50 53Nash-Rocky Mount Schools 640396 Williford Elementary 3 F 39 F 37 F 34 Met 80.1 29 27 24 55Nash-Rocky Mount Schools 640400 Winstead Avenue Elementary 3 INew Hanover County Schools 650304 Bradley Creek Elementary 2 C 65 C 60 C 65 Exceeded 86.4 60 55 60 75New Hanover County Schools 650308 Carolina Beach Elementary 2 B 71 B 72 C 68 NotMet 69.4 71 72 68 78New Hanover County Schools 650309 Castle Hayne Elementary 2 C 68 C 59 B 70 Met 75.4 67 56 70 87New Hanover County Schools 650310 Charles P Murray Middle 2 B 72 B 73 C 68 Met 82.2 70 71 63 79 >95New Hanover County Schools 650312 R Freeman Sch of Engineering 2 D 43 D 42 D 42 NotMet 68.5 36 35 35 45New Hanover County Schools 650316 College Park Elementary 2 C 61 C 64 C 56 Met 83.0 56 59 50 70New Hanover County Schools 650323 Edwin A Anderson Elementary 2 B 70 C 68 C 63 Met 83.9 67 64 61 90New Hanover County Schools 650324 Edwin A Alderman Elementary 2 D 53 D 50 D 53 Met 82.8 45 43 45 52New Hanover County Schools 650325 Emma B Trask Middle 2 B 70 C 66 C 67 Exceeded 88.4 65 61 61 81 >95New Hanover County Schools 650326 Emsley A Laney High 2 B 75 Exceeded 89.9 72 57 69 53 71 62 >95New Hanover County Schools 650327 Eugene Ashley High 2 B 75 Met 84.6 73 58 67 66 66 76 >95New Hanover County Schools 650328 Forest Hills Global Elementary 2 C 57 D 54 C 55 Met 81.1 52 48 49 72New Hanover County Schools 650332 Gregory School of Math Science and Tech 2 D 48 D 53 D 42 NotMet 67.4 43 46 36 51New Hanover County Schools 650338 Heyward C Bellamy Elem 2 B 78 B 74 B 77 Exceeded 89.7 76 71 77 87New Hanover County Schools 650339 Holly Tree Elementary 2 B 83 B 83 B 79 Met 84.0 83 83 81 90New Hanover County Schools 650340 Isaac M Bear High 2 A 98 Exceeded 93.4 >95 >95 >95 95 >95 >95New Hanover County Schools 650341 John J Blair Elementary 2 C 69 C 66 C 67 Exceeded 87.2 64 61 63 77New Hanover County Schools 650342 John T Hoggard High 2 B 77 Met 74.2 78 69 76 65 78 69 >95New Hanover County Schools 650343 Holly Shelter Middle 2 C 56 C 59 D 52 NotMet 66.1 53 57 45 63 >95New Hanover County Schools 650345 Lake Forest Academy 2 N/A N/A N/ANew Hanover County Schools 650346 Mary C Williams Elementary 2 C 55 C 55 D 52 Met 81.8 48 48 47 56New Hanover County Schools 650348 Murrayville Elementary 2 B 71 C 66 B 70 Met 84.5 68 62 69 79New Hanover County Schools 650350 M C S Noble Middle 2 B 75 B 77 C 68 Exceeded 86.8 72 74 64 81 >95New Hanover County Schools 650351 Myrtle Grove Middle 2 B 70 B 72 C 64 Met 80.8 68 69 62 75 >95New Hanover County Schools 650352 New Hanover High 2 C 61 NotMet 58.6 62 46 62 50 55 63 >95New Hanover County Schools 650353 Dr Hubert Eaton Sr Elem 2 A 89 A 87 A 89 Exceeded 93.9 88 87 88 91New Hanover County Schools 650354 Lakeside 2 N/A N/A N/ANew Hanover County Schools 650355 Mary Sidberry Mosley PLC 2 N/A N/A N/ANew Hanover County Schools 650356 Ogden Elementary 2 A 87 A 88 A 86 Met 82.7 88 89 88 86New Hanover County Schools 650362 Pine Valley Elementary 2 B 73 B 70 B 70 Met 83.6 70 68 67 86New Hanover County Schools 650364 Roland-Grise Middle 2 B 74 B 74 B 70 Met 75.6 74 74 67 87 >95New Hanover County Schools 650366 Dr John Codington Elem 2 A 88 A 87 A 88 Exceeded 89.5 88 88 87 91New Hanover County Schools 650368 Sunset Park Elementary 2 C 60 D 53 D 53 Met 84.8 53 47 48 85New Hanover County Schools 650380 Walter L Parsley Elementary 2 A 91 A 88 A 91 Exceeded 90.1 91 88 92 95New Hanover County Schools 650384 A H Snipes Academy of Arts/Des 2 D 43 D 41 D 44 Exceeded 91.0 31 29 32 38
NCDPI/Division of Accountability Services 36 of 116 February 5, 2015

New Hanover County Schools 650392 Williston Middle 2 D 52 D 50 D 47 Exceeded 87.7 43 42 36 59 >95New Hanover County Schools 650394 Wilmington Early College High 2 B 81 Met 78.5 82 81 84 61 71 83 >95New Hanover County Schools 650400 Winter Park Model Elementary 2 C 59 D 52 C 58 Exceeded 89.9 52 45 51 73New Hanover County Schools 650404 Wrightsboro Elementary 2 C 55 C 56 D 50 Met 81.0 49 49 45 57New Hanover County Schools 650408 Wrightsville Beach Elem 2 A 86 A 86 A 86 Met 81.2 88 87 87 93New Hanover County Schools 650409 D.C. Virgo Preparatory Academy 2 F 36 D 45 F 25 Met 76.7 25 36 14Northampton County Schools 660306 Central Elementary 3 D 49 D 51 D 46 Met 82.0 40 45 36Northampton County Schools 660308 Conway Middle 3 F 33 F 32 F 25 NotMet 50.0 29 26 19 48 51Northampton County Schools 660320 Gaston Elementary 3 F 39 D 46 F 32 NotMet 69.0 31 39 24Northampton County Schools 660325 Gaston Middle 3 F 26 F 33 F 25 NotMet 55.4 19 24 14 19 12Northampton County Schools 660334 Northampton County Alternative School 3 N/A N/A N/ANorthampton County Schools 660336 Northampton County High School 3 C 60 Met 80.6 55 31 41 34 47 69 >95Northampton County Schools 660356 Squire Elementary 3 INorthampton County Schools 660360 Willis Hare Elementary 3 D 45 D 43 D 47 Met 71.4 38 35 42Onslow County Schools 670304 Bell Fork Elementary 2 C 65 C 62 C 64 Met 84.2 60 58 59 66Onslow County Schools 670308 Blue Creek Elementary 2 C 63 C 64 C 60 Met 81.2 59 60 55 68Onslow County Schools 670310 Carolina Forest Elementary 2 B 70 B 70 C 67 Met 75.1 69 69 66 80Onslow County Schools 670312 Clyde Erwin Elementary 2 C 55 C 55 C 55 Exceeded 87.1 47 48 46 48Onslow County Schools 670314 Dixon Elementary 2 C 66 C 65 C 66 Met 71.2 65 61 65 74Onslow County Schools 670318 Dixon Middle 2 C 57 C 58 D 51 Met 71.6 54 55 43 73 92Onslow County Schools 670320 Dixon High 2 B 72 Exceeded 88.4 68 47 61 59 53 69 >95Onslow County Schools 670321 Hunters Creek Elementary 2 C 67 C 67 C 58 Exceeded 85.0 63 62 54 87Onslow County Schools 670322 Hunters Creek Middle 2 D 51 D 52 D 41 NotMet 58.6 49 50 35 73 86Onslow County Schools 670323 Jacksonville Commons Elem 2 C 55 C 56 D 53 Met 74.5 50 50 48 53Onslow County Schools 670324 Jacksonville High 2 B 74 Exceeded 93.6 69 48 68 58 61 76 >95Onslow County Schools 670325 Jacksonville Commons Middle 2 D 51 C 56 F 39 NotMet 69.3 46 51 31 66 79Onslow County Schools 670329 Meadow View Elementary 2 C 61 C 60 C 55 Exceeded 91.7 53 53 47 70Onslow County Schools 670330 Morton Elementary 2 C 58 D 53 C 57 Met 83.6 52 48 50 67Onslow County Schools 670331 New Bridge Middle 2 C 67 C 69 C 56 Met 82.2 63 66 50 83 >95Onslow County Schools 670332 Northwoods Elementary 2 D 47 D 50 D 43 Met 81.3 39 43 33 43Onslow County Schools 670333 Northside High 2 B 71 Exceeded 89.0 67 54 61 51 55 65 >95Onslow County Schools 670335 Queens Creek Elementary 2 B 70 C 68 C 67 Exceeded 86.0 66 65 63 78Onslow County Schools 670336 Northwoods Park Middle 2 D 49 C 55 F 38 NotMet 56.3 47 52 32 66 71Onslow County Schools 670337 Richlands Primary 2 IOnslow County Schools 670338 Parkwood Elementary 2 C 62 C 65 C 57 Exceeded 85.5 56 61 50 62Onslow County Schools 670339 Richlands Elementary 2 C 57 C 59 D 53 NotMet 68.4 54 56 49 62Onslow County Schools 670340 Richlands High 2 C 66 NotMet 66.3 65 42 56 53 61 73 >95Onslow County Schools 670341 Sand Ridge Elementary 2 C 66 C 63 C 65 Met 84.5 61 60 59 71Onslow County Schools 670342 Silverdale Elementary 2 C 58 C 55 C 56 Exceeded 86.1 51 49 48 69Onslow County Schools 670343 Southwest Elementary 2 B 73 B 70 B 70 Exceeded 91.9 68 66 65 82Onslow County Schools 670344 Southwest High 2 B 71 Met 82.9 67 51 50 51 65 70 >95Onslow County Schools 670345 Southwest Middle 2 C 60 C 62 D 45 Exceeded 87.2 54 57 37 84 86Onslow County Schools 670346 Summersill Elementary 2 B 70 C 65 C 67 Met 83.2 67 62 64 88Onslow County Schools 670347 Stateside Elementary 2 B 73 B 72 C 69 Exceeded 90.6 69 70 63 82Onslow County Schools 670350 Swansboro Elementary 2 C 69 C 65 C 68 Met 81.3 66 63 64 77
NCDPI/Division of Accountability Services 37 of 116 February 5, 2015

Onslow County Schools 670351 Swansboro Middle 2 C 63 C 57 C 55 Exceeded 91.5 56 55 46 82 >95Onslow County Schools 670352 Swansboro High 2 C 69 NotMet 58.8 71 56 63 50 63 80 >95Onslow County Schools 670356 Trexler Middle 2 D 54 C 55 D 44 NotMet 62.6 52 52 40 79 82Onslow County Schools 670364 White Oak High 2 C 69 Met 81.2 67 45 53 61 55 72 >95Orange County Schools 680304 A L Stanback Middle 5 C 55 C 63 D 49 NotMet 53.8 56 60 47 65 78Orange County Schools 680308 Cameron Park Elementary 5 B 76 B 73 B 75 Exceeded 92.6 72 69 72 78Orange County Schools 680310 Cedar Ridge High 5 B 70 NotMet 68.2 71 57 59 60 69 85 >95Orange County Schools 680312 Central Elementary 5 D 48 D 49 D 49 NotMet 63.4 45 43 46 47Orange County Schools 680316 Charles W Stanford Middle 5 C 65 B 71 D 54 NotMet 64.5 65 69 53 79 >95Orange County Schools 680324 Efland Cheeks Elementary 5 C 56 C 56 C 56 Met 81.8 50 48 51 51Orange County Schools 680327 Gravelly Hill Middle 5 C 58 C 61 D 47 Met 77.7 53 57 41 74 >95Orange County Schools 680328 Grady Brown Elementary 5 C 69 C 67 C 69 Met 84.4 65 63 66 74Orange County Schools 680329 Hillsborough Elementary 5 B 73 B 74 B 72 Met 71.6 74 74 72 79Orange County Schools 680330 New Hope Elementary 5 C 64 C 59 C 66 Exceeded 91.9 57 52 60 63Orange County Schools 680332 Orange High 5 C 67 NotMet 66.2 68 50 61 54 57 77 94Orange County Schools 680335 Partnership Academy 5 N/A N/A N/AOrange County Schools 680336 Pathways Elementary 5 C 68 C 68 C 67 NotMet 67.7 68 66 68 76Chapel Hill-Carrboro Schools 681300 Northside Elementary 6 C 69 B 71 B 71 Met 71.1 68 69 69 64Chapel Hill-Carrboro Schools 681304 Carrboro Elementary 6 B 74 B 72 B 76 Met 81.1 72 70 73 73Chapel Hill-Carrboro Schools 681305 Carrboro High 6 A 85 Exceeded 85.2 86 72 84 78 84 87 >95Chapel Hill-Carrboro Schools 681308 Chapel Hill High 6 A 87 Exceeded 94.1 85 75 82 80 90 80 >95Chapel Hill-Carrboro Schools 681309 McDougle Middle 6 B 81 B 79 B 76 Exceeded 96.8 77 77 72 89 >95Chapel Hill-Carrboro Schools 681310 Seawell Elementary 6 A 85 B 83 B 83 Exceeded 92.0 83 81 82 91Chapel Hill-Carrboro Schools 681311 Ephesus Elementary 6 B 77 B 76 B 75 Met 82.8 75 75 73 82Chapel Hill-Carrboro Schools 681312 Estes Hills Elementary 6 B 74 B 76 B 75 Met 75.4 74 75 74 74Chapel Hill-Carrboro Schools 681314 East Chapel Hill High 6 A 87 Exceeded 92.1 86 75 86 77 88 59 >95Chapel Hill-Carrboro Schools 681316 FPG Elementary 6 C 55 C 59 D 54 NotMet 63.7 53 54 52 52Chapel Hill-Carrboro Schools 681320 Glenwood Elementary 6 B 81 B 83 B 81 Met 84.4 81 83 80 77Chapel Hill-Carrboro Schools 681322 Culbreth Middle 6 B 79 B 79 B 73 Exceeded 91.4 76 77 70 91 >95Chapel Hill-Carrboro Schools 681324 Phillips Middle 6 B 82 B 80 B 78 Exceeded 88.0 80 80 76 89 >95Chapel Hill-Carrboro Schools 681326 McDougle Elementary 6 B 75 B 73 B 75 Met 81.7 73 71 73 81Chapel Hill-Carrboro Schools 681328 UNC Hospital School 6 IChapel Hill-Carrboro Schools 681330 Scroggs Elementary 6 B 79 B 80 B 77 Met 75.1 80 81 77 87Chapel Hill-Carrboro Schools 681332 Morris Grove Elementary 6 B 84 B 81 B 84 Exceeded 93.4 81 78 83 84Chapel Hill-Carrboro Schools 681334 Rashkis Elementary 6 B 78 B 79 B 78 Met 79.5 77 79 77 73Chapel Hill-Carrboro Schools 681336 Smith Middle 6 B 82 B 80 B 77 Exceeded 93.5 79 79 74 86 >95Chapel Hill-Carrboro Schools 681338 Phoenix Academy High 6 N/A N/A N/APamlico County Schools 690312 Fred A Anderson Elementary 2 C 58 C 58 D 52 Exceeded 86.2 51 51 45 66Pamlico County Schools 690316 Pamlico County Middle 2 C 58 C 57 D 52 Met 80.5 52 53 43 63 >95Pamlico County Schools 690320 Pamlico County High 2 C 60 NotMet 54.2 61 48 47 40 50 64 >95Pamlico County Schools 690324 Pamlico County Primary 2 IPasquotank County Schools 700306 Central Elementary 1 C 61 C 55 C 63 Met 80.3 56 52 57 64Pasquotank County Schools 700308 Elizabeth City Middle 1 D 43 D 52 F 34 NotMet 58.5 39 44 28 49 81Pasquotank County Schools 700310 H L Trigg Community 1 N/A N/A N/APasquotank County Schools 700314 Northside Elementary 1 C 65 C 61 C 68 Met 81.7 61 57 65 61
NCDPI/Division of Accountability Services 38 of 116 February 5, 2015

Pasquotank County Schools 700316 J C Sawyer Elementary 1 C 55 C 56 D 53 Met 73.9 50 49 51 51Pasquotank County Schools 700317 Northeastern High 1 C 66 Exceeded 89.9 60 37 54 49 46 70 86Pasquotank County Schools 700318 Pasquotank Elementary 1 D 44 D 46 D 42 NotMet 68.5 38 38 36 42Pasquotank County Schools 700319 Pasquotank County High 1 C 62 Exceeded 88.1 55 30 62 44 45 72 79Pasquotank County Schools 700320 P W Moore Elementary 1 D 44 D 46 D 46 NotMet 66.4 38 38 40 31Pasquotank County Schools 700322 River Road Middle 1 D 50 D 52 D 47 Met 73.8 45 46 38 49 80Pasquotank County Schools 700324 Sheep-Harney Elementary 1 D 51 D 51 D 54 Met 77.0 44 44 48 36Pasquotank County Schools 700328 Weeksville Elementary 1 C 69 C 64 B 71 Met 82.0 66 62 67 73Pender County Schools 710312 Burgaw Elementary 2 D 50 D 53 D 50 Met 73.6 44 47 43 41Pender County Schools 710316 Burgaw Middle 2 D 43 D 47 F 29 NotMet 58.8 39 43 21 69 78Pender County Schools 710318 Cape Fear Elementary 2 D 52 D 53 D 51 Met 79.6 46 45 44 52Pender County Schools 710320 Cape Fear Middle 2 D 53 D 51 F 37 Met 81.9 45 46 29 82 90Pender County Schools 710321 Heide Trask High 2 C 56 NotMet 52.8 57 31 58 31 43 54 >95Pender County Schools 710323 North Topsail Elementary 2 C 66 C 62 C 67 Met 79.2 62 61 63 66Pender County Schools 710324 Malpass Corner Elementary 2 C 56 D 47 C 58 Met 81.2 49 41 52 65Pender County Schools 710326 Pender High 2 C 64 Exceeded 86.4 58 37 47 44 37 57 >95Pender County Schools 710327 Pender Early College High 2 A 86 Met 83.2 86 58 85 80 86 >95Pender County Schools 710328 Penderlea Elementary 2 C 58 C 61 D 52 Met 83.5 52 56 44 59 94Pender County Schools 710332 Rocky Point Elementary 2 D 40 D 44 D 41 NotMet 64.0 34 35 34 26Pender County Schools 710342 Topsail High 2 B 80 Exceeded 85.0 79 69 76 74 71 83 >95Pender County Schools 710344 Topsail Elementary 2 B 73 B 72 B 70 Met 79.7 71 70 69 84Pender County Schools 710346 Topsail Middle 2 B 76 B 73 C 69 Exceeded 97.9 70 71 62 89 >95Pender County Schools 710347 South Topsail Elementary 2 B 72 B 74 C 69 Exceeded 86.4 68 72 64 69Pender County Schools 710348 West Pender Middle 2 D 43 D 46 F 28 NotMet 56.9 39 40 21 77 85Perquimans County Schools 720304 Perquimans Central 1 IPerquimans County Schools 720312 Hertford Grammar 1 C 64 C 61 C 59 Exceeded 94.8 56 55 51 77Perquimans County Schools 720316 Perquimans County High 1 C 60 NotMet 52.7 62 33 56 48 60 76 95Perquimans County Schools 720320 Perquimans County Middle 1 D 50 D 50 D 46 Met 70.5 45 46 35 54 67Person County Schools 730332 Helena Elementary 5 B 79 B 73 B 79 Exceeded 85.3 77 71 79 92Person County Schools 730334 North Elementary 5 D 47 D 46 D 41 Met 81.3 38 37 32 66Person County Schools 730340 North End Elementary 5 C 59 C 55 C 55 Met 81.0 54 50 49 76Person County Schools 730344 Northern Middle 5 D 53 D 50 D 46 Met 80.0 46 46 36 71 >95Person County Schools 730348 Oak Lane Elementary 5 B 71 B 71 C 65 Met 76.2 69 70 63 84Person County Schools 730352 Person High 5 C 61 NotMet 68.0 60 33 51 51 46 64 >95Person County Schools 730354 Stories Creek Elementary 5 B 75 C 68 B 77 Met 84.9 72 66 75 83Person County Schools 730356 South Elementary 5 D 45 D 40 D 47 Met 74.9 38 29 42 50Person County Schools 730360 Southern Middle 5 C 56 D 54 D 46 Met 80.0 50 49 38 77 87Person County Schools 730368 Woodland Elementary 5 B 78 B 70 B 78 Exceeded 90.5 75 67 76 91Pitt County Schools 740302 A G Cox Middle 1 C 59 C 63 D 51 Met 76.3 55 58 46 72 93Pitt County Schools 740304 Ayden Elementary 1 C 58 C 58 C 56 NotMet 64.1 56 55 53 70Pitt County Schools 740308 Ayden Middle 1 D 50 D 52 D 43 NotMet 59.1 48 46 39 72 83Pitt County Schools 740309 Ayden-Grifton High 1 C 55 NotMet 55.7 54 34 41 19 44 71 >95Pitt County Schools 740310 Belvoir Elementary 1 D 46 D 44 D 45 Exceeded 92.2 35 33 33 49Pitt County Schools 740320 Bethel Elementary 1 C 57 D 52 D 51 Exceeded 89.7 48 44 42 67 >95Pitt County Schools 740324 C M Eppes Middle 1 F 39 D 47 F 32 NotMet 56.3 35 38 26 40 58
NCDPI/Division of Accountability Services 39 of 116 February 5, 2015

Pitt County Schools 740330 Creekside Elementary 1 C 56 C 55 C 56 NotMet 67.5 53 51 51 64Pitt County Schools 740332 Chicod 1 B 73 B 73 C 68 Exceeded 92.5 69 70 62 79 >95Pitt County Schools 740333 D H Conley High 1 C 68 NotMet 59.5 70 57 60 60 69 71 >95Pitt County Schools 740334 Falkland Elementary 1 D 42 D 46 D 42 NotMet 63.1 37 38 37 38Pitt County Schools 740336 Eastern Elementary 1 D 53 D 52 D 53 Met 74.2 48 45 49 57Pitt County Schools 740337 E B Aycock Middle 1 D 47 D 50 F 37 NotMet 66.5 42 44 31 63 75Pitt County Schools 740338 Elmhurst Elementary 1 C 63 C 59 C 65 Met 80.5 58 55 60 60Pitt County Schools 740340 Farmville Middle 1 C 55 C 56 D 51 Exceeded 90.6 47 47 41 51 86Pitt County Schools 740344 Farmville Central High 1 C 60 NotMet 68.2 58 35 50 34 46 59 >95Pitt County Schools 740352 Grifton 1 F 38 D 42 F 33 Met 71.7 29 32 24 32 87Pitt County Schools 740358 G R Whitfield 1 D 52 C 56 D 51 Met 71.4 47 50 43 43 >95Pitt County Schools 740360 H B Sugg Elementary 1 IPitt County Schools 740362 Hope Middle 1 B 78 B 74 B 74 Exceeded 100.0 73 70 69 86 >95Pitt County Schools 740366 Junius H Rose High 1 C 66 Met 73.1 64 43 53 50 59 53 >95Pitt County Schools 740368 Lakeforest Elementary 1 F 36 D 41 F 31 NotMet 58.0 30 33 25 36Pitt County Schools 740374 North Pitt High 1 D 54 NotMet 61.9 51 40 46 25 36 61 >95Pitt County Schools 740375 Northwest Elementary 1 C 63 D 54 B 75 Met 81.6 59 48 73 50Pitt County Schools 740376 Pactolus 1 D 43 D 43 F 38 Met 80.6 34 34 28 43 84Pitt County Schools 740378 Pitt Memorial Hospital 1 F 9 F 9 F 5 9 9 5 18Pitt County Schools 740379 Ridgewood Elementary 1 B 70 C 68 B 72 Met 80.3 68 65 69 70Pitt County Schools 740380 W H Robinson Elementary 1 C 61 C 57 C 59 Exceeded 88.6 55 51 52 78Pitt County Schools 740386 Sam D Bundy Elementary 1 D 47 D 52 D 46 NotMet 58.7 44 46 43 44Pitt County Schools 740388 South Central High 1 C 59 NotMet 56.9 60 36 51 45 49 63 93Pitt County Schools 740390 South Greenville Elementary 1 F 33 F 36 F 35 NotMet 62.1 26 28 25 24Pitt County Schools 740396 Stokes 1 C 60 C 57 C 57 Met 83.4 54 51 51 66 83Pitt County Schools 740400 Wahl Coates Elementary 1 D 53 C 55 D 52 Met 73.4 49 50 46 53Pitt County Schools 740402 Wellcome Middle 1 F 39 D 45 F 35 NotMet 65.0 32 36 28 20 90Pitt County Schools 740404 Wintergreen Intermediate 1 B 72 C 69 B 72 Met 75.1 71 67 73 78Pitt County Schools 740406 Wintergreen Primary 1 IPolk County Schools 750304 Tryon Elementary School 8 C 67 C 68 C 68 NotMet 61.0 68 68 68 70Polk County Schools 750314 Polk Central Elementary School 8 B 70 C 64 B 73 Met 78.8 68 64 70 78Polk County Schools 750317 Polk County Early College 8 B 77 Met 72.9 78 93 83 52 75 >95Polk County Schools 750318 Polk County High School 8 B 76 Met 80.0 75 72 68 58 66 89 >95Polk County Schools 750319 Polk County Middle School 8 B 72 B 73 C 61 Met 76.7 71 71 60 90 >95Polk County Schools 750320 Saluda Elementary School 8 B 77 B 79 B 76 Met 80.9 77 79 75 76Polk County Schools 750328 Sunny View Elementary School 8 C 63 C 59 C 63 NotMet 62.5 64 56 64 84Randolph County Schools 760304 Archdale Elementary 5 C 60 C 58 C 57 Met 84.7 54 51 53 66Randolph County Schools 760308 Braxton Craven Middle 5 C 61 C 66 C 55 Met 73.4 58 62 53Randolph County Schools 760316 Coleridge Elementary 5 C 59 D 52 C 61 Exceeded 95.2 51 43 53 65Randolph County Schools 760318 Eastern Randolph High 5 D 53 NotMet 59.6 51 34 37 28 44 73 >95Randolph County Schools 760320 Farmer Elementary 5 C 63 C 60 C 60 Met 73.7 60 56 58 79Randolph County Schools 760324 Franklinville Elementary 5 C 66 C 63 C 64 Exceeded 85.3 61 58 60 69Randolph County Schools 760328 Grays Chapel Elementary 5 C 67 C 62 B 70 Met 80.7 63 57 69 65Randolph County Schools 760329 Hopewell Elementary 5 B 77 C 67 B 81 Exceeded 85.2 74 65 80 84Randolph County Schools 760330 John R Lawrence Elementary 5 C 56 C 58 C 55 NotMet 57.2 56 54 55 64
NCDPI/Division of Accountability Services 40 of 116 February 5, 2015

Randolph County Schools 760331 Level Cross Elementary 5 C 64 C 62 C 65 Met 81.5 59 57 61 63Randolph County Schools 760332 Liberty Elementary 5 D 54 D 53 C 57 Met 74.9 49 45 53 48Randolph County Schools 760336 New Market Elementary 5 B 71 C 67 B 70 Exceeded 88.8 66 62 66 77Randolph County Schools 760338 Northeastern Randolph Middle 5 C 58 C 57 D 43 Met 79.1 52 51 39 83 81Randolph County Schools 760339 Providence Grove High 5 B 74 Exceeded 95.7 69 46 54 69 67 72 >95Randolph County Schools 760340 Ramseur Elementary 5 D 52 D 42 C 55 Exceeded 90.2 43 32 47 59Randolph County Schools 760344 Randleman Elementary 5 D 51 D 46 C 56 NotMet 59.6 49 41 54 54Randolph County Schools 760348 Randleman High 5 C 59 NotMet 59.6 59 41 43 47 50 69 >95Randolph County Schools 760352 Randleman Middle 5 D 54 C 56 D 45 Met 77.1 48 50 36 63 85Randolph County Schools 760354 Randolph Early College High 5 A 87 Exceeded 89.3 86 75 92 72 95 >95Randolph County Schools 760356 Seagrove Elementary 5 C 62 C 59 C 63 NotMet 69.7 60 55 62 68Randolph County Schools 760357 Southeastern Randolph Middle 5 D 40 D 48 F 26 NotMet 58.3 36 40 20 61 76Randolph County Schools 760358 Southwestern Randolph High 5 B 72 Exceeded 93.0 67 58 51 51 53 71 >95Randolph County Schools 760359 Southmont Elementary 5 C 57 D 51 C 62 NotMet 68.1 54 46 61 57Randolph County Schools 760360 Southwestern Randolph Middle 5 C 55 C 59 D 45 NotMet 67.5 52 53 41 65 >95Randolph County Schools 760364 Tabernacle Elementary 5 C 56 D 54 C 56 Met 70.1 53 48 54 62Randolph County Schools 760368 Trindale Elementary 5 B 78 B 72 B 79 Exceeded 85.9 76 69 78 89Randolph County Schools 760376 Trinity Elementary 5 C 63 C 61 C 60 Exceeded 89.7 57 55 53 72Randolph County Schools 760378 Archdale-Trinity Middle 5 C 59 C 58 D 50 NotMet 69.1 56 54 44 73 >95Randolph County Schools 760380 Trinity High 5 B 72 Exceeded 86.3 69 67 54 52 58 72 >95Randolph County Schools 760382 Uwharrie Middle 5 D 51 C 55 D 40 NotMet 52.8 51 53 36 71 92Randolph County Schools 760388 Wheatmore High 5 B 71 Met 82.6 69 57 57 55 55 86 >95Asheboro City Schools 761304 Asheboro High 6 C 68 Exceeded 90.3 62 36 55 45 55 78 >95Asheboro City Schools 761308 South Asheboro Middle 6 D 50 D 50 D 45 Met 77.6 44 43 34 56 77Asheboro City Schools 761312 Balfour Elementary 6 D 49 D 46 D 48 Met 74.9 42 38 42 54Asheboro City Schools 761320 Charles W McCrary Elementary 6 D 47 D 45 D 47 Met 78.6 39 37 39 46Asheboro City Schools 761321 Donna L Loflin Elementary 6 D 43 D 47 D 40 NotMet 57.4 40 41 36 47Asheboro City Schools 761328 Guy B Teachey Elementary 6 C 66 C 60 C 69 Exceeded 90.3 60 54 64 64Asheboro City Schools 761332 Lindley Park Elementary 6 C 58 D 51 C 60 Met 75.9 53 46 56 66Asheboro City Schools 761336 North Asheboro Middle 6 D 52 D 46 D 47 Exceeded 91.0 42 37 36 62 95Richmond County Schools 770310 East Rockingham Elementary 4 C 59 D 51 C 59 Exceeded 87.6 52 43 53 76Richmond County Schools 770312 Cordova School 4 N/A N/A N/ARichmond County Schools 770316 Ellerbe Middle 4 D 53 D 48 D 47 Exceeded 88.4 44 39 38 64 >95Richmond County Schools 770318 Fairview Heights Elementary 4 C 62 C 58 C 61 Exceeded 86.7 56 52 55 69Richmond County Schools 770328 Hamlet Middle 4 C 55 C 55 D 41 Exceeded 86.5 47 46 34 74 >95Richmond County Schools 770340 L J Bell Elementary 4 C 64 C 64 D 52 Exceeded 85.3 58 58 50 85Richmond County Schools 770342 Leak Street High 4 N/A N/A N/ARichmond County Schools 770344 Mineral Springs Elementary 4 D 49 D 46 D 47 Met 76.9 42 37 42 53Richmond County Schools 770346 Monroe Avenue Elementary 4 D 47 D 46 D 43 Met 74.4 40 38 37 57Richmond County Schools 770348 Richmond Senior High 4 D 54 NotMet 56.4 54 <5 38 32 33 56 >95Richmond County Schools 770349 Richmond Early College High 4 B 72 NotMet 66.9 73 58 78 58 71 >95Richmond County Schools 770351 Richmond 9th Grade Academy 4 D 40 NotMet 58.0 36 36 29Richmond County Schools 770360 Rockingham Middle 4 C 63 C 62 C 56 Exceeded 97.2 55 54 47 70 >95Richmond County Schools 770364 Rohanen Middle 4 D 42 D 42 F 33 NotMet 69.2 35 34 25 59 >95Richmond County Schools 770368 West Rockingham Elementary 4 D 48 D 47 D 49 Met 78.2 41 40 41 41
NCDPI/Division of Accountability Services 41 of 116 February 5, 2015

Richmond County Schools 770370 Washington Street Elementary 4 C 60 C 57 C 55 Exceeded 92.8 52 49 48 71Robeson County Schools 780320 Deep Branch Elementary 4 F 37 F 39 F 35 Met 70.3 29 30 27 37Robeson County Schools 780322 East Robeson Primary 4 C 56 C 56 D 50 Met 82.9 49 49 50Robeson County Schools 780324 Fairgrove Middle 4 D 45 D 45 F 38 Met 72.9 39 38 30 63Robeson County Schools 780325 Fairmont High 4 C 59 Met 73.5 56 40 45 39 33 74 >95Robeson County Schools 780326 Fairmont Middle 4 D 46 D 44 D 43 Exceeded 96.5 34 33 29 45Robeson County Schools 780328 Green Grove Elementary 4 D 47 D 42 D 47 Met 70.1 41 36 47Robeson County Schools 780329 Janie C Hargrave Elem 4 F 37 F 36 F 37 Met 81.3 26 26 26Robeson County Schools 780330 L Gilbert Carroll Middle 4 D 44 D 48 D 41 NotMet 59.3 40 42 37 45Robeson County Schools 780331 Robeson Co Career Ctr 4 IRobeson County Schools 780336 Littlefield Middle 4 D 47 D 47 D 46 Exceeded 85.7 38 38 35 39 >95Robeson County Schools 780340 Long Branch Elementary 4 D 51 C 56 D 45 Met 82.2 43 48 38Robeson County Schools 780341 Lumberton Junior High 4 D 40 D 50 F 31 NotMet 54.8 37 42 25 36 93Robeson County Schools 780342 Lumberton Senior High 4 C 57 NotMet 65.9 55 36 37 32 37 62 >95Robeson County Schools 780344 Magnolia Elementary 4 F 36 F 37 F 30 NotMet 59.8 30 28 23 53Robeson County Schools 780352 Orrum Middle 4 F 39 D 43 F 33 NotMet 58.1 34 37 26 43Robeson County Schools 780356 Oxendine Elementary 4 D 46 D 43 D 49 Met 80.9 37 35 40 34Robeson County Schools 780360 Parkton Elementary 4 D 53 D 51 D 45 Exceeded 90.9 44 43 34 70Robeson County Schools 780364 Pembroke Elementary 4 D 45 D 46 F 38 Met 72.4 38 38 31 54Robeson County Schools 780368 Pembroke Middle 4 D 40 F 38 D 40 NotMet 59.1 35 32 31 48 >95Robeson County Schools 780374 Peterson Elementary 4 F 38 F 38 F 39 NotMet 68.6 31 29 33Robeson County Schools 780376 Piney Grove Elementary 4 D 48 D 49 D 45 Met 77.5 41 40 39 46Robeson County Schools 780384 Prospect Elementary 4 D 41 D 47 F 36 NotMet 61.8 35 39 30 41Robeson County Schools 780385 PSRC Early College at RCC 4 A 86 Exceeded 90.2 85 87 64 78 79 >95 >95Robeson County Schools 780390 R B Dean Elementary 4 F 32 F 30 F 34 Met 71.1 22 20 24Robeson County Schools 780391 Red Springs High 4 C 60 Exceeded 90.3 53 35 27 36 39 59 >95Robeson County Schools 780392 Rex-Rennert Elementary 4 F 27 F 31 F 26 NotMet 58.7 19 21 17 22Robeson County Schools 780393 Red Springs Middle 4 D 43 D 40 F 32 Exceeded 90.2 31 29 20 60Robeson County Schools 780394 Rosenwald Elementary 4 F 34 F 37 F 32 Met 79.6 23 26 21Robeson County Schools 780396 Rowland Middle 4 D 48 D 41 F 38 Met 81.1 40 36 26 94Robeson County Schools 780398 Rowland Norment Elementary 4 C 59 C 61 D 51 Exceeded 86.7 53 54 51Robeson County Schools 780400 Saint Pauls Elementary 4 F 38 D 40 F 37 Met 82.5 27 28 26 27Robeson County Schools 780401 Saint Pauls High 4 C 64 Exceeded 89.7 58 46 36 40 42 62 >95Robeson County Schools 780402 South Robeson High 4 C 57 NotMet 66.8 55 31 36 48 26 56 >95Robeson County Schools 780403 Saint Pauls Middle 4 D 51 D 46 D 46 Exceeded 97.8 39 36 33 66Robeson County Schools 780407 Tanglewood Elementary 4 B 74 C 69 B 78 Met 83.6 71 65 78Robeson County Schools 780408 Southside/Ashpole Elem 4 D 41 D 40 D 45 NotMet 66.6 34 30 39 29Robeson County Schools 780410 Townsend Middle 4 F 32 F 35 F 31 Met 75.8 21 23 17 23Robeson County Schools 780412 Union Chapel Elementary 4 D 48 D 41 D 45 Met 80.8 40 35 35 72Robeson County Schools 780416 Union Elementary 4 D 51 D 48 D 47 Met 79.8 44 40 40 79Robeson County Schools 780417 W H Knuckles 4 F 33 F 32 F 36 NotMet 65.7 25 24 27Robeson County Schools 780418 West Lumberton Elementary 4 C 60 C 59 C 61 Met 83.4 54 53 56Robeson County Schools 780420 Purnell Swett High 4 C 58 NotMet 65.4 56 39 41 33 38 62 >95Rockingham County Schools 790302 Bethany Elementary 5 C 69 C 64 B 70 Exceeded 85.0 65 62 66 74Rockingham County Schools 790310 Central Elementary 5 C 66 C 63 C 66 Exceeded 93.7 59 57 59 64
NCDPI/Division of Accountability Services 42 of 116 February 5, 2015

Rockingham County Schools 790314 Dalton McMichael High 5 C 69 Exceeded 87.0 65 56 55 51 53 65 95Rockingham County Schools 790318 Douglass Elementary 5 C 64 C 56 C 65 Exceeded 94.6 56 47 59 74Rockingham County Schools 790322 Draper Elementary 5 D 45 D 45 D 46 NotMet 67.7 39 38 39 44Rockingham County Schools 790327 Huntsville Elementary 5 C 61 C 57 C 63 Met 76.8 57 53 58 68Rockingham County Schools 790330 J E Holmes Middle 5 D 47 D 54 F 37 NotMet 56.7 45 48 32 63 94Rockingham County Schools 790334 John W Dillard Elementary 5 D 44 D 45 D 50 NotMet 59.2 40 36 48 29Rockingham County Schools 790344 Leaksville-Spray Elementary 5 C 56 D 53 C 58 Exceeded 90.8 48 45 50 48Rockingham County Schools 790347 Lincoln Elementary 5 D 54 D 50 D 52 Met 76.8 48 44 47 65Rockingham County Schools 790350 Monroeton Elementary 5 C 65 C 62 C 69 Exceeded 90.5 59 56 64 56Rockingham County Schools 790354 John M Morehead High 5 D 53 NotMet 59.6 51 29 39 45 45 73 82Rockingham County Schools 790358 Moss Street Elementary 5 F 36 F 37 F 38 NotMet 58.7 31 28 33 33Rockingham County Schools 790362 New Vision Sch.of Math/Sci/Tec 5 B 76 B 74 B 72 Exceeded 85.6 73 71 70 88Rockingham County Schools 790366 Reidsville High 5 C 57 Met 83.3 50 38 36 34 34 43 88Rockingham County Schools 790374 Reidsville Middle 5 D 41 D 49 F 31 NotMet 59.2 36 41 25 49 87Rockingham County Schools 790378 Rockingham County High 5 C 68 Exceeded 86.2 63 44 56 63 59 55 88Rockingham County Schools 790379 Rockingham Co Early College High 5 A 88 Exceeded 85.9 88 78 85 80 94 >95Rockingham County Schools 790380 Rockingham County Middle 5 C 58 C 61 D 48 NotMet 68.0 55 57 43 73 >95Rockingham County Schools 790386 South End Elementary 5 D 51 D 52 D 48 Met 81.4 43 44 39 50Rockingham County Schools 790390 Stoneville Elementary 5 C 57 D 52 C 55 Exceeded 88.5 49 44 47 67Rockingham County Schools 790392 The SCORE Center 5 N/A N/A N/ARockingham County Schools 790394 Western Rockingham Middle 5 D 54 C 61 D 45 Met 70.6 50 55 38 69 >95Rockingham County Schools 790398 Wentworth Elementary 5 C 69 C 68 C 68 Met 84.9 65 65 63 70Rockingham County Schools 790402 Williamsburg Elementary 5 C 57 D 53 C 58 Exceeded 89.4 49 44 50 59Rowan-Salisbury Schools 800308 Henderson High 7 N/A N/A N/ARowan-Salisbury Schools 800312 Bostian Elementary 7 B 70 B 74 C 63 Met 80.0 68 72 61 75Rowan-Salisbury Schools 800314 Erwin Middle 7 D 51 C 59 F 37 Met 71.4 47 53 32 64 >95Rowan-Salisbury Schools 800315 Overton Elementary 7 D 50 D 51 D 46 Met 71.6 45 44 41 56Rowan-Salisbury Schools 800316 China Grove Elementary 7 C 55 C 56 D 51 Met 83.3 48 49 43 58Rowan-Salisbury Schools 800320 China Grove Middle 7 C 59 C 61 D 44 Met 84.5 52 55 37 79 92Rowan-Salisbury Schools 800324 Cleveland Elementary 7 C 62 C 62 C 56 Met 80.7 57 57 52 74Rowan-Salisbury Schools 800328 Corriher Lipe Middle 7 D 50 C 56 F 36 Met 82.2 42 48 27 62 >95Rowan-Salisbury Schools 800340 East Rowan High 7 B 71 Exceeded 85.3 67 54 60 46 68 68 >95Rowan-Salisbury Schools 800346 Koontz Elementary 7 D 42 D 46 D 42 Met 75.8 33 36 35 23Rowan-Salisbury Schools 800347 Shive Elementary 7 C 56 C 59 D 51 Met 76.0 51 53 44 61Rowan-Salisbury Schools 800348 Enochville Elementary 7 C 56 C 61 D 54 Met 77.4 50 55 48 43Rowan-Salisbury Schools 800352 Faith Elementary 7 C 63 C 64 C 62 Met 76.6 60 59 58 65Rowan-Salisbury Schools 800356 Granite Quarry Elementary 7 D 53 D 54 D 52 NotMet 60.0 51 50 49 56Rowan-Salisbury Schools 800358 Isenberg Elementary 7 D 40 D 47 F 33 NotMet 69.2 32 40 23 39Rowan-Salisbury Schools 800359 Dole Elementary 7 D 43 D 43 D 40 Met 81.1 34 33 31 44Rowan-Salisbury Schools 800360 Hurley Elementary 7 D 49 D 49 D 49 Met 71.1 43 43 42 51Rowan-Salisbury Schools 800361 Carson High 7 B 71 Met 83.1 67 39 61 68 54 65 >95Rowan-Salisbury Schools 800362 Knollwood Elementary 7 D 49 D 44 D 51 Met 81.2 41 35 43 49Rowan-Salisbury Schools 800363 Knox Middle 7 D 42 D 48 F 28 Met 81.6 32 38 19 53 63Rowan-Salisbury Schools 800364 Landis Elementary 7 D 43 D 51 D 43 NotMet 58.9 39 45 37 30Rowan-Salisbury Schools 800366 Millbridge Elementary 7 C 67 C 63 C 66 Exceeded 85.7 62 58 61 79
NCDPI/Division of Accountability Services 43 of 116 February 5, 2015

Rowan-Salisbury Schools 800368 Morgan Elementary 7 C 57 C 56 D 49 Met 71.9 53 52 45 77Rowan-Salisbury Schools 800372 Mt Ulla Elementary 7 C 60 C 55 C 61 Met 80.0 55 50 56 69Rowan-Salisbury Schools 800373 North Rowan Elementary 7 F 33 F 39 F 36 NotMet 58.8 27 30 28 18Rowan-Salisbury Schools 800376 North Rowan High 7 D 49 NotMet 56.6 48 29 28 17 39 37 >95Rowan-Salisbury Schools 800377 North Rowan Middle 7 D 48 D 51 D 40 Exceeded 94.3 37 41 27 44 85Rowan-Salisbury Schools 800392 Rockwell Elementary 7 C 65 C 64 C 65 Exceeded 89.2 59 58 59 61Rowan-Salisbury Schools 800394 Rowan Co Early College 7 B 81 Met 76.6 82 68 75 70 86 >95Rowan-Salisbury Schools 800396 Salisbury High 7 C 60 Met 82.5 55 26 54 44 44 57 >95Rowan-Salisbury Schools 800398 Southeast Middle 7 D 50 D 54 D 42 NotMet 62.4 47 47 37 65 >95Rowan-Salisbury Schools 800400 South Rowan High 7 C 58 NotMet 59.2 58 34 52 42 54 58 >95Rowan-Salisbury Schools 800408 West Rowan High 7 C 57 NotMet 50.0 59 36 50 39 49 54 >95Rowan-Salisbury Schools 800410 West Rowan Middle 7 C 60 C 64 D 50 Met 83.9 55 57 43 72 93Rowan-Salisbury Schools 800412 Woodleaf Elementary 7 C 56 C 60 D 54 Met 77.8 50 54 48 45Rutherford County Schools 810324 Chase High School 8 C 66 Exceeded 86.8 61 36 58 54 49 67 >95Rutherford County Schools 810326 Chase Middle School 8 C 56 C 58 D 50 Met 76.3 51 52 43 68 76Rutherford County Schools 810328 Cliffside Elementary School 8 C 67 C 63 C 68 Met 76.9 65 61 66 77Rutherford County Schools 810336 Forest City-Dunbar Elementary School 8 D 54 C 55 D 49 NotMet 66.6 50 50 46 66Rutherford County Schools 810340 East Rutherford High School 8 C 63 Met 71.7 61 43 47 50 56 56 >95Rutherford County Schools 810342 East Rutherford Middle School 8 D 54 C 57 D 46 NotMet 64.0 51 53 40 71 75Rutherford County Schools 810344 Ellenboro Elementary School 8 B 70 B 70 C 67 Met 84.3 67 66 64 76Rutherford County Schools 810350 Forrest W Hunt Elementary School 8 C 64 C 61 C 66 Met 84.7 59 56 62 58Rutherford County Schools 810360 Harris Elementary School 8 C 62 C 61 C 59 NotMet 69.6 61 59 57 78Rutherford County Schools 810364 Mt Vernon-Ruth Elementary School 8 C 65 C 69 C 59 Met 84.6 60 65 52 67Rutherford County Schools 810370 Pinnacle Elementary School 8 B 74 B 75 B 71 Met 80.9 72 74 70 73Rutherford County Schools 810378 R-S Middle School 8 C 56 C 60 D 44 Met 83.8 49 54 35 70 79Rutherford County Schools 810384 R-S Central High School 8 C 66 Met 84.3 61 40 57 44 61 45 95Rutherford County Schools 810385 Rutherford Early College High School 8 B 83 NotMet 67.0 87 83 83 71 93 >95Rutherford County Schools 810386 Rutherford Opportunity Center 8 N/A N/A N/ARutherford County Schools 810388 Rutherfordton Elementary School 8 C 60 C 59 C 61 Met 73.4 56 55 57 56Rutherford County Schools 810396 Spindale Elementary School 8 C 56 D 53 C 57 Met 74.5 52 49 51 61Rutherford County Schools 810400 Sunshine Elementary School 8 C 65 C 64 C 68 NotMet 68.1 65 62 67 67Sampson County Schools 820312 Roseboro Elementary 2 C 63 D 54 C 65 Exceeded 86.6 57 48 60 75Sampson County Schools 820320 Clement Elementary 2 C 63 C 64 C 60 Met 71.0 61 60 59 67Sampson County Schools 820324 Sampson Early College High 2 A 86 Exceeded 87.6 86 83 83 71 81 >95Sampson County Schools 820340 Hargrove Elementary 2 C 65 C 58 C 68 Exceeded 95.7 58 50 62 67Sampson County Schools 820346 Hobbton Elementary 2 C 61 C 64 C 57 NotMet 60.2 61 60 57 75Sampson County Schools 820347 Hobbton Middle 2 C 59 C 60 D 51 Met 81.3 54 55 45 70 >95Sampson County Schools 820348 Hobbton High 2 C 68 Met 83.0 64 47 50 55 38 71 >95Sampson County Schools 820349 Lakewood High 2 C 56 NotMet 63.6 55 28 44 42 35 43 >95Sampson County Schools 820350 Midway Elementary 2 C 69 C 62 B 70 Exceeded 86.9 64 58 66 79Sampson County Schools 820352 Midway High 2 B 73 Met 81.7 70 65 63 54 57 76 >95Sampson County Schools 820354 Midway Middle 2 C 67 C 66 C 62 Exceeded 86.1 62 61 57 76 >95Sampson County Schools 820364 Plain View Elementary 2 B 73 B 71 C 67 Met 81.8 71 69 68 86Sampson County Schools 820370 Union Middle 2 D 49 D 51 F 39 Met 80.3 41 43 28 61 65Sampson County Schools 820372 Roseboro-Salemburg Middle 2 C 58 C 59 D 47 Exceeded 91.6 50 51 37 77 89
NCDPI/Division of Accountability Services 44 of 116 February 5, 2015

Sampson County Schools 820376 Salemburg Elementary 2 C 57 C 58 D 49 Exceeded 93.8 47 50 38 69Sampson County Schools 820384 Union Elementary 2 C 68 C 69 C 60 Exceeded 93.2 61 63 60Sampson County Schools 820385 Union Intermediate 2 C 56 D 53 C 59 Met 81.0 50 46 53 53Sampson County Schools 820388 Union High 2 C 58 Met 77.5 53 30 46 20 47 66 >95Clinton City Schools 821304 Butler Avenue Elementary 5 C 66 C 64 C 63 Exceeded 86.3 61 58 63Clinton City Schools 821308 Clinton High 5 C 62 NotMet 65.5 62 50 51 48 41 73 >95Clinton City Schools 821316 Langdon C Kerr Elementary 5 IClinton City Schools 821320 Sampson Middle 5 C 59 C 59 D 51 Exceeded 87.3 51 51 43 66 89Clinton City Schools 821330 Sunset Avenue Elementary 5 C 57 C 57 C 58 NotMet 62.8 55 54 55 58Scotland County Schools 830304 Carver Middle 4 D 47 D 45 D 42 NotMet 55.8 45 41 38 64 95Scotland County Schools 830312 Covington Street Elementary 4 B 70 C 66 B 73 Exceeded 88.7 65 62 68 67Scotland County Schools 830316 Shaw Academy 4 N/A N/A N/AScotland County Schools 830320 I E Johnson Elementary 4 D 42 D 40 D 44 NotMet 68.9 35 31 38 39Scotland County Schools 830328 Laurel Hill Elementary 4 B 74 C 69 B 76 NotMet 69.9 75 68 80 81Scotland County Schools 830336 North Laurinburg Elementary 4 D 54 D 52 D 53 Met 70.1 49 47 49 57Scotland County Schools 830343 Scotland High School 4 C 55 NotMet 50.0 57 40 42 30 40 67 >95Scotland County Schools 830344 Pate-Gardner Elementary 4 D 54 C 57 C 56 NotMet 69.8 50 52 52 42Scotland County Schools 830348 Scotland Early College High 4 A 85 Exceeded 87.4 84 83 79 84 80 >95Scotland County Schools 830349 Spring Hill Middle 4 C 65 C 62 C 58 Exceeded 87.3 59 58 51 77 >95Scotland County Schools 830350 Sycamore Lane Middle 4 D 46 D 48 F 38 NotMet 59.1 43 43 33 56 93Scotland County Schools 830356 South Scotland Elementary 4 C 66 C 67 C 67 Met 80.6 63 63 65 57Scotland County Schools 830360 Wagram Elementary 4 D 54 C 55 D 51 Met 75.5 48 48 48 50Scotland County Schools 830364 Washington Park Elementary 4 D 51 C 55 D 51 NotMet 59.6 49 48 50 48Stanly County Schools 840302 Albemarle High 6 D 54 NotMet 67.8 51 32 44 34 47 56 94Stanly County Schools 840303 Albemarle Middle 6 C 57 C 55 D 51 Exceeded 97.2 47 45 40 62 >95Stanly County Schools 840304 Aquadale Elementary 6 B 71 B 70 B 71 Met 78.3 69 68 70 67Stanly County Schools 840308 Badin Elementary 6 C 67 B 72 C 57 Met 84.8 63 68 54 75Stanly County Schools 840310 Central Elementary 6 C 56 C 58 C 57 Met 78.4 51 52 52 44Stanly County Schools 840312 Endy Elementary 6 B 71 C 69 B 76 NotMet 68.7 72 68 78 67Stanly County Schools 840316 East Albemarle Elementary 6 D 40 D 47 F 39 NotMet 59.7 35 39 35 30Stanly County Schools 840320 Locust Elementary 6 C 59 C 65 C 58 NotMet 56.6 59 62 58 52Stanly County Schools 840324 Millingport Elementary 6 C 56 C 64 C 57 NotMet 59.9 55 62 54 35Stanly County Schools 840328 North Stanly Middle 6 C 66 C 67 C 55 Exceeded 98.5 58 60 46 78 >95Stanly County Schools 840332 North Stanly High 6 C 65 NotMet 65.7 65 59 49 56 56 43 94Stanly County Schools 840336 Norwood Elementary 6 C 57 C 58 D 53 Exceeded 91.6 48 51 43 52Stanly County Schools 840340 Oakboro Elementary 6 C 61 C 62 C 60 NotMet 67.3 59 58 59 62Stanly County Schools 840344 Richfield Elementary 6 C 66 C 64 C 64 Met 84.2 61 58 60 71Stanly County Schools 840350 West Stanly Middle School 6 C 66 C 67 C 56 Exceeded 98.0 59 61 46 78 >95Stanly County Schools 840356 South Stanly High 6 C 64 NotMet 68.1 63 53 58 44 54 47 >95Stanly County Schools 840358 South Stanly Middle 6 C 66 C 68 C 55 Exceeded 90.3 60 63 48 80 >95Stanly County Schools 840360 Stanfield Elementary 6 C 67 C 66 B 70 Met 76.5 65 63 68 60Stanly County Schools 840361 Stanly Early College High 6 A 88 Met 82.3 89 84 93 72 >95 83 >95Stanly County Schools 840368 West Stanly High 6 C 68 Met 73.1 67 66 61 58 54 42 93Stanly County Schools 840370 Stanly Academy Learning Center 6 N/A N/A N/AStokes County Schools 850304 Chestnut Grove Middle 5 C 65 C 67 C 58 Exceeded 85.3 60 63 50 77 >95
NCDPI/Division of Accountability Services 45 of 116 February 5, 2015

Stokes County Schools 850308 Francisco Elementary 5 C 63 D 51 C 63 Exceeded 85.4 57 43 57 >95Stokes County Schools 850312 Germanton Elementary 5 B 70 B 73 C 61 Exceeded 91.5 65 69 54 83Stokes County Schools 850314 Mount Olive Elementary 5 B 70 C 68 B 70 Exceeded 89.0 66 62 67 72Stokes County Schools 850316 King Elementary 5 B 70 C 65 B 72 Exceeded 92.0 65 60 67 74Stokes County Schools 850320 Lawsonville Elementary 5 C 67 C 62 C 64 Exceeded 89.7 61 56 58 89Stokes County Schools 850324 Meadowbrook Academy 5 N/A N/A N/AStokes County Schools 850328 Nancy Reynolds Elementary 5 C 66 C 67 C 65 Met 80.0 62 62 62 62Stokes County Schools 850332 North Stokes High 5 B 71 Met 74.2 70 56 50 67 58 70 >95Stokes County Schools 850336 Pine Hall Elementary 5 C 57 D 48 C 60 Exceeded 86.6 50 38 54 68Stokes County Schools 850338 Piney Grove Middle 5 C 59 C 59 C 55 Met 74.9 54 54 48 67 >95Stokes County Schools 850340 Pinnacle Elementary 5 C 63 C 60 C 59 Exceeded 90.9 56 52 52 79Stokes County Schools 850342 Poplar Springs Elementary 5 B 72 C 68 B 72 Exceeded 87.4 68 63 69 76Stokes County Schools 850348 Sandy Ridge Elementary 5 B 71 C 67 B 70 Exceeded 89.8 66 63 66 79Stokes County Schools 850350 Southeastern Middle 5 C 62 C 66 D 53 Exceeded 85.0 56 62 45 67 >95Stokes County Schools 850352 South Stokes High 5 B 74 Exceeded 97.6 69 81 56 54 42 54 >95Stokes County Schools 850354 London Elementary 5 C 61 C 61 C 64 NotMet 69.2 59 56 63 56Stokes County Schools 850356 Walnut Cove Elementary 5 C 62 C 63 C 60 Exceeded 87.6 56 57 54 57Stokes County Schools 850358 West Stokes High 5 C 60 NotMet 52.9 62 44 58 43 59 63 >95Stokes County Schools 850360 Stokes Early College 5 A 89 Met 81.4 91 94 92 71 95 >95Surry County Schools 860302 Cedar Ridge Elementary 7 C 67 C 66 C 60 Exceeded 90.8 61 61 54 79Surry County Schools 860306 Central Middle 7 C 59 C 63 D 54 NotMet 64.1 57 58 50 70 92Surry County Schools 860308 Copeland Elementary 7 C 63 C 57 C 64 Met 76.8 60 52 63 73Surry County Schools 860312 Dobson Elementary 7 C 68 C 64 B 70 NotMet 65.2 69 64 70 83Surry County Schools 860316 East Surry High 7 B 74 NotMet 69.9 75 71 72 60 62 72 >95Surry County Schools 860320 Flat Rock Elementary 7 C 67 C 60 C 68 Met 73.4 66 55 68 89Surry County Schools 860324 Franklin Elementary 7 B 73 C 68 B 74 Exceeded 87.9 70 64 70 88Surry County Schools 860326 J Sam Gentry Middle 7 C 63 C 67 D 51 NotMet 68.8 61 66 47 84 >95Surry County Schools 860330 Meadowview Middle 7 D 49 D 54 D 43 NotMet 59.9 46 50 36 55 71Surry County Schools 860332 Mountain Park Elementary 7 C 58 C 59 D 51 Met 81.9 52 53 46 68Surry County Schools 860336 North Surry High 7 C 63 NotMet 56.7 65 52 57 44 57 66 >95Surry County Schools 860339 Pilot Mountain Elementary 7 C 63 C 58 C 67 Met 70.0 62 56 64 71Surry County Schools 860340 Pilot Mountain Middle 7 C 62 C 65 C 58 NotMet 59.5 62 63 55 71 93Surry County Schools 860344 Rockford Elementary 7 C 61 C 56 C 63 Exceeded 85.0 55 49 58 67Surry County Schools 860348 Shoals Elementary 7 B 81 B 79 B 81 Met 82.7 80 79 81 83Surry County Schools 860352 Surry Central High 7 C 63 NotMet 53.3 66 49 55 48 62 57 >95Surry County Schools 860354 Surry Early College HS Design 7 A 87 Met 76.7 90 87 89 79 89 >95Surry County Schools 860356 Westfield Elementary 7 B 71 C 66 B 70 Met 82.5 68 63 66 86Surry County Schools 860360 White Plains Elementary 7 C 69 C 69 C 63 Exceeded 86.9 64 66 58 78Elkin City Schools 861304 Elkin Elementary 7 B 75 B 76 B 72 Exceeded 87.4 72 74 68 76Elkin City Schools 861308 Elkin High 7 B 84 Exceeded 91.3 82 80 77 74 79 78 >95Elkin City Schools 861312 Elkin Middle 7 C 69 B 72 D 54 Met 82.4 66 70 48 86 >95Mount Airy City Schools 862308 Bruce H Tharrington Elem 7 IMount Airy City Schools 862310 Jones Elementary 7 C 69 C 63 C 68 Exceeded 95.0 62 58 62 78Mount Airy City Schools 862312 Mount Airy High 7 B 79 Exceeded 90.9 76 67 71 61 73 74 >95Mount Airy City Schools 862316 Mount Airy Middle 7 C 63 C 65 D 54 Met 70.0 61 61 52 79 >95
NCDPI/Division of Accountability Services 46 of 116 February 5, 2015

Swain County Schools 870314 Swain County High 8 C 58 NotMet 54.5 59 39 52 42 53 60 >95Swain County Schools 870318 Swain County Middle 8 C 55 D 52 D 52 Exceeded 86.2 48 46 42 61 >95Swain County Schools 870320 Swain Co East Elementary 8 C 61 C 57 C 57 Exceeded 88.3 54 50 51 77Swain County Schools 870324 Swain Co West Elementary 8 B 71 C 65 B 71 Met 81.9 68 63 67 82Transylvania County Schools 880304 Brevard Elementary 8 C 65 C 65 C 61 Exceeded 85.7 60 60 56 71Transylvania County Schools 880308 Brevard High 8 B 71 NotMet 64.0 73 62 71 73 65 69 86Transylvania County Schools 880312 Brevard Middle 8 C 65 C 65 C 58 Exceeded 85.4 60 61 50 72 93Transylvania County Schools 880318 Pisgah Forest Elementary 8 B 73 B 70 B 75 Met 82.6 71 69 73 71Transylvania County Schools 880320 Davidson River School 8 N/A N/A N/ATransylvania County Schools 880324 Rosman Elementary 8 C 66 C 68 C 64 Met 84.6 62 64 59 62Transylvania County Schools 880328 Rosman High 8 C 69 NotMet 59.8 71 50 59 64 59 73 94Transylvania County Schools 880330 Rosman Middle 8 C 60 C 62 D 47 Met 74.0 57 59 40 87 >95Transylvania County Schools 880336 T C Henderson Elementary 8 B 71 B 76 C 65 Met 80.2 69 73 65 67Tyrrell County Schools 890304 Columbia High 1 C 67 Exceeded 88.7 61 40 68 53 50 46 94Tyrrell County Schools 890306 Columbia Middle 1 D 46 C 55 F 30 NotMet 63.0 41 51 20 61 74Tyrrell County Schools 890308 Tyrrell Elementary 1 D 45 D 54 D 44 NotMet 63.0 41 49 38 26Union County Public Schools 900302 Antioch Elementary 6 B 83 B 82 B 84 Met 80.3 83 83 84 82Union County Public Schools 900303 Rea View Elementary 6 B 84 A 85 A 88 NotMet 62.1 90 90 91 85Union County Public Schools 900304 Benton Heights Elementary 6 D 46 D 43 D 48 Met 75.2 39 33 41 47Union County Public Schools 900305 New Town Elementary 6 B 79 B 78 B 81 Met 70.3 82 80 82 86Union County Public Schools 900306 East Elementary 6 D 40 F 37 D 48 Met 74.6 31 27 39 20Union County Public Schools 900307 Rocky River Elementary 6 B 75 C 67 B 79 Exceeded 85.3 72 63 78 80Union County Public Schools 900308 East Union Middle 6 D 49 D 51 D 45 NotMet 58.5 46 46 41 59 >95Union County Public Schools 900310 Cuthbertson Middle 6 A 86 A 85 B 83 Exceeded 93.9 84 84 81 91 >95Union County Public Schools 900311 Cuthbertson High 6 A 88 Exceeded 89.4 87 83 88 79 88 71 >95Union County Public Schools 900312 Fairview Elementary 6 B 76 B 70 B 78 Exceeded 90.7 72 67 75 78Union County Public Schools 900314 Monroe Middle 6 D 50 D 47 D 47 Exceeded 94.0 39 37 35 54 >95Union County Public Schools 900316 Forest Hills High 6 C 64 Exceeded 86.1 59 41 49 45 37 63 >95Union County Public Schools 900318 Hemby Bridge Elementary 6 B 78 B 74 B 81 Met 81.1 77 74 80 81Union County Public Schools 900320 Indian Trail Elementary 6 B 76 B 71 B 78 Exceeded 91.0 73 68 75 79Union County Public Schools 900328 Kensington Elementary 6 B 84 B 83 B 83 Exceeded 86.8 83 82 83 86Union County Public Schools 900332 Marshville Elementary 6 C 59 C 59 C 62 Met 73.9 56 55 58 51Union County Public Schools 900334 Marvin Elementary 6 A 86 A A 89 Met 71.3 89 88 92 88Union County Public Schools 900336 Monroe High 6 C 57 Exceeded 85.7 50 42 41 20 28 72 >95Union County Public Schools 900340 New Salem Elementary 6 B 80 B 76 B 82 Met 77.6 81 75 84 89Union County Public Schools 900341 Porter Ridge Elementary 6 C 67 C 67 C 69 Met 82.9 63 63 64 62Union County Public Schools 900342 Porter Ridge High School 6 B 77 Met 72.8 78 69 73 63 72 83 >95Union County Public Schools 900343 Porter Ridge Middle School 6 B 74 B 75 C 67 Exceeded 93.5 69 72 61 75 >95Union County Public Schools 900344 Parkwood High 6 C 66 NotMet 59.5 68 53 59 49 61 79 >95Union County Public Schools 900346 Parkwood Middle 6 C 63 C 66 C 57 Met 72.3 61 63 51 72 >95Union County Public Schools 900347 Poplin Elementary 6 B 79 B 78 B 80 Met 81.0 78 77 79 75Union County Public Schools 900348 Piedmont High 6 B 83 Exceeded 96.7 80 71 71 83 64 80 >95Union County Public Schools 900350 Piedmont Middle 6 B 76 B 75 B 71 Exceeded 90.1 73 73 67 82 >95Union County Public Schools 900351 Rock Rest Elementary 6 B 73 C 59 A 85 Exceeded 88.8 69 53 84 75Union County Public Schools 900352 Prospect Elementary 6 C 56 C 60 C 56 NotMet 65.5 54 58 50 54
NCDPI/Division of Accountability Services 47 of 116 February 5, 2015

Union County Public Schools 900353 Sandy Ridge Elementary 6 A 85 B 82 A 85 Exceeded 89.1 84 81 84 91Union County Public Schools 900354 Sardis Elementary 6 B 70 C 66 B 71 Met 79.9 67 62 69 75Union County Public Schools 900356 Shiloh Elementary 6 B 79 B 74 A 85 Met 75.8 80 72 88 80Union County Public Schools 900358 Stallings Elementary 6 A 85 B 81 B 82 Met 77.8 85 82 84 94Union County Public Schools 900360 Sun Valley High 6 B 75 Met 83.3 73 63 69 63 59 69 >95Union County Public Schools 900362 Sun Valley Middle 6 B 70 B 71 C 61 Exceeded 86.7 66 69 56 82 >95Union County Public Schools 900363 Sun Valley Elementary 6 B 76 B 72 B 78 Met 83.2 75 69 78 81Union County Public Schools 900364 Union Elementary 6 C 65 C 60 C 68 Met 84.4 60 54 64 66Union County Public Schools 900365 South Providence 6 N/A N/A N/AUnion County Public Schools 900366 Central Academy of Technology & Arts 6 A 93 Exceeded 95.7 93 91 95 89 87 86 >95Union County Public Schools 900367 Union County Early College 6 A 89 Exceeded 86.3 90 91 86 83 >95 >95Union County Public Schools 900368 Unionville Elementary 6 B 73 B 71 B 77 Met 79.1 72 68 76 67Union County Public Schools 900370 Walter Bickett Elementary 6 D 47 D 40 D 52 Exceeded 86.7 37 31 41 39Union County Public Schools 900372 Waxhaw Elementary 6 C 69 C 69 C 65 Met 82.0 66 66 62 80Union County Public Schools 900376 Weddington Elementary 6 A 91 A 87 A 94 Met 80.2 94 90 >95 95Union County Public Schools 900377 Weddington High 6 A 91 Exceeded 90.5 91 90 87 87 84 88 >95Union County Public Schools 900378 Weddington Middle 6 A 92 A 88 A 90 Exceeded 98.5 90 88 89 >95 >95Union County Public Schools 900380 Wesley Chapel Elementary 6 B 83 B 84 B 79 Exceeded 93.1 81 81 78 90Union County Public Schools 900384 Western Union Elementary 6 D 54 D 54 C 57 NotMet 67.3 51 48 53 54Union County Public Schools 900388 Wingate Elementary 6 C 60 C 56 C 68 Met 72.9 57 50 66 54Union County Public Schools 900391 Marvin Ridge Middle 6 A 92 A 89 A 93 Exceeded 100.0 91 89 92 89 >95Union County Public Schools 900392 Wolfe School 6 N/A N/A N/AUnion County Public Schools 900393 Marvin Ridge High 6 A 91 Exceeded 89.3 91 89 91 77 95 92 >95Vance County Schools 910304 Aycock Elementary 3 C 67 C 64 C 68 Met 81.4 63 59 68 60Vance County Schools 910308 Carver Elementary 3 C 63 C 58 B 70 NotMet 66.9 62 54 71 57Vance County Schools 910311 Clarke Elementary 3 C 56 D 41 C 57 Exceeded 89.0 47 32 51 85Vance County Schools 910314 Dabney Elementary 3 D 50 D 51 D 52 Met 73.9 44 43 47 38Vance County Schools 910316 Eaton-Johnson Middle 3 F 36 D 43 F 28 NotMet 54.6 31 34 22 41 51Vance County Schools 910320 Henderson Middle 3 F 35 D 40 F 27 NotMet 50.0 31 34 21 43 56Vance County Schools 910340 New Hope Elementary 3 F 32 F 35 F 31 NotMet 59.6 25 24 24 33Vance County Schools 910346 E O Young Jr Elementary 3 F 35 D 44 F 36 NotMet 57.0 30 35 30 14Vance County Schools 910356 Pinkston Street Elementary 3 D 52 D 53 D 51 NotMet 63.2 49 48 47 60Vance County Schools 910360 E M Rollins Elementary 3 F 34 D 44 F 31 NotMet 58.9 28 35 24 16Vance County Schools 910364 Southern Vance High 3 D 50 NotMet 62.3 47 23 44 27 36 52 >95Vance County Schools 910368 Western Vance High 3 N/A N/A N/AVance County Schools 910370 Northern Vance High 3 D 50 NotMet 50.0 50 26 43 20 47 68 >95Vance County Schools 910376 L B Yancey Elementary 3 D 48 F 38 C 59 Met 78.9 40 30 52 35Vance County Schools 910380 Zeb Vance Elementary 3 D 49 D 49 D 44 Met 71.2 43 43 38 62Vance County Schools 910382 Vance Co Early College 3 C 69 NotMet 69.3 69 50 80 50 68 >95Wake County Schools 920302 River Bend Elementary 3 C 62 C 61 C 60 Met 81.1 57 55 56 68Wake County Schools 920304 Adams Elementary 3 B 77 B 74 B 79 Met 83.1 76 72 79 79Wake County Schools 920306 Herbert Akins Rd Elementary 3 B 74 B 76 B 73 Met 75.9 74 74 72 75Wake County Schools 920307 Alston Ridge Elementary 3 B 82 B 82 B 82 NotMet 65.2 86 84 87 88Wake County Schools 920308 Apex Elementary 3 B 74 B 77 B 74 NotMet 67.2 76 76 77 76Wake County Schools 920312 Apex Middle 3 B 83 B 78 B 81 Exceeded 90.9 81 78 78 94 89
NCDPI/Division of Accountability Services 48 of 116 February 5, 2015

Wake County Schools 920316 Apex High 3 A 86 Exceeded 87.5 85 78 86 78 87 85 93Wake County Schools 920318 Athens Drive High 3 B 80 Exceeded 100.0 75 65 72 66 71 80 95Wake County Schools 920320 Aversboro Elementary 3 C 64 C 61 C 66 Met 83.3 59 56 62 59Wake County Schools 920324 Longview 3 N/A N/A N/AWake County Schools 920325 Banks Rd Elementary 3 B 76 B 75 B 75 Exceeded 85.9 73 73 71 78Wake County Schools 920326 Baileywick Road Elementary 3 C 62 C 60 C 66 Met 75.4 59 56 62 57Wake County Schools 920327 Ballentine Elementary 3 C 67 C 69 C 65 Met 71.3 66 66 64 71Wake County Schools 920328 Baucom Elementary 3 B 80 B 79 B 81 Exceeded 85.7 78 77 80 79Wake County Schools 920329 Barwell Road Elementary 3 D 46 D 45 D 48 NotMet 61.8 42 40 43 45Wake County Schools 920334 Brassfield Elementary 3 B 82 B 81 B 83 Met 80.7 82 81 83 81Wake County Schools 920336 Brentwood Elementary 3 D 53 D 50 C 56 Met 76.9 47 44 49 52Wake County Schools 920340 Briarcliff Elementary 3 B 76 B 73 B 75 Met 79.2 75 72 75 85Wake County Schools 920342 Brier Creek Elementary 3 B 72 B 73 B 72 Met 76.2 71 71 72 67Wake County Schools 920344 Brooks Elementary 3 B 79 B 79 B 78 Exceeded 86.2 78 77 78 82Wake County Schools 920348 Needham Broughton High 3 B 74 Exceeded 87.7 71 55 74 54 74 70 94Wake County Schools 920352 Bugg Elementary 3 D 52 D 49 D 54 Met 72.5 46 45 47 50Wake County Schools 920356 Carnage Middle 3 B 70 C 69 C 62 Met 73.8 69 68 61 83 90Wake County Schools 920358 Carpenter Elementary 3 B 76 B 78 B 75 Met 73.5 76 77 76 77Wake County Schools 920360 Carroll Middle 3 D 47 C 55 F 37 NotMet 59.8 44 49 32 62 67Wake County Schools 920362 Carver Elementary 3 C 64 C 57 C 67 Exceeded 90.2 57 51 61 66Wake County Schools 920364 Cary Elementary 3 B 71 B 71 B 74 NotMet 66.6 73 71 74 73Wake County Schools 920368 Cary High 3 B 83 Exceeded 100.0 79 66 78 79 78 80 91Wake County Schools 920369 Cedar Fork Elementary 3 A 89 A 87 A 89 Exceeded 86.5 89 87 91 92Wake County Schools 920370 Centennial Campus Middle 3 C 57 C 60 D 47 Met 72.3 53 54 44 78 64Wake County Schools 920376 Combs Elementary 3 B 73 B 70 B 73 Exceeded 87.1 69 67 70 73Wake County Schools 920380 Conn Elementary 3 C 59 C 63 C 55 Met 70.8 56 58 52 59Wake County Schools 920384 Creech Road Elementary 3 D 47 D 45 D 51 Met 80.4 39 36 43 34Wake County Schools 920388 Daniels Middle 3 C 60 C 62 D 53 NotMet 59.1 60 60 51 76 78Wake County Schools 920390 Davis Drive Elementary 3 A 93 A 89 A 93 Exceeded 93.8 93 90 93 >95Wake County Schools 920391 Davis Drive Middle 3 A 90 A A 88 Exceeded 94.3 89 86 87 >95 >95Wake County Schools 920393 Dillard Drive Elementary 3 C 60 C 63 C 55 Met 80.1 55 57 53 59Wake County Schools 920394 Dillard Drive Middle 3 C 63 C 60 D 54 Met 80.4 58 55 49 80 93Wake County Schools 920396 Douglas Elementary 3 C 64 C 67 C 68 Met 74.7 62 65 64 45Wake County Schools 920398 Durant Road Elementary 3 B 76 B 71 B 78 Exceeded 92.4 72 67 75 75Wake County Schools 920399 Durant Road Middle 3 C 62 C 65 D 51 NotMet 67.9 61 61 49 78 86Wake County Schools 920400 Reedy Creek Middle 3 C 56 C 58 D 48 NotMet 57.8 56 58 45 75 80Wake County Schools 920402 East Cary Middle 3 C 69 C 68 C 65 Met 70.8 69 68 63 83 94Wake County Schools 920403 East Garner Elementary 3 C 57 D 54 D 54 Exceeded 89.1 49 47 46 66Wake County Schools 920404 East Garner Middle 3 D 48 D 51 D 41 NotMet 61.1 45 46 36 63 65Wake County Schools 920408 East Millbrook Middle 3 D 49 D 45 F 38 NotMet 67.5 44 41 32 74 74Wake County Schools 920410 East Wake Middle 3 D 47 D 53 F 39 NotMet 64.7 42 44 34 54 68Wake County Schools 920412 William G Enloe High 3 B 72 Met 76.7 70 59 76 61 75 76 71Wake County Schools 920413 Forestville Road Elementary 3 C 62 C 55 C 67 Met 82.1 57 48 63 64Wake County Schools 920414 Farmington Woods Elementary 3 B 75 B 78 B 72 Met 81.9 74 76 71 75Wake County Schools 920415 Fox Road Elementary 3 D 49 D 46 D 51 NotMet 68.9 44 39 47 50
NCDPI/Division of Accountability Services 49 of 116 February 5, 2015

Wake County Schools 920416 Fuller Elementary 3 B 72 C 68 B 74 Exceeded 93.3 67 63 69 71Wake County Schools 920417 Forest Pines Elementary 3 C 69 C 68 C 67 Met 74.1 67 65 66 76Wake County Schools 920420 Fuquay-Varina Elementary 3 B 74 B 71 B 74 Exceeded 86.3 71 67 72 81Wake County Schools 920424 Fuquay-Varina Middle 3 C 63 C 64 D 52 Met 83.3 58 58 48 73 93Wake County Schools 920428 Fuquay-Varina High 3 B 74 Exceeded 90.0 70 63 68 45 67 51 89Wake County Schools 920436 Garner High 3 B 71 Exceeded 97.6 64 45 59 57 54 88 92Wake County Schools 920438 River Oaks Middle 3 N/A N/A N/AWake County Schools 920439 Green Hope Elementary 3 A 88 A 86 A 91 Exceeded 94.4 87 85 89 85Wake County Schools 920440 Green Elementary 3 C 55 D 54 C 55 Met 72.3 51 47 52 58Wake County Schools 920441 Green Hope High 3 A 90 Exceeded 89.5 90 82 90 84 91 88 >95Wake County Schools 920442 Hilburn Drive Academy 3 C 69 C 68 B 72 Exceeded 86.2 65 64 67 55 >95Wake County Schools 920443 Highcroft Elementary 3 A 91 A 90 A 91 Exceeded 88.6 91 91 92 91Wake County Schools 920444 Heritage Middle 3 B 80 B 79 B 74 Met 81.6 79 78 73 88 93Wake County Schools 920445 Heritage High 3 B 77 Exceeded 92.9 74 59 75 63 68 68 93Wake County Schools 920446 Hodge Road Elementary 3 D 44 D 41 D 47 Met 82.4 34 30 38 38Wake County Schools 920447 Holly Springs Elementary 3 B 82 B 82 B 79 Exceeded 87.5 80 80 79 84Wake County Schools 920448 Hunter Elementary 3 C 66 C 66 C 65 Met 83.0 62 61 61 68Wake County Schools 920449 Holly Ridge Elementary 3 B 76 B 76 B 71 Met 84.8 73 73 71 81Wake County Schools 920450 Holly Ridge Middle 3 C 69 C 68 C 60 Met 74.5 68 66 60 83 >95Wake County Schools 920451 Harris Creek Elementary 3 C 69 B 70 C 68 Exceeded 86.8 65 65 64 69Wake County Schools 920452 Jeffreys Grove Elementary 3 C 69 B 70 C 66 Met 80.1 66 67 64 70Wake County Schools 920453 Jones Dairy Elementary 3 A 86 A 85 A 86 Met 82.6 86 85 89 84Wake County Schools 920454 Heritage Elementary 3 B 79 B 78 B 78 NotMet 67.7 82 81 81 85Wake County Schools 920455 Holly Springs High 3 B 83 Exceeded 93.1 81 72 79 69 79 84 >95Wake County Schools 920456 Joyner Elementary 3 B 73 B 75 B 73 NotMet 66.1 75 74 76 77Wake County Schools 920457 Holly Grove Elementary 3 B 79 B 78 B 79 NotMet 67.6 81 79 82 85Wake County Schools 920458 Holly Grove Middle 3 C 66 C 66 C 57 NotMet 59.8 67 67 57 88 84Wake County Schools 920460 Kingswood Elementary 3 C 66 C 64 C 66 Met 79.5 62 60 63 67Wake County Schools 920464 Knightdale Elementary 3 D 53 D 49 C 57 NotMet 64.7 50 44 54 56Wake County Schools 920466 Knightdale High 3 C 64 Exceeded 87.6 58 46 47 42 42 71 90Wake County Schools 920467 Laurel Park Elementary 3 B 82 B 81 B 81 Exceeded 85.6 81 81 81 86Wake County Schools 920468 Lacy Elementary 3 B 79 B 78 B 78 Met 84.6 78 76 78 83Wake County Schools 920469 Leesville Road Elementary 3 B 71 B 73 B 71 Met 71.3 71 71 71 70Wake County Schools 920470 Lead Mine Elementary 3 C 68 C 66 B 70 NotMet 67.2 68 65 69 78Wake County Schools 920471 Leesville Road Middle 3 B 71 B 73 C 63 Met 77.4 70 70 61 83 92Wake County Schools 920472 Ligon Middle 3 B 73 B 74 C 62 Met 78.3 71 72 61 85 92Wake County Schools 920473 Leesville Road High 3 A 85 Exceeded 100.0 81 77 78 72 77 75 >95Wake County Schools 920474 Lake Myra Elementary 3 C 56 C 57 D 54 NotMet 62.0 55 54 53 59Wake County Schools 920476 Lincoln Heights Elementary 3 D 50 D 49 D 48 Met 81.8 42 41 40 50Wake County Schools 920480 Lockhart Elementary 3 C 59 C 58 C 56 Met 77.6 54 53 52 65Wake County Schools 920484 Lufkin Road Middle 3 B 84 B 77 B 81 Exceeded 93.4 81 78 78 90 >95Wake County Schools 920488 Lynn Road Elementary 3 D 52 D 51 D 50 NotMet 67.9 48 45 46 62Wake County Schools 920492 Martin Middle 3 B 73 C 69 C 68 Met 77.1 72 69 66 81 95Wake County Schools 920494 Middle Creek Elementary 3 B 82 B 79 B 81 Exceeded 91.2 80 76 80 87Wake County Schools 920495 Middle Creek High 3 B 83 Exceeded 100.0 79 71 77 76 67 89 95
NCDPI/Division of Accountability Services 50 of 116 February 5, 2015
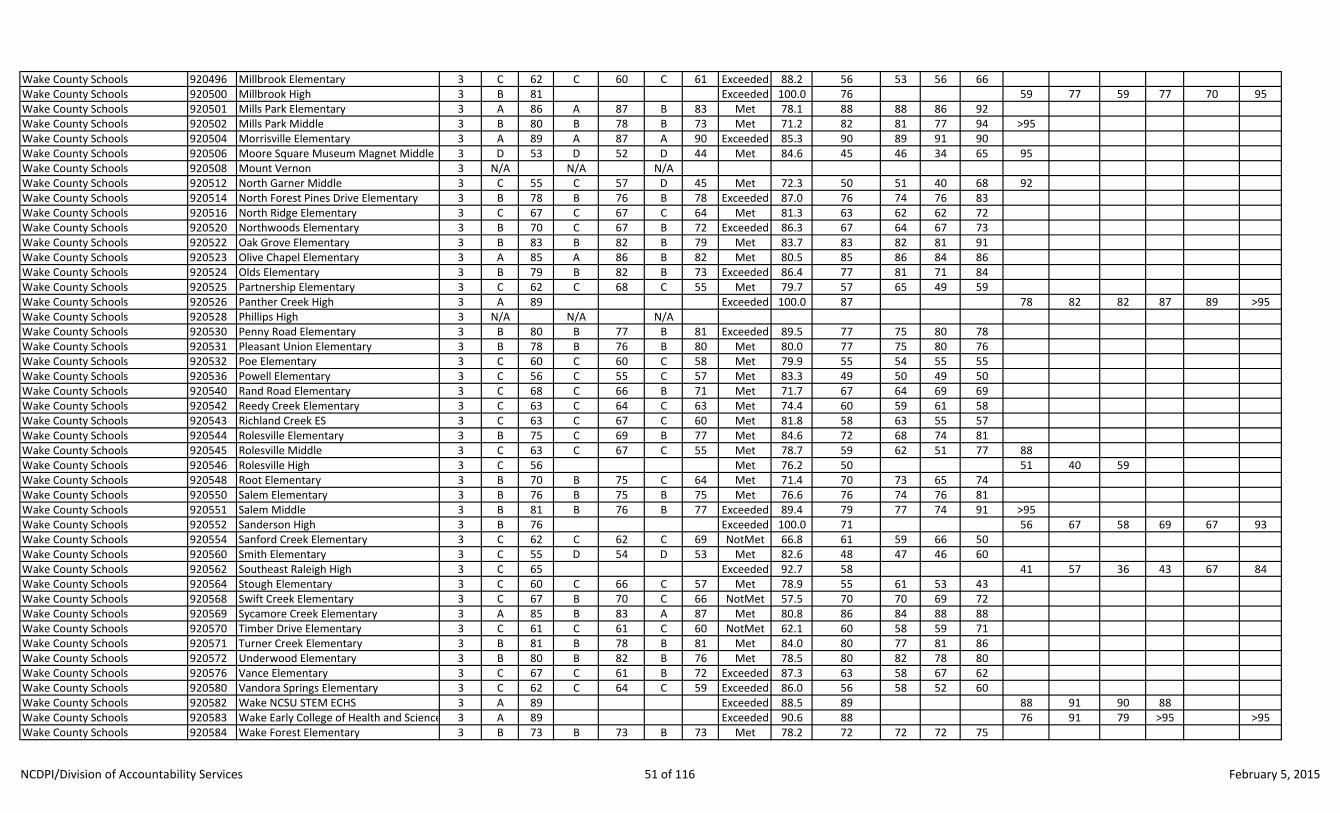
Wake County Schools 920496 Millbrook Elementary 3 C 62 C 60 C 61 Exceeded 88.2 56 53 56 66Wake County Schools 920500 Millbrook High 3 B 81 Exceeded 100.0 76 59 77 59 77 70 95Wake County Schools 920501 Mills Park Elementary 3 A 86 A 87 B 83 Met 78.1 88 88 86 92Wake County Schools 920502 Mills Park Middle 3 B 80 B 78 B 73 Met 71.2 82 81 77 94 >95Wake County Schools 920504 Morrisville Elementary 3 A 89 A 87 A 90 Exceeded 85.3 90 89 91 90Wake County Schools 920506 Moore Square Museum Magnet Middle 3 D 53 D 52 D 44 Met 84.6 45 46 34 65 95Wake County Schools 920508 Mount Vernon 3 N/A N/A N/AWake County Schools 920512 North Garner Middle 3 C 55 C 57 D 45 Met 72.3 50 51 40 68 92Wake County Schools 920514 North Forest Pines Drive Elementary 3 B 78 B 76 B 78 Exceeded 87.0 76 74 76 83Wake County Schools 920516 North Ridge Elementary 3 C 67 C 67 C 64 Met 81.3 63 62 62 72Wake County Schools 920520 Northwoods Elementary 3 B 70 C 67 B 72 Exceeded 86.3 67 64 67 73Wake County Schools 920522 Oak Grove Elementary 3 B 83 B 82 B 79 Met 83.7 83 82 81 91Wake County Schools 920523 Olive Chapel Elementary 3 A 85 A 86 B 82 Met 80.5 85 86 84 86Wake County Schools 920524 Olds Elementary 3 B 79 B 82 B 73 Exceeded 86.4 77 81 71 84Wake County Schools 920525 Partnership Elementary 3 C 62 C 68 C 55 Met 79.7 57 65 49 59Wake County Schools 920526 Panther Creek High 3 A 89 Exceeded 100.0 87 78 82 82 87 89 >95Wake County Schools 920528 Phillips High 3 N/A N/A N/AWake County Schools 920530 Penny Road Elementary 3 B 80 B 77 B 81 Exceeded 89.5 77 75 80 78Wake County Schools 920531 Pleasant Union Elementary 3 B 78 B 76 B 80 Met 80.0 77 75 80 76Wake County Schools 920532 Poe Elementary 3 C 60 C 60 C 58 Met 79.9 55 54 55 55Wake County Schools 920536 Powell Elementary 3 C 56 C 55 C 57 Met 83.3 49 50 49 50Wake County Schools 920540 Rand Road Elementary 3 C 68 C 66 B 71 Met 71.7 67 64 69 69Wake County Schools 920542 Reedy Creek Elementary 3 C 63 C 64 C 63 Met 74.4 60 59 61 58Wake County Schools 920543 Richland Creek ES 3 C 63 C 67 C 60 Met 81.8 58 63 55 57Wake County Schools 920544 Rolesville Elementary 3 B 75 C 69 B 77 Met 84.6 72 68 74 81Wake County Schools 920545 Rolesville Middle 3 C 63 C 67 C 55 Met 78.7 59 62 51 77 88Wake County Schools 920546 Rolesville High 3 C 56 Met 76.2 50 51 40 59Wake County Schools 920548 Root Elementary 3 B 70 B 75 C 64 Met 71.4 70 73 65 74Wake County Schools 920550 Salem Elementary 3 B 76 B 75 B 75 Met 76.6 76 74 76 81Wake County Schools 920551 Salem Middle 3 B 81 B 76 B 77 Exceeded 89.4 79 77 74 91 >95Wake County Schools 920552 Sanderson High 3 B 76 Exceeded 100.0 71 56 67 58 69 67 93Wake County Schools 920554 Sanford Creek Elementary 3 C 62 C 62 C 69 NotMet 66.8 61 59 66 50Wake County Schools 920560 Smith Elementary 3 C 55 D 54 D 53 Met 82.6 48 47 46 60Wake County Schools 920562 Southeast Raleigh High 3 C 65 Exceeded 92.7 58 41 57 36 43 67 84Wake County Schools 920564 Stough Elementary 3 C 60 C 66 C 57 Met 78.9 55 61 53 43Wake County Schools 920568 Swift Creek Elementary 3 C 67 B 70 C 66 NotMet 57.5 70 70 69 72Wake County Schools 920569 Sycamore Creek Elementary 3 A 85 B 83 A 87 Met 80.8 86 84 88 88Wake County Schools 920570 Timber Drive Elementary 3 C 61 C 61 C 60 NotMet 62.1 60 58 59 71Wake County Schools 920571 Turner Creek Elementary 3 B 81 B 78 B 81 Met 84.0 80 77 81 86Wake County Schools 920572 Underwood Elementary 3 B 80 B 82 B 76 Met 78.5 80 82 78 80Wake County Schools 920576 Vance Elementary 3 C 67 C 61 B 72 Exceeded 87.3 63 58 67 62Wake County Schools 920580 Vandora Springs Elementary 3 C 62 C 64 C 59 Exceeded 86.0 56 58 52 60Wake County Schools 920582 Wake NCSU STEM ECHS 3 A 89 Exceeded 88.5 89 88 91 90 88Wake County Schools 920583 Wake Early College of Health and Science 3 A 89 Exceeded 90.6 88 76 91 79 >95 >95Wake County Schools 920584 Wake Forest Elementary 3 B 73 B 73 B 73 Met 78.2 72 72 72 75
NCDPI/Division of Accountability Services 51 of 116 February 5, 2015

Wake County Schools 920585 Wake Young Men's Leadership Academy 3 C 67 B 75 D 53 NotMet 59.2 69 75 52 91 75 90 54Wake County Schools 920586 Wake Young Women's Leadership Academy 3 B 78 B 80 C 67 Exceeded 90.0 75 79 63 93 68 93 69Wake County Schools 920588 Wake Forest High School 3 B 80 Exceeded 100.0 76 59 69 77 69 87 93Wake County Schools 920592 Wake Forest Middle School 3 C 66 C 68 D 53 Exceeded 87.2 61 62 49 83 78Wake County Schools 920593 Wakefield Elementary 3 C 60 C 63 C 61 Met 71.4 57 58 58 50Wake County Schools 920594 Wakefield Middle 3 C 69 B 73 C 56 Met 74.2 68 70 55 87 83Wake County Schools 920595 Wakefield High 3 B 79 Exceeded 100.0 74 63 69 69 64 68 92Wake County Schools 920596 Washington Elementary 3 B 74 B 76 B 71 Exceeded 89.4 70 72 68 70Wake County Schools 920597 Wakelon Elementary 3 C 57 C 57 D 52 Met 76.7 52 52 47 65Wake County Schools 920598 Weatherstone Elementary 3 B 84 B 79 A 86 Exceeded 98.9 81 76 84 87Wake County Schools 920599 Walnut Creek ES 3 D 44 D 47 D 44 NotMet 63.6 40 39 39 43Wake County Schools 920600 Wendell Elementary 3 C 60 C 56 D 52 Exceeded 90.4 52 48 45 79Wake County Schools 920601 Wendell Middle 3 D 46 D 50 F 35 NotMet 56.4 43 43 31 74 56Wake County Schools 920604 West Cary Middle 3 B 72 B 72 C 64 NotMet 67.2 73 72 65 90 90Wake County Schools 920606 West Lake Elementary 3 B 76 B 75 B 76 Exceeded 90.1 72 72 72 73Wake County Schools 920607 West Lake Middle 3 B 73 B 72 C 67 Exceeded 85.0 71 70 63 82 >95Wake County Schools 920608 West Millbrook Middle 3 C 63 C 64 D 52 Met 71.2 61 62 49 78 93Wake County Schools 920616 Wilburn Elementary 3 D 51 D 51 D 51 Met 80.5 43 43 44 42Wake County Schools 920618 Wildwood Forest Elementary 3 C 58 C 60 C 58 NotMet 56.9 58 57 58 59Wake County Schools 920620 Wiley Elementary 3 B 74 B 71 B 72 Exceeded 85.2 71 67 70 82Wake County Schools 920624 Willow Springs Elementary 3 B 83 B 77 B 83 Exceeded 92.7 80 76 81 90Wake County Schools 920626 Yates Mill Elementary 3 B 74 C 67 B 76 Met 83.1 72 64 75 85Wake County Schools 920628 York Elementary 3 C 65 C 65 C 62 Met 74.7 63 62 59 75Wake County Schools 920632 Zebulon Elementary 3 C 66 C 68 C 64 Exceeded 85.6 61 62 60 61Wake County Schools 920636 Zebulon Middle 3 D 54 C 60 D 43 NotMet 69.0 50 54 39 70 51Wake County Schools 920700 East Wake School of Health Science 3 B 73 Exceeded 89.3 68 46 71 49 53 74 >95Wake County Schools 920701 East Wake School of Integrated Technolog 3 C 60 Met 78.9 55 37 58 31 56 52 93Wake County Schools 920702 East Wake School of Arts Education and G 3 C 68 Exceeded 92.8 62 33 59 53 38 58 92Wake County Schools 920703 East Wake School of Engineering 3 D 54 NotMet 62.8 52 30 42 30 35 78 95Warren County Schools 930330 Mariam Boyd Elementary 3 D 45 D 44 D 43 Met 70.1 39 38 35 57Warren County Schools 930340 Northside Elementary 3 F 30 F 39 F 26 NotMet 59.2 23 29 17 21Warren County Schools 930344 South Warren Elementary 3 D 53 D 47 C 58 Met 84.9 45 41 50 43Warren County Schools 930348 Vaughan Elementary 3 C 56 C 59 D 53 Met 73.2 52 55 48 58Warren County Schools 930352 Warren County High 3 C 56 Met 84.5 49 39 40 25 35 43 >95Warren County Schools 930354 Warren County Middle 3 F 38 D 41 F 27 NotMet 59.7 32 35 17 62 83Warren County Schools 930360 Warren Early College High 3 C 65 Met 73.3 64 44 52 49 68 >95Warren County Schools 930700 Warren New Tech High 3 C 66 Met 73.2 65 31 75 55 53 >95Washington County Schools 940306 Creswell Elementary 1 D 48 D 51 D 44 NotMet 62.0 45 47 39 57Washington County Schools 940308 Creswell High 1 D 45 D 47 F 20 NotMet 56.1 42 40 10 63 25 50 26 36 64 >95Washington County Schools 940314 Pines Elementary 1 F 33 F 38 F 31 NotMet 52.1 28 33 26 24Washington County Schools 940316 Plymouth High 1 C 57 Met 80.2 51 24 38 22 30 31 >95Washington County Schools 940328 Washington County Union 1 D 43 D 43 F 34 Exceeded 90.1 31 31 24 40 >95Watauga County Schools 950308 Bethel Elementary 7 D 54 C 60 D 45 Met 77.6 49 55 38 63Watauga County Schools 950312 Blowing Rock Elementary 7 B 84 A 85 B 78 Exceeded 90.7 83 84 77 90 >95Watauga County Schools 950316 Cove Creek Elementary 7 C 69 B 70 C 62 Met 79.6 66 66 60 80 >95
NCDPI/Division of Accountability Services 52 of 116 February 5, 2015

Watauga County Schools 950320 Green Valley Elementary 7 C 62 C 63 C 55 Exceeded 90.9 55 57 46 66 >95Watauga County Schools 950322 Hardin Park Elementary 7 B 76 B 74 B 73 Exceeded 88.4 73 72 70 79 >95Watauga County Schools 950324 Mabel Elementary 7 C 68 C 66 C 67 Met 83.2 65 62 63 74 >95Watauga County Schools 950328 Parkway Elementary 7 B 75 B 77 C 68 Exceeded 91.0 71 74 64 79 >95Watauga County Schools 950332 Valle Crucis Elementary 7 B 73 B 75 C 66 Met 84.1 71 73 62 83 >95Watauga County Schools 950336 Watauga High 7 B 75 Met 70.3 77 64 71 65 75 79 >95Wayne County Public Schools 960312 Brogden Middle 2 F 31 F 38 F 26 NotMet 54.7 26 29 18 28 71Wayne County Public Schools 960314 Brogden Primary 2 F 39 D 40 F 37 Met 80.4 29 29 29Wayne County Public Schools 960316 Carver Elementary 2 D 41 D 44 F 39 NotMet 66.5 35 37 33Wayne County Public Schools 960318 Carver Heights Elementary 2 F 38 D 41 F 35 Met 81.3 27 31 23Wayne County Public Schools 960324 Charles B Aycock High 2 B 71 Met 80.2 69 54 63 59 51 94 >95Wayne County Public Schools 960326 Dillard Middle 2 F 21 F 29 F 18 NotMet 50.0 14 19 8 12 54Wayne County Public Schools 960329 Eastern Wayne Elementary 2 D 40 D 49 D 42 NotMet 59.6 36 43 33 24Wayne County Public Schools 960330 Eastern Wayne High 2 C 60 NotMet 58.0 60 42 55 35 44 82 95Wayne County Public Schools 960331 Eastern Wayne Middle 2 D 52 D 53 D 42 Exceeded 91.9 43 45 29 65 90Wayne County Public Schools 960332 Edgewood Cmty Developmental 2 N/A N/A N/AWayne County Public Schools 960334 Fremont STARS Elementary 2 D 53 C 55 D 47 Met 83.6 45 47 40 56Wayne County Public Schools 960335 Goldsboro High 2 D 46 NotMet 58.5 43 14 31 19 21 61 >95Wayne County Public Schools 960336 Grantham 2 C 62 C 58 C 55 Exceeded 90.6 54 52 48 76 92Wayne County Public Schools 960340 Greenwood Middle 2 C 56 C 56 D 53 Met 83.4 49 49 45 53 >95Wayne County Public Schools 960344 Meadow Lane Elementary 2 C 60 C 60 C 61 Met 77.4 56 56 56Wayne County Public Schools 960348 Mount Olive Middle 2 D 53 D 54 D 44 Exceeded 93.4 43 45 31 54 89Wayne County Public Schools 960360 Norwayne Middle 2 C 68 B 70 C 61 Exceeded 99.0 60 62 52 69 >95Wayne County Public Schools 960370 Rosewood Elementary 2 C 65 C 67 C 58 Met 79.4 62 62 55 81Wayne County Public Schools 960372 Rosewood High 2 C 62 NotMet 64.1 62 44 57 43 48 92 >95Wayne County Public Schools 960374 Rosewood Middle 2 C 62 C 59 C 60 Met 81.5 57 56 53 61 >95Wayne County Public Schools 960376 School Street Elementary 2 F 38 F 39 F 37 Exceeded 85.1 27 29 25Wayne County Public Schools 960380 Southern Wayne High 2 D 51 NotMet 50.4 52 35 43 26 34 75 >95Wayne County Public Schools 960382 Spring Creek Elementary 2 C 57 D 53 C 58 Exceeded 86.8 50 47 50 56Wayne County Public Schools 960386 Spring Creek High 2 C 56 D 52 F 37 Met 77.1 50 44 28 56 37 49 61 49 94 >95Wayne County Public Schools 960388 Tommy's Road Elementary 2 D 53 C 59 D 45 Met 76.4 47 53 37 55Wayne County Public Schools 960390 North Drive Elementary 2 D 43 D 46 D 40 Met 83.2 33 36 31Wayne County Public Schools 960450 Northeast Elementary 2 C 57 C 62 C 55 NotMet 56.9 57 60 54 60Wayne County Public Schools 960454 Northwest Elementary 2 C 58 C 59 C 58 NotMet 67.5 55 57 52 58Wayne County Public Schools 960488 Wayne Middle / High Academy 2 N/A N/A N/AWayne County Public Schools 960490 Wayne Early / Middle College High 2 A 92 Met 83.5 94 88 >95 89 92 >95Wayne County Public Schools 960700 Wayne School of Engineering 2 A 86 A 89 B 80 Exceeded 92.4 84 89 77 65 83 83 64 >95 >95Wilkes County Schools 970308 Boomer-Ferguson Elementary 7 C 66 C 65 C 57 Exceeded 90.0 60 61 49 82Wilkes County Schools 970310 C B Eller Elementary 7 C 61 C 59 C 60 Exceeded 88.4 55 52 53 65Wilkes County Schools 970312 C C Wright Elementary 7 D 50 D 52 D 47 NotMet 59.3 48 47 44 59Wilkes County Schools 970315 Central Wilkes Middle 7 D 47 D 52 D 40 NotMet 55.4 45 50 34 58 90Wilkes County Schools 970320 East Wilkes High 7 C 63 NotMet 56.7 64 58 48 41 58 62 >95Wilkes County Schools 970322 East Wilkes Middle 7 C 63 C 66 D 54 Exceeded 85.8 58 61 47 77 94Wilkes County Schools 970337 Millers Creek Elementary 7 C 63 C 58 C 64 Met 84.9 57 52 59 66Wilkes County Schools 970340 Moravian Falls Elementary 7 C 67 C 65 C 67 Exceeded 92.1 61 60 61 63
NCDPI/Division of Accountability Services 53 of 116 February 5, 2015

Wilkes County Schools 970344 Mount Pleasant Elementary 7 C 63 C 64 C 58 Exceeded 85.4 57 58 52 67Wilkes County Schools 970348 Mountain View Elementary 7 C 65 C 58 C 67 Exceeded 91.0 59 52 60 77Wilkes County Schools 970352 Mulberry Elementary 7 C 64 C 58 C 65 Exceeded 88.4 57 51 60 69Wilkes County Schools 970356 North Wilkes High 7 C 64 NotMet 52.0 67 49 51 17 54 74 93Wilkes County Schools 970358 North Wilkes Middle 7 D 52 D 53 D 40 NotMet 59.5 50 50 36 79 >95Wilkes County Schools 970360 North Wilkesboro Elementary 7 D 46 D 52 D 43 NotMet 62.3 43 45 39 45Wilkes County Schools 970368 Roaring River Elementary 7 D 54 D 54 D 49 Exceeded 89.8 45 47 39 58Wilkes County Schools 970370 Ronda-Clingman Elementary 7 C 65 C 62 C 62 Exceeded 89.9 59 57 55 78Wilkes County Schools 970376 Traphill Elementary 7 D 51 D 51 D 52 Met 70.5 47 45 47 49Wilkes County Schools 970388 West Wilkes High 7 B 72 Met 80.1 70 62 57 59 62 52 >95Wilkes County Schools 970389 West Wilkes Middle 7 C 65 C 64 C 59 Exceeded 91.1 59 59 51 75 >95Wilkes County Schools 970390 Wilkes Central High 7 C 63 NotMet 58.0 64 53 51 44 58 73 88Wilkes County Schools 970392 Wilkesboro Elementary 7 B 73 B 70 B 72 Exceeded 91.6 69 66 67 81Wilkes County Schools 970393 Wilkes Early College High 7 B 77 Met 73.6 78 61 83 70 73 >95 >95Wilson County Schools 980306 Milton M Daniels Learning Cntr 3 N/A N/A N/AWilson County Schools 980308 B O Barnes Elementary 3 D 42 D 40 D 40 Met 82.3 32 30 30 46Wilson County Schools 980317 Charles H Darden Middle 3 F 38 D 45 F 17 Met 73.8 29 35 7 88 41Wilson County Schools 980318 Beddingfield High 3 C 63 Met 72.6 61 46 55 38 62 65 >95Wilson County Schools 980320 Elm City Elementary 3 D 51 C 56 D 44 Met 71.7 46 48 41 52Wilson County Schools 980324 Elm City Middle 3 C 64 C 65 C 58 Met 83.6 59 61 51 66 77Wilson County Schools 980336 Fike High 3 C 62 NotMet 56.9 63 49 53 50 59 72 >95Wilson County Schools 980338 Forest Hills Middle 3 C 55 C 60 D 42 Met 78.5 49 53 34 74 70Wilson County Schools 980340 Gardners Elementary 3 B 77 B 71 B 78 Exceeded 85.7 75 68 76 90Wilson County Schools 980342 James Hunt High 3 C 61 NotMet 58.8 61 49 58 45 51 78 89Wilson County Schools 980344 John W Jones Elementary 3 C 57 C 57 D 54 Exceeded 88.0 50 51 46 57Wilson County Schools 980348 Lee Woodard Elementary 3 D 45 C 56 F 36 NotMet 61.9 41 50 30 46Wilson County Schools 980352 Lucama Elementary 3 C 67 C 64 B 74 NotMet 65.9 68 62 74 67Wilson County Schools 980356 Margaret Hearne Elementary 3 F 35 F 38 F 36 NotMet 59.6 29 30 28 26Wilson County Schools 980357 Vick Elementary 3 F 38 F 39 F 34 Met 72.1 29 30 24 42Wilson County Schools 980360 New Hope Elementary 3 C 67 C 69 C 66 NotMet 55.4 69 69 69 72Wilson County Schools 980364 Rock Ridge Elementary 3 B 81 B 77 B 84 Exceeded 92.6 78 75 81 81Wilson County Schools 980380 Speight Middle 3 D 47 C 56 F 33 NotMet 60.8 43 50 26 81 34Wilson County Schools 980384 Springfield Middle 3 D 52 C 61 D 50 NotMet 57.6 51 56 44 68 38Wilson County Schools 980388 Stantonsburg Elementary 3 D 49 D 46 D 43 Exceeded 87.9 39 37 32 63Wilson County Schools 980390 Toisnot Middle 3 C 55 C 60 D 46 Exceeded 91.7 46 51 35 58 61Wilson County Schools 980392 Vinson-Bynum Elementary 3 C 59 C 57 D 54 Met 83.3 52 52 46 70Wilson County Schools 980396 Wells Elementary 3 D 49 C 55 D 50 NotMet 67.5 45 48 44 36Wilson County Schools 980398 Wilson Early College Academy 3 A 85 Met 84.5 85 80 >95 82 69 >95Wilson County Schools 980400 Winstead Elementary 3 F 38 D 44 F 34 NotMet 69.1 31 35 25 36Yadkin County Schools 990304 Boonville Elementary 7 C 66 C 62 C 65 Exceeded 86.6 61 57 60 81Yadkin County Schools 990308 Courtney Elementary 7 B 77 B 73 B 78 Exceeded 87.3 75 70 76 88Yadkin County Schools 990312 East Bend Elementary 7 C 60 C 58 C 57 Met 83.3 54 52 50 72Yadkin County Schools 990316 Fall Creek Elementary 7 C 64 C 65 C 60 Exceeded 90.4 58 59 53 70Yadkin County Schools 990320 Forbush Elementary 7 B 81 B 77 B 81 Exceeded 88.6 80 76 79 >95Yadkin County Schools 990321 Forbush Middle 7 C 58 C 61 D 52 NotMet 51.9 60 60 52 72 >95
NCDPI/Division of Accountability Services 54 of 116 February 5, 2015

Yadkin County Schools 990322 Forbush High 7 B 70 Exceeded 90.9 65 36 59 57 57 67 92Yadkin County Schools 990324 Jonesville Elementary 7 C 65 C 65 C 65 Met 77.4 63 61 62 70Yadkin County Schools 990325 Starmount Middle 7 D 54 D 49 D 48 NotMet 59.9 53 48 43 78 >95Yadkin County Schools 990326 Starmount High 7 C 64 Met 73.0 62 27 45 60 52 55 92Yadkin County Schools 990328 West Yadkin Elementary 7 C 60 C 60 C 57 Met 76.6 55 54 53 70Yadkin County Schools 990332 Yadkin Early College 7 A 88 Exceeded 87.4 88 90 92 73 75 >95Yadkin County Schools 990336 Yadkinville Elementary 7 C 57 C 57 C 55 Met 76.6 52 50 51 62Yadkin County Schools 990340 Yadkin Success Academy 7 N/A N/A N/AYancey County Schools 995304 Bald Creek Elementary 8 B 84 B 78 A 89 Exceeded 94.8 81 76 87 75Yancey County Schools 995308 Bee Log Elementary 8 B 75 B 73 B 75 Met 82.6 73 70 74 78Yancey County Schools 995312 Burnsville Elementary 8 C 60 C 63 D 50 Met 84.4 54 58 42 82Yancey County Schools 995316 Cane River Middle 8 C 69 C 69 C 61 Met 80.1 66 66 58 79 >95Yancey County Schools 995320 Clearmont Elementary 8 C 55 C 55 D 48 Met 82.6 48 49 39 67Yancey County Schools 995324 East Yancey Middle 8 B 72 C 68 C 68 Exceeded 90.3 67 64 63 80 >95Yancey County Schools 995328 Micaville Elementary 8 C 67 C 63 C 66 Met 84.0 62 57 62 80Yancey County Schools 995330 Mountain Heritage High 8 B 74 Met 74.0 75 63 63 71 59 70 >95Yancey County Schools 995336 South Toe Elementary 8 B 80 B 78 B 79 Exceeded 91.1 77 75 77 89Regional Schools 94Z000 Northeast Regional School - Biotech/Agri 1 B 78 Met 83.3 77 82 73 60Charter Schools 01B000 River Mill Academy 5 C 69 B 76 C 56 Met 81.6 66 72 53 71 33 78 49 69 >95Charter Schools 01C000 Clover Garden 5 C 68 C 69 C 60 Met 74.3 67 67 58 80 51 50 81 68 >95Charter Schools 01D000 The Hawbridge School 5 B 82 B 80 B 78 Met 83.8 82 82 76 >95 60 >95 73 88 81Charter Schools 06A000 Grandfather Academy 7 F 15 F 14 F 0 15 14 <5 20 29Charter Schools 06B000 Crossnore Academy 7 C 60 C 57 D 48 Met 73.4 56 53 41 67 43 73 60 >95Charter Schools 07A000 Washington Montessori 1 C 62 B 77 D 47 Met 76.5 58 76 39 60 80Charter Schools 09A000 Paul R. Brown Leadership Academy 4 F 23 F 30 F 13 NotMet 59.6 14 20 <5 25 8 33 33Charter Schools 10A000 Charter Day School 2 B 75 B 73 B 72 Exceeded 86.3 72 70 69 85 95Charter Schools 11A000 Evergreen Community Charter 8 B 72 B 76 C 65 NotMet 55.6 76 81 65 95 73Charter Schools 11B000 ArtSpace Charter School 8 C 69 B 72 C 61 Met 71.7 68 72 56 83 >95Charter Schools 11K000 Francine Delany New School 8 B 81 B 83 B 74 Exceeded 88.2 79 84 70 88 >95Charter Schools 12A000 New Dimensions 7 C 58 C 67 D 45 Met 70.1 55 64 40 72Charter Schools 13A000 Carolina International School 6 B 70 B 77 C 58 Exceeded 86.7 66 74 54 79 70 91 64Charter Schools 13B000 Cabarrus Charter Academy 6 B 75 B 75 B 72 Exceeded 85.1 72 73 70 82Charter Schools 16A000 Coastal Academy for Technology and Scien 2 D 42 42 60 40 75Charter Schools 16B000 Tiller School 2 A 86 A 86 A 86 NotMet 69.5 90 89 91 91Charter Schools 19A000 Chatham Charter 5 B 71 B 77 C 63 Met 72.8 71 76 62 74 67 80 77Charter Schools 19B000 Woods Charter 5 A 89 A 88 B 83 Exceeded 86.6 90 90 83 93 90 >95 88 >95 >95Charter Schools 19C000 Willow Oak Montessori 5 B 71 B 82 C 55 Met 80.4 69 83 55Charter Schools 20A000 The Learning Center 8 C 65 C 69 C 55 Exceeded 86.6 60 65 48 78Charter Schools 23A000 Pinnacle Classical Academy 6 C 69 B 75 C 63 Met 78.0 67 73 61 68Charter Schools 24B000 Flemington Academy 4 F 26 D 40 F 8 26 40 8 60 18 <5 8 11 86Charter Schools 24C000 SEGS (STEM Ed Global Society) Academy 4 F 25 F 21 F 24 Met 71.8 13 8 11 36Charter Schools 24N000 Columbus Charter School 4 C 64 C 61 C 60 Met 72.4 62 59 57 84 >95Charter Schools 26B000 Alpha Academy 4 C 56 C 58 D 52 Met 73.2 51 53 47 61Charter Schools 27A000 Water's Edge Village School 1 C 56 C 56 C 56 56 56 56Charter Schools 32A000 Maureen Joy Charter School 3 D 53 D 47 D 49 Met 84.5 45 38 42 72 60
NCDPI/Division of Accountability Services 55 of 116 February 5, 2015

Charter Schools 32B000 Healthy Start Academy 3 F 35 D 41 F 27 Met 80.0 24 29 15 31Charter Schools 32C000 Carter Community Charter 3 D 51 D 48 D 44 Exceeded 93.4 41 39 31 77Charter Schools 32D000 Kestrel Heights School 3 D 53 C 63 D 48 NotMet 61.0 52 58 44 64 33 51 32 43 93Charter Schools 32H000 Research Triangle Charter 3 D 52 D 54 D 47 Exceeded 91.2 42 46 36 46 >95Charter Schools 32K000 Central Park School For Child 3 B 76 B 76 B 74 Met 76.5 76 75 73 86Charter Schools 32L000 Voyager Academy 3 B 76 B 74 B 70 Exceeded 94.5 72 71 64 81 64 74 20 73 >95Charter Schools 32M000 Global Scholars Academy 3 D 54 C 60 D 48 Exceeded 90.3 44 52 39 36Charter Schools 32N000 Research Triangle High 3 B 74 Met 80.7 72 66 85 68Charter Schools 32P000 The Institute Development Young Leaders 3 F 19 F 22 F 17 NotMet 64.1 8 12 <5 7Charter Schools 33A000 North East Carolina Prep 3 F 31 F 39 F 23 NotMet 50.0 26 34 16 41 18Charter Schools 34B000 Quality Education Academy 5 D 49 D 44 D 44 Met 82.2 41 36 34 59 40 36 15 14 >95Charter Schools 34D000 Carter G Woodson School 5 F 37 F 36 F 30 Met 75.8 28 23 20 19 31 50 17 20 >95Charter Schools 34F000 Forsyth Academy 5 D 50 D 52 D 49 Met 82.3 42 45 39 36 78Charter Schools 34G000 The Arts Based School 5 C 69 B 73 C 67 NotMet 66.2 70 75 65 70 75Charter Schools 34H000 The North Carolina Leadership Academy 5 B 77 B 80 B 74 Met 81.7 76 80 72 72 85Charter Schools 35A000 Crosscreek Charter School 3 C 58 C 65 D 47 Met 77.4 54 61 41 64 >95Charter Schools 36B000 Piedmont Community Charter School 6 C 68 C 69 C 60 Met 82.0 65 69 54 73 46 77 59 81 >95Charter Schools 36C000 Mountain Island Charter 6 B 75 B 76 B 73 Exceeded 86.1 73 74 71 87 49 78 61Charter Schools 39A000 Falls Lake Academy 3 C 63 C 69 C 56 NotMet 69.4 61 66 55 72Charter Schools 39B000 Oxford Preparatory High 3 D 54 NotMet 59.1 53 53 54Charter Schools 41B000 Greensboro Academy 5 B 75 B 77 B 78 NotMet 69.1 76 77 77 77 66Charter Schools 41C000 Guilford Preparatory Academy 5 D 49 D 50 D 40 Met 77.8 42 42 34 61 >95Charter Schools 41D000 Phoenix Academy 5 C 57 C 64 D 53 NotMet 59.0 56 62 50 56Charter Schools 41F000 Triad Math and Science Academy 5 C 58 C 64 D 54 NotMet 61.0 58 61 50 75 49 56 13 75 >95Charter Schools 41G000 Cornerstone Charter Academy-CFA 5 C 68 B 73 C 63 Met 71.9 67 71 62 67 84Charter Schools 41H000 College Prep and Leadership Academy 5 D 46 D 49 D 41 Met 77.0 38 43 32 46Charter Schools 41J000 Summerfield Charter Academy 5 C 67 B 71 C 65 NotMet 60.0 69 72 65 70Charter Schools 45A000 The Mountain Community Sch 8 C 69 B 74 C 58 Exceeded 87.7 64 72 50 78 90Charter Schools 49B000 American Renaissance School 7 C 60 C 64 D 48 Met 83.1 54 61 39 70 >95Charter Schools 49D000 Success Institute Charter 7 F 33 F 28 F 28 Met 80.7 21 15 15 83Charter Schools 49E000 Pine Lake Preparatory 7 B 77 B 81 B 77 NotMet 54.1 83 84 81 84 82 87 58 89 >95Charter Schools 49F000 Langtree Charter Academy 7 B 76 B 79 B 73 Exceeded 88.2 74 77 70 75Charter Schools 50A000 Summit Charter 8 C 67 B 71 C 67 NotMet 64.5 68 71 66 72 53Charter Schools 51A000 Neuse Charter School 3 B 75 B 79 C 67 Exceeded 92.2 70 77 62 84 64 65 56 60 >95Charter Schools 54A000 Children's Village Academy 2 F 37 F 33 F 37 Exceeded 86.0 25 21 24 36Charter Schools 55A000 Lincoln Charter School 6 B 81 B 82 B 78 Met 80.7 81 82 76 87 61 88 77 91 >95Charter Schools 58B000 Bear Grass 1 C 65 C 63 C 63 Met 80.9 61 60 56 77 52 48 38 52 >95Charter Schools 60A000 Community Charter School 6 D 40 D 45 F 33 NotMet 67.4 33 38 24 46Charter Schools 60B000 Sugar Creek Charter 6 C 60 C 56 C 62 Exceeded 88.6 53 48 54 58 59Charter Schools 60C000 Kennedy Charter 6 D 45 D 50 F 34 Exceeded 86.0 34 41 21 68 <5 24 19 10 >95Charter Schools 60D000 Lake Norman Charter 6 A 88 B 83 B 75 Exceeded 96.0 86 82 75 91 87 94 93 93 >95Charter Schools 60F000 Metrolina Reg Scholars Academy 6 A 94 A 96 A 90 Met 76.5 >95 >95 >95 >95 >95 >95Charter Schools 60G000 Queen's Grant Community School 6 B 75 B 75 B 74 Exceeded 93.7 71 74 69 81 55 66 52 60 >95Charter Schools 60H000 Crossroads Charter High 6 F 35 NotMet 59.0 29 9 37 17 8 20Charter Schools 60I000 Community School of Davidson 6 A 87 B 83 B 83 Exceeded 86.4 87 84 84 89 82 92 83 93 >95
NCDPI/Division of Accountability Services 56 of 116 February 5, 2015

Charter Schools 60J000 Socrates Academy 6 A 85 B 80 B 83 Met 72.8 85 83 84 93 >95Charter Schools 60K000 Charlotte Secondary 6 C 63 C 64 C 56 Met 83.7 58 62 48 86 48 60 48Charter Schools 60L000 KIPP Charlotte 6 D 54 D 49 D 48 Exceeded 87.7 46 41 39 64 95Charter Schools 60M000 Corvian Community School 6 B 78 B 80 B 75 Met 73.5 79 81 76Charter Schools 60N000 Aristotle Preparatory Academy 6 D 50 C 59 F 33 Met 71.2 44 56 33Charter Schools 60P000 Charlotte Choice Charter 6 F 34 F 37 F 35 Met 71.6 25 28 25 14Charter Schools 60Q000 Invest Collegiate 6 C 63 B 80 D 50 Met 71.4 62 79 47 50Charter Schools 63A000 The Academy of Moore County 4 B 71 B 74 B 70 Met 78.3 69 72 69 57Charter Schools 63B000 STARS Charter 4 D 54 C 59 D 47 Met 72.9 49 55 41 57 83Charter Schools 64A000 Rocky Mount Preparatory 3 D 43 D 51 F 28 NotMet 59.0 39 43 21 48 48 55 28 26 >95Charter Schools 65A000 Cape Fear Center for Inquiry 2 B 81 B 83 B 78 Exceeded 88.6 79 82 75 81 85Charter Schools 65B000 Wilmington Preparatory Academy 2 C 55 C 59 D 45 Exceeded 87.3 47 52 35 65Charter Schools 65C000 Douglass Academy 2 ICharter Schools 65D000 Island Montessori Charter 2 D 47 C 62 F 37 NotMet 55.4 44 61 33 26Charter Schools 66A000 Gaston College Preparatory 3 B 71 C 61 C 69 Exceeded 92.8 65 56 63 70 48 86 80 75 >95Charter Schools 67B000 Z.E.C.A. School of Arts and Technology 2 F 28 F 31 F 30 NotMet 69.7 18 20 20 <5Charter Schools 68A000 Orange Charter 5 B 78 B 81 B 74 Met 82.3 77 80 72 74 >95Charter Schools 68N000 PACE Academy 5 D 49 Met 81.3 41 33 32 16 19 78Charter Schools 69A000 Arapahoe Charter School 2 D 49 C 57 D 41 NotMet 66.9 44 52 36 46 62Charter Schools 73A000 Bethel Hill Charter 5 C 63 C 67 C 62 Met 74.1 60 65 58 54Charter Schools 73B000 Roxboro Community School 5 B 72 B 78 C 56 NotMet 59.6 76 78 56 87 80 81 61 89 >95Charter Schools 76N000 Uwharrie Charter Academy 5 C 57 Met 72.7 53 48 63Charter Schools 78A000 CIS Academy 4 D 46 D 42 D 44 Exceeded 87.4 35 31 33 54Charter Schools 78B000 Southeastern Academy 4 B 73 B 70 B 74 Exceeded 88.4 69 65 71 67 >95Charter Schools 79A000 Bethany Community Middle 5 C 67 B 72 C 55 Met 83.4 64 69 49 85 >95Charter Schools 81A000 Thomas Jefferson Class Academy 8 A 86 A B 80 Exceeded 88.1 86 87 77 93 94 95 75 93 >95Charter Schools 81B000 Lake Lure Classical Academy 8 C 69 B 75 D 49 Met 82.6 65 73 44 89 63 87 64Charter Schools 84B000 Gray Stone Day 6 A 87 NotMet 69.6 92 89 94 78 >95 >95Charter Schools 86T000 Millennium Charter Academy 7 B 72 B 72 C 66 Exceeded 85.7 69 70 62 83 95Charter Schools 87A000 Mountain Discovery 8 B 79 B 80 B 73 Exceeded 88.9 77 80 68 90 83Charter Schools 88A000 Brevard Academy 8 B 70 B 77 C 63 Met 82.3 67 76 58 73 44Charter Schools 90A000 Union Academy 6 B 78 B 82 C 65 NotMet 69.3 80 83 67 88 82 85 79 84 >95Charter Schools 91A000 Vance Charter School 3 C 66 C 63 C 67 NotMet 68.0 66 63 65 74 >95Charter Schools 91B000 Henderson Collegiate 3 B 77 B 71 B 75 Exceeded 100.0 71 65 69 92 >95Charter Schools 92B000 Exploris Middle School 3 A 91 A 90 A 88 Exceeded 91.6 90 91 88 92 >95Charter Schools 92D000 Magellan Charter 3 A 95 A 92 A 94 Exceeded 86.8 >95 95 >95 >95 >95Charter Schools 92E000 Sterling Montessori Academy 3 B 84 A 85 B 81 Met 82.3 84 86 80 86 >95Charter Schools 92F000 Franklin Academy 3 B 83 B 80 B 75 Exceeded 91.7 80 78 72 84 82 94 82 94 >95Charter Schools 92G000 East Wake Academy 3 B 81 B 75 B 74 Exceeded 93.1 78 73 70 89 78 90 89 84 >95Charter Schools 92K000 Raleigh Charter High School 3 A 98 Exceeded 94.2 >95 >95 >95 >95 >95 >95Charter Schools 92L000 Torchlight Academy 3 D 50 D 47 D 48 Exceeded 86.4 41 39 37 60Charter Schools 92M000 PreEminent Charter 3 F 36 D 42 F 31 NotMet 58.8 30 33 24 34 80Charter Schools 92N000 Quest Academy 3 A 94 A 93 A 95 Met 81.5 >95 >95 >95 >95 >95Charter Schools 92P000 Southern Wake Academy 3 C 63 D 54 D 45 Met 77.2 60 48 39 68 54 61 73 87Charter Schools 92Q000 Hope Elementary 3 F 22 F 29 F 18 NotMet 60.1 12 16 8 13
NCDPI/Division of Accountability Services 57 of 116 February 5, 2015

Charter Schools 92R000 Casa Esperanza Montessori Charter School 3 B 79 B 77 B 79 Exceeded 86.4 77 75 78 83Charter Schools 92S000 Endeavor Charter 3 A 90 A 86 A 90 Exceeded 90.2 90 88 89 >95 94Charter Schools 92T000 Triangle Math and Science Academy 3 A 85 A 85 B 81 Exceeded 85.9 85 85 82 91 >95Charter Schools 92U000 Longleaf School of the Arts 3 B 76 Met 79.2 76 68 95 75Charter Schools 93A000 Haliwa-Saponi Tribal School 3 F 34 F 36 F 19 NotMet 60.7 28 27 7 31 22 35 35 46 >95Charter Schools 95A000 Two Rivers Community School 7 B 74 B 80 C 64 NotMet 67.3 75 83 62 83 >95Charter Schools 96C000 Dillard Academy 2 F 31 F 36 F 26 Met 78.6 20 25 14Charter Schools 97D000 Bridges Academy 7 C 61 C 68 D 51 Met 74.9 58 67 44 72Charter Schools 98A000 Sallie B Howard School 3 C 56 D 52 D 53 Exceeded 95.5 47 44 43 66
NCDPI/Division of Accountability Services 58 of 116 February 5, 2015

Cohort
Graduation
Rate
Standard
Score*
>95
81
76
67
83
9091
2013-14 School Performance Grade, School Performance Score and Growth Status by District/School
N/A or I (Insufficient data) or a blank cell indicates a school does not have tested grades/sufficient data for reporting.*Percentages greater than 95 are displayed as >95 and percentages less than 5 are displayed as <5.
NCDPI/Division of Accountability Services 59 of 116 February 5, 2015

85
92
>95
85
>9587
>95
93
91
NCDPI/Division of Accountability Services 60 of 116 February 5, 2015

87
92
76>9579
95
74
80
>95
82
90
NCDPI/Division of Accountability Services 61 of 116 February 5, 2015

80
89
88
88
76
80
88
94
NCDPI/Division of Accountability Services 62 of 116 February 5, 2015
86
>95
>95
91
95
95
90
>95
89
NCDPI/Division of Accountability Services 63 of 116 February 5, 2015

85
86
89
94
>9581
>95
83
92
>95
NCDPI/Division of Accountability Services 64 of 116 February 5, 2015

91
93
90
85
69
8989
87
77
NCDPI/Division of Accountability Services 65 of 116 February 5, 2015

93
93
>95
93
87
88
7088
92
NCDPI/Division of Accountability Services 66 of 116 February 5, 2015

>95
88
77
86
89
>95
>95
>95
79
91
89
NCDPI/Division of Accountability Services 67 of 116 February 5, 2015
>9589
88
88
84
82
>95
80
NCDPI/Division of Accountability Services 68 of 116 February 5, 2015

78
95
91
85
84
93
8283
NCDPI/Division of Accountability Services 69 of 116 February 5, 2015

>95
89
87
95
83
>95
NCDPI/Division of Accountability Services 70 of 116 February 5, 2015

81
82
81
78
>95
85
93
88
95
>95
NCDPI/Division of Accountability Services 71 of 116 February 5, 2015

84
>95
85
92
90
82
85
84
NCDPI/Division of Accountability Services 72 of 116 February 5, 2015

73
87>95
>95
8466
78
80
>95
86
>95
NCDPI/Division of Accountability Services 73 of 116 February 5, 2015

95
88
>95
81
88
83
>95>95
NCDPI/Division of Accountability Services 74 of 116 February 5, 2015

>9582
77
78
>95
81
>9592
82
NCDPI/Division of Accountability Services 75 of 116 February 5, 2015

93
94
88
7969
>9581
82
92
NCDPI/Division of Accountability Services 76 of 116 February 5, 2015
76>95
79
93
90
86
90
7587
90
83
90
>95
NCDPI/Division of Accountability Services 77 of 116 February 5, 2015

73
85
92
83
82
82
NCDPI/Division of Accountability Services 78 of 116 February 5, 2015

7771
89938486
>95
90
>95
8680
NCDPI/Division of Accountability Services 79 of 116 February 5, 2015

95>9591
>95
>95
94
85>9595
NCDPI/Division of Accountability Services 80 of 116 February 5, 2015
>9591
>9594
91
90
86>9594
91
>95
NCDPI/Division of Accountability Services 81 of 116 February 5, 2015

>95
89
71
79
79
>95
86
NCDPI/Division of Accountability Services 82 of 116 February 5, 2015

82
82
80
81
8887
87
>95
89
NCDPI/Division of Accountability Services 83 of 116 February 5, 2015

9590
7490
63
73
>95
9190
60
>95
>95
NCDPI/Division of Accountability Services 84 of 116 February 5, 2015

89
86>95
89
88
90
>95
>95
91
88
90
NCDPI/Division of Accountability Services 85 of 116 February 5, 2015

86
>95
>9581
88
7992
87
83
NCDPI/Division of Accountability Services 86 of 116 February 5, 2015

>9588
93
80
90
72
83
91
85
94
NCDPI/Division of Accountability Services 87 of 116 February 5, 2015

89
9391
76
>95
8980
82
77
>9576
NCDPI/Division of Accountability Services 88 of 116 February 5, 2015

>95
92
>95
92
>95
84
NCDPI/Division of Accountability Services 89 of 116 February 5, 2015

91
87
88
88
89
>95
NCDPI/Division of Accountability Services 90 of 116 February 5, 2015

89
91
92
>95
>95
93
>95
NCDPI/Division of Accountability Services 91 of 116 February 5, 2015

91
78
85
849293858389
5982
91
NCDPI/Division of Accountability Services 92 of 116 February 5, 2015

91
9190
95
7795
88
NCDPI/Division of Accountability Services 93 of 116 February 5, 2015

75
78
8684
>95
89
72
NCDPI/Division of Accountability Services 94 of 116 February 5, 2015

>95
81
95
89
93
89
85
NCDPI/Division of Accountability Services 95 of 116 February 5, 2015

92
88
87
90
9392
92
87
NCDPI/Division of Accountability Services 96 of 116 February 5, 2015

93
87
87
83>95
90
92
76
83
NCDPI/Division of Accountability Services 97 of 116 February 5, 2015
88
89
82
75
88
8983
84
NCDPI/Division of Accountability Services 98 of 116 February 5, 2015

85
84
91
89
93
9186
8894
NCDPI/Division of Accountability Services 99 of 116 February 5, 2015
91
83
>95
77
8786
91
NCDPI/Division of Accountability Services 100 of 116 February 5, 2015

80
70
76
76>95
84
91
NCDPI/Division of Accountability Services 101 of 116 February 5, 2015

81
>9573
7790
82
80
87>95
94
8180
82
NCDPI/Division of Accountability Services 102 of 116 February 5, 2015

73
85
93
95
71
83
87
>9583
NCDPI/Division of Accountability Services 103 of 116 February 5, 2015

95
90
9095
>95
80
87>95
89
90
NCDPI/Division of Accountability Services 104 of 116 February 5, 2015

84
85
>95
88
>95
87
87
95
90
92
NCDPI/Division of Accountability Services 105 of 116 February 5, 2015

89
>95>95
>95
>95
78
72
84
NCDPI/Division of Accountability Services 106 of 116 February 5, 2015

9180
80
82
81
NCDPI/Division of Accountability Services 107 of 116 February 5, 2015

8084
>95
85
91
81
88
87
NCDPI/Division of Accountability Services 108 of 116 February 5, 2015

87
95
83
80
>95
NCDPI/Division of Accountability Services 109 of 116 February 5, 2015

85
88
89818676
63
8988
83
83
NCDPI/Division of Accountability Services 110 of 116 February 5, 2015

87
83
86
70
86
76
81
>95>95
87
NCDPI/Division of Accountability Services 111 of 116 February 5, 2015

91
93
88
85
74
77
84
>95
NCDPI/Division of Accountability Services 112 of 116 February 5, 2015

88
89
>95
92
>959492
80
25
92
NCDPI/Division of Accountability Services 113 of 116 February 5, 2015

74
90
9080
87
>95
93
93
>95>95
80>95
7947
>95
NCDPI/Division of Accountability Services 114 of 116 February 5, 2015

82
86
49
>95
>95
>95
>95
>9594
>95
77
NCDPI/Division of Accountability Services 115 of 116 February 5, 2015
83
NCDPI/Division of Accountability Services 116 of 116 February 5, 2015