2013-14 Budget Paper 4: Education and Training Directorate Web view2013-14 Budget Paper No....
55
EDUCATION AND TRAINING DIRECTORATE Purpose The Education and Training Directorate (the Directorate) works in partnership with parents and the community to ensure that all young people in the ACT learn, thrive and are equipped with the skills to lead fulfilling, productive and responsible lives. The Directorate works closely with other government agencies, education and training providers, business and industry to position the ACT as Australia’s learning capital. Services of the Directorate include the provision of public school education and early intervention education programs, regulation of education and care services, registration of non government schools and home education, and the planning and coordination of vocational education and training. High achievement for all students through connected and inclusive learning across all sectors of the education system is achieved through focussing on quality learning, inspirational teaching and leadership, high expectations and high performance, and improvement and innovation in business systems. 2013-14 Priorities Strategic and operational initiatives to be pursued in 2013-14 include: providing quality early childhood education and care consistent with national and local legislation and frameworks; further developing school networks to foster collaboration between schools and sectors with a focus on identifying and sharing best practice; recruiting, developing and retaining quality teachers in our classrooms; implementing the Australian Curriculum; raising standards in literacy and numeracy in all schools; further developing provision of vocational education and training to better align with student, school and employer requirements; 2013-14 Budget Paper No. 4 285 Education and Training Directorate
Transcript of 2013-14 Budget Paper 4: Education and Training Directorate Web view2013-14 Budget Paper No....
EDUCATION AND TRAINING DIRECTORATE
PurposeThe Education and Training Directorate (the Directorate) works in partnership with parents and the community to ensure that all young people in the ACT learn, thrive and are equipped with the skills to lead fulfilling, productive and responsible lives. The Directorate works closely with other government agencies, education and training providers, business and industry to position the ACT as Australia’s learning capital.
Services of the Directorate include the provision of public school education and early intervention education programs, regulation of education and care services, registration of non government schools and home education, and the planning and coordination of vocational education and training. High achievement for all students through connected and inclusive learning across all sectors of the education system is achieved through focussing on quality learning, inspirational teaching and leadership, high expectations and high performance, and improvement and innovation in business systems.
2013-14 PrioritiesStrategic and operational initiatives to be pursued in 2013-14 include:
providing quality early childhood education and care consistent with national and local legislation and frameworks;
further developing school networks to foster collaboration between schools and sectors with a focus on identifying and sharing best practice;
recruiting, developing and retaining quality teachers in our classrooms;
implementing the Australian Curriculum;
raising standards in literacy and numeracy in all schools;
further developing provision of vocational education and training to better align with student, school and employer requirements;
ensuring each school has a plan for year on year improvement, with annual plans and reports in alignment with the School Improvement Framework;
strengthening principal responsibility, delegations and accountabilities, including for the use of resources, in improving student outcomes;
providing safe, supportive and engaging schools consistent with the National Safe Schools Framework;
implementing the Disability Standards for Education to provide reasonable adjustments for students with a disability to access the curriculum;
closing the learning achievement gap between Aboriginal and Torres Strait Islander students and other students;
encouraging excellence and meeting the needs of high performing students;
strengthening and supporting engagement with parents and the community; and
2013-14 Budget Paper No. 4 285 Education and Training Directorate

increasing qualifications and skill levels in the ACT through reforming the vocational education and training system to enhance productivity.
In response to the Review of Funding for Schooling (the Gonski Review), the Commonwealth Government has proposed large scale reform of school education and funding under a broad National Education Reform Agreement framework. ACT Government funding changes have been included in the 2013-14 Budget in anticipation of the new framework.
Business and Corporate StrategiesTo achieve its objectives, priorities, efficiency measures and manage business and financial issues, the Directorate will:
operate as a customer service oriented entity subject to the requirements of government policy and legislation;
adopt high standard operating practices to safeguard the environment and the health and safety of staff;
improve our business systems;
provide a productive and satisfying working environment for staff, and a commitment to high standards of human resource management based on the principles of equal employment opportunity, respect, equity and diversity; and
work collaboratively with stakeholders in the planning and implementation of Council of Australian Government (COAG) initiatives.
Estimated Employment Level2011-12
Actual Outcome2012-13Budget
2012-13Est. Outcome
2013-14Budget
4,9281 Staffing (FTE) 4,698 4,7652 4,6663
Notes: 1. Reflects full time equivalent staff as at pay 26 of 2011-12 financial year.2. The increase in the 2012-13 estimated outcome from the original budget is mainly due to increased enrolments and transfer of staff
from Community Services Directorate.3. The decrease of 99 FTE in 2013-14 from the 2012-13 estimated outcome is mainly due to the impact of prior year savings, partially
offset by new initiatives.
2013-14 Budget Paper No. 4 286 Education and Training Directorate

Strategic Objectives and IndicatorsThe strategic objectives of the Directorate are:
quality learning;
inspirational teaching and leadership; and
high expectations, high performance.
Strategic Objective 1Quality Learning
The Government has the objective of ensuring students succeed through quality learning that engages them and supports the development of capabilities for life.
Strategic Indicator 1.1: Mean achievement score of all year 5 public school students in reading in the National Assessment Program – Literacy and Numeracy
2009 2010 2011 2012 2012 2013Actual Actual Actual Target Actual Target
505 502 513 507 512 516Source: ACT Education and Training Directorate, unpublished data.
Strategic Indicator 1.2: Mean achievement score of all year 5 public school students in numeracy in the National Assessment Program – Literacy and Numeracy
2009 2010 2011 2012 2012 2013Actual Actual Actual Target Actual Target
492 494 4991 490 499 503Source: ACT Education and Training Directorate, unpublished data.
Note:1. A rounding error resulted in the number being published as 500 in the 2011-12 Statement of Performance. The correct figure is 499.
Strategic Indicator 1.3: Mean achievement score of all year 9 public school students in reading in the National Assessment Program – Literacy and Numeracy
2009 2010 2011 2012 2012 2013Actual Actual Actual Target Actual Target
587 582 585 598 586 598Source: ACT Education and Training Directorate, unpublished data.
Strategic Indicator 1.4: Mean achievement score of all year 9 public school students in numeracy in the National Assessment Program – Literacy and Numeracy
2009 2010 2011 2012 2012 2013Actual Actual Actual Target Actual Target
589 586 584 595 588 595Source: ACT Education and Training Directorate, unpublished data.
Strategic Indicator 1.5: Mean achievement score of Aboriginal and Torres Strait Islander year 5 public school students in reading in the National Assessment Program – Literacy and Numeracy
2009 2010 2011 2012 2012 2013Actual Actual Actual Target Actual Target
446 427 456 451 445 451Source: ACT Education and Training Directorate, unpublished data.
2013-14 Budget Paper No. 4 287 Education and Training Directorate

Strategic Indicator 1.6: Mean achievement score of Aboriginal and Torres Strait Islander year 5 public school students in numeracy in the National Assessment Program – Literacy and Numeracy
2009 2010 2011 2012 2012 2013Actual Actual Actual Target Actual Target
441 431 444 439 437 444Source: ACT Education and Training Directorate, unpublished data.
Strategic Indicator 1.7: Mean achievement score of Aboriginal and Torres Strait Islander year 9 public school students in reading in the National Assessment Program – Literacy and Numeracy
2009 2010 2011 2012 2012 2013Actual Actual Actual Target Actual Target
530 545 547 556 531 556Source: ACT Education and Training Directorate, unpublished data.
Strategic Indicator 1.8: Mean achievement score of Aboriginal and Torres Strait Islander year 9 public school students in numeracy in the National Assessment Program – Literacy and Numeracy
2009 2010 2011 2012 2012 2013Actual Actual Actual Target Actual Target
534 546 528 552 542 552Source: ACT Education and Training Directorate, unpublished data.
Strategic Objective 2Inspirational Teaching and Leadership
The Government has the objective of employing high performing teachers and leaders who ensure success for every learner in public schools.
Strategic Indicator 2.1: Overall student satisfaction with the education at their public school2009 2010 2011 2012 2012 2013
Actual Actual Actual Target Actual Target79.4% 80.3% 80.4% 82.3% 80.8% 82.5%
Source: ACT Education and Training Directorate, What do people think about ACT public schools.
Strategic Indicator 2.2: Overall satisfaction of parents and carers with the education provided at their public school
2009 2010 2011 2012 2012 2013Actual Actual Actual Target Actual Target85.3% 81.7% 83.3% 87.5% 86.0% 88.0%
Source: ACT Education and Training Directorate, What do people think about ACT public schools.
Strategic Indicator 2.3: Staff retention rate2009 2010 2011 2012 2012 2013
Actual Actual Actual Target Actual Target93.3% 94.2% 93.1% 92.0% 93.9% 92.0%
Source: ACT Education and Training Directorate, unpublished data.
2013-14 Budget Paper No. 4 288 Education and Training Directorate

Strategic Objective 3High Expectations, High Performance
The Government’s objective is to exceed community expectations of developing an educated and skilled workforce to support a high performing ACT economy.
Strategic Indicator 3.1: Percentage of year 12 public school students who received a Year 12 Certificate
2009 2010 2011 2012 2012 2013Actual Actual Actual Target Actual Target88.0% 87.0% 88.0% 89.0% 88.3% 89.0%
Source: ACT Education and Training Directorate, unpublished data.
Strategic Indicator 3.2: Percentage of year 12 Aboriginal and Torres Strait Islander public school students who received a Year 12 Certificate
2009 2010 2011 20121 2012 2013Actual Actual Actual Target Actual Target80.0% 73.9% 80.4% n/a 86.2% 80.0%
Source: ACT Education and Training Directorate, unpublished data.
Note:1. The 2012 target is not applicable as this is a new strategic indicator.
Strategic Indicator 3.3: Percentage of public school year 12 graduates employed or studying six months after completing year 12
2009 2010 2011 2012 2012 2013Actual Actual Actual Target Actual Target90.5% 90.7% 92.6% 91.6% 93.5% 92.8%
Source: ACT Education and Training Directorate, unpublished data.
Strategic Indicator 3.4: Percentage of apprentices satisfied with their training under Australian Apprenticeships
2009 2010 2011 2012 2012 2013Actual Actual Actual Target Actual Target82.0% 85.2% 85.5% 80.0% 76.7% 80.0%
Source: National Centre for Vocational Education Research, Student Outcomes Survey.
Strategic Indicator 3.5: Proportion of graduates with improved employment status after training 2009 2010 2011 2012 2012 2013
Actual Actual Actual Target1 Actual Target67.4% 68.1% 69.6% n/a 65.4% 66.0%
Source: National Centre for Vocational Education Research, Student Outcomes Survey.
Note:1. The 2012 target is not applicable as this is a new strategic indicator.
2013-14 Budget Paper No. 4 289 Education and Training Directorate

Output ClassesTotal Cost1 Government Payment for
Outputs2012-13
Est. Outcome$’000
2013-14Budget
$’000
2012-13Est. Outcome
$’000
2013-14Budget
$’000 Output Class 1:Public School Education 634,584 656,447 526,129 548,459Output 1.1: Public Primary School Education 304,471 315,852 247,795 258,028
Note: 1. Total cost includes depreciation and amortisation of $65.327 million in 2012-13 and $68.236 million in 2013-14.
As reported in the February 2013 census, the ACT Government operated 86 public schools with a total enrolment of 40,879 students. Of these, 24,704 attended a primary school (60.4 per cent), 9,754 attended a high school (23.9 per cent), 6,005 students attended a public college (14.7 per cent) and 416 students attended one of the four specialist schools (1 per cent).
Output Description
Public primary school education spans the years from preschool to year 6. It is available, on average, for eight years with a preschool age of four years and a kindergarten starting age of five years. A balanced curriculum allows students to develop the qualities needed for lifelong learning. Students are given every opportunity to develop the knowledge, understanding, capabilities and values essential for participation as active members of their community and society.
Learning opportunities in the primary years are designed to allow each student to experience success and achieve high quality learning outcomes. Students in ACT public primary schools consistently achieve high academic results against national standards.
Early intervention programs identify and address the physical, emotional, social and educational needs of children between the ages of two to five years who have a disability or a developmental delay.
Assessment and monitoring of public and non government education and care services contributes to ensuring quality education and care is provided to children accessing these services. Education and care services include ACT public preschools, independent preschools, family day care, long day care and school age care programs.
Total Cost Government Payment for Outputs
2012-13Est. Outcome
$’000
2013-14Budget
$’000
2012-13Est. Outcome
$’000
2013-14Budget
$’000 Output 1.2: Public High School Education 159,855 164,120 134,116 139,397
2013-14 Budget Paper No. 4 290 Education and Training Directorate

Output Classes cont.Output Description
Public high school education covers years 7 to 10. Each school organises its curriculum to maximise opportunities for students to develop the knowledge, understanding, skills and values articulated in the ACT curriculum framework and the Australian Curriculum.
In the high school years, ACT public schools offer a broad comprehensive education across all key learning areas. The focus is on providing challenging and engaging learning, building relationships based on mutual trust and respect, and connecting students to the outside world.
School programs develop students’ critical thinking, problem solving, interpersonal and teamwork skills to empower students to contribute positively to their community. Schools use a range of strategies to connect students to the world of work. Years 9 and 10 students in ACT public schools are offered work experience placements and vocational programs in partnership with colleges. Years 7 to 10 students in ACT public schools consistently achieve high academic results against national and international standards.
Total Cost Government Payment for Outputs
2012-13Est. Outcome
$’000
2013-14Budget
$’000
2012-13Est. Outcome
$’000
2013-14Budget
$’000 Output 1.3: Public Secondary College Education 104,220 107,759 86,046 90,032
Output Description
Public secondary college education covers years 11 and 12. Public secondary colleges offer courses catering for a broad range of student needs and interests. Courses are accredited by the ACT Board of Senior Secondary Studies (BSSS) to ensure they are educationally sound, lead to tertiary entrance qualifications and have sufficient rigour to meet the requirements of tertiary institutions throughout Australia. Public secondary colleges also offer Vocational Education and Training (VET) programs designed around training packages endorsed by specific industry areas.
Students are able to receive dual accreditation towards an Australian Qualifications Framework (AQF) qualification and the ACT Year 12 Certificate. Courses include:
A courses – courses accredited as educationally sound and appropriate for students in years 11 and 12;
T courses – accredited courses leading to higher education;
M courses – accredited courses providing appropriate educational experiences for students who satisfy specific disability criteria;
R courses – acknowledging community service and extra-curricular activity;
H courses – accredited by an Australian university as contributing towards an undergraduate degree and recognised by the BSSS; and
2013-14 Budget Paper No. 4 291 Education and Training Directorate

vocational programs – culminating in a vocational certificate or statement of attainment.
Output Classes cont.Total Cost Government Payment for
Outputs2012-13
Est. Outcome$’000
2013-14Budget
$’000
2012-13Est. Outcome
$’000
2013-14Budget
$’000 Output 1.4: Disability Education in
Public Schools 66,038 68,716 58,172 61,002
Output Description
A range of programs are available in ACT public schools for students with a disability. These include access to specialist schools, specific classes or units in mainstream schools, or participation in mainstream classes with the support required to access and participate in the educational programs offered by the school.
The Student Centred Appraisal of Need (SCAN) process identifies the level of additional resourcing required by the student in the particular school setting. Parents and schools work together in developing and reviewing each student’s Individual Learning Plan (ILP), which identifies educational goals. Student progress against ILPs is reviewed annually or more frequently as required.
The focus is on literacy and numeracy, health, self-management and interpersonal skills appropriate to the assessed needs of students with disabilities, to enable them to realise their individual potential.
Total Cost1 Government Payment for Outputs
2012-13Est. Outcome
$’000
2013-14Budget
$’000
2012-13Est. Outcome
$’000
2013-14Budget
$’000 Output Class 2:Non Government Education 5,249 4,287 4,791 3,762Output 2.1: Non Government Education 5,249 4,287 4,791 3,762
Note: 1. Total cost includes depreciation and amortisation of $0.085 million in 2012-13 and $0.154 million in 2013-14.
Output Description
The Directorate contributes to the maintenance of standards in non government schools and home education through compliance, registration and the accreditation and certification of senior secondary courses through the BSSS. The Directorate also undertakes the administration and payment of Commonwealth and ACT Government grants.
The Directorate has a Memorandum of Understanding with the non government education sector, detailing protocols related to the single collection of student records for the National Assessment Program - Literacy and Numeracy and the annual February school census.
2013-14 Budget Paper No. 4 292 Education and Training Directorate

In addition to the funds provided by the Directorate in Output Class 2, both the ACT and Commonwealth Governments provide funding to non government schools through the Territorial appropriation.
Output Classes cont.
Grants paid to Non Government Schools 2012-13 Est. Outcome
$’000
2013-14 Budget
$’000Commonwealth Government1
152,592 164,617ACT Government2
51,090 56,906Total 203,682 221,523
Notes: 1. The increase in Commonwealth Grants in the 2013-14 Budget compared to the 2012-13 estimated outcome is mainly due to
increased recurrent grants.2. The increase in ACT Government Grants to non government schools in the 2013-14 Budget compared to the 2012-13 estimated
outcome is mainly due to new initiatives and increased enrolments.
Total Cost1 Government Payment for Outputs
2012-13Est. Outcome
$’000
2013-14Budget
$’000
2012-13Est. Outcome
$’000
2013-14Budget
$’000 Output Class 3:Vocational Education and Training 38,818 37,528 38,656 37,208Output 3.1: Planning and Coordination of Vocational Education and Training Services 38,818 37,528 38,656 37,208
Note: 1. Total cost includes depreciation and amortisation of $0.037 million in 2012-13 and $0.199 million in 2013-14.
Output Description
The Directorate is responsible and accountable for the provision of strategic advice and management of post school vocational education and training and higher education in the ACT. This includes monitoring and auditing the provision of publicly funded vocational education.
The Directorate administers Territorial and national funds for a variety of programs addressing skills development for entry level and existing workers, as well as adult and community education.
All aspects of apprenticeship training are managed by the Directorate through user choice arrangements as well as support provided for equity groups through the purchase of targeted training programs.
ACT vocational education and training policy and funding priorities are developed in consultation with industry and community groups to reflect industry trends and to meet the future training requirements of the ACT.
2013-14 Budget Paper No. 4 293 Education and Training Directorate

Accountability Indicators 2012-13Targets
2012-13Est. Outcome2
2013-14Targets
Output Class 1: Public School Education
National Assessment Program – Literacy and Numeracy1
Literacy mean achievement score of:a. all year 3 students in reading 425 442 n/ab. Aboriginal and Torres Strait Islander year 3 students in
reading3369 376 n/a
c. all year 5 students in reading 507 512 n/ad. Aboriginal and Torres Strait Islander year 5 students in
reading3451 445 n/a
e. all year 7 students in reading 555 547 n/af. Aboriginal and Torres Strait Islander year 7 students in
reading3509 496 n/a
g. all year 9 students in reading 598 586 n/ah. Aboriginal and Torres Strait Islander year 9 students in
reading3556 531 n/a
i. all year 3 students in writing 430 411 n/aj. Aboriginal and Torres Strait Islander year 3 students in
writing3389 366 n/a
k. all year 5 students in writing 491 481 n/al. Aboriginal and Torres Strait Islander year 5 students in
writing3444 425 n/a
m. all year 7 students in writing 531 504 n/an. Aboriginal and Torres Strait Islander year 7 students in
writing3488 439 n/a
o. all year 9 students in writing 565 542 n/ap. Aboriginal and Torres Strait Islander year 9 students in
writing3521 474 n/a
Numeracy mean achievement score of:a. all year 3 students 419 407 n/ab. Aboriginal and Torres Strait Islander year 3 students3 366 347 n/ac. all year 5 students 490 499 n/ad. Aboriginal and Torres Strait Islander year 5 students3 439 437 n/ae. all year 7 students 555 535 n/af. Aboriginal and Torres Strait Islander year 7 students3 505 486 n/ag. all year 9 students 595 588 n/ah. Aboriginal and Torres Strait Islander year 9 students3 552 542 n/a
Notes: 1. Accountability indicators on National Assessment Program - Literacy and Numeracy for all students and Aboriginal and Torres Strait
Islander students have been discontinued. Reading and numeracy mean achievement scores of all students and Aboriginal and Torres Strait Islander students in year 5 and year 9 have been adopted as strategic indicators.
2. Estimated outcomes for 2012-13 are taken from NAPLAN 2012 assessments conducted in May 2012 and published in December 2012.
3. A transcription error during preparation of the 2012-13 Budget Papers resulted in 2013-14 targets being published as 2012-13 targets. The error has been corrected through Notifiable Instrument NI2013-56.
2013-14 Budget Paper No. 4 294 Education and Training Directorate

Accountability Indicators cont.2012-13Targets
2012-13Est. Outcome
2013-14Targets
Output Class 1: Public School Education cont.
Early interventiona. Number of eligible children with developmental delays
and disabilities who attended an early intervention program
400 400 400
b. Individual Learning Plans commenced within one month of the student’s first attendance at an early intervention program
100% 100% 100%
c. Parent satisfaction with their children’s progress in early intervention placement as measured by annual survey
90% 90% 90%
d. Average cost ($) per child attending an early intervention program
4,735 4,742 4,755
Early childhood educationa. Number of enrolments in preschool in public schools1 n/a 4,381 4,425b. Number of enrolments of Aboriginal and Torres Strait
Islander students in preschool in public schools1n/a 214 220
School participationa. Attendance rate of public school students in year 1 to
year 101n/a 91.4% 91.5%
Education and care services2
a. Number of visits to approved education and care services to administer the Education and Care Services National Law (ACT) Act 2011 and the Children and Young People Act 20083
324 324 504
b. Education and care services satisfaction with assessment and monitoring functions
85% 85% 85%
c. Cost ($) per visit to licensed education and care services4
2,901 2,901 n/a
Disability educationa. Individual Learning Plans completed for students in
special and mainstream schools who access special education services
100% 100% 100%
Senior secondary educationa. Percentage of year 10 students who proceed to public
secondary college education85% 91% 85%
b. Percentage of year 10 Aboriginal and Torres Strait Islander students who proceed to public secondary college education1
n/a 80% 80%
c. Apparent retention of public school students from year 7 to year 121
n/a 105%6 100%
d. Apparent retention of Aboriginal and Torres Strait Islander public school students from year 7 to year 121
n/a 78% 75%
e. Percentage of year 12 students who receive a Tertiary Entrance Statement
50% 50% 50%
2013-14 Budget Paper No. 4 295 Education and Training Directorate

Accountability Indicators cont.2012-13Targets
2012-13Est. Outcome
2013-14Targets
Output Class 1: Public School Education cont.
f. Percentage of year 12 Aboriginal and Torres Strait Islander students who receive a Tertiary Entrance Statement1
n/a 19% 20%
g. Percentage of year 12 students who receive a nationally recognised vocational qualification
60% 64% 60%
h. Percentage of year 12 Aboriginal and Torres Strait Islander students who receive a nationally recognised vocational qualification1
n/a 55% 50%
Average cost ($) per student per annum in public:a. Preschool 6,394 6,509 6,419b. Primary schools5 14,062 14,459 14,509c. High schools 16,974 17,327 17,644d. Secondary colleges 17,227 17,554 18,364e. Special schools 57,771 58,094 57,455f. Mainstream schools’ student with a disability 28,506 28,666 27,680
Notes:1. The targets for 2012-13 for these indicators are ‘Not Applicable’ as these are new accountability indicators. 2. This output has been received from the Community Services Directorate subsequent to Administrative Arrangement 2012 No. 2. 3. To improve clarity, the description of this indicator has been changed from ‘Number of visits to licensed education and care services’.
As this indicator was transferred to the Education and Training Directorate from the Community Services Directorate during 2012-13, the 2012-13 target and 2012-13 estimated outcome reflect a pro-rata amount.
4. This indicator has been discontinued as the measure does not adequately capture the quality of the functions of the Directorate.5. For this measure, primary school students are defined as kindergarten to year 6 to enable cross-jurisdiction comparisons.6. The Estimated Outcome for 2012-13 is greater than 100% as a result of cross border students attending ACT schools.
2013-14 Budget Paper No. 4 296 Education and Training Directorate

Accountability Indicators cont.2012-13Targets
2012-13Est. Outcome
2013-14Targets
Output Class 2: Non Government EducationOutput 2.1: Non Government Education
a. Non government school registration reviews completed within the period required under the Education Act 2004
100% 100% 100%
b. Home education registration reviews for provisionally registered children be completed within three months
96% 100% 96%
c. Grants paid within the required period of receiving funds from the Commonwealth Government
100% 100% 100%
d. Satisfaction with the processes of the non government education section
87% 87% 87%
2012-13Targets
2012-13Est. Outcome
2013-14Targets
Output Class 3: Vocational Education and TrainingOutput 3.1: Planning and Coordination of VocationalEducation and Training Services
a. Total number of hours under programs available for competitive purchase1
1,800,000 1,800,000 n/a
b. Total reported number of training commencements under available programs1
6,800 6,800 n/a
c. Total number of enrolments of existing workers under additional programs1
434 434 n/a
d. Percentage of apprentices satisfied with their training under Australian Apprenticeships2
80% 77% n/a
e. Retention rate of existing workers training towards a qualification under additional programs1
85% 81% n/a
f. Funded training initiative allocation rounds administered within published timeframes3
n/a 80% 100%
g. Registered training organisation audit reports provided within 30 days of completion of on-site audit3
n/a 60% 100%
h. Total number of students undertaking vocational qualifications3,4:i. all students n/a 29,440 29,500ii. Aboriginal and Torres Strait Islander students n/a 729 740iii. students with a disability n/a 1,871 1,900
i. Participation in vocational education and training3:i. all students (percentage) n/a 8.1% 8.2%ii. Aboriginal and Torres Strait Islander Students
(percentage)n/a 15.1% 15.5%
Notes:1. These indicators have been discontinued.2. This indicator has been discontinued as an accountability indicator and adopted as Strategic Indicator 3.4.3. The targets for 2012-13 for these indicators are ‘Not Applicable’ as these are new accountability indicators. 4. The 2012-13 estimated outcome for these indicators are based on the latest available data for the 2011 calendar year which was
published in 2012.
2013-14 Budget Paper No. 4 297 Education and Training Directorate

Changes to AppropriationChanges to Appropriation – Controlled 2012-13 2013-14 2014-15 2015-16 2016-17Government Payment for Outputs Est. Out. Budget Estimate Estimate Estimate $'000 $'000 $'000 $'000 $'000
2012-13 Budget 558,459 552,533 572,864 577,543 577,543
FMA Section 16B Rollovers from 2011-12Commonwealth Grants – Productivity Places Program
NP4,391 - - - -
Commonwealth Grants – Improving Teacher Quality NP
4,246 - - - -
Commonwealth Grants – Literacy and Numeracy NP 3,277 - - - - Productivity Places Program NP (ACT Contribution) 2,403 - - - - Commonwealth Grants – More Support for Students
with Disability NP1,079 - - - -
Commonwealth Grants – Empowering Local Schools NP
940 - - - -
Commonwealth Grants – Youth Attainment and Transitions NP
940 - - - -
Commonwealth Grants – Reward for Great Teachers NP
713 - - - -
Teachers' Professional Development Funds 496 - - - - Commonwealth Grants – Industry and Indigenous
Skills Centres NP385 - - - -
Youth Commitment and Youth Attainment and Transitions NP (ACT Contribution)
351 - - - -
Commonwealth Grants – Training Places for Single and Teen Parents NP
247 - - - -
Commonwealth Grants – Low Socio-Economic Status School Communities NP
234 - - - -
Commonwealth Grants – Investing in Focus Schools 200 - - - - Commonwealth Grants – Early Childhood Education
Data and Information Capability NP186 - - - -
Commonwealth Grants – Money Smart Schools NP 74 - - - - Joint Group Training Program NP (ACT Contribution) 38 - - - - Commonwealth Grants – Joint Group Training
Program NP28 - - - -
2013-14 Budget Policy AdjustmentsCertificate III in Children's Services - 240 - - - Degree Scholarships for Early Childhood Educators - 10 54 95 136 Special Needs Transport - 1,579 - - - Canteen Grants - 200 - - - Support for Students with Disabilities - 1,250 - - - Aboriginal and Torres Strait Islander Education
Scholarship Program- 25 25 25 25
Supporting Non Government Schools - 151 154 156 167 Canberra College Cares – New Building at Phillip
Campus- - - 70 210
Childcare Centre Upgrades – Stage 2 - - - 20 40 Tuggeranong Introductory English Centre - - - - 18 Offset to 2013-14 Recurrent Initiatives - (1,526) (77) (147) (314)ACT Base Funding Adjustment – National School
Reform1- (312) (576) 9,022 13,595
Savings Reinvestment to Transition to Gonski - 4,325 - - -
2013-14 Budget Paper No. 4 298 Education and Training Directorate

Changes to Appropriation cont.Changes to Appropriation – Controlled 2012-13 2013-14 2014-15 2015-16 2016-17Government Payment for Outputs Est. Out. Budget Estimate Estimate Estimate $'000 $'000 $'000 $'000 $'000
2013-14 Budget Technical AdjustmentsEnrolment Adjustment – Public Preschools - 61 62 64 65 Enrolment Adjustment – Public Schools - 3,673 3,769 3,847 3,924 Revised Indexation Parameters - (174) (178) (184) 10,091 Revised Wage Indexation Parameters - - (133) 8,302 8,302 Revised Superannuation Parameters - 392 (773) (112) (1,978)Revised Superannuation Guarantee Rate - 512 1,107 2,379 3,807 Transfer – Childcare Services and Regulation from
CSD2,447 2,468 1,529 1,555 1,582
Transfer – Carbon Neutral Government Funding to ESDD
- (148) - - -
Revised Funding Profile – Productivity Places Program NP
(2,300) 2,300 - - -
Revised Funding Profile – VET Skills Reform NP (1,800) 1,800 - - - Revised Funding Profile – Productivity Places Program
(ACT Contribution) (1,700) 1,700 - - -
Revised Funding Profile – More Support for Students with Disability NP
(900) 900 - - -
Revised Funding Profile – Empowering Local Schools NP
(850) 850 - - -
Revised Funding Profile – Teachers' Professional Development Funds
(756) 756 - - -
Revised Funding Profile – Improving Teacher Quality NP
(375) 375 - - -
Revised Funding Profile – National Quality Agenda for Early Childhood Education and Care NP
(97) 97 - - -
Revised Funding Profile – Low Socio-Economic Status School Communities NP
(249) 249 - - -
Revised Funding Profile – Early Childhood Education and Care NP (ACT Contribution)
(250) 250 - - -
Revised Funding Profile – Literacy and Numeracy NP (250) 250 - - - Revised Funding Profile – Training Places for Single
and Teen Parents NP(253) 253 - - -
Revised Funding Profile – Reward for Great Teachers NP
(360) 360 - - -
Commonwealth Grants – Literacy and Numeracy NP 1,171 587 - - - Commonwealth Grants – Empowering Local Schools
NP- - - (3,514) (3,514)
Commonwealth Grants – National Schools SPP - (31,816) (68,943) (74,748) (74,748) National Education Reform – Government Schools - 35,704 73,050 76,447 80,040Commonwealth Grants – National Skills and
Development SPP- 85 121 122 279
Commonwealth Grants – Vocational Education and Skills Reform NP
- - 2 (1) 2,225
Commonwealth Grants – Reward for Great Teachers NP
(34) (440) (1,370) (2,740) (2,740)
Commonwealth Grants – Improving Teacher Quality NP
(3,128) 3,128 - - -
Commonwealth Grants – Money Smart Schools NP - 91 86 94 109 Commonwealth Grants – Reward for School
Improvement NP(134) (121) (375) (675) (675)
Commonwealth Grants – Industry and Indigenous Skills Centres NP
181 - - - -
2013-14 Budget Paper No. 4 299 Education and Training Directorate

Changes to Appropriation cont.Changes to Appropriation – Controlled 2012-13 2013-14 2014-15 2015-16 2016-17Government Payment for Outputs Est. Out. Budget Estimate Estimate Estimate $'000 $'000 $'000 $'000 $'000
Commonwealth Grants – Joint Group Training Program NP
293 - - - -
Revised Funding Profile – Low Socio-Economic Status School Communities NP
- (167) (340) - -
Commonwealth Grants – More Support for Students with Disability NP
- 535 802 - -
Commonwealth Grants – Early Childhood Education – Universal Access NP
233 6,444 3,728 - -
2013-14 Budget 569,576 589,429 584,588 597,620 618,189
Changes to Appropriation – Territorial 2012-13 2013-14 2014-15 2015-16 2016-17Payment for Expenses on Behalf of Territory Est. Out. Budget Estimate Estimate Estimate $'000 $'000 $'000 $'000 $'000
2012-13 Budget 228,229 235,473 253,740 275,983 275,983
FMA Section 16B Rollovers from 2011-12Commonwealth Grants – Reward for Great Teachers
– Non Government Schools NP206 - - - -
Interest Subsidy Scheme 181 - - - -
2013-14 Budget Policy AdjustmentsSecondary Bursary Scheme - 77 158 162 162 Supporting Non Government Schools - 1,200 1,227 1,255 1,283 ACT Base Funding Adjustment - National School
Reform1- 312 1,506 2,777 3,973
2013-14 Budget Technical AdjustmentsNon Government Schools Enrolment Adjustment - 627 860 841 739 Revised Indexation Parameters - (130) (133) (136) 1,664 Revised Funding Profile – Interest Subsidy Scheme (2,250) 2,250 - - - Commonwealth Grants – Literacy and Numeracy –
Non Government Schools NP638 320 - - -
Commonwealth Grants – Reward for Great Teachers – Non Government Schools NP
37 (316) (952) (1,903) (1,903)
Commonwealth Grants – Empowering Local Schools – Non Government Schools NP
- - - (2,049) (2,049)
Commonwealth Grants – Trade Training Centres – Non Government Schools NP
(350) (715) (771) (1,544) 104
Commonwealth Grants – National Schools – Non Government Schools SPP
(7,141) (91,370) (195,403) (211,520) (211,519)
National Education Reform - 90,668 187,667 199,859 212,645Commonwealth Grants – Reward for School
Improvement NP- - (193) (468) (468)
Commonwealth Grants – Support for Students with Disability
- 213 213 - -
2013-14 Budget 219,550 238,609 247,919 263,257 280,614
2013-14 Budget Paper No. 4 300 Education and Training Directorate

Changes to Appropriation cont.Changes to Appropriation – Controlled 2012-13 2013-14 2014-15 2015-16 2016-17Capital Injections Est. Out. Budget Estimate Estimate Estimate $'000 $'000 $'000 $'000 $'000
2012-13 Budget 122,318 58,792 17,312 18,924 18,924
FMA Section 16B Rollovers from 2011-12Digital Learning 1,863 - - - - COAG Universal Access to Preschools – Stage 1
Expansion Works1,118 - - - -
Environment – Solar Schools 523 - - - - Gungahlin College 467 - - - - Harrison Secondary School 464 - - - - Namadgi P-10 School 390 - - - - Canberra College Cares (CC Cares) – (Forward Design) 353 - - - - Additional IT – Public Schools 322 - - - - Installation of Artificial Grass Surfaces – Stage 1 223 - - - - Fibre Optic Cabling 221 - - - - Smart Schools Smart Students 216 - - - - School Toilet Upgrades Program – Stage 1 197 - - - - North Watson Development – Majura Primary School
Expansion193 - - - -
West Macgregor Development – Macgregor Primary School Expansion
121 - - - -
Fire System Upgrade Program 118 - - - - School Roof Replacement Program – Stage 1 111 - - - - Year 12 Certification – Stage 3 90 - - - - Car Parks and Traffic Safety Program 85 - - - - Schools Staffing Integrated Management System
Design79 - - - -
Molonglo (Coombs) Primary School (Design) 50 - - - - Replacement of ACT Vocational Education
Management System (AVMS 2)46 - - - -
Commonwealth Grants – National Solar Schools Plan – Government Schools NP
46 - - - -
Bonner Primary School (Design) 39 - - - - Commonwealth Grants – Trade Training Centres
Schools – Government Schools NP20 - - - -
New Online Enrolment System 10 - - - - Malkara School – Hydrotherapy Pool Refurbishment (49) - - - - Hazardous Materials Removal Program – Stage 2 (275) - - - - Red Hill Primary School Expansion (744) - - - - Canberra College (Woden Campus) Performing Arts
Theatre(1,748) - - - -
Franklin Early Childhood School (Design) (2,735) - - - -
2013-14 Budget Policy AdjustmentsSustaining Smart Schools - 7,100 1,500 1,500 - Canberra College Cares – New Building at Phillip
Campus- 5,000 9,000 - -
School Infrastructure for the Future - 3,345 - - - Belconnen High School Modernisation – Stage 1 - 2,000 - - - Childcare Centre Upgrades – Stage 2 - 2,000 - - - Tuggeranong Introductory English Centre - 800 1,000 - - Coombs Primary School (Finalisation of Design) - 550 - - -
2013-14 Budget Paper No. 4 301 Education and Training Directorate

Changes to Appropriation cont.Changes to Appropriation – Controlled 2012-13 2013-14 2014-15 2015-16 2016-17Capital Injections Est. Out. Budget Estimate Estimate Estimate $'000 $'000 $'000 $'000 $'000
2013-14 Budget Technical AdjustmentsRevised Indexation Parameters - - - - 355 Transfer – Childcare Services and Regulation from
CSD10,230 5,910 436 447 458
Revised Funding Profile – Carbon Neutral Schools – Stage 1
500 (500) - - -
Revised Funding Profile – Fibre Optic Cabling (50) 50 - - - Revised Funding Profile – Smart Schools Smart
Students(164) 164 - - -
Revised Funding Profile – ACT Teacher Quality Institute
(289) 289 - - -
Revised Funding Profile – School Staffing Integrated Management System Design
(330) 330 - - -
Revised Funding Profile – Duffy Primary and Preschool Expansion
(780) 780 - - -
Revised Funding Profile – Replacement of ACT Vocational Education Management System (AVMS 2)
(813) 813 - - -
Revised Funding Profile – COAG Universal Access to Preschools – Stage 1 Expansion Works
(2,000) 2,000 - - -
Revised Funding Profile – North Watson Development – Majura Primary School Expansion
(2,000) 2,000 - - -
Revised Funding Profile – Franklin Early Childhood School (Design)
(3,000) (11,000) - - -
Revised Funding Profile – West Macgregor Expansion – Macgregor Primary School Expansion
(3,000) 3,000 - - -
Revised Funding Profile – Bonner Primary School (Design)
(7,500) (6,500) - - -
Cessation – Carbon Neutral Schools – Stage 1 - - - - (1,000)Commonwealth Grants – Trade Training Centres
Schools – Government Schools NP3,086 2,817 (554) (1,421) 735
Commonwealth Grants – National Solar Schools Plan NP
(336) 382 - - -
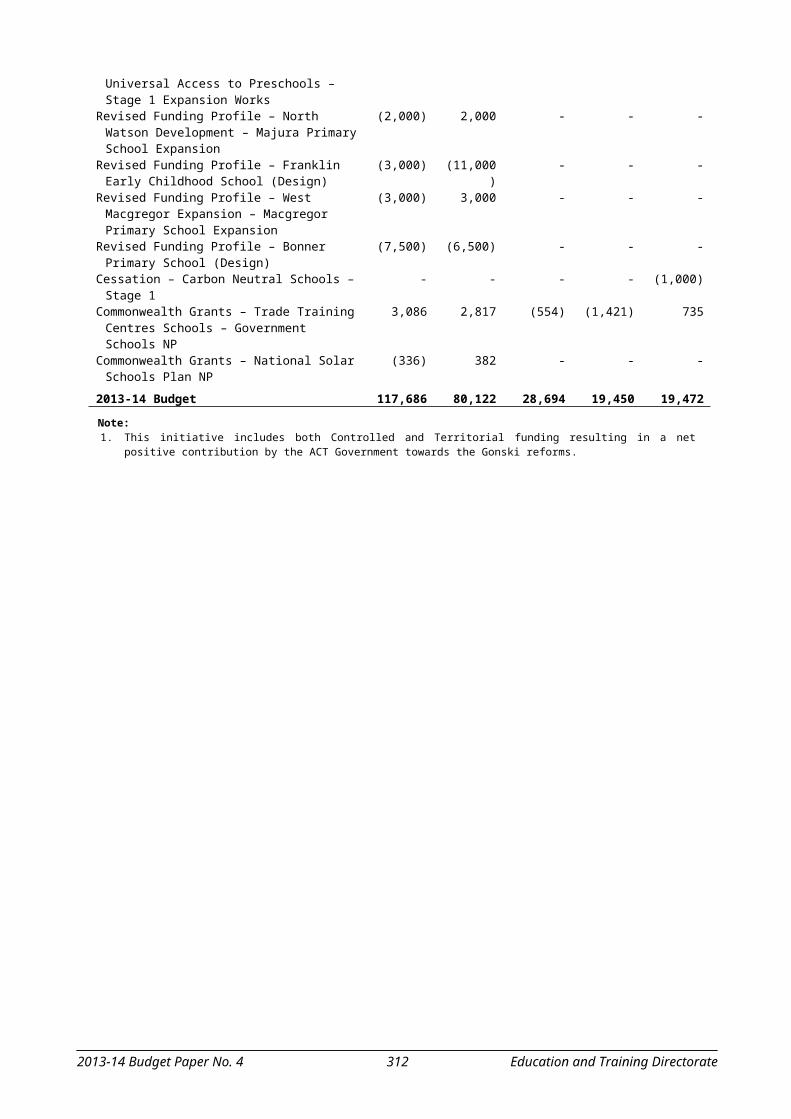
2013-14 Budget 117,686 80,122 28,694 19,450 19,472
Note:1. This initiative includes both Controlled and Territorial funding resulting in a net positive contribution by the ACT Government
towards the Gonski reforms.
2013-14 Budget Paper No. 4 302 Education and Training Directorate

2013-14 Capital Works Program Estimated Estimated 2013-14 2014-15 2015-16 Physical
Total Expenditure Financing Financing Financing Completion Cost Pre 2013-14 Date
$’000 $’000 $’000 $’000 $’000
New Capital WorksCanberra College Cares – New Building at
Phillip Campus14,000 - 5,000 9,000 - Feb 2015
School Infrastructure for the Future 3,345 - 3,345 - - Jun 2014 Childcare Centre Upgrades – Stage 2 2,000 - 2,000 - - Jun 2014 Belconnen High School Modernisation –
Stage 12,000 - 2,000 - - Jun 2014
Tuggeranong Introductory English Centre 1,800 - 800 1,000 - Feb 2015Coombs Primary School (Finalisation of
Design)550 - 550 - - Mar 2014
Total New Capital Works 23,695 - 13,695 10,000
Capital UpgradesSchool Capital Upgrades 13,530 - 13,530Childcare Capital Upgrades 425 - 425Total Capital Upgrades 13,955 - 13,955
Total New Works 37,650 - 27,650 10,000 - Works in ProgressCOAG Universal Access to Preschools –
Stage 1 Expansion Works6,200 4,200 2,000 - - Feb 2014
Duffy Primary School Expansion 2,800 900 1,900 - - Feb 2014Carbon Neutral Schools – Stage 1 3,500 1,000 500 1,000 1,000 Jun 2016Rectification and Upgrade of Taylor
Primary School 12,930 5,000 7,930 - - Dec 2013
Civic Childcare Centre (Feasibility) 350 200 150 - - Dec 2013Franklin Early Childhood School 28,700 24,700 4,000 - - Mar 2013Bonner Primary School 46,270 33,770 12,500 - - Jun 2013West Macgregor Development –
Macgregor Primary School Expansion5,650 2,650 3,000 - - Sep 2013
North Watson Development – Majura Primary School Expansion
4,400 2,400 2,000 - - Oct 2013
Trade Training Centres1 17,269 4,625 4,027 1,888 2,287 Jun 2017Childcare Centre Improvements 900 117 783 - - Jun 2014Upgrade of Early Childhood Facilities 7,236 5,534 1,702 - - Dec 2013Holder Early Childhood Centre 7,189 4,189 3,000 - - Mar 2014Total Works in Progress 143,394 89,285 43,492 2,888 3,287
Total Capital Works Program 181,044 89,285 71,142 12,888 3,287
Note:1. An additional $4.442 million is forecast for the 2016-17 financial year.
2013-14 Budget Paper No. 4 303 Education and Training Directorate

Education and Training DirectorateOperating Statement
2012-13 2012-13 2013-14 2014-15 2015-16 2016-17Budget Est. Outcome Budget Var Estimate Estimate Estimate
$'000 $'000 $'000 % $'000 $'000 $'000
Income Revenue
558,459 Government Payment for Outputs
569,576 589,429 3 584,588 597,620 618,189
16,598 User Charges - Non ACT Government
15,142 15,528 3 15,927 16,328 16,728
405 User Charges - ACT Government
405 415 2 425 436 436
1,545 Interest 1,350 1,350 - 1,350 1,350 1,3500 Distribution from
Investments with the Territory Banking Account1
195 118 -39 118 118 118
19,086 Other Revenue 20,048 20,033 .. 20,011 20,013 20,015249 Resources Received
Free of Charge385 385 - 385 385 385
596,342 Total Revenue 607,101 627,258 3 622,804 636,250 657,221
596,342 Total Income 607,101 627,258 3 622,804 636,250 657,221
Expenses
386,325 Employee Expenses 391,918 406,210 4 412,471 423,292 439,44558,145 Superannuation Expenses 58,456 60,219 3 58,999 61,128 62,97465,630 Supplies and Services 68,040 69,324 2 64,933 63,954 64,20057,411 Depreciation and
Amortisation65,449 68,589 5 71,990 72,572 73,052
20 Borrowing Costs 12 12 - 12 12 1228,244 Grants and Purchased
Services32,136 30,949 -4 24,744 24,965 26,962
62,774 Other Expenses 62,640 62,959 1 63,787 64,421 65,150
658,549 Total Ordinary Expenses 678,651 698,262 3 696,936 710,344 731,795
-62,207 Operating Result -71,550 -71,004 1 -74,132 -74,094 -74,574
-62,207 Total Comprehensive Income
-71,550 -71,004 1 -74,132 -74,094 -74,574
Note:1. Interest received from investments with the Territory Banking Account is no longer presented as Interest Income. These amounts
are now reflected under the line item Distributions from the Territory Banking Account. This treatment is not reflected in the 2012-13 Budget figures.
2013-14 Budget Paper No. 4 304 Education and Training Directorate

Education and Training DirectorateBalance Sheet
Budget Est. Outcome Budget Estimate Estimate Estimateas at 30/6/13 as at 30/6/13 as at 30/6/14 Var as at 30/6/15 as at 30/6/16 as at 30/6/17
$'000 $'000 $'000 % $'000 $'000 $'000 Current Assets
41,806 Cash and Cash Equivalents 50,496 50,967 1 51,438 51,909 52,3807,121 Receivables 4,605 4,603 .. 4,601 4,599 4,597
259 Investments 259 259 - 259 259 2593,653 Other Current Assets 2,648 2,648 - 2,648 2,648 2,648
52,839 Total Current Assets 58,008 58,477 1 58,946 59,415 59,884
Non Current Assets
1,774 Investments 1,832 1,832 - 1,832 1,832 1,8321,914,581 Property, Plant and
Equipment1,968,189 2,005,239 2 1,971,060 1,920,857 1,868,395
150 Intangibles 123 123 - 123 123 12377,980 Capital Works in Progress 34,797 10,350 -70 2,350 550 550
1,994,485 Total Non Current Assets 2,004,941 2,017,544 1 1,975,365 1,923,362 1,870,900
2,047,324 TOTAL ASSETS 2,062,949 2,076,021 1 2,034,311 1,982,777 1,930,784
Current Liabilities
4,164 Payables 8,637 8,637 - 8,637 8,637 8,637149 Finance Leases 50 50 - 50 50 50
107,141 Employee Benefits 115,283 118,726 3 122,164 124,987 127,8103,787 Other Liabilities 3,853 3,853 - 3,853 3,853 3,853
115,241 Total Current Liabilities 127,823 131,266 3 134,704 137,527 140,350
Non Current Liabilities
53 Finance Leases 53 5 -91 4 3 211,023 Employee Benefits 11,183 11,742 5 12,033 12,320 12,608
58 Other 58 58 - 58 58 58
11,134 Total Non Current Liabilities 11,294 11,805 5 12,095 12,381 12,668
126,375 TOTAL LIABILITIES 139,117 143,071 3 146,799 149,908 153,018
1,920,949 NET ASSETS 1,923,832 1,932,950 .. 1,887,512 1,832,869 1,777,766 REPRESENTED BY FUNDS EMPLOYED
899,726 Accumulated Funds 911,629 920,747 1 875,309 820,666 765,5631,021,223 Reserves 1,012,203 1,012,203 - 1,012,203 1,012,203 1,012,203
1,920,949 TOTAL FUNDS EMPLOYED 1,923,832 1,932,950 .. 1,887,512 1,832,869 1,777,766
2013-14 Budget Paper No. 4 305 Education and Training Directorate

Education and Training DirectorateStatement of Changes in Equity
Budget Est. Outcome Budget Estimate Estimate Estimateas at 30/6/13 as at 30/6/13 as at 30/6/14 Var as at 30/6/15 as at 30/6/16 as at 30/6/17
$'000 $'000 $'000 % $'000 $'000 $'000
Opening Equity
839,615 Opening Accumulated Funds 831,420 911,629 10 920,747 875,309 820,6661,021,223 Opening Asset Revaluation
Reserve1,012,203 1,012,203 - 1,012,203 1,012,203 1,012,203
1,860,838 Balance at the Start of the
Reporting Period1,843,623 1,923,832 4 1,932,950 1,887,512 1,832,869
Comprehensive Income
-62,207 Operating Result for the Period
-71,550 -71,004 1 -74,132 -74,094 -74,574
-62,207 Total Comprehensive
Income-71,550 -71,004 1 -74,132 -74,094 -74,574
0 Total Movement in Reserves 0 0 - 0 0 0 Transactions Involving Owners
Affecting Accumulated Funds
122,318 Capital Injections 117,686 80,122 -32 28,694 19,451 19,4710 Inc/Dec in Net Assets due to
Admin Restructure34,073 0 -100 0 0 0
122,318 Total Transactions Involving
Owners Affecting Accumulated Funds
151,759 80,122 -47 28,694 19,451 19,471
Closing Equity
899,726 Closing Accumulated Funds 911,629 920,747 1 875,309 820,666 765,5631,021,223 Closing Asset Revaluation
Reserve1,012,203 1,012,203 - 1,012,203 1,012,203 1,012,203
1,920,949 Balance at the End of the
Reporting Period1,923,832 1,932,950 .. 1,887,512 1,832,869 1,777,766
2013-14 Budget Paper No. 4 306 Education and Training Directorate

Education and Training DirectorateCash Flow Statement
2012-13 2012-13 2013-14 2014-15 2015-16 2016-17Budget Est. Outcome Budget Var Estimate Estimate Estimate
$'000 $'000 $'000 % $'000 $'000 $'000
CASH FLOWS FROM OPERATING ACTIVITIES Receipts
558,459 Cash from Government for Outputs
569,576 589,429 3 584,588 597,620 618,189
17,003 User Charges 15,547 15,943 3 16,353 16,764 17,1641,545 Interest Received 1,350 1,350 - 1,350 1,350 1,350
0 Distribution from Investments with the Territory Banking Account1
195 118 -39 118 118 118
43,577 Other Receipts 44,539 39,340 -12 35,187 34,413 34,415620,584 Operating Receipts 631,207 646,180 2 637,596 650,265 671,236
Payments382,008 Related to Employees 387,596 402,206 4 408,740 420,181 436,333
58,147 Related to Superannuation 58,458 60,221 3 59,001 61,130 62,97765,029 Related to Supplies and
Services67,303 68,592 2 64,202 63,222 63,468
20 Borrowing Costs 12 12 - 12 12 1228,244 Grants and Purchased
Services32,136 30,949 -4 24,744 24,965 26,962
87,469 Other 87,335 82,464 -6 79,161 79,019 79,748620,917 Operating Payments 632,840 644,444 2 635,860 648,529 669,500
-333 NET CASH INFLOW/(OUTFLOW)
FROM OPERATING ACTIVITIES-1,633 1,736 206 1,736 1,736 1,736
CASH FLOWS FROM INVESTING ACTIVITIES Payments
123,533 Purchase of Property, Plant and Equipment and Capital Works
118,901 81,337 -32 29,909 20,665 20,687
123,533 Investing Payments 118,901 81,337 -32 29,909 20,665 20,687
-123,533 NET CASH INFLOW/(OUTFLOW) FROM INVESTING ACTIVITIES
-118,901 -81,337 32 -29,909 -20,665 -20,687
CASH FLOWS FROM FINANCING ACTIVITIES Receipts
122,318 Capital Injections from Government
117,686 80,122 -32 28,694 19,450 19,472
122,318 Financing Receipts 117,686 80,122 -32 28,694 19,450 19,472Payments
50 Repayment of Finance Leases 50 50 - 50 50 5050 Financing Payments 50 50 - 50 50 50
122,268 NET CASH INFLOW/(OUTFLOW)
FROM FINANCING ACTIVITIES117,636 80,072 -32 28,644 19,400 19,422
-1,598 NET INCREASE / (DECREASE)
IN CASH HELD-2,898 471 116 471 471 471
43,404 CASH AT THE BEGINNING OF
REPORTING PERIOD53,394 50,496 -5 50,967 51,438 51,909
41,806 CASH AT THE END OF
REPORTING PERIOD50,496 50,967 1 51,438 51,909 52,380
Note:1. Interest received from investments with the Territory Banking Account is no longer presented as Interest Income. These amounts
are now reflected under the line item Distributions from the Territory Banking Account. This treatment is not reflected in the 2012-13 Budget figures.
2013-14 Budget Paper No. 4 307 Education and Training Directorate

Notes to the Budget StatementsSignificant variations are as follows:
Operating Statement
government payment for outputs:
– the increase of $11.117 million in the 2012-13 estimated outcome from the original budget is due to rollovers ($10.088 million) mainly associated with Commonwealth National Partnership Programs, transfer of childcare services and regulation from the Community and Services Directorate ($2.447 million), partially offset by revised Commonwealth Grants ($1.418 million); and
– the increase of $19.853 million in the 2013-14 Budget from the 2012-13 estimated outcome is mainly due to indexation ($10.319 million), wage parameters ($5.222 million), increases in enrolment numbers ($3.939 million), Commonwealth Government Grants ($2.382 million) and the impact of rollovers ($1.974 million). The increase is partially offset by, savings initiatives ($2.145 million) and revised superannuation parameters ($0.957 million).
user charges – non ACT Government: the decrease of $1.456 million in the 2012-13 estimated outcome from the original budget is due to the revised Commonwealth Own Purpose grants. The increase of $0.386 million in the 2013-14 Budget from the 2012-13 estimated outcome is mainly due to the indexation of fees and charges.
other revenue: the increase of $0.962 million in the 2012-13 estimated outcome from the original budget mainly relates to teachers registration fees associated with Teacher Quality Institute.
employee expenses:
– the increase of $5.593 million in the 2012-13 estimated outcome from the original budget primarily relates to re-alignment of the comcare premium ($3.3 million), impact of rollovers ($2.214 million) and transfer of childcare services and regulation from the Community and Services Directorate ($1.098 million), partially offset by Commonwealth Government Grants reductions ($1.052 million); and
– the increase of $14.292 million in the 2013-14 Budget from the 2012-13 estimated outcome is mainly due to revised wage parameters ($11.867 million), increased staff numbers arising from increased enrolments ($3.444 million) and new and prior year initiatives ($0.576 million), partially offset by Comcare premium cost pressure in 2012-13 ($1.3 million).
superannuation expenses: the increase of $1.763 million in the 2013-14 Budget from the 2012-13 estimated outcome is primarily due to wage parameters ($0.950 million), increases in staff numbers arising from increased enrolments ($0.495 million) and Commonwealth Government Grants ($0.346 million).
2013-14 Budget Paper No. 4 308 Education and Training Directorate

supplies and services:
– the increase of $2.410 million in the 2012-13 estimated outcome from the original budget is mainly due to the impact of rollovers ($4.519 million), transfer of childcare services and regulation from the Community and Services Directorate ($1.291 million), partially offset by revised Commonwealth Government Grants ($1.308 million) and re-classification of budget to employee expenses for Comcare premium ($2.000 million); and
– the increase of $1.284 million in the 2013-14 Budget from the 2012-13 estimated outcome mainly relates to the impact of rollovers ($1.306 million) and indexation ($0.636 million), partially offset by savings initiatives ($0.429 million).
depreciation and amortisation:
– the increase of $8.038 million in the 2012-13 estimated outcome from the original budget primarily relates to the flow on impact of 2011-12 audited outcome relating to asset revaluation; and
– the increase of $3.140 million in the 2013-14 Budget from the 2012-13 estimated outcome is due to completed capital projects ($2.476 million) and transfer of childcare facilities from the Community and Services Directorate ($0.664 million).
grants and purchased services:
– the increase of $3.892 million in the 2012-13 estimated outcome from the original budget is primarily due to the impact of rollovers ($3.106 million) and increased Commonwealth Government Grants ($1.125 million); and
– the decrease of $1.187 million in the 2013-14 Budget from the 2012-13 estimated outcome primarily relates to the impact of rollovers ($0.701 million) and revised Commonwealth Government Grants ($0.510 million).
Balance Sheet
current assets: the increase of $5.169 million in the 2012-13 estimated outcome from the original budget is mainly due to the flow-on impact of the 2011-12 audited outcome primarily due to timing of expenditure, partially offset by receivables and prepayments.
non current assets:
– the increase of $10.456 million in the 2012-13 estimated outcome from the original budget is mainly due to the transfer of childcare facilities from the Community Services Directorate, partially offset by the deferral of works to 2013-14; and
– the increase of $12.603 million in the 2013-14 Budget from the 2012-13 estimated outcome is mainly due to the capital works program and the purchase of plant and equipment ($81.337 million), partially offset by depreciation ($68.589 million).
total liabilities:
– the increase of $12.742 million in the 2012-13 estimated outcome from the original budget is mainly due to increased employee entitlements associated with the flow-on impact of the 2011-12 audited outcome and increased payables; and
2013-14 Budget Paper No. 4 309 Education and Training Directorate

– the increase of $3.954 million in the 2013-14 Budget from the 2012-13 estimated outcome is due to the impact of increased employee entitlements associated with wage parameters.
Statement of Changes in Equity
capital injections:
– the decrease of $4.632 million in the 2012-13 estimated outcome from the original budget is due to rollovers and cash re-profiling of projects ($17.612 million), partially offset by the transfer of Childcare capital projects ($10.230 million) and revised Commonwealth Government funding ($2.750 million) mainly associated with the Trade Training Centres National Partnership; and
– the decrease of $37.564 million in the 2013-14 Budget from the 2012-13 estimated outcome is due to reduced capital projects funding ($67.018 million), partially offset by new initiatives ($20.795 million) and rollovers and cash re-profiling of projects ($8.659 million).
increase in net assets due to administrative restructure: the net increase in assets of $34.073 million due to administrative restructure relates to the transfer of childcare facilities from the Community Services Directorate
Cash Flow Statement
Variations in the statement are explained in the notes above.
2013-14 Budget Paper No. 4 310 Education and Training Directorate

Education and Training DirectorateStatement of Income and Expenses on Behalf of the Territory
2012-13 2012-13 2013-14 2014-15 2015-16 2016-17Budget Est. Outcome Budget Var Estimate Estimate Estimate
$'000 $'000 $'000 % $'000 $'000 $'000 Income
Revenue212,368 Payment for Expenses on
behalf of Territory204,290 222,146 9 230,674 244,894 260,936
210 Taxes, Fees and Fines 12 0 -100 0 0 0 212,578 Total Revenue 204,302 222,146 9 230,674 244,894 260,936 212,578 Total Income 204,302 222,146 9 230,674 244,894 260,936 Expenses
212,368 Grants and Purchased Services
204,290 222,146 9 230,674 244,894 260,936
210 Transfer Expenses 12 0 -100 0 0 0 212,578 Total Expenses 204,302 222,146 9 230,674 244,894 260,936 0 Operating Result 0 0 - 0 0 0 0 Total Comprehensive Income
0 0 - 0 0 0
Education and Training DirectorateStatement of Assets and Liabilities on Behalf of the Territory
Budget Est. Outcome Budget Estimate Estimate Estimateas at 30/6/13 as at 30/6/13 as at 30/6/14 Var as at 30/6/15 as at 30/6/16 as at 30/6/17
$'000 $'000 $'000 % $'000 $'000 $'000 Current Assets
558 Cash and Cash Equivalents 50 50 - 50 50 5099 Receivables 23 23 - 23 23 23
657 Total Current Assets 73 73 - 73 73 73 657 TOTAL ASSETS 73 73 - 73 73 73 Current Liabilities
657 Other Liabilities 73 73 - 73 73 73 657 Total Current Liabilities 73 73 - 73 73 73 657 TOTAL LIABILITIES 73 73 - 73 73 73 0 NET ASSETS 0 0 - 0 0 0 REPRESENTED BY FUNDS EMPLOYED 0 TOTAL FUNDS EMPLOYED 0 0 - 0 0 0
2013-14 Budget Paper No. 4 311 Education and Training Directorate
Education and Training DirectorateStatement of Changes in Equity on Behalf of the Territory
Budget Est. Outcome Budget Estimate Estimate Estimateas at 30/6/13 as at 30/6/13 as at 30/6/14 Var as at 30/6/15 as at 30/6/16 as at 30/6/17
$'000 $'000 $'000 % $'000 $'000 $'000
0 Total Movement in Reserves 0 0 - 0 0 0
0 Balance at the End of the Reporting Period
0 0 - 0 0 0
Education and Training DirectorateStatement of Cash Flows on Behalf of the Territory
2012-13 2012-13 2013-14 2014-15 2015-16 2016-17Budget Est. Outcome Budget Var Estimate Estimate Estimate
$'000 $'000 $'000 % $'000 $'000 $'000 CASH FLOWS FROM OPERATING ACTIVITIES
Receipts
228,229 Cash from Government for EBT
219,550 238,609 9 247,919 263,257 280,614
210 Taxes, Fees and Fines 12 0 -100 0 0 05,316 Other Receipts 5,109 5,588 9 5,652 5,944 6,226
233,755 Operating Receipts 224,671 244,197 9 253,571 269,201 286,840 Payments
228,229 Grants and Purchased Services
219,550 238,609 9 247,919 263,257 280,614
5,316 Other 5,109 5,588 9 5,652 5,944 6,226210 Territory Receipts to
Government12 0 -100 0 0 0
233,755 Operating Payments 224,671 244,197 9 253,571 269,201 286,840
0 NET CASH INFLOW/ (OUTFLOW) FROM OPERATING ACTIVITIES
0 0 - 0 0 0
558 CASH AT THE BEGINNING OF
REPORTING PERIOD50 50 - 50 50 50
558 CASH AT THE END OF REPORTING PERIOD
50 50 - 50 50 50
2013-14 Budget Paper No. 4 312 Education and Training Directorate

Notes to the Budget StatementsSignificant variations are as follows:
Statement of Income and Expenses on Behalf of the Territory
payment for expenses on behalf of the Territory and grants and purchased services:
– the decrease of $8.078 million in the 2012-13 estimated outcome from the original budget is due to revised Commonwealth Government Grants for non government schools ($6.196 million) and the impact of rollovers ($1.882 million); and
– the increase of $17.856 million in the 2013-14 Budget from the 2012-13 estimated outcome is due to increased non government schools funding from the Commonwealth Government ($12.025 million), additional non government schools funding from the ACT Government ($3.738 million) and the impact of rollovers ($2.119 million).
Statement of Assets and Liabilities on Behalf of the Territory
Variations in the statement are explained in the notes above.
Statement of Cash Flows on Behalf of the Territory
Variations in the statement are explained in the notes above.
2013-14 Budget Paper No. 4 313 Education and Training Directorate

Public School EducationOperating Statement
2012-13 2012-13 2013-14 2014-15 2015-16 2016-17Budget Est. Outcome Budget Var Estimate Estimate Estimate
$'000 $'000 $'000 % $'000 $'000 $'000 Income Revenue
519,378 Government Payment for Outputs
526,129 548,459 4 549,861 562,760 580,498
15,841 User Charges - Non ACT Government
15,133 15,519 3 15,919 16,319 16,719
404 User Charges - ACT Government
404 414 2 424 435 435
1,542 Interest 1,350 1,350 - 1,350 1,350 1,3500 Distribution from
Investments with the Territory Banking Account1
192 115 -40 115 115 115
19,057 Other Revenue 19,659 19,644 .. 19,622 19,624 19,626248 Resources Received Free of
Charge384 384 - 384 384 384
556,470 Total Revenue 563,251 585,885 4 587,675 600,987 619,127
556,470 Total Income 563,251 585,885 4 587,675 600,987 619,127
Expenses
378,756 Employee Expenses 383,922 398,585 4 405,065 415,940 431,56756,991 Superannuation Expenses 57,231 59,082 3 57,919 60,055 61,84261,561 Supplies and Services 62,817 65,129 4 61,782 60,810 60,78057,280 Depreciation and
Amortisation65,327 68,236 4 71,445 72,027 72,507
20 Borrowing Costs 12 12 - 12 12 121,185 Grants and Purchased
Services2,751 2,560 -7 1,292 1,312 1,341
62,658 Other Expenses 62,524 62,843 1 63,672 64,305 65,032
618,451 Total Ordinary Expenses 634,584 656,447 3 661,187 674,461 693,081
-61,981 Operating Result -71,333 -70,562 1 -73,512 -73,474 -73,954
Note:1. Interest received from investments with the Territory Banking Account is no longer presented as Interest Income. These amounts
are now reflected under the line item Distributions from the Territory Banking Account. This treatment is not reflected in the 2012-13 Budget figures.
2013-14 Budget Paper No. 4 314 Education and Training Directorate

Non Government EducationOperating Statement
2012-13 2012-13 2013-14 2014-15 2015-16 2016-17Budget Est. Outcome Budget Var Estimate Estimate Estimate
$'000 $'000 $'000 % $'000 $'000 $'000 Income Revenue
3,629 Government Payment for Outputs
4,791 3,762 -21 2,380 2,415 2,461
79 User Charges - Non ACT Government
9 9 - 9 9 9
1 Interest 0 0 - 0 0 00 Distribution from
Investments with the Territory Banking Account1
1 1 - 1 1 1
0 Other Revenue 360 360 - 360 360 360
3,709 Total Revenue 5,161 4,132 -20 2,750 2,785 2,831
3,709 Total Income 5,161 4,132 -20 2,750 2,785 2,831 Expenses
1,856 Employee Expenses 1,709 1,632 -5 1,431 1,447 1,465285 Superannuation Expenses 294 253 -14 234 237 242
1,568 Supplies and Services 2,865 2,245 -22 1,079 1,095 1,11885 Depreciation and
Amortisation85 154 81 183 183 183
0 Grants and Purchased Services
293 0 -100 0 0 0
3 Other Expenses 3 3 - 3 3 3
3,797 Total Ordinary Expenses 5,249 4,287 -18 2,930 2,965 3,011
-88 Operating Result -88 -155 -78 -180 -180 -180
Note:1. Interest received from investments with the Territory Banking Account is no longer presented as Interest Income. These amounts
are now reflected under the line item Distributions from the Territory Banking Account. This treatment is not reflected in the 2012-13 Budget figures.
2013-14 Budget Paper No. 4 315 Education and Training Directorate

Vocational Education and TrainingOperating Statement
2012-13 2012-13 2013-14 2014-15 2015-16 2016-17Budget Est. Outcome Budget Var Estimate Estimate Estimate
$'000 $'000 $'000 % $'000 $'000 $'000 Income Revenue
35,452 Government Payment for Outputs
38,656 37,208 -4 32,346 32,445 35,230
678 User Charges - Non ACT Government
0 0 - 0 0 0
1 User Charges - ACT Government
1 1 - 1 1 1
2 Interest 0 0 - 0 0 00 Distribution from
Investments with the Territory Banking Account1
2 2 - 2 2 2
29 Other Revenue 29 29 - 29 29 291 Resources Received Free of
Charge1 1 - 1 1 1
36,163 Total Revenue 38,689 37,241 -4 32,379 32,478 35,263
36,163 Total Income 38,689 37,241 -4 32,379 32,478 35,263
Expenses
5,713 Employee Expenses 6,287 5,993 -5 5,975 5,905 6,413869 Superannuation Expenses 931 884 -5 846 836 890
2,501 Supplies and Services 2,358 1,950 -17 2,072 2,049 2,30246 Depreciation and
Amortisation37 199 438 362 362 362
27,059 Grants and Purchased Services
29,092 28,389 -2 23,452 23,653 25,621
113 Other Expenses 113 113 - 112 113 115
36,301 Total Ordinary Expenses 38,818 37,528 -3 32,819 32,918 35,703
-138 Operating Result -129 -287 -126 -440 -440 -440
Note:1. Interest received from investments with the Territory Banking Account is no longer presented as Interest Income. These amounts
are now reflected under the line item Distributions from the Territory Banking Account. This treatment is not reflected in the 2012-13 Budget figures.
2013-14 Budget Paper No. 4 316 Education and Training Directorate

Notes to the Output Class StatementsSignificant variations are as follows:
Public School Education Total Ordinary Expenses
the increase of $16.133 million in the 2012-13 estimated outcome from the original budget is mainly due to the flow on impact of the audited outcome adjustment relating to depreciation ($7.885 million), the net impact of Commonwealth Government Grants (including rollovers) ($4.911 million) and the transfer of childcare services and regulation from the Community and Services Directorate ($2.951 million).
the increase of $21.863 million in the 2013-14 Budget from the 2012-13 estimated outcome is due to wage parameters and indexation ($14.787 million), increases in staff due to increased enrolments ($3.939 million) and depreciation ($2.909 million).
Non Government Education Total Ordinary Expenses
the increase of $1.452 million in the 2012-13 estimated outcome from the original budget is mainly due to the impact of rollovers relating to National Partnership Programs.
the decrease of $0.962 million in the 2013-14 Budget from the 2012-13 estimated outcome is mainly due to the impact of rollovers ($1.246 million) partially offset by new initiatives ($0.163 million).
Vocational Education and Training Total Ordinary Expenses
the increase of $2.517 million in the 2012-13 estimated outcome from the original budget is mainly due to the impact of rollovers ($3.204 million), partially offset by the flow on audited outcome impact relating to user charges ($0.678 million).
the decrease of $1.290 million in the 2013-14 Budget from the 2011-12 estimated outcome is mainly due to the impact of rollovers.
2013-14 Budget Paper No. 4 317 Education and Training Directorate

2013-14 Budget Paper No. 4 318 Education and Training Directorate