· 2013-12-11 · THIS IS REPUBLIKA SRPSKA, 2013 . PREFACE. 3. Dear Readers, Here is the sixth...
107
Transcript of · 2013-12-11 · THIS IS REPUBLIKA SRPSKA, 2013 . PREFACE. 3. Dear Readers, Here is the sixth...


Banja Luka December 2013
ISSN 2232-7304 UDC 311 (497.6 Republika Srpska)
THIS IS REPUBLIKA SRPSKA
2013

Editor in Chief: Radmila Čičković, PhD Editorial Board: Radmila Čičković, PhD, Radoslav Latinčić, Bogdana Radić, Jelena Đokić, Velimir Savić, Aleksandra Zec Head of the Division for creation of publication databases and statistical publications Vladan Sibinović Preparation of the data: Statistical departments Technical preparation of the text, design and layout: Vladan Sibinović Translation: Jelena Kandić Person responsible Radmila Čičković, PhD, Acting Director Printed by: Primaprom, Banja Luka For the printing company: Duško Vrhovac

THIS IS REPUBLIKA SRPSKA, 2013
PREFACE
3
Dear Readers,
Here is the sixth edition of the annual publication entitled “This is Republika Srpska”, published by the Republika Srpska Institute of Statistics. As in the previous editions, we present you with basic statistical data on Republika Srpska once again in a simple, interesting and picturesque way.
In this publication we present the current fields of life and functioning of Republika Srpska, in 28 chapters, using graphs, tables and short texts and focusing on the five-year period, in order to provide You with a more detailed image of Republika Srpska through the comparison of situation in the given time period.
Additional value is given to this publication by the fact that it compares our statistical data with data for the neighbouring countries, which provides readers with a more complete view of Republika Srpska.
Also, this publication is available in English as a separate edition, and both editions may be downloaded free of charge at the website of the Republika Srpska Institute of Statistics.
I would like to thank everyone who participated in the preparation and development of this publication, as well as users for their suggestions aimed at the improvement of the content quality of this year’s edition.
Radmila Čičković, PhD Acting Director of the Republika Srpska Institute of Statistics

THIS IS REPUBLIKA SRPSKA, 2013
USER GUIDE
4
Dear users,
This publication is designed for a wide range of users, while providing main indicators of the situation and changes in the economic and social life of Republika Srpska.
Regular statistical activities carried out by the Institute of Statistics are the main source of data for tables and graphs for which source of data is not given.
For all tables and graphs which present data collected and processed by other authorised bodies and organisations, source of data is given under the table or graph.
For easy reference, data in certain tables and graphs are given in larger units of measure (thousand, million), while due to rounding-off total amounts do not always correspond to sums of data for individual categories.
Data presented by specific level of the activity classification are given in accordance with the KD BiH 2010 which is in its content and structure fully harmonised with the Statistical Classification of Economic Activities NACE Rev.2. Recalculation of data to the KD BiH 2010 was performed for the period between 2005 and 2010. For 2011 and 2012, data collection and processing were directly based on the KD BiH 2010.
When using data from this publication, we would appreciate it if you cited the source (Republika Srpska Institute of Statistics and the title of this publication).

THIS IS REPUBLIKA SRPSKA, 2013
TABLE OF CONTENTS
5
Preface ..........................................…………….….........................…… 3 User Guide …………….......................…………….........................…… 4 Symbols and Abbreviations ...............…………….........................…… 6 Sections of Economic Activity ............................................................. 8
1 General Information .......……………...................………………..….. 9 2 Geographical and Meteorological Data ........................................... 10 3 Register of Business Entities ...........…………….........................…… 17 4 Population …................................................................................... 20 5 Wages ............................................................................................... 23 6 Labour Market ................................................................................... 25 7 Gross Domestic Product ................................................................. 31 8 Standard of Living and Poverty …........................................................ 35 9 Gross Fixed Capital Formation …..................................................... 38
10 Prices ................................................................................................ 41 11 Agriculture ……................................................................................ 44 12 Forestry …............…...........………………………..................……… 49 13 Environment ……................................................................................ 52 14 Industry …........…...............………………………..................……… 55 15 Energy ……........…...............………………………..................……… 59 16 Construction .....................................……...............................…… 62 17 External Trade ……........................................................................... 64 18 Distributive Trade ………................................................................... 67 19 Hotels and Restaurants ……….......................................................... 69 20 Tourism ............................................................................................... 71 21 Transport and Communications ......................................................... 72 22 Education …….................................................................................... 77 23 Culture and Art ……........................................................................... 83 24 Health Care .................................................................................... 86 25 Health, Pension and Disability Insurance ……………….................. 88 26 Social Welfare ……........................................................................... 90 27 Research and Development …......................................................... 96 28 Crime ………..................................................................................... 101

THIS IS REPUBLIKA SRPSKA, 2013
SYMBOLS AND ABBREVIATIONS
6
- no occurrence ... data not available 0 data lower than 0.5 of the given unit of measure Ø average ( ) less reliable data – coefficient of variation (CV) lower than 0.2 and equal to or
higher than 0.1, or expressed in percentage as follows 10%≤CV<20%
(( )) unreliable data – coefficient of variation (CV) lower than 0.3 and equal to or higher than 0.2, or expressed in percentage as follows 20%≤CV<30%
• extremely unreliable data – coefficient of variation (CV) equal to or higher than 0.3, or expressed in percentage as follows CV≥30%
:
statistically unreliable data (up to 20 occurrences) * corrected data
*** confidential data 1) symbol for footnote in a table
°C degree Celsius m metre
m2 square metre m3 cubic metre km kilometre
km2 square kilometre elev. elevation
ha hectare t tonne
kW kilowatt GWh gigawatt hour
thous. thousand mill. million Sm3 a cubic metre of gas under a standard condition

THIS IS REPUBLIKA SRPSKA, 2013
SYMBOLS AND ABBREVIATIONS
7
pcs. pieces HBS Household Budget Survey LFS Labour Force Survey
GDP Gross Domestic Product COICOP Classification of Individual Consumption by Purpose
ISCED International Standard Classification of Education NACE Rev. 2 European Classification of Economic Activities
КМ Convertible Mark KD Classification of Economic Activities

THIS IS REPUBLIKA SRPSKA, 2013
SECTIONS OF ECONOMIC ACTIVITY 1)
8
A Agriculture, forestry and fishing
B Mining and quarrying
C Manufacturing
D Electricity, gas, steam and air-conditioning supply
E Water supply, sewerage, waste management and remediation
F Construction
G Wholesale and retail trade; repair of motor vehicles and motorcycles
H Transport and storage
I Accommodation and food service activities
J Information and communication
K Financial and insurance activities
L Real estate activities
M Professional, scientific and technical activities
N Administrative and support service activities
O Public administration and defence; compulsory social security
P Education
Q Human health and social work activities
R Arts, entertainment and recreation
S Other services
T Activities of households as employers; undifferentiated goods- and services- producing activities of households for own use
U Activities of extra-territorial organisations and bodies 1) Pursuant to the Decision on the Classification of Economic Activities of Republika Srpska (“Official Gazette of Republika Srpska”, No. 9/13 and 33/13).

THIS IS REPUBLIKA SRPSKA, 2013
General Information 1
9
Republika Srpska was proclaimed on 9th January 1992, while as an entity within Bosnia and Herzegovina it was verified by the Dayton Peace Agreement and peace ratification in Paris on 14th December 1995. Today, Republika Srpska is a parliamentary republic, with limited international subjectivity. The largest city in Republika Srpska is Banja Luka which is the administrative, economic and cultural centre of the country.
Name
Republika Srpska
Symbols
emblem
flag
Official languages
language of the Serbian people, language of the Bosniak people, language of the Croatian people
Official scripts Cyrillic and Latin alphabet Population (2012, estimate) 1,429,290
Square area1) 24,641 km2
Territorial organisation municipalities 57 cities 6
Currency Convertible Mark (КМ) International banking code (ISO code)
BAM
1) Preliminary data on the surface area of Republika Srpska which do not include the portion of Brčko District. Source: Republic Administration for Geodetic and Property-Legal Affairs

2 THIS IS REPUBLIKA SRPSKA, 2013
Geographical and Meteorological Data
10
Geographical location of Republika Srpska is very favourable The latitude and longitude of the territory of Republika Srpska are between 42°33'N and 45°16'N and 16°13'E and 19°38'E respectively, that is, its territory covers northern and eastern parts of the geographical area of Bosnia and Herzegovina. The surface area of Republika Srpska is 24,641km². Republika Srpska belongs to the group of continental areas – it has no access to the sea, and it is located at the meeting point of two large natural geographic and socio-economic regional units – Pannonian and Mediterranean. According to the territorial organisation, on the territory of Republika Srpska there are six cities: the City of Banja Luka, the City of Istočno Sarajevo, the City of Prijedor, the City of Doboj, the City of Bijeljina and the City of Trebinje, and 57 municipalities. The City of Banja Luka, the City of Prijedor, the City of Doboj, the City of Bijeljina and the City of Trebinje have no municipalities in their composition, while the territory of the City of Istočno Sarajevo consists of the municipalities Istočna Ilidža, Istočno Novo Sarajevo, Pale, Sokolac, Istočni Stari Grad, and Trnovo. The City of Banja Luka is the largest city in Republika Srpska, as well as the administrative, economic and cultural centre of the country. 2.1. Geographical coordinates of the extreme points
North geographic
latitude
East geographic longitude1)
Municipality Settlement
North 45° 17' 16° 56' Kozarska Dubica
Donja Gradina – Municipality of
Kozarska Dubica
South 42° 33' 18° 27' Trebinje Grab – Municipality of Trebinje
East 44° 03' 19° 38' Bratunac Žlijebac – Municipality of Bratunac
West 44° 57' 16° 12' Krupa na Uni
Srednji Bušević – Municipality of Krupa
na Uni 1) by Greenwich

THIS IS REPUBLIKA SRPSKA, 2013
Geographical and Meteorological Data 2
11
Republika Srpska is located on the intersection of vital communication links In terms of transport and geography, location of Republika Srpska is of particular importance. This is especially the case when it comes to the meridional direction which, by means of river valleys of Bosna and Neretva, while going through the Dinara mountain complex, connects Central European with Mediterranean macroregion. No less important is the zonal direction which connects Republika Srpska with the Central Balkans and Western European area. It is necessary to mention the importance of Republika Srpska's access to the river Sava, by means of which it is connected to the European Rhine – Main – Danube Canal. Natural characteristics of Republika Srpska are quite complex, which is the result of it being part of various natural and geographical units and their geomorphological evolution In the northern, Peri-Pannonian part, the hilly terrain composed of Cenozoic deposits gradually descends to the flat land with alluvial plateaus and fluvial terraces, and this is at the same time the most fertile part of Republika Srpska. There are only a few scattered mountains in this area – Kozara, Prosara, Motajica, Vučijak, Ozren and Trebovac, as well as the furthermost northeastern slopes of Majevica. Towards the south, the flat land gradually turns first into the hilly terrain and then into the mountainous region which covers the largest portion of the territory of Republika Srpska. The highest mountain peak on the territory of Republika Srpska is Maglić, located at 2,386 metres above sea level, on the mountain also named Maglić. The longest rivers in Republika Srpska are Drina (305 km), Sava (202 km), and Vrbas (117 km), and these belong to the Black Sea drainage basin. All waters south of the mountain pass Čemerno, in Eastern Herzegovina, belong to the Adriatic drainage basin (Trebišnjica, Neretva). Other large rivers in Republika Srpska are Bosna and Trebišnjica. The largest lake in Republika Srpska is Bilećko (on Trebišnjica), with the square area of 27.064 km2, and this lake is also the largest artificial lake in the Balkan Peninsula. The largest natural lake is Štirinsko (on the mountain Zelengora), with the square area of 0.129 km2.

2 THIS IS REPUBLIKA SRPSKA, 2013
Geographical and Meteorological Data
12
2. 2. The highest mountains and mountain peaks
Mountain Peak Height above sea level, m
Maglić Maglić 2,386 Volujak Volujak 2,336 Lelija Velika Lelija 2,032 Zelengora Bregoč 2,014 Klekovača Klekovača 1,961 Crvanj Zimomor 1,920 Jahorina Ogorjelica 1,916 Vitorog Veliki Vitorog 1,906 Bjelasnica (Gatačka) Bjelasnica 1,867 Baba Đed 1,735 Vučevo Žrvanj 1,696 Romanija Veliki Lupoglav 1,652 Trebević Trebević 1,629 Javor Veliki Žep 1,537
Source: Faculty of Natural Sciences and Mathematics Banja Luka, Department of Physical Geography 2.3. The longest rivers
River Length, km
TOTAL in Republika Srpska
Drina 341.0 305.0 Sava 945.0 202.0 Vrbas 249.9 117.0 Vrbanja 95.4 95.4 Sana 157.7 85.0 Una 212.5 82.0 Ukrina 80.9 80.9 Bosna 279.4 79.0
Source: Public Institution “Vode Srpske”, Bijeljina

THIS IS REPUBLIKA SRPSKA, 2013
Geographical and Meteorological Data 2
13
2.4. The largest lakes and fishponds
Square
area, km2 Height above sea level, m
Maximum depth, m
Water volume, mill. m3
ARTIFICIAL LAKES
Bilećko (on Trebišnjica) 27.064 400 104.0 1,280.0 Perućačko (on Drina) 12.401 290 70.0 355.0 Zvorničko (on Drina) 8.876 140 28.0 89.0 Višegradsko (on Drina) 8.900 336 78.0 161.0 Bočac (on Vrbas) 2.330 282 62.0 52.7
NATURAL LAKES Štirinsko (on Zelengora) 0.129 1,672 4.5 0.255 Kotlaničko (on Zelengora) 0.044 1,528 10.0 0.250 Uloško (on Crvanj) 0.043 1,058 14.0 0.255 Donje Bare (on Zelengora) 0.021 1,475 4.5 0.057 Orlovačko (on Zelengora) 0.021 1,438 5.0 0.054
FISHPONDS
Saničani (on Gomjenica) 11.179 143 4.0 ... Bardača (on Matura) 7.472 90 2.2 ... Prnjavor (on Vijaka) 6.664 134 3.5 ... Sjekovac (on Ukrina) 3.980 85 3.0 ...
Source: Faculty of Natural Sciences and Mathematics Banja Luka, Department of Physical Geography
Natural resources are certainly one of the key factors in the present and future development of Republika Srpska and its economic and geographical formation. In this sense, the most important natural resources are agricultural land, forest areas, hydro-climatic conditions, and mining and mineral resources.

2 THIS IS REPUBLIKA SRPSKA, 2013
Geographical and Meteorological Data
14
Climatic characteristics Various climatic influences in force on the territory of Republika Srpska are result of the natural factors and rules of general circulation of air masses in this region. Thus, there are three climate types on the territory of Republika Srpska, and these are: 1. Northern Peri-Pannonian region, with its moderate continental climate. This region’s climate is characterised by moderately cold winters and warm summers. Average annual air temperature ranges for this climate type are between 12°C and 19°C. 2. Alpine and Pannonian climate covers the largest part of Republika Srpska. Mountain ranges are characterised by short and cool summers and cold and snowy winters, with high snow cover which persists for a long time. Average annual air temperature is between 5°С and 7°С. Hilly terrain, hollows and valleys are however characterised by a somewhat milder climate. Average annual air temperature in the areas with the Alpine and Pannonian climate is approximately 10°C. Winters are moderately cold, with snow, common temperature inversions, and fog. Summers are moderately warm. 3. Modified Mediterranean-Adriatic climate The southern region of Republika Srpska, also known as lower Herzegovina, is characterised by the modified Adriatic climate. This region is called Humine, as opposed to the region called Rudine which covers higher mountainous parts of the karst of Herzegovina with a variant of both the Alpine climate and the climate of Humine. Average annual air temperature is between 14°C and 14.7°C. Trebinje, the warmest city in Republika Srpska, is located in this climatic region.

THIS IS REPUBLIKA SRPSKA, 2013
Geographical and Meteorological Data 2
15
2.5. Annual values of main meteorological parametres, 2012
Measuring station
Air temperature, annual average,
°C Cloudiness, tenths Humidity, % Insolation, hours
Banja Luka 12.7
5.6 70 2,085 Bijeljina 13.0 5.3 75 - Bileća 12.9 4.3 65 2,607 Višegrad 12.6 5.8 70 - Gradiška 13.1 4.6 69 - Doboj 12.3 5.7 72 2,083 Mrkonjić Grad 10.2 5.3 73 - Novi Grad 11.7 5.6 72 - Prijedor 12.5 5.7 71 2,047 Ribnik 11.3 5.2 69 - Sokolac 8.1 5.3 71 2,014 Srbac 11.4 - 71 - Trebinje 15.4 3.8 57 - Source: Republic Hydrometeorological Service
2.6. Earthquakes2)
Place Intensity degree Time of earthquake date hour minute
Gacko 6-7 25 Oct 1902 21 45 Vlasenica 6-7 25 Dec 1908 21 30 Ljubinje 8 14 Feb 1927 3 43 Derventa 7 17 Dec 1940 10 52 Treskavica (mountain) 8 11 Jun 1962 7 15 Zlovrh (mountain) 7 3 Jul 1967 2 55 Banja Luka 8 26 Oct 1969 15 36 Banja Luka 9 27 Oct 1969 8 10 Banja Luka 8 31 Dec 1969 13 18 Velež (mountain) 8 3 Oct 1979 22 57 Berkovići 6-7 27 Sep 2005 0 25 Trebinje 6-7 14 Nov 2008 13 26 Pale 5-6 31 Mar 2009 1 46 Čelinac 6
28 Apr 2011 23 30 2) Only the earthquakes with the intensity of six degrees and higher are shown. Intensity of earthquake
at the epicentre is rated by the MCS (Mercalli-Cancani-Sieberg) scale. The time is presented in GMT Source: Republic Hydrometeorological Service

2 THIS IS REPUBLIKA SRPSKA, 2013
Geographical and Meteorological Data
16
Kozara National Park, in the geographical and geomorphological terms, covers the Peri-Pannonian area of the internal Dinarides in Republika Srpska. From the geographical aspect, it covers the area between 44°59' N and 45°3'N and 16°51’E and 16°55'E respectively, by Greenwich. The square area of the Kozara National park is 3,520 ha and it was proclaimed a national park in 1967 in order to protect the cultural, historical and natural values of the mountain Kozara. Kozara National Park is a member of the Federation of Nature and National Parks of Europe – EUROPARC.
Kozara is a mountain of dynamic relief, with peaks not exceeding one thousand metres above sea level. Moderate continental climate, a lot of sunny days and cultivated mountaintops – vantage points from which one can observe Gradiška, Prijedor, Kozarska Dubica and other surrounding places give a special value to this mountain. On the territory of the National Park there are sources of large streams and rivers (Mlječanica, Moštanica, Kozaračka rijeka – Starenica), which makes the Kozara National Park an orohydrographical node of the mountain with the same name. The central part of the National Park and of the mountain covers the area of Mrakovica, and there are several plateaus at between 700 and 800 metres above sea level in this area. Geomorphologically, the territory of the park is rather heterogeneous and orographically very pronounced, which is particularly manifested in specific vegetation and climate change. Triassic limestone and dolomite in the southern part of the mountain, at certain places, build typical karst forms of relief, with reefs.
DID YOU KNOW THAT... Kozara was proclaimed a national park in 1967.

THIS IS REPUBLIKA SRPSKA, 2013
Register of Business Entities 3
17
Decrease in number of established business entities in 2012 compared to the previous year The number of business entities established in 2012 was 5.5% lower compared to 2011.
Graph 3.1. Number of established business entities by year, 2008–2012
The highest number of business entities was established in the section of activities S (Other service activities) and in the section of activities G (Wholesale and retail trade, repair of motor vegicles and motorcycles), and these accounted for 33.2% and 17.0% respectively. Trade activity – the most common activity of business entities Three fifths of all business entities, in terms of their predominant activity, are classified into the section G (Wholesale and retail trade; repair of motor vehicles and motorcycles), section S (Other service activities) and section C (Manufacturing).
0
200
400
600
800
1,000
1,200
1,400
1,600
2008 2009 2010 2011 2012

3 THIS IS REPUBLIKA SRPSKA, 2013
Register of Business Entities
18
3.1. Number of business entities by section of the Classification of Economic Activities, state as on 31st December
2011 2012
TOTAL 25,173 26,233 A 912 938 B 157 161 C 3,462 3,576 D 125 136 E 192 203 F 1,401 1,438 G 7,958 8,087 H 1,203 1,253 I 329 343 J 447 458 K 164 165 L 112 126 M 1,117 1,173 N 299 307 O 507 468 P 514 528 Q 489 603 R 1,849 1,968 S 3,935 4,301 U 1 1

THIS IS REPUBLIKA SRPSKA, 2013
Register of Business Entities 3
19
Data on business entities were obtained from the Register of Business Entities by activity maintained in the Institute of Statistics. The Register covers all entities with headquarters on the territory of Republika Srpska. Physical entities engaged in entrepreneurial activity are not entered into the Register.
DID YOU KNOW THAT... in one fifth of all established business entities in Republika Srpska directors/managers are under the age of 30.

4 THIS IS REPUBLIKA SRPSKA, 2013
Population
20
Population of Republika Srpska Estimated number of citizens in Republika Srpska in 2012 was 1,429,290, which was 378 citizens less than in the previous year. One of the reasons for the population decline was a negative natural increase. Among the neighbouring countries, a slight increase in number of population was recorded in the FYR Macedonia, Slovenia and Montenegro. Live-born children Average age of mother at birth of the first child in Republika Srpska was 26.4 years. Compared to the previous year, this age was almost the same. Data indicate that women postpone giving birth, thus the age of mother at birth has been increasing. Total average age of mother at birth in the EU-27, according to the latest available data provided by Eurostat (2011) was 30, while in Republika Srpska this age in 2012 was 28.1. In the previous period, approximately 85% of live-born children have been born in marriage. Deaths in Republika Srpska In comparison with the previous year, the total number of deceased persons increased by 1% in 2012. In Republika Srpska, the average age at death was 73 years. On the average, women live approximately six years longer than men. More than a half of all deceased persons died due to diseases of the circulatory system, while approximately one fifth died due to malignant tumors. Per one thousand live-born babies, on the average four babies up to one year of age decease. Republika Srpska has a low infant mortality rate when compared with the neighbouring countries, and in 2012 it amounted to 3.7‰.
DID YOU KNOW THAT… every second live-born baby in Republika Srpska is the first child, while on the average every eighth live-born baby is the third child in the family.

THIS IS REPUBLIKA SRPSKA, 2013
Population 4
21
4.1. Deaths in Republika Srpska 2008 2009 2010 2011 2012
ALL 13,501 13,775 13,517 13,658 13,796 Male 7,058 7,099 6,935 7,001 7,064 Female 6,443 6,676 6,582 6,657 6,732
Marriages Since 2007, the number of marriages has been decreasing. Per one thousand citizens, there are on the average 3.7 new marriages. Compared to the previous year, a slight decrease in this number was recorded, as in 2011 there were four new marriages per one thousand citizens. The oldest groom in 2012 was 89 years old, while the oldest bride was 79 years old. The youngest groom was 17 years old, and the youngest bride was 16 years old. Average age of bride at marriage was 27.8 years, while average age of bride at first marriage was 26.3 years. Average age of groom at marriage was 31.5 years, and average age of groom at first marriage was 29.6 years.
Graph 4.1. Marriages, by year
0 1,000 2,000 3,000 4,000 5,000 6,000 7,000
2008
2009
2010
2011
2012

4 THIS IS REPUBLIKA SRPSKA, 2013
Population
22
Migrations in Republika Srpska Approximately 35% of internal migrations in Republika Srpska were inter-municipality migrations in Republika Srpska, while more than a half of those were migrations between Republika Srpska and the Federation of Bosnia and Herzegovina. The largest population movements were recorded in the age group of 20 to 29 years. When it comes to this age group, women opt for moving more often than men. In the age group of 30 years and older, participation of men in migration is higher than that of women.
Graph 4.2. Internal migrations (immigration/emigration) in Republika Srpska,
2012
35.3%
60.2%
4.5%
Inter-municipality migrations in Republika Srpska
Migrations between entities
Migrations between Republika Srpska and Brčko District
DID YOU KNOW THAT… there are more immigrants from the Federation of Bosnia and Herzegovina and Brčko District to Republika Srpska than emigrants from Republika Srpska to the Federation of Bosnia and Herzegovina and Brčko District.

THIS IS REPUBLIKA SRPSKA, 2013
Wages 5
23
Average wage increasing again In the past five years, the average net wage has increased 1.4 times. In 2012, the net wage increased by 9 KM or 1.1% compared to 2011. As in the previous period, the highest wage was that of those employed in the section Financial and insurance activities, in which every second employee completed a higher education school or has a university degree. They account for 2.8% of the total number of employed persons and receive on the average 1,280 KM. The lowest net monthly wage, 532 KM, was earned by those employed in the section Administrative and support service activities, which employs 1.1% of the total number of employed persons. In this section, the highest number of employees completed secondary school, 56.5%, while 13.9% of them have a university degree.
Graph 5.1. Average net wages by section of the Classification of Economic Activities,
2012
200
400
600
800
1,000
1,200
1,400
A B C D E F G H I J K L M N O P Q R S
0
DID YOU KNOW THAT... in the past five years the net wage in the section Education has doubled.

5 THIS IS REPUBLIKA SRPSKA, 2013
Wages
24
5.1. Average net wages by section of the Classification of Economic Activities, 2008-2012
КМ 2008 2009 2010 2011 2012
TOTAL 755 788 784 809 818 A 635 621 604 638 645 B 846 891 947 990 1,015 C 483 518 544 565 579 D 899 1,017 1,008 1,022 1,017 E 578 608 611 625 631 F 529 546 552 587 578 G 513 559 586 601 601 H 631 643 632 645 624 I 472 500 525 541 546 J 944 1,045 1,026 1,053 1,068 K 1,206 1,253 1,212 1,252 1,280 L 665 562 689 836 784 M 710 735 712 789 824 N 618 574 571 575 532 O 1,026 1,085 1,048 1,063 1,081 P 829 900 885 883 875 Q 1,127 1,046 1,024 1,038 1,045 R 557 584 594 579 585 S 852 890 812 891 829
The highest nominal increase in net wages in 2012, compared to 2011, was realised in the section Professional, scientific and technical activities (4.4%), followed by that in the sections Mining and quarrying and Manufacturing (2.5%). On the other hand, a decrease in wages was recorded in the sections Administrative and support service activities (7.5%) and Other service activities (7%). Real wage index, which represents a ratio between the nominal wage index and consumer price index in certain period, has been decreasing in the past two years. Thus, compared to 2010 this decrease amounted to 0.7% in 2011, while in 2012, compared to 2011, it amounted to 1%.

THIS IS REPUBLIKA SRPSKA, 2013
Labour Market 6
25
Increasing trend of unemployment rate continued in 2012 Labour market in Republika Srpska is still negatively affected by the global economic crisis. After the unemployment rate dropped from 25.2% in 2007 to 20.5% in 2008, in 2009 it started to increase again. Unemployment rate in 2009 increased by 0.9 percentage points, in 2010 by 2.2 percentage points, in 2011 by 0.9 percentage points, and in 2012 it increased by 1.1 percentage points. By sex, female unemployment rate in 2012 was 1.7 percentage points higher than in the previous year, while male unemployment rate increased by 0.8 percentage points during the same period.
6.1. Unemployment rates
2008 2009 2010 2011 2012 TOTAL 20.5 21.4 23.6 24.5 25.6 Male 18.2 20.6 22.0 23.0 23.8 Female 24.1 22.4 25.9 26.5 28.2
In spite of the global economic crisis, employment rate changes in the period between 2008 and 2012 were lower than one percentage point. Structure of employed persons by group of sections of activities in 2012 was as follows: agricultural 31.7%, industrial (non-agricultural) 24.7% and services 43.6%, while by employment the structure was: employed persons (employees) 62.7%, self-employed persons 29.2%, and unpaid supporting family members 8.1%. Developed countries are characterised by the dominant share of those employed in the services sector, as well as high participation of those employed for a wage in total employment.

6 THIS IS REPUBLIKA SRPSKA, 2013
Labour Market
26
Graph 6.1. Employment rates (15-64 years of age)
Male employment rate in 2012 was 44.1%, and it was 16.9 percentage points higher than female employment rate, which is a common divergence in this region.
0
10
20
30
40
50
60
70
2008 2009 2010 2011 2012
TOTAL
Male
Female
DID YOU KNOW THAT... half of all unemployed persons have been looking for a job for longer than three years.

THIS IS REPUBLIKA SRPSKA, 2013
Labour Market 6
27
Graph 6.2. Employed persons by sex, annual average
Number of employed persons kept decreasing in 2012 Decrease in number of employed persons continued in 2012, thus, compared to 2011, the number of employed persons decreased by 0.33%, while the number of unemployed persons increased by 1.9%.
0 20 40 60 80
100 120 140 160
2008 2009 2010 2011 2012
Male
Female
DID YOU KNOW THAT... there were twice as many employed Doctors of Science in 2012 as in 2005.
thous.

6 THIS IS REPUBLIKA SRPSKA, 2013
Labour Market
28
Graph 6.3. Employed persons by type of ownership, 2012
Every second employed person works in business entities in private ownership, while every fifth is an entrepreneur or works for an entrepreneur. Half of all employed persons in Republika Srpska work in Manufacturing, Trade and Public Administration. Every second employee has completed secondary education, and every fourth has completed a higher education school or has a university degree. Every sixth employed person is under 30 years of age, while one in four employed persons is older than 50. Every second person seeking employment has completed secondary education, while every fifteenth person has completed a higher education school or has a university degree. One in three unemployed persons is under the age of 30, while one in five is older than 50.
72,793
119,464
650
45,271
State
Private
Cooperative
Mixed

THIS IS REPUBLIKA SRPSKA, 2013
Labour Market 6
29
6.2. Employed persons by section of the Classification of Economic Activities, annual average
2008 2009 2010 2011 2012
TOTAL 259,205 258,634 244,453 238,956 238,178 А 8,349 8,468 8,176 8,159 7,816 B 4,970 4,711 4,841 4,918 4,932 C 56,874 52,951 48,816 46,372 45,968 D 6,907 6,999 7,101 6,952 7,114 E 4,448 4,602 4,524 4,498 4,566 F 15,152 15,278 13,763 12,590 11,702 G 54,028 54,308 49,344 47,447 45,902 H 11,870 12,036 11,512 11,316 11,032 I 16,660 15,090 12,848 11,840 11,330 J 4,788 4,968 5,030 5,034 5,106 K 3,799 5,180 5,122 5,252 5,616 L 1,131 854 756 623 608 M 7,141 7,224 6,752 6,880 6,938 N 2,200 2,520 2,540 2,599 2,550 O 21,062 22,708 22,444 22,394 23,198 P 18,837 19,516 20,126 20,778 21,156 Q 14,208 14,449 14,784 15,394 16,350 R 2,036 2,503 2,355 2,500 2,540 S 4,745 4,269 3,619 3,410 3,754

6 THIS IS REPUBLIKA SRPSKA, 2013
Labour Market
30
Decrease in employment recorded in the neighbouring countries as well
Graph 6.4. Employment rates in the neighbouring countries (between 20 and 64 years of age)
Neighbouring countries are also still affected by the consequences of the global economic crisis, thus a decrease in number of employed persons and an increase in number of unemployed persons were recorded in these countries too in 2012.
0 10 20 30 40 50 60 70 80
EU-27
Slovenia
Croatia
Republika Srpska
FYR Macedonia
Female Male
DID YOU KNOW THAT... in case all persons currently having the status of unemployed persons found a job, that is, if they all became employed, the employment rate in Republika Srpska would still be below the EU average.

THIS IS REPUBLIKA SRPSKA, 2013
Gross Domestic Product 7
31
After a real increase by 0.8% which was recorded in the Gross Domestic Product both in 2010 and 2011, in 2012 it really decreased by 1.1%. 7.1. Gross Domestic Product and Gross Value Added, 2012
Current prices, thous. КМ Real growth rate, %
A Agriculture, forestry and fishing 836,493 -7.9 B Mining and quarrying 188,788 -1.7 C Manufacturing 669,986 -4.5 D Electricity, gas, steam and air conditioning supply 349,845 -3.7 E Water supply; sewerage, waste management and
remediation activities 93,478 -7.3
F Construction 369,345 -3.2 G Wholesale and retail trade, repair of motor vehicles
and motorcycles 1,040,807 0.6
H Transport and storage 238,015 2.3 I Accommodation and food service activities 125,027 -1.7
J Information and communication 439,201 1.4 K Financial and insurance activities 254,356 5.1
L Real estate activities 419,468 -1.0 M Professional, scientific and technical activities 269,290 0.0 N Administrative and support service activities 38,068 13.1
O Public administration and defence; compulsory social security
879,332 3.4
P Education 401,034 0.9 Q Human health and social work activities 431,170 2.2
R Arts, entertainment and recreation 86,568 2.3 S Other service activities 63,845 0.5 FISIM ( minus ) 195,933 6.3
Gross Value Added 6,998,183 -1.1 Taxes on products minus subsidies on products 1,586,789
-1.1
Gross Domestic Product 8,584,972 -1.1

7 THIS IS REPUBLIKA SRPSKA, 2013
Gross Domestic Product
32
Graph 7.1. Gross Value Added, current prices, 2012
Over 1,200 million КМ of Gross Value Added originated from industrial activities In the total Gross Domestic Product in 2012, the section Manufacturing participated with 7.8%, Electricity, gas, steam and air conditioning supply with 4.2%, and Mining and quarrying with 2.2%. In terms of employment, these sections were also dominant, since they employ approximately a quarter of the total number of employed persons. 7.2. Gross Domestic Product and Gross Value Added, current prices, structures 2008 2009 2010 2011 2012
Agricultural activities 11.4 11.1 10.5 10.2 9.7 Non-agricultural activities 21.7 22.5 21.0 20.8 19.6 Service activities 51.1 52.2 53.2 53.3 54.5 FISIM(minus) 2.1 2.2 2.1 2.2 2.3 Gross Value Added 82.1 83.6 82.6 82.1 81.5 Taxes on products and services, subsidies on products excluded
17.9 16.4 17.4 17.9 18.5
Gross Domestic Product 100.0 100.0 100.0 100.0 100.0
0
200
400
600
800
1,000
1,200
A B C D E F G H I J K L M N O P Q R S
mill. КМ

THIS IS REPUBLIKA SRPSKA, 2013
Gross Domestic Product 7
33
Certain changes in the structure of Gross Domestic Product of Republika Srpska can be observed in the five-year period. Participation of agricultural activities (agriculture, forestry and fishing) has been in decline, while participation of service activities has been increasing constantly, and in 2012 it was 3.4 percentage points higher than in 2008. 7.3. Gross Value Added by institutional sector, current prices, structures 2008 2009 2010 2011 2012
Non-financial sector 49.7 48.5 49.2 49.6 49.0 Financial sector 3.1 3.3 3.2 3.3 3.5 State sector 20.8 22.0 21.9 22.8 23.5 Households sector 28.1 28.0 27.2 25.8 25.7 Sector of non-profit institutional units serving households
0.9 0.9 1.0 1.1 1.1
FISIM (minus) 2.6 2.7 2.5 2.6 2.8 Gross Value Added 100.0 100.0 100.0 100.0 100.0 7.4. Gross Domestic Product 2008 2009 2010 2011 2012
Gross Domestic Product, current prices, thous. КМ
8,490,642 8,236,270 8,318,217 8,682,397 8,584,972
Gross Domestic Product per capita, КМ
5,907 5,739 5,805 6,073 6,006
Gross Domestic Product, real growth rates
6.3 -3.0 0.8 0.8 -1.1
DID YOU KNOW THAT… out of the total number of market enterprises, 0.7% were large enterprises which realise 19.0% of the Gross Value Added.

7 THIS IS REPUBLIKA SRPSKA, 2013
Gross Domestic Product
34
Gross domestic product per capita is a rough measure of the material standard of living and in 2012 it was 1.7% higher than in 2008. The largest part of the Gross Domestic Product is allocated for compensation of employees Allocation of the Gross Domestic Product calculated by production approach in 2012 was as follows: 49.5% for compensation of employees, 32.0% for gross operating surplus and gross mixed income, and 18.5% for net taxes on products and production. Compensation of employees in the observation period was constantly increasing, and compared to 2008 it increased by 5.4 percentage points. 7.5. Income components of gross domestic product, current prices, thous. КМ
2008 2009 2010 2011 2012
Gross Domestic Product 8,490,642 8,236,270 8,318,217 8,682,397 8,584,972 Compensation of employees
3,746,017 3,866,619 3,937,423 4,233,305 4,247,460
Net taxes on products and production
1,510,734 1,320,604 1,413,153 1,538,634 1,583,303
Gross operating surplus/Gross mixed income
3,233,891 3,049,047 2,967,641 2,910,458 2,754,209
DID YOU KNOW THAT… 20.4% of compensation of employees consisted of other payments to employees.

THIS IS REPUBLIKA SRPSKA, 2013
Standard of Living and Poverty 8
35
In 2011, total monthly expenditure of households in Republika Srpska was 1,381.45 КМ. 8.1. Average monthly expenditure of households by category of expenditures, HBS
Average monthly expenditure (КМ) Structure, %
2004 2007 2011 2004 2007 2011 Average household size 3.17 3.11 2.95
TOTAL 1,227.33 1,364.31 1,381.45 100.0 100.0 100.0 Food and beverages, total
419.12 473.18 469.18 34.1 34.7 34.0
Bread and cereals 54.66 59.07 64.18 4.5 4.3 4.6 Meat 94.82 115.95 124.47 7.7 8.5 9.0 Fish 11.09 14.07 11.16 0.9 1.0 0.8 Milk, cheese and eggs 64.11 66.42 65.98 5.2 4.9 4.8 Oils and fats 17.94 18.54 18.93 1.5 1.4 1.4 Fruits and vegetables 69.28 77.97 75.57 5.6 5.7 5.5 Sugar, jam, honey, confectionery, syrups, etc.
44.77 52.88 45.97 3.6 3.9 3.3
Non-alcoholic beverages 36.91 44.42 39.48 3.0 3.3 2.9 Alcoholic beverages 25.53 23.86 23.14 2.1 1.7 1.7 Non-food, total 808.21 891.14 912.27 65.9 65.3 66.0 Tobacco 23.95 24.91 30.61 2.0 1.8 2.2 Clothing and footwear 59.96 66.64 70.4 4.9 4.9 5.1 Housing 196.00 198.32 214.43 16.0 14.5 15.5 Electricity, gas, water and other fuels
94.6 100.93 127.93 7.7 7.4 9.3
Furnishing, household equipment
- 68.52 64.93 5.0 4.7
Health 53.66 65.29 46.70 4.4 4.8 3.4 Transport 121.82 156 150.91 9.9 11.4 10.9 Communication 28.83 42.89 48.08 2.3 3.1 3.5 Recreation and culture 41.41 44.12 34.16 3.4 3.2 2.5 Education - 7.36 8.94 0.5 0.6 Catering services 17.88 23.00 20.36 1.5 1.7 1.5 Accommodation services 7.68 11.17 11.11 0.6 0.8 0.8 Other goods and services 70.19 81.98 83.72 5.7 6.0 6.1

8 THIS IS REPUBLIKA SRPSKA, 2013
Standard of Living and Poverty
36
Graph 8.1. Structure of ownership of consumer durable goods in households, total (HBS
2011)
0 20 40 60 80 100
Electric/gas cooker
Firewood and coal stove
Refrigerator, freezer, etc.
Dish washer
Clothes-washing machine
Air-conditioning
Car
Bicycle
Television set
Video recorder, DVD
Telephone
Mobile phone
Satellite dish
Personal computer, printer
2011
2007
2004
DID YOU KNOW THAT... a third of total monthly expenditure went towards purchase of food and beverages, of which almost one third went towards purchase of meat.

THIS IS REPUBLIKA SRPSKA, 2013
Standard of Living and Poverty 8
37
8.2. Relative poverty 2004 2007 2011
Relative poverty line per adjusted household member, monthly КМ
298.96 350.22 381.09
Percentage of the poor per adjusted household member(%)
15.80 15.60 14.80
The poorest were old single-member households and households in which the head was unable to work In Republika Srpska, 14.8% of the population were was relatively poor, that is, these persons lived in households whose monthly consumption per adjusted household member was lower than 381.09 KM (in 2011). Out of the total number of households, 8.3% lived at the poverty threshold.
Graph 8.2. Poverty incidence by age of the household head, 2004, 2007 and 2011
0
5
10
15
20
25
30
over 65 56 - 65 46 - 55 36 - 45 < 35
2004 2007 2011

9 THIS IS REPUBLIKA SRPSKA, 2013
Gross Fixed Capital Formation
38
After several years of the gross fixed capital formation decline, these activities increased in 2012, and as a consequence gross fixed capital formation in this year was 19.2% higher than in the previous year. By activity of investor, gross fixed capital formation in the section Mining and quarrying was more than twice as high as in 2011. A significant increase in gross fixed capital formation was recorded in the following sections: Education 161.6%, Professional, scientific and technical activities 126.3%, Accommodation and food service activities 124.6%, and Electricity, gas, steam and air conditioning supply 120.1%.
9.1. Gross fixed capital formation in fixed assets by activity of investor, 2012
Value of gross capital formation, thous. KM Structure, %
Total gross fixed capital formation 1,622,047 100.0 Agriculture, forestry and fishing 41,668 2.6
Mining and quarrying 266,866 16.4 Manufacturing 234,140 14.4 Electricity, gas, steam and air conditioning supply 244,776 15.1 Water supply; sewerage, waste management and remediation activities
15,503 1.0
Construction 65,634 4.0 Wholesale and retail trade, repair of motor vehicles and motorcycles
115,821 7.1
Transport and storage 46,160 2.8 Accommodation and food service activities 25,764 1.6 Information and communication 77,680 4.8 Financial and insurance activities 31,888 2.0 Real estate activities 10,346 0.6
Professional, scientific and technical activities 35,111 2.2 Administrative and support service activities 4,638 0.3 Public administration and defence; compulsory social security
313,284 19.3
Education 43,339 2.7 Human health and social work activities 39,842 2.5 Arts, entertainment and recreation 8,701 0.5 Other service activities 886 0.1

THIS IS REPUBLIKA SRPSKA, 2013
Gross Fixed Capital Formation 9
39
By activity of investor, the largest share in the structure of gross fixed capital formation was that of the following sections: Public administration and defence; compulsory social security, Mining and quarrying, Electricity, gas, steam and air conditioning supply, and Manufacturing. By purpose of gross fixed capital formation in new fixed assets, the largest share was that of Electricity, gas, steam and air conditioning supply, Construction, and Manufacturing. Over 700 million КМ was invested in machinery, equipment and transport equipment By technical composition, more than a half of total gross fixed capital formation was invested in machinery, equipment and transport. In 2012, largest investments in construction structures were those of business entities from the section Public administration and defence; compulsory social security with 40.6%, followed by Manufacturing with 9.5% and Wholesale and retail trade; repair of motor vehicles and motorcycles with 9.2%. When it comes to gross fixed capital formation in non-monetary (intangible) fixed assets, the section Mining and quarrying had a share of 78.9%, Professional, scientific and technical activities participated with 5.5%, and the section Public administration and defence; compulsory social security had a share of 4.6%. 9.2. Structure of gross fixed capital formation in fixed assets by technical composition
2008 2009 2010 2011 2012 Gross fixed capital formation 100.0 100.0 100.0 100.0 100.0 Construction structures and spaces 56.0 58.2 55.6 52.9 41.2 Machinery, equipment and transport equipment
41.2 37.3 40.2 42.8 43.9
Other 2.8 4.5 4.2 4.3 14.9

9 THIS IS REPUBLIKA SRPSKA, 2013
Gross Fixed Capital Formation
40
Gross fixed capital formation in 2012 were mostly financed from own financial assets (48.4%), followed by financial loans (36.6%), other sources (6.3%), assets of budgets and funds (4.7%), joint assets (2.4%), and financial leasing (1.6%).
9.3. Financing of gross fixed capital formation and gross fixed capital formation
thous. КМ 2008 2009 2010 2011 2012
Financing of gross fixed capital formation
1,673,858 1,565,353 1,443,308 1,367,206 1,630,244
Gross fixed capital formation
1,784,784 1,551,808 1,446,629 1,359,836 1,622,047
DID YOU KNOW THAT…
in terms of kind of construction, half of gross fixed capital formation in new fixed assets referred to building of new capacities.

THIS IS REPUBLIKA SRPSKA, 2013
Prices 10
41
Oil prices, gas prices and food prices at the world market are the factors that have had a significant impact on inflation in the past few years.
The highest increase in prices in Republika Srpska in 2012 was recorded in the division Alcoholic beverages and tobacco, while the highest decrease in prices was recorded in the division Clothing and footwear.
10.1. Consumer price indices according to the COICOP, 2008−2012
previous year=100 2008 2009 2010 2011 2012
TOTAL 107.2 99.6 102.5 103.9 102.1
Food and non-alcoholic beverages
111.2 98.3 99.2 105.6 101.7
Alcoholic beverages and tobacco
101.2 111.0 120.5 108.0 109.1
Clothing and footwear 98.2 96.9 96.3 95.4 96.1
Housing, water, electricity and other fuels
108.2 104.4 104.1 102.8 101.2
Furnishings, household equipment and routine maintenance of the house
102.0 100.8 99.8 101.1 101.1
Health 101.5 101.1 102.8 99.0 99.9
Transport 112.5 90.0 106.5 108.1 105.4
Communication 104.9 102.1 108.3 110.3 104.3
Recreation and culture 103.1 102.2 100.0 100.3 99.8
Education 103.2 100.8 105.4 99.8 100.3
Hotels and restaurants 104.4 103.5 100.4 100.7 100.2
Other goods and services 102.7 102.9 100.7 99.5 100.5

10 THIS IS REPUBLIKA SRPSKA, 2013
Prices
42
Compared to Republika Srpska, neighbouring countries Slovenia, FYR Macedonia, Croatia, Montenegro and Serbia recorded higher inflation rates.
Graph 10.1. Inflation in 2012 – comparison
Producer prices of industrial products increased by 0.4% on the average in 2012. By purpose of consumption, the highest increase in prices was recorded for intermediate goods, while the highest decrease in prices was recorded for durable consumer goods.
7.8
4.1
3.4
3.3
2.6
2.1
2.1
0 1 2 3 4 5 6 7 8 9
Serbia
Montenegro
Croatia
FYR Macedonia
Slovenia
Federation of BH
Republika Srpska
%

THIS IS REPUBLIKA SRPSKA, 2013
Prices 10
43
10.2. Producer price indices of industrial products by section of the KD BiH 2010, 2008−2012
previous year =100 Section 2008 2009 2010 2011 2012
INDUSTRY TOTAL 109.0 98.1 102.2 104.7 100.4 Mining and quarrying 108.0 101.2 101.2 111.2 102.8 Manufacturing 108.7 97.0 101.4 106.0 100.4
Electricity, gas and water supply
110.0 99.0 103.9 100.0 100.1
Graph 10.2. Producer prices of industrial products in 2012 – comparison
7.0
5.6
4.6
1.9
1.7
1.0
0.4
0 1 2 3 4 5 6 7 8
Croatia Serbia
FYR Macedonia Montenegro
Federation of BH Slovenia
Republika Srpska
%

11 THIS IS REPUBLIKA SRPSKA, 2013
Agriculture
44
Share of agriculture in the GDP formation was 8.4% The share of agriculture in the structure of Gross Domestic Product of Republika Srpska has been decreasing constantly in the past years, but it remains high when compared with developed and highly developed countries. In 2012, the share of agricultural Gross Value Added in the Gross Domestic Production formation was 8.4%, which was 0.5% lower than the share realised in the previous year and 1.7% lower than that from 2008.
Graph 11.1. Share of agriculture in the structure of GDP
29.4% of all employed persons were employed in primary agriculture
Persons employed in primary agricultural production have a relatively high participation in the total number of employed persons in Republika Srpska. According to the Labour Force Survey 2012 results, 29.4% of all employed persons were employed in agriculture, out of which 58.6% were male and 41.4% were female.
Graph 11.2. Number of persons employed in agricultural and non-agricultural activities
0 2 4 6 8
10 12
2008 2009 2010 2011 2012
0
100
200
300
400
2008 2009 2010 2011 2012
Employees outside agriculture
Employees in agriculture
%
thous.

THIS IS REPUBLIKA SRPSKA, 2013
Agriculture 11
45
Value of realised external trade of agricultural products was 238.1 million KM Agricultural products did not have a significant share in the structure of external trade of Republika Srpska. This state is supported by the fact that realised volume of external trade of agricultural products in 2012, which amounted to 238.1 million KM, accounted for only 3.5% of the value of total trade of goods. Agriculture of Republika Srpska in 2012, as well as in previous years, had a negative external trade balance. Thus, during 2012, Republika Srpska exported agricultural products whose value was 34.8 million KM, while at the same time the value of imported agricultural products was 203.3 million KM. Therefore, the rate of coverage of import with export was 17.1%.
Graph 11.3. External trade balance of agricultural products trade
Compared to 2011, realised external trade deficit in the trade of agricultural products in 2012 decreased by 5.1% or 9.1 million KM.
-250,000 -200,000 -150,000 -100,000 -50,000
0 50,000
100,000 150,000 200,000 250,000
2008 2009 2010 2011 2012
Export
Import
Balance
thous. КМ

11 THIS IS REPUBLIKA SRPSKA, 2013
Agriculture
46
Export of agricultural products from Republika Srpska participated with 1.5% in the total realised export in 2012, while import participated with 4.5%. In the structure of total export, eggs of poultry had the highest share, with 6.9 million KM or 19.8% of the total value of export realised during 2012.
The most represented agricultural product in the structure of export was wheat. The value of imported wheat was 52.7 million KM, or 25.9% of the value of total realised import in the field of agriculture. Average yield of maize 2.7 t/ha According to the 2012 data, total sown area of arable land and gardens in Republika Srpska covers 296,755 ha. Observed separately by individual crop, the structure of sown arable land was dominated by areas under maize, which covered 143,024 ha, or 45.1% of the total sown arable land in 2012. Area under maize increased slightly compared to the previous year (by 0.3%) and to the ten-year average (by 0.8%).
Graph 11.4. Yield of maize
0 100 200 300 400 500 600 700 800
2003 2004 2005 2006 2007 2008 2009 2010 2011 2012
thous. t
THIS IS REPUBLIKA SRPSKA, 2013
Agriculture 11
47
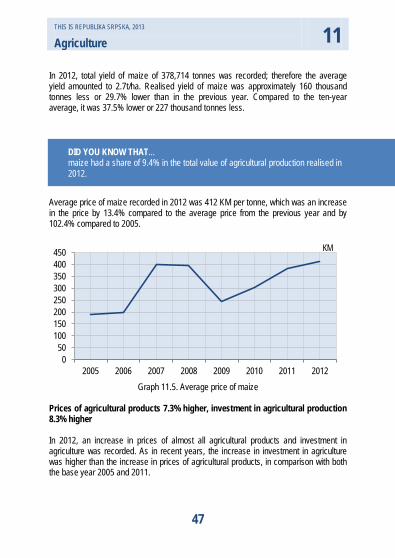
In 2012, total yield of maize of 378,714 tonnes was recorded; therefore the average yield amounted to 2.7t/ha. Realised yield of maize was approximately 160 thousand tonnes less or 29.7% lower than in the previous year. Compared to the ten-year average, it was 37.5% lower or 227 thousand tonnes less.
Average price of maize recorded in 2012 was 412 KM per tonne, which was an increase in the price by 13.4% compared to the average price from the previous year and by 102.4% compared to 2005.
Graph 11.5. Average price of maize
Prices of agricultural products 7.3% higher, investment in agricultural production 8.3% higher In 2012, an increase in prices of almost all agricultural products and investment in agriculture was recorded. As in recent years, the increase in investment in agriculture was higher than the increase in prices of agricultural products, in comparison with both the base year 2005 and 2011.
0 50
100 150 200 250 300 350 400 450
2005 2006 2007 2008 2009 2010 2011 2012
КМ
DID YOU KNOW THAT... maize had a share of 9.4% in the total value of agricultural production realised in 2012.

11 THIS IS REPUBLIKA SRPSKA, 2013
Agriculture
48
Graph 11.6. Annual indices of input and output prices Investment in agriculture increased by 59.4% in comparison with 2005, with goods and services currently consumed increasing by 59.7% and goods and services contributing to agricultural investment by 32.7%. Compared to 2011, investment in agriculture increased by 8.3%. During this period, goods and services currently consumed increased by 8.4%, and goods and services contributing to agricultural investment by 0.7%. When it comes to investment in agriculture, the highest increase in prices in 2012 was recorded for forage. Compared to the previous year, price of forage increased by 18.9%.
Prices of agricultural products in Republika Srpska were 33.9% higher in 2012 than in the base year 2005, and 7.3% higher than in 2011. This increase in prices of agricultural products was mainly caused by the increase in prices of crops by 55.7% compared to 2005 and by 5.3% compared to the previous year. Prices of livestock and livestock products were 16.8% higher than in 2005 and 9.6% higher than in 2011. Cereals, as a group of products, realised the highest increase in prices. This increase was 89.9% compared to 2005 and 10.7% compared to the previous year.
100 110 120 130 140 150 160 170 180
2005 2006 2007 2008 2009 2010 2011 2012
Agricultural production, total Investment in agriculture (input 1+input 2), total
2005=100

THIS IS REPUBLIKA SRPSKA, 2013
Forestry 12
49
Territorially, forests and forest land cover approximately 50% of the total area of Republika Srpska, forests alone covering 41%, that is, 0.75 ha per capita. Percentage of forest cover is close to that of Europe and it amounts to approximately 46%. Forests in Republika Srpska fulfill their economic, ecological and social functions to a large extent. It is important to note that Republika Srpska is one of rare European regions where forests’ structure is mainly natural. Approximately one million hectares of forests and forest land are in state ownership, while private forests and forest land cover approximately 20% of the total forest area in Republika Srpska, that is, approximately 290,000 ha.
Gross felled timber in the forest and outside the forest in 2012 increased in comparison with 2011, and its amount was 2,853 thousand m3. Out of this sum, 2,558 thousand m3 belonged to the state sector, which was significantly more than in the private sector, since the state sector covered 90% of the total felled timber.
12.2. Production and sale of forest assortments in state forests 2008 2009 2010 2011 2012
Production total 1,958,081 1,750475 1,771,841 1,893,542 1,848,712 logs for cutting 1,007,351 812,106 812,047 866,875 862,997 Sale total 1939,855 1,682,983 1,809,701 1,955,500 1,815,978 logs for cutting 1,001,533 784,429 847,965 910,105 862,869
12.1. Forest exploitation thous. m3
Gross felled timber broadleaves conifers
total state forests
private forests
2008 2,943 2,582 361 1,787 1,156 2009 2,543 2,325 218 1,595 949 2010 2,550 2,314 236 1,523 1,028 2011 2,838 2,555 283 1,640 1,198 2012 2,853 2,558 296 1,585 1,269

12 THIS IS REPUBLIKA SRPSKA, 2013
Forestry
50
Total afforested area in 2012 was 918 ha, which represented a decrease by a quarter compared to the previous year. Conifer afforestation covered an area of 808 ha, which was approximately 88% of the total area afforested during 2012.
Graph 12.1. Artificial afforestation
12.3. Gross Value Added in the forestry sector
2008 2009 2010 2011 2012 Gross Value Added in forestry, thous. КМ
115,771 94,456 99,643 109,500 109,318
Gross Domestic Product at market prices, thous. КМ
8,490,642 8,236,270 8,318,217 8,682,397 8,584,972
Structure, % 1.4 1.1 1.2 1.3 1.3 Commercial forestry and industry using wood as raw material1) had a significant share in the structure of export2) of Republika Srpska in 2012, with 13.8% or 326 million KM.. 1)Except manufacture of furniture,2)Export in accordance with the Standard International Trade Classification (SITC Rev.4)
0 200 400 600 800
1,000 1,200 1,400 1,600 1,800 2,000
2002 2003 2004 2005 2006 2007 2008 2009 2010 2011 2012
state sector private sector
ha

THIS IS REPUBLIKA SRPSKA, 2013
Forestry 12
51
Graph 12.2. Areas of forest and forest land affected by fire
Damages caused by fire in 2012 were recorded over an area of 33,781 ha, with 177,761 m3 of damaged felled timber, which represented a volume increase by 142% compared to the previous year.
Chamois is one of the few animal species that is due to its abundance still hunted in our country. Chamois hunt represents one of the most challenging types of hunting. The autochthonous population of chamois in Republika Srpska is increasing constantly and its most important habitats are on Bjelašnica and Treskavica and in the special-purpose hunting areas “Zelengora”, “Kamenica” and “Sušica”.
0
5,000
10,000
15,000
20,000
25,000
30,000
35,000
40,000
2002 2003 2004 2005 2006 2007 2008 2009 2010 2011 2012
DID YOU KNOW THAT... there are currently 90 active hunting areas in Republika Srpska, covering the area of 2,468 thousand hectares, out of which 45% covered by forests.
ha

13 THIS IS REPUBLIKA SRPSKA, 2013
Environment
52
Mixed municipal waste dominant in the composition of collected municipal waste
Municipal waste in Republika Srpska is collected mainly as mixed waste, which in the period between 2010 and 2012 accounted for 97% of the total amount of collected municipal waste. During the same period, a share of separated collected packaging waste in the total collected municipal waste was practically insignificant and it was between 0.1% and 0.2%. It is estimated that each citizen of Republika Srpska in 2012 produced 263 kg of waste, which was 1.5% lower than in the previous year, and significantly below the average of the European Union members (EU-27), which in 2011 amounted to 503 kg per capita.
Graph 13.1. Collected municipal waste
0% 10% 20% 30% 40% 50% 60% 70% 80% 90%
100%
2010 2011 2012
Mixed municipal waste Other collected waste

THIS IS REPUBLIKA SRPSKA, 2013
Environment 13
53
Increased volume of treated municipal waste water in natural recepients
Volume of municipal waste water treated before being discharged into a natural recipient in 2012 in Republika Srpska was 16% higher than in the previous year. Municipal water was treated mainly using the secondary treatment process, which was used for as much as 84% of the total volume of treated water. The remaining volume was treated using the tertiary treatment process. The tertiary treatment process of municipal waste water was for the first time recorded in 2012 and in the years before that the secondary treatment process and to a lesser extent the primary process were used. When it comes to the system of waste water disposal, the length of closed sewer network has been constantly increasing, thus in 2012 it was 23.5% longer than in 2005.
Graph 13.2. Treated and untreated municipal waste water
In 2012, in the public water supply system, water was mostly supplied to households, tht is, 76% of the total volume of water supplied to consumers. This share increased by 3% in the period between 2008 and 2012. Consumers of the remaining volume of water include industry, agriculture, forestry, fishing, and other activities.
0
5,000
10,000
15,000
20,000
25,000
30,000
35,000
2008 2009 2010 2011 2012
Untreated water Treated water

13 THIS IS REPUBLIKA SRPSKA, 2013
Environment
54
Graph 13.3. Recipients of municipal waste water, 2012
Graph 13.4. Total length of closed sewer network
7%
92%
1%
Ground waters
Rivers
Lakes
0 200 400 600 800
1,000 1,200 1,400 1,600 1,800
2008 2009 2010 2011 2012
km

THIS IS REPUBLIKA SRPSKA, 2013
Industry 14
55
Industrial production decreased by 4.0% in 2012 compared to 2011 After quite a long period of the growth of industrial production, between 2008 and 2011, a decrease by 4.0% was recorded in 2012, compared to 2011. Production of electricity, food products, manufacturing of wood, mining of coal, mining of metal ores, manufacture of hydrated alumina, manufacture of metal and concrete products, manufacture of refined petroleum products, and manufacture of footwear were still the most important. For comparison, in the same year a decrease in industrial production was also recorded in Serbia (-2.9%), Croatia (-5.5%), the FYR Macedonia (-6.6%) and the Federation of BH (-4.4%), while an increase was recorded in Slovenia (0.4%). 14.1. Indices of industrial production by section of the Classification of Economic
Activities, 2008−2012 previous year=100
Section 2008 2009 2010 2011 2012
INDUSTRY TOTAL 117.7 110.7 105.4 104.8 96.0 Mining and quarrying 114.1 92.9 109.1 118.2 96.1 Manufacturing 120.8 121.4 105.5 104.3 95.6 Electricity, gas, steam and air conditioning supply (except 35.3)
110.5 103.6 103.0 100.0 96.3
14.2. Indices of industrial production by section of the Classification of Economic
Activities, 2008−2012 2010=100
Section 2008 2009 2011 2012
INDUSTRY TOTAL 85.6 94.8 104.8 100.5 Mining and quarrying 98.6 91.6 118.2 113.6 Manufacturing 78.1 94.7 104.3 99.8 Electricity, gas, steam and air conditioning supply (except 35.3)
93.7 97.1 100.0 96.3

14 THIS IS REPUBLIKA SRPSKA, 2013
Industry
56
In 2012, investments in industry were 2.3% higher than in the previous year Gross fixed capital formation in new fixed assets in industrial activities amounted to 715 million KM, which was 48.0% of the total gross fixed capital formation in new fixed assets in Republika Srpska in 2012. Industry had a significant share in the Gross Domestic Product (14.1%), while the biggest share was that of Manufacturing (7.8%). At the end of 2012, there were 3,938 registered industrial enterprises, out of which 87.2% were in private ownership. Most industrial enterprises, 90.8% of them, were engaged in Manufacturing, while 4.1% were engaged in Mining and quarrying, 3.5% in Electricity, gas, steam and air conditioning supply, and 1.7% in Materials recovery. More than 53 thousand workers were employed in industrial enterprises, out of which 76.9% in Manufacturing. Workers employed in industrial enterprises accounted for 26.4% of the total number of employed persons in Republika Srpska. Products of Manufacturing accounted for almost three quarters of the total sale According to the reports of industrial enterprises, the sale of industrial products in 2012 amounted to 5 billion KM. Products of Manufacturing accounted for 74.3% of the total value of sale. The highest shares in the total value of sale of industrial products were those of the following divisions: Manufacture of coke and refined petroleum products 26.5%, Electricity, gas, steam and air conditioning supply 20.5%, Manufacture of food products 12.1%, Manufacture of basic metals 5.4%, Manufacture of wood and of products of wood and cork, except furniture 5.3%, and Manufacture of fabricated metal products, except machinery and equipment 5.1%.
DID YOU KNOW THAT... In 2012, 141 business entities were recorded in the Register of Business Entities and classified into industrial activities

THIS IS REPUBLIKA SRPSKA, 2013
Industry 14
57
14.3. Value of sale by industrial division, 2008−2012 mill. КМ
1) The data is not optimally comparable with the data from the previous year
INDUSTRIAL DIVISION 2008 2009 2010 2011 2012
INDUSTRY TOTAL 3,231 2,902 3,415 3,864 5,0321)
Mining of coal and lignite (brown coal) 28 31 35 45 61 Mining of metal ores 91 56 90 114 135 Other mining and quarrying 42 31 28 31 32 Manufacture of food products 477 454 537 574 609 Manufacture of beverages 60 63 57 57 72 Manufacture of tobacco products 9 10 7 5 4 Manufacture of textiles 39 46 42 39 36 Manufacture of wearing apparel 46 42 36 38 33 Manufacture of leather and related products 56 64 77 88 71 Manufacture of wood and of products of wood and cork 247 181 214 260 269 Manufacture of paper and paper products 96 94 93 106 103 Printing and reproduction of recorded media 21 19 19 16 14 Manufacture of coke and refined petroleum products 46 86 97 133 1 3311)
Manufacture of chemicals and chemical products 30 57 64 40 60 Manufacture of basic pharmaceutical products and pharmaceutical preparations
10 9 12 31 38
Manufacture of rubber and plastic products 85 80 71 77 81 Manufacture of other non-metallic mineral products 124 113 152 151 125 Manufacture of basic metals 304 177 296 336 274 Manufacture of fabricated metal products, except machinery and equipment
288 191 227 253 257
Manufacture of computer, electronic and optical products 11 9 8 8 7 Manufacture of electrical equipment 35 23 44 47 51 Manufacture of machinery and equipment, n.e.c. 40 29 26 37 46 Manufacture of motor vehicles, trailers and semi-trailers 28 14 24 26 26 Manufacture of other transport equipment 3 2 2 1 7 Manufacture of furniture 95 87 102 122 136 Other manufacturing 10 8 8 8 12 Repair and installation of machinery and equipment 45 48 66 82 74 Electricity, gas, steam and air conditioning supply 813 857 932 1 081 1 030 Materials recovery 49 21 51 57 38

14 THIS IS REPUBLIKA SRPSKA, 2013
Industry
58
Out of the total value of sale of industrial enterprises, 31.7% referred to export Export realised by industrial enterprises in 2012 amounted to 1,594 million KM, which represented 31.7% of their total value of sale.
Graph 14.1. Industrial divisions with the highest share of export in the total export of
industrial enterprises, 2012
0 2 4 6 8 10 12 14 16 18 20
Manufacture of leather and related products
Manufacture of basic metals
Manufacture of furniture
Manufacture of paper and paper products
Manufacture of food products
Electricity, gas, steam and air conditioning supply
Manufacture of fabricated metal products, except machinery and equipment
Manufacture of wood and of products of wood and cork, except furniture; manufacture of …
Manufacture of coke and refined petroleum products
%

THIS IS REPUBLIKA SRPSKA, 2013
Energy 15
59
In the past two years, a decrease in production of electricity in hydroelectric power plants was recorded Republika Srpska is an important exporter of electricity on the regional market. Unfavourable hydrologic conditions which characterised 2011 continued also in 2012, which resulted in a decrease in production of electricity in hydroelectric power plants. Realised net production of electricity in 2012 amounted to 5,130 GWh, out of which 1,878 GWh or 36.6% was produced in hydroelectric power plants, and 3,252 GWh or 63.4% in thermal power stations. In the period between 2006 and 2012, a slight increasing trend was recorded in final consumption of electricity.
Graph 15.1. Net production and final consumption of electricity
Over 95% of the total available amount of coal was consumed for production of energy Brown coal and lignite represent significant natural resources in Republika Srpska.
0
1,000
2,000
3,000
4,000
5,000
6,000
7,000
2008 2009 2010 2011 2012
Net production Final consumption
GWh

15 THIS IS REPUBLIKA SRPSKA, 2013
Energy
60
Out of the total available amount of coal, 95% was consumed for production of energy, while the rest was used in mass consumption. Given the fact that Republika Srpska does not have its own production of natural gas, all the necessary amounts are imported. The largest final consumer of natural gas was industry, which accounted for 86.9% of the consumption, while the remaining 13.1% of natural gas was consumed by households and other consumers.
15.1. Production and final consumption of fuels and energy
Production of fuels and energy 2009 2010 2011 2012
Brown coal (1,000 t) 1,930 1,550 2,147 2,201 Lignite ( 1,000 t) 2,834 3,042 3,379 3,024 Electricity1) (GWh) 5,640 6,183 5,298 5,130 Hydroelectric power plants1) (GWh) 2,638 3,318 1,848 1,878 Thermal power stations1) (GWh) 2,993 2,856 3,450 3,252 Other production1) (GWh) 9 9 - - Heat (TJ) 1,547 1,680 1,737 1,806
Final consumption of fuels and energy 2009 2010 2011 2012
Brown coal (1,000 t) 63 74 81 71 Lignite (1,000 t) 98 104 134 133 Electricity (GWh) 2,847 2,922 2,970 3,000 Heat (TJ) 1,378 1,483 1,613 1,506 Natural gas (thous. Sm3) 32,097 36,026 67,037 27,883 1) Production and threshold
In 2012, more than 560 million KM was invested in energy Gross fixed capital formation in new fixed assets in energy (divisions 05, 19 and 35) amounted to approximately 565 million KM, which was 34.9% of the total gross fixed capital formation in new fixed assets in Republika Srpska in 2012. Energy had a share of 4.0% in the total Gross Domestic Product.
DID YOU KNOW THAT... the largest amount of heat was obtained from mazut, followed by coal, biomass and natural gas.

THIS IS REPUBLIKA SRPSKA, 2013
Energy 15
61
Approximately 11 thousand workers were employed in energy, which accounted for approximately 6% of all employed persons in Republika Srpska. The number of persons employed in energy was 1.2% higher in 2012 than in 2011.
Graph 15.2. Electricity consumption per capita, 2011 (IEA)
0 2,000 4,000 6,000 8,000 10,000 12,000 14,000 16,000
Albania Republika Srpska
Romania Turkey Croatia Poland
Hungary FYR Macedonia
Serbia Bulgaria Greece
Italy EU-27
Denmark Czech Republic
Slovenia Netherlands
Germany France
Switzerland Belgium Austria
Sweden Finland
kWh per capita

16 THIS IS REPUBLIKA SRPSKA, 2013
Construction
62
Total value of performed construction works in 2012, compared to the previous year, decreased by 4.1%. Value of performed civil engineering works, which accounted for 37.4% of the total value of performed works, decreased by 2.9%, while the value of building works decreased by 4.8%. At the same time, the number of employed persons in construction decreased by 1.8%. Value of works performed abroad in 2012, compared to 2011, decreased by 28.1%, and it accounted for 3.7% of the total value of performed works. In 2012, the Gross Value Added of construction had a share of 4.3% in the Gross Domestic Product formation in 2012, while the gross fixed capital formation in new fixed assets in construction participated with approximately 17% in the total gross fixed capital formation.
Graph 16.1. Value of performed works
0 100,000 200,000 300,000 400,000 500,000 600,000 700,000 800,000
2007 2008 2009 2010 2011 2012
Buildings Civil engineering
thous. КМ

THIS IS REPUBLIKA SRPSKA, 2013
Construction 16
63
Compared to the previous year, the number of completed dwellings in 2012 was 18.0% lower. The highest decrease in building of dwellings was recorded in three-room dwellings (almost 33%). Namely, in 2012, the highest share in the total number of completed dwellings was that of two-room dwellings (43.7%), followed by one-room dwellings (37.6%), while the rest were three or more-room dwellings.
16.1. Completed dwellings by number of rooms
Unit of
measure 2012
TOTAL
number 1,459 m2 75,211
One-room dwellings
number 548 m2 20,674
Two-room dwellings
number 637 m2 32,821
Three-room dwelling
number 226 m2 16,133
Four or more-room dwellings
number 48 m2 5,583
DID YOU KNOW THAT… Approximately 5% of all employed persons in Republika Srpska were employed in construction.

17 THIS IS REPUBLIKA SRPSKA, 2013
External Trade
64
Decrease in import in 2012 During the period between 2008 and 2012, export from Republika Srpska was continually increasing, except in 2009 and 2012. In 2012, compared to 2011, export decreased by 7.3% and import decreased by 2.0%. Volume of external trade of Republika Srpska in 2012 was 6.9 billion KM, out of which 2.4 billion KM referred to export and 4.5 billion KM to import. External trade deficit of Republika Srpska in the same year was 2.1 billion KM.
The highest value of export from Republika Srpska was that of export to Italy with 16.0%, followed by Serbia 15.6%, Croatia 13.5%., Austria 9.5% and Germany 8.3%. In the same year, majority of import was from Russia with 26.0%, followed by Serbia 17.2%, Italy 9.2%, Germany 6.0% and Croatia 5.4%. Coverage of import with export in 2012 was 52.9% Coverage of import with export in Republika Srpska, just as in most neighbouring countres, also decreased from 2011 to 2012. In Republika Srpska’s trade of goods with foreign countries in 2012, the highest share was that of mineral products. In the structure of export in 2012, the highest share was that of the division Mineral products with 20.7%, followed by the division Basic metals and related products with 15.1%, and Wood; charcoal; cork; products of straw with 10.8%. In the structure of imoport in the same year, the highest share was that of the division Mineral products with 30.4%, followed by the division Machinery; equipment; apparatus for reproduction of image and sound with 10.44%, and Foodstuffs; beverages, spirits and tobacco with 10.38%.
DID YOU KNOW THAT… more than half of the total export from Republika Srpska in 2012 was to the European Union countries.

THIS IS REPUBLIKA SRPSKA, 2013
External Trade 17
65
Graph 17.1. Export and import per capita
mill. КМ
Graph 17.2. External trade balance
0
500
1,000
1,500
2,000
2,500
3,000
3,500
2008 2009 2010 2011 2012
Export per capita Import per capita
0 500
1,000 1,500 2,000 2,500 3,000 3,500 4,000 4,500 5,000
2008 2009 2010 2011 2012
Export
Import
КМ
17 THIS IS REPUBLIKA SRPSKA, 2013
External Trade
66
mill. КМ
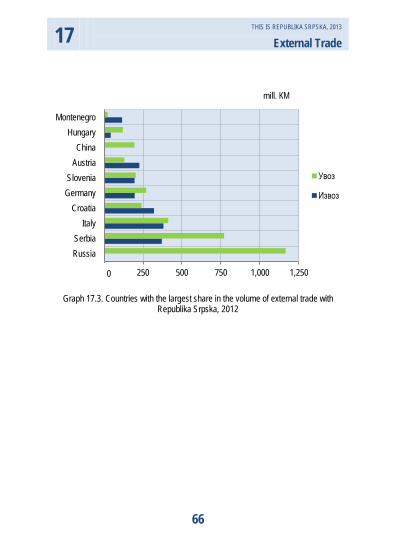
Graph 17.3. Countries with the largest share in the volume of external trade with Republika Srpska, 2012
0 250 500 750 1,000 1,250
Russia Serbia
Italy Croatia
Germany Slovenia
Austria China
Hungary Montenegro
Увоз
Извоз
0

THIS IS REPUBLIKA SRPSKA, 2013
Distributive trade 18
67
Growth rates of wholesale and retail trade have been fairly equal, except in 2009, when a decrease was recorded in turnover of retail trade in comparison with 2008, which was also the case in the neighbouring countries. An increase in turnover in retail trade in 2012, compared to the previous year, was 2.3%, while in wholesale trade a decrease by 22.6% in turnover was recorded, which was a consequence of the harmonisation and transition to the new Classification of Economic Activities KD BiH 2010.
mill. КМ
Graph 18.1. Turnover in wholesale and retail trade
Graph 18.2. The most significant groups of products in realised turnover in wholesale
trade
0
1,000
2,000
3,000
4,000
5,000
6,000
2008 2009 2010 2011 2012
Retail trade
Wholesale trade
31.0%
15.0% 18.6%
35.4% Food, beverages and tobacco products
Motor fuels and lubricants
Household appliances
Other wholesale trade

18 THIS IS REPUBLIKA SRPSKA, 2013
Distributive trade
68
Graph 18.3. The most significant groups of products in realised turnover in retail trade
31.6
27.7 10.3
30.4 Food, beverages and tobacco products
Motor fuels and lubricants
Household appliances
Other retail trade

THIS IS REPUBLIKA SRPSKA, 2013
Hotels and Restaurants 19
69
In 2012, in comparison with the previous year, turnover in hotels and restaurants increased by 5.5%.
Graph 19.1. Structure of turnover in hotels and restaurants by type of services, 2012
Increase in turnover was recorded for all types of services and the highest increase was that in other turnover in hotels and restaurants (23.7%). The data do not cover entrepreneurs.
Food and beverages
47.8%
Drinks 25.0%
Accommodation 22.8%
Other 4.4%
DID YOU KNOW THAT... turnover in hotels and restaurants has been constantly increasing in the past five years. Also, the highest turnover in a year is realised in the third quarter, which is evident from the data referring to the past five years.

19 THIS IS REPUBLIKA SRPSKA, 2013
Hotels and Restaurants
70
Graph 19.2. Turnover in hotels and restaurants by year, 2008−2012
0
20,000
40,000
60,000
80,000
100,000
120,000
2008 2009 2010 2011 2012
thous. КМ

THIS IS REPUBLIKA SRPSKA, 2013
Tourism 20
71
Tourism activity in Republika Srpska has continued its increasing trend, which has been characterised by a constant increase in number of tourist nights in the past three years. In 2012, an increase in number of both tourist arrivals and tourist nights was recorded. The number of arrivals was 1.4% higher and the number of nights 2.4% higher. Out of the total number of foreign tourist nights, tourists from Serbia realised the most nights (35.9%), followed by tourists from Croatia (18.9%) and Slovenia (8.3%).
Graph 20.1. Tourist arrivals and tourist nights by year, 2008−2012
0 100,000 200,000 300,000 400,000 500,000 600,000 700,000
2008 2009 2010 2011 2012
Arrivals Nights
DID YOU KNOW THAT... the share of domestic tourist nights in the total number of tourist nights in 2012 was 61.1%, and 51.2% of these were realised in spa resorts.

21 THIS IS REPUBLIKA SRPSKA, 2013
Transport and communications
72
Transport of goods and passengers Over the past five years, positive growth rate was recorded in transport of passengers in road and urban transport, while transport of passengers in railway transport showed the opposite tendency. 21.1. Transport of goods and passengers by transport branch, 2008−2012 2008 2009 2010 2011 2012
Road and urban transport
Length of roads, km 12,785 13,092 14,147 14,376 14,299
Transported passengers, thous. 28,063 28,578 30,499 32,171 32,612
Transported goods, thous. tonnes
1,548 1,397 1,447 1,741 2,063
Railway transport
Length of tracks, km 416 416 426 426 426
Transported passengers, thous. 728 448 402 317 321
Transported goods, thous. tonnes
5,076 4,101 5,087 5,191 5,372
Air transport services
Number of flights 1,154 896 662 856 658
Number of passengers 11,889 6,973 4,566 8,372 6,397 In 2012, 33 million passengers were transported, which was 1.4% more than in the previous year. “Željeznice Republike Srpske” transported 1.0% of all passengers, while an increase by 2.0% was recorded in urban and suburban transport of passengers, which at the same time had a share of 75% in the total transport of passengers. Positive growth rate was also recorded in transport of goods in road transport. From 2011 to 2012, transport of goods increased by 18.5%. This increase in the volume of transported goods was also recorded for railway transport, as 3.5% more goods were transported than in the previous year. Railway transport served to transport 72.3% of all transported goods.

THIS IS REPUBLIKA SRPSKA, 2013
Transport and communications 21
73
Postal activities The development of postal activities has been characterised by a decreasing trend, therefore the number of letter mails was 17.5% lower than in the previous year, of packages 12.9%, and of telegrams 2.4% lower.
Graph 21.1. Postal services, 2008−2012
Registered vehicles Compared to the previous year, 5.5% more vehicles were registered in 2012 in Republika Srpska. Out of the total number of registered vehicles, 83% were registered passenger vehicles.
0
20,000
40,000
60,000
80,000
100,000
120,000
2008 2009 2010 2011 2012
Letter mail Parcels Telegrams
DID YOU KNOW THAT... by age structure of vehicles registered in 2012, 50% were vehicles older than 15 years, while only 2% were vehicles up to one year old.

21 THIS IS REPUBLIKA SRPSKA, 2013
Transport and communications
74
Graph 21.2. Total number of registered vehicles, 2008−2012
Traffic accidents Compared to 2011, the number of traffic accidents in Republika Srpska in 2012 was 10.0% lower. The number of persons deceased in traffic accidents decreased by 13.6%, while the number of injured persons decreased by 11.9% during the same period.
0
50
100
150
200
250
300
350
2008 2009 2010 2011 2012
thous.

THIS IS REPUBLIKA SRPSKA, 2013
Transport and communications 21
75
Graph 21.3. Traffic accidents and injured and deceased persons, 2008−2012
In 2012, 36% of all persons who deceased in traffic accidents were persons between 20 and 40 years of age, while majority of all injured persons were those aged between 20 and 30 years. Speeding vehicles caused 30% of all traffic accidents.
0
2,000
4,000
6,000
8,000
10,000
12,000
2008 2009 2010 2011 2012
Number of traffic accidents
Number of injured and deceased persons
DID YOU KNOW THAT... one third of all traffic accidents happen in the period between noon and 4 PM.

21 THIS IS REPUBLIKA SRPSKA, 2013
Transport and communications
76
Graph 21.4. Injured and deceased persons by participation in traffic accidents, 2012
1,116 persons 39.6%
112 persons 4.0% 104 persons
3.7%
388 persons 13.8%
1,011 persons 35.9%
89 persons 3.0%
Drivers Bicyclists Motorcyclists Pedestrians Passengers Others

THIS IS REPUBLIKA SRPSKA, 2013
Education 22
77
Good education for all is a prerequisite for the progress and prosperity of the country. Developed societies aspire to create a “society of knowledge”, therefore the investment in education becomes a manner of investing in human capital.
PRE-SCHOOL EDUCATION AND UPBRINGING
The objective of pre-school education and upbringing in Republika Srpska is to provide optimal conditions for the full development and realization of children’s rights to every child, within an integrated system of upbringing and education. There were 7,369 children in pre-school institutions in 2012/2013, which means that there were 9.5% or 637 children more in comparison with 2011/2012. There were 5.8% more boys than girls in pre-school institutions.
Graph 22.1. Pre-school institutions in 2012/2013 by number of children in educational
group
0
500
1,000
1,500
2,000
up to 3 years 3 to 4 years 4 to 5 years 5 to 6 years mixed age, 3 to 6 years
all female
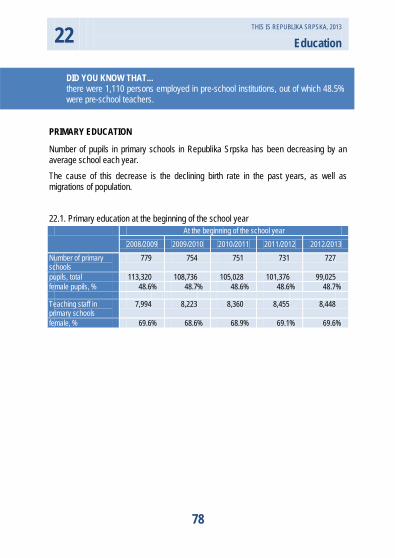
22 THIS IS REPUBLIKA SRPSKA, 2013
Education
78
PRIMARY EDUCATION
Number of pupils in primary schools in Republika Srpska has been decreasing by an average school each year. The cause of this decrease is the declining birth rate in the past years, as well as migrations of population. 22.1. Primary education at the beginning of the school year
At the beginning of the school year 2008/2009 2009/2010 2010/2011 2011/2012 2012/2013
Number of primary schools
779 754 751 731 727
pupils, total 113,320 108,736 105,028 101,376 99,025 female pupils, % 48.6% 48.7% 48.6% 48.6% 48.7% Teaching staff in primary schools
7,994 8,223 8,360 8,455 8,448
female, % 69.6% 68.6% 68.9% 69.1% 69.6%
DID YOU KNOW THAT... there were 1,110 persons employed in pre-school institutions, out of which 48.5% were pre-school teachers.

THIS IS REPUBLIKA SRPSKA, 2013
Education 22
79
SECONDARY EDUCATION 22.2. Secondary education at the beginning of the school year
At the beginning of the school year 2008/2009 2009/2010 2010/2011 2011/2012 2012/2013
Number of secondary schools
92 92 93 94 94
pupils, total 46,938 48,225 48,788 50,452 49,367 emale pupils, % 49.8% 49.9% 49.7% 49.5% 49.6% Teaching staff at secondary schools 3,309 3,598 3,768 3,981 4,013 female, % 58.2% 58.3% 59.7% 60.7% 61.7%
HIGHER EDUCATION
The number of students studying under the old programme has been decreasing At higher education institutions, studies are organised in accordance with the old programme of education which is harmonised with the Bologna Declaration. Only 8% of all students enrolled in all three cycles of studies were students enrolled under the old programme of education in the academic year 2012/2013. By sex structure of enrolled students, there were more female students at the first cycle of studies and at specialist studies, at master studies the number of female students and the number of male students were approximately the same, while at the third cycle of studies two in five students were female.
DID YOU KNOW THAT... Out of 4,013 teachers in secondary schools, 47.5% were in the age group between 25 and 39 years.

22 THIS IS REPUBLIKA SRPSKA, 2013
Education
80
Out of the total number of students enrolled in the first cycle of studies, the majority of students still opted for acquiring the title in the field Social Sciences, Business and Law (41%). If we observe the fields of education by sex structure, there were more female students in the fields Education, Humanities and Arts, Social Sciences, Business and Law and Health and Social Welfare. On the other hand, male students were more common in the fields Natural Sciences, Mathematics and Informatics, Engineering, Manufacturing and Construction, Agriculture and Veterinary, and Services. Out of the total number of those enrolled in the second cycle of studies, 2,009 students were enrolled in master studies and 166 in specialist studies. Almost 65% of those enrolled in master and specialist studies were persons under 30 years of age. All students enrolled in specialist studies were enrolled under the Bologna-compliant programme, while 97% of those enrolled in master studies were enrolled under the Bologna-compliant programme. There were 50 doctoral candidates enrolled in the third cycle of studies, out of which 2/5 were female. All doctoral dissertations were registered in accordance with the old programme of studying.
In 2012, studies were completed by 7,916 students
At the first cycle of studies there were 7,567 students who graduated in 2011. More than a half of graduated students were female (58.9%). Out of the total number of graduated students, four in five students completed studies under the Bologna-compliant programme
The title master of science and the title specialist in 2012 were awarded to 282 students, out of which 47% were male. The title of doctor of science was awarded to 67 students.
DID YOU KNOW THAT... there were 46,945 students in Republika Srpska in the school year 2012/2013.
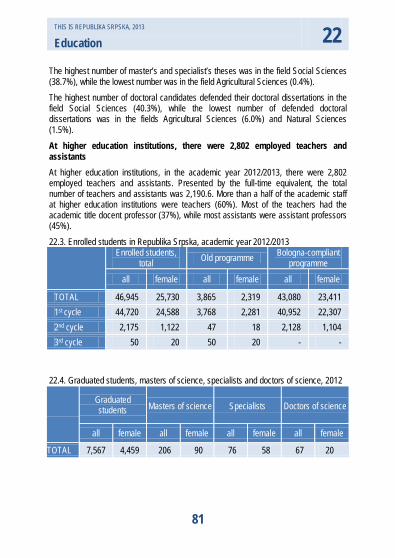
THIS IS REPUBLIKA SRPSKA, 2013
Education 22
81
The highest number of master’s and specialist’s theses was in the field Social Sciences (38.7%), while the lowest number was in the field Agricultural Sciences (0.4%). The highest number of doctoral candidates defended their doctoral dissertations in the field Social Sciences (40.3%), while the lowest number of defended doctoral dissertations was in the fields Agricultural Sciences (6.0%) and Natural Sciences (1.5%). At higher education institutions, there were 2,802 employed teachers and assistants At higher education institutions, in the academic year 2012/2013, there were 2,802 employed teachers and assistants. Presented by the full-time equivalent, the total number of teachers and assistants was 2,190.6. More than a half of the academic staff at higher education institutions were teachers (60%). Most of the teachers had the academic title docent professor (37%), while most assistants were assistant professors (45%). 22.3. Enrolled students in Republika Srpska, academic year 2012/2013
Enrolled students, total Old programme Bologna-compliant
programme all female all female all female
TOTAL 46,945 25,730 3,865 2,319 43,080 23,411 1st cycle 44,720 24,588 3,768 2,281 40,952 22,307 2nd cycle 2,175 1,122 47 18 2,128 1,104 3rd cycle 50 20 50 20 - -
22.4. Graduated students, masters of science, specialists and doctors of science, 2012
Graduated students Masters of science Specialists Doctors of science
all female all female all female all female
TOTAL 7,567 4,459 206 90 76 58 67 20

22 THIS IS REPUBLIKA SRPSKA, 2013
Education
82
Graph 22.2. Enrolled students in Republika Srpska in the academic year 2012/2013
Graph 22.3. Enrolled students in Republika Srpska by type of ownership of higher education institution in the academic year 2012/2013
0% 20% 40% 60% 80% 100%
3rd cycle
2nd cycle
1st cycle
Old programme
Bologna compliant programme
Public higher education institutions
68%
Private higher education institutions
31%
Theological faculties
1%

THIS IS REPUBLIKA SRPSKA, 2013
Culture and Art 23
83
In Republika Srpska in 2012, an increasing trend was recorded in foreign film audience and in number of theatre visitors, in comparison with 2011. The number of visitors of professional theatre increased by 25.8% in 2012 compared to 2011, while children’s theatre had the most visitors per performance (296). Mainly music, informative-documentary, entertainment and commercial programmes were broadcast by radio stations in 2012, while cultural-artistic programmes were the least represented. Compared to 2011, the number of broadcast hours decreased by 2.1% in 2012.
Graph 23.1. Programme broadcast by radio stations, 2012
In 2012, mainly feature, music, informative, commercial and entertainment programmes were broadcast by TV stations, while children and youth’s programmes were the least represented. Compared to 2011, the number of broadcast hours decreased by 5.5% in 2012.
0 50 100 150
Music Informative-documentary
Entertainment Other
Commercial Children and youth's programme
Sports Cultural-artistic
thous.hours

23 THIS IS REPUBLIKA SRPSKA, 2013
Culture and Art
84
Graph 23.2. Programme broadcast by television stations, 2012
In cinemas, the number of cinema visitors watching foreign films increased when compared to those watching domestic films. Compared to 2011, the number of visitors watching foreign films increased by 1.9% in 2012. The number of users of library fund in 2012 was 1.6% lower than in 2011.
0 4,000 8,000 12,000 16,000 20,000
Feature Music
Informative Commercial
Entertainment Sports
Educational Scientific-cultural
Other Children and youth's programme

THIS IS REPUBLIKA SRPSKA, 2013
Culture and Art 23
85
Graph 23.3. Cinema visitors, 2012
Graph 23.4. Theatre visitors
0 20 40 60 80
100 120 140 160 180
2009 2010 2011 2012
Domestic films
Foreign films
0
10
20
30
40
50
60
70
2007/2008 2008/2009 2009/2010 2010/2011 2011/2012
Children's theatre Professional theatre Amateur theatre Experimental theatre
thous.
thous.

24 THIS IS REPUBLIKA SRPSKA, 2013
Health Care
86
In the public health sector of Republika Srpska in 2012 there were 13,275 employed medical staff and associates, out of which almost 41% were employed at health care centres. Out of the total number of employed persons, approximately 18% were doctors of medicine. In the same period, private health care institutions employed 1,607 persons, out of which almost 11% were doctors of medicine. There were approximately 4.25 million visits to the General and Family Medicine services, and approximately 26% of these were first visits to the physician. The first visit is a contact realised for the first time with a physician due to a disease, condition or injury. One person may, in the course of one year, visit a physician several times, but each time due to different disease, and in that case each visit is considered to be the first visit due to that disease. In the same year, 174,000 persons concluded their hospital treatment, which represented an increase by 3.2% compared to 2011. 24.1. Doctors of medicine in health institutions
2011 2012
TOTAL 2,471 2,530 In public health 2,286 2,355 In private clinics 185 175
Source: Republika Srpska Public Health Institute The most cases of parotitis epidemics Compared to 2011, there were approximately 1.1% more reported cases of infectious and parasitic diseases in 2012 in Republika Srpska, which represents a significant decrease in comparison with the period 2010/2011. Out of the total number of reported cases in 2012, a significant number of cases of parotitis epidemics was recorded (approximately 5.5 thousand), which represented and increase by 148% compared to 2011. During the same period, the number of influenza (J10-J11) cases decreased by 75% compared to 2011.
DID YOU KNOW THAT… there were eight new reported cases of HIV positive persons and one new AIDS case in 2012 in Republika Srpska.

THIS IS REPUBLIKA SRPSKA, 2013
Health Care 24
87
24.2. Reported cases of infectious and parasitic diseases in Republika Srpska Number of reported cases
2008 15,674 2009 17,344 2010 11,643 2011 19,215 2012 19,434
Source: Republika Srpska Public Health Institute Among diseased persons, the most frequent were cases of neoplasms, while most deaths occurred due to diseases of the circulatory system In Republika Srpska in 2012 there were 167,000 deceased persons. Out of all disease cases, 20.3% were cases of neoplasms, and during the same period approximately 22% of persons deceased due to this disease. Slightly more than 7,500 persons, or 58% of all deceased persons, deceased due to the diseases of the circulatory system, which affected 11% of persons in the previous year
Graph 24.1. Morbidity and mortality by specific disease group, 2012
Source of data on morbidity: Republika Srpska Public Health Institute
0
5,000
10,000
15,000
20,000
25,000
30,000
35,000
Neoplasms (C00-D48) Diseases of the circulatory system (I00-I99)
Diseases of the respiratory system (J00-J99)
Endocrine and metabolic diseases (E00-E90)
Diseased Deceased

25 THIS IS REPUBLIKA SRPSKA, 2013
Health, Pension and Disability Insurance
88
Health Insurance In 2012 in Republika Srpska there were almost 930 thousand health-insured persons. Since 2010, the number of these persons has been decreasing in comparison with 2008 and 2009, when the number of health-insured persons was increasing. The highest decrease in the number of health-insured persons in 2012 was recorded in the category of active insured persons, and this decrease amounted to 3.4%. An increase in number of insured persons was recorded in the category of beneficiaries of insurance from the PDI and in the category of unemployed persons. Insured persons who exercised their right to health insurance were temporarily unable to work for almost 578 thousand days in 2012, in almost 16 thousand cases. Since 2008, the number of issued prescriptions has been constantly increasing, thus in 2012 there were almost 390 thousand prescriptions more than in 2011. 25.1. Insured persons by category of health insurance (average)
25.2. Exercise of health insurance rights
2008 2009 2010 2011 2012 Temporary inability to work, number of days
495,505 599,156 594,879 559,761 578,208
Number of issued prescriptions
4,676,662 5,185,817 5,902,575 6,303,610 6,690,369
Source: Health Insurance Fund of Republika Srpska
Insurance category 2008 2009 2010 2011 2012 TOTAL 963,552 1,025,518 949,369 932,877 928,561 Active insured persons 198,675 251,831 242,095 219,316 211,814 Beneficiaries of insurance from the PDI
213,392 217,372 197,000 202,051 204,577
Unemployed persons 187,864 172,782 148,110 151,171 158,992 Family members of an insured person
363,621 383,533 362,164 360,339 353,178
Source: Health Insurance Fund of Republika Srpska
DID YOU KNOW THAT... in Republika Srpska in 2012 approximately 6.7 million prescriptions were issued, that is, approximately 18,300 prescriptions a day.

THIS IS REPUBLIKA SRPSKA, 2013
Health, Pension and Disability Insurance 25
89
Pension and Disability Insurance Since 2008, the average number of pension beneficiaries has been increasing constantly, and in 2012 there were, on the average, almost 235 thousand beneficiaries, which was an increase by 2% compared to 2011. Out of the total average number of pension beneficiaries in 2012, more than a half were old-age pension beneficiaries and the number of these increased by 4.6%, compared to 2011. After an increase was recorded in 2008 and 2009, average pensions began to decrease in 2010. The average pension in 2012 was 288 KM, and it decreased by 4% compared to 2011. The highest decrease (6%) in comparison with 2011 was recorded in the category of disability pensions.
Graph 25.1. Pension right beneficiaries in the period 2008 – 2012
(average)
Source: Pension and Disability Insurance Fund of Republika Srpska
20,000
40,000
60,000
80,000
100,000
120,000
140,000
2008 2009 2010 2011 2012
Old-age pensions Survivors' pensions Disability pensions
DID YOU KNOW THAT... members of male population exercise their right to personal pension for 16.6 years on the average, and members of female population for 19.9 years.

26 THIS IS REPUBLIKA SRPSKA, 2013
Social Welfare
90
In Republika Srpska in 2012 at least one form of social welfare was received by 376,802 persons, out of which 70.6% were adults and 29.4% minors. By sex, there were more female social welfare beneficiaries
Graph 26.1. Social welfare beneficiaries, 2012
In 2012, the number of social welfare beneficiaries increased by 7.5% compared to 2011. An increase was recorded in both categories of beneficiaries.
48.6 51.4
Male
Female
DID YOU KNOW THAT… in 2012 in Republika Srpska 182 children were abandoned by their parents.

THIS IS REPUBLIKA SRPSKA, 2013
Social Welfare 26
91
The number of minor beneficiaries increased by approximately 6% and the number of adult beneficiaries increased by 8.1%
Graph 26.2. Number of social welfare beneficiaries
In 2012, there were 110,921 recorded minor beneficiaries of social welfare. Most minor beneficiaries were between 7 and 14 years of age, while the lowest number of them were in the category of 17 and 18 years of age. By category, most minor beneficiaries were those from the category of the disadvantaged by family situation (44.8%). The same category included most children of parents not having sufficient income to support the family (85.9%).
0
50,000
100,000
150,000
200,000
250,000
300,000
2008 2009 2010 2011 2012
Minor beneficiaries Adult beneficiaries

26 THIS IS REPUBLIKA SRPSKA, 2013
Social Welfare
92
Graph 26.3. Minor beneficiaries by sex and age, 2012
In 2012, at least one of the forms of social welfare was received by 265,881 adults, out of which most over 65 years of age, while the lowest number of them were in the age group between 18 and 21 years. The biggest share in the total number of adult beneficiares was that of the category of persons in different social and protection needs (52.5%) and among them 53.8% were female.
Graph 26.4 Adult beneficiaries by sex and age, 2012
0
5,000
10,000
15,000
20,000
up to 7 7–14 15–16 17–18
Male Female
0 5,000
10,000 15,000 20,000 25,000 30,000 35,000
18–21 22–26 27–45 46–59 60–65 65+
Male Female

THIS IS REPUBLIKA SRPSKA, 2013
Social Welfare 26
93
Social welfare institutions In 2012, there were 243 beneficiaries in homes for children and youth, and most of them were over 18 years of age, mostly female (96.3%), while most male beneficiaries were in the age group between 15 and 18 years.
Graph 26.5 Beneficiaries of homes for children and youth by sex and age, 2012
Institutions of social welfare for disabled children and youth with physical and mental disabilities in 2012 accommodated 340 persons, most of them 21 years of age.
0 20 40 60 80
100 120 140 160 180
up to 3 3–6 7–10 11–14 15–18 18 +
Male Female

26 THIS IS REPUBLIKA SRPSKA, 2013
Social Welfare
94
Graph 26.6 Beneficiaries of institutions for disabled children and youth by sex and age,
2012
In 2012, institutions for adult disabled persons accommodated 43 beneficiaries, most of them physically disabled (74.4%). Institutions of social welfare for the elderly in 2012 accommodated 1,068 persons, most of them female (approximately 63%). Most beneficiaries were over 80 years of age - 392 persons, out of which 251 were female.
0 20 40 60 80
100 120 140 160 180 200
up to 10 11–13 14–15 16–17 18–21 21 +
Male Female
DID YOU KNOW THAT… social work centres in Republika Srpska processed 720,542 cases in 2012.

THIS IS REPUBLIKA SRPSKA, 2013
Social Welfare 26
95
Graph 26.7 Benficiaries of institutions for the elderly by sex, 2012
Child support beneficiaries The total number of beneficiaries realising the right to child support in 2012 was 27,281, and the number of children realising the right to child support in the same year was 38,552. Compared to 2011, the total number of beneficiaries realising the right to child support in 2012 decreased by 8.1%, and the number of children realising this right decreased by 7.4% during the same period.
Graph 26.8. Number of child support beneficiaries and number of children
37%
63%
Male Female
0
10,000
20,000
30,000
40,000
50,000
2008 2009 2010 2011 2012
Number of beneficiaries Number of children

27 THIS IS REPUBLIKA SRPSKA, 2013
Research and Development
96
The role and significance of science and technology in the development of modern societies represent indispensable and irreplaceable factors in any consideration of quality and sustainable development. Research and development and innovations are the driving force of development, representing at the same time the foundation of aspiration to create a society of knowledge. In Republika Srpska in 2012 most of those engaged in research and development were employed in the scientific field Engineering and Technology
Out of the total number of persons engaged in research and development activities, covering researchers, research associates, technicians, managers and other supporting staff, 2/3 were researchers. The majority of researchers (46.2%) carried out research in the scientific field Engineering and Technology, which covers mechanical and chemical engineering, electrical engineering, electronics, information engineering, and other engineering and technologies. Higher education, which covers higher education schools, universities with faculties and academies, and institutes under direct control or management of higher education institutions, is a sector which in 2012 employed 62.2% of the total number of persons employed in all sectors in which research and development is carried out. In 2012, 34,297,000 KM were spent on research development, out of which 4/5 were spent in the business sector. Out of the total funds spent, 44% were spent on labour costs and compensation of employees, material costs for research and development activities, payments under service contracts and other current costs, while the remaining 56% were spent on expenditure for land, construction buildings, machinery, equipment, studies, projects and other investment expenditure. In the period 2010 – 2012 in Republika Srpska, 27.8% of the total number of enterprises were innovation active. Innovation activity of enterprises increases in proportion to their size Innovation – active enterprises are those that have introduced product innovation and/or process innovation, as well as those that have begun their innovation activities or abandoned them, and/or introduced innovation in enterprise organisation and/or marketing innovation. Innovation active enterprises with technological innovation, the share of which in the period 2010–2012 in Republika Srpska was 16.5%, are enterprises which introduced new or significantly improved product or service and/or new or significantly improved production or delivery method, that is, those enterprises that have begun innovation activities or abandoned them, before the end of 2012.

THIS IS REPUBLIKA SRPSKA, 2013
Research and Development 27
97
Innovation active enterprises with non-technological innovation, the share of which in the observed period in Republika Srpska was 23.2%, are enterprises which introduced new organisational method in business practice and/or new marketing concept or strategy which are different from the existing ones in the enterprise. In the period 2010 – 2012, in order to introduce innovation in their business activities, enterprises were mostly engaged in the acquirement of machinery, equipment, software and buildings. Sources of information for innovation activities may be internal and market sources, educational and research institutions, and other sources. Sources within the enterprise or enterprise group were marked as very important by the highest number of enterprises (34.1%). Through the introduction of innovations, most enterprises increased their range of goods, services or processes.
27.1. Gross domestic expenditure on research and development by sector and source of funds
thous. KM
Sources of funds TOTAL Sector
business govenment higher education non-profit
2009 24,566 10,017 1,670 12,879 - 2010 20,779 8,520 2,019 10,091 149 2011 26,191 15,526 3,592 7,031 42 2012 34,297 27,430 1,946 4,875 46 TOTAL 34,297 27,430 1,946 4,875 46 Funds from Republika Srpska 14,748 8,531 1,745 4,430 42 Republic and local government 2,442 976 377 1,055 34 Private and public enterprises 478 98 10 370 - Non-profit organisations 5 - - 5 - Own funds 11,823 7,457 1,358 3,000 8 Funds from abroad 19,318 18,899 - 419 - Funds of common institutions of BH
227 - 201 26 -
Funds from the FBH and BD 4 - - - 4

27 THIS IS REPUBLIKA SRPSKA, 2013
Research and Development
98
Graph 27.1. Persons engaged in Research and Development by level of education, 2012
Graph 27.2. Enterprises by size of enterprise and by innovation activity, 2010 – 2012
0 50 100 150 200
Other education
Secondary education
Vocational education
University education
Specialists
Masters of science
Doctors of science
female male
0
10
20
30
40
50
60
70
80
TOTAL Small Medium Large
Innovation-active enterprises
Non-innovative enterprises

THIS IS REPUBLIKA SRPSKA, 2013
Research and Development 27
99
0
500
1,000
1,500
2,000
2,500
3,000
3,500
4,000
4,500
5,000
Explo
ratio
n and
exp
loitat
ion o
f spa
ce
Defen
ce
Healt
h
Politi
cal a
nd so
cial s
ystem
s, str
uctur
es a
nd p
roce
sses
Educ
ation
Ener
gy
Cultu
re, r
ecre
ation
, reli
gion a
nd m
ass m
edia
Agric
ultur
e
Envir
onme
nt
Tran
spor
t, tel
ecom
munic
ation
and
othe
r infr
astru
cture
s
Indus
trial p
rodu
ction
and
tech
nolog
y
Gene
ral a
dvan
ceme
nt of
know
ledge
Explo
ratio
n and
exp
loitat
ion o
f Ear
th
18,50
0 19
,000
thous
. КМ
Grap
h 27.3
. Res
ourc
es fo
r Res
earc
h and
Dev
elopm
ent a
ctivit
y by s
ocio-
econ
omic
goal,
2012

27 THIS IS REPUBLIKA SRPSKA, 2013
Research and Development
100
0
5
10
15
20
25
Product innovators
Process innovators
Product and process
innovators
Ongoing and/or
abandoned innovation
activity
Small
Medium
Large
0
5
10
15
20
25
30
Innovators in organisation
Innovators in marketing
Innovators in organisation and
marketing
Small Medium Large
Graph 27.4. Enterprises with technological innovations by type of innovations, 2010–2012
Graph 27.5. Enterprises with non-technological innovations by type of innovations, 2010 – 2012

THIS IS REPUBLIKA SRPSKA, 2013
Crime 28
101
ADULT PERPETRATORS Public Prosecutor’s Offices resolved 12,448 criminal charges filed against adults, and for almost 30% of them the identity perpetrator was not determined. As in the previous year, criminal offences against property were the most common offences. Thus, these accounted for almost 50% of the total number of resolved criminal charges, and if we take into account unknown perpetrators only, these accounted for more than 90% of the total number of unknown persons. In the same period, 4,717 persons were accused and 4,294 persons were convicted at the competent courts. Over 90% of all convicted persons were male, mostly between 30 and 39 years of age. Besides property offences, with which one in three accused or convicted person was charged, 15% were criminal offences against public order. Out of all accused and convicted perpetrators, 10% were charged with criminal offences of endangering public transport and 10% with assault causing bodily harm. When it comes to perpetrators who were found guilty, the most common sanction was conditional sentence, which was recorded in almost 60% of all cases. Unconditional imprisonment and fine were imposed in almost 20% of cases.
Graph 28.1. Adult perpetrators of criminal offences − reported, accused and convicted, 2012
12,448
4,717
4,294
Reported
Accused
Convicted

28 THIS IS REPUBLIKA SRPSKA, 2013
Crime
102
Graph 28.2. Convicted adult persons – imposed criminal sanctions by group of criminal offences, 2012
JUVENILE PERPETRATORS Out of a total of 353 resolved criminal charges for juvenile persons in 2012, more than 60% referred to older juvenile persons (persons who completed 16 years of age, but still did not complete 18 years of age). Criminal offences against property were the most common among juveniles as well, with over 70% of the total number of charges being cases of criminal offences against property. The indictment for perpetrated criminal offence was confirmed for 66 juvenile persons, and for 80% of them one of criminal sanctions was imposed in further proceedings. Out of 51 imposed criminal sanctions, only two were against female persons. Out of the total number of criminal sanctions, there was only one case of juvenile imprisonment. Educational-correctional measures were imposed in all other cases, and 60% of these were measures of intensified supervision. Besides property offences, for which over 65% of all accused juveniles were found guilty, criminal sanctions for 15% of juveniles were imposed due to perpetrated criminal offences from the group of assaults causing bodily harm.
0
500
1,000
1,500
2,000
2,500
3,000
Conditional sentence Fine Imprisonment

THIS IS REPUBLIKA SRPSKA, 2013
Crime 28
103
Graph 28.3. Juvenile perpetrators of criminal offences − reported, accused and convicted, 2012
Graph 28.4. Convicted juvenile perpetrators – imposed criminal sanctions by group of criminal offences, 2012
353
66
51
Reported
Accused
Convicted
50
1
Educational-correctional measures
Juvenile imprisonment

Published by the Republika Srpska Institute of Statistics, Banja Luka, Veljka Mlađenovića 12d – Tel. +387 51 332 700 – Radmila Čičković, PhD, Acting Director – Total print run 50 – Annual periodicity – The publication is also published on the Internet at: www.rzs.rs.ba – E-mail: [email protected] – These data can be used provided the source is acknowledged


![Republika Srpska · Web view[Type the company name] Republika Srpska [Type the document subtitle] BsR Geografija REPUBLIKA SRPSKA Republika Srpska je danas parlamentarna republika](https://static.fdocuments.in/doc/165x107/5e5df45329961b090f6f0ad3/republika-srpska-web-view-type-the-company-name-republika-srpska-type-the-document.jpg)