2012 - University of Technology...
39
INSTITUTE FOR SUSTAINABLE FUTURES POVERTY DIMENSIONS OF WATER, SANITATION AND CLIMATE VULNERABILITY IN CAN THO CITY 2012
-
Upload
truonghanh -
Category
Documents
-
view
215 -
download
0
Transcript of 2012 - University of Technology...
INSTITUTE FOR SUSTAINABLE FUTURES
POVERTY DIMENSIONS OF WATER, SANITATION AND CLIMATE VULNERABILITY IN CAN THO CITY
2012

INSTITUTE FOR SUSTAINABLE FUTURES MARCH 2012
ii
ABOUT THE AUTHORS The Institute for Sustainable Futures (ISF) was established by the University of
Technology, Sydney in 1996 to work with industry, government and the community to
develop sustainable futures through research and consultancy. Our mission is to create
change toward sustainable futures that protect and enhance the environment, human
well-being and social equity. We seek to adopt an inter-disciplinary approach to our work
and engage our partner organisations in a collaborative process that emphasises strategic
decision-making.
For further information visit: www.isf.uts.edu.au
Research team: Ms Naomi Carrard, A/Prof Mick Paddon, Dr Juliet Willetts and Mr Dustin
Moore
CITATION Cite this report as:
Carrard, N., Paddon, M., Willetts, J. and Moore, D. (2012). Poverty Dimensions of Water
and Sanitation Services and Climate Vulnerability in Can Tho City, report prepared by the
Institute for Sustainable Futures, University of Technology, Sydney.
ACKNOWLEDGEMENT The research reported here is part of the CSIRO-AusAID Research for Development
Alliance study: Climate Adaptation through Sustainable Urban Development, Can Tho
Case Study. This study has been jointly funded by AusAID and CSIRO's Climate
Adaptation Flagship through the AusAID / CSIRO Research For Development Alliance.
The authors would like to acknowledge and thank the team from Can Tho University
(CTU) and Can Tho Water Supply and Sewerage Company (CTWSSC) who arranged
and assisted with interviews. In particular we thank Mr Trinh Cong Doan (CTWSSC), Mr
Vo Quoc Thanh (CTU) and Mr Dinh Diep Anh Tuan (CTU). Thanks also to Mr Do Xuan
Thuy (consultant) for his role as a key member of the interview team. The authors would
also like to thank the wider CSIRO and CTU team for support and assistance including Dr
Minh Nguyen, Dr Luis Neumann, Dr Magnus Moglia, Mr Stephen Cook and Dr Nguyen
Hieu Trung.
INSTITUTE FOR SUSTAINABLE FUTURES University of Technology, Sydney
PO Box 123
Broadway, NSW, 2007
www.isf.edu.au
© UTS March 2012

INSTITUTE FOR SUSTAINABLE FUTURES MARCH 2012
iii
UTS:INSTITUTE FOR SUSTAINABLE FUTURES
MARCH 2012
Poverty Dimensions of
Water, Sanitation and
Climate Vulnerability in Can
Tho City
Prepared for: CSIRO
AUTHORS
Naomi Carrard
Michael Paddon
Juliet Willetts
Dustin Moore

INSTITUTE FOR SUSTAINABLE FUTURES MARCH 2012
POVERTY, WATER AND SANITATION SERVICES AND CLIMATE VULNERABILITY IN CAN THO iv
Table of Contents
Summary 1
1 Background and rationale 5
2 Exploring poverty in Vietnam 7
2.1 Measuring poverty and the situation in Vietnam 7
2.2 Official definition of poverty in Vietnam 8
3 Approach 10
3.1 Vietnamese government data 10
3.2 Survey 10
3.3 Qualitative empirical study 11
4 Findings and implications 14
4.1 Poverty dynamics in Can Tho 14 4.1.1 Poverty in Can Tho 14
4.2 Access to infrastructure and water related behaviour 21 4.2.1 Poor households and access to water 21 4.2.2 Sanitation and wastewater services 25
4.3 Social vulnerability 27 4.3.1 Location and housing type 28 4.3.2 Livelihood insecurity and resource dependency 30
5 Conclusion and next steps 32
6 References 33
Annex 1 Interview question guide 35

INSTITUTE FOR SUSTAINABLE FUTURES MARCH 2012
POVERTY DIMENSIONS OF WATER, SANITATION AND CLIMATE VULNERABILITY IN CAN THO 1
Summary
Background
This report details findings from research on the poverty dynamics of water and sanitation
services and climate vulnerability in the city of Can Tho, Vietnam. The research forms part
of the CSIRO-AusAID Research for Development Alliance study: Climate Adaptation
through Sustainable Urban Development, Can Tho Case Study. Findings presented in this
report were drawn from Vietnamese government data, the results of a survey of 1,200
households undertaken by Can Tho University in 2011 (as part of the wider study), and a
qualitative empirical study comprising 23 interviews with low income households in O Mon
and Thot Not districts. Insights from the research are presented in this report including an
analysis of the scale and nature of poverty in Can Tho, a discussion of poor households‟
access to infrastructure and water related behaviour, and an exploration of social
vulnerability.
Poverty dynamics in Can Tho
Based on measures of income, in the past decade poverty rates in Can Tho have been
higher than for comparable cities in Vietnam. While recent official data indicates that
poverty rates are falling so that overall in the city only 6% of households were classified as
officially poor in 2010, there is a significant variation between the urban districts, with Ninh
Kieu having the lowest rate of householder poverty (1%) and O Mon having the highest
rate, with 8%of households officially classified as poor. Data from the survey conducted
for this project suggests that these figures may underestimate the extent of poverty,
particularly if analysis extends to non-income dimensions of poverty such as those
related to living standards
Focusing on poor households specifically, the research explored the characteristics and
experience of poverty and identified implications for water and sanitation service provision
in the context of climate adaptation. According to official data, 59% of households
classified as poor in urban districts are living in „dilapidated‟ dwellings. The independent
survey data indicates a link between household income and housing structure with over
50% of households in the two lowest income groups living in temporary or semi-
permanent housing. The nature of the dwellings in which poor households live is a key
consideration when assessing the significance that options for providing water and
sanitation services (such as rainwater tanks or septic tanks) will have. This is because
these options may not be feasible for these households and alternative approaches need
to be identified.
Affordability and the capacity to plan and manage household income are also key
considerations. Sources of income for poor households are typically seasonal, sporadic
INSTITUTE FOR SUSTAINABLE FUTURES MARCH 2012
POVERTY DIMENSIONS OF WATER, SANITATION AND CLIMATE VULNERABILITY IN CAN THO 2
and unreliable. Most households included in the qualitative study reported experiencing
stress related to their situation, with key concerns identified as health, income, food,
education, ability to cope with flooding and overall quality of life. The majority of
households interviewed lived over or near to waterways, with some occupying very
marginal land highly vulnerable to seasonal or longer-term climatic changes and weather
events.
Access to infrastructure and water-related behaviour
Review of the current situation with respect to access to water and sanitation services
indicates that targeted efforts are needed to increase access for urban poor households.
In the urban districts, 27% of poor households were without access to water services in
2008 (compared to the Water Supply and Sewerage Company‟s figure of 20% for the city
overall). The rate differs significantly between districts, with only 2% of poor households in
Ninh Kieu lacking access while the figure in other urban districts is between 30% and
40%. This implies a correlation between poverty and lack of access to water in Can Tho
that reflects global findings on the links between wealth and service provision, with the
poor 2–5 times less likely to use improved water and sanitation facilities (WHO/UNICEF
2010).
In working to increase access for poor households, careful consideration of models of
service delivery are needed to ensure the proposed options meet the needs of targeted
households in terms of access, demand and affordability. For most households in the
qualitative study, it was common practice to use multiple sources of water, matching the
source with intended purpose. While piped water (when available) was identified as the
main source for non-drinking purposes, interviewees used river water for at least some
purposes (for example washing) to save on water bills. For poorer households the
assessment of affordability was also influenced by whether they met official criteria which
makes them eligible for registration and payment of subsidies by the city. If the survey
has accurately identified a significant number of potentially poor people who are not
included in the official statistics (i.e. are not registered) the challenge of housing
affordability will be more widespread. Models of likely demand and revenue for water
services need to take this into account, as projected demand may be lower than
anticipated if the water provided is considered to be too costly and if alternative free
sources are readily available and perceived to be of sufficient quality for particular
households purposes.
Similar considerations need to be taken into account with respect to sanitation. While the
survey data indicates that 81% of households overall are using facilities defined as
„improved sanitation‟ by the WHO/UNICEF Joint Monitoring Program, this is linked to
income with only just over 60% of respondents in the lowest income group reporting
access to this standard of facility. Of the 23 households included in the qualitative study,
21 used hanging fishpond toilets. There was a lack of expressed household demand for
INSTITUTE FOR SUSTAINABLE FUTURES MARCH 2012
POVERTY DIMENSIONS OF WATER, SANITATION AND CLIMATE VULNERABILITY IN CAN THO 3
and willingness to invest in improved sanitation compared with water supply. In light of
this, there is a need for sanitation improvement programs to focus on the social aspects of
sanitation promotion, including demand creation and behaviour change.
Affordability is also a significant part of the sanitation picture for poor households. Four
interviewees reported that microfinance was available for constructing a toilet within their
house, but that they were either unable or unwilling to participate in the scheme due to
concerns about their ability to make repayments. This has implications for both sanitation
and water supply schemes that require households to invest either directly or through
microfinance or subsidised loan schemes.
Social vulnerability
Questions relating to social vulnerability were explored in order to establish whether the
link identified in the literature between poverty and vulnerability was present. Data from
the qualitative study indicates that poor households are indeed highly vulnerable to the
impacts of climate change predicted for Can Tho, including an increased risk of flooding, a
reduction in the quality of surface water, changes in river flows and a more intense dry
season. Key dynamics are the location of poor households (typically on marginal land
proximate to waterways) and their livelihood situation with respect to income and resource
dependency.
The proximity of dwellings to waterways, combined with their poor structural quality,
intensifies the experience of seasonal and tidal flooding, indicating significant exposure to
the increased the risk of flooding predicted for Can Tho. The impacts of flooding reported
in interviews included poor health (respiratory and skin disorders), reduced mobility and
loss of income. Those reliant on rice or fish industries for employment in particular cited
difficulties.
The marginal location of households interviewed also means that any changes in water
quality and local environmental conditions directly impacts households. Many households
noted a decline in local environmental conditions, for example degraded water and river
environment quality or a decline in fish numbers. Interviewees identified a link between
water quality and health, with sickness most commonly attributed to a decline in the
quality of river water over time with particular concerns about quality during low tides and
the dry season. Illnesses reported included stomach upsets and skin disorders.
The impacts of changes in water quality are particularly significant for households relying
on local waterways for some or all household water uses – including those without access
to piped water and those that cannot afford to use piped water for all purposes.
In addition to those reliant on surface water, households that are either directly or
indirectly dependent on local resources for their livelihood are particularly vulnerable. The
INSTITUTE FOR SUSTAINABLE FUTURES MARCH 2012
POVERTY DIMENSIONS OF WATER, SANITATION AND CLIMATE VULNERABILITY IN CAN THO 4
majority of households interviewed were either directly or indirectly dependent on local
resources for employment and in some cases food. This includes households that depend
on eating locally caught or grown fish and vegetables, those making use of local
resources for income generation, and those for whom the primary sources of income rely
on the success of local crops or production.
Next steps
Research into the poverty dynamics of water, sanitation and climate vulnerability in Can
Tho reinforces the relationship between poverty, access to basic services and social
vulnerability, and sheds light on the specific situation for urban poor households in Can
Tho. To date there has been little information available that focuses on the poverty
aspects of water services in Can Tho. This study draws together available information
from existing data sets and adds additional qualitative insight from interviews to build a
richer picture of the situation for urban poor households, with reference to water and
sanitation services as well as social vulnerability.
The findings from this study of poverty, water, sanitation and vulnerability will inform the
upcoming phases of the climate adaptation study, and the next phases of the study will in
turn add to the emerging picture of poverty. In identifying potential future scenarios for
Can Tho based on development trajectories and predicted climate change impacts, a
„poverty lens‟ can be applied to consider how alternative scenarios might be experienced
by the poor, and how they might respond. Similarly, case study analysis will provide
detailed information about the life-cycle costs and sustainability considerations of various
service options, including implications for the urban poor.

INSTITUTE FOR SUSTAINABLE FUTURES MARCH 2012
POVERTY DIMENSIONS OF WATER, SANITATION AND CLIMATE VULNERABILITY IN CAN THO 5
1 Background and rationale
This report forms part of ISF‟s contribution to the CSIRO-AusAID Research for
Development Alliance study: Climate Adaptation through Sustainable Urban
Development, Can Tho Case Study. It details findings and implications from a study of the
poverty dimensions of water services and climate adaptation that form part of Activity 1
(understand the current situation and obtain data) and aims to inform Activity 3 (climate-
adapted integrated urban water system analysis at the city scale) and Activity 4 (capability
building through development of alternative water service options for climate change
adaptation in a peri-urban or new development area).
The aim of this component of the research is to fill a gap in existing knowledge about the
socio-economic dynamics of water and sanitation services in Can Tho City, with a
particular focus on services for the urban and peri-urban poor. To date there has been
little research focused on the poverty aspects of water services in Can Tho. This study
draws together information from four sources: the official poverty data from the Can Tho
Department of Labour, Invalids and Social Affairs (DoLISA); data from the official
population census in 2009; data from a survey of 1,200 households undertaken by Can
Tho University (CTU) as part of the wider CSIRO/CTU/ISF study; and an empirical study
using semi-structured interviews undertaken with 23 low-income households in Can Tho.
The focus on socio-economic dynamics and poverty is important for a number of reasons.
Firstly, poverty reduction is the core objective of international development assistance and
the CSIRO-AusAID research alliance represents one of Australia‟s initiatives to support
development and reduce poverty. The alleviation of poverty is the first of the Millennium
Development Goals (MDGs) and improving access to sustainable and safe drinking water
is also fundamental to the MDGs (as enshrined in the seventh MDG). The focus on the
urban and peri-urban poor in this study is in recognition that these two goals are inherently
linked.
Secondly, the specific focus on the poor is also a critical consideration in the planning of
future water and sanitation services under climate change scenarios. The poor are two to
five times less likely to use improved water and sanitation facilities (WHO/UNICEF 2010),
and a focus on poor households is therefore warranted in any research or development
project that ultimately aims to improve sustainable and equitable access to water and
sanitation. Further, poorer households are typically less resilient and more vulnerable to
shocks, including disruptions in income or services (Adger 1999, Brooks 2003). In the
context of climate adaptation it is critical to investigate the situation and potential
vulnerability of poorer households to determine the likely impacts of climate change on
these groups and to inform planning for appropriate service provision, adaptation and
disaster risk reduction.
Finally, different water service options and scenarios will have specific implications for
poorer households, and these will affect the policy response to potential options. In order
to examine the likely implications of different service options for poor households, it is

INSTITUTE FOR SUSTAINABLE FUTURES MARCH 2012
POVERTY DIMENSIONS OF WATER, SANITATION AND CLIMATE VULNERABILITY IN CAN THO 6
essential to gain an insight into their current situation, so that potential policy drivers and
barriers related to water service scenarios can be anticipated and predicted (e.g. the
relationship between water services tariffs and affordability and cost recovery).
The contemporary literature on climate change adaptation and vulnerability goes further
than documenting and analysing poverty. In a review of the climate change literature on
vulnerability, risk and adaptation, Brooks (2003) identifies two definitions of vulnerability:
(i) The potential damage to a system caused by climatic events or hazards
(from Jones and Boer 2003); or
(ii) A system state unrelated to specific hazards (Allen 2003).
The second definition is significant for this study and for the wider project on climate
change adaptation in Can Tho because it locates vulnerability in structural and institutional
characteristics which then mediate the relationship between climate related events and
their impacts (Brooks 2003). In other words, vulnerability can be seen as socially rather
than biophysically determined, with the nature of vulnerability shaped by socio-political
processes that allocate social and other resources (Blaikie & Canon et al. 1994 and Hewitt
1997, as cited in Kuruppu 2009).
This literature draws a helpful distinction between biophysical or ecological vulnerability
and social vulnerability. Biophysical vulnerability relates to the likely impacts of a climatic
event on the natural environment (e.g. ecosystem impacts) and the amount of damage in
human terms (e.g. mortality, monetary cost) (Brooks 2003). Social vulnerability (as a
social-political state unlinked to specific hazards) relates to factors such as poverty and
inequality as well as housing quality, marginalisation, and access to insurance and food
entitlements (Blaikie et al. 1994; Adger and Kelly 1999; Cross 2001 cited in Brooks 2003).
Resource dependency is a key component of social vulnerability. As Marshall et al. (2009
p.11) note, “the sensitivity of individuals who rely on ecosystem goods and services is
largely determined by how strongly they depend on the specific goods and services which
will be affected by environmental change”.
Vulnerability is one part of the climate adaptation picture, with adaptation typically defined
in the literature as “the ability or capacity of a system to modify or change its
characteristics or behaviour so as to cope better with the existing or anticipated external
stresses” (Brooks 2003 p.8; see also Burton et al. 2002; Adger et al. 2003). This report
does not attempt to fully assess the adaptive capacity of poor households as this would
require a full analysis of biophysical vulnerability and institutional adaptation (as described
by Adger 1999) in addition to exploration of social vulnerability.
The main body of this report therefore investigates poverty dynamics in Can Tho (Section
4.1) and then examines the access by poor households to water and sanitation
infrastructure and how they use and live with what is available to them (section 4.2). We
then make an initial assessment of social vulnerability in terms of location and types of
housing, livelihoods and resource dependency (section 4.3).
INSTITUTE FOR SUSTAINABLE FUTURES MARCH 2012
POVERTY DIMENSIONS OF WATER, SANITATION AND CLIMATE VULNERABILITY IN CAN THO 7
2 Exploring poverty in Vietnam
This section provides a brief introduction to measures of poverty and the situation in
Vietnam, to set the scene for the more detailed analysis of poverty in Can Tho.
2.1 Measuring poverty and the situation in Vietnam
While the objective of reducing poverty is clear (and arguably universal), the issues of how
to conceptualise and define poverty are complex. The concepts of what constitutes
poverty have changed over time with the recognition that simple and single measures are
inadequate for understanding or developing policies for water and sanitation. As such, this
study has drawn on several sources of information, combining a range of measures to
build a richer and more adequate picture of the experience of poverty.
The conventional starting point for assessing poverty, and the initial basis for most
analysis since the start of the 20th century, has been income (Maxwell 1999). However,
as the concept developed from the middle of the last century there was an
acknowledgement that poverty is a relative rather than an absolute measure; that is, it
relates to the standards of a particular society at a point in time and is not a fixed condition
linked to physical „needs‟. Further, poverty is not merely about the characteristics of
particular individuals or households but is linked also to access to basic services usually
provided socially, including education and health. The concept has been broadened,
deepened and unpacked. It now encompasses a range of overlapping components
covering vulnerability, well-being, livelihoods, and social inclusion and exclusion. With this
more complex understanding, the analysis of poverty, vulnerability and inclusion/exclusion
includes (adapted from Maxwell 1999):
Individual as well as household poverty
Access to public goods (like sanitation) as well as personal income
Non-monetary as well as monetary components
Changes over time as well as snapshots
Potential as well as current and actual poverty
Stocks or resources people have access to as well as flows of income
Outputs and how well people are able to participate as well as the “inputs” of their
income
Relative requirements and not just absolute requirements
Subjective measures (how people experience their situation) in addition to
objective data.
In the development sector, subjective considerations – that is, how people describe or
evaluate their own situations – have been added to the objective measures of poverty (for
example see UN-DESA 2009). In this report we focus on the dynamics of poverty and
access to water and sanitation services in particular, including some subjective
information and experiential data from the semi-structured interviews with low income
households. However this report does not attempt to engage with questions of self-
perception, so it is important to note that these indicators form just one part of the picture
in terms of both the characteristics and experience of poverty (and beyond that to issues
of vulnerability and adaptation).
INSTITUTE FOR SUSTAINABLE FUTURES MARCH 2012
POVERTY DIMENSIONS OF WATER, SANITATION AND CLIMATE VULNERABILITY IN CAN THO 8
One of the more comprehensive and established frameworks currently deployed in
development analysis that goes beyond income measures of poverty is the
Multidimensional Poverty Index (MPI), which is now used in the UNDP Human
Development Report. The MPI takes into account multiple dimensions of deprivation
including those relating to education, health and living conditions. It provides a framework
for measuring both the incidence and intensity of deprivation, with intensity defined as the
number of deprivations experienced at the same time. The MPI provides an international
benchmark against which to assess the situation in Vietnam nationally.
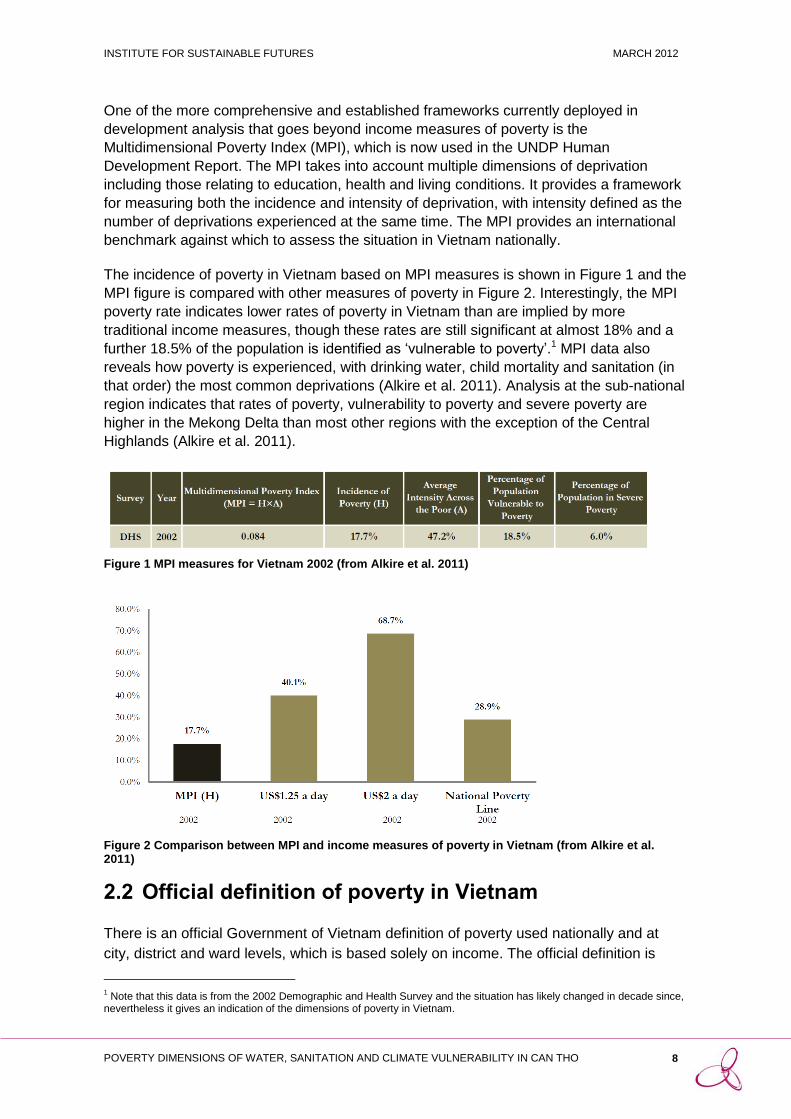
The incidence of poverty in Vietnam based on MPI measures is shown in Figure 1 and the
MPI figure is compared with other measures of poverty in Figure 2. Interestingly, the MPI
poverty rate indicates lower rates of poverty in Vietnam than are implied by more
traditional income measures, though these rates are still significant at almost 18% and a
further 18.5% of the population is identified as „vulnerable to poverty‟.1 MPI data also
reveals how poverty is experienced, with drinking water, child mortality and sanitation (in
that order) the most common deprivations (Alkire et al. 2011). Analysis at the sub-national
region indicates that rates of poverty, vulnerability to poverty and severe poverty are
higher in the Mekong Delta than most other regions with the exception of the Central
Highlands (Alkire et al. 2011).
Figure 1 MPI measures for Vietnam 2002 (from Alkire et al. 2011)
Figure 2 Comparison between MPI and income measures of poverty in Vietnam (from Alkire et al. 2011)
2.2 Official definition of poverty in Vietnam
There is an official Government of Vietnam definition of poverty used nationally and at
city, district and ward levels, which is based solely on income. The official definition is
1 Note that this data is from the 2002 Demographic and Health Survey and the situation has likely changed in decade since,
nevertheless it gives an indication of the dimensions of poverty in Vietnam.

INSTITUTE FOR SUSTAINABLE FUTURES MARCH 2012
POVERTY DIMENSIONS OF WATER, SANITATION AND CLIMATE VULNERABILITY IN CAN THO 9
used in the collection and reporting of poverty by the national Ministry of Labour and
Social Affairs and at the city level in Can Tho by the Department of Labour and Social
Affairs (DoLISA). Although based solely on income, the official definition of poverty is a
relative measure (as discussed previously) in that there are different income levels used
for urban and rural areas (incorporating the notion that there are different requirements for
living in these areas) and the income thresholds for defining poverty are revised upward
every five years.
The current definition derives from Decision 09/2011 of the Prime Minister (30 January
2011). For the period 2011–2015, in urban areas, households are defined as poor if the
average household income is equal to or less than 500,000 VND/person/month
(equivalent to around US$25.6/person/month, less than 1 USD per day). The official
definition also incorporates the notions of the importance of the potential for poverty in
addition to the current situation. The Decision establishes a category of households that
are „close to poor‟, with an income threshold in urban areas for this group of 501,000-
650,000 VND/person/month (which translates to US$25.6 to $33.3 at the exchange rates
current in 2011).
Based on the official definition of poverty, households can apply to register as poor with
the local authorities. If successful in their application, they receive a registration card that
entitles them to a range of benefits including lower fees for services (including water, see
below) and reduced cost health care. Households just above the poverty line are not
eligible for these benefits.
The linking of official poverty data to registration and associated benefits means that
poverty figures across data sources should be viewed with some caution. The situation
for registered poor households can change with a re-definition of income thresholds
(which happens every five years), or a small increase in income. This can create
confusion and concern for households reliant on benefits related to their registration, and
it is an incentive to under-report income.

INSTITUTE FOR SUSTAINABLE FUTURES MARCH 2012
POVERTY DIMENSIONS OF WATER, SANITATION AND CLIMATE VULNERABILITY IN CAN THO 10
3 Approach
The study of poorer households reported here is derived from four major sources. There
are two sources of official data from existing Vietnamese Government information: poverty
data from DoLISA for the period 2006–2010 and census data from 2009.The third is data
from a survey of 1,200 households undertaken by Can Tho University (CTU) as part of the
CSIRO/CTU/ISF study in 2011 (referred to in this report as the survey). The fourth is a
series of semi-structured interviews with a 23 poor households in O Mon and Thot Not
districts (termed the interviews in the subsequent sections of this report). Below we
provide descriptions of the methodological approaches taken for each source.
3.1 Vietnamese government data
Data from the Can Tho Department of Labour, Invalids and Social Affairs (DoLISA) was
available for households officially defined as poor under current Vietnamese government
income thresholds and includes a number of other aspects of the living conditions of the
poor such as access to water. This was made available by district from 2006–2010.
Census data for 2009 was also available, which provides basic demographic information
by district including a breakdown of dwelling types from permanent to simple. Both
datasets were collated and measures considered relevant for exploring poverty (as
discussed above) were identified. These ranged from income poverty through to access to
resources and housing structure.
The DoLISA data makes it possible to assess the characteristics of poor households as a
distinct group. With reference to areas explored in the survey and interviews as well as
initial findings from both, relevant dimensions available from DoLISA data were extracted
to enable closer examination of the situation specific to poor households. These
dimensions include access to water, ethnicity, people with a disability and housing
structure. Available data was collated in tables and charts to facilitate assessment of the
situation overall and recent trends for each district; for urban districts as a group; and for
the whole of Can Tho.
3.2 Survey
A survey of 1200 households across 24 wards in Can Tho‟s five urban districts was
undertaken during April and May 2011. The survey forms part of the „climate adaptation
through sustainable urban development study‟. Questions were drafted by CSIRO and ISF
in collaboration with Can Tho University and translated into Vietnamese. The survey was
undertaken by a team of 22 CTU staff. Topics explored include basic demographic and
socio-economic information, household water and sanitation practices, attitudes to water
services and perceptions around water quality and threats such as flooding. A full
description and analysis of the survey will be available in Neumann et al. (in preparation).

INSTITUTE FOR SUSTAINABLE FUTURES MARCH 2012
POVERTY DIMENSIONS OF WATER, SANITATION AND CLIMATE VULNERABILITY IN CAN THO 11
We aimed explore the situation specifically for lower income households included in the
survey sample, and intended to use the survey to obtain a more comprehensive picture of
the situation and experience of low income households. This presented two challenges:
the first was that we wanted to have some comparability with the DoLISA data on poor
households, so we had to generate data consistent with the income thresholds used in the
official definition of poverty. Secondly, we were aware that reported income is typically
problematic in Vietnam for a range of reasons:
People under-report income for fear of losing benefits due to their low income
status.
Only formal income is reported, which creates a skewed picture if informal sources
are significant (as they are extensively in Vietnam).
People may not track monthly income or it may be highly variable month to month
(as is the case with many poorer households) and therefore difficult to calculate.
Given these limitations, a variety of other measures from the survey were also initially
investigated as potential indirect or composite measures for poverty and vulnerability
using survey data, including education and dwelling structure. All these measures provide
some further insight into the poverty dynamics of Can Tho. However, like income, when
considered in isolation they are problematic. We chose to use income as the primary
measure despite its limitations because: (a) the available research evidence indicates that
it correlates with other aspects of poverty such as health indicators that are relevant in
determining social vulnerability (Glewwe & van der Gaag 1990, cited in Adger 1999); and
(b) it provides comparability across different contexts and over time, so it provides a
helpful baseline for further subsequent investigation (Adger 1999).
In order to isolate a sub-sample of poor households comparable with DoLISA data, but to
also acknowledge the importance of other, imperfectly correlated, variables, we therefore
applied criteria combining income levels and level of education (primary or junior
secondary). This process identified 523 households who could be classified as poor. For
these households we then undertook sensitivity analysis to assess the appropriateness of
our classification. The survey analysis of poor households therefore focuses on this sub-
sample of 523, and uses income as the primary variable in the assessment.
3.3 Qualitative empirical study
Semi-structured interviews were conducted over two days in October 2011 in O Mon and
Thot Not districts. A total of 23 interviews took place including 11 in O Mon (Chau Van
Liem ward) and 12 in Thot Not (Thoi Thuan and Thuan An wards). These districts were
selected because DoLISA official data indicated that the level of poverty amongst
households was relatively high compared with other urban districts in the city, and a
consideration in the selection of wards was that they be close to waterways. Chau Van
Liem in particular was selected because it had been identified as a potential „hot spot‟ in
the stakeholder workshop conducted in an earlier phase of this research project and initial
analysis of survey data suggested a relatively high level of water related health issues.
INSTITUTE FOR SUSTAINABLE FUTURES MARCH 2012
POVERTY DIMENSIONS OF WATER, SANITATION AND CLIMATE VULNERABILITY IN CAN THO 12
The interview team comprised Ms Naomi Carrard (ISF), Mr Do Xuan Thuy (consultant), Mr
Trinh Cong Doan (Can Tho Water Supply and Sewerage Company) and Mr Vo Quoc
Thanh (CTU). The sample of poor households was selected by the District People‟s
Committee in O Mon and the district water company in Thot Not based on local
knowledge about the relative wealth of different wards and the location of poorer
communities. Interviews were conducted in Vietnamese with two interviewers at each
household. Local officials were present during most interviews. Care was taken to ensure
consistency of approach between pairs of interviewers and to support development of
interview skills across the team. At the end of each day notes were compared. Any
discrepancies or points of confusion were noted, discussed and clarified where possible.
Interview questions covered:
Demographic and socio-economic information.
Access to water and sanitation facilities.
Relationships around water and sanitation services including relationships with any
service providers.
Perceptions about the local environment and climate change impacts.
Perceptions about social vulnerability and resilience.
The question guide used during interviews is provided in Annex 1. Data from interviews
was summarised and coded using the Dedoose qualitative data analysis web application
(dedoose.com).
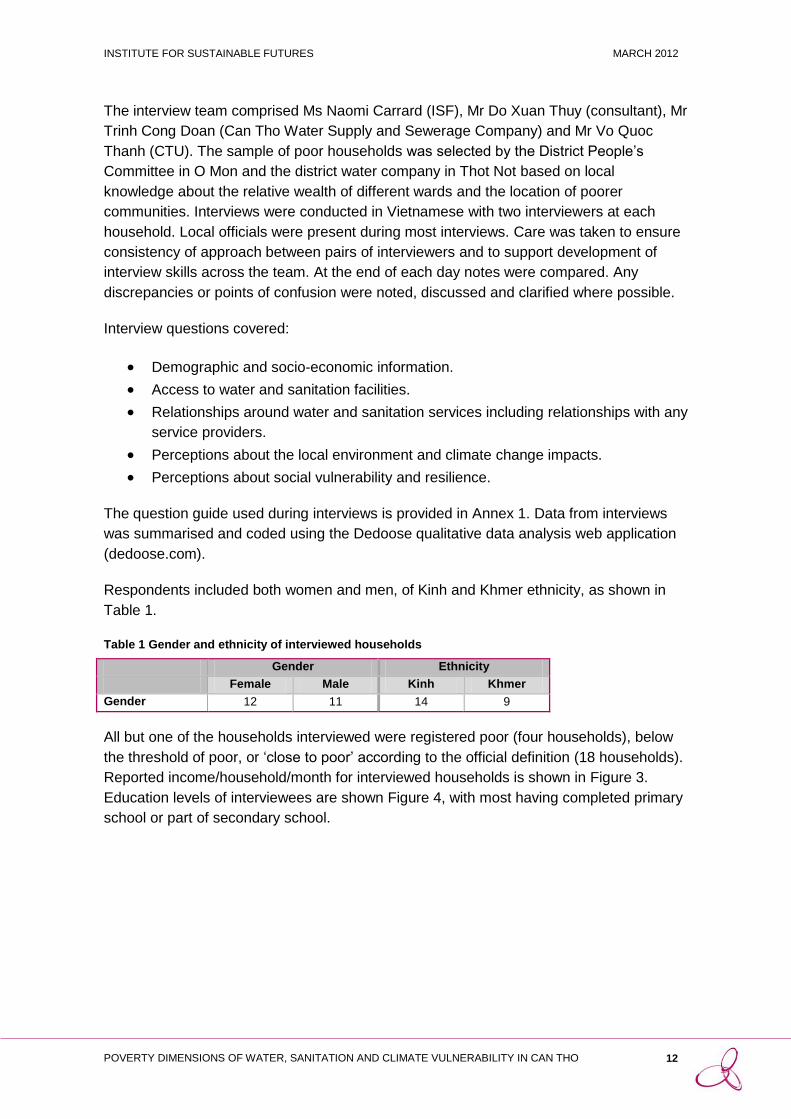
Respondents included both women and men, of Kinh and Khmer ethnicity, as shown in
Table 1.
Table 1 Gender and ethnicity of interviewed households
Gender Ethnicity
Female Male Kinh Khmer
Gender 12 11 14 9
All but one of the households interviewed were registered poor (four households), below
the threshold of poor, or „close to poor‟ according to the official definition (18 households).
Reported income/household/month for interviewed households is shown in Figure 3.
Education levels of interviewees are shown Figure 4, with most having completed primary
school or part of secondary school.

INSTITUTE FOR SUSTAINABLE FUTURES MARCH 2012
POVERTY DIMENSIONS OF WATER, SANITATION AND CLIMATE VULNERABILITY IN CAN THO 13
Figure 3 Household income VND/month
Figure 4 Education levels of interviewees
0 2 4 6 8 10 12
<1
1-2.5
2.5-4
4-10
>10
Unclear
Income (million VND/month)
0 2 4 6 8
No school
Part of primary school
Completed primary school
Part of secondary school
Completed secondary school
University educated
Education

INSTITUTE FOR SUSTAINABLE FUTURES MARCH 2012
POVERTY DIMENSIONS OF WATER, SANITATION AND CLIMATE VULNERABILITY IN CAN THO 14
4 Findings and implications
4.1 Poverty dynamics in Can Tho
4.1.1 Poverty in Can Tho
Overall poverty levels
In 2005 the overall rate of poverty in Can Tho was 10.46% according to official DoLISA
statistics, which is higher than for other comparable cities of the same classification (ISF-
UTS 2007). For example, Danang has a poverty rate of 4.78% of households and
Haiphong a rate of 10.26% (ISF-UTS 2007). Table 2 and Figure 5 indicate the rates of
poverty in Can Tho from 2006–2010. Overall for Can Tho the incidence of poverty fell
from 10% to 6% between 2006 and 2010.
While the poverty rates in all districts have fallen since 2005–06, there is still a significant
disparity between them. Only 1% of households in Ninh Kieu are living below the official
poverty level, but in the urban districts in O Mon 8% of households were living in poverty
in 2010.
Table 2 Rates of poverty by district in Can Tho 2006-2010 (source: DoLISA)
District 2006 2007 2008 2009 2010
Ninh Kieu 2% 2% 2% 2% 1%
Binh Thuy 8% 7% 6% 5% 3%
Cai Rang 10% 9% 8% 7% 5%
O Mon 15% 13% 13% 11% 8%
Thot Not 10% 8% 7% 6% 5%
Co Do 17% 15% 14% 12% 12%
Phong Dien 10% 9% 7% 6% 4%
Vinh Thanh 14% 14% 14% 9% 7%
Tho Lai 11% 9%
Total Can Tho 10% 9% 8% 7% 6%

INSTITUTE FOR SUSTAINABLE FUTURES MARCH 2012
POVERTY DIMENSIONS OF WATER, SANITATION AND CLIMATE VULNERABILITY IN CAN THO 15
Figure 5 Rates of poverty in Can Tho 2006-2010 (source: DoLISA)
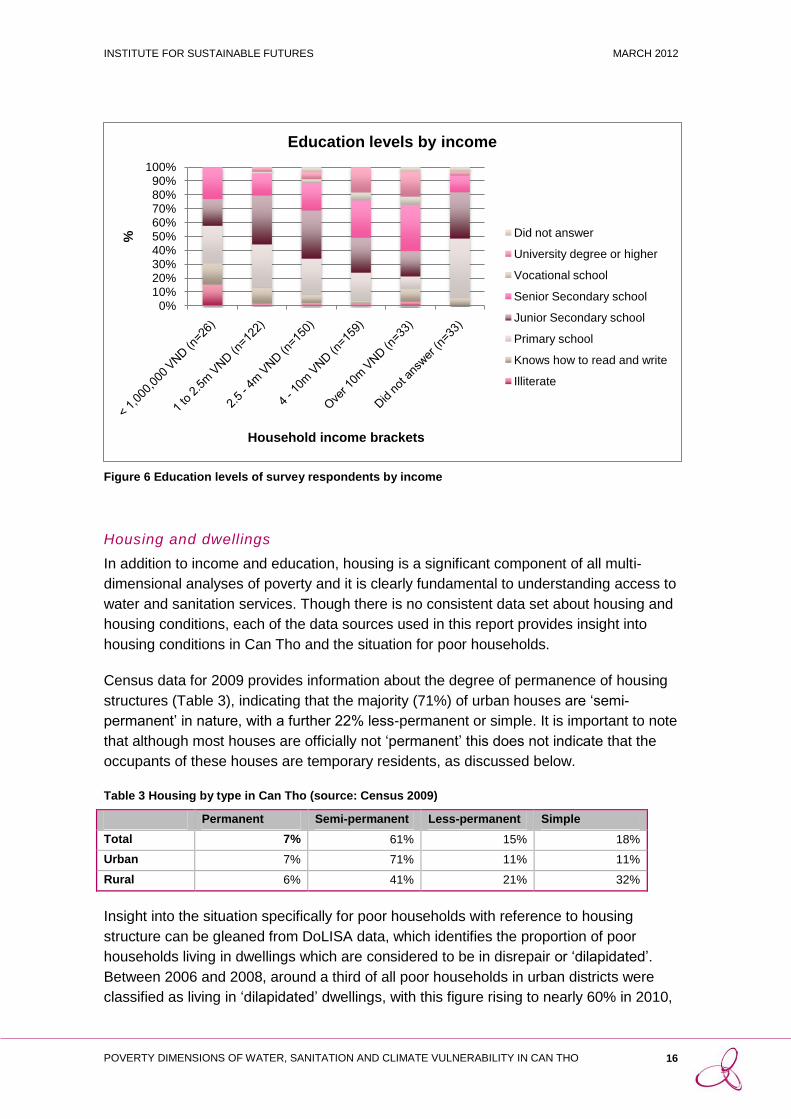
Poverty and education
Survey data provides information about the relationship between education level and
income, indicating that even within the subset of households identified as „poor‟ based on
income, respondents from households with higher total incomes are more likely to have
achieved higher education levels. For each income bracket, Figure 6 shows the proportion
of respondents in each education level. In the two lower household income brackets the
proportion of heads of households with an education level of primary school or lower is
40–50%. University education and vocation school do not appear at all in the lowest
income category. This is in contrast to the upper two levels of household income where
more than 50% of respondents have an education level of senior secondary school or
higher.
0%
2%
4%
6%
8%
10%
12%
2006 2007 2008 2009 2010
% of Can Tho households considered poor
INSTITUTE FOR SUSTAINABLE FUTURES MARCH 2012
POVERTY DIMENSIONS OF WATER, SANITATION AND CLIMATE VULNERABILITY IN CAN THO 16
Figure 6 Education levels of survey respondents by income
Housing and dwellings
In addition to income and education, housing is a significant component of all multi-
dimensional analyses of poverty and it is clearly fundamental to understanding access to
water and sanitation services. Though there is no consistent data set about housing and
housing conditions, each of the data sources used in this report provides insight into
housing conditions in Can Tho and the situation for poor households.
Census data for 2009 provides information about the degree of permanence of housing
structures (Table 3), indicating that the majority (71%) of urban houses are „semi-
permanent‟ in nature, with a further 22% less-permanent or simple. It is important to note
that although most houses are officially not „permanent‟ this does not indicate that the
occupants of these houses are temporary residents, as discussed below.
Table 3 Housing by type in Can Tho (source: Census 2009)
Permanent Semi-permanent Less-permanent Simple
Total 7% 61% 15% 18%
Urban 7% 71% 11% 11%
Rural 6% 41% 21% 32%
Insight into the situation specifically for poor households with reference to housing
structure can be gleaned from DoLISA data, which identifies the proportion of poor
households living in dwellings which are considered to be in disrepair or „dilapidated‟.
Between 2006 and 2008, around a third of all poor households in urban districts were
classified as living in „dilapidated‟ dwellings, with this figure rising to nearly 60% in 2010,
0%10%20%30%40%50%60%70%80%90%
100%
%
Household income brackets
Education levels by income
Did not answer
University degree or higher
Vocational school
Senior Secondary school
Junior Secondary school
Primary school
Knows how to read and write
Illiterate
INSTITUTE FOR SUSTAINABLE FUTURES MARCH 2012
POVERTY DIMENSIONS OF WATER, SANITATION AND CLIMATE VULNERABILITY IN CAN THO 17
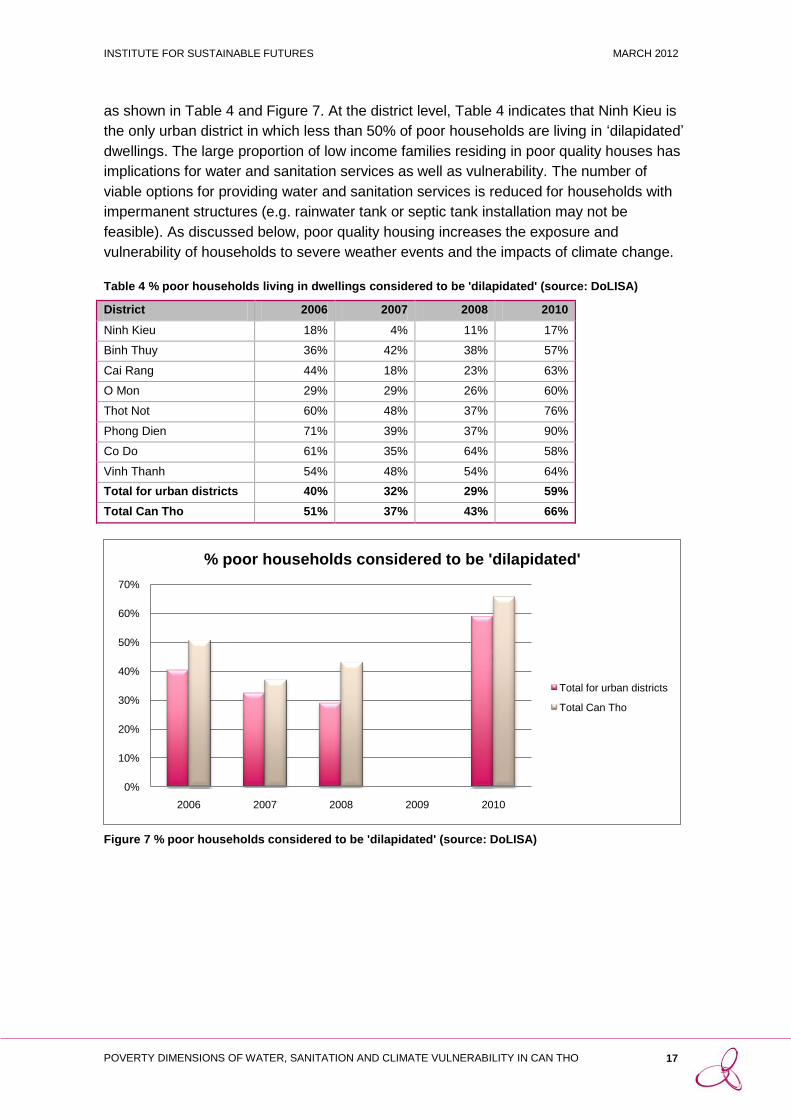
as shown in Table 4 and Figure 7. At the district level, Table 4 indicates that Ninh Kieu is
the only urban district in which less than 50% of poor households are living in „dilapidated‟
dwellings. The large proportion of low income families residing in poor quality houses has
implications for water and sanitation services as well as vulnerability. The number of
viable options for providing water and sanitation services is reduced for households with
impermanent structures (e.g. rainwater tank or septic tank installation may not be
feasible). As discussed below, poor quality housing increases the exposure and
vulnerability of households to severe weather events and the impacts of climate change.
Table 4 % poor households living in dwellings considered to be 'dilapidated' (source: DoLISA)
District 2006 2007 2008 2010
Ninh Kieu 18% 4% 11% 17%
Binh Thuy 36% 42% 38% 57%
Cai Rang 44% 18% 23% 63%
O Mon 29% 29% 26% 60%
Thot Not 60% 48% 37% 76%
Phong Dien 71% 39% 37% 90%
Co Do 61% 35% 64% 58%
Vinh Thanh 54% 48% 54% 64%
Total for urban districts 40% 32% 29% 59%
Total Can Tho 51% 37% 43% 66%
Figure 7 % poor households considered to be 'dilapidated' (source: DoLISA)
0%
10%
20%
30%
40%
50%
60%
70%
2006 2007 2008 2009 2010
% poor households considered to be 'dilapidated'
Total for urban districts
Total Can Tho
INSTITUTE FOR SUSTAINABLE FUTURES MARCH 2012
POVERTY DIMENSIONS OF WATER, SANITATION AND CLIMATE VULNERABILITY IN CAN THO 18
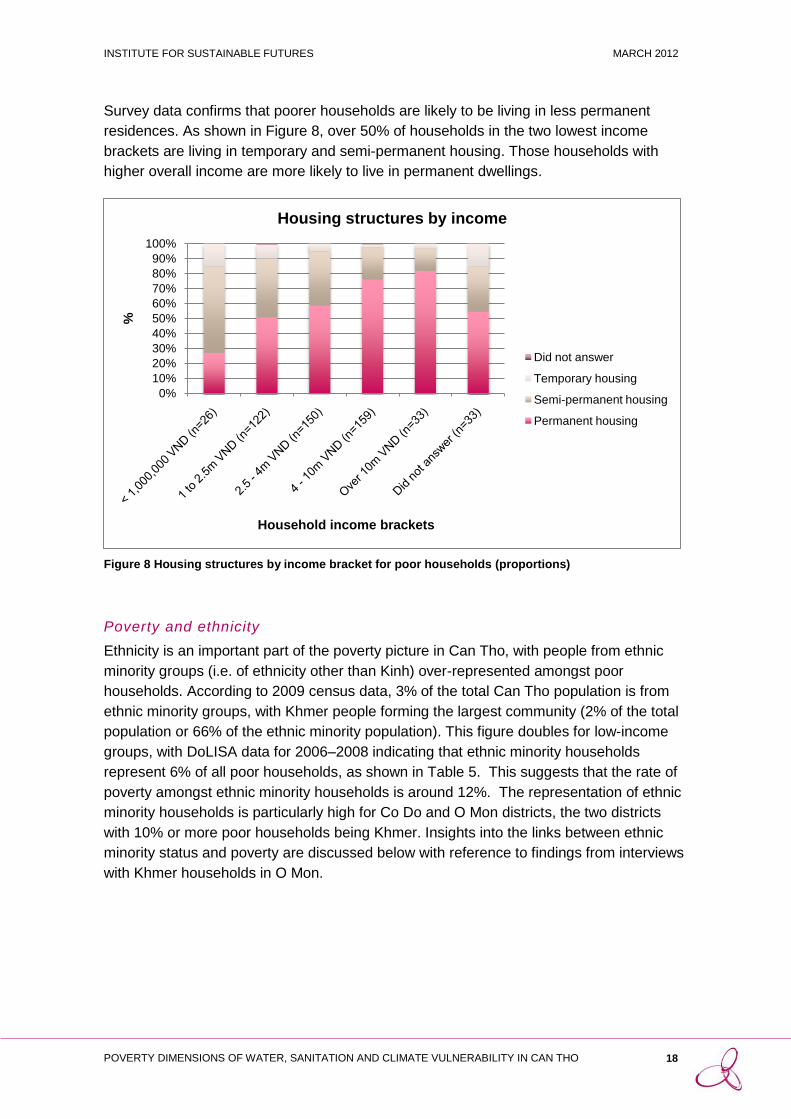
Survey data confirms that poorer households are likely to be living in less permanent
residences. As shown in Figure 8, over 50% of households in the two lowest income
brackets are living in temporary and semi-permanent housing. Those households with
higher overall income are more likely to live in permanent dwellings.
Figure 8 Housing structures by income bracket for poor households (proportions)
Poverty and ethnicity
Ethnicity is an important part of the poverty picture in Can Tho, with people from ethnic
minority groups (i.e. of ethnicity other than Kinh) over-represented amongst poor
households. According to 2009 census data, 3% of the total Can Tho population is from
ethnic minority groups, with Khmer people forming the largest community (2% of the total
population or 66% of the ethnic minority population). This figure doubles for low-income
groups, with DoLISA data for 2006–2008 indicating that ethnic minority households
represent 6% of all poor households, as shown in Table 5. This suggests that the rate of
poverty amongst ethnic minority households is around 12%. The representation of ethnic
minority households is particularly high for Co Do and O Mon districts, the two districts
with 10% or more poor households being Khmer. Insights into the links between ethnic
minority status and poverty are discussed below with reference to findings from interviews
with Khmer households in O Mon.
0%
10%
20%
30%
40%
50%
60%
70%
80%
90%
100%
%
Household income brackets
Housing structures by income
Did not answer
Temporary housing
Semi-permanent housing
Permanent housing

INSTITUTE FOR SUSTAINABLE FUTURES MARCH 2012
POVERTY DIMENSIONS OF WATER, SANITATION AND CLIMATE VULNERABILITY IN CAN THO 19
Table 5 Ethnic minority households as % of poor households (source: DoLISA)
District 2006 2007 2008
Ninh Kieu 4.89% 5.53% 5.08%
Binh Thuy 1.05% 1.30% 1.88%
Cai Rang 0.84% 1.31% 1.40%
O Mon 10.48% 10.55% 9.77%
Thot Not 1.04% 1.14% 1.36%
Phong Dien 1.28% 1.83% 2.34%
Co Do 12.98% 12.47% 13.13%
Vinh Thanh 1.59% 1.97% 2.54%
Total for urban districts 4.43% 4.87% 4.62%
Total Can Tho 5.68% 5.92% 5.98%
The experience of poverty: livelihoods, access to resources and stress
Interview data provides qualitative insights into the characteristics of poor households and
how poverty is experienced in terms of livelihood, access to resources and stress. From
interviews, it is possible to identify common characteristics of poor households and the
experience of being poor.
For poor households, sources of income are typically seasonal, sporadic and unreliable.
Typical responses from interviewees asked about their work included “my job is irregular”
or “my work is not continuous”. Interviewees earn income from employment as rice
porters, labourers, construction workers, bicycle taxi drivers or from micro-businesses
such as selling small groceries, lottery tickets or handicrafts. It is typical for households to
pursue multiple sources of income to cope with the unreliability of any one job. For
example one interviewee worked as a bicycle taxi driver as well as serving coffee and also
selling ornamental fish.
Most households reported experiencing stress related to their situation as low income
households. Stress came from many directions, including health, income, food, education,
ability to cope with flooding and overall quality of life. As one interviewee shared:
Sometimes we feel stressed about meals, to cope with these times we have credit/debt
from the grocery store.
Another said:
We have quite a lot of difficulty in our life … We can get a loan from a loan shark if we
need it but it has high interest of 20% per month.
Most households interviewed experience illness that can be attributed to a lack of basic
services or to poor housing, with one respondent noting:
Sickness is normal for poor people.
While many were able to seek no-cost treatment at local hospitals, some expressed
concerns about their ability to afford necessary medications. One man (shown in Figure 9

INSTITUTE FOR SUSTAINABLE FUTURES MARCH 2012
POVERTY DIMENSIONS OF WATER, SANITATION AND CLIMATE VULNERABILITY IN CAN THO 20
below) was largely confined to his bed, and relied on handouts from the local hospital for
basic food.
Figure 9 Elderly man in O Mon
The majority of households interviewed lived over or near to waterways, with some
occupying very marginal land that had been provided by relatives. Houses in these
locations are very vulnerable to flooding and to changes in local environmental conditions.
This is discussed further below with reference to social vulnerability.
The household structures of interviewees were observed by the interview team, with most
classified as „semi-permanent‟. However the definition was difficult to apply – many
houses were mixed in their construction, for example some had a tiled and/or cement floor
with rusted corrugated iron roof, or no floor with at least one solid wall. More insight can
be gleaned from the length of time families had been living in the dwelling. Most
respondents had lived in the same dwelling for more than 20 years or an unspecified „very
long time‟, indicating permanence of dwelling in situations where the structures
themselves are at best semi-permanent or at worst very temporary with incomplete walls,
roofs and floors (such as those shown in Figure 10, where residents had been living for
many years).
Figure 10 Typical dwelling structures for interviewed households

INSTITUTE FOR SUSTAINABLE FUTURES MARCH 2012
POVERTY DIMENSIONS OF WATER, SANITATION AND CLIMATE VULNERABILITY IN CAN THO 21
Of the 23 households interviewed, nine were Khmer and 14 were Kinh. As noted above,
ethnic minority groups (of which Khmer people form a significant proportion) are over-
represented within the total number of poor households in Can Tho. Responses across
Khmer and Kinh households revealed similar challenges related to the experience and
impacts of poverty.
4.2 Access to infrastructure and water related behaviour
4.2.1 Poor households and access to water
Data from DoLISA, the CSIRO/CTU survey and interviews indicate variable access
amongst poorer households to water and sanitation services. Table 6 shows official data
(DoLISA, 2010) indicating the proportion of households classified as poor that are without
access to „clean‟ water (with the measure of „clean‟ not defined in the available dataset).
For the urban districts, 27% of poor households were without access to „clean‟ water in
2008. The rate differs significantly between districts, with only 2% of poor households in
Ninh Kieu lacking access compared with 30–40% in other urban districts. With the
exception of Ninh Kieu, the rate of poor households without access to clean water is
significantly higher than the figure for the total urban population of Can Tho City. Recent
Can Tho Water Supply and Sewerage Company (WSSC) information indicates that in the
city overall 20% of urban residents are without access (Neumann et al. 2011). This implies
a correlation between poverty and lack of access to water in Can Tho that reflects global
findings (WHO/UNICEF 2010).
Table 6 Proportion of poor households without access to clean water (source: DoLISA)
District 2005 2006 2007 2008
Ninh Kieu 7% 7% 4% 2%
Binh Thuy 41% 39% 35% 40%
Cai Rang 77% 62% 42% 39%
O Mon 37% 29% 31% 37%
Thot Not 53% 45% 36% 32%
Phong Dien 65% 62% 37% 44%
Co Do 41% 43% 23% 40%
Vinh Thanh 60% 60% 39% 14%
Total for urban districts 38% 32% 27% 27%
Total Can Tho 49% 45% 32% 32%
Note: no data was available for 2009 and 2010
Survey data provides an additional source of information about access to water amongst
lower income households, and suggests that the access rates to clean water for poorer
households may be lower than indicated in the DoLISA data. To analyse the survey data
we used the WHO/UNICEF JMP definitions of „improved‟ water which include household
connections, public standpipes, boreholes, protected dug wells, protected springs and
rainwater collections. Figure 11 compares DoLISA data from 2005 (households without
access to „clean‟ water) with 2011 survey data (households without access to „improved‟
INSTITUTE FOR SUSTAINABLE FUTURES MARCH 2012
POVERTY DIMENSIONS OF WATER, SANITATION AND CLIMATE VULNERABILITY IN CAN THO 22
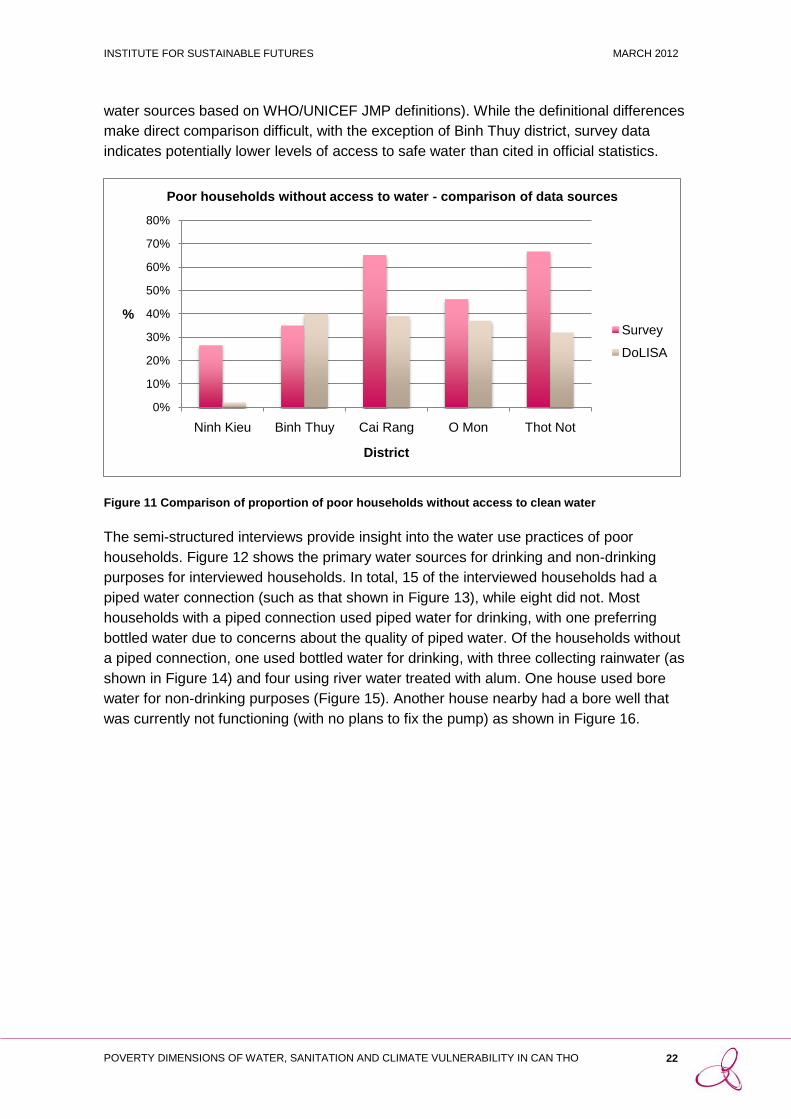
water sources based on WHO/UNICEF JMP definitions). While the definitional differences
make direct comparison difficult, with the exception of Binh Thuy district, survey data
indicates potentially lower levels of access to safe water than cited in official statistics.
Figure 11 Comparison of proportion of poor households without access to clean water
The semi-structured interviews provide insight into the water use practices of poor
households. Figure 12 shows the primary water sources for drinking and non-drinking
purposes for interviewed households. In total, 15 of the interviewed households had a
piped water connection (such as that shown in Figure 13), while eight did not. Most
households with a piped connection used piped water for drinking, with one preferring
bottled water due to concerns about the quality of piped water. Of the households without
a piped connection, one used bottled water for drinking, with three collecting rainwater (as
shown in Figure 14) and four using river water treated with alum. One house used bore
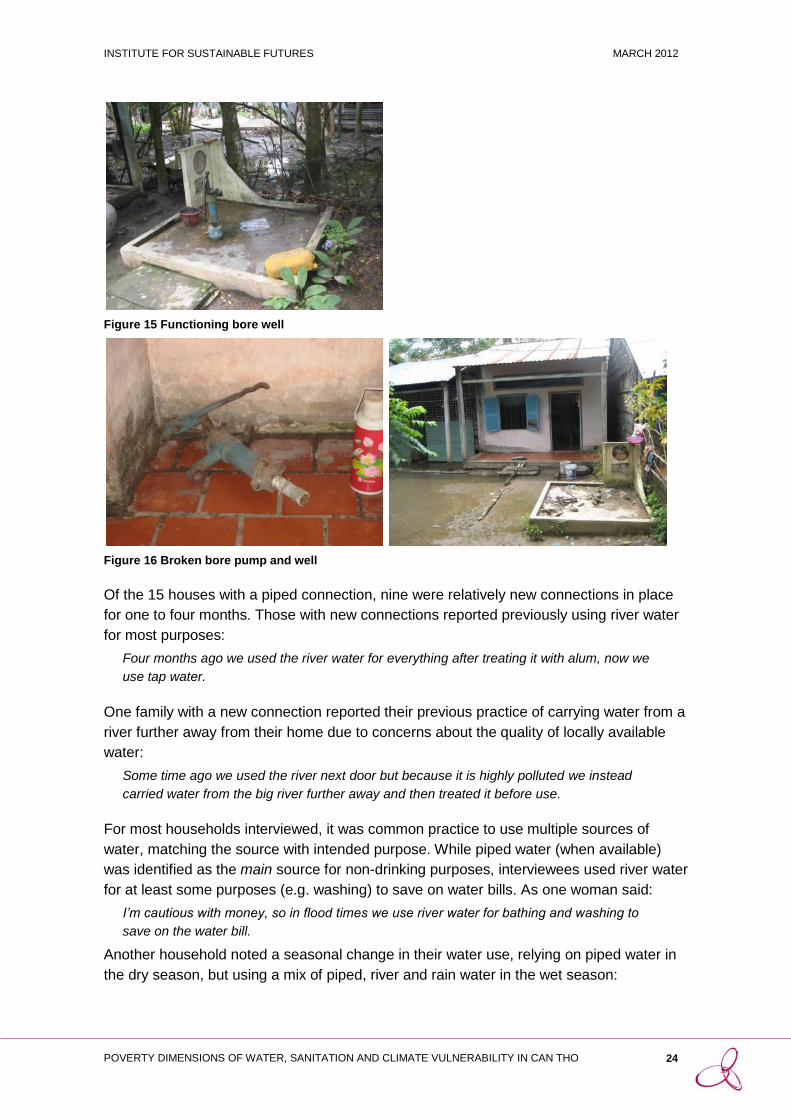
water for non-drinking purposes (Figure 15). Another house nearby had a bore well that
was currently not functioning (with no plans to fix the pump) as shown in Figure 16.
0%
10%
20%
30%
40%
50%
60%
70%
80%
Ninh Kieu Binh Thuy Cai Rang O Mon Thot Not
%
District
Poor households without access to water - comparison of data sources
Survey
DoLISA

INSTITUTE FOR SUSTAINABLE FUTURES MARCH 2012
POVERTY DIMENSIONS OF WATER, SANITATION AND CLIMATE VULNERABILITY IN CAN THO 23
Figure 12 Main source of water for drinking purposes
Figure 13 Piped water connection
Figure 14 Clay pots for collecting and storing rainwater
0 2 4 6 8 10 12 14 16
River water
Rainwater
Bore water
Piped water
Bottled water
Water use - primary source for drinking and other purposes
Drinking source Non-drinking source
INSTITUTE FOR SUSTAINABLE FUTURES MARCH 2012
POVERTY DIMENSIONS OF WATER, SANITATION AND CLIMATE VULNERABILITY IN CAN THO 24
Figure 15 Functioning bore well
Figure 16 Broken bore pump and well
Of the 15 houses with a piped connection, nine were relatively new connections in place
for one to four months. Those with new connections reported previously using river water
for most purposes:
Four months ago we used the river water for everything after treating it with alum, now we
use tap water.
One family with a new connection reported their previous practice of carrying water from a
river further away from their home due to concerns about the quality of locally available
water:
Some time ago we used the river next door but because it is highly polluted we instead
carried water from the big river further away and then treated it before use.
For most households interviewed, it was common practice to use multiple sources of
water, matching the source with intended purpose. While piped water (when available)
was identified as the main source for non-drinking purposes, interviewees used river water
for at least some purposes (e.g. washing) to save on water bills. As one woman said:
I’m cautious with money, so in flood times we use river water for bathing and washing to
save on the water bill.
Another household noted a seasonal change in their water use, relying on piped water in
the dry season, but using a mix of piped, river and rain water in the wet season:

INSTITUTE FOR SUSTAINABLE FUTURES MARCH 2012
POVERTY DIMENSIONS OF WATER, SANITATION AND CLIMATE VULNERABILITY IN CAN THO 25
River water in the wet season is okay, but in the dry season it’s too dirty. It’s black, we
can’t use it for anything. Then we use piped water for everything.
Responses to questions about the affordability of piped connections were mixed, and
given the small number of households with long established connections it is difficult to
draw conclusions. Monthly water bills for most households were between 3,000 and
20,000 VND, with one household where 16 people lived reporting an average monthly bill
of 70,000 VND. Four households interviewed were „card holding‟ poor (i.e. they fell below
the official poverty threshold and had received registration as such from the authorities)
and were eligible to receive a water meter free of charge and pay a reduced water tariff.
Others reported trying to minimise their piped water use by supplementing it with other
sources in order to reduce the overall cost (as described above), and some noted
difficulties in paying the bills, sometimes delaying payment for a month or more. One
household described prioritising paying for water over electricity as the electricity utility
offered more leeway before cutting service:
With electricity we can owe for two months without cut-off, but not for water, so we find a
way to pay the water bill.
Interviewees identified a link between water quality and health, with sickness most
commonly attributed to a decline in the quality of river water over time and particular
concerns about quality during low tide and the dry season. Illnesses reported included
stomach upsets and skin disorders.
4.2.2 Sanitation and wastewater services
It is important to consider two aspects of access when assessing sanitation and waste
water services. One is the facilities available in the household, and the other is the
management of waste produced. Survey data provides insight into sanitation facilities
within poor households, with most survey respondents using a flush toilet connected to a
septic tank. As with the analysis of water services, we used WHO/UNICEF JMP
definitions of „improved sanitation‟ as the basis for relating access to sanitation services to
income. Improved sanitation facilities include connection to public sewers, connection to
septic systems, pour-flush latrines, simple pit latrines and ventilated improved pit latrines.
Unimproved sanitation facilities include bucket latrines (where excreta is manually
removed), public latrines and open latrines. Using these definitions, of the 523 surveyed
households identified as poor, 423 used improved sanitation and 22 used unimproved
facilities (with the remaining 78 using multiple facilities or providing invalid answers). While
most households used improved facilities, the proportion of households using unimproved
facilities increased amongst those with lower incomes, as shown in Figure 17.

INSTITUTE FOR SUSTAINABLE FUTURES MARCH 2012
POVERTY DIMENSIONS OF WATER, SANITATION AND CLIMATE VULNERABILITY IN CAN THO 26
Figure 17 Households using ‘improved’ and ‘unimproved’ toilet facilities by income
The survey also asked respondents whether they used shared toilet facilities. Of the 523
poor households included in the survey, only 39 shared facilities. For those that did share
facilities, the numbers of people sharing one toilet ranged from 4 to 20 with an average of
11 people per toilet. Qualitative insight into the sanitation perceptions and practices of
households that did share toilet facilities is provided below with reference to interview
data, with most interviewed households using shared hanging fishpond toilets.
Beyond the household, there was a significant gap in service provision around wastewater
transportation, treatment and disposal. Across Vietnam, 77% of households in urban
areas use septic tanks to pre-treat blackwater and an estimated 96% of domestic
wastewater is untreated (beyond the household septic tank) and discharges directly into
local waterways (USAID and EAWAG 2010). In Can Tho, there is currently no wastewater
treatment, though a treatment facility to service the central Ninh Kieu district is under
construction. A 2009 survey in Ninh Kieu found that 95% of households had septic tanks
(with a 29% emptying rate) and 54% were connected to public sewers (GMBH 2009).
Survey data for households identified as poor indicated an even lower connection rate. Of
the 433 households that had toilets connected to septic tanks, only 34% (147 households)
had tanks connected to a drainage system.
DoLISA data for poor households in Can Tho includes a measure „no drainage‟. However
the definition of „no drainage‟ is unclear and the numbers of households classified as
having no drainage were very small (0–3%). These figures do not reflect other information
about rates of wastewater service in Can Tho, so they have been excluded from this
report.
Interview data provides insight into perceptions and questions of affordability around
sanitation for poor households. Of the 23 households interviewed, 21 used hanging
0%10%20%30%40%50%60%70%80%90%
100%
%
Household income brackets
Improved and unimproved toilet facilities by income
Multiple/Other/Invalid answer
Unimproved sanitation
Improved sanitation
INSTITUTE FOR SUSTAINABLE FUTURES MARCH 2012
POVERTY DIMENSIONS OF WATER, SANITATION AND CLIMATE VULNERABILITY IN CAN THO 27
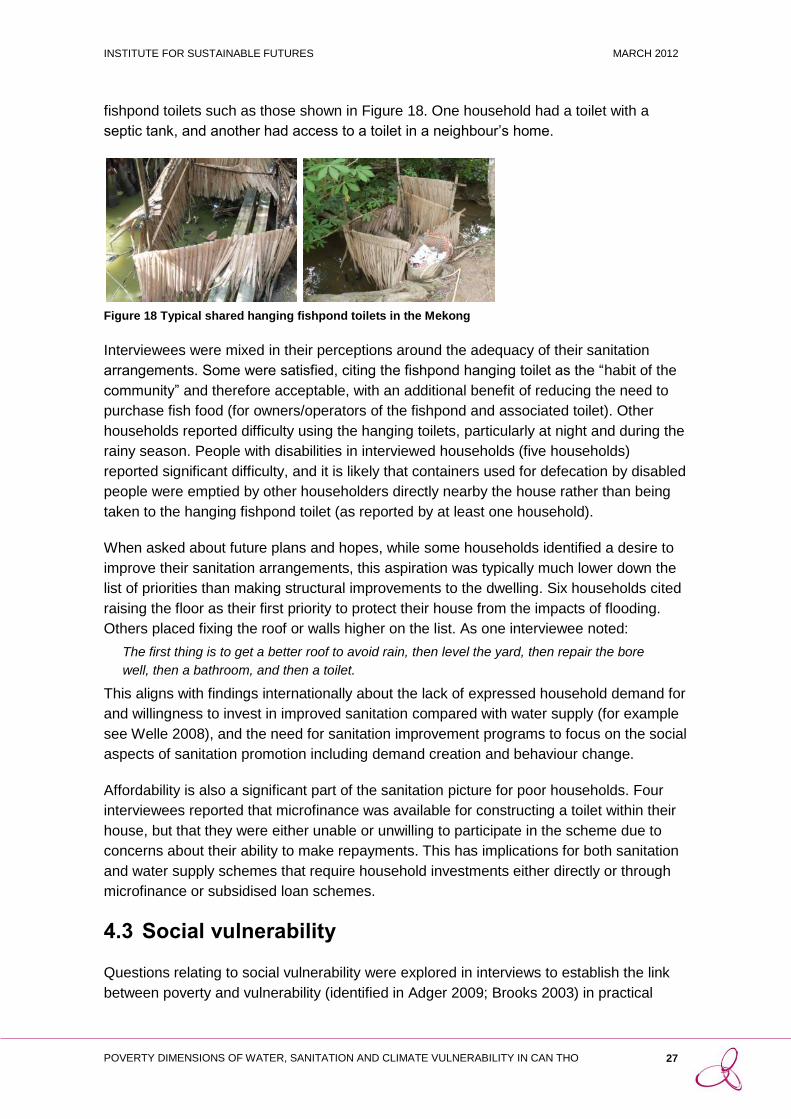
fishpond toilets such as those shown in Figure 18. One household had a toilet with a
septic tank, and another had access to a toilet in a neighbour‟s home.
Figure 18 Typical shared hanging fishpond toilets in the Mekong
Interviewees were mixed in their perceptions around the adequacy of their sanitation
arrangements. Some were satisfied, citing the fishpond hanging toilet as the “habit of the
community” and therefore acceptable, with an additional benefit of reducing the need to
purchase fish food (for owners/operators of the fishpond and associated toilet). Other
households reported difficulty using the hanging toilets, particularly at night and during the
rainy season. People with disabilities in interviewed households (five households)
reported significant difficulty, and it is likely that containers used for defecation by disabled
people were emptied by other householders directly nearby the house rather than being
taken to the hanging fishpond toilet (as reported by at least one household).
When asked about future plans and hopes, while some households identified a desire to
improve their sanitation arrangements, this aspiration was typically much lower down the
list of priorities than making structural improvements to the dwelling. Six households cited
raising the floor as their first priority to protect their house from the impacts of flooding.
Others placed fixing the roof or walls higher on the list. As one interviewee noted:
The first thing is to get a better roof to avoid rain, then level the yard, then repair the bore
well, then a bathroom, and then a toilet.
This aligns with findings internationally about the lack of expressed household demand for
and willingness to invest in improved sanitation compared with water supply (for example
see Welle 2008), and the need for sanitation improvement programs to focus on the social
aspects of sanitation promotion including demand creation and behaviour change.
Affordability is also a significant part of the sanitation picture for poor households. Four
interviewees reported that microfinance was available for constructing a toilet within their
house, but that they were either unable or unwilling to participate in the scheme due to
concerns about their ability to make repayments. This has implications for both sanitation
and water supply schemes that require household investments either directly or through
microfinance or subsidised loan schemes.
4.3 Social vulnerability
Questions relating to social vulnerability were explored in interviews to establish the link
between poverty and vulnerability (identified in Adger 2009; Brooks 2003) in practical
INSTITUTE FOR SUSTAINABLE FUTURES MARCH 2012
POVERTY DIMENSIONS OF WATER, SANITATION AND CLIMATE VULNERABILITY IN CAN THO 28
terms for Can Tho, and to determine the specific and contextual dynamics of vulnerability.
Interview data suggests that poor households are indeed highly vulnerable to the impacts
of climate change predicted for Can Tho, including an increased risk of flooding, a
reduction in the quality of surface water, changes in river flows and a more intense dry
season (Neumann et al. 2011). Key dynamics are location (typically on marginal land
proximate to waterways) and livelihood situations with respect to insecurity of
employment/income and resource dependency. These are explored below with reference
to insights from interviews.
4.3.1 Location and housing type
All households interviewed lived on relatively marginal land, commonly over or adjacent to
waterways. Many dwellings were not structurally sound, with temporary floors, roofs or
walls as described above. In some cases land had been given to the respondent‟s family
by relatives as the owners could not afford land elsewhere. A number of dwellings were
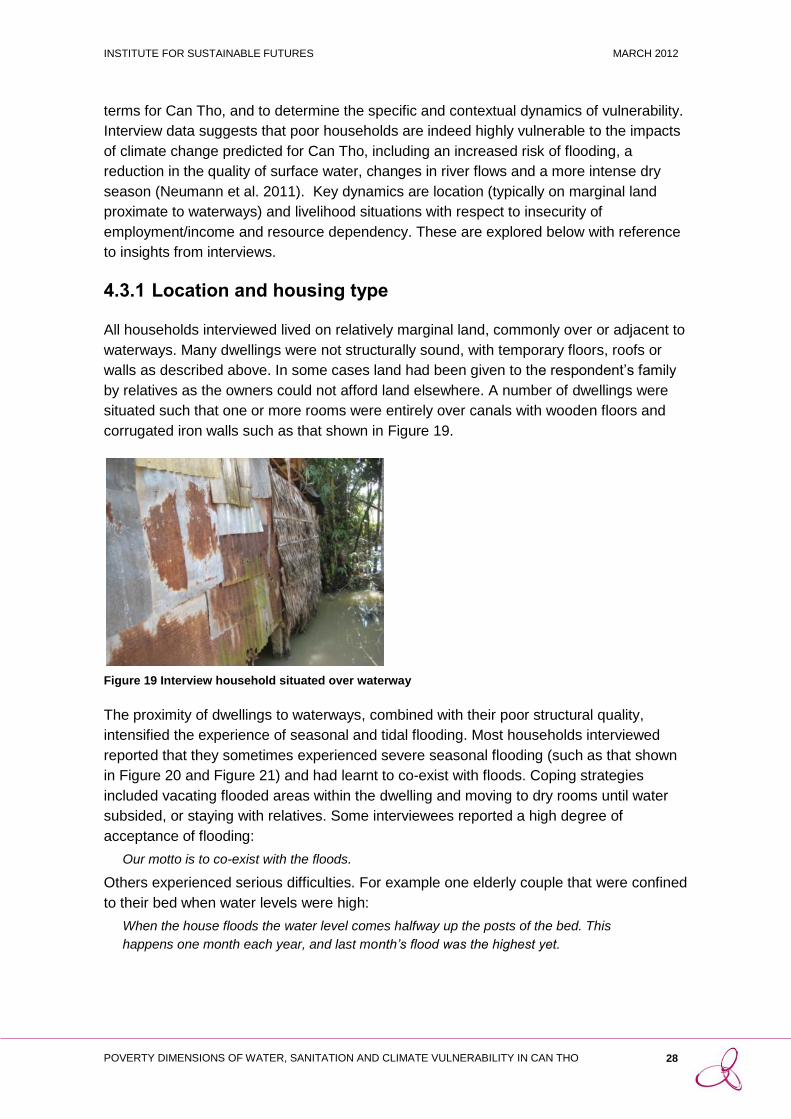
situated such that one or more rooms were entirely over canals with wooden floors and
corrugated iron walls such as that shown in Figure 19.
Figure 19 Interview household situated over waterway
The proximity of dwellings to waterways, combined with their poor structural quality,
intensified the experience of seasonal and tidal flooding. Most households interviewed
reported that they sometimes experienced severe seasonal flooding (such as that shown
in Figure 20 and Figure 21) and had learnt to co-exist with floods. Coping strategies
included vacating flooded areas within the dwelling and moving to dry rooms until water
subsided, or staying with relatives. Some interviewees reported a high degree of
acceptance of flooding:
Our motto is to co-exist with the floods.
Others experienced serious difficulties. For example one elderly couple that were confined
to their bed when water levels were high:
When the house floods the water level comes halfway up the posts of the bed. This
happens one month each year, and last month’s flood was the highest yet.

INSTITUTE FOR SUSTAINABLE FUTURES MARCH 2012
POVERTY DIMENSIONS OF WATER, SANITATION AND CLIMATE VULNERABILITY IN CAN THO 29
Figure 20 The backroom of a house, under approximately 30cm water
Figure 21 Due to flooding, the occupant of the blue house was staying with his brother next door at
the time of interview
When asked about the future impact of flooding, a number of households shared
aspirations to build up their floors as a barrier. Others were less focused on practical
responses, but shared concerns:
I don’t want to think about it, we sleep on the floor so better not to think about it.
The impacts of flooding reported in interviews included poor health (respiratory and skin
disorders), reduced mobility and loss of income. Those reliant on rice or fish industries for
employment in particular cited difficulties:
Since my son is a porter, during the flood season the warehouse stops working and then
he is unemployed.
The marginal location of households interviewed also meant that any changes in water
quality and local environmental conditions directly impacted on them. Many households
noted a decline in local environmental conditions, for example degraded water and river
environment quality or a decline in fish numbers:
The quality of the river water here has become poor compared with 15 years ago when
we moved here.
Some linked the decline in environmental quality to the prevalence of hanging fishpond
toilets, while others cited solid waste (littering) and industrial pollution as their main
concerns. As one interviewee stated:

INSTITUTE FOR SUSTAINABLE FUTURES MARCH 2012
POVERTY DIMENSIONS OF WATER, SANITATION AND CLIMATE VULNERABILITY IN CAN THO 30
The water here [that I live above] is connected to the fish pond where the toilet is, and it’s
quite dirty and smelly.
Interviewees observed that water quality is poorest at low tide and during the dry season.
For this reason, families with access to piped water that typically saved on bills by
supplementing piped water use with river water, sometimes relied solely on their piped
connection.
4.3.2 Livelihood insecurity and resource dependency
Almost all households interviewed experienced insecurity and stress related to their
sources of income. Many relied on multiple sources of income, taking work as the
opportunity arose but with no guarantee of regular or continued employment. As one
interviewee stated:
Life is difficult because of unemployment, my job depends on the flood and the
warehouse.
Jobs typical of households interviewed included porter (carrying rice), small scale vendor
(e.g. groceries, coffee/drinks or lottery tickets), construction worker or factory worker (e.g.
in a fish or rice processing factory). Some interviewees were unable to work at all due to
illness, disability or age, and these households relied on food and handouts from either
the government, the local temple (in the case of at least one Khmer household) or a
nearby hospital (for one elderly couple).
For both employment and also in some cases food, the majority of households
interviewed were either directly or indirectly dependent on local resources. High resource
dependency has been identified as a key indicator of social vulnerability, with households
dependent on the local environment more exposed to environmental changes and shocks
associated with climate change (Marshall et al. 2010).
Households directly dependent on local resources are those using surface water for some
or all purposes, eating locally caught or grown fish and vegetables and making use of
local resources for income generation (e.g. selling locally caught fish or basket weaving).
Of the households interviewed, eight supplemented their diet with locally caught fish from
paddy fields and the river. As one interviewee said:
My father traps eels and fish. We eat this quite a bit and also sell them for extra income.
We work hard to find this food, and also grow vegetables.
Indirectly resource dependent households are those where the primary sources of income
rely on the success of local crops or production (e.g. those working as rice porters or in a
fish or rice processing factory). These households experienced particular stress during
times of flood as described above.
Households that are either directly or indirectly dependent on local resources are
particularly vulnerable to the climate change impacts identified as likely for Can Tho. The
impacts of changes in water quality are particularly significant for households relying on
local waterways for some or all household water uses – including those without access to

INSTITUTE FOR SUSTAINABLE FUTURES MARCH 2012
POVERTY DIMENSIONS OF WATER, SANITATION AND CLIMATE VULNERABILITY IN CAN THO 31
piped water or those that can‟t afford to use piped water for all purposes. Changes in river
flows and water quality are likely to have a negative impact upon aquatic ecosystems,
which will affect households that rely on local fish for food and/or work in fish-related
industries. Any increase in the frequency or severity of floods poses particular risks for
those households already experiencing significant stress related to flooding in terms of
both household inundation and impacts on livelihood.

INSTITUTE FOR SUSTAINABLE FUTURES MARCH 2012
POVERTY DIMENSIONS OF WATER, SANITATION AND CLIMATE VULNERABILITY IN CAN THO 32
5 Conclusion and next steps
This research into the poverty dynamics of water, sanitation and climate vulnerability in
Can Tho identifies the specific situation for urban poor households in the city and
establishes that there is a significant relationship between poverty, access to basic
services and social vulnerability,
A significant proportion of urban households in Can Tho, particularly those living outside
Nin Kieu, can be considered poor based on measures of income and other dimensions
relating to living standards, including household structure and access to basic services
(water and sanitation). A particular focus on the poor and the relationship between poverty
and urban water systems in upcoming phases of the study is therefore key to ensuring the
relevance of the study for longer term policy and planning in Can Tho.
The findings from this study of poverty, water, sanitation and vulnerability are relevant to
the upcoming phases of the climate adaptation study including Activity 3 (climate-adapted
integrated urban water system analysis at the city scale) and Activity 4 (capability building
through development of alternative water service options for climate change adaptation in
a peri-urban or new development area).
In developing scenarios for Can Tho based on development trajectories and predicted
climate change impacts, a „poverty lens‟ can be applied to consider how alternative
scenarios might be experienced by the poor, and how they might respond.
A poverty lens can also be applied to the selection of a case study site and analysis of
service options at the case study scale. If the case study site is confirmed to be Chau Van
Liem ward in O Mon province as has been proposed, this would provide an opportunity to
build on data from interviews with poor households by undertaking complementary
analysis relating to possible infrastructure configurations, their affordability and the
behavioural dynamics that may affect the viability of alternative service options.
For example, dwelling structure needs to be taken into account when considering viable
service options, with a significant number of poor households living in structures that are
temporary, semi-permanent or in a state of disrepair. Similarly, water use practices and
perceptions gleaned from the qualitative study indicate that many households draw from
multiple sources and match water source to intended use. Decisions about what water
source to use are informed by what is available, what is affordable, and the observed or
perceived quality of different sources.
With reference to institutional analysis, different water service options and scenarios will
have specific implications for poorer households, and these will affect the policy
responses to potential options. Gaining insight into the current situation for poorer
households enables the examination of likely implications of different service options for
poor households so potential policy drivers and barriers related to water service scenarios
can be anticipated and predicted.

INSTITUTE FOR SUSTAINABLE FUTURES MARCH 2012
POVERTY DIMENSIONS OF WATER, SANITATION AND CLIMATE VULNERABILITY IN CAN THO 33
6 References
Adger, N. (1999) “Social Vulnerability to Climate Change and Extremes in Coastal
Vietnam”, World Development, 27(2), 249-269.
Alkire, Sabina; Jose Manuel Roche; Maria Emma Santos & Suman Seth (2011) Viet Nam
Country Briefing. Oxford Poverty & Human Development Initiative (OPHI)
Multidimensional Poverty Index Country Briefing Series, available at:
www.ophi.org.uk/policy/multidimensional-poverty-index/mpi-country-briefings/.
Brooks, N. (2003) Vulnerability, risk and adaptation: A conceptual framework, Tyndall
Centre for Climate Change Research Working Paper 38.
GMBH (2009) Survey report on household wastewater connections and septic tanks in Bac Ninh, Can Tho, Soc Trang, and Tra Vinh. Project GTZ TC No: 07.2023.5-001.00; Project Document No: AD 004, Edition 01. Hanoi, Vietnam: Ministry of Construction – Hanoi & Deutsche Gesellschaft für Technische Zusammenarbeit (GTZ).
ISF-UTS (2007) City Development Strategy for Can Tho, Vietnam: English Summary.
Prepared for the World Bank.
Kelly, P. M. and Adger, N. (2000) “Theory and Practice in Assessing Vulnerability to
Climate Change and Facilitating Adaptation”, Climatic Change, 47, 325-352.
Kuruppu, N. (2009) Confronting Climate Change and Variability: Enhancing the adaptive
capacity of water resource management in Kiribati, Environmental Change Institute,
Oxford, University of Oxford.
Marshall, N. A., Marshall, P. A., Tamelander, J., Obura, D., Malleret-King, D. and Cinner,
J. E. (2009) A Framework for Social Adaptation to Climate Change: Sustaining Tropical
Coastal Communities and Industries, Gland, IUCN.
Maxwell, S. (1999) “The Meaning and Measurement of Poverty” ODI Policy Briefing available at www.odi.org.uk/resources/docs/3095.pdf.
Neumann, L.E., Moglia, M., Cook, S., Nguyen, M., Sharma, A. and Nguyen, T. (2012, in
preparation) “Water use and Sanitation in Can Tho City: Challenges of Urbanisation in the
Mekong Delta”.
Neumann, L., Nguyen, M., Moglia, M., Cook, S., Lipkin, F. (2011) Urban Water Systems in
Can Tho, Vietnam: Understanding the current context for climate change adaption,
AusAID-CSIRO Research & Development Alliance Project, Climate Adaptation through
Sustainable Urban Development Case study on Urban Water Systems in Can Tho,
Vietnam.
UN-DESA (2009) Rethinking Poverty: Report on the World Social Situation 2010, United
Nations Department of Economic and Social Affairs, Social Policy and Development
Division, available at www.un.org/esa/socdev/rwss/docs/2010/fullreport.pdf.
USAID and EAWAG (2010) A Rapid Assessment of Septage Management in Asia:
Policies and Practices in India, Indonesia, Malaysia, the Philippines, Sri Lanka, Thailand,

INSTITUTE FOR SUSTAINABLE FUTURES MARCH 2012
POVERTY DIMENSIONS OF WATER, SANITATION AND CLIMATE VULNERABILITY IN CAN THO 34
and Vietnam, report by USAID and the Swiss Federal Institute of Aquatic Science and
Technology, available at www.waterlinks.org/septage-report.
Welle, K. (2008) Improving the provision of basic services for the poor in fragile
environments: Water Supply, Sanitation and Hygiene International Literature Review,
report prepared by the Humanitarian Policy Group, Overseas Development Institute,
London for the AusAID Office of Development Effectiveness (ODE).
WHO/UNICEF Joint Monitoring Program (2010) Progress on sanitation and drinking
water, 2010 update, comparison of WASH access levels between richest and poorest
20% of the population.
INSTITUTE FOR SUSTAINABLE FUTURES MARCH 2012
POVERTY DIMENSIONS OF WATER, SANITATION AND CLIMATE VULNERABILITY IN CAN THO 35
Annex 1 Interview question guide


![Yi.Yang@uts.edu.au arXiv:1805.10002v5 [cs.LG] 8 Feb 2019 · Yi.Yang@uts.edu.au ABSTRACT The goal of few-shot learning is to learn a classifier that generalizes well even when trained](https://static.fdocuments.in/doc/165x107/5f096b0d7e708231d426be49/yiyangutseduau-arxiv180510002v5-cslg-8-feb-2019-yiyangutseduau-abstract.jpg)