©2012 The McGraw-Hill Companies, All Rights Reserved 1 Chapter 14: Spending, Income, and GDP.
48
©2012 The McGraw-Hill Companies, All Rights Reserved 1 Chapter 14: Spending, Income, and GDP
-
Upload
patrick-hazel -
Category
Documents
-
view
225 -
download
2
Transcript of ©2012 The McGraw-Hill Companies, All Rights Reserved 1 Chapter 14: Spending, Income, and GDP.
©2012 The McGraw-Hill Companies, All Rights Reserved
1
Chapter 14: Spending, Income, and GDP

©2012 The McGraw-Hill Companies, All Rights Reserved
2
Learning Objectives
1. Explain how economist define and measure an economy's output
2. Use the expenditure method for measuring GDP to analyze economic activity
3. Define and compute nominal GDP and real GDP
4. Discuss the relationships between GDP and economic well-being

©2012 The McGraw-Hill Companies, All Rights Reserved
3
Macroeconomics
Data on output, employment, prices Vital signs of the economy
Employment, unemployment, average work hours
Stock values and trends Prices and inflation
Reported often in the newsSystematic measurement of
economic output developed during World War II Common systems and measured used
virtually worldwide
©2012 The McGraw-Hill Companies, All Rights Reserved
4
Measuring Output
©2012 The McGraw-Hill Companies, All Rights Reserved
5
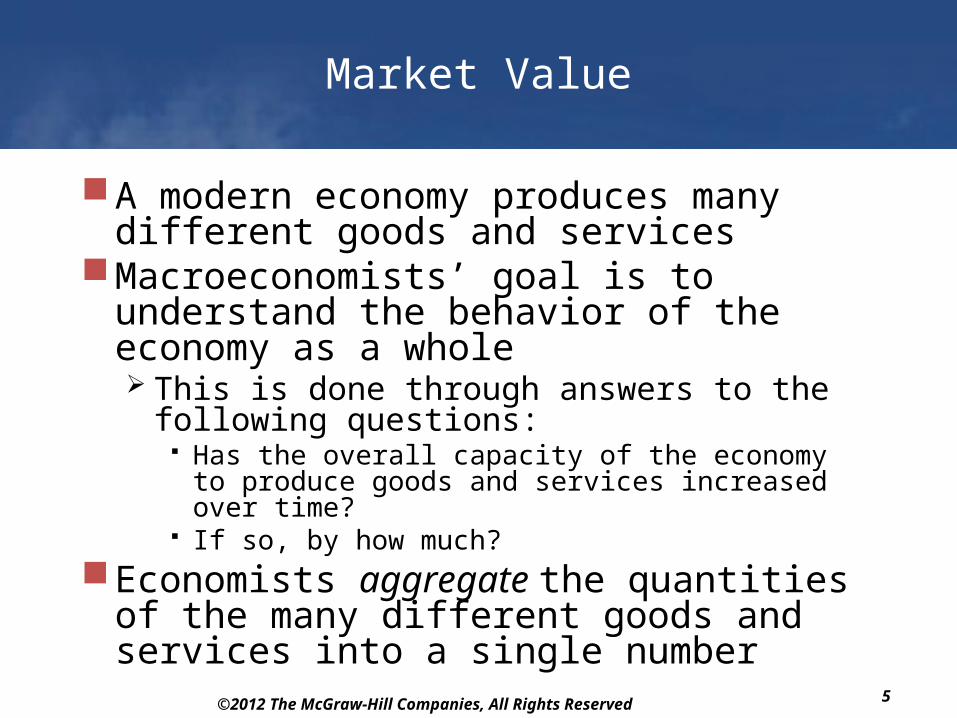
Market Value
A modern economy produces many different goods and services
Macroeconomists’ goal is to understand the behavior of the economy as a whole This is done through answers to the
following questions: Has the overall capacity of the economy to
produce goods and services increased over time?
If so, by how much?Economists aggregate the quantities
of the many different goods and services into a single number
©2012 The McGraw-Hill Companies, All Rights Reserved
6
Market Value
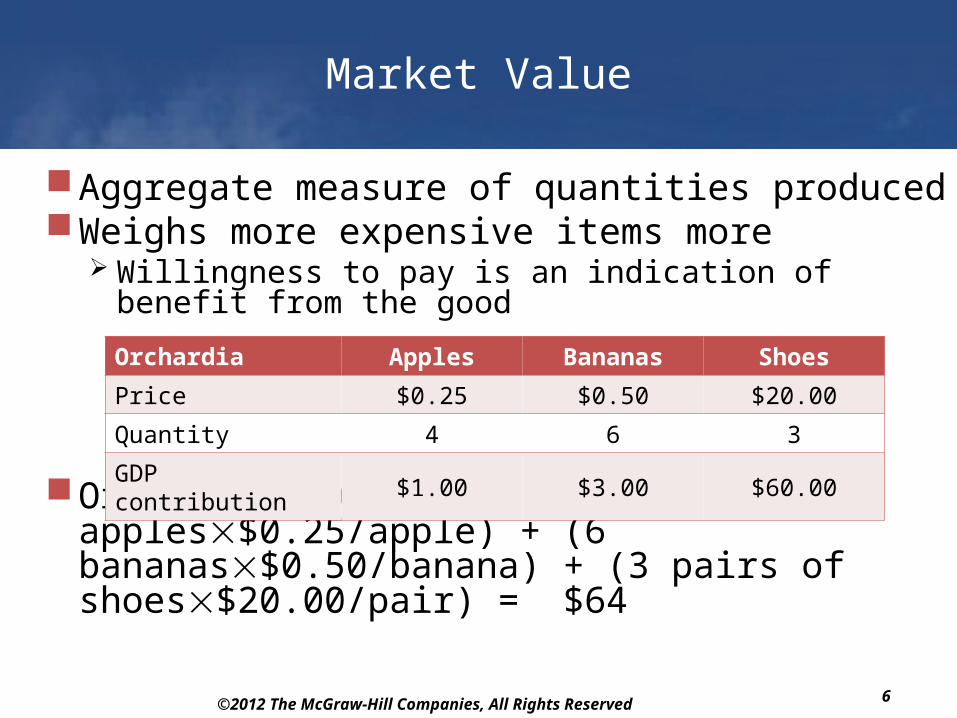
Aggregate measure of quantities producedWeighs more expensive items more
Willingness to pay is an indication of benefit from the good
Orchardia's GDP = (4 apples$0.25/apple) + (6 bananas$0.50/banana) + (3 pairs of shoes$20.00/pair) = $64
Orchardia Apples Bananas Shoes
Price $0.25 $0.50 $20.00
Quantity 4 6 3
GDP contribution $1.00 $3.00 $60.00
©2012 The McGraw-Hill Companies, All Rights Reserved
7
Market Value
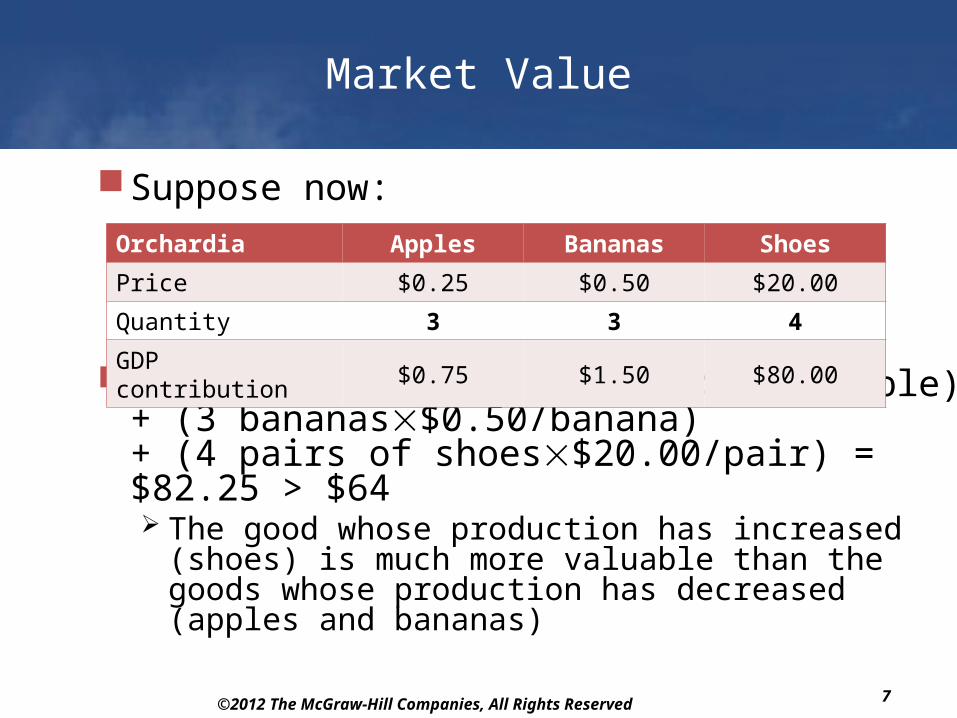
Suppose now:
Orchardia's GDP (3 apples$0.25/apple) + (3 bananas$0.50/banana)+ (4 pairs of shoes$20.00/pair) = $82.25 > $64 The good whose production has increased
(shoes) is much more valuable than the goods whose production has decreased (apples and bananas)
Orchardia Apples Bananas Shoes
Price $0.25 $0.50 $20.00
Quantity 3 3 4
GDP contribution $0.75 $1.50 $80.00
©2012 The McGraw-Hill Companies, All Rights Reserved
8
Female Labor Force Participation
The percentage of adult women working outside the home has increased dramatically over the past three decades in the Middle East and North Africa Women’s labor force participation:
Egypt: 7% in 1980 to about 26% in 2005 Morocco: 15% in 1982 to about 30% in 2007
Still it remains very low relative to other industrialized nations such as the US and the UK (60% and 70%)
If more women join the workforce, how is this change expected to affect measured GDP?
©2012 The McGraw-Hill Companies, All Rights Reserved
9
Female Labor Force Participation
The entry of more women into the labor market can raise measured GDP in two ways: The goods and services that women produce in
their new jobs contribute directly to increasing GDP
Represents a genuine increase in economic activity The fact that paid workers take over previously
unpaid housework and childcare duties increases measured GDP by the amount paid to those workers
Reflects a transfer of existing economic activities from the unpaid sector to the market sector
Measured change in GDP overstates actual change
©2012 The McGraw-Hill Companies, All Rights Reserved
10
Increasing Efficiency
Principle of Comparative Advantage applies to household tasks Produce at lowest opportunity cost Women with high opportunity cost of
household tasks find other ways to get the tasks completed
Feminist movement, civil rights concerns, increasing educational attainment, and loosening social constraints moved women into the work force Household tasks performed by paid specialists

©2012 The McGraw-Hill Companies, All Rights Reserved
11
Some Non-Market Goods Included
Government goods and services are not sold in the market
Protection by the army / transportation / education
These goods have value Increase overall output Quantities are known Prices cannot be established
Government production is valued at cost Overstates GDP if there is waste and
inefficiency
©2012 The McGraw-Hill Companies, All Rights Reserved
12
Final Goods and Services
Final goods are consumed by the ultimate user End products of production Included in GDP
Intermediate goods are used up in the production of final goods Not included in GDP
Avoids double countingA barber's assistant earns $2 per
haircut for providing services such as shampooing and sweeping up Barber charges $10 per haircut Haircut's contribution to GDP is $10
©2012 The McGraw-Hill Companies, All Rights Reserved
13
Goods Can Be Final and Intermediate
Milk can be sold as: A final product: milk in the grocery store sold to
households An intermediate good: milk sold to restaurants
Count only the final goodsA capital good, difficult to classify, is
a long-lived good used in the production of other goods and services Houses, apartments, and motels Stoves in restaurants, cooking schools Delivery vehicles and taxis
Money is not a capital good
©2012 The McGraw-Hill Companies, All Rights Reserved
14
Produced in a Country in a Period of Time
"Domestic" in GDP means the activity is measured within a country's borders Nationality of owners or company is not
relevantValue must be produced in the year
considered Sell a 20-year old house for $200,000
• House was not produced in the period of time studied
Pay $12,000 commission value added is $12,000
• Since the service was provided during the current year, the agent’s fee is counted in current-year GDP
©2012 The McGraw-Hill Companies, All Rights Reserved
15
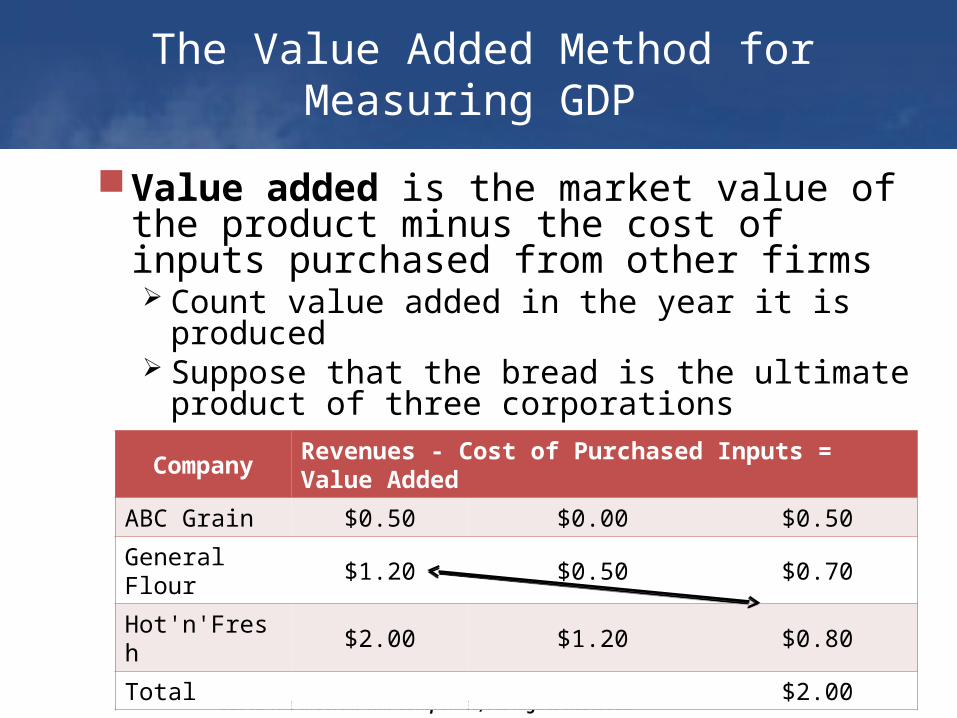
The Value Added Method for Measuring GDP
Value added is the market value of the product minus the cost of inputs purchased from other firms Count value added in the year it is
produced Suppose that the bread is the ultimate
product of three corporationsCompany
Revenues - Cost of Purchased Inputs = Value Added
ABC Grain $0.50 $0.00 $0.50
General Flour
$1.20 $0.50 $0.70
Hot'n'Fresh $2.00 $1.20 $0.80
Total $2.00
©2012 The McGraw-Hill Companies, All Rights Reserved
16
The Expenditure Method for Measuring GDP
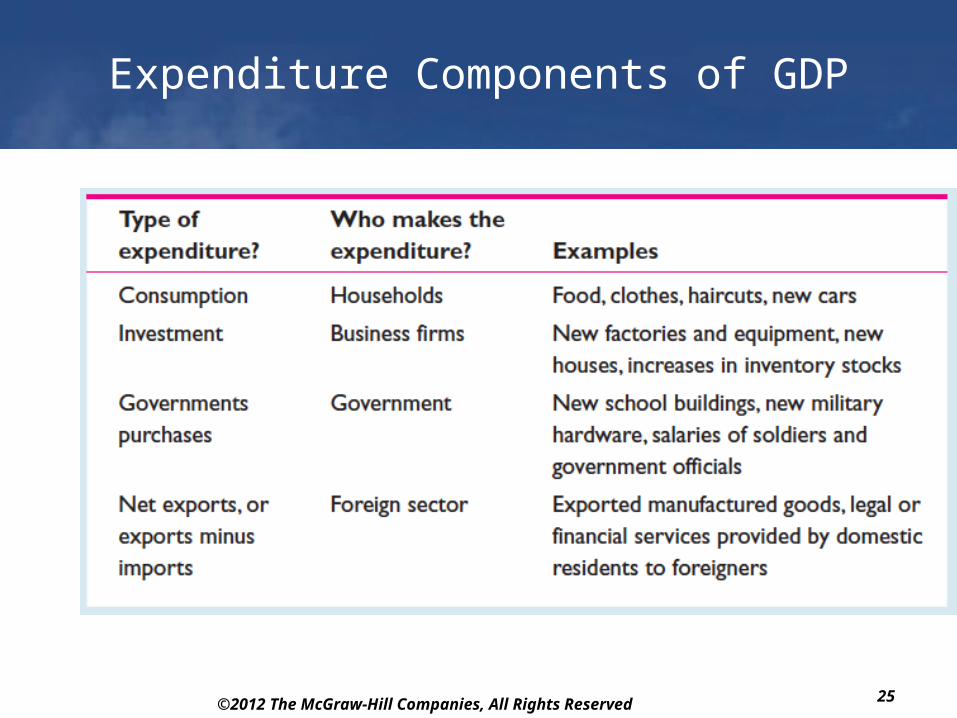
Users of final goods can be divided into 4 groups Households(C) ■ Firms (I) Government (G) ■ Foreigners (NX)
All goods produced are purchased by one of these groups in a given year
Amount spent = market valueGDP can be measured two ways
Market value Total spending for final goods less value
of imports

©2012 The McGraw-Hill Companies, All Rights Reserved
17
The Expenditure Method for Measuring GDP
©2012 The McGraw-Hill Companies, All Rights Reserved
18
Consumption Expenditure
Spending by households for goods and services is divided into three subcategories Consumer durables are long-lived
consumer goods
Consumer non-durable goods are shorter-lived goods
Services are the largest component of consumer spending
Cars Furniture Appliances
Clothing Food Bedding
Education Taxi rides Haircuts
©2012 The McGraw-Hill Companies, All Rights Reserved
19
Investment
Investment can be divided into three subcategories Business fixed investment is purchases
of new capital goods
Residential investment is construction of new homes and apartment buildings
Inventory investment is the change in unsold goods to the company's inventory
These goods are produced but not yet sold This entry can be positive or negative Negative inventory investment means less in
inventory at year-end than at the beginning
Plant Property Equipment
©2012 The McGraw-Hill Companies, All Rights Reserved
20
Economic Investment and Financial Investment
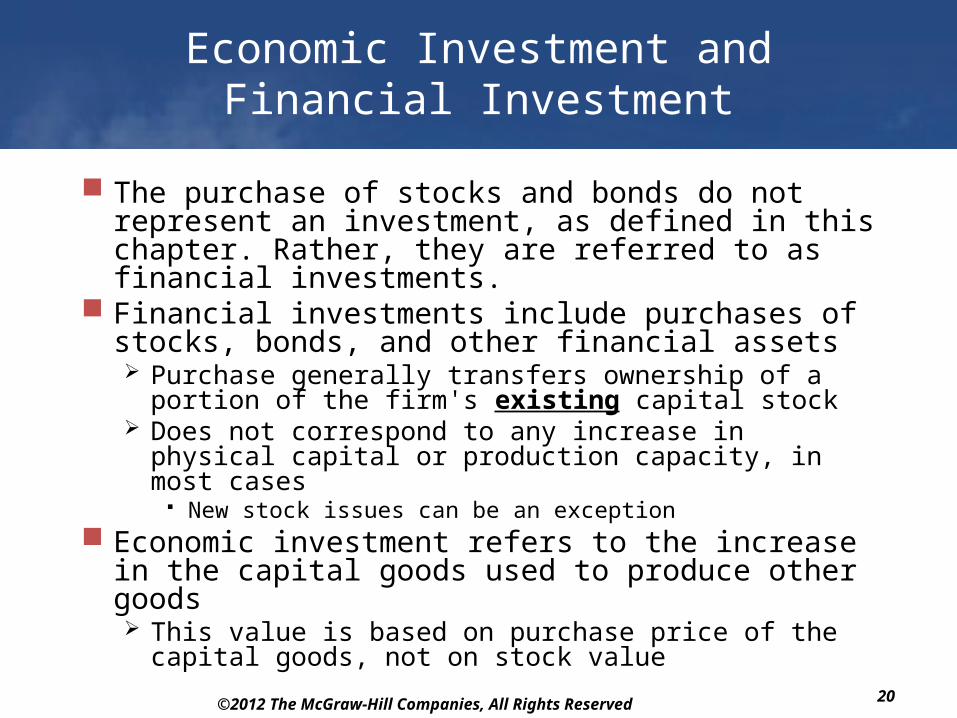
The purchase of stocks and bonds do not represent an investment, as defined in this chapter. Rather, they are referred to as financial investments.
Financial investments include purchases of stocks, bonds, and other financial assets Purchase generally transfers ownership of a
portion of the firm's existing capital stock Does not correspond to any increase in physical
capital or production capacity, in most cases New stock issues can be an exception
Economic investment refers to the increase in the capital goods used to produce other goods This value is based on purchase price of the
capital goods, not on stock value
©2012 The McGraw-Hill Companies, All Rights Reserved
21
Government Purchases
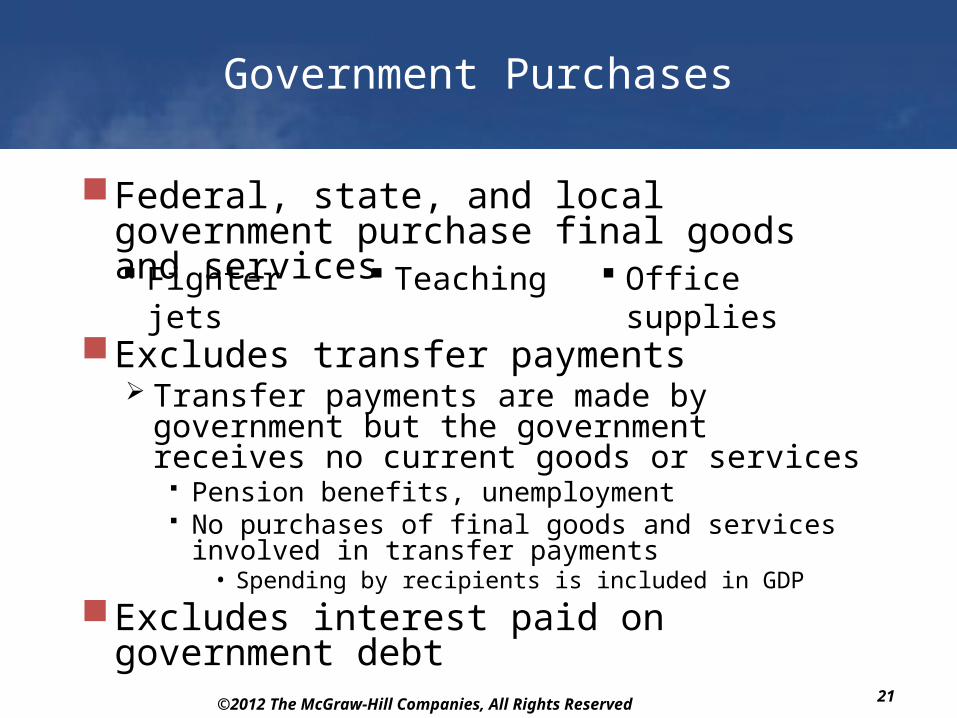
Federal, state, and local government purchase final goods and services
Excludes transfer payments Transfer payments are made by
government but the government receives no current goods or services
Pension benefits, unemployment No purchases of final goods and services
involved in transfer payments• Spending by recipients is included in GDP
Excludes interest paid on government debt
Fighter jets Teaching Office supplies
©2012 The McGraw-Hill Companies, All Rights Reserved
22
Net Exports
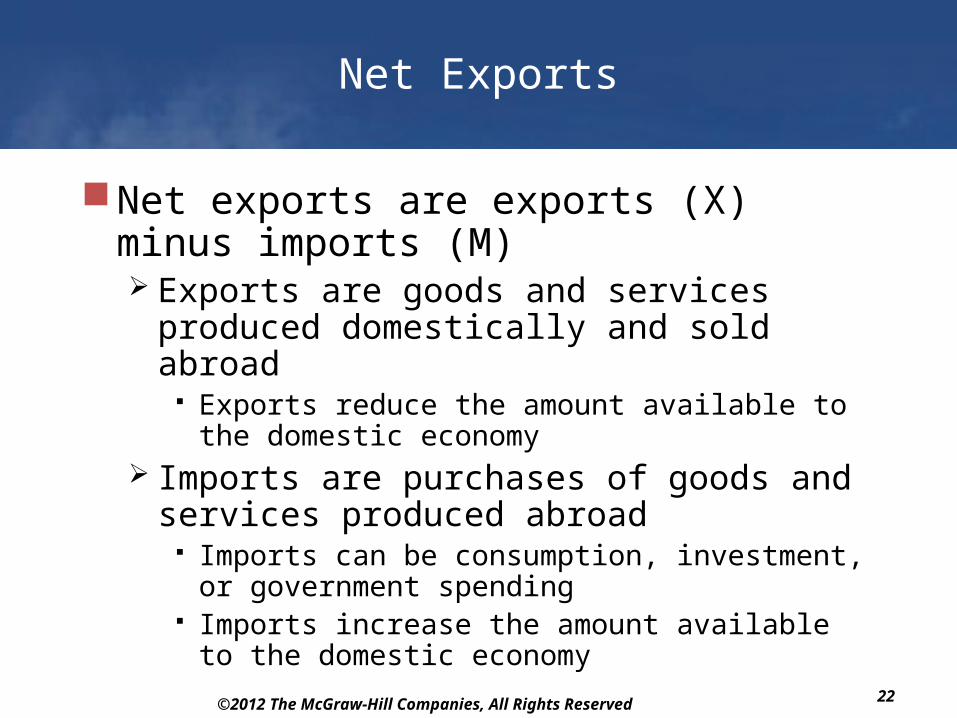
Net exports are exports (X) minus imports (M) Exports are goods and services
produced domestically and sold abroad Exports reduce the amount available to the
domestic economy Imports are purchases of goods and
services produced abroad Imports can be consumption, investment, or
government spending Imports increase the amount available to the
domestic economy
©2012 The McGraw-Hill Companies, All Rights Reserved
23
GDP Expenditures Equation
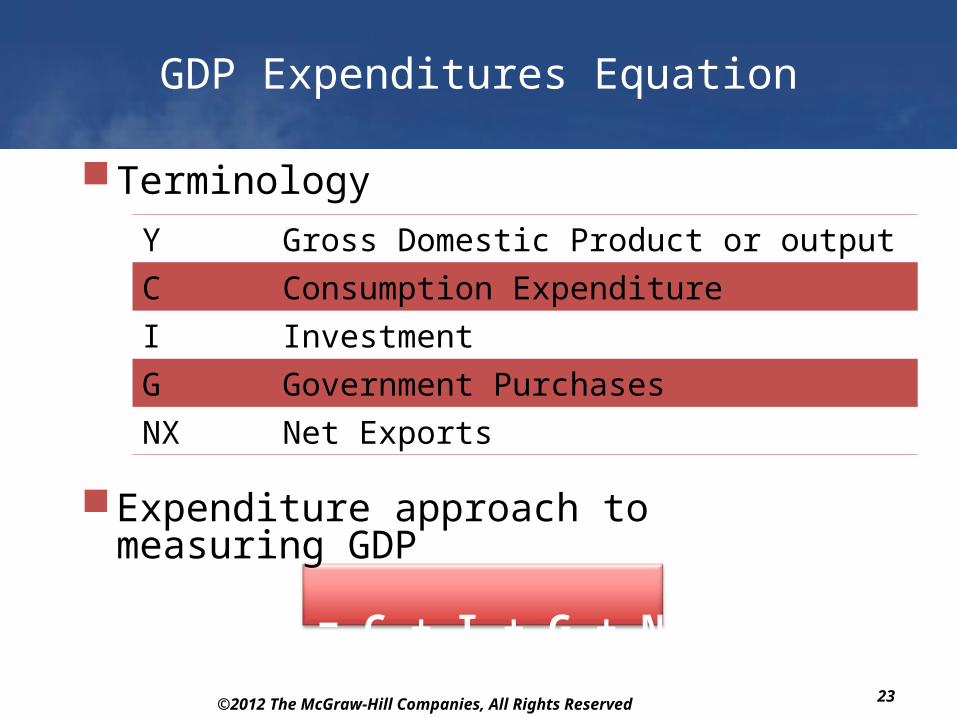
Terminology
Expenditure approach to measuring GDP
Y = C + I + G + NX
Y Gross Domestic Product or output
C Consumption Expenditure
I Investment
G Government Purchases
NX Net Exports
©2012 The McGraw-Hill Companies, All Rights Reserved
24
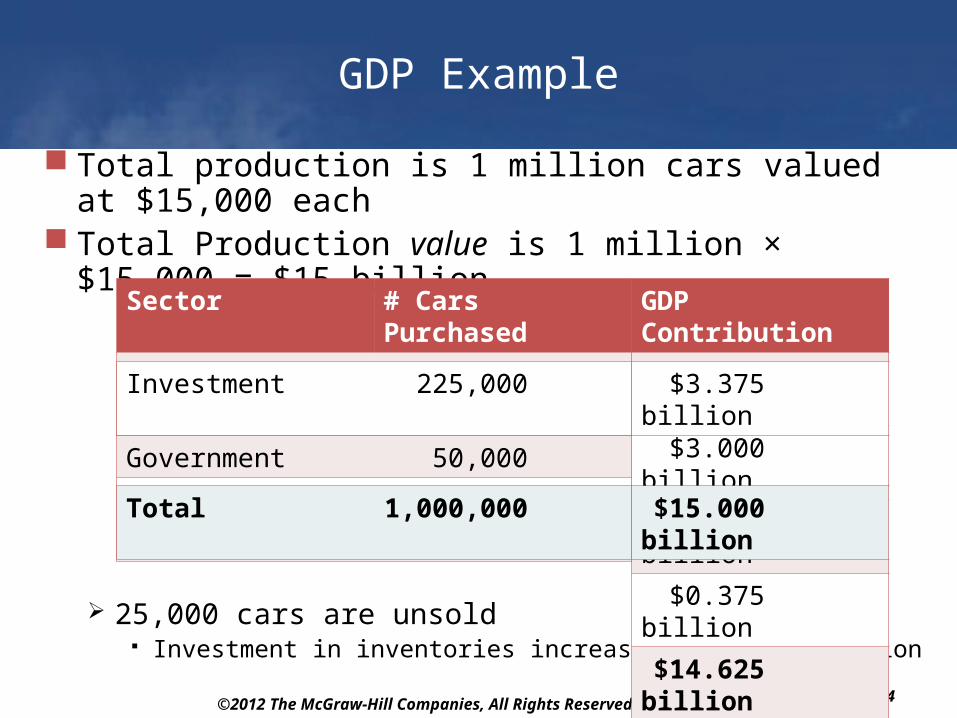
GDP Example
Total production is 1 million cars valued at $15,000 each
Total Production value is 1 million × $15,000 = $15 billion
25,000 cars are unsold Investment in inventories increases by $0.375 billion
GDP Contribution
$10.500 billion
$3.000 billion
$0.750 billion
$0.375 billion
$14.625 billion
Sector # Cars Purchased
Consumers 700,000
Businesses 200,000
Government 50,000
Net exports 25,000
Total 975,000
Investment 225,000 $3.375 billion
Total 1,000,000 $15.000 billion
©2012 The McGraw-Hill Companies, All Rights Reserved
25
Expenditure Components of GDP
©2012 The McGraw-Hill Companies, All Rights Reserved
26
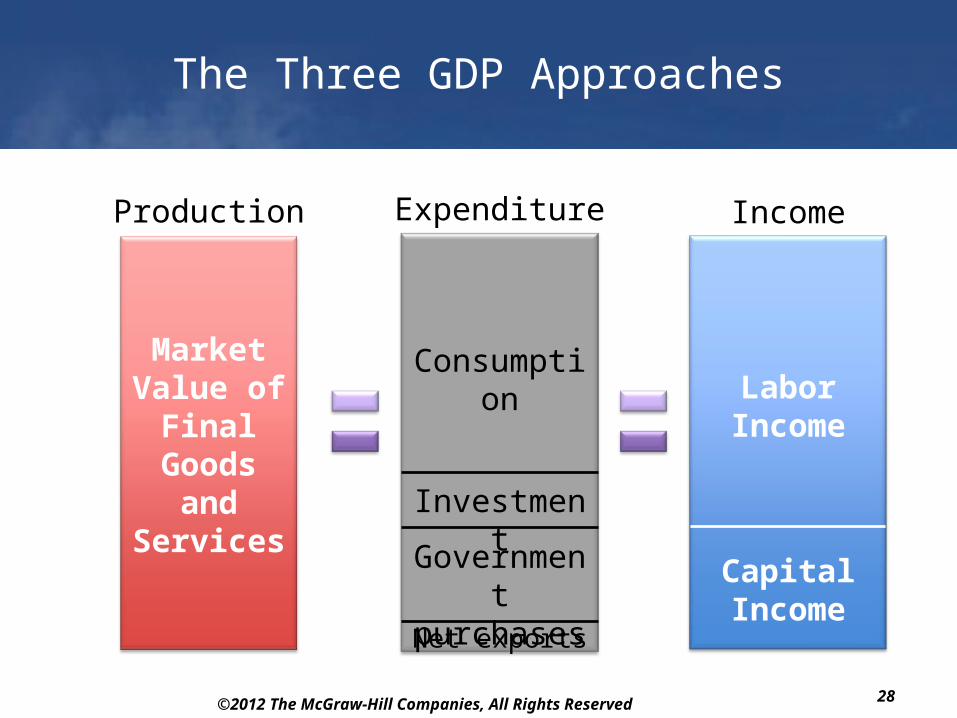
The Income Method for Measuring GDP
There are three ways to measure GDP Measure of total production Measure of total expenditure Measure of incomes of capital and
labor
All three methods should give the same final answer
©2012 The McGraw-Hill Companies, All Rights Reserved
27
The Income Method for Measuring GDP
When a good is sold, its proceeds are distributed to workers or business owners
GDP = labor income + capital incomeLabor income is wages, salaries,
benefits, and incomes of the self-employed About 71 percent of GDP in the UAE (2008)
Capital income pays for physical capital and intangibles
Measured before taxes
Profits for business owners Rent for land
Interest for bond holders Royalties
©2012 The McGraw-Hill Companies, All Rights Reserved
28
The Three GDP Approaches
Expenditure
Investment
Consumption
Government
purchasesNet exports
Income
Capital Income
Labor Income
Production
Market Value of
Final Goods
and Services

©2012 The McGraw-Hill Companies, All Rights Reserved
29
Nominal GDP versus Real GDP
Compare GDP for different years to see how much output has changed
GDP changes over time because Prices change
AND / OR
Quantity of output changesTo see how much output has grown,
use only the changes in quantities Hold prices constant
©2012 The McGraw-Hill Companies, All Rights Reserved
30
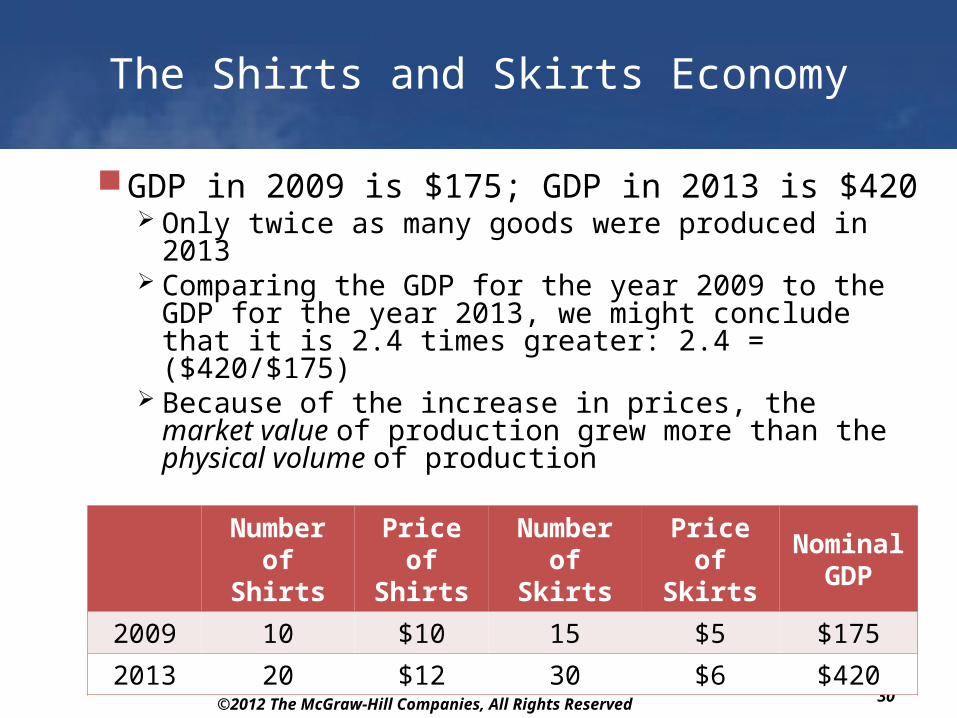
The Shirts and Skirts Economy
GDP in 2009 is $175; GDP in 2013 is $420 Only twice as many goods were produced in
2013 Comparing the GDP for the year 2009 to the
GDP for the year 2013, we might conclude that it is 2.4 times greater: 2.4 = ($420/$175)
Because of the increase in prices, the market value of production grew more than the physical volume of production
Number of Shirts
Price of Shirts
Number of Skirts
Price of Skirts
Nominal GDP
2009 10 $10 15 $5 $175
2013 20 $12 30 $6 $420
©2012 The McGraw-Hill Companies, All Rights Reserved
31
Real GDP and Nominal GDP
Real GDP (RGDP) values output in the current year using the prices from the base year The base year is a reference year that
changes infrequently Real GDP measures the physical volume
of productionNominal GDP (NGDP) values
output in the current year using prices from the current year Nominal GDP is the current dollar value
of production

©2012 The McGraw-Hill Companies, All Rights Reserved
32
Calculating Real GDP for 2013
Use 2009 as the base yearNominal GDP for 2009 is $175 and
for 2013, $420Calculate real GDP using current
year quantities and base year prices
Number of Shirt
Price of Shirts
Number of Skirts
Price of Skirts
2009 10 $10 15 $5
2013 20 $12 30 $6
©2012 The McGraw-Hill Companies, All Rights Reserved
33
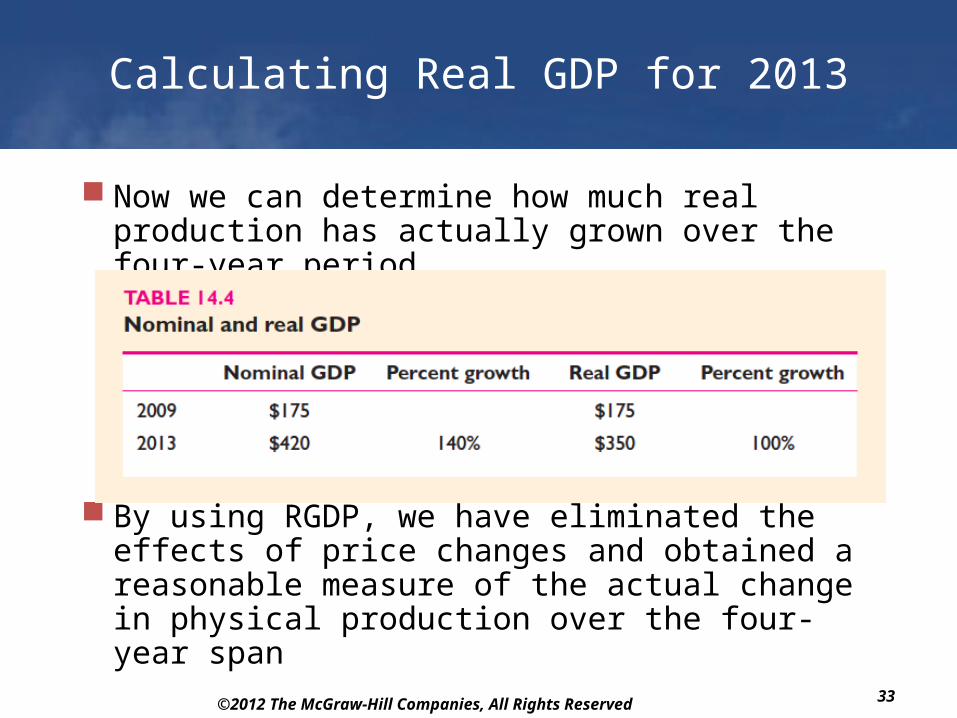
Calculating Real GDP for 2013
Now we can determine how much real production has actually grown over the four-year period
By using RGDP, we have eliminated the effects of price changes and obtained a reasonable measure of the actual change in physical production over the four-year span

©2012 The McGraw-Hill Companies, All Rights Reserved
34
Chain Weighting
Another method to calculate RGDP RGDP from a chain weighting approach is
Less sensitive to the choice of the base year Chain weighting is similar to the simpler
process Geometric average (where the subscript
is the price year)
Consistent with the income method, RGDP doubles between 2009 and 2013.
©2012 The McGraw-Hill Companies, All Rights Reserved
35
Observations on Real and Nominal GDP
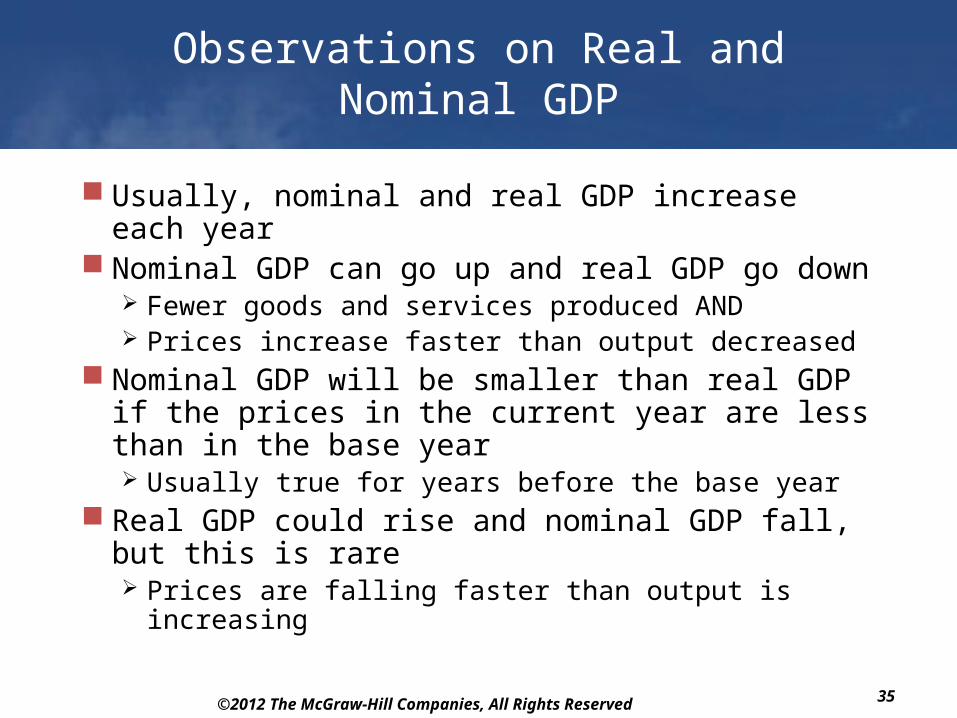
Usually, nominal and real GDP increase each year
Nominal GDP can go up and real GDP go down Fewer goods and services produced AND Prices increase faster than output decreased
Nominal GDP will be smaller than real GDP if the prices in the current year are less than in the base year Usually true for years before the base year
Real GDP could rise and nominal GDP fall, but this is rare Prices are falling faster than output is increasing
©2012 The McGraw-Hill Companies, All Rights Reserved
36
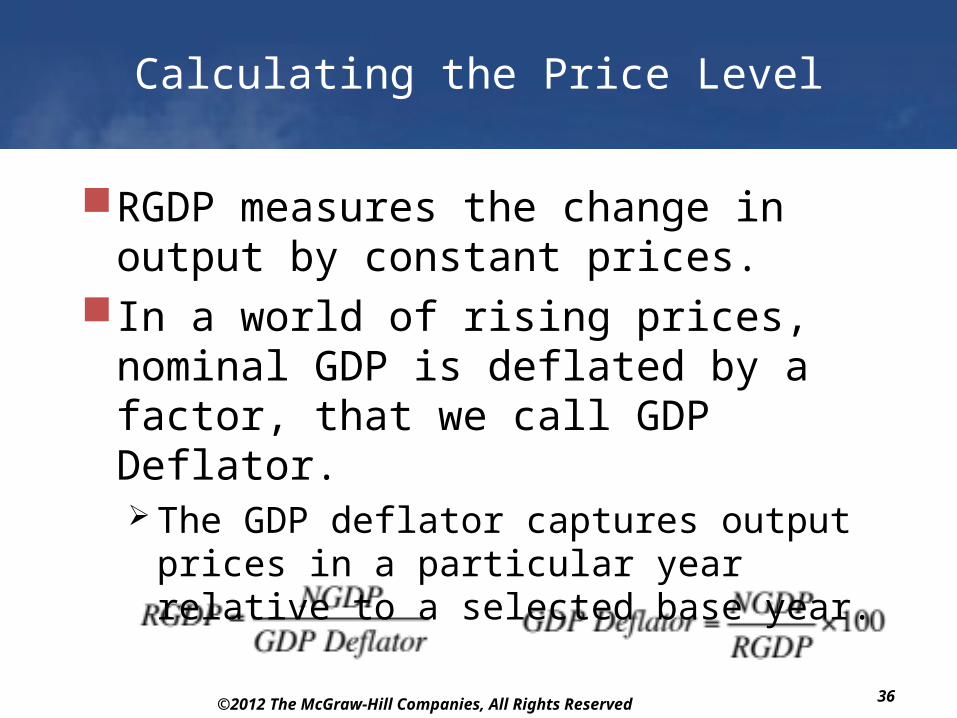
Calculating the Price Level
RGDP measures the change in output by constant prices.
In a world of rising prices, nominal GDP is deflated by a factor, that we call GDP Deflator. The GDP deflator captures output
prices in a particular year relative to a selected base year.
©2012 The McGraw-Hill Companies, All Rights Reserved
37
GDP Deflator
The GDP deflator represents a measure of the overall price level of produced goods and services.
The GDP deflator is equal to 100 in the base year.
It is greater than 100 when the current year’s prices exceed the base year’s prices.
It is less than 100 when the current year’s prices are lower than the base year’s prices.
©2012 The McGraw-Hill Companies, All Rights Reserved
38
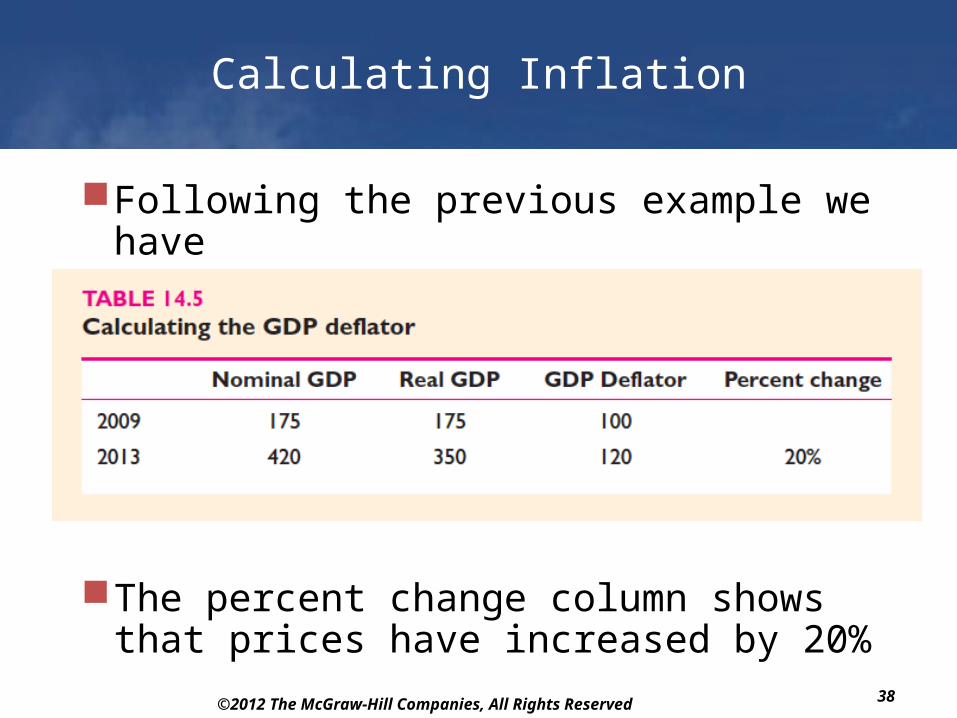
Calculating Inflation
Following the previous example we have
The percent change column shows that prices have increased by 20%

©2012 The McGraw-Hill Companies, All Rights Reserved
39
Real GDP and Economic Well-Being
Real GDP is a flawed measure of well-being It values only market transactions
Omits illegal transactions, volunteer work, and household production
Maximizing GDP will not necessarily maximize national well-being Whether increases in output increase
welfare is a case-by-case issue
©2012 The McGraw-Hill Companies, All Rights Reserved
40
GDP Does Not Value Leisure
Amount of leisure time has increased in the past 100 years Work weeks are shorter People enter the labor force at an older age People retire earlier
Leisure produces no goods for market GDP places a value of zero on all leisure time Opportunity cost of an hour of leisure is your
hourly wage Omission of the value of leisure time makes
GDP seem smaller
©2012 The McGraw-Hill Companies, All Rights Reserved
41
Nonmarket Economic Activities
GDP omits services that are not traded in markets Household production
This is of particular importance to developing countries where services are commonly traded for others
Volunteer servicesValuing these services would be difficultNonmarket activities are important in
poor countries Self-sufficient households and bartered
goods and services
©2012 The McGraw-Hill Companies, All Rights Reserved
42
Underground economy
Underground economy is all unreported transactions, legal and illegal
Casual labor is often paid in cash Failure to report transaction reduces taxes Includes baby sitters, lawn care, home repair,
etc.Some underground activity is illegal
A service of value is provided Drug dealers, etc
Estimates suggest the underground economy is large regardless of national income level
©2012 The McGraw-Hill Companies, All Rights Reserved
43
Environmental Quality
Suppose a factory is built in your town People are employed and output is
produced Productive activity is included in GDP
Suppose further that the factory creates pollution Your city hires a company to restore the
environment to its initial condition Clean-up activities are included in GDP
Gets environment back to its starting point, not better
©2012 The McGraw-Hill Companies, All Rights Reserved
44
Resource Depletion
No adjustment is made for the decline in resource availability when mining or other harvesting is done One more barrel of oil on the market
means one less barrel for future useEnvironmental quality and resource
depletion are difficult to value They have value and that value is
omitted from GDP
©2012 The McGraw-Hill Companies, All Rights Reserved
45
Other Quality of Life Considerations
GDP does not account for intangibles people value Crime rates Traffic congestion Civic organizations Open space Sense of community

©2012 The McGraw-Hill Companies, All Rights Reserved
46
Poverty and Economic Inequality
GDP measures the total quantity of goods and services produced and sold in an economy, but it conveys no information about who gets to enjoy those goods and services
Two countries may have identical GDPs but differ radically in the distribution of economic welfare across the population
GDP does not capture the effects of income inequality Most would prefer living in a relatively equal
society to one with a few wealthy and many poor
©2012 The McGraw-Hill Companies, All Rights Reserved
47
GDP as a Welfare Measure
GDP omits and undervalues some goods and services
GDP per capita is positively associated with several measures of well-being Material standard of living: more goods
and services Health and life expectancy
Residents of industrialized countries fare better than residents of developing countries in a range of health measures
Education Literacy and school enrollment rates are
higher in high-income countries

©2012 The McGraw-Hill Companies, All Rights Reserved
48
GDP as a Welfare Measure