2012 Report on Ethanol Market Concentration I. Introduction · 2013-07-11 · 2012 Report on...
21
1 2012 Report on Ethanol Market Concentration I. Introduction Section 1501(a)(2) of the Energy Policy Act of 2005, as codified at 42 U.S.C. § 7545(o), requires the Federal Trade Commission (“Commission” or “FTC”) each year to “perform a market concentration analysis of the ethanol production industry using the Herfindahl-Hirschman Index [(“HHI”)] to determine whether there is sufficient competition among industry participants to avoid price-setting and other anticompetitive behavior.” 1 The statute also requires the FTC to consider all marketing arrangements among industry participants in preparing its analysis. 2 The FTC must report its findings to Congress and to the Administrator of the Environmental Protection Agency (“EPA”) by December 1. 3 This report presents the FTC’s concentration analysis of the ethanol production industry for 2012. It builds upon Commission reports from previous years, which contain relevant background information that this report does not repeat. 4 For purposes of this analysis, FTC staff (“staff”) reviewed and analyzed publicly available data and conducted interviews with ethanol producers, marketers, and other industry participants. As in previous reports, staff calculated HHIs for the ethanol production industry based on two different measures of market share – production capacity and actual production 5 – 1 Energy Policy Act of 2005 § 1501(a)(2), 42 U.S.C. § 7545(o)(10) (2009). For purposes of this report, we presume that Congress used the term “price-setting” to mean “price fixing.” 2 Id. at § 7545(o)(10)(A)(ii). 3 Id. at § 7545(o)(10)(B). 4 See FTC, 2011 Report on Ethanol Market Concentration (2011) (“2011 Ethanol Report”), available at http://www.ftc.gov/os/2011/12/111213ethanolreport.pdf. For prior Ethanol Reports, see 2011 Ethanol Report at 1 n.4. 5 Due to the confidential nature of the ethanol production data the Department of Energy’s Energy Information Administration (“EIA”) collects, EIA staff – at FTC staff’s request –
Transcript of 2012 Report on Ethanol Market Concentration I. Introduction · 2013-07-11 · 2012 Report on...

1
2012 Report on Ethanol Market Concentration I. Introduction Section 1501(a)(2) of the Energy Policy Act of 2005, as codified at 42 U.S.C. § 7545(o),
requires the Federal Trade Commission (“Commission” or “FTC”) each year to “perform a
market concentration analysis of the ethanol production industry using the Herfindahl-Hirschman
Index [(“HHI”)] to determine whether there is sufficient competition among industry participants
to avoid price-setting and other anticompetitive behavior.”1 The statute also requires the FTC to
consider all marketing arrangements among industry participants in preparing its analysis.2 The
FTC must report its findings to Congress and to the Administrator of the Environmental
Protection Agency (“EPA”) by December 1.3 This report presents the FTC’s concentration
analysis of the ethanol production industry for 2012. It builds upon Commission reports from
previous years, which contain relevant background information that this report does not repeat.4
For purposes of this analysis, FTC staff (“staff”) reviewed and analyzed publicly
available data and conducted interviews with ethanol producers, marketers, and other industry
participants. As in previous reports, staff calculated HHIs for the ethanol production industry
based on two different measures of market share – production capacity and actual production5 –
1 Energy Policy Act of 2005 § 1501(a)(2), 42 U.S.C. § 7545(o)(10) (2009). For purposes of this report, we presume that Congress used the term “price-setting” to mean “price fixing.”
2 Id. at § 7545(o)(10)(A)(ii).
3 Id. at § 7545(o)(10)(B).
4 See FTC, 2011 Report on Ethanol Market Concentration (2011) (“2011 Ethanol Report”), available at http://www.ftc.gov/os/2011/12/111213ethanolreport.pdf. For prior Ethanol Reports, see 2011 Ethanol Report at 1 n.4.
5 Due to the confidential nature of the ethanol production data the Department of Energy’s Energy Information Administration (“EIA”) collects, EIA staff – at FTC staff’s request –

2
allocated under three different approaches, for a total of six HHI calculations.6 Based on
production capacity, the HHIs for the domestic ethanol production industry range from 290 to
608, depending on the method of market share allocation. Based on actual production, the HHIs
range from 328 to 686. Four of the six resulting HHIs for 2012 are higher than those calculated
for the 2011 Ethanol Report, indicating increased concentration. The other two HHIs for 2012
are lower than those calculated for the 2011 Ethanol Report, indicating decreased concentration.
All of the 2012 HHIs, however, reflect that the domestic ethanol industry remains
unconcentrated, as it has been in each year during the life of the Commission’s reporting
obligations under the statute.
These figures indicate that the U.S. fuel ethanol7 production industry is unconcentrated,8
assuming domestic fuel ethanol production is a relevant market for competition analysis. This
assumption precludes consideration of (1) a broader relevant product market that includes other
calculated both the actual production market shares and the production-based HHIs presented in this report. EIA provided only the aggregated HHI figures to FTC staff and did not disclose the underlying confidential data or market shares. See Section IV.B, infra.
6 See Section IV, infra.
7 This report analyzes fuel ethanol market concentration, rather than market concentration of all ethanol. Fuel ethanol and beverage-grade alcohol are not substitute products in consumption; fuel ethanol contains up to five percent denaturant (for example, natural gasoline), rendering it undrinkable and exempt from the beverage alcohol tax. See Renewable Fuels Association (“RFA”), How Ethanol is Made, http://www.ethanolrfa.org/pages/how-ethanol-is-made (last visited Sept. 25, 2012).
8 The Commission and the U.S. Department of Justice characterize markets in which the HHI is below 1500 as unconcentrated. HHIs between 1500 and 2500 indicate moderately concentrated markets, which may or may not raise competitive concerns. Markets with HHIs over 2500 are highly concentrated and are more likely to pose competitive concerns. U.S. Department of Justice and Federal Trade Commission Horizontal Merger Guidelines (2010) (“Horizontal Merger Guidelines” or “Guidelines”) § 5.3, available at http://ftc.gov/os/2010/08/ 100819hmg.pdf.

3
gasoline additives and (2) a relevant geographic market broader or narrower than the United
States. Nonetheless, the level of concentration in the U.S. ethanol industry does not justify a
presumption that a single ethanol producer or marketer or a group of such firms could exercise
market power to set prices or coordinate on price or output levels.
II. Recent Industry Developments
Since 2005, Congress has required the domestic consumption of a minimum annual
volume of renewable fuels, including ethanol blended into motor fuels. The Energy Policy Act
of 2005 originally established this minimum, the Renewable Fuel Standard (“RFS”), and set out
escalating annual requirements for 2006 through 2012. The 2005 RFS required the use of 6.8
billion gallons of renewable fuels in 2010, rising to 7.5 billion gallons in 2012.9 In the Energy
Independence and Security Act of 2007, Congress amended the RFS, significantly increasing the
volume minimums – including a revised 2012 requirement of 15.2 billion gallons – and
extending the annual mandate to a peak requirement of 36 billion gallons in 2022.10
Ethanol demand has increased steadily year-over-year since the FTC’s first Report on
Ethanol Market Concentration in 2005.11 This trend has held over the past year: for each month
from July 2011 to June 2012, the industry blended more ethanol than in the same month of the
9 Energy Policy Act of 2005, Pub. L. No. 109-58, § 1501(a)(2), 119 Stat. 594, 1067 (amended 2007).
10 See Energy Independence and Security Act of 2007 § 202(a)(2), 42 U.S.C. § 7545(o)(2)(B)(i)(I) (2009).
11 See EIA, Annual U.S. Refinery and Blender Net Input of Fuel Ethanol, http://www.eia.gov/dnav/pet/hist/LeafHandler.ashx?n=PET&s=MFERIUS1&f=A (last modified Sept. 27, 2012); see also prior Ethanol Reports, supra note 4.

4
prior year, blending a total of 12.7 billion gallons.12 Industry participants believe that domestic
ethanol demand will likely meet the 2012 RFS minimum,13 despite a recent decline in gasoline
demand that reduced the pool of gasoline available to blend with ethanol.14 Some industry
participants question whether ethanol demand beyond 2012 will be sufficient to meet the RFS
mandate.
Fuel ethanol consumption is nearing 10 percent of total motor gasoline demand,15 the
maximum level permissible under current regulation for general use in conventional motor
vehicles.16 EIA has granted waivers for gasoline blends containing more than 10 percent
12 See EIA, Monthly U.S. Refinery and Blender Net Input of Fuel Ethanol, http://www.eia.gov/dnav/pet/hist/LeafHandler.ashx?n=pet&s=mferius1&f=m (last modified Sept. 27, 2012).
13 EIA notes, however, that the 2012 RFS may not be met as a result of continuing effects from drought conditions in the Midwest. EIA, This Week in Petroleum: Corn Ethanol Issues Not Expected to Significantly Impact Gasoline Prices in 2012 (Aug. 8, 2012), http://www.eia.gov/oog/info/twip/twiparch/120808/twipprint.html. See also EPA, Request for Comment on Letters Seeking a Waiver of the Renewable Fuel Standard, http://www.epa.gov/otaq/fuels/renewablefuels/notices.htm (last visited Oct. 15, 2012) (reporting that on August 13 and 14, 2012, the Governors of Arkansas and North Carolina requested that EPA grant a full or partial waiver of the RFS for 2012 and 2013). 14 See EIA, Monthly U.S. Product Supplied of Finished Motor Gasoline, http://www.eia.gov/dnav/pet/hist/LeafHandler.ashx?n=PET&s=MGFUPUS1&f=M (last modified Sept. 27, 2012). Between July 2011 and June 2012, the domestic gasoline consumption totaled approximately 134.3 billion gallons compared to 136.5 billion gallons consumed in the preceding 12 months. 2011 Ethanol Report at 4. 15 See id. For perspective, the 12.7 billion gallons of ethanol blended between July 2011 and June 2012 represent over 9.4 percent of total U.S. gasoline consumption compared to 9 percent blended in the preceding 12 months. Id. 16 The Clean Air Act prohibits fuel manufacturers from increasing the concentration of any fuel additive sold for general use in light-duty motor vehicles, but provides that EPA may waive this prohibition upon a determination that the new concentration will not cause vehicles to fail to comply with emissions rules. Clean Air Act § 211, 42 U.S.C. § 7545(f) (2009). In 1979, EPA granted a waiver permitting “gasohol” blends of up to 10 percent ethanol. See Fuels and Fuel
5
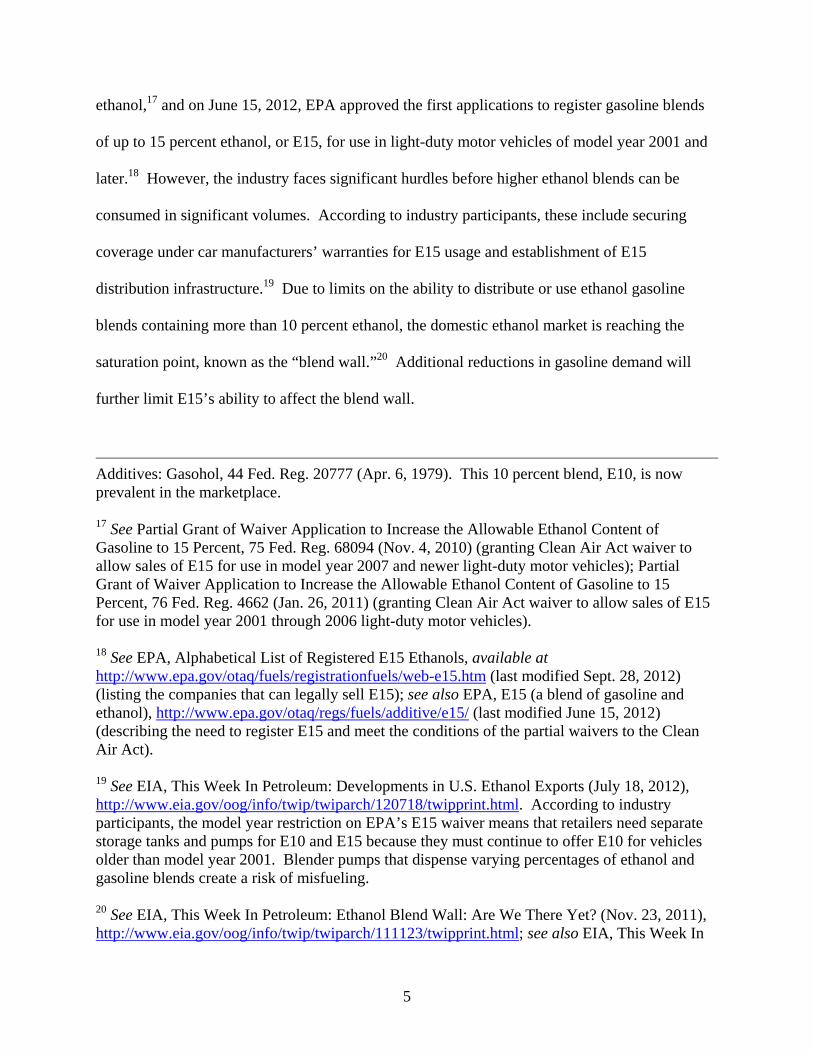
ethanol,17 and on June 15, 2012, EPA approved the first applications to register gasoline blends
of up to 15 percent ethanol, or E15, for use in light-duty motor vehicles of model year 2001 and
later.18 However, the industry faces significant hurdles before higher ethanol blends can be
consumed in significant volumes. According to industry participants, these include securing
coverage under car manufacturers’ warranties for E15 usage and establishment of E15
distribution infrastructure.19 Due to limits on the ability to distribute or use ethanol gasoline
blends containing more than 10 percent ethanol, the domestic ethanol market is reaching the
saturation point, known as the “blend wall.”20 Additional reductions in gasoline demand will
further limit E15’s ability to affect the blend wall.
Additives: Gasohol, 44 Fed. Reg. 20777 (Apr. 6, 1979). This 10 percent blend, E10, is now prevalent in the marketplace.
17 See Partial Grant of Waiver Application to Increase the Allowable Ethanol Content of Gasoline to 15 Percent, 75 Fed. Reg. 68094 (Nov. 4, 2010) (granting Clean Air Act waiver to allow sales of E15 for use in model year 2007 and newer light-duty motor vehicles); Partial Grant of Waiver Application to Increase the Allowable Ethanol Content of Gasoline to 15 Percent, 76 Fed. Reg. 4662 (Jan. 26, 2011) (granting Clean Air Act waiver to allow sales of E15 for use in model year 2001 through 2006 light-duty motor vehicles). 18 See EPA, Alphabetical List of Registered E15 Ethanols, available at http://www.epa.gov/otaq/fuels/registrationfuels/web-e15.htm (last modified Sept. 28, 2012) (listing the companies that can legally sell E15); see also EPA, E15 (a blend of gasoline and ethanol), http://www.epa.gov/otaq/regs/fuels/additive/e15/ (last modified June 15, 2012) (describing the need to register E15 and meet the conditions of the partial waivers to the Clean Air Act). 19 See EIA, This Week In Petroleum: Developments in U.S. Ethanol Exports (July 18, 2012), http://www.eia.gov/oog/info/twip/twiparch/120718/twipprint.html. According to industry participants, the model year restriction on EPA’s E15 waiver means that retailers need separate storage tanks and pumps for E10 and E15 because they must continue to offer E10 for vehicles older than model year 2001. Blender pumps that dispense varying percentages of ethanol and gasoline blends create a risk of misfueling.
20 See EIA, This Week In Petroleum: Ethanol Blend Wall: Are We There Yet? (Nov. 23, 2011), http://www.eia.gov/oog/info/twip/twiparch/111123/twipprint.html; see also EIA, This Week In

6
As in prior years, fuel ethanol prices have been volatile throughout the reported period,
leading to wide variations in margins. Margins were strong through the second half of 2011 due
to high export demand for U.S. ethanol21 and the anticipated expiration of the Volumetric
Ethanol Excise Tax Credit (“VEETC”) on December 31, 2011.22 VEETC provided a $0.45 tax
credit to refiners for every gallon of ethanol they blended with gasoline, which encouraged
greater levels of blending. Refiners sought to maximize the benefit of the tax credit before its
expiration, leading to an increase in ethanol demand in the second half of the year.
Margins deteriorated in the first half of 2012, primarily due to an abundance of ethanol,
lower overall gasoline demand, and high corn prices (i.e., higher ethanol input costs). Ethanol
producers were slow to decrease production after the expiration of VEETC, leading to excess
ethanol supplies.23 EIA notes that drought conditions in the Midwest reduced corn harvests,
Petroleum: Developments in U.S. Ethanol Exports (July 18, 2012), http://www.eia.gov/oog/info/twip/twiparch/120718/twipprint.html.
21 See EIA, This Week In Petroleum: Developments in U.S. Ethanol Exports (July 18, 2012), http://www.eia.gov/oog/info/twip/twiparch/120718/twipprint.html; EIA, Today In Energy: Record U.S. Ethanol Exports In 2011 Help Offset Brazil’s Production Decline (Mar. 6, 2012), http://www.eia.gov/todayinenergy/detail.cfm?id=5270. Decreased ethanol production in Brazil in 2011 resulted in a record level of U.S. ethanol exports to Brazil and other countries that traditionally source ethanol from Brazil. Brazil experienced a shortage of its primary ethanol feedstock, sugar cane.
22 VEETC originated in the American Jobs Creation Act of 2004. Pub. L. No. 108-357, § 301, 118 Stat. 1418, 1459 (2004) (amended 2010). In 2010, Congress extended the tax credit through December 31, 2011, as part of a larger tax policy package. Tax Relief, Unemployment Insurance Reauthorization, and Job Creation Act of 2010 § 708, 26 U.S.C. § 6426 (2010).
23 See generally Agricultural Marketing Resource Center, Iowa State University, Tracking Ethanol Profitability, http://www.extension.iastate.edu/agdm/energy/xls/d1-10ethanolprofitability.xlsx (last modified Sept. 7, 2012).

7
resulting in higher corn prices.24 According to industry participants, the resulting low-margin
environment has prompted some producers to reduce operating rates or shut down less efficient
plants.25
Although sufficient ethanol production capacity exists to meet the 2012 RFS
requirements, additional capacity will be necessary to fulfill future RFS mandates set out in the
Energy Independence and Security Act of 2007, including volume requirements for advanced
biofuels (defined as cellulosic ethanol and other biofuels derived from feedstocks other than corn
starch).26 One plant is currently producing commercial-grade cellulosic ethanol, and another
plant has completed construction and obtained the required EPA registration to start production
24 See EIA, Today In Energy: Drought Increases Price of Corn, Reduces Profits to Ethanol Producers (Aug. 31, 2012), http://www.eia.gov/todayinenergy/detail.cfm?id=7790# (noting a 35 percent rise in the price of corn from June 18 to August 29, 2012). 25 See EIA, This Week In Petroleum: Corn Ethanol Issues Not Expected to Significantly Impact Gasoline Prices in 2012 (Aug. 8, 2012), http://www.eia.gov/oog/info/twip/twiparch/120808/twipprint.html; Ethanol Producer Magazine, RFS under Scrutiny (Sept. 11, 2012), available at http://www.ethanolproducer.com/articles/9099/rfs-under-scrutiny. 26 See Energy Independence and Security Act of 2007 § 202(a)(2), 42 U.S.C. § 7545(o)(2)(B)(i)(II)-(IV) (2009) (providing specific volume requirements for advanced biofuels, including biodiesel and cellulosic biofuel). The advanced biofuels minimums apply from 2009 to 2022. The biodiesel requirement started in 2009 with volume minimums specified through 2012. The cellulosic requirement took effect in 2010 and extends until 2022. Id. However, EPA reduced the cellulosic biofuel standard for 2012, as it did in 2011 and 2010, because the projected volume of cellulosic biofuel production was less than the minimum volume set out by statute. See 2012 Renewable Fuel Standards, 77 Fed. Reg. 1320, 1323 (Jan. 9, 2012) (codified at 40 C.F.R. pt. 80); 2011 Renewable Fuel Standards, 75 Fed. Reg. 76790, 76791 (Dec. 9, 2010) (codified at 40 C.F.R. pt. 80); Changes to Renewable Fuel Standard Program, 75 Fed. Reg. 14670, 14675 (Mar. 26, 2010) (codified at 40 C.F.R. pt. 80). EPA anticipates it will also reduce the cellulosic biofuel standard for 2013. See EPA, Newsroom: EPA Finalizes 2012 Renewable Fuel Standards (Dec. 27, 2011), http://yosemite.epa.gov/opa/admpress.nsf/0/a7ce72844710be0a85257973006a20f3.

8
and sale.27 Three other facilities planned to start production during 2012.28 In addition to these
facilities, at least two other commercial-scale cellulosic ethanol plants are expected to complete
construction in 2013.29
III. Summary of Market Concentration Trends
Actual ethanol production increased this year even as production capacity decreased
slightly, reflecting greater utilization and more efficient use of existing capacity. Domestic
ethanol production increased approximately 2 percent between 2011 and 2012, from 13.7 billion
gallons to nearly 14 billion gallons.30 Production increased over 870 percent since 2000, when
domestic ethanol production was 1.6 billion gallons.31 Domestic ethanol production capacity
27 See 2012 Renewable Fuel Standards, 77 Fed. Reg. 1320, 1323 (Jan. 9, 2012) (codified at 40 C.F.R. pt. 80) (identifying six cellulosic biofuel plants that are producing or expected to begin producing in 2012: five will produce cellulosic ethanol and one will produce cellulosic gasoline and diesel); Ethanol Producer Magazine, EPA Awards … Registration for Production, Sale of Fuel (Aug. 10, 2012), available at http://ethanolproducer.com/articles/9027/epa-awards-ineos-bio-registration-for-production-sale-of-fuel. 28 See 2012 Renewable Fuel Standards, 77 Fed. Reg. 1320, 1323 (Jan. 9, 2012) (codified at 40 C.F.R. pt. 80). 29 See Ethanol Producer Magazine, Industry Gets Progress Report on Cellulosic Ethanol Projects (June 6, 2012), available at http://ethanolproducer.com/articles/8846/industry-gets-progress-report-on-cellulosic-ethanol-projects. 30 Production figures for 2012 cited in this report reflect production from July 2011 to June 2012; 2011 figures reflect production from July 2010 to June 2011. See EIA, Monthly U.S. Oxygenate Plant Production of Fuel Ethanol, http://www.eia.doe.gov/dnav/pet/hist/LeafHandler.ashx?n=pet&s=m_epooxe_yop_nus_1&f=m (last modified Sept. 27, 2012).
31 See RFA, Accelerating Industry Innovation: 2012 Ethanol Industry Outlook 3 (Jan. 2012), available at http://ethanolrfa.3cdn.net/d4ad995ffb7ae8fbfe_1vm62ypzd.pdf.

9
decreased slightly to approximately 14.9 billion annualized gallons as of September 201232 from
15.2 billion annualized gallons as of September 2011.33
The number of firms producing ethanol has decreased since last year’s report. As of
September 2012, 154 firms currently produce ethanol or likely will begin producing ethanol
within the next 12 to 18 months, as compared to 164 firms in 2011.34 The largest ethanol
producer’s share of domestic capacity is 11.1 percent, a slight decrease from its 11.5 percent
share in 2011 and below its 12 percent share in 2010.35 This figure is comparable to the largest
producer’s capacity share of 11 percent in 2008 and 2009, and it remains below the largest
producer’s capacity shares of 16 percent in 2007, 21 percent in 2006, and 26 percent in 2005.36
IV. Analysis37
Section 1501(a)(2) of the Energy Policy Act of 2005 instructs the Commission to
measure concentration in U.S. ethanol production using HHIs.38 HHIs can provide a snapshot of
32 RFA, Biorefinery Locations, http://ethanolrfa.org/bio-refinery-locations/ (last modified Sept. 25, 2012). 33 See 2011 Ethanol Report at 8. Unless indicated otherwise, measures of capacity in this report represent both current capacity and capacity under construction.
34 Id.
35 Id.
36 Id.
37 The background information in this section regarding HHI calculations and their relevance is consistent with the background information presented in last year’s Report on Ethanol Market Concentration. See id. at 9.
38 Energy Policy Act of 2005 § 1501(a)(2), supra note 1. A given market’s HHI is the sum of the squares of the individual market shares of all market participants. For example, a four-firm market with market shares of 30 percent, 30 percent, 20 percent, and 20 percent has an HHI of 2600 [(30*30) + (30*30) + (20*20) + (20*20) = 2600]. HHIs range from 10,000 in a one-firm (pure monopoly) market to a number close to zero in a highly unconcentrated market.

10
market concentration39 based upon the number of market participants and their respective sales,
production, or capacity. The Commission and the U.S. Department of Justice regularly use HHIs
to measure concentration in a relevant antitrust market as part of their analysis of the likely
effects of a merger or acquisition on competition in that market.40
To calculate the HHIs that Section 1501(a)(2) requires, we must assume that U.S. fuel
ethanol production is a relevant antitrust market.41 This assumption precludes consideration of a
broader or narrower relevant geographic market than the United States that could provide further
insight into how ethanol producers compete. This assumption also precludes consideration of a
broader relevant product market that includes other gasoline blending components that might be
economically viable and environmentally acceptable substitutes for ethanol. In the event that
ethanol competes with other blending components, HHIs based on a fuel ethanol market would
understate the amount of competition in the industry.
39 See supra note 8 (discussing the HHI threshold levels for characterizing a market as unconcentrated, moderately concentrated, or highly concentrated under the Horizontal Merger Guidelines). See also Horizontal Merger Guidelines § 5.3.
40 In the context of merger review, the difference between the pre-merger HHI and the post-merger HHI is one factor that may affect how the agency might view the competitive significance of the merger, all other circumstances remaining equal. See Horizontal Merger Guidelines § 5.3.
41 A relevant antitrust market has both product and geographic aspects. A relevant product market is a product or group of products such that a hypothetical profit-maximizing firm that was the only seller of those products likely would impose at least a small but significant and nontransitory increase in price (“SSNIP”). If such a price increase would not be profitable because of the loss of sales to other products, the product or group of products would not be a relevant product market. Similarly, a relevant geographic market is a region such that a hypothetical profit-maximizing firm that was the only seller of the relevant product in that region likely would impose at least a SSNIP above the competitive level. If such a price increase would not be profitable because of the loss of sales to sellers outside the region, the region would be too narrow to be a relevant geographic market. See Horizontal Merger Guidelines §§ 4.1-4.2.

11
As in previous years, this report presents six HHIs for the ethanol industry, calculated
using two different measures of market share and three different methods of allocating those
market shares. First, FTC staff calculated each producer’s market share based on the producer’s
domestic ethanol production capacity. FTC staff then performed three separate HHI
calculations, attributing the producer’s market share: (1) to the producer itself; (2) to the
producer or to the third-party firm that actually marketed the producer’s ethanol output; and
(3) to the third-party marketing firm only if that firm marketed the producer’s volumes pursuant
to a pooling agreement (and, absent such a pooling agreement, to the producer). Second, EIA
staff calculated market shares derived from its confidential ethanol production data. Using the
market share allocation methods described above, EIA staff then performed each of the HHI
calculations and provided the resulting production-based HHIs to FTC staff.42
Four of the six HHIs calculated for this report are higher than those calculated in 2011,
reflecting a relatively minor increase in concentration. The other two calculations yielded HHIs
just below those calculated for the 2011 Ethanol Report, indicating a decrease in concentration.
In all cases, the 2012 HHIs, like the 2011 HHIs, indicate that the domestic ethanol production
industry remains unconcentrated.
42 FTC staff provided EIA staff with the information necessary to attribute market shares to marketers where appropriate. EIA staff provided only the aggregated HHI figures to FTC staff and did not disclose the underlying confidential data or market shares.
12
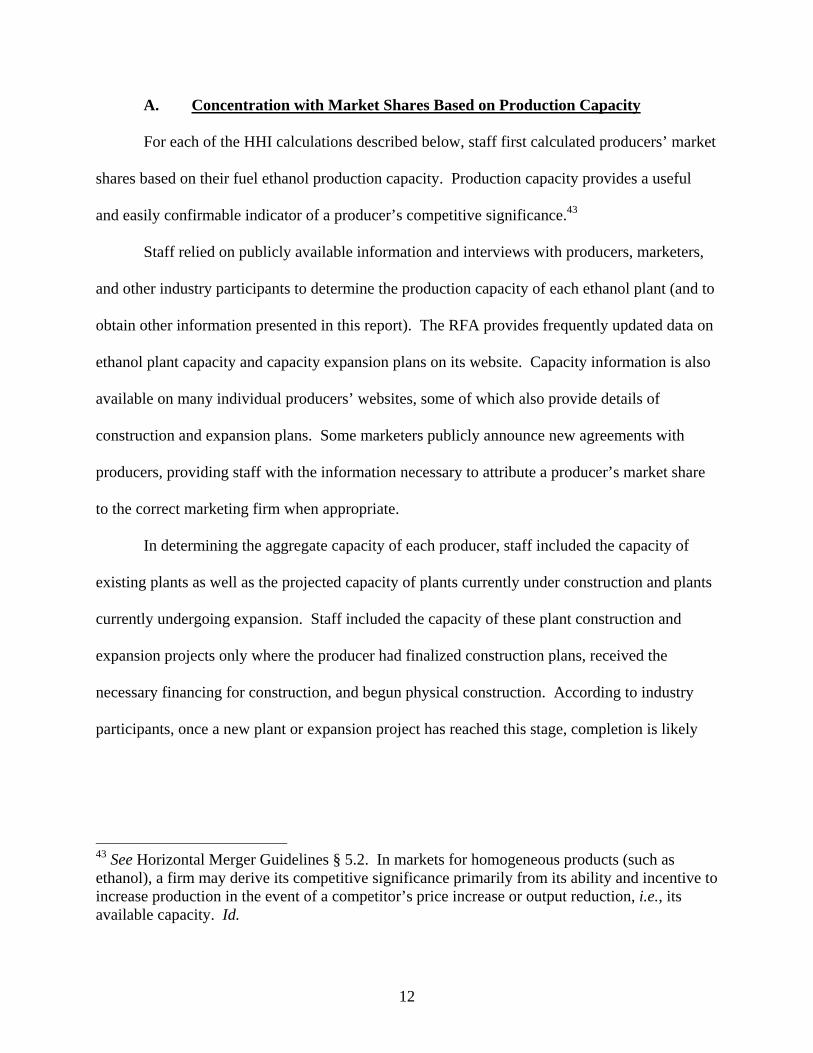
A. Concentration with Market Shares Based on Production Capacity
For each of the HHI calculations described below, staff first calculated producers’ market
shares based on their fuel ethanol production capacity. Production capacity provides a useful
and easily confirmable indicator of a producer’s competitive significance.43
Staff relied on publicly available information and interviews with producers, marketers,
and other industry participants to determine the production capacity of each ethanol plant (and to
obtain other information presented in this report). The RFA provides frequently updated data on
ethanol plant capacity and capacity expansion plans on its website. Capacity information is also
available on many individual producers’ websites, some of which also provide details of
construction and expansion plans. Some marketers publicly announce new agreements with
producers, providing staff with the information necessary to attribute a producer’s market share
to the correct marketing firm when appropriate.
In determining the aggregate capacity of each producer, staff included the capacity of
existing plants as well as the projected capacity of plants currently under construction and plants
currently undergoing expansion. Staff included the capacity of these plant construction and
expansion projects only where the producer had finalized construction plans, received the
necessary financing for construction, and begun physical construction. According to industry
participants, once a new plant or expansion project has reached this stage, completion is likely
43 See Horizontal Merger Guidelines § 5.2. In markets for homogeneous products (such as ethanol), a firm may derive its competitive significance primarily from its ability and incentive to increase production in the event of a competitor’s price increase or output reduction, i.e., its available capacity. Id.

13
within 12 to 18 months. Incorporating capacity from such projects into current market share
calculations is consistent with the approach set forth in the Horizontal Merger Guidelines.44
1. Attributing Market Shares to Producers
Under the simplest approach to market concentration, staff allocated market share to each
producer based on the producer’s percentage of total production capacity. This method of
calculation yielded an HHI of 290, unconcentrated under the Horizontal Merger Guidelines.45
This HHI is essentially unchanged from last year’s HHI of 291.46
2. Attributing Market Shares to Marketers
Staff’s second method of calculating market concentration is also capacity-based but
attributes each producer’s capacity to the firm marketing its ethanol. Many producers enter into
marketing agreements with third parties to market their ethanol to blenders and end users, while
44 See Horizontal Merger Guidelines § 5.1. The Guidelines include as market participants “rapid entrants” – firms that are not current producers but likely would respond rapidly in the event of a SSNIP, with a direct competitive impact and without incurring significant sunk costs. Such firms have competitive significance even though they do not currently supply the relevant market. Rapid entrants can also include firms that produce the relevant product but refrain from selling it in the relevant geographic market, as well as firms that clearly possess the necessary capacity to supply the relevant market rapidly. This is particularly likely in markets for homogeneous goods when that capacity is efficient and available (as is the case with many ethanol plants under construction or undergoing expansion). Id.
45 The market shares implicit in these HHI calculations may suggest an analytic precision that does not reflect the rate of change in this industry, particularly as producers frequently announce capacity additions, new plants, plant sales, and cancellations of plans to build new capacity. Staff’s HHI calculations represent staff’s best estimate of the industry’s concentration as of September 2012, the cut-off date for our analysis unless otherwise indicated. This approach therefore excludes any more recent publicly available information.
46 2011 Ethanol Report at 12.

14
other producers sell their output directly. For those producers that engage in direct sales, staff
attributed the market shares to the producers themselves.47
An ethanol marketer may represent and make limited decisions for multiple individual
producers, essentially aggregating these producers’ capacities under a single entity. For purposes
of competitive analysis, attributing production capacity to marketers rather than to the actual
producers provides a measure of industry concentration that captures this aggregation.
This approach yields an HHI of 608, unconcentrated under the Horizontal Merger
Guidelines. This HHI is slightly higher than the corresponding HHI of 585 in 2011.48
3. Attributing Market Shares to Marketers with Pooling Agreements
Staff’s final approach to concentration calculation attributes a producer’s market share to
its third-party marketer only when the marketer sells the producer’s output under the terms of a
pooling agreement. Under a pooling agreement, the marketing firm sells its client producers’
volumes in common rather than individually, which allows the marketing firm to make more
significant decisions for its client producers than a traditional marketing agreement. Although
the specific terms of pool marketing agreements vary, pool marketers generally sell ethanol to
customers, and assign a client plant or plants to fulfill each sale obligation. Each producer
receives a prorated share from the common revenue pool based on the volume it contributes.
The output from each plant generally earns an identical return, sometimes adjusted to reflect the
cost of transportation from a plant to its output’s destination. Each producer under a pooling
agreement receives purchase offers only from its marketer, which also represents other 47 In some instances, staff was unable to determine whether a producer marketed for itself or used an outside marketing firm. In these instances, staff attributed market shares to the producers.
48 2011 Ethanol Report at 13.

15
producers. By contrast, under a non-pooling marketing arrangement, the marketer sells its
producers’ volumes on a plant-specific basis and can present each producer with offers from
multiple buyers.
Because individual producers within a pooling arrangement do not participate directly in
negotiating the sale of their output, competition among the members of a given pool is limited if
present at all. Buyers deal only with the single marketer, which then allocates the production
capacity within its client portfolio to fulfill its output obligations. Therefore, attributing
production capacity to marketers only for those producers in pooling arrangements may capture
more accurately the competitive significance of firms in the ethanol industry. Under this
allocation approach, production volumes sold under non-pooling marketing arrangements
contribute to the producer’s market share rather than to the non-pool marketer’s share. Measured
in this way, the HHI is 325, unconcentrated under the Horizontal Merger Guidelines. This HHI
represents a slight decrease from last year’s HHI of 342.49
B. Concentration with Market Shares Based on Actual Production
At FTC staff’s request, EIA staff calculated industry concentration using market shares
based on market participants’ actual production volumes over the past year. Using production
data is instructive because capacity data have certain limitations, particularly insofar as stated
capacity does not necessarily represent actual production capabilities. Ethanol plants often can
produce as much as 10 to 15 percent more than their stated design capacities and tend to operate
at increasing rates as their owners and operators improve the production process and gain
49 Id. at 14.

16
expertise in operating their plants.50 In this respect, actual production may reflect a market
participant’s competitive significance more accurately than would its plants’ capacities.
There are some limitations to the accuracy of HHIs based on actual production, just as
there are limitations to HHIs based on production capacity. HHIs based on production over a
given period may overstate or understate actual concentration due to entry and exit of firms,
construction of new capacity, and variations in capacity utilization rates during the relevant time
frame. Specifically, the production-based HHIs provided below do not fully reflect the
deconcentrating impact of new facilities that began production during the last 12 months and
plant improvements that increased capacity during the last 12 months, nor do they fully reflect
the concentrating impact of plant closures and idlings during the period. In both cases, these
facilities will have produced only a fraction of what they otherwise would produce in a full year,
leading to an understatement (in the case of new facilities) or an overstatement (in the case of
idled facilities) of their competitive significance in the market. Similarly, the HHIs below do not
account for the effects on concentration of plant expansion, construction, and capacity-enhancing
improvement projects that are not yet in operation.51
EIA provided FTC staff with the final production-based HHIs contained in this report.
Firms that produce over eight million gallons of oxygenates (such as ethanol) per year must
report to EIA their monthly production volumes by product. These production data are
confidential. Therefore, EIA provided only the aggregated HHIs to FTC staff and did not
disclose the volumes of ethanol attributable to any individual producer or the market shares
50 See id. at 14-15.
51 See id. at 15.

17
based on those volumes.52 These production-based HHIs reflect actual production volumes from
July 2011 through June 2012.
Where EIA attributed the actual production market share directly to individual producers,
the resulting HHI is 328, an increase from the 2011 HHI of 284.53 The production-based HHI
calculated by attributing the market share of each producer to the firm that markets for that
producer results in an HHI of 686, an increase from the 2011 HHI of 601.54 Attributing a
producer’s market shares to its marketing firm only when the marketing is pursuant to a pooling
agreement yields an HHI of 368. This HHI is higher than the HHI of 328 in last year’s report.55
C. Ease of Entry and Imports
Today, the U.S. ethanol industry is unconcentrated, suggesting that an attempt to exercise
market power is unlikely. Should the industry become more concentrated in the future, an
increase in the price of ethanol resulting from anticompetitive conduct would likely remain
unsustainable due to both (1) the ease of entry into the ethanol industry and (2) the
responsiveness of imports to fluctuations in the U.S. ethanol price relative to foreign prices.
The U.S. ethanol production industry currently lacks significant barriers to entry.
Potential entrants can purchase and re-start existing production facilities that are currently idle as
a result of recent economic conditions such as low margins and high corn prices. In addition,
52 For producers for which EIA maintains production data, FTC staff provided EIA with the identity of those producers’ marketers and whether those producers entered into pooling agreements with their marketers. EIA used this information, in conjunction with its own data on ethanol production, to calculate the HHIs that attribute market share to marketers.
53 2011 Ethanol Report at 16.
54 Id.
55 Id.

18
construction of cellulosic ethanol plants and expansion of existing plants – through improved
plant processes – continue in the industry today, albeit at a reduced rate. An increase in supply
resulting from new entry likely would make any exercise of market power unsustainable.
The probable influx of ethanol imports also would likely restrain any potential exercise of
market power by a domestic firm. Ethanol import levels are responsive to fluctuations in the
price of U.S. ethanol relative to foreign ethanol prices, particularly prices for sugar cane-based
ethanol from Brazil. The expiration of the ethanol import tariff of $0.54 per gallon at the end of
201156 reduced the costs of importing ethanol relative to domestic production. If U.S. ethanol
prices were to increase due to the exercise of market power by a domestic firm or group of
firms,57 currently exported ethanol could remain in the domestic market,58 and imports would
likely increase.59 The likely response of ethanol imports to an anticompetitive increase in
domestic prices relative to foreign prices would render that increase unsustainable.
56 See Ethanol Producer Magazine, UNICA Applauds Ending of Ethanol Import Tariff (Dec. 29, 2011), available at http://www.ethanolproducer.com/articles/8449/unica-applauds-ending-of-ethanol-import-tariff. 57 The level of concentration and the large number of market participants in the U.S. ethanol production industry suggest that collusion is unlikely among a sufficient number of firms to exercise market power. In the event of such collusion (in the form of an export cartel or otherwise), imports likely would continue to act as a constraint on the cartel’s exercise of market power.
58 In 2011, the United States exported 1.2 billion gallons of ethanol, compared to less than 400 million gallons in 2010. EIA, This Week In Petroleum: Developments in U.S. Ethanol Exports (July 18, 2012), http://www.eia.gov/oog/info/twip/twiparch/120718/twipprint.html. 59 In 2012, the United States imported 153 million gallons of ethanol, compared to 11 million gallons imported in the prior year. See RFA, Monthly U.S. Fuel Ethanol Production, http://ethanolrfa.org/pages/monthly-fuel-ethanol-production-demand (last visited Oct. 2, 2012). The RFS requirement for advanced biofuels can be satisfied with imported sugar cane-based ethanol.

19
Even if domestic ethanol production were more concentrated than it is, the ease with
which new firms can enter the domestic market and the responsiveness of ethanol imports to
relative price changes likely would constrain anticompetitive behavior by domestic firms.
V. Conclusion
Ethanol production has remained unconcentrated over the last year. Regardless of the
particular measure of market share or the market share allocation method used to calculate
concentration, the low concentration levels that characterize the U.S. ethanol production industry
have persisted. Although some of the 2012 HHIs reflect an increase in concentration from 2011,
the industry remains less concentrated than it was at the time of the first Report on Ethanol
Market Concentration in 2005. Furthermore, the ease of entry by new firms and the availability
of ethanol imports provide additional constraints on the exercise of market power by current
industry participants. These dynamics make it extremely unlikely that a single ethanol producer
or marketer or a group of such firms could exercise market power to set prices or coordinate on
price or output levels.

20
Figure 1: Domestic Fuel Ethanol Concentration60
Concentration Based on Capacity 2011 HHI 2012 HHI
Shares attributed to each producer 291 290
Shares attributed to marketers for all marketing agreements 585 608
Shares attributed to marketers only for pooling agreements 342 325
Concentration Based on Production 2011 HHI 2012 HHI
Shares attributed to each producer 284 328
Shares attributed to marketers for all marketing agreements 601 686
Shares attributed to marketers only for pooling agreements 328 368
Source: Production HHIs from EIA Note: Capacity for 2011 includes the capacity as of September of 2011 and the capacity additions under construction and expected to be completed within 12 to 18 months after September 2011. Capacity for 2012 includes the current capacity as of September 2012 and the capacity additions under construction and expected to be completed within 12 to 18 months after September 2012. Production data for 2011 are from July 2010 through June 2011, and production data for 2012 are from July 2011 through June 2012.
60 As discussed in note 8, supra, the Commission and the Department of Justice characterize markets with HHIs below 1500 as unconcentrated. HHIs between 1500 and 2500 indicate moderately concentrated markets, and HHIs over 2500 indicate highly concentrated markets that are more likely to pose competitive concerns. An increase in the HHI of less than 100 points is unlikely to have adverse competitive effects. Horizontal Merger Guidelines § 5.3.
21
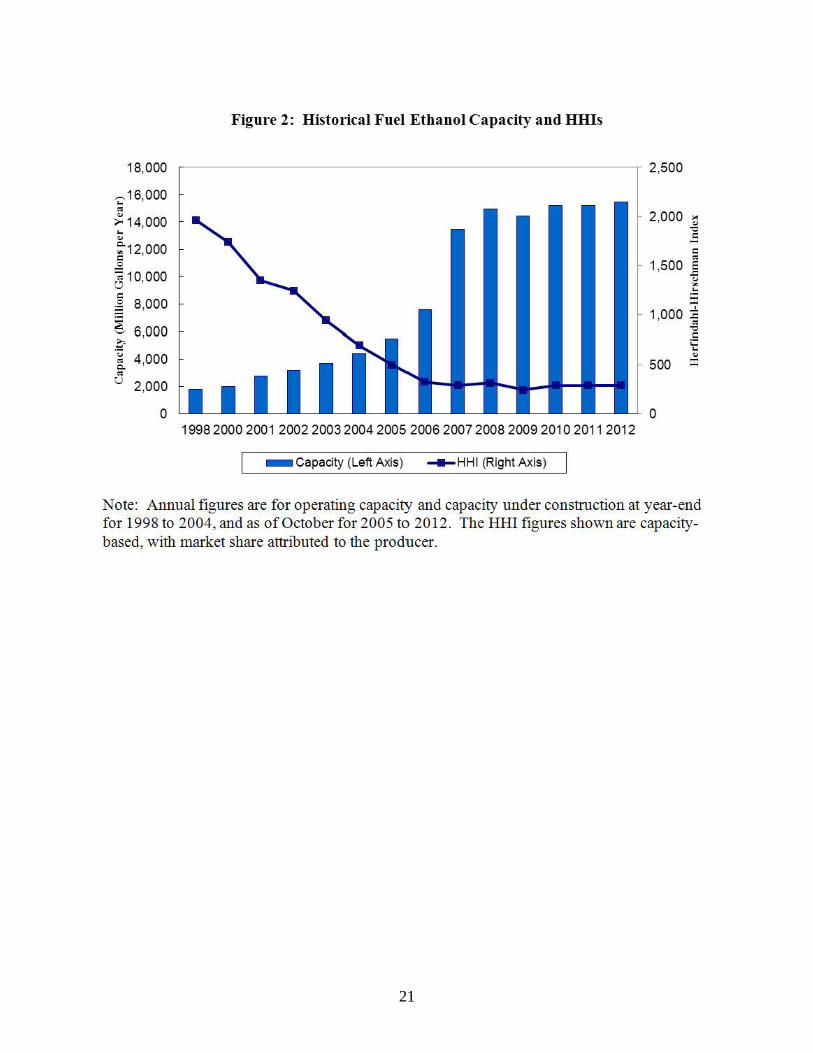
Figure 2: Histo rical Fuel Ethanol Capacity and HHis
18,000 2,500
-;:-- 16,000 .. 2,000 .,
>< ><14,000 ., .. "=' ., c
~12, 000 -c .. 0 1,500 .§ 810,000 " "' .. c s ~ 8,000
1,000 :E ~ ..
6,000 "=' .s $- .... '[ 4,000
.. ., 500 = ..
u 2,000
0 0 19982000200120022003200420052006200720082009201020112012
- Capacity (Left Axis) - H HI (Right Axis)
Note: Annual figures are for operating capacity and capacity under construction at year-end for 1998 to 2004, and as of October for 2005 to 2012. The HHI figures shown are capacitybased, with market share attributed to the producer.