2012 Pillar 3 Report Final - AIB Personal Banking – Allied Irish … · · 2018-04-30EBS...
70
PILLAR 3 DISCLOSURES 2012 AIB Group 31 December 2012
Transcript of 2012 Pillar 3 Report Final - AIB Personal Banking – Allied Irish … · · 2018-04-30EBS...

PILLAR 3 DISCLOSURES 2012
AIB Group 31 December 2012

Forward-looking statements A number of statements contained in this document will not be based on historical fact, but will be “forward-looking” statements within the meaning of Section 27A of the US Securities Act of 1933 and Section 21E of the US Securities Exchange Act of 1934. Actual results may differ materially from those projected in the forward-looking statements. Factors that could cause actual results to differ materially from those in the forward-looking statements include, but are not limited to, financial instability within the Eurozone, global, national and regional economic conditions, further national austerity and budget measures, levels of market interest rates, credit or other risks of lending and investment activities, competitive, legislative and regulatory factors and technology change. Any forward-looking statements made by or on behalf of the Group speak only as of the date they are made.

3
Contents
1. Introduction and AIB Group key information 6 Overview 6
2. Capital and capital management 8 Introduction 8 Capital Requirements Directive (“CRD”) 8 Regulatory capital ratios 9
3. Risk management 12 Introduction 12 Risk factors 12 Individual risk types 12
4. Credit Risk – Overview 14
5. Credit Risk – Standardised Approach 17 Use of external credit ratings 17
6. Credit Risk – Foundation Internal Ratings Based Approach 25 Regulatory approval and transition 25 Internal ratings process by exposure class 26 Foundation IRB obligor grades 31
7. Credit Risk Mitigation 34 Collateral 34
8. Credit Risk – Impairment 35 Past due 35 Impairment 36 Loss experience in the preceding period – Foundation IRB Approach 38
9. Counterparty credit risks 40 Assigning internal capital and credit limits for counterparty credit exposure 40 Policies for securing collateral and establishing credit reserves 41 Policies with respect to one-way exposures 41 Change in credit rating 41 Credit derivative hedges 41 Derivatives counterparty credit risk 42 Credit derivative transactions product distribution 43

4
10. Securitisations 44 Objectives in relation to securitisation activity 44 Extent of the Group’s involvement in each securitisation 44 Accounting policies 45 Securitisation risks, monitoring and hedging policies 45 Calculating risk weighted exposure amounts 45 External Credit Assessment Institutions 46
11. Equity exposures in the banking book 49
12. Non-trading interest rate risk 52
Appendix 1: Parent and subsidiary disclosures 54
Appendix 2: Own funds 59
Appendix 3: Remuneration Disclosures 62
Glossary of definitions and explanations 66

5
Background and context
Background
This document represents the ‘Pillar 3’ disclosures for AIB Group as at 31 December 2012, as required by directives 2006/48/EC, 2006/49/EC and 2010/76/EU, known as the Capital Requirements Directive (“CRD”) relating to the taking up and pursuit of the business of credit institutions.
The CRD, which was transposed into Irish law at the end of 2006, was the basis for implementing the Basel II framework in the European Union. This framework is based on three pillars. Pillar 1 (‘minimum capital requirements’) defines rules for the calculation of credit, market and operational risk. Under Pillar 2 (‘supervisory review’) banks may estimate their own internal capital requirements through an Internal Capital Adequacy Assessment Process (“ICAAP”), which is subject to supervisory review and evaluation. Pillar 3 (‘market discipline’) involves the disclosure of a suite of qualitative and quantitative risk management information to the market.
Basis of disclosures Allied Irish Banks, p.l.c. (“AIB” or the “Parent Company”) and its subsidiaries (collectively “AIB Group” or “Group”) prepares consolidated financial statements (“consolidated accounts”) under International Financial Reporting Standards (“IFRS”).
Allied Irish Banks, p.l.c. is a credit institution authorised by the Central Bank of Ireland (“Central Bank”). Both the Parent Company and the Group are required to file regulatory returns with the Central Bank for the purpose of assessing, inter alia, their capital adequacy and their balance sheets.
All subsidiaries are consolidated for both financial statement presentation and regulatory reporting and accordingly for AIB Group, the regulatory returns and financial statements are similar other than presentation.
The disclosures contained in this report have been prepared for Allied Irish Banks, p.l.c. and its subsidiaries on a Group consolidated basis as at 31 December 2012. These disclosures cover both the Pillar 3 qualitative and quantitative disclosure requirements and incorporate the requirements of the amending Directive 2010/76/EU which sets out additional requirements for the trading book, re-securitisations and the supervisory review of remuneration policies.
The Pillar 3 disclosures have been prepared to explain the basis on which the Group has prepared and disclosed capital requirements and information about the management of certain risks and for no other purpose. They do not constitute any form of financial statement and should not be relied upon exclusively in making any judgement on the Group. They should be read in conjunction with the other information made public by AIB Group and available on the AIB Group website, including the 2012 Annual Financial Report.
Frequency This report is made on an annual basis, with the disclosures based on the financial year-end date of 31 December.
Reporting conventions In this report comparative data is included where relevant.
Disclosure policy The Group Disclosure Committee first approved the formal Pillar 3 disclosure policy during 2008, and the Group Disclosure Committee has reviewed and approved the policy in 2013.
Media and location The Pillar 3 report is published on AIB Group’s website (www.aibgroup.com), alongside the 2012 Annual Financial Report. Pillar 3 reports from previous years are also available on this website.
Verification The Pillar 3 disclosures have been subject to internal review procedures broadly consistent with those undertaken for unaudited information published in the 2012 Annual Financial Report and have not been audited by the Group’s external auditors. Any audited information that has been included in these disclosures is included in the 2012 Annual Financial Report.

6
1. Introduction and AIB Group key information
Overview
i. Basis of consolidation for accounting and prudential purposes Allied Irish Banks, p.l.c. is the parent company in AIB Group and is a European Economic Area institution regulated by the Central Bank of Ireland (“Central Bank”). AIB Group prepares consolidated financial statements under International Financial Reporting Standards (“IFRS”) as issued by the IASB and adopted by the EU for statutory reporting purposes (“the Consolidated Accounts”). Additionally, AIB Group is required to prepare regulatory returns (“the Regulatory Returns”) for the purpose of assessing its capital adequacy and monitoring its balance sheet. All subsidiaries are consolidated for both Group statutory and regulatory purposes. Details of significant subsidiary (a) capital requirements and (b) risk weighted assets are set out in Appendix 1 to this document.
Organisational structure of licensed banks within AIB Group3
as at 31 December 2012
ii. Transfer of capital between parent company and its subsidiaries Allied Irish Banks, p.l.c. is the parent company of a number of licensed subsidiary banks and investment firms which are subject to individual capital adequacy requirements. Each of these licensed subsidiaries is subject to minimum capital requirements imposed by their individual regulators.
In order to maintain capital and/or liquidity ratios at or above the levels set down by their regulators, the licensed subsidiaries are unable to remit capital to the parent when to do so would result in such ratios being breached.
iii. Solo consolidation The balance sheet of Allied Irish Banks, p.l.c. includes all activities of the reporting entity including its foreign branches for the purpose of preparing its financial statements under IFRS. Transactions between branches of Allied Irish Banks, p.l.c. are excluded in presenting the balance sheet at each reporting date. The Central Bank has adopted the national discretion under Article 70 of the Capital Requirements Directive (“CRD”) concerning the ability of institutions to include certain subsidiaries in their individual regulatory return. This treatment, termed ‘solo consolidation’, in effect treats such subsidiaries as if they were branches of the parent rather than separate entities in their own right.
1 For the purposes of illustration, intermediate parent company of AIB Group (UK) p.l.c. has been omitted from this diagram.
2 On 5 April 2012, AIB announced that it is winding down its operations in Jersey and the Isle of Man and that it intends to
cease operating on these islands on 31 December 2013. 3
For a description of the Group’s 2012 operating market segments please refer to pages 12 – 14 of the 2012 Annual
Financial Report.
Allied Irish Banks, p.l.c.
AIB Mortgage Bank
AIB Group (UK) p.l.c.
1
AIB Bank (CI) Limited
2
AIB International Savings Limited
2 EBS Limited
EBS Mortgage Finance

7
There are certain criteria that must be met before the Central Bank will approve the inclusion of non-authorised subsidiaries in the ‘solo consolidation’. Allied Irish Banks, p.l.c. has received approval to prepare its regulatory return on a solo consolidation basis. However, certain legal entities are treated differently for statutory reporting purposes and compare to their CRD regulatory accounting as follows:
Entity Statutory Accounting
Treatment CRD Regulatory Treatment
Associated undertakings
1
Equity Accounting For holdings greater than 10% of an associate’s capital, deduction from Group capital for investment in excess of 10% of the Total capital of the associate (50:50 from Core tier 1 and Tier 2 capital). Balance of investment added to Risk Weighted Average (“RWA”).
Securitisation vehicles
Fully Consolidated A first loss deduction is taken, 50% from Core tier 1 capital and 50% from Tier 2 capital for tranches retained in originated securitisations which have obtained Pillar 1 derecognition. The quantum of the deduction is set at the FIRB value of the securitised portfolios.
In accordance with the discretion provided for in Article 72 of the CRD (and except for the information presented in Annex II of the CRD), AIB Group presents its Pillar 3 information on an AIB Group consolidated basis.
There were no additional capital initiatives during 2012 as AIB’s capital requirements as set out in the Central Bank’s Financial Measures Programme were met by 31 July 2011 through the various recapitalisation measures by the Irish Government in addition to certain measures undertaken by AIB. Distinctions between Pillar 3 and IFRS quantitative disclosures The 2012 Annual Financial Report compiles information based on IFRS accounting standards, whereas certain information presented in this Pillar 3 report has been complied based on capital adequacy concepts and rules, as contained in CRD. It should be noted that there are significant differences in the two bases of calculation of the financial data. This in particular relates to credit risk disclosures where the credit exposure under CRD, is defined as the expected amount of exposure at default (“EAD”) and is estimated under specified regulatory rules. The total assets under IFRS at 31 December 2012 were €122 billion whereas the total regulatory EAD was €135 billion, a difference of €13 billion. The main drivers of this difference are as follows:
• The inclusion in EAD of € 5.4 billion non-collateralised repurchase agreement borrowings at 31 December 2012. The resulting exposure to banks and central banks arises in cases where the fair value of collateral provided to secure the borrowing is in excess of the cash received.
• Specific provisions on IRB exposures of € 3.8 billion are not reflected in the calculation of EAD for IRB portfolios, whereas from an IFRS treatment perspective these assets will be shown net of all provisions.
• The inclusion in EAD of undrawn committed credit facilities, contingent liabilities and other off balance sheet items in the amount of € 2.9 billion. For the purposes of the calculation of EAD, regulatory credit conversion factors are applied to convert the contractual amount of a commitment into a credit equivalent amount. This is not reflected in the IFRS assets.
• An amount of € 0.3 billion IFRS assets, in respect of intangible assets and investments in associates and joint ventures, is not reflected in EAD and instead deducted from regulatory capital.
1 Associated undertakings – From 1 January 2013 the treatment of participation in insurance undertakings has changed. The
regulatory treatment is to fully deduct the investment in the associate from capital, split 50:50 from Core tier 1 and Tier 2 capital.

8
2. Capital and capital management
Introduction
The objectives of the Group’s capital management policy are to at all times comply with regulatory capital requirements and to ensure that the Group has sufficient capital to cover the current and future risks inherent in its business and to support its future development. The Group does this through an Internal Capital Adequacy Assessment Process (“ICAAP”), which is subject to supervisory review and evaluation. The minimum regulatory capital requirements set by the Central Bank, which reflect the requirements of the Capital Requirements Directive (“CRD”) established a floor of 4% under which the core tier 1 capital ratio must not fall (8% for total capital ratio). Following the Prudential Capital Assessment Review (“PCAR”) in March 2011, the Central Bank announced a new minimum capital target for AIB of 10.5% core tier 1 capital ratio in a base scenario and 6% core tier 1 capital ratio in a stressed scenario. These target ratios form the basis of the Group’s capital management policy and are the capital adequacy requirements effective as at 31 December 2012. The Group’s capital base underwent significant changes in 2011, the most significant of which was the recapitalisation of the Group by the Irish Government following the completion of the Central Banks’ Financial Measures Programme. As a result of the PCAR 2011 exercise, AIB was required to raise capital of € 14.8 billion which was completed in July 2011 via the following: - - Liability management exercise € 2.1 billion; - Equity placing to the NPRFC € 5 billion; - Contingent capital issue € 1.6 billion; - Capital contribution € 6.1 billion. In May 2012, following an Irish High Court order, € 5.9 billion was transferred into reserves. € 2 billion of share premium was cancelled and € 3.9 billion was reduced from capital redemption reserves. This had no impact on the Group’s capital base in 2012. The Group’s core tier 1 capital ratio was 15.1% as at 31 December 2012 from 17.9% as at 31 December 2011. “Table 2 – Capital adequacy information” on page 10 summarises the Group’s risk weighted assets and key capital ratios.
Capital Requirements Directive (“CRD”)
The CRD, which came into force on 1 January 2007, is the EU directive that establishes the regulatory capital adequacy requirements for credit institutions. It is set out in three distinct ‘pillars’. Pillar 1 is concerned with the calculation of the minimum capital requirements for credit risk, market risk and operational risk. It introduced greater granularity and sensitivity in risk weightings, including for certain portfolios, risk weightings determined by regulatory approved internal rating models (known as the Internal Ratings Based approach). Under Pillar 2, banks are required to estimate their own internal capital requirements to cover all material risks (not limited to the pillar risks) as part of their ICAAP which is then subject to supervisory review and evaluation (known as the “SREP”). Pillar 3 (‘market discipline’) involves the disclosure of a suite of qualitative and quantitative risk management information to the market. Since it first came into effect, the CRD has been amended a number of times (“CRD II” and “CRD III”). These amendments reflected in the main; new requirements on hybrid tier one capital instruments; updates to the large exposures regime; improved risk management requirements for securitisations; and changes to trading book capital requirements. These amendments have not had a material impact on the capital position of the Group. In July 2011, a further amendment to the CRD was proposed by the European Commission to implement Basel 3 in Europe. This new directive, CRD IV, was due to be in place from 1 January 2013. The implementation of CRD IV has been delayed from its original target implementation date, as drafting of the underlying regulations and directive has not completed. It is based on the Basel 3 recommendations, which were developed in response to the recent banking crisis and aims to strengthen the capital adequacy of banks by:

9
- increasing the quality of eligible capital that banks can include in their capital base for capital adequacy purposes; and
- increasing the quantity of capital held by setting significantly higher minimum capital ratios and identifying capital buffers that can be imposed by national supervisors according to their assessment of risk exposure.
The group’s pro forma Common Equity Tier 1 (“CET 1”) ratio, including the 2009 Preference Shares (which will continue to be considered as CET 1 until 31 December 2017), is estimated at 9.7% as at 31 December 2012. (This pro forma ratio is calculated taking a full deduction of deferred tax assets, however, current guidance in relation to deferred tax transitional arrangements has now increased from five to ten years.).
Regulatory capital ratios
Risk weighted assets (“RWAs”) reduced by € 12.9 billion in the year to 31 December 2012. The credit RWAs reduction of € 11.5 billion is primarily a result of deleveraging, amortisations and increased provisions, which were offset, to a degree, by deterioration in credit quality. The RWAs attached to Operational risk reduced by € 1.4 billion in 2012 reflecting the reduced levels of income in the annual calculation, arising, in the main, from disposals and the impact of the economic decline in the last three years Core tier 1 capital has reduced by € 4.3 billion in the period; this is primarily due to the attributable loss for the period. The impact of this movement together with the decrease in RWAs is a reduction in the core tier 1 capital ratio from 17.9% at 31 December 2011 to 15.1% at 31 December 2012. The core tier 1 ratio is in excess of the 10.5% target core tier 1 requirement as announced under the Financial Measures Programme in March 2011. Total capital reduced by € 4.7 billion in the year to 31 December 2012, due to the € 4.3 billion movements in core tier 1 capital described above and a € 0.4 billion reduction in tier 2 capital. The reduction in tier 2 capital results from the continued amortisation of the contingent capital instrument that is within five years to maturity. The contingent capital instrument is due to mature in July 2016. The impact of this movement together with the decrease in RWAs is a reduction in the total capital ratio from 20.5% at 31 December 2011 to 17.6% at 31 December 2012. An analysis of the components of the capital base is set out overleaf in Table 2: Capital adequacy information.

10
Table 2: Capital adequacy information – components of capital base
2012
€ m 2011 € m
Tier 1
Paid up share capital and related share premium
Eligible reserves
Regulatory adjustments
Intangible assets and goodwill
Other regulatory deductions
8,096
3,022
(190)
(122)
(312)
10,096
5,313
(178)
(85)
(263)
Core tier 1 capital 10,806 15,146
Supervisory deductions from tier 1
Unconsolidated financial investments
Securitisations
(6)
(45)
(2)
(79)
Total tier 1 capital (including supervisory deductions)
10,755 15,065
Tier 2
Eligible reserves
IBNR provisions
Subordinated term loan capital
Supervisory deductions from tier 2 capital
Unconsolidated financial investments
Holdings in other credit and financial institutions
125
682
1,154
(6)
(45)
(51)
125
795
1,472
(2)
(79)
(81)
Total tier 2 capital 1,910 2,311
Gross capital
Supervisory deductions – Holdings in insurance undertakings
12,665
(74)
17,376
(74)
Total capital 12,591 17,302
Risk weighted assets
Credit risk
Market risk
Operational risk
66,335
616
4,466
77,863
560
5,856
Total risk weighted assets 71,417 84,279
Capital ratios
Core tier 1
Total
15.1%
17.6%
17.9%
20.5%

11
Table 3a below summarises the risk weighted assets (“RWA”), minimum capital requirements and total exposures (Exposures at Default) of the Group, which are further analysed throughout this report.
Table 3a: Group capital adequacy information
2012
Total exposures
1
€ m
Risk weighted assets
€ m
Minimum capital requirement
2
€ m
Credit risk – Standardised approach 70,081 43,633 3,491
Credit risk – IRB approach 65,119 22,702 1,816
Market risk – Standardised approach (Table 3b) N/A 616 49
Operational risk – Standardised approach N/A 4,466 357
135,200 71,417 5,713
2011
Total exposures
€ m
Risk weighted assets
€ m
Minimum capital
requirement
€ m
Credit risk – Standardised approach 87,435 50,428 4,035
Credit risk – IRB approach 69,173 27,435 2,196
Market risk – Standardised approach (Table 3b) N/A 560 45
Operational risk – Standardised approach N/A 5,856 468
156,608 84,279 6,744
Table 3b: Market risk – minimum capital requirement
Market risk – minimum capital requirement
2012
€ m
2011
€ m
Interest rate PRR3 26 28
Equity rate PRR 7 2
Foreign exchange PRR 11 2
Investment firms 5 13
49 45
1 Exposure at default (“EAD”) represents the institution’s best estimate of its expected gross exposure for each facility upon
a borrower’s default, giving full recognition to drawn and undrawn credit lines and regardless of whether such undrawn lines are committed or advised lines. 2 Based on 8% of the risk weighted asset amount.
3 Position risk requirement.

12
3. Risk management
Introduction
The Group assumes a variety of risks in undertaking its business activities. Risk is defined as any event that could impact the core earnings capacity of the Group, increase earnings or cash-flow volatility, reduce capital, threaten business reputation or viability, and/or breach regulatory or legal obligations. AIB has adopted an Enterprise Risk Management approach to identifying, assessing and managing risks, the core elements of which are set out in a revised Enterprise Risk Management Framework which was approved by the Board in March 2012. This framework is in turn supported by a number of frameworks covering the management of specific risk categories (credit risk, operational risk, etc) which were reviewed and approved by the Board over the course of 2012.
Risk factors
The Group’s approach to identifying and monitoring the principal risks and uncertainties it faces is informed by risk factors. All of the Group’s activities involve, to varying degrees, the measurement, evaluation, acceptance and management of risks which are assessed on a Group wide basis. Certain risks can be mitigated by the use of safeguards and appropriate systems and actions which form part of the Group’s risk management framework. The principal risks and uncertainties facing the Group fall under the following broad categories:
- Macro-economic and geopolitical risk; - Macro-prudential, regulatory and legal risks to the business model; and, - Risks relating to business operations, governance and internal control systems. The risks pertaining to each of these categories are described in detail on pages 58 to 64 of the 2012 Annual Financial Report.
Individual risk types The following individual risk types have been identified through the Group’s risk assessment process:
- Credit risk; - Liquidity risk; - Market risk; - Structural foreign exchange risk; - Operational risk; - Regulatory compliance risk; and - Pension risk.
The individual risk types listed above are described in detail on pages 68 – 155 of the 2012 Annual Financial Report, with prefaces to Credit risk, Market risk and Operational risk included below. Further discussion on Credit Risk can also be found in Sections 4 - 9 of this Report. Credit risk Credit risk is the risk that the Group will incur losses as a result of a customer or counterparty being unable or unwilling to meet a commitment that it has entered into. Credit exposure arises in relation to lending activities to customers and banks, including ‘off-balance sheet’ guarantees and commitments, the trading portfolio, financial investments available for sale, and derivatives. Concentrations in particular portfolio sectors, such as property and construction, can impact the overall level of credit risk. As at 31 December 2012, the Group uses a combination of Standardised and IRB Approaches for assessing its capital requirements for credit risk.
13
Market risk Market risk is the risk relating to the uncertainty of returns attributable to fluctuations in market factors. Where the uncertainty is expressed as a potential loss in earnings or value, it represents a risk to the income and capital position of the Group. Market risk includes repricing risk, curve risk, basis risk, optionality risk, valuation risk and concentration risk. The Group is exposed to market risk through the following risk factors: interest rates, foreign exchange, equity prices, inflation rates and credit spreads. AIB Group uses the Standardised Approach for assessing its capital requirements for trading book market risk. As set out on page 11, of the total minimum capital requirement of € 5,713 million, the minimum capital requirement for Market risk amounts to € 49 million. Operational risk Operational risk is the risk of loss resulting from inadequate or failed internal processes, people and systems or from external events. It includes legal risk, but excludes strategic and business risk. In essence, operational risk is a broad range of individual risk types which include information technology, business continuity, health and safety risks, and legal risk. AIB Group uses the Standardised Approach for assessing its capital requirements for operational risk.

14
4. Credit Risk – Overview
One of the Group’s main sources of income from on-going activities arises from granting credit. Accordingly, this exposes it to its most significant risk, namely credit risk. The most significant credit risks in AIB Group arise from traditional lending activities to corporate, commercial and personal customers and to sovereigns and banks. Credit risk also arises through the use of derivatives, off-balance sheet guarantees and commitments through the Group’s trading and ‘available for sale’ portfolios of financial instruments. Capital requirements are based on the perceived level of risk of individual credit exposures. A description of how AIB manages, monitors and reports credit risk is outlined in the “Risk management” section on pages 57- 166 of the 2012 Annual Financial Report.
The Capital Requirements Directive (“CRD”) provides two approaches for the calculation of minimum regulatory capital requirements for credit risk:
a) The Standardised Approach; and b) Internal Ratings Based Approach (“IRB Approach”), which can be sub divided into
i. Foundation Internal Ratings Based Approach (“Foundation IRB Approach”); ii. Advanced Internal Ratings Based Approach (“Advanced IRB Approach”); and iii. Retail Internal Ratings Based Approach (“Retail IRB Approach”).
Under the Standardised Approach, risk weightings for rated counterparties are determined on the basis of the external credit rating assigned to the counterparty. For non-rated counterparties and certain other types of exposure, regulatory-determined standardised risk weightings are used.
The IRB Approach allows banks, subject to regulatory approval, use their own estimates of
certain risk components to derive regulatory capital requirements for credit risk across different
asset classes. The relevant risk components are probability of default (“PD”), loss given default
(“LGD”) and exposure at default (“EAD”). For non-retail exposures, there are two IRB approaches.
Under the Foundation IRB Approach, banks use their own estimate of PD, and regulatory estimates
of LGD and EAD. Under the Advanced IRB Approach, banks use their own estimates of all three
risk components. For retail exposures, there is only one IRB approach – this uses internal estimates
of all three risk components.
As at 31 December 2012, the Group used a combination of Standardised and IRB
Approaches for assessing its capital requirements for credit risk. It has received regulatory approval
to use the Foundation IRB Approach for certain sovereign, bank and corporate exposures, and uses
the Retail IRB Approach for certain residential mortgage exposures (henceforth, for ease of
reference within this document, this combination of Foundation and Retail IRB approval will be
referred to as approval to use a Foundation IRB Approach). The Group’s exposures under both Standardised and Foundation IRB approaches are set
out in Sections 5 and 6. Additional commentary on specific credit risks arising from certain transactions including derivative transactions, repurchase agreements and securitisations are set out in Sections 9 and 10 of this document.
These disclosures have been provided on a Group consolidated basis and include assets which, as at 31 December 2012, were held for sale. Further information and analysis is available in the 2012 Annual Financial Report on the Group website: www.aibgroup.com.
The following guidelines apply to the tables throughout this document and should be read in conjunction with the “Glossary of definitions and explanations”:
a) The Group reports exposure values as Exposure at Default (“EAD”) which is after the application of Credit Risk Mitigation (“CRM”) and Credit Conversion Factors (“CCFs”);
b) Total gross exposure is before CRM, CCFs and offsets; c) Total exposure is after CRM, CCFs and after specific offsets; d) Items belonging to high risk categories include, subject to the discretion of competent
authorities, exposures associated with particularly high risks such as investments in venture capital firms and private equity investments;
e) “Other items” refers to other assets including land and buildings, plant and machinery, other fixtures and fittings, tools and equipment, payments on account, current tax and deferred tax.
The capital requirements for exposures calculated under the Standardised Approach and Foundation IRB Approach and the related exposure values are set out in the following table.

15
Table 4: Total exposures (EAD) by exposure class and related minimum capital requirements
2012 2011
Total
exposures
Minimum capital
requirement Total
exposures
Minimum capital
requirement
Exposure class € m € m € m € m
Standardised exposure class
Central governments and central banks 18,516 3 25,576 2
Regional governments or local authorities - - - -
Administrative bodies and non-commercial undertakings 38 3 39 3
Institutions1 1,098 27 3,122 58
Corporates 6,935 555 8,952 715
Retail 4,983 299 5,597 336
Secured on real estate property2 20,354 1,055 26,409 1,451
Past due items3 11,676 1,094 10,946 1,001
Items belonging to regulatory high risk categories 194 23 448 54
Covered Bonds 426 8 490 9
Securitisations 85 28 88 24
Other items 5,776 396 5,768 382
Total Standardised Approach 70,081 3,491 87,435 4,035
Foundation IRB exposure class
Central governments and central banks 20,064 6 18,148 7
Institutions1 6,036 88 7,379 160
Corporates 13,047 636 15,751 875
Retail42
24,663 989 25,044 935
Securitisation positions 1,303 96 2,845 218
Non-credit obligation assets 6 1 6 1
Total Foundation IRB Approach 65,119 1,816 69,173 2,196
Total Credit Risk53 135,200 5,307 156,608 6,231
Overall total exposures fell by 13.7% (€ 21.4 billion) in 2012 compared to 2011, comprising a € 17.3 billion decrease in standardised exposures and a € 4.1 billion decrease in IRB exposures, reflecting the Group’s continued policy of non-core deleveraging and muted loan demand in 2012. The credit risk capital requirement also fell, broadly in line with the above, and was down 14.8% in the year. Within the standardised portfolio, the main drivers of the reduction in exposures occurred in the “Central governments and central banks” and “Secured on real estate property” exposure classes which decreased by € 7.1 billion and € 6.1 billion respectively. The decline in the former is primarily due to a decrease in sovereign exposures in EBS of € 3.7 billion and a decrease in the NAMA bond of € 2.4 billion. The latter decrease is primarily attributable to deleveraging activities in the period in Corporate, Institutional and Business Banking (“CICB”) and AIB UK in particular, and
1
Institutions exposure class predominantly relates to banks. 2
The total exposures (EAD) in the secured on real estate property exposure class includes a significant portion of property
portfolios in Corporate, Institutional & Business Banking (“CICB”), Personal & Business Banking (“PBB”) and AIB UK, as well as residential mortgages in EBS and AIB UK. The Group operating market segments for 2012 are described on pages 12-14 of the 2012 Annual Financial Report. 2
The Basel asset class “Past due items” relates only to standardised exposures and comprises exposures that are greater
than 90 days past due or defaulted, and those impaired. A profile of contractually past due (but not impaired) facilities, for both the Standardised and Foundation IRB Approaches, is contained in table 15 of Section 8 of this Report. 3
All exposures under the IRB Approach for retail are secured by real estate collateral and represent the majority of the
residential mortgage portfolio in PBB & CICB. 5
Includes credit exposures arising as a result of repurchase transactions.

16
the disposal of a portion of the EBS residential mortgage buy-to-let portfolio. Other movements occurred in the “Institutions” exposure class (decrease of € 2.0 billion) and “Corporate” exposure class (decrease of € 2.0 billion) across all industry sectors, where the demand for credit was exceeded by repayments of debt. The decrease in the IRB exposures was driven by a € 2.7 billion decrease in “Corporate” exposures due to continued deleveraging of non-core assets, particularly in the CICB market segment. Balances in the “Institutions” exposure class were € 1.3 billion lower than at 31 December 2011 due to a decline in bank placements year-on-year, whilst “Securitisation positions” decreased by € 1.5 billion due to disposals in the year. The above decreases in IRB exposures were partly offset by an increase of € 1.9 billion in the “Central governments and central banks” exposure class reflecting an increased holding in government bonds in 2012.
The movements in the standardised and IRB exposures as described above resulted in a
decrease in the minimum capital requirement of € 0.9 billion (14.8%) in the period, comprising a €
0.5 billion decrease in the minimum capital requirement for standardised exposures and a € 0.4
billion decrease in the minimum capital requirement for IRB exposures.
In terms of the standardised exposures, the most significant movements in the minimum
capital requirement were due to decreases in the “Corporates” and “Secured on real estate
property” exposure classes as a result of deleveraging activities in the period, while the significant
decrease in exposures to “Central government and central banks” as described above had no
impact on capital.
The small decrease in the minimum capital requirement for IRB exposures was primarily
due to decreases in the “Corporates” and “Securitisation positions” exposure classes as a result of
deleveraging and disposals in the period, partly offset by an increase in the minimum capital
requirement for “Retail” reflecting the deterioration in the residential mortgage book in Personal &
Business Banking (“PBB”) & CICB in the period.

17
5. Credit Risk – Standardised Approach Exposures rated under the Standardised Approach amounted to € 70,081 million, with a capital requirement of € 3,491 million as at 31 December 2012 (2011: exposures of € 87,435 million, capital requirement of € 4,035 million). The decrease in the exposures and related capital requirement mainly reflects the Group’s deleveraging activities and loan repayments in the period and a reduction in exposures to “Central governments and central banks”, both of which are described on the previous page. The following tables analyse the Credit Risk Exposures under the Standardised Approach on the following bases:
a) Industry (Table 5); b) Geography (Table 6); and c) Residual maturity (Table 7).
Use of external credit ratings
AIB uses Standard & Poor’s Rating Services, Fitch Ratings, Moody's Investors Service and Dominion Bond Rating Service (“DBRS”) as its nominated External Credit Assessment Institutions (“ECAIs”) for a small part of its credit risk corporate asset class exposures under the Standardised Approach (see also Section 10 Securitisations).
Exposures to which credit ratings are assigned are mapped to risk weights using mapping guidelines issued by the Central Bank. These guidelines are identical to those issued by the European Banking Authority (“EBA”)
1. The externally rated credit risk exposures represent 2.6% of
standardised exposures and 1.3% of the total (Standardised Approach and Foundation IRB Approach) credit risk exposures (2011: 4.3% and 2.4% respectively).
Of the total Standardised exposures after credit risk mitigation amounting to € 70,081 million (2011: € 87,435 million), € 19,937 million (2011: € 28,933 million) is rated by ECAIs, the majority of which (€ 17,128 million) relates to the NAMA bonds received as consideration for the loans and receivables transferred to NAMA during 2010 and 2011 and the transfer of the Anglo deposit business to the Group during 2011.
1
The European Banking Authority (“EBA”) was established by Regulation (EC) No. 1093/2010 of the European Parliament
and of the Council of 24 November 2010. The EBA officially came into being as of 1 January 2011 and has taken over all existing and ongoing tasks and responsibilities from the Committee of European Banking Supervisors (“CEBS”).

18
Table 5: Industry distribution of credit exposures (EAD) – Standardised Approach
2012
Agriculture Construction Distribution Energy Financial Home loans Manufacturing
Other loans -
personal Other
services Property Transport &
communication
Bank, sovereign & public sector Other
Total exposures
Exposure class € m € m € m € m € m € m € m € m € m € m € m € m € m € m
Central governments and central banks - - - - - - - - - - - 18,516 - 18,516
Regional governments or local authorities - - - - - - - - - - - - - -
Administrative bodies and non-commercial undertakings - - - - - - - - 38 - - - - 38
Institutions - - - - - - - - - - - 1,098 - 1,098
Corporates 476 214 1,225 64 547 2 254 645 2,661 459 388 - - 6,935
Retail 662 90 375 7 28 613 80 2,278 482 290 78 - - 4,983
Secured on real estate property 117 61 56 - 95 12,925 3 71 513 6,482 29 - 2 20,354
Past due items 327 521 734 14 24 2,499 98 658 303 6,467 28 - 3 11,676
Items belonging to regulatory high risk categories 5 36 21 - 10 - 17 - 28 77 - - - 194
Covered Bonds - - - - 426 - - - - - - - - 426
Collective investment undertakings - - - - - - - - - - - - - -
Securitisations - - - - 85 - - - - - - - - 85
Other items - - 1 - 175 - 1 1 10 2 - - 5,586 5,776
1,587 922 2,412 85 1,390 16,039 453 3,653 4,035 13,777 523 19,614 5,591 70,081

19
Table 5: Industry distribution of credit exposures (EAD) – Standardised Approach
2011
Agriculture Construction Distribution Energy Financial Home loans Manufacturing
Other loans -
personal Other
services Property Transport &
communication
Bank, sovereign &
public sector Other Total
exposures
Exposure class € m € m € m € m € m € m € m € m € m € m € m € m € m € m
Central governments and central banks - - - - - - - - - - - 25,576 - 25,576
Regional governments or local authorities - - - - - - - - - - - - - -
Administrative bodies and non-commercial undertakings - - - - - - - - - - - 39 - 39
Institutions - - - - - - - - - - - 3,122 - 3,122
Corporates 533 236 1,501 72 821 8 354 1,012 3,074 637 403 - 301 8,952
Retail 665 125 445 9 33 648 105 2,585 532 354 96 - - 5,597
Secured on real estate property 219 73 67 - 111 15,219 7 87 354 10,235 34 - 3 26,409
Past due items 335 587 691 13 28 2,358 79 801 315 5,700 39 - - 10,946
Items belonging to regulatory high risk categories 6 98 11 1 14 1 25 - 58 227 7 - - 448
Covered Bonds - - - - 490 - - - - - - - - 490
Collective investment undertakings - - - - - - - - - - - - - -
Securitisations - - - - 88 - - - - - - - - 88
Other items - 1 2 - 60 - 3 1 11 2 - - 5,688 5,768
1,758 1,120 2,717 95 1,645 18,234 573 4,486 4,344 17,155 579 28,737 5,992 87,435
20
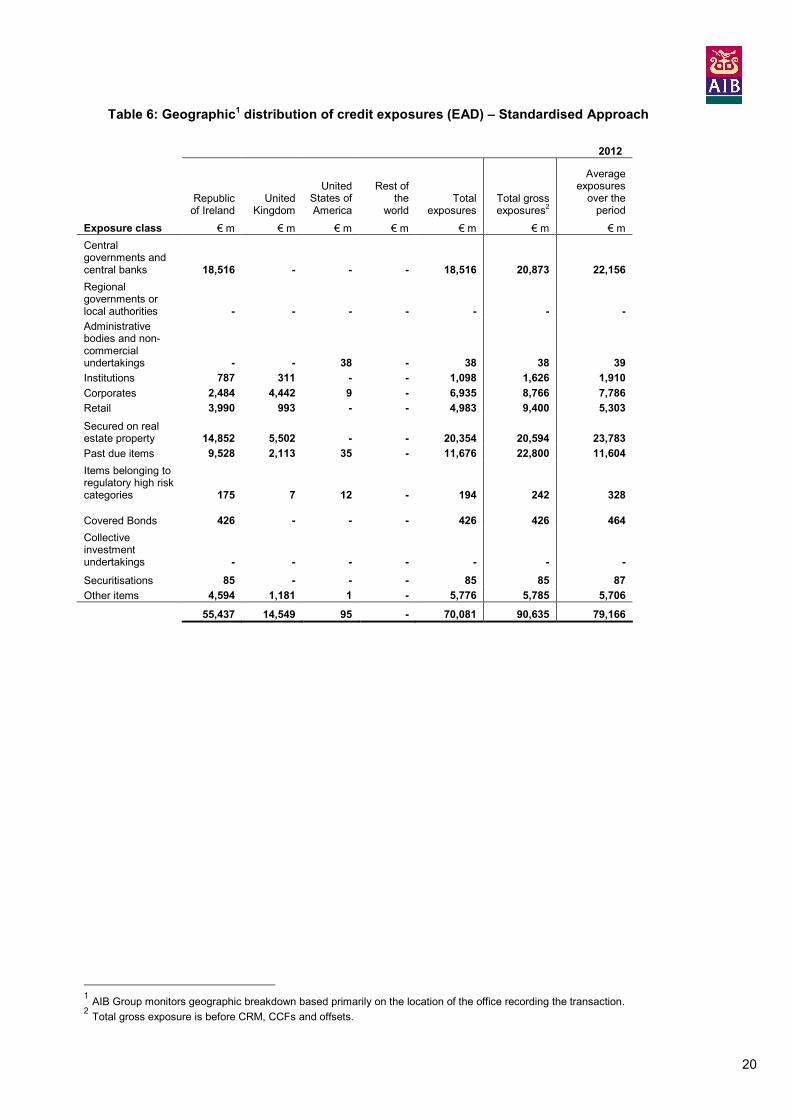
Table 6: Geographic1 distribution of credit exposures (EAD) – Standardised Approach
2012
Republic
of Ireland United
Kingdom
United States of America
Rest of the
world Total
exposures Total gross exposures
2
Average exposures
over the period
Exposure class € m € m € m € m € m € m € m
Central governments and central banks 18,516 - - - 18,516 20,873 22,156
Regional governments or local authorities - - - - - - -
Administrative bodies and non-commercial undertakings - - 38 - 38 38 39
Institutions 787 311 - - 1,098 1,626 1,910
Corporates 2,484 4,442 9 - 6,935 8,766 7,786
Retail 3,990 993 - - 4,983 9,400 5,303
Secured on real estate property 14,852 5,502 - - 20,354 20,594 23,783
Past due items 9,528 2,113 35 - 11,676 22,800 11,604
Items belonging to regulatory high risk categories 175 7 12 - 194 242 328
Covered Bonds 426 - - - 426 426 464
Collective investment undertakings - - - - - - -
Securitisations 85 - - - 85 85 87
Other items 4,594 1,181 1 - 5,776 5,785 5,706
55,437 14,549 95 - 70,081 90,635 79,166
1 AIB Group monitors geographic breakdown based primarily on the location of the office recording the transaction.
2 Total gross exposure is before CRM, CCFs and offsets.

21
Table 6: Geographic1 distribution of credit exposures (EAD) – Standardised Approach
2011
Republic
of Ireland United
Kingdom
United States of America
Rest of the
world Total
exposures Total gross exposures
Average exposures
over the period
Exposure class € m € m € m € m € m € m € m
Central governments and central banks 25,575 - - 1 25,576 25,525 23,974
Regional governments or local authorities - - - - - - 13
Administrative bodies and non-commercial undertakings 19 - 20 - 39 39 72
Institutions 1,028 2,069 19 6 3,122 3,578 3,481
Corporates 3,362 5,543 41 6 8,952 10,626 11,310
Retail 4,510 1,041 - 46 5,597 10,294 6,846
Secured on real estate property 19,544 6,545 204 116 26,409 26,849 32,487
Past due items 8,862 2,045 39 - 10,946 20,058 11,109
Items belonging to regulatory high risk categories 392 18 38 - 448 554 848
Covered Bonds 490 - - - 490 490 488
Collective investment undertakings - - - - - - 5
Securitisations 88 - - - 88 88 87
Other items 4,593 1,173 1 1 5,768 5,777 4,830
68,463 18,434 362 176 87,435 103,878 95,550
1
AIB Group monitors geographic breakdown based primarily on the location of the office recording the transaction.

22
Table 7: Residual maturity of credit exposures (EAD) – Standardised Approach 2012
On demand
0 < 3 months
3 < 6 months
6 months < 1 year
1 < 3 years
3 < 5 years
5 < 10 years
10 years
+
No maturity
Total exposures
Exposure class € m € m € m € m € m € m € m € m € m € m
Central governments and central banks - 17,387 165 15 411 - 305 233 - 18,516
Administrative bodies and non-commercial undertakings - 37 - - - - 1 - - 38
Institutions 325 393 47 75 212 5 - 41 - 1,098
Corporates 202 664 241 1,239 1,232 799 647 1,911 - 6,935
Retail 21 308 155 1,308 745 716 649 1,081 - 4,983
Secured on real estate property 463 956 430 1,069 1,515 1,365 1,442 13,114 - 20,354
Past due items 439 502 462 4,863 497 1,619 436 2,858 - 11,676
Items belonging to regulatory high risk categories 1 18 28 100 8 2 13 24 - 194
Covered Bonds - 21 - 48 326 31 - - - 426
Collective investment undertakings - - - - - - - - - -
Securitisations - - - - - - - 85 - 85
Other items - 1 1 58 3 - - - 5,713 5,776
1,451 20,287 1,529 8,775 4,949 4,537 3,493 19,347 5,713 70,081
2011
On demand
0 < 3 months
3 < 6 months
6 months
< 1 year
1 < 3 years
3 < 5 years
5 < 10 years
10 years
+
No maturity
Total exposures
Exposure class € m € m € m € m € m € m € m € m € m € m
Central governments and central banks 304 24,152 - - 397 128 349 246 - 25,576
Administrative bodies and non-
commercial undertakings - - - - 38 - - 1 - 39
Institutions 1,208 495 1,071 32 194 99 7 16 - 3,122
Corporates 413 791 446 1,412 1,739 718 1,004 2,429 - 8,952
Retail 15 414 174 1,386 801 947 704 1,156 - 5,597
Secured on real estate property 288 1,282 706 1,943 3,438 1,423 1,901 15,428 - 26,409
Past due items 261 660 225 4,070 864 1,508 407 2,951 - 10,946
Items belonging to regulatory high risk categories 11 36 60 217 52 46 25 1 - 448
Covered Bonds - 21 - 43 179 242 5 - - 490
Collective investment undertakings - - - - - - - - - -
Securitisations - - - - - - - 88 - 88
Other items 1 46 1 70 337 - 3 - 5,310 5,768
2,501 27,897 2,683 9,173 8,039 5,111 4,405 22,316 5,310 87,435
23
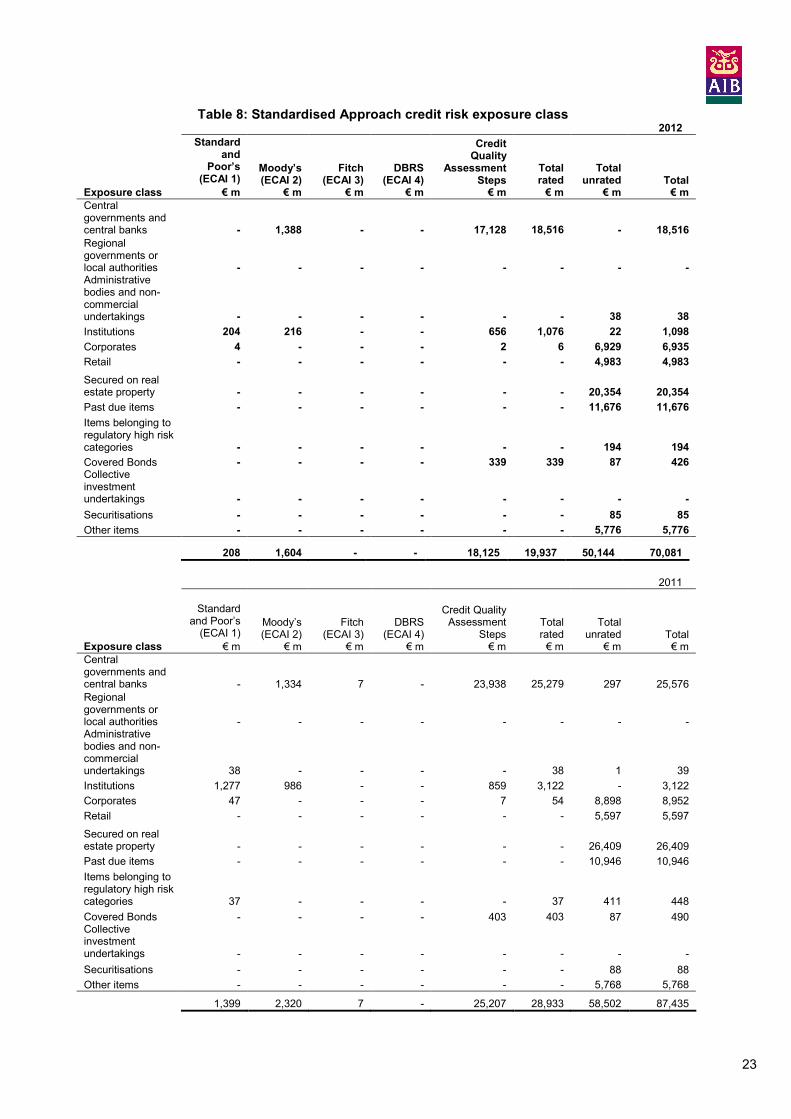
Table 8: Standardised Approach credit risk exposure class 2012
Exposure class
Standard and
Poor’s (ECAI 1)
€ m
Moody’s (ECAI 2)
€ m
Fitch (ECAI 3)
€ m
DBRS (ECAI 4)
€ m
Credit Quality
Assessment Steps € m
Total rated € m
Total unrated
€ m Total € m
Central governments and central banks - 1,388 - - 17,128 18,516 - 18,516
Regional governments or local authorities - - - - - - - - Administrative bodies and non-commercial undertakings - - - - - - 38 38
Institutions 204 216 - - 656 1,076 22 1,098
Corporates
4 - - - 2 6 6,929 6,935
Retail - - - - - - 4,983 4,983
Secured on real estate property - - - - - - 20,354 20,354
Past due items - - - - - - 11,676 11,676
Items belonging to regulatory high risk categories - - - - - - 194 194
Covered Bonds - - - - 339 339 87 426 Collective investment undertakings - - - - - - - -
Securitisations - - - - - - 85 85
Other items - - - - - - 5,776 5,776
208 1,604 - - 18,125 19,937 50,144 70,081
2011
Exposure class
Standard and Poor’s
(ECAI 1)
€ m
Moody’s (ECAI 2)
€ m
Fitch (ECAI 3)
€ m
DBRS (ECAI 4)
€ m
Credit Quality Assessment
Steps € m
Total rated
€ m
Total unrated
€ m Total
€ m
Central governments and central banks - 1,334 7 - 23,938 25,279 297 25,576
Regional governments or local authorities - - - - - - - - Administrative bodies and non-commercial undertakings 38 - - - - 38 1 39
Institutions 1,277 986 - - 859 3,122 - 3,122
Corporates
47 - - - 7 54 8,898 8,952
Retail - - - - - - 5,597 5,597
Secured on real estate property - - - - - - 26,409 26,409
Past due items - - - - - - 10,946 10,946
Items belonging to regulatory high risk categories 37 - - - - 37 411 448
Covered Bonds - - - - 403 403 87 490 Collective investment undertakings - - - - - - - -
Securitisations - - - - - - 88 88
Other items - - - - - - 5,768 5,768
1,399 2,320 7 - 25,207 28,933 58,502 87,435

24
Table 9: Total Exposure (EAD) value (after CRM) split by credit quality assessment step1–
Standardised Approach
2012
Exposure class
Step 1
€ m
Step 2
€ m
Step 3
€ m
Step 4
€ m
Step 5
€ m
Step 6
€ m
Total rated € m
Total unrated
€ m Total € m
Central governments and central banks 301 - 17,128 1,087 - - 18,516 - 18,516
Regional governments or local authorities - - - - - - - - -
Administrative bodies and non-commercial undertakings - - - - - - - 38 38
Institutions 234 680 66 96 - - 1,076 22 1,098
Corporates2
- - 4 2 - - 6 6,929 6,935
Retail - - - - - - - 4,983 4,983
Secured on real estate property - - - - - - - 20,354 20,354
Past due items - - - - - - - 11,676 11,676
Items belonging to regulatory high risk categories - - - - - - - 194 194
Covered Bonds 51 79 148 61 - - 339 87 426
Collective investment undertakings - - - - - - - - -
Securitisations - - - - - - - 85 85
Other items - - - - - - - 5,776 5,776
586 759 17,346 1,246 - - 19,937 50,144 70,081
2011
Exposure class
Step 1
€ m
Step 2
€ m
Step 3
€ m
Step 4
€ m
Step 5
€ m
Step 6
€ m
Total rated
€ m
Total unrated
€ m Total
€ m
Central governments and central banks 3,872 31 20,073 1,303 - - 25,279 297 25,576
Regional governments or local authorities - - - - - - - - -
Administrative bodies and non-commercial undertakings 38 - - - - - 38 1 39
Institutions 923 1,852 326 21 - - 3,122 - 3,122
Corporates2
15 10 12 17 - - 54 8,898 8,952
Retail - - - - - - - 5,597 5,597
Secured on real estate property - - - - - - - 26,409 26,409
Past due items - - - - - - - 10,946 10,946
Items belonging to regulatory high risk categories - - - - 31 6 37 411 448
Covered Bonds 148 105 46 104 - - 403 87 490
Collective investment undertakings - - - - - - - - -
Securitisations - - - - - - - 88 88
Other items - - - - - - - 5,768 5,768
4,996 1,998 20,457 1,445 31 6 28,933 58,502 87,435
1 The following ratings apply to the credit quality assessment steps as follows:
Credit quality assessment step 1: AAA to AA (S&P / Fitch / DBRS); Aaa to Aa3 (Moody’s) Credit quality assessment step 2: A+ to A- (S&P / Fitch / DBRS); A1 to A3 (Moody’s) Credit quality assessment step 3: BBB+ to BBB- (S&P / Fitch / DBRS); Baa1 to Baa3 (Moody’s) Credit quality assessment step 4: BB+ to BB- (S&P / Fitch / DBRS); Ba1 to B3 (Moody’s) Credit quality assessment step 5: B+ to B- (S&P / Fitch / DBRS); B1 to B3 (Moody’s) Credit quality assessment step 6: CCC+ and below (S&P / Fitch / DBRS); Caa1 and below (Moody’s)
2 Of the gross standardised exposures (before credit risk mitigation) of € 90,635 million at 31 December 2012, € 56 million (31
December 2011: € 70 million) is covered by eligible financial collateral.

25
6. Credit Risk – Foundation Internal Ratings Based Approach Exposures rated under the Foundation IRB Approach amounted to € 65,119 million, with a capital requirement of € 1,816 million as at 31 December 2012 (2011: exposures of € 69,173 million, capital requirement of € 2,196 million). As described on page 16 of this document, the decrease in IRB exposures was driven by a decrease of € 2,704 million in “Corporate” exposures due to continued deleveraging of non-core assets, a € 1,343 million decrease in exposures to “Institutions” reflecting reduced bank placements and a € 1,542 million decrease in “Securitisation positions” reflecting disposals in the period, offset by an increase of € 1,916 million in the “Central governments and central banks”.
Regulatory approval and transition As at 31 December 2012, the Group used the Foundation IRB Approach for the portfolios and exposure classes listed in the table below, having previously received approval from the Central Bank.
Segment AIB Portfolio Exposure class
Personal & Business Banking Commercial / large SME Corporates Residential Mortgages Retail
Corporate, Institutional & Commercial Banking Bank Institutions Corporates Corporates Not-for-profit Corporates Project finance Corporates
Commercial / large SME Corporates
Sovereign Residential Mortgages
Central governments and central banks Retail
AIB UK Bank Institutions
Sovereign Central governments and
central banks
AIB plans to transition other standardised portfolios in the Group to the Foundation IRB Approach.
Governance of the rating process
AIB has a formalised governance framework around the entire internal ratings model process. The Board has designated the Credit Risk Measurement Committee as the body responsible for approval of material aspects of credit risk measurement systems and processes. The Committee’s responsibilities include:
a) ensuring that the credit risk rating models used in regulatory capital calculations comply with the requirements of the CRD;
b) approval of Group standards for the development, validation, maintenance and use of credit risk rating models;
c) approval of new credit risk rating models to be used in the estimation of minimum regulatory capital requirements, and approval of changes to these models;
d) establishment and maintenance of governance structures and processes required for credit risk rating model development and validation; and
e) confirmation that the requirements for independence in the above processes have been met.
Credit Risk Control function
The Credit Risk Control function within the Group is an integrated set of independent units and functions which share responsibility for key control aspects of the Group's rating systems. These responsibilities include rating model development, use, performance monitoring and oversight.

26
Use of rating models
Rating models and systems are core to credit and risk management in the Group, with the outputs from Foundation IRB models playing an essential role in a wide range of risk processes:
a) Credit approval: Grades assigned by Foundation IRB risk models are a key input to the assessment of credit applications. Grades are also used in determining the size of delegated credit authorities. The outputs of the models are also used in assessing risk-return and pricing of loans;
b) Risk management and decision-making processes: In the management of existing exposures grades, rating models are fundamental to management reporting and in determining the level and nature of management attention applied to exposures;
c) Internal capital allocation: The outputs from Foundation IRB risk models are an input to the Internal Capital Adequacy Assessment Process (“ICAAP”) including stress tests of capital adequacy;
d) Annual planning: Risk forecasts based on the outputs of Foundation IRB models are embedded in the annual planning process.
Use of and process for recognising credit risk mitigation
When calculating the capital requirements for Foundation IRB Approach the Group takes account of collateral as a credit risk mitigant for residential real estate in its retail (home mortgage) portfolio but does not recognise credit risk mitigation techniques in the sovereign, institution and corporate exposure classes, with the exception of financial collateral.
The Group uses its own estimates of LGD in the calculation of risk weighted assets for exposures secured on residential real estate in its retail (home mortgage) portfolio. The Group's approach to taking, perfecting, valuing and monitoring real estate collateral is consistent with its broad framework for credit risk mitigation as described in Section 7.
Internal ratings process by exposure class
The following tables set out the split out by portfolio for the exposure classes (a) Corporates; (b) Central governments and central banks; (c) Institutions; and (d) Retail rated under the Foundation IRB Approach.
(a) Corporates
The following portfolios within the Group's IRB Approach approval are treated under the corporate exposure class:
Segment AIB Portfolio Portfolio description
Personal & Business Banking
Commercial / large SME
Predominantly commercial business - all sectors except property.
Corporate, Institutional & Commercial Banking
Corporate
Commercial / large SME
Not-for-profit
Project finance
Companies that are engaged in the provision of goods or services with the intention of generating profit for the owners. Excluded from this category are: a) Financial service providers; b) Special purpose entities that do not have a diversified
income stream; and c) Special purpose entities set up to facilitate
securitisations. Predominantly commercial business - all sectors except property.
Exposures to not-for-profit entities in Allied Irish America.
Long-term loans made to projects in the energy, infrastructure and transportation sectors in Europe, North America, and Asia-Pacific.
Under the Foundation IRB Approach, internal rating models are used to assign corporate obligors to borrower grades, to which estimates of Probability of Default ‘PD’ are attached. The Group uses regulatory LGD and EAD measures in calculating risk weighted assets.

27
The ratings methodology and criteria used in assigning borrowers to grades vary across the model used for the four portfolios, but all the models use a combination of statistical analysis (using both financial and non-financial inputs) and expert judgement. PDs are calibrated on the basis of both internal and external available loss data and through benchmarking. External ratings, where available, play a role in both the assignment and calibration process, but their role is that of one factor amongst several others. The definition of default used for all four portfolios is consistent with the CRD definition. The Group's validation processes are rigorous. They test, inter alia, the rank ordering of borrowers in terms of probability of default, the stability of the ratings, the stability of the portfolio and the probability of default estimates. (b) Central governments and central banks
The following portfolios within the Group's IRB Approach approval are treated under the central governments and central banks exposure class:
Segment AIB Portfolio Portfolio description
Corporate, Institutional & Commercial Banking
Sovereign Central governments Central banks Other specified multinational development banks and international organisations
AIB UK Sovereign Central governments Central banks Other specified multinational development banks and international organisations
Under the Foundation IRB Approach, internal rating models are used to assign central governments and central banks obligors to borrower grades, to which estimates of PD are attached. The Group uses regulatory LGD and EAD measures in calculating risk weighted assets.
Ratings are assigned on the basis of expert judgement, based upon perceived political risk, government policy risk, economic policy and external liquidity risk. PDs are calibrated on the basis of expert judgement, benchmarked to available external ratings. The definition of default is consistent with the CRD definition.
(c) Institutions
The following portfolios within the Group's IRB Approach approval are treated under the institutions exposure class:
Segment AIB Portfolio Portfolio description
Corporate, Institutional & Commercial Banking
Bank Banks
Securities firms subject to the same regulation as banks
AIB UK
Bank Banks
Securities firms subject to the same regulation as banks
Under the Foundation IRB Approach, internal rating models are used to assign institution obligors to borrower grades, to which estimates of PD are attached. The Group uses regulatory LGD and EAD measures to calculate risk weighted assets.
Ratings are assigned on the basis of a hybrid model (a statistical model or scorecard with some expert judgement). External ratings for the country of domicile are used to establish a 'country ceiling' on the rating, and as an input into the quantitative score. Due to the lack of internal default data, PDs are calibrated to an equivalent external rating grade. The definition of default is consistent with that used by the rating agencies, which in general is considered to occur at an earlier stage than that defined by the CRD and hence considered to be more conservative.

28
(d) Retail
The following portfolios within the Group's IRB Approach approval are treated under the retail exposure class:
Segment AIB Portfolio Portfolio description
Personal & Business Banking
Home mortgages Home mortgage lending and first five buy-to-lets
Corporate, Institutional & Commercial Banking
Home mortgages Home mortgage lending and first five buy-to-lets
Under the IRB Approach for retail, the Group uses its own estimates of PD, LGD and EAD in calculating risk weighted assets for residential mortgages originated in Ireland, excluding those originated through EBS. The rating methodology is primarily statistical, with limited use of expert judgement. Application and behavioural scorecards are used. PDs and LGDs are calibrated on the basis of internal data, supplemented with benchmarking to external sources. EAD is calculated both on drawn facilities and on 'pipeline' business (mortgages which have been sanctioned but not yet drawn down). The definition of default is consistent with the CRD definition of default.

29
Table 10: Industry distribution of credit exposures (EAD) - Foundation IRB Approach
2012
Central governments and central
banks Institutions Corporates Retail
Securitisation positions
Non-credit obligation
assets Total
Sector € m € m € m €m € m € m € m
Agriculture - - 396 - - - 396
Construction
- - 352 - - - 352
Distribution - - 5,026 - - 1 5,027
Energy - - 666 - - - 666
Financial - - 141 - 1,293 - 1,434
Home loans - - 25 24,663 - - 24,688
Manufacturing - - 1,497 - - 1 1,498
Other loans – personal - - 222 - - - 222
Other services - - 2,652 - 10 1 2,663
Property
- - 628 - - - 628
Transport and communication - - 1,442 - - 3 1,445
Bank, sovereign & public sector entities 20,064 6,036 - - - - 26,100
20,064 6,036 13,047 24,663 1,303 6 65,119
2011
Central governments
and central banks Institutions Corporates Retail
Securitisation
positions
Non-credit obligation
assets Total
Sector € m € m € m €m € m € m € m
Agriculture - - 427 - - - 427
Construction
- - 662 - - - 662
Distribution - - 5,686 - - 1 5,687
Energy - - 1,129 - - - 1,129
Financial - - 214 - 2,339 - 2,553
Home loans - - 33 25,044 - - 25,077
Manufacturing - - 2,105 - - 1 2,106
Other loans – personal - - 250 - - - 250
Other services - - 3,143 - 506 2 3,651
Property
- - 645 - - - 645
Transport and communication - - 1,457 - - 2 1,459
Bank, sovereign & public sector entities 18,148 7,379 - - - - 25,527
18,148 7,379 15,751 25,044 2,845 6 69,173

30
Table 11: Geographic11distribution of credit exposures (EAD) - Foundation IRB Approach
2012
Republic of
Ireland United
Kingdom
United States
of America
Rest of the
World Total
exposures
Total gross exposures
2
Average exposures over the period
Exposure Class € m € m € m € m € m € m € m
Central governments and central banks 15,295 4,463 306 - 20,064 39,823 17,570
Institutions 4,561 1,398 77 - 6,036 11,509 6,458
Corporates 11,738 878 431 - 13,047 14,461 14,263
Retail3
24,663 - - - 24,663 24,751 24,840
Securitisation positions 1,293 - 10 - 1,303 1,303 1,964
Non-credit obligation assets 6 - - - 6 6 7
57,556 6,739 824 - 65,119 91,853 65,102
2011
Republic
of Ireland United
Kingdom
United States of America
Rest of the
World Total
exposures
Total gross exposures
Average exposures
over the period
Exposure Class € m € m € m € m € m € m € m
Central governments and central banks 14,262 3,607 279 - 18,148 45,102 27,916
Institutions 5,263 1,999 117 - 7,379 12,146 8,656
Corporates 13,436 1,169 894 252 15,751 17,303 19,182
Retail4
25,044 - - - 25,044 25,124 25,323
Securitisation positions 2,625 - 220 - 2,845 2,844 3,681
Non-credit obligation assets 6 - - - 6 7 8
60,636 6,775 1,510 252 69,173 102,526 84,766
1 AIB Group monitors geographic breakdown based primarily on the location of the office recording the transaction.
2 Total gross exposure is before CRM, CCFs and offsets.

31
Table 12: Residual maturity of credit exposures (EAD) – Foundation IRB Approach
2012
Residual maturity
Central governments and central
banks € m
Institutions € m
Corporates € m
Retail € m
Securitisation positions
€ m
Non-credit
obligation assets
€ m Total € m
On demand 1,155 135 263 17 - - 1,570
< 3 months 2,396 899 852 26 - 1 4,174
3 < 6 months 218 104 335 115 - 1 773
6 months < 1 year 223 1,652 3,803 41 - 1 5,720
1 < 3 years 4,970 1,069 2,220 171 34 3 8,467
3 < 5 years 6,175 1,638 1,609 471 59 - 9,952
5 < 10 years 4,435 339 1,828 1,943 25 - 8,570
10 years + 492 200 2,137 21,879 1,185 - 25,893
20,064 6,036 13,047 24,663 1,303 6 65,119
2011
Residual maturity
Central governments
and central banks
€ m Institutions
€ m Corporates
€ m Retail
€ m
Securitisation positions
€ m
Non-credit
obligation assets
€ m Total
€ m
On demand 2,334 - 150 15 - - 2,499
< 3 months 5,203 1,127 553 44 - 2 6,929
3 < 6 months 277 524 714 150 - - 1,665
6 months < 1 year 195 2,324 3,546 61 1 1 6,128
1 < 3 years 2,425 1,450 4,289 174 66 3 8,407
3 < 5 years 3,147 749 1,769 430 48 - 6,143
5 < 10 years 3,824 1,007 1,960 1,796 168 - 8,755
10 years + 743 198 2,770 22,374 2,562 - 28,647
18,148 7,379 15,751 25,044 2,845 6 69,173
Foundation IRB obligor grades
For the purpose of calculating credit risk and ultimately its capital requirement using the Foundation IRB Approach, AIB has allocated all relevant exposures to obligor grades and an associated PD. These obligor grades are a risk category within the Group’s rating systems. An obligor grade is assigned to obligors on the basis of rating criteria within each rating model from which estimates of PD are derived. These rating models have been calibrated at an individual business unit level. These individual rating models continue to be refined and recalibrated based on experience.
For the purposes of aggregate reporting, the Group uses a 13 point ratings master scale which provides a common and consistent framework for aggregating, comparing and reporting exposures across all lending portfolios. The ratings master scale is PD based. Under the ratings master scale:
- Grades 1 – 3 would typically include strong corporate and commercial lending combined with elements of the retail portfolios and residential mortgages;
- Grades 4 – 10 would typically include new business written and existing satisfactorily performing exposures across all portfolios. The lower end of this category (Grade 10) includes a portion of the Group’s criticised loans (i.e. loans requiring additional management attention over and above that normally required for the loan type);
- Grades 11 – 13 contain the remainder of the Group’s criticised loans, including impaired loans, together with loans written at a high PD where there is a commensurate higher margin for the risk taken.
Table 13 sets out the analysis of EAD of the exposure classes by obligor grade, within the Foundation IRB Approach for the Group, excluding the securitisations rated on IRB approved models (2012: € 1,303 million; 2011: € 2,845 million), which are analysed in greater detail in Section 10.

32
Table 13: Foundation IRB - Obligor grade disclosures (excluding securitisations) 2012
Central Government &
central banks Institutions Corporates
Exposure
value (EAD)1
Exposure-weighted average
risk weight Exposure
value (EAD)1
Exposure-weighted average
risk weight Exposure
value (EAD)1
Exposure-weighted average
risk weight
Obligor grade € m % € m % € m %
Grade 1 – 3 20,037 - 5,589 14 1,254 33
Grade 4 – 10 27 82 226 66 7,028 95
Grade 11 - 13 - - 221 84 4,765 18
20,064 - 6,036 18 13,047 61
Retail Non-credit obligation
assets Total Foundation - IRB2
Exposure
value (EAD)1
Exposure-weighted average
risk weight Exposure
value (EAD)1
Exposure-weighted average
risk weight Exposure
value (EAD)1
Exposure-weighted average
risk weight
Obligor grade € m % € m % € m %
Grade 1 – 3 4,833 5 1 100 31,714 5
Grade 4 – 10 13,443 21 2 100 20,726 47
Grade 11 - 13 6,387 145 3 100 11,376 91
24,663 50 6 100 63,816 34
2011
Central Government & central
banks Institutions Corporates
Exposure
value (EAD)1
Exposure-weighted
average risk weight
Exposure value (EAD)
1
Exposure-weighted
average risk weight
Exposure value (EAD)
1
Exposure-weighted
average risk weight
Obligor grade € m % € m % € m %
Grade 1 – 3 17,988 - 5,251 14 1,734 28
Grade 4 – 10 119 55 2,076 60 9,580 97
Grade 11 - 13 41 - 52 69 4,437 27
18,148 - 7,379 27 15,751 69
Retail Non-credit obligation assets Total Foundation - IRB3
Exposure
value (EAD)1
Exposure-weighted
average risk weight
Exposure value (EAD)
1
Exposure-weighted
average risk weight
Exposure value (EAD)
1
Exposure-weighted
average risk weight
Obligor grade € m % € m % € m %
Grade 1 – 3 5,160 5 - 100 30,133 5
Grade 4 – 10 14,801 23 4 100 26,580 52
Grade 11 - 13 5,083 158 2 100 9,615 96
25,044 47 6 100 66,328 37
1 Includes EAD in relation to impaired loans.
2 Excludes EAD of securitisation positions of € 1,303 million.
3 Excludes EAD of securitisation positions of € 2,845 million.

33
Table 14: Foundation IRB - Exposure-weighted average LGD 2012
Retail
Exposure value (EAD) Exposure-weighted
average LGD
Obligor grade € m %
Grade 1 – 3 4,833 18
Grade 4 – 10 13,443 21
Grade 11 – 13 6,387 40
24,663 25
2011
Retail
Exposure value (EAD) Exposure-weighted
average LGD
Obligor grade € m %
Grade 1 – 3 5,160 18
Grade 4 – 10 14,801 22
Grade 11 – 13 5,083 29
25,044 23

34
7. Credit Risk Mitigation The perceived strength of a borrower’s repayment capacity is the primary factor in granting a loan; however, AIB uses various approaches to help mitigate risks relating to individual credits including: transaction structure, collateral and guarantees. Collateral or guarantees are usually required as a secondary source of repayment in the event of the borrower’s default. The main types of collateral for loans and receivables to customers are described below. The methodologies applied and processes used to assess the value of property assets taken as collateral are described on page 76 and 77 of the 2012 Annual Financial Report.
Collateral
The main types of collateral for loans and receivables to customers are as follows: Mortgage portfolios: The Group takes collateral in support of lending transactions for the purchase of residential property. Collateral valuations are required at the time of origination of each residential mortgage. Non-mortgage portfolios: For non-mortgage lending, collateral is taken where available, and will typically include a charge over the business assets such as stock and debtors. In some cases, a charge over property collateral or a personal guarantee supported by a lien over personal assets may also be taken. The value of collateral is assessed at origination of the loan or in the case of criticised loans, when testing for impairment. Derivatives: The Group has a number of International Swaps and Derivatives Association (“ISDA”) Master Agreements (netting agreements) in place which may allow it to net the termination values of derivative contracts upon the occurrence of an event of default with respect to its counterparties. The Group has Credit Support Annexes (“CSAs”) in place which provide collateral for derivative contracts. Very occasionally, credit derivatives are purchased to hedge credit risk. Current levels are minimal and their use is subject to the normal credit approval process. The Group enters into master netting agreements for derivatives with certain counterparties, to ensure that in the event of default, all amounts outstanding with those counterparties will be settled on a net basis. In the case of large exposures, it is sometimes necessary to reduce initial deal size through appropriate sell-down and syndication strategies. There are established guidelines in place within the Group relating to the execution of such strategies. The Group also has in place an interbank exposure policy which establishes the maximum exposure for each counterparty bank depending on credit grade. Each bank is assessed for the appropriate exposure limit within the policy. Risk generating business units in each market segment are required to have an approved bank or country limit prior to granting any credit facility, or approving any obligation or commitment which has the potential to create interbank or country exposure.
AIB takes limited account of credit risk mitigation in its calculation of minimum Pillar 1 capital. Of the gross standardised exposures (before credit risk mitigation) of € 90,635 million at 31 December 2012 (2011: € 103,878 million), € 56 million (2011: € 70 million) is covered by eligible financial collateral. Of the remaining gross standardised exposures not covered by eligible financial collateral, € 17,128 million (2011: € 20,073 million) relating to NAMA senior bonds are guaranteed by the Irish Government. For the Foundation IRB Approach, of the gross exposures (before credit risk mitigation) of € 91,853 million at 31 December 2012 (2011: € 102,526 million), the amount covered by eligible financial collateral is € 14 million (2011: €16 million. Given the limited extent to which the Group takes account of credit risk mitigation in the calculation of its minimum Pillar 1 capital, the credit and market risk concentrations within the credit risk mitigation taken are deemed not to be material. Credit Risk Mitigation is discussed in the “Risk Management” section of the 2012 Annual Financial Report 2012, pages 70 and 71, whilst further information in relation to repurchase transactions is set out below in Section 9 Counterparty credit risks.

35
8. Credit Risk – Impairment
Past due When a borrower fails to make a contractually due payment, a loan is deemed to be past due. Past due days is a term used to describe the cumulative numbers of days a missed payment is overdue. Past due days commence from the close of business on the day on which a payment is due but not received. In the case of overdrafts, past due days are counted once a borrower:
a) has breached an advised limit; b) has been advised of a limit lower than the then current outstanding; or c) has drawn credit without authorisation. When a loan or exposure is past due, the entire exposure is reported as past due, not just the amount of any excess or arrears.
Table 15: Contractually past due but not impaired1 - industry and geographic
2 distribution
2012
Industry
Past due 1 - 30 days
€ m
Past due 31 - 60 days
€ m
Past due 61 - 90 days
€ m
Past due > 90 days
€ m
Total
€ m
Agriculture 55 9 16 59 139
Energy 6 - - 2 8
Manufacturing 19 4 2 16 41
Property and construction 210 101 66 516 893
Distribution 80 34 28 133 275
Transport 7 5 1 19 32
Financial 4 2 8 9 23
Other services 70 25 17 78 190
Personal
Residential mortgages 1,013 451 248 361 2,073
Credit cards 39 11 9 6 65
Other 75 32 40 153 300
1,578 674 435 1,352 4,039
Geography
Republic of Ireland 1,474 596 390 1,194 3,654
United Kingdom 104 78 45 158 385
United States of America - - - - -
Rest of the World - - - - -
1,578 674 435 1,352 4,039
1 Contractually past due and not impaired: Under IFRS 7, a financial asset is past due when a counterparty has failed to make
a payment when contractually due. 2
AIB Group monitors geographic breakdown based primarily on the location of the office recording the transaction.

36
2011
Industry
Past due 1 - 30 days
€ m
Past due 31 - 60 days
€ m
Past due 61 - 90 days
€ m
Past due > 90 days
€ m
Total
€ m
Agriculture 54 37 10 43 144
Energy 4 - 1 5 10
Manufacturing 24 16 2 13 55
Property and construction 391 163 115 468 1,137
Distribution 153 75 45 206 479
Transport 10 7 2 7 26
Financial 6 1 1 6 14
Other services 87 30 13 75 205
Personal
Residential mortgages 1,067 489 253 460 2,269
Credit cards 50 16 11 9 86
Other 126 60 34 153 373
1,972 894 487 1,445 4,798
Geography
Republic of Ireland 1,750 832 457 1,371 4,410
United Kingdom 220 62 30 74 386
United States of America - - - - -
Rest of the World 2 - - - 2
1,972 894 487 1,445 4,798
Impairment
Credit grading and scoring systems facilitate the early identification and management of any deterioration in loan quality. When loans are deemed to be impaired, the Group raises specific impairment provisions in a timely and consistent way across portfolios. The Group utilises two types of impairment provision: (a) Specific; and (b) Incurred but not reported (“IBNR”) which represents a collective provision relating to the portfolio of performing loans. Details of the methodologies adopted by the Group in identifying, monitoring and managing impaired loans are set out on pages 75 to 78 of the 2012 Annual Financial Report, whilst the relevant accounting policy can be found on pages 202 to 204 of the 2012 Annual Financial Report. Tables 15 on page 35 above and 16 below analyse loans and receivables to customers, including loans and receivables held for sale.
Table 16: Loans and receivables to customers, impaired loans and provisions - industry and geographic
1 distribution
2012
Industry
Loans and receivables to customers –
gross of provisions
€ m
Impaired
€ m
Specific balance sheet provisions
€ m
Impairment provision charge
for year
€ m
Agriculture 1,781 334 233 35
Energy 463 36 29 3
Manufacturing 1,625 472 300 88
Property and construction 22,251 13,804 7,681 1,438
Distribution 7,790 3,442 2,013 413
Transport 1,174 357 215 143
Financial 785 245 168 11
Other services 6,327 1,026 650 185
Personal
Residential Mortgages 42,521 8,130 2,699 1,118
Other 4,698 1,431 1,064 303
Lease financing 457 139 133 19
89,872 29,416 15,185 3,756
1 AIB Group monitors geographic breakdown based primarily on the location of the office recording the transaction.

37
Table 16: Loans and receivables to customers, impaired loans and provisions - industry and geographic
1 distribution (continued)
Geography
Loans and receivables to customers –
gross of provisions
€ m
Impaired
€ m
Specific balance sheet provisions
€ m
Impairment provision charge
for year
€ m
Republic of Ireland 73,535 24,719 12,864 3,014
United Kingdom 16,064 4,641 2,305 742
United States of America 273 56 16 -
Rest of the World - - - -
89,872 29,416 15,185 3,756
IBNR provision/(release) 1,343 (1,322)
Specific provision in relation to loans and receivables to banks 4 -
Total provisions for impairment on loans and receivables 16,532 2,434
2011
Industry
Loans and receivables to
customers – gross of provisions
€ m
Impaired
€ m
Specific balance sheet provisions
€ m
Impairment provision charge for
year
€ m
Agriculture 1,868 310 199 107
Energy 896 38 28 17
Manufacturing 2,071 436 251 203
Property and construction 24,490 11,899 6,469 3,816
Distribution 8,549 3,058 1,698 1,065
Transport 1,329 127 90 57
Financial 1,368 191 142 113
Other services 7,025 951 567 435
Personal
Residential mortgages 45,226 6,343 1,788 1,386
Other 5,321 1,335 904 475
Lease financing 544 145 121 32
98,687 24,833 12,257 7,706
Republic of Ireland 79,501 21,047 10,466 6,516
United Kingdom 18,209 3,725 1,777 1,128
United States of America 588 49 11 25
Rest of the World 389 12 3 37
98,687 24,833 12,257 7,706
IBNR provision 2,684 179
Specific provision in relation to loans and receivables to banks 4 -
Total provisions for impairment on loans and receivables 14,945 7,885
1 AIB Group monitors geographic breakdown based primarily on the location of the office recording the transaction.

38
Table 17: Movement in provisions for impairment on loans and receivables
2012
€ m
2011
€ m
At 1 January 14,945 7,976
Exchange translation adjustments 47 74
Acquisition of subsidiaries - 738
Transfers 34 (360)
Charge against income statement (see below) 2,434 7,885
Amounts written off (673) (802)
Recoveries of amounts written off in previous periods 4 4
Provisions on loans and receivables returned by / (transferred to) NAMA 4 (570)
Disposals (263) -
At 31 December 16,532 14,945
The charge against income statement for 2012 of € 2,434 million (2011: € 7,885 million) comprises € 3,756 million (2011: € 7,706 million) of a specific provision charge for impaired loans and a release of incurred but not reported (‘IBNR’) provisions of € 1,322 million (2011: € 179 million charge) for unidentified losses in the performing book. Further information and analysis is available in the 2012 Annual Financial Report on the Group’s website: www.aibgroup.com.
Loss experience in the preceding period – Foundation IRB Approach
An analysis of the expected loss (“EL”) and actual loss experience by exposure class for the year
ended 31 December 2012 is outlined in table 18. Regulatory EL provides a view of the expected losses that are likely to emerge in the performing loan book within one year, using through-the-cycle estimates of grade PDs and recognises the grade profile of the book at the time at which the EL is estimated. It does not forecast changes that will emerge in the grade profile of the book in the relevant year, nor does it take into account any likely future changes in the credit environment.
Actual loss in the table below is the specific provision charged to the income statement for
the year ended 31 December 2012 in relation to exposures newly impaired in the period and rated
under the Foundation IRB approach at 31 December 2012. These specific provisions are driven by
accounting standard requirements and are calculated at a point in time. It is important to note these
differences in interpreting the information in the tables below.
The reduction in the actual loss in 2012 for the non-retail exposure classes reflects the
slowdown in the pace of cases downgraded to impaired status in the period. The actual loss for the
retail asset class (residential mortgages) has increased reflecting the increased level of arrears due to
continued financial pressure on borrowers caused by the current economic climate.

39
Table 18: Expected loss analysis – Foundation IRB Approach 2012
Exposure class Expected loss
1
€ m Actual loss
€ m
Institutions 8 -
Corporates 176 519
Retail
221 641
Securitisation positions2
- -
Total 405 1,160
Exposure class Expected loss
1
€ m Actual loss
€ m
Retail exposures secured by real estate collateral 221 641
Total retail 221 641
2011
Exposure class Expected loss
1
€ m Actual loss
€ m
Institutions 1 -
Corporates 270 907
Retail
149 508
Securitisation positions2
- -
Total 420 1,415
Exposure class Expected loss
1
€ m Actual loss
€ m
Retail exposures secured by real estate collateral 149 508
Total retail 149 508
The Group's risk weightings for Foundation IRB models as at 31 December 2012 are detailed below.
The weightings are influenced by the grade profile and associated PD of the portfolios, having applied
the regulatory loss given defaults (“LGD”) of 45% for the majority3 of the non-retail portfolios (2011:
45% for the majority), and the Group’s own estimate of LGD for the retail portfolio (residential
mortgages), which had an average LGD of 25% applied as at 31 December 2012 (2011: 31
December 23%). The non-retail loans classified as defaulted have been excluded from the calculation
of the risk weightings as these loans influence the EL calculation and not the risk weighted assets
calculation.
Table 19: CRD risk weightings (as a percentage of EAD) for Foundation IRB models
Foundation IRB rating models 2012
% 2011
%
Sovereign - -
Bank 10 16
Commercial 107 111
Corporate 79 79
Not-for-profit 39 37
Project finance 108 102
Residential Mortgage 50 47
The movement in the above percentage weightings in 2012 across the rating models was impacted by a combination of factors: an increase in the proportion of the loan book in default, a change in the grade profile of the performing book and the deleveraging of elements of the loan portfolio in the period.
1 Expected loss is derived at the end of the preceding year.
2 Under the Foundation IRB Approach, rating agency ratings, as opposed to EL, are used in the determination of capital for
securitisation positions. For this reason AIB Group does not calculate EL for securitisation positions. 3 An LGD of 45% is applied to senior exposures, whilst LGDs of 11.25% and 75.00% are applied to covered bonds and
subordinated exposures respectively.

40
9. Counterparty credit risks
Assigning internal capital and credit limits for counterparty credit exposure
The Group is predominately exposed to counterparty credit exposure through its portfolio of derivatives and repurchase agreements ('repos').
Derivatives
Credit exposure arises on derivative transactions as there is a risk that the counterparty to the contract defaults prior to its maturity. If at that time, the Group incurs a loss to replace the contract this gives rise to a claim on the counterparty.
The credit exposure on derivatives is managed in the same way as other types of credit exposure. The Group applies the same credit control and risk management policies as relate to counterparty credit approval, limit setting and monitoring procedures.
Counterparty Credit Exposure (“CCE”) consists partly of current replacement cost (or mark-to-market) of the contracts and partly of potential future exposure. The potential future exposure component is an estimation which reflects possible changes in market values during the remaining life of the individual contract. The CCE for an individual counterparty will take into account the existence of valid bilateral netting or collateral agreements, where these are in place.
AIB applies the simplified method for calculating exposure amounts for the purposes of calculating internal capital on counterparty credit exposure for derivatives.
Pre-settlement CCE limits must be approved in advance of any transactions being entered into by the appropriate credit approval authority. This forms a part of the normal credit management and review process. Settlement and maturity limits must conform to general credit policy requirements. Limits on the maximum residual maturity of derivative activities are governed by individual counterparty maturity constraints.
Those sanctioning CCE limits must be satisfied that they sufficiently understand the risks involved in the proposed transactions and the models used to measure the exposures arising. It is Group practice, where possible and relevant, that all appropriate documentation, such as facility letters or International Swaps and Derivatives Association (“ISDA”) agreements be put in place before any limits are made available for use. Further details of master netting agreements are available in note 27 in the 2012 Annual Financial Report.
The Group uses a volatility-based risk weighting for internal purposes to determine potential future exposure values. These weightings or add-on-factors are derived from a rolling 3-year historical time series of price volatility data, raised to a 95
th percentile one-tailed confidence interval.
The Group updates these add-on-factor tables, which are organised by product, currency and residual maturity, on a monthly basis (except for repo products, where the add-on-factor tables are reviewed annually). Pre-settlement CCE limits for derivative transactions are established by reference to the specific transaction’s add-on-factors equivalent. Although Credit Support Annexes are taken into consideration when setting the internal credit risk utilisation for derivative counterparties, they are not recognised as credit risk mitigation for reducing the exposure at default on the derivative transactions in the Pillar 1 regulatory capital calculations.
Repurchase agreements
AIB Group is also active in repurchase transactions on capital market instruments. This is achieved through repo/reverse repo products and Sell Buy Back (“SBB”)/Buy Sell Back (“BSB”) products (together called repurchase transactions). Repurchase transactions are undertaken on both a bilateral and tri-party basis.
Where appropriate, netting documentation is in place; both sets of products also become legally equivalent from a credit mitigation perspective. The Group only engages in such transactions once the appropriate documentation has been executed.
Risk Management functions, independent of the front office, have responsibility for managing the margining of the Group’s bilateral repo / reverse repo and SBB/BSB activities. Margining has been predominantly cash-based although the documentation in general allows for securities to be used as collateral. Tri-party margining is managed through Euroclear.

41
The associated credit risk is managed in the same way as other types of credit exposure. Exposures are calculated to take account of historical price volatility reflecting the maturity of both the collateral and repurchase transaction. The exposures are aggregated with all other exposures to the counterparty.
In addition to the normal credit control and risk management policies relating to counterparty credit approval, limit setting and monitoring procedures, the following credit terms received additional focus for repurchase transactions:
a) Acceptable collateral b) Acceptable counterparties c) Appropriate nominal exposure limits by counterparty d) Appropriate risk weighted exposure limits by counterparty e) Haircut amounts (where appropriate)
AIB applies the Financial Collateral Comprehensive method for the purposes of calculating counterparty credit exposure for repurchase type transactions.
Policies for securing collateral and establishing credit reserves It is Group practice, where possible and relevant, that ISDA Master Agreements are put in place to cover derivatives business on a counterparty specific basis. It is Group practice in relation to wholesale market counterparts to supplement ISDA documentation with a Credit Support Annex to accommodate the reduction of net exposure on an agreed basis, and in line with market practice, by way of transferring a margin amount, typically cash (as opposed to securities).
AIB employs robust procedures and processes to control the residual risk that may arise when taking financial collateral, including strategy, consideration of the underlying credit and collateral management/valuation process. In addition, the Group has established standards to ensure legal certainty exists and that there is a low correlation between the credit quality of the obligor and the collateral value.
Policies with respect to one-way exposures Where the pattern of transactions with a given counterparty is dominated by trades in one direction (e.g. customer is a buyer of US dollars, but not a seller), the resulting derivative exposure may be referred to as a ‘one-way’ exposure. Such counterparty exposures are subject to the credit process, including grade assessment, limit setting, exposure measurement and credit review.
Change in credit rating A downgrade in the Group’s credit rating would have the effect of reducing the market value threshold for margin calls on some of the Credit Support Annexes. This would result in a potential increase in the amount of collateral the Group would have to provide against the derivatives within the Credit Support Annexes. However, due to the very small number of Credit Support Annexes with downgrade triggers, this is not deemed a significant risk for the Group. In addition, a downgrade in the Group’s credit rating would lead to an increase in the haircuts that would be demanded by counterparties in repurchase transactions. This would lead to an increase in the quantum of securities being pledged by the Group as collateralised. Some counterparties also require an ‘independent amount’ to be deposited in advance of transacting derivative business. The requirement for independent amounts reduced during 2012 when compared to 2011 due to the unwinding of certain credit derivatives.
Credit derivative hedges The Group had minimal credit derivative hedging activity during the year ended 31 December 2012.

42
Derivatives counterparty credit risk Table 20 analyses the counterparty credit risk exposure of derivative transactions, the positive fair value of which is presented in line with the technical disclosure requirements of CRD III and as reported for regulatory purposes. Over the counter (“OTC”) derivatives are contracts that are traded (and privately negotiated) directly between two parties, without going through an exchange or other intermediary. Credit derivatives are financial instruments with which credit risk connected with loans, bonds or other risk-weighted assets or market risk positions is transferred to counterparties providing credit protection.
Table 20: Counterparty credit risk - trading & banking book
2012
Positive fair value of
contracts € m
Add-ons € m
Netting benefits
€ m
Gross positive fair value of
contracts (incl. add-ons)
€ m
Financial collateral
held € m
Net derivatives
credit exposure
€ m
OTC derivatives 2,725 628 - 3,353 - 3,353
Credit derivatives - 2 - 2 - 2
Total derivatives 2,725 630 - 3,355 - 3,355
2011
Positive fair value of
contracts € m
Add-ons € m
Netting benefits
€ m
Gross positive fair value of contracts
(incl. add-ons) € m
Financial collateral
held € m
Net derivatives
credit exposure
€ m
OTC derivatives 2,972 805 - 3,777 - 3,777
Credit derivatives - 2 - 2 - 2
Total derivatives 2,972 807 - 3,779 - 3,779
Derivatives, such as interest rate swaps, options and forward rate agreements, currency swaps and options, and equity index options are used for trading purposes while interest rate swaps, currency swaps, cross currency interest rate swaps and credit derivatives are primarily used for hedging purposes. The Group maintains trading positions in a number of financial instruments including derivatives. Trading transactions arise both as a result of activity generated by customers and from proprietary trading with a view to generating incremental income. Non-trading derivative transactions comprise transactions held for hedging purposes as part of the Group’s risk management strategy against assets, liabilities, positions and cash flows. AIB does not apply the use of netting benefits and collateral held for regulatory credit exposure reporting purposes. The gross positive fair value of contracts in table 20 above differs from the derivative financial instruments in the Group’s 2012 Annual Financial Report. For financial reporting purposes, the Group has a number of ISDA Master Agreements (netting agreements) in place which may allow it to net the termination value of derivative contracts upon the occurrence of an event of default with respect to its counterparties. The Group also has Credit Support Annexes in place which provide collateral for derivative contracts.

43
Credit derivative transactions product distribution Table 21 analyses the notional value of credit derivative transactions, according to their origin and the purposes for which they are used.
Table 21: Credit derivative transactions product distribution 2012
Notional credit derivative transactions
Group’s own credit portfolio use Intermediation activities
Credit derivative product type
Purchased
€m
Sold
€ m
Purchased
€ m
Sold
€ m
Credit default swaps 45 - - -
45 - - -
2011
Notional credit derivative transactions
Group’s own credit portfolio use Intermediation activities
Credit derivative product type
Purchased
€m
Sold
€ m
Purchased
€ m
Sold
€ m
Credit default swaps 45 171 - -
45 171 - -

44
10. Securitisations
Objectives in relation to securitisation activity The Group utilised securitisations primarily to support the following business objectives:
- as an investor, the Group has used securitisation as part of the management of its interest rate and liquidity risks through Treasury;
- as an investor, securitisations have been utilised by the Group to invest in transactions that offered an appropriate risk-adjusted return opportunity;
- as an originator of securitisations, to meet customer demand to offer a full range of investment opportunities by making available opportunities to invest in AIB-managed Collateralised Debt Obligations (“CDOs”) and Collateralised Bond Obligations (“CBOs”);
- as an originator of securitisations to support the funding activities of the Group: and - as a sponsor, the Group manages securitisation vehicles originated by other institutions.
Extent of the Group’s involvement in each securitisation
Investor AIB has primarily been an investor in securitisations issued by other credit institutions. The most significant investment in securitisations has been through Treasury’s purchases of senior tranches of predominantly AAA-rated prime Residential Mortgage Backed Securities (“RMBS”), holdings of which have continued to reduce during 2012.This portfolio was originally purchased as part of Treasury’s primary interest rate and liquidity management objective, subject to qualifying criteria, including loan-to-value (“LTV”), seasoning, location and quality of originator. A smaller proportion of the overall portfolio is held in other asset classes which are reported in the available for sale portfolio. At 31 December 2012, the Group also has a small residual portfolio of investments in securitisations which are classified as “non-core”. The portfolio consists of both cash and synthetic structures across a variety of asset classes, including RMBS, Commercial Mortgage Backed Securities (“CMBS”) and CDOs.
Originator Arising from the acquisition of EBS on 1 July 2011, AIB controls certain special purpose vehicles which had been set up by EBS. These securitisation structures support the funding activities of the Group. Included in the Group’s consolidated loans and receivables to customers is € 3,539 million (31 December 2011 € 3,899 million) of loans held through these EBS securitisation vehicles as follows: Emerald Mortgages No.4 p.l.c. The total carrying amount of the original residential mortgages transferred by EBS Limited to Emerald Mortgages No.4 plc (‘Emerald 4’) as part of the securitisation amounts to € 1,500 million. The amount of transferred secured loans that the Group has recognised at 31 December 2012 is € 868 million. The carrying amount of the bonds issued by Emerald 4 to third party investors amounts to € 846 million. The carrying amount of the loan note in EBS Limited issued to Emerald 4 amounts to € 872 million and is included within “Customer accounts”. Emerald Mortgages No.5 The total carrying amount of original residential mortgages transferred by EBS Limited to Emerald Mortgages No.5 (‘Emerald 5’) as part of the securitisation amounted to € 2,500 million. The amount of transferred secured loans that the Group has recognised at 31 December 2012 is € 1,716 million. Bonds were issued by Emerald 5 to EBS but these are not shown in the Group’s financial statements, as these bonds are eliminated on consolidation. Mespil 1 RMBS Limited (‘Mespil’) The total carrying amount of secured loans that the Group has recognised as at 31 December 2012 is € 955 million in relation to the transfers from EBS Limited and Haven Mortgages Limited. The bonds issued by Mespil to EBS are not shown in the Group’s financial statements, as these bonds are eliminated on consolidation.

45
Tenterden Funding p.l.c. In 2012, the Group securitised € 533 million of its residential mortgage portfolio held in the AIB UK market segment. These mortgages were transferred to a securitisation vehicle, Tenterden Funding p.l.c. (‘Tenterden’). In order to fund the acquired mortgages, Tenterden issued class A notes to external investors and class B notes to an AIB subsidiary. The transferred mortgages have not been derecognised as the Group retains substantially all the risks and rewards of ownership and continue to be reported in the Group’s financial statements. Tenterden is consolidated into the Group’s financial statements with the class B notes being eliminated on consolidation. The liability in respect of cash received by Tenterden from the external investors is included within ‘Debt securities in issue’ on the statement of financial position. At 31 December 2012, the carrying amount of the assets which the Group continues to recognise is € 467 million and the carrying amount of the associated liabilities is € 316 million. Loans which have been securitised but which the Group has not derecognised in the financial statements (€ 4,006 million) are likewise not derecognised for Pillar 1 purposes. These loans are included in Table 16 “Loans and receivables to customers” in Section 8. There were no new securitisations originated by the Group during 2012 which qualified for derecognition under Pillar 1.
Sponsor At 31 December 2012, the Group was acting as a sponsor to a securitisation whilst also being an investor in the vehicle. This securitisation was disposed of in Quarter 1, 2013.
Accounting policies
The Group derecognises financial assets when the contractual rights to receive cash flows from the assets have expired or the Group has transferred its contractual rights to receive cash flows from the assets and either all the risks and rewards of ownership of the assets have transferred to a third party external to the Group or a significant portion, but not all, of the risks and rewards have been transferred outside the Group. If substantially all of the risks and rewards of ownership associated with the financial asset are transferred outside the Group, the financial asset is derecognised in full. The asset is derecognised in its entirety if the transferee has the ability to sell the financial asset; otherwise, the financial asset continues to be recognised to the extent of the Group’s continuing involvement.
Securitisation risks, monitoring and hedging policies
The risks inherent within securitisation activity include those applicable to other types of financial instruments such as credit risk, liquidity risk, market risk, non-trading interest rate risk, structural foreign exchange risk and operational risk. Such risks are identified, managed and monitored in line with the Group’s Risk Management Framework as described on pages 65 to 67 of the 2012 Annual Financial Report and as described in detail in the “Risk management” section of the 2012 Annual Financial Report. Securitisation positions are typically unhedged.
Calculating risk weighted exposure amounts AIB Group uses the IRB approach to calculate the risk-weighted exposure amount for the majority of its securitisation positions (primarily those the group has purchased as an investor), within which the Ratings Based Method is primarily used. Under this approach, where investments are rated, risk weights are assigned to securitisation tranches on the basis of the credit ratings applied to these by approved External Credit Assessment Institutions (“ECAIs”). Where there is no credit rating, but other criteria are met to apply a risk band other than unrated, the Supervisory Formula Method is applied to the exposures to establish the relevant risk weight. The standardised approach is used to calculate the risk-weighted exposure amount in relation to securitisations originated by the Group and for a small proportion of those in which the Group has invested.

46
External Credit Assessment Institutions
AIB uses the following ECAIs for securitisation exposures: - Standard & Poor's Ratings Services - Fitch Ratings - Moody's Investors Service - Dominion Bond Rating Service
The process used to assign credit assessments to risk weights follows the mapping guidelines issued by the European Banking Authority (“EBA”)
1 and adopted by the Central Bank. There is no
outstanding amount of securitised revolving exposures. In relation to the following sets of tables: i. exposure type refers to the assets that are contained in the pool on which the securitisation paper
is issued; ii. traditional securitisation means a securitisation involving the economic transfer of the exposures
being securitised to a securitisation special purpose entity which issues securities. This is accomplished by the transfer of ownership of the securitised exposures from the originator credit institution or through sub participation. The securities issued do not represent payment obligations of the originator credit institution;
iii. synthetic securitisation means a securitisation where the tranching is achieved by the use of credit derivatives or guarantees, and the pool of exposures is not removed from the balance sheet of the originator credit institution;
iv. outstanding amounts are exposures gross of impairment provisions.
Table 22 details the Group's outstanding amount of exposures securitised by securitisation type and
exposure type, and relate to exposures securitised within the Emerald 4 and Tenterden
securitisations, both of which are external.
Table 22: Outstanding amount of exposure securitised 2012
Outstanding amount of exposures
securitised Of which:
Exposure type
Traditional transactions
€ m
Synthetic transactions
€ m
Total
€ m
Impaired
€ m
Past due
€ m
Recognised losses
€ m
Residential mortgages 1,339 - 1,339 104 33 -
Commercial mortgages - - - - - -
Leasing - - - - - -
Loans to corporates or SMEs - - - - - -
Consumer loans - - - - - -
1,339 - 1,339 104 33 -
2011
Outstanding amount of exposures securitised Of which:
Exposure type
Traditional transactions
€ m
Synthetic transactions
€ m
Total
€ m
Impaired
€ m
Past due
€ m
Recognised losses
€ m
Residential mortgages 917 917 85 17 -
Commercial mortgages - - - - - -
Leasing - - - - - -
Loans to corporates or SMEs - - - - - -
Consumer loans - - - - - -
917 - 917 85 17 -
1
The European Banking Authority was established by Regulation (EC) No. 1093/2010 of the European Parliament and of the
Council of 24 November 2010. The EBA officially came into being as of 1 January 2011 and has taken over all existing and ongoing tasks and responsibilities from the Committee of European Banking Supervisors (“CEBS”).

47
Tables 23 and 24 analyse the Group’s total securitisation positions (including re-securitisations) by exposure type and risk weight, whilst Table 24a analyses the Group re-securitisations positions by risk weight.
Table 23: Securitisation positions – by exposure type of underlying exposure 2012
Securitisation positions – outstanding amount
Retained Purchased Total
Originator Sponsor Investor
Exposure type € m € m € m € m
Residential mortgages 23 - 1,019 1,042
Commercial mortgages - - 91 91
Leasing - - 4 4
Loans to corporates or SMEs - - 27 27
Consumer loans - - 91 91
Re-securitisations - 26 107 133
23 26 1,339 1,388
2011
Securitisation positions – outstanding amount
Retained Purchased Total
Originator Sponsor Investor
Exposure type € m € m € m € m
Residential mortgages 23 - 1,970 1,993
Commercial mortgages - - 120 120
Leasing - - 6 6
Loans to corporates or SMEs - - 181 181
Consumer loans - - 109 109
Re-securitisations - 165 359 524
23 165 2,745 2,933
Table 24: Securitisation positions - risk weight bands 2012
Securitisation positions – outstanding amount
Retained Purchased Total
Originator Sponsor Investor
Risk weight band € m € m € m € m
7 – 10% - - 286 286
11 – 19% - - 100 100
20 – 49% - - 362 362
50 – 75% - - 123 123
75 – 99% - - - -
100 – 249% - 26 124 150
250 – 349% - - 67 67
350 – 424% - - 40 40
425 – 649% - - 90 90
650 – 1249% - - 56 56
1250% or deducted 23 - 91 114
23 26 1,339 1,388

48
2011
Securitisation positions – outstanding amount
Retained Purchased Total
Originator Sponsor Investor
Risk weight band € m € m € m € m
7 – 10% - - 1,636 1,636
11 – 19% - - 168 168
20 – 49% - - 171 171
50 – 75% - - 103 103
75 – 99% - - - -
100 – 249% - 27 157 184
250 – 349% - 96 139 235
350 – 424% - - - -
425 – 649% - - 158 158
650 – 1249% - 42 55 97
1250% or deducted 23 - 158 181
23 165 2,745 2,933
Table 24a: Re-securitisation positions - risk weight bands 2012
Securitisation positions – outstanding amount
Retained Purchased Total
Originator Sponsor Investor
Risk weight band € m € m € m € m
7 – 10% - - - -
11 – 19% - - - -
20 – 49% - - - -
50 – 75% - - 4 4
75 – 99% - - - -
100 – 249% - 26 13 39
250 – 349% - - 37 37
350 – 424% - - 40 40
425 – 649% - - 13 13
650 – 1249% - - - -
1250% or deducted - - - -
- 26 107 133
2011
Securitisation positions – outstanding amount
Retained Purchased Total
Originator Sponsor Investor
Risk weight band € m € m € m € m
7 – 10% - - - -
11 – 19% - - - -
20 – 49% - - 29 29
50 – 75% - - 41 41
75 – 99% - - - -
100 – 249% - 27 103 130
250 – 349% - 96 26 122
350 – 424% - - - -
425 – 649% - - 44 44
650 – 1249% - 42 12 54
1250% or deducted - - 104 104
- 165 359 524
49
11. Equity exposures in the banking book
AIB calculates its capital requirements for equity exposures in the banking book using the Standardised Approach. The Group's equity activity can be divided into the following four sub-categories:
a) Quoted investments: a limited number of straight equity positions that are quoted on recognised stock exchanges;
b) Unquoted investments: typically comprising exposure to equities or the equity tranche in a structured transaction or SPE;
c) Managed funds: typically comprising exposure to the equity component of a managed investment fund;
d) Investments in associate undertakings: these are held by the Group for strategic purposes.
While individual transactions will vary in structure, the Group’s profit objectives are typically realised through a combination of fee income (e.g. structuring or management fees), dividend income and capital gains on realisation.
The principal accounting policies applied by the Group to equity investments is informed by International Accounting Standards IAS 28 and IAS 39 which set out the rules for classification, balance sheet recognition, methods of valuation (i.e. fair value) and income and impairment recognition. Further information in relation to the Group accounting policies for financial assets, which include equities, can be found in the Group’s 2012 Annual Financial Report. Investments in associated undertakings are initially recorded at cost and increased (or decreased) each year by the Group’s share of the post acquisition net income (or loss), and other movements reflected directly in the equity of the associated undertaking. Other banking book equities are carried on the balance sheet at fair value.
Goodwill arising on the acquisition of an associated undertaking is included in the carrying amount of the investment (net of any accumulated impairment loss). For regulatory purposes, goodwill in associates is deducted directly from capital.
The cumulative realised gains from sales and liquidations in the banking book of equity investments amount to € 6 million for the year ended 31 December 2012 (2011: € 8 million).
The total unrealised gain as at 31 December 2012, gross of tax, in the banking book of equity investments amounted to € 11 million, all of which relates to other equity securities (2011: unrealised gain € 2 million, all of which related to other equity securities). In addition, provisions for impairment of available for sale equity investments of € 86 million (2011: € 119 million) were included in the income statement in 2012.
An unrealised loss, after tax, of € 15 million (2011: € 22 million) is included in tier 1 capital whilst an unrealised gain, after tax, of € 26 million (2011: € 24 million) is included in tier 2 capital for regulatory capital calculations. There were no latent revaluation gains or losses. Further details in relation to this are contained in Appendix 2: Own funds of this report.

50
Table 25: Banking book equity values 2012
Carrying value Type Nature € m
Exchange traded exposures Quoted A limited number of straight equity positions that are quoted on recognised stock exchanges. 58
Unquoted Exposure to equities or the equity tranche in a structural transaction or SPE. 68
1
Funds Exposure to the equity component of a managed investment fund. 17
Other exposures
CDOs/CBOs Equity interest in Collateralised Debt Obligation SPEs created and managed by Group on an ongoing basis. -
143
Investments in associate undertakings2
Less goodwill3
64 (3)
61
204
Of which are risk weighted Of which deducted from capital
192 12
204
2011 Carrying value
Type Nature € m
Exchange traded exposures Quoted A limited number of straight equity positions that are quoted on recognised stock exchanges. 54
Unquoted Exposure to equities or the equity tranche in a structural transaction or SPE. 181
1
Funds Exposure to the equity component of a managed investment fund. 30
Other exposures
CDOs/CBOs Equity interest in Collateralised Debt Obligation SPEs created and managed by Group on an ongoing basis. 1
266
Investments in associate undertakings Less goodwill
3
246 (3)
243
509
Of which are risk weighted Of which deducted from capital
430 79
509
1 Of which €47 million relates to NAMA subordinated bonds (2011: €132 million).
2 Investment in Aviva Life Holdings Limited (“ALH”) is accounted for at fair value through Profit & Loss – see note on page 61
Supervisory deductions from gross capital. 3 Deducted from Tier 1 capital.

51
Table 26: Risk weighted asset equivalents of equity exposures
2012
Exposure € m
Risk weighted asset € m
Equity investments subject to a 100% risk weight 153 153
Equity investments subject to a 150% risk weight 39 59
192 212
2011
Exposure € m
Risk weighted asset € m
Equity investments subject to a 100% risk weight 177 177
Equity investments subject to a 150% risk weight 253 380
430 557

52
12. Non-trading interest rate risk Non-trading interest rate risk is defined as the Group’s sensitivity to earnings volatility in its non-trading activity arising from movements in interest rates. It reflects a combination of banking book treasury activity and interest rate risk arising in the Group’s retail, commercial and corporate operations. AIB’s banking book activity includes its money market business and management of internal funds flows with the Group’s businesses. Non-trading interest rate risk in retail, commercial and corporate banking activities can arise from a variety of sources, including where those assets and liabilities and off-balance sheet instruments have different repricing dates. As a core risk management principle, the Group requires that Treasury manages, and is responsible for, all material interest rate risk throughout the Group. This banking book risk is managed as part of Treasury’s overall interest rate risk position. A Principal Components Analysis (PCA) methodology is applied for the determination of the Group’s ICAAP internal capital requirements for non-trading interest rate risk. A PCA approach is employed to analyse interest rate term structure factor sensitivity (i.e. PCA identifies the three most predictive elements driving interest rate changes, namely parallel shift, twist and bow, and uses these in the determination of alternative stressed portfolio valuation). A stress test, based on 200 basis points (“bps”) parallel interest rate shocks, is also applied for non-trading interest rate risk. For both methods, interest rates are floored at zero under all scenarios. Non-trading interest rate risk is calculated on the basis of establishing the repricing behaviour of each asset, liability and off-balance sheet product. For some products, the actual interest repricing characteristics differ from their contractual arrangements. In these cases, the repricing maturity is determined by the market interest rates that most closely fit the behaviour of the product interest rate. The Group manages structural interest rate risk volatility by maintaining a portfolio of instruments with interest rates fixed for several years. For non-interest bearing current and demand deposit accounts, prudent assumptions regarding their average life are made based on the stability of the portfolio. Behavioural assumptions are also applied in relation to Impaired Loan balances and potential prepayment activity for the Fixed Rate mortgage portfolio. Stress-testing of these behavioural assumptions is undertaken and the associated impact is reflected as a "Behavioural Assumption Sensitivity”. In the case of the Group's equity, an assumed average maturity is assigned, and a portfolio of fixed interest securities is maintained to manage the associated interest rate risk volatility. The assumptions underpinning these repricing maturities and the stability levels of portfolios are reviewed periodically by Group ALCo. Basis risk arises for the Group principally in relation to the net cash flow position in respect of European Central Bank (”ECB”) Repo funding balances, and Tracker Mortgages linked to the ECB Refi rate, and is reflected as part of the overall analysis of non-trading interest rate risk. Detailed analysis of non-trading interest rate risk is presented to the Group ALCo for approval on a quarterly basis, as part of the overall ICAAP process.

53
Table 27: Non-trading interest rate risk variation
2012
Interest rate risk variation Absolute € m % of Own funds
Interest rates +1% 23 0.2
Interest rates -1% (199) (1.6)
Interest rates +2% 342 2.7
Interest rates -2% (299) (2.4)
PCA Rates Higher (35) (0.3)
PCA Rates Lower (197) (1.6)
2011
Interest rate risk variation Absolute € m % of Own funds
Interest rates +1% 285 1.7
Interest rates -1% (416) (2.4)
Interest rates +2% 741 4.3
Interest rates -2% (612) (3.5)
PCA Rates Higher 192 1.1
PCA Rates Lower (337) (1.9)
The absolute level of interest rate risk sensitivity has declined over the course of 2012, reflecting a number of key underlying issues:
• The levels of open directional interest rate risk were reduced due to increased investment in Fixed interest securities.
• Basis risk has increased over the course of the year, mainly due to an increase in the volatility of the spread between Euribor and ECB Refi, principally in relation to ECB Refi rate exposures arising from AIB’s tracker mortgage portfolio and ECB refinancing operations.
• Euro interest rates declined during 2012 and, as a result, Down 200 sensitivities are subject to significant ‘floor effects’ i.e. the assumption of zero as a minimum interest rate at most durations, with Down 100 sensitivities also increasingly subject to this effect in light of the interest rate swap levels prevailing at 31 December 2012.

54
Appendix 1: Parent and subsidiary disclosures
Article 72 of the CRD requires the Group to disclose various information on the calculation of capital ratios and own funds of its significant subsidiaries. The Group has provided this information on the following pages for the parent and significant subsidiaries as at 31 December 2012:
a) Allied Irish Banks, p.l.c.; b) AIB Mortgage Bank; c) AIB Group (UK) p.l.c.; d) EBS Limited; and e) EBS Mortgage Finance.
The Basel II capital ratios are based on Pillar 1 (‘minimum capital requirements’) under the CRD. Figures reported for Allied Irish Banks, p.l.c. and EBS Limited reflect the solo consolidation basis. Figures reported for AIB Group (UK) p.l.c represent the position as reported to its local regulator (the Financial Services Authority (“FSA”)). The closing exchange rate on 31 December 2012 used to translate sterling (“Stg£”) to Euro is € 1 = Stg£ 0.81610, consistent with the 2012 Annual Financial Report.

55
Table 28: Capital base of significant subsidiaries - as reported to local regulators
2012
Allied Irish Banks, p.l.c. € m
AIB Mortgage
Bank € m
AIB Group (UK) p.l.c.
€ m
EBS Limited
€m
EBS
Mortgage Finance
€m
Tier 1
Paid up share capital and related share premium
Eligible reserves
Equity non-controlling interests in subsidiaries
Supervisory deductions from core tier 1 capital
8,096
3,165
-
(470)
1,545
(620)
-
-
4,541
(2,960)
-
-
1,324
(587)
-
(27)
477
(124)
-
(2)
Core tier 1 capital
Non-equity non-controlling interests in subsidiaries
Non-cumulative perpetual preferred securities
Reserve capital instruments
Supervisory deductions from tier 1 capital
10,791
-
-
-
-
925
-
-
-
-
1,581
-
-
-
-
710
-
-
-
-
351
-
-
-
-
Total tier 1 capital 10,791 925 1,581 710 351
Tier 2
Eligible reserves
IBNR provisions (Standardised portfolio)
Subordinated perpetual loan capital
Subordinated term loan capital
Supervisory deductions from tier 2 capital
21
482
-
1,154
(196)
-
82
200
100
-
3
117
-
-
-
-
79
-
-
-
-
44
-
-
-
Total tier 2 capital 1,461 382 120 79 44
Gross capital
Supervisory deductions
12,252
(74)
1,307
-
1,701
(37)
816
(27)
395
(2)
Total capital 12,178 1,307 1,664 789 393
Risk weighted assets:
Credit risk
Market risk
Operational risk
Capital floor
47,723
535
3,507
-
12,708
-
422
-
8,660
-
667
-
6,185
-
146
-
3,465
-
73
-
Total risk weighted assets 51,765 13,130 9,327 6,331 3,538
Capital ratios
Core tier 1
Tier 1
Total
20.9%
20.9%
23.5%
7.0%
7.0%
10.0%
17.0%
17.0%
17.8%
11.2%
11.2%
12.5%
9.9%
9.9%
11.2%

56
Table 28: Capital base of significant subsidiaries - as reported to local regulators (continued)
2011
Allied Irish Banks,
p.l.c. € m
AIB Mortgage
Bank € m
AIB Group (UK) p.l.c.
€ m
EBS Limited
€ m
EBS
Mortgage Finance
€m
Tier 1
Paid up share capital and related share premium
Eligible reserves
Equity non-controlling interests in subsidiaries
Supervisory deductions from core tier 1 capital
10,096
3,209
-
(424)
1,345
(324)
-
-
3,760
(2,153)
-
(1)
924
36
-
(29)
477
(46)
-
(2)
Core tier 1 capital
Non-equity non-controlling interests in subsidiaries
Non-cumulative perpetual preferred securities
Reserve capital instruments
Supervisory deductions from tier 1 capital
12,881
-
-
-
-
1,021
-
-
-
-
1,606
-
-
-
-
931
-
-
-
-
429
-
-
-
-
Total tier 1 capital 12,881 1,021 1,606 931 429
Tier 2
Eligible reserves
IBNR provisions (Standardised portfolio)
Subordinated perpetual loan capital
Subordinated term loan capital
Supervisory deductions from tier 2 capital
20
629
-
1,472
(200)
-
200
100
80
-
4
138
676
-
-
-
89
-
-
-
-
8
-
-
-
Total tier 2 capital 1,921 380 818 89 8
Gross capital
Supervisory deductions
14,802
-
1,401
-
2,424
(37)
1,020
-
437
-
Total capital 14,802 1,401 2,387 1,020 437
Risk weighted assets:
Credit risk
Market risk
Operational risk
Capital floor
58,863
460
4,582
-
12,111
-
339
-
10,013
-
1,000
-
6,941
-
204
-
3,738
-
65
-
Total risk weighted assets 63,905 12,450 11,013 7,145 3,803
Capital ratios
Core tier 1
Tier 1
Total
20.2%
20.2%
23.2%
8.2%
8.2%
11.2%
14.6%
14.6%
21.7%
13.0%
13.0%
14.3%
11.3%
11.3%
11.5%

57
Table 29: Minimum capital requirement of significant subsidiaries - as reported to local regulators
2012
Allied Irish
Banks, p.l.c.
€ m
AIB Mortgage
Bank
€ m
AIB Group (UK) p.l.c.
€ m
EBS Limited
€ m
EBS
Mortgage Finance
€m
Standardised credit risk exposure class
Central governments and central banks - - 8 3 -
Administrative bodies and non-commercial undertakings 3 - - - -
Institutions11
682 1 2 47 5
Corporates 680 - 286 92 -
Retail 238 1 57 - -
Secured on real estate property 323 34 234 142 213
Past due items22
698 47 68 93 57
Items belonging to regulatory high risk categories 30 - - 1 -
Collective investment undertakings - - - - -
Covered Bonds - - - 10 -
Securitisation Positions - - - 28 -
Other items 277 17 38 78 2
2,931 100 693 494 277 Total for Standardised Approach
Foundation IRB exposure class
Central governments and central banks 6 - - - -
Institutions12
75 - - - -
Corporates 636 - - - -
Retail 72 917 - - -
Securitisation positions 96 - - - -
Non-credit obligation assets 1 - - - -
886 917 - - - Total for Foundation IRB Approach
Total for credit risk 3,817 1,017 693 494 277
Total for market risk 43 - - - -
Total for operational risk 281 34 53 12 -
Total for capital floor - - - - 6
Total minimum capital requirement 4,141 1,051 746 506 283
1 Institution exposure class predominantly relates to banks.
2 The Basel asset class “Past due items” relates only to standardised exposures and comprises exposures that are greater than
90 days past due or defaulted, and those impaired.

58
Table 29: Minimum capital requirement of significant subsidiaries - as reported to local
regulators (continued)
2011
Allied Irish Banks,
p.l.c.
€ m
AIB Mortgage
Bank
€ m
AIB Group (UK) p.l.c.
€ m
EBS Limited
€ m
EBS
Mortgage Finance
€m
Standardised credit risk exposure class
Central governments and central banks - - - 2 -
Administrative bodies and non-commercial undertakings 3 - - - -
Institutions1 865 2 - 22 5
Corporates 756 - 327 96 -
Retail 272 1 59 - -
Secured on real estate property 552 35 291 209 249
Past due items2 598 45 44 123 44
Items belonging to regulatory high risk categories 68 - - 1 -
Collective investment undertakings - - - - -
Covered Bonds - - - 11 -
Securitisation Positions - - - 24 -
Other items 276 11 80 67 1
3,390 94 801 555 299 Total for Standardised Approach
Foundation IRB exposure class
Central governments and central banks 6 - - - -
Institutions1 160 - - - -
Corporates 874 1 - - -
Retail 60 874 - - -
Securitisation positions 218 - - - -
Non-credit obligation assets 1 - - - -
1,319 875 - - - Total for Foundation IRB Approach
Total for credit risk 4,709 969 801 555 299
Total for market risk 36 - - - -
Total for operational risk 367 27 80 16 5
Total for capital floor - - - - -
Total minimum capital requirement 5,112 996 881 571 304
1 Institution exposure class predominantly relates to banks.
2 The Basel asset class “Past due items” relates only to standardised exposures and comprises exposures that are greater than 90 days past due or defaulted, and those impaired.

59
Appendix 2: Own funds Summary information on the main components of own funds items, and their terms and conditions as applicable, is set out below. Further information on the terms and conditions of ordinary shares and the government preference shares is available in the 2012 Annual Financial Report on the Group website: www.aibgroup.com.
TIER 1
Core tier 1
Paid up share capital and related share premium
Ordinary, convertible non-voting and preference share capital comprising shares of the parent company represent funds raised by issuing shares in return for cash or other consideration. When shares are issued at a premium whether for cash or otherwise, the excess of the amount received over the par value of the shares is transferred to share premium.
A bonus issue of 3,623,969,972 of new ordinary shares of € 0.01 each to the National Pension Reserve Fund Commission (“NPRFC”) in lieu of settlement of a dividend payable by AIB p.l.c., resulted in a transfer of € 36 million from the share premium to ordinary share capital during 2012. The paid up share capital and related share premium relates to the ordinary shares and the Preference Shares. Following the renominalisation of Allied Irish Banks, p.l.c.’s ordinary shares in 2011 and the resulting acquisition and subsequent cancellation of deferred shares arising from this transaction in 2011, the Irish High Court, in May 2012, confirmed an application by Allied Irish Banks, p.l.c., to reduce the share premium by € 2,000 million in addition to a reduction of € 3,958 million in its capital redemption reserve.
Eligible reserves
Included in the eligible reserves are the following capital components:
Revenue reserves Revenue reserves represent retained earnings of the parent company, subsidiaries and its associated undertakings. Revenue reserves are shown gross of the cumulative deficit within the defined benefit pension schemes. A capital contribution amounting to € 6,054 million which was received from the Irish Minister for Finance and the NPRFC in July 2011 is also included within revenue reserves. The reduction in share premium and capital redemption reserves of € 2,000 million and € 3,958 million respectively were transferred to revenue reserves in 2012. € 247 million of capital contributions relating to the Anglo business transfer and the Contingent Capital Note issuance was deemed distributable in 2012 and transferred from capital reserves to revenue reserves.
Available for sale equity securities Unrealised losses on available for sale equity securities are deducted from tier 1 eligible reserves.
Foreign currency translation reserves The foreign currency translation reserves represent the cumulative gains and losses on the retranslation of the Group’s net investment in foreign operations, at the rate of exchange at the reporting date.
Treasury shares Where the parent or other members of the Group purchase the share capital of Allied Irish Banks, p.l.c., the consideration paid is deducted from total shareholders’ equity as treasury shares. Where such shares are subsequently sold or re-issued, any consideration received is included in shareholders’ equity.
Share based payment reserve The share based payment expense charged to the income statement is credited to the share based payment reserve over the vesting period of the shares and options. Upon the grant of shares and the exercise of options, the amount in respect of the award credited to the share based payment reserve is transferred to revenue reserves.

60
Capital reserves Capital reserves represent transfers from retained earnings in accordance with relevant legislation and also include capital contributions arising from the acquisition of the Anglo deposit business and the acquisition of EBS. The capital contribution arising from the Anglo transaction is treated initially as non-distributable as the assets received relate to NAMA bonds. However, as NAMA repays these bonds the proceeds will be deemed distributable and an equal amount will be transferred to revenue reserves. The capital contribution arising from the EBS transaction is treated as non-distributable as the related net assets received are largely non-cash in nature. Capital redemption reserves The capital redemption reserves of € 3,958 million represent the reserves created on the cancellation of deferred shares which arose from the re-nominalisation of AIB’s ordinary share capital in July 2011. On 1 May 2012, the Irish High Court, confirmed an application by Allied Irish Bank’s, p.l.c., for a reduction of its capital redemption reserve fund and accordingly, the balance of € 3,958 million was transferred to revenue reserves leaving a balance of nil.
TIER 2
Eligible reserves
Fixed asset revaluation reserves Revaluation reserves represent the unrealised surplus, net of tax, which arose on revaluation of properties prior to the implementation of IFRS at 1 January 2004.
Available for sale equity securities Unrealised gains on available for sale equity securities are included in tier 2 eligible reserves.
Credit provisions Incurred but not reported provisions For IFRS purposes impairment provisions on financial assets are required to be recognised in respect of losses that have been incurred but not reported (“IBNR”). An IBNR provision represents an interim step pending the identification of impairment losses on an individual asset in a group of financial assets. As soon as information is available that specifically identifies losses on individually impaired assets in a group, those assets are removed from the group. This IBNR provision on the standardised portfolio is included as tier 2 capital. IRB provision excess Where there is an excess of provision on Internal Ratings Based Approach (“IRBA”) portfolios over the expected loss on IRBA portfolios, this excess is included as tier 2 capital subject to regulatory thresholds.
Subordinated term loan capital At 31 December 2012 subordinated term loan capital is included within Tier 2 capital. This includes the balances outstanding on dated loan capital which were issued under the European Medium Term Note programme. During 2011, all outstanding amounts were either redeemed or purchased for cash apart from residual, balances which were subject to a Subordinated Liabilities Order (“SLO”). The carrying value of these residual balances amounted to € 34 million at 31 December 2012. On 26 July 2011, AIB issued € 1.6 billion in nominal value of Contingent Capital Notes (“CCNs”) to the Minister for Finance of Ireland for a cash consideration of € 1.6 billion. Under IFRS, the fair value of these notes was recorded as € 1,153 million with € 447 million accounted for as a capital contribution and included within capital reserves. However, for regulatory capital purposes, the € 1.6 billion is included within tier 2 capital, albeit reduced by 10 percent due to maturity. The terms of these notes are as follows:

61
Issue of € 1.6 billion Contingent Capital Tier 2 Notes due 2016 On 26 July 2011, AIB issued € 1.6 billion in contingent capital notes (‘CCNs’) to the Minister for Finance for cash consideration of € 1.6 billion. Interest is payable annually in arrears at a fixed rate of 10% per annum on the nominal amount outstanding. These notes, which are unsecured, mature in 2016 and qualify as subordinated tier 2 instruments. They rank as (a) junior to claims of all holders of unsubordinated obligations of AIB; (b) pari passu with the claims of holders of all other subordinated obligations of AIB which qualify as consolidated tier 2 capital of the Group for regulatory purposes or which rank, or are expressed to rank, pari passu with the CCNs; and (c) senior to the claims of all other subordinated obligations of AIB which rank junior to the CCNs including any subordinated obligations of AIB which qualify as tier 1 capital of the Group for regulatory purposes. While the CCNs are outstanding, if the Core tier 1 capital ratio (the CET Ratio after the CRD IV implementation date) falls below the Trigger ratio of 8.25%, the CCNs are immediately and mandatorily redeemable and will convert to ordinary shares of AIB at a conversion price of € 0.01 per share.
Details of the Group’s dated loan capital are set out in pages 284 to 285 of the Annual Financial Report 2012.
Supervisory deductions from core tier 1
Goodwill and intangible assets
Goodwill and intangible assets are deducted from core tier 1 capital. Pension filter Cash contributions to pension schemes are agreed between the Trustees and the employer on a triennial basis and comprise an amount to cover the expected current service cost and an amount to eliminate any pension deficit arising at the triennial valuation. Excess contributions to eliminate a pension deficit are deducted from capital based on the rules applied by the local regulator.
Basel II related supervisory deductions from core tier 1 and tier 2 capital Holdings in other credit and financial institutions Holdings in other credit and financial institutions’ equity capital or other qualifying capital instruments are required to be deducted if the holding exceeds 10% of the regulatory capital of the institution. The deduction amounts to the excess of the investment in these instruments over 10% of the regulatory capital of the institution. The required deduction is made 50% from core tier 1 capital and 50% from tier 2 capital. Expected loss adjustment The expected loss on the IRB portfolios is compared to the IFRS provisions on the IRB Portfolios. The excess of the expected loss over the IFRS provisions is deducted 50% from core tier 1 capital and 50% from tier 2 capital. Securitisation positions Certain securitisation exposures, where the Group is either an originator or an investor, are treated as deductions from capital and thus excluded from the risk weighted asset calculation. The required deduction is made 50% from core tier 1 capital and 50% from tier 2 capital.
Supervisory deductions from gross capital Holdings in insurance undertakings For the year-ended 31 December 2012, holdings in insurance undertakings are required to be deducted if the holding exceeds 10% of the capital of the institution. The deduction amounts to the excess of the investment in the institution over 10% of the capital of the institution. The required deduction is made from total capital. However, from 1 January 2013, the treatment of participation in insurance undertakings has changed. The regulatory treatment is to fully deduct the investment in the associate from capital, split 50:50 from Core tier 1 and Tier 2 capital. This deduction relates to the Group’s investment in Aviva Life Holdings Limited (“ALH”), which although the Group holds more then a 20% interest it was accounted for in the Annual Financial Report 2012 at fair value through profit or loss, since the Group ceased to have significant influence over the investee. (See note 25 of the Annual Financial Report 2012.).

62
Appendix 3: Remuneration Disclosures
Introduction In December 2010 the Committee of European Banking Supervisors (CEBS) - now the European Banking Authority (EBA) - issued Guidelines on Remuneration Policies and Practices for application by financial institutions across the EU. This report addresses Section 5 of the Guidelines relating to Disclosure by providing further remuneration information in addition to that contained in the 2012 Annual Financial Report (“Remuneration Committee” and “Remuneration Policy and Governance” pages 179 to 181 and the “Report on directors’ remuneration and interests” pages 316 to 320). The report summarises AIB’s principal remuneration policies and practices including the required design features of any schemes, decision making and the governance of remuneration, and the link between individual and company performance and remuneration. AIB’s remuneration levels continued to be closely managed in 2012 with no general salary increases or increments paid. There were no bonuses or shares awarded in 2012. While there are currently no bonus schemes or share schemes in operation, any future schemes will be structured in line with the EBA Guidelines on Policies and Practices and AIB’s Remuneration Policy. Aggregate quantitative data on remuneration for those members of staff in employment during 2012 and whose professional activities are considered to have a material impact on AIB’s risk profile is detailed below.
Table 30: Remuneration 2012
Segments and business Areas
Personal & Business Banking
Corporate, Institutional & Commercial Banking AIB UK EBS
Group
1 Total
€ m 8.7 6.3 5.1 2.1 21.9 44.1 Total Remuneration in 2012 (all forms of payments or benefits) Identified
Staff 34 22 18 12 82 168
€ m 0.1 0.1 0.0 0.0 0.0 0.2 Variable Remuneration in 2012 (additional payments or benefits including contractual obligation)
Identified Staff
1 3 0 0 0 4
€ m 1.2 0.2 0.2 0.0 2.8 4.4 Severance payments in 2012 (payments under the Voluntary Severance and Early Retirement schemes)
Identified Staff
6 1 1 0 13 21
€ m 1.3 0.3 0.2 0.0 2.8 4.6 Total Variable Remuneration in 2012
Identified Staff
6 4 1 0 13 24
1 The figures for Group segment include the following centralised functions: Group Services and Transformation, Chief Financial
Office, Chief Risk Office, Non-Core Unit, Corporate Affairs and Strategy, Office of Group General Counsel and Office of Group Internal Audit.

63
2011
Segments and business Areas
Retail Banking - Republic of
Ireland
Corporate, Institutional & Commercial
Banking AIB UK EBS Group
Total
€ m 10.2 6.3 5.0 4.1 19.2 44.8 Total Remuneration in 2011 (all forms of payments or benefits) Identified
Staff 43 22 19 20 77 181
€ m 0.00 0.17 0.03 0.00 0.80 1.00 Total Variable Remuneration in 2011 (additional payments or benefits including contractual obligation)
Identified Staff
0 4 1 0 6 11
2012
Functions Senior
management11
Key control functions
Other material risk takers
Total
€ m 14.1 7.9 22.1 44.1 Total Remuneration in 2012 (all forms of payments or benefits) Identified
Staff 45 37 86 168
€ m 13.4 7.4 18.7 39.5 Total Fixed Remuneration in 2012 (salaries and other fixed benefits including pension contributions) Identified
Staff 45 37 86 168
€ m 0.0 0.0 0.2 0.2 Variable Remuneration in 2012 (additional payments or benefits including contractual obligations)
Identified Staff
0 0 4 4
€ m 0.7 0.5 3.2 4.4 Severance Payments in 2012 (payments under the Voluntary Severance and Early Retirement schemes)
Identified Staff
3 3 15 21
€ m 0.7 0.5 3.4 4.6 Total Variable Remuneration in 2012
Identified Staff
3 3 18 24
2011
Functions Senior
management Key control functions
Other material risk takers
Total
€ m 10.5 11.3 23.0 44.8 Total Remuneration in 2011 (all forms of payments of benefits) Identified
Staff 32 52 97 181
€ m 10.4 11.2 22.2 43.8 Total Fixed Remuneration in 2011 (salaries and other fixed benefits including pension contributions) Identified
Staff 32 52 97 181
€ m 0.1 0.1 0.8 1.0 Total Variable Remuneration in 2011 (additional payments or benefits including contractual obligation) Identified
Staff 1 1 9 11
1 Current Leadership Team and direct reports to the Leadership Team members.

64
- Variable remuneration in 2012 includes four contractual payments totalling € 210,886 and severance payments under the approved voluntary severance scheme in respect of Identified Staff amounting to € 4,393,732. Severance payments were paid to a total of 21 staff, the highest amount paid to any one person being € 225,000 or GBP£ 190,000.
- There was no deferred remuneration awarded in 2012; details of any options that vested in previous years and exercisable are contained in Note 11 “Share-based compensation schemes” in the 2012 Annual Financial Report.
- There were no sign-on payments in respect of the Identified Staff during 2012. - Details of Directors' remuneration are contained in Note 62 in the 2012 Annual Financial Report.
The list of Identified Staff was compiled in full consultation with the relevant business areas and control functions while taking account of the extent of individuals’ reporting lines, and the degree to which individuals’ decision making was subject to control and approval through credit committees or trading limits. A total of 168 staff were identified as material risk takers in 2012 (from 185 material risk takers in 2011). These Identified Staff considered to have a material impact on AIB’s risk profile include:
- Members of the Leadership Team; - Other senior management such as members of Senior Management teams and those responsible
for leading significant business lines including regions, trading and other pricing/funding activities; - Senior management in Credit Risk including the Chief Credit Officer, Heads of Credit, their direct
reports and other staff with delegated authority to chair credit committees with discretions greater than €10 million;
- Senior staff responsible for compliance, finance, risk management, human resources and internal audit; and
- Other risk takers whose professional activities individually or collectively exert influence on the institution’s risk profile, including staff capable of entering into contracts/positions and taking decisions that affect the institution’s risk positions. e.g. traders and credit officers.
Incentive Scheme Design Features AIB reviewed and adapted its remuneration policies in 2011 to take account of the remuneration requirements of the CRD III and the related EBA Guidelines to ensure that its remuneration policies and practices are fully consistent with, and promote effective risk management. There was little scope in practice to change the design characteristics of remuneration schemes (which are suspended) and to give effect to the required regulatory changes in 2011 due to the financial position of the Group, and the constraints on remuneration arising from AIB’s commitments under the Subscription and Placing Agreements between Allied Irish Banks, plc and the National Pensions Reserve Fund Commission (NPRFC), the National Treasury Management Agency (“NTMA”) and the Minister for Finance.
AIB’s Remuneration Policy which is approved by the AIB Board, contains a range of important remuneration design requirements which together will ensure that the remuneration of Identified Staff, and of any other employee at the discretion of the Remuneration Committee, is fully compliant with the EBA Guidelines. These requirements principally relate to:
- Quantitative and qualitative risk-adjusted performance measurement; - Deferral structures which will ensure performance is measured over both the short and medium
term; - The inclusion of forfeiture, claw back and discretionary provisions in remuneration schemes.
Decision Making and Governance AIB’s remuneration policies are set and governed by the Remuneration Committee of the Board whose purpose, duties and membership are set by its Terms of Reference which may be viewed on the Group’s website www.aibgroup.com. In 2012 the membership of the Remuneration Committee comprised:
• Members: David Hodgkinson, Jim O’Hara, Peter Hagan (from 26 July 2012) and Tom Foley (from 13 September 2012); and
• Former Members during the year: Declan Collier (resigned from the Board on the 28 June 2012).
The scope of the Committee’s activities is broad based, ranging from setting pay policy to determining appropriate pension arrangements. The adoption of remuneration policies and practices, which are both fair and competitive and that drive sustainable performance over the long-term, is a key responsibility of the Board. The Board recognises the need to take account of appropriate input from AIB’s control functions in

65
its decision making, and to ensure that remuneration policies and practices are consistent with, and promote, effective risk management, and that they do not encourage excessive risk taking, but support the maintenance of a sound capital base and required liquidity levels. The Terms of Reference of the Remuneration Committee were reviewed in 2012 by the Committee following which changes were made, with Board approval, to reflect standardisation of company documentation. The governance and scope of AIB’s remuneration policies and practices include all financial benefits for employees and extend to all areas of the Group. The Remuneration Committee’s responsibilities include recommending to the Board:
- remuneration policies and practices; - the remuneration of the Chairman of the Board (in his absence); and - performance related and share-based incentive schemes when appropriate.
The Committee also determines the remuneration of the Chief Executive and, in consultation with the Chief Executive, the remuneration of other Executive Directors and the other members of the Leadership Team, under advice to the Board. The Committee is also required to review the remuneration components of staff identified as material risk takers as defined by the EBA. Remuneration matters of a significant nature are considered by the Board as a whole. The Committee controls the appointment of any external remuneration consultants or similar specialist advisors who provide it with advice.
Pay and Performance AIB’s remuneration policies are designed to support its business strategy by aligning the objectives and incentives of individual staff with AIB’s financial and non-financial performance thereby ensuring a strong link between performance and reward. AIB’s performance review process uses a balanced scorecard approach in the assessment of individual performance which in turn determines individual reward including base pay and other cash or share based incentives. Although AIB’s incentive schemes are currently suspended, the design features of performance related pay, bonus schemes and share schemes reflect individual and Group performance measurement. The link between pay and performance is required under AIB’s remuneration policy. Total variable remuneration and individual incentive awards can be considerably reduced at the discretion of the Remuneration Committee. This discretion may be exercised by the Committee as necessary and will be applied particularly where:
- poor or negative financial performance occurs; - it is considered that a payout would adversely affect the maintenance of a sound capital base; - the payment of variable remuneration would prevent or delay a decrease in AIB’s dependence on
Government support.

66
Glossary of definitions and explanations
A
AIB Group (UK) p.l.c. is a wholly owned subsidiary which trades in Northern Ireland as First Trust Bank and in Britain as Allied Irish Bank (GB).
B
Banking book (also non-trading book) – The Group’s banking book consists of its retail and corporate deposit books, the treasury function’s cash books and the Group’s investment portfolios and derivatives hedging interest rate risk within these portfolios.
Basel II - A set of banking regulations issued in 2004 by the Basel Committee on Bank Supervision, which regulates finance and banking internationally. It was implemented in to EU law by Directive 2006/48/EC and Directive 2006/49/EC. Basel II attempts to integrate Basel capital standards with national regulations, by setting the minimum capital requirements of financial institutions with the goal of ensuring institution liquidity.
C
Carrying value – an accounting measure of value, where the value of an asset or a company is based on the figures in the company's statement of financial position (balance sheet). This is the amount at which an asset is recognised in the balance sheet after deducting accumulated depreciation and accumulated impairment. This is different from market value, as it can be higher or lower depending on the circumstances, the asset in question and the accounting practices that affect those assets.
Capital requirements directive (“CRD”) – A capital adequacy legislative package issued by the European Commission and adopted by member states. The first CRD legislative package gave effect to the Basel II proposals in the EU. CRD II which came into force on 31 December 2010 subsequently updated the requirements for capital instruments, large exposure, liquidity risk and securitisation. A further CRD III amendment updated market risk capital and additional securitisation requirements and came in to force on 31 December 2011.
Capital requirements directive IV (“CRD IV”) – CRD IV, which has not got legal effect, comprises a recast Capital Requirements Directive and a new Capital Requirements Regulation which implements the Basel III capital proposals together with transitional arrangements for some of its requirements.
Central Bank of Ireland - the Central Bank of Ireland is responsible for both central banking and financial regulation and was created under the Central Bank Reform Act 2010. The Central Bank has a legal mandate, in both domestic legislation and under the Maastricht treaty, to contribute to financial stability both in Ireland and across the euro area. A key focus is the resolution of the financial crisis. This includes monitoring overall liquidity for the banking system.
Collective Investment Undertakings (“CIU”) – is an exposure class and includes: i. undertakings where the sole object is the collective investment in transferable securities of capital
raised from the public and which operate on the principle of risk-spreading; and ii. units which are, at the request of the holders, repurchased or redeemed, directly or indirectly, out
of those undertakings’ assets. Common equity tier 1 capital (“CET 1”) – the highest quality form of regulatory capital under Basel III that comprises common shares issued and related share premium, retained earnings and other reserves excluding the cash flow hedging reserve, less specified regulatory adjustments.
Conversion factor – is the ratio of the currently undrawn amount of a commitment that will be drawn and outstanding at default to the currently undrawn amount of the commitment. The extent of the commitment is determined by the advised limit, unless the unadvised limit is higher.
Core tier 1 capital – the highest quality form of regulatory capital under Basel II that comprises total shareholders’ equity and related non-controlling interests, less goodwill and intangible assets and certain other regulatory adjustments.
Core tier 1 ratio – Core tier 1 capital as a percentage of risk weighted assets.
Counterparty credit exposure (“CCE”) – is a measure of the amount that would be lost in the event that a counterparty to a financial contract defaults prior to its maturity. If, at that time the Group would incur a loss to replace the contract, this gives rise to a claim on the counterparty. CCE consists partly of the contract’s current replacement cost (or mark-to-market) and partly of potential future exposure. The potential future exposure component is an estimation which reflects possible changes in market values during the remaining life of the

67
individual contract. The CCE for an individual counterparty will take into account the existence of valid bilateral netting or collateral agreements, where these are in place.
Credit conversion factor (“CCF”) – converts off balance sheet items and items which are committed but undrawn into on balance sheet credit exposure equivalents.
Credit default swap (“CDS”) – is an agreement between two parties whereby one party pays the other a fixed coupon over a specified term. The other party makes no payment unless a specified credit event such as a default occurs, at which time a payment is made and the swap terminates. Credit default swaps are typically used by the purchaser to provide credit protection in the event of default by a counterparty.
Credit derivatives – are financial instruments where credit risk connected with loans, bonds or other risk-weighted assets or market risk positions is transferred to counterparties providing credit protection. The credit risk might be the exposure inherent in a financial asset such as a loan or might be generic credit risk such as the bankruptcy risk of an entity.
Credit risk mitigation (“CRM”) – is a technique used by a credit institution to reduce the credit risk associated with an exposure or exposures which the credit institution continues to hold.
Credit support annex (“CSA”) – provides credit protection by setting out the rules governing the mutual posting of collateral. CSAs are used in documenting collateral arrangements between two parties that trade over-the-counter derivative securities. The trade is documented under a standard contract called a master agreement, developed by the International Swaps and Derivatives Association (“ISDA”). The two parties must sign the ISDA master agreement and execute a credit support annex before they trade derivatives with each other.
D
Default – when a customer breaches a term and/or condition of a loan agreement, a loan is deemed to be in default for case management purposes. Depending on the materiality of the default, if left unmanaged it can lead to loan impairment. Default is also used in a Basel II context when a loan is either 91+ days past due or impaired, and may require additional capital to be set aside.
E
Eligible financial collateral – is any of the following1
(a) cash on deposit with, or cash assimilated instruments held by, the lending credit institution; (b) debt securities issued by central governments or central banks, which securities have a credit
assessment by an External Credit Assessment Institution (“ECAI”) or export credit agency recognised as eligible for the purposes of Articles 78 to 83 which has been determined by the competent authority to be associated with credit quality step 4 or above under the rules for the risk weighting of exposures to central governments and central banks under Articles 78 to 83;
(c) debt securities issued by institutions, where the securities have a credit assessment by an eligible ECAI which has been determined by the competent authority to be associated with credit quality step 3 or above under the rules for the risk weighting of exposures to credit institutions under Articles 78 to 83;
(d) debt securities issued by other entities, where the securities have a credit assessment by an eligible ECAI which has been determined by the competent authority to be associated with credit quality step 3 or above under the rules for the risk weighting of exposures to corporates under Articles 78 to 83;
(e) debt securities with a short-term credit assessment by an eligible ECAI which has been determined by the competent authority to be associated with credit quality step 3 or above under the rules for the risk weighting of short term exposures under Articles 78 to 83;
(f) equities or convertible bonds that are included in a main index; and (g) gold
Expected loss (“EL”) – is the ratio of the amount expected to be lost on an exposure from a potential default of a counterparty or dilution over a one year period to the amount outstanding at default.
Exposure at default (“EAD”) – represents the institution’s best estimate of its expected exposure, after credit risk mitigation, for each facility upon a borrower’s default, giving full recognition to drawn and undrawn credit lines and regardless of whether such undrawn lines are committed or advised lines.
Exposure value – for on balance sheet exposures, is the amount outstanding less provisions and collateral held taking into account relevant netting agreements. No account is taken of the residual maturity or ratings from external credit rating agencies. For commitments and guarantees, it is the amount outstanding less provisions and collateral held taking into account relevant netting agreements and credit conversion factors.
1 Annex VIII, 1.3.1 of Directive 2006/48/EC

68
External Credit Assessment Institution (“ECAI”) – is a body which rates securities or debt offered by way of a public issue. The national supervisors are responsible for determining whether an ECAI meets the eligibility criteria listed in paragraph 91 of the paper “International Convergence of Capital Measurement and Capital Standards” issued by the Basel Committee in November 2005 (Basel II), so that banks incorporated in their jurisdictions can use the ECAIs risk assessments for the calculation of capital requirement under Basel II.
F
Fair value – according to the International Financial Reporting Standards (“IFRS”), fair value is the amount for which an asset could be exchanged, a liability settled, or an equity instrument granted could be exchanged, between knowledgeable, willing parties in an arms’ length transaction.
Forbearance – Forbearance is a term that is used when repayment terms of a loan contract have been renegotiated in order to make repayment terms more manageable for borrowers. Forbearance techniques have the common characteristic of rescheduling principal or interest repayments, rather then reducing them. Standard forbearance techniques employed by the Group include: - interest only; a reduction in the payment amount; a temporary deferral of payment (a moratorium); extending the term of the mortgage; and capitalising arrears amounts and related interest.
G
Gross exposure – gross exposure is the exposure at default before Credit Risk Mitigation (“CRM”), Credit Conversion Factors (“CCF”) and other offsets. See Credit Risk Mitigation and Credit Conversion Factor defined above.
I
International Swaps and Derivatives Association (“ISDA”) – represents participants in the privately negotiated derivatives industry. It is the largest global financial trade association, by number of member firms.
Items belonging to regulatory high risk categories (Annex VI Standardised Approach: Directive 2006/48/EC): - Paragraph 66. Subject to the discretion of competent authorities, exposures associated with particularly
high risks such as investments in venture capital firms and private equity investments are assigned a risk weight of 150%.
- Paragraph 67. Non past due items may be assigned a 150% risk weight according to the provisions of this Part and for which value adjustments have been established may be assigned a risk weight of: (a) 100%, if value adjustments are no less than 20% of the exposure value gross of value adjustments; and (b) 50%, if value adjustments are no less than 50% of the exposure value gross of value adjustments.
L
Loss given default (“LGD”) – is the ratio of the loss on an exposure due to the default of a counterparty to the amount outstanding at default.
M
Market value – the market value is the prevailing price at which goods and/or services may be bought or sold in the open market.
N
NAMA – The National Asset Management Agency was established in December 2009 as one of a number of initiatives taken by the Irish Government to address the serious problems which arose in Ireland’s banking sector as the result of excessive property lending.
NPRFC – The National Pensions Reserve Fund was established in April 2001 to meet as much as possible of the costs of Ireland's social welfare and public service pensions from 2025 onwards, when these costs are projected to increase dramatically due to the ageing of the population. The Fund is controlled and managed by the National Pensions Reserve Fund Commission. The Commission's functions include the determination and implementation of the Fund's investment strategy in accordance with its statutory investment policy.
NTMA – The National Treasury Management Agency is a State body which operates with a commercial remit outside public service structures to provide asset and liability management services to the Irish Government.

69
O
Operational risk – is the risk of loss resulting from inadequate or failed internal processes, people and systems or from external events, and includes legal risk.
Originator – is either of the following: (a) an entity which, either itself or through related entities, directly or indirectly, is involved in the original
agreement which created the obligations or potential obligations of the debtor or potential debtor giving rise to the exposure being securitised;
(b) an entity which purchases a third party's exposures onto its balance sheet and then securitises them.
Other items – refers to other assets including land and buildings, plant and machinery, other fixtures and fittings, tools and equipment, payments on account and tangible assets in the course of construction.
P
Past due items – the Basel asset class “Past due items” relates only to standardised exposures and comprises exposures that are greater than 90 days past due or defaulted, and those impaired.
Pillar 1 – minimum capital requirements – the part of the Basel Accord setting out the calculation of regulatory capital for credit, market and operational risk.
Pillar 2 – the supervisory review process – the part of the Basel Accord which sets out the process by which a bank should review its overall capital adequacy and the processes under which the supervisors evaluate how well the financial institutions are assessing their risks and take appropriate actions in response to the assessments.
Pillar 3 – market discipline – the part of the Basel Accord which sets out the disclosure requirements for banks to publish certain details of their risks, capital and risk management, with the aim of strengthening market discipline.
Position risk requirement (PRR) – a capital requirement applied to a position treated under * BIPRU 7 (Market risk) as part of the calculation of the market risk capital requirement. * BIPRU is the Prudential Regulatory Authority (“PRA”) in the UK prudential sourcebook for banks, building societies and investments.
Probability of default (“PD”) – is the probability of default of a counterparty over a one year period.
R
Regulatory capital – the capital which AIB holds, determined in accordance with rules established by the Central Bank of Ireland for the consolidated Group and by local regulators for individual Group companies.
Residential mortgage backed securities (“RMBS”) – are debt obligations that represent claims to the cash flows from pools of mortgage loans, most commonly on residential property.
Revolving exposure – an exposure whereby customers' outstanding balances are permitted to fluctuate based on their decisions to borrow and repay, up to an agreed limit.
Risk weighted assets (“RWA”) – A measure of assets (including off-balance sheet items converted into asset equivalents e.g. credit lines) which are weighted in accordance with prescribed rules and formulae as defined in the Basel Accord to reflect the risks inherent in those assets.
S
Securitisation - a transaction or scheme, whereby the credit risk associated with an exposure or pool of exposures is tranched, and where payments to investors in the transaction or scheme are dependent upon the performance of the exposure or pool of exposures. The subordination of tranches determines the distribution of losses during the ongoing life of the transaction or scheme.
Securitisation position – an exposure to a securitisation.
Special Purpose Entity (”SPE”) – a SPE is a legal entity which can be a limited company of a limited partnership created to fulfil narrow or specific objectives. A company will transfer assets to the SPE for management or use by the SPE to finance a large project thereby achieving a narrow set of goals without putting the entire firm at risk.
Sovereign exposures – exposures to governments, ministries, departments of governments, embassies, consulates and exposures on account of cash balances and deposits with central banks.
Sponsor – a credit institution other than an originator credit institution that establishes and manages an asset backed commercial paper programme or other securitisation scheme that purchases exposures from third party entities.

70
Synthetic securitisation – a securitisation where the transfer of risk is achieved by the use of credit derivatives or guarantees and the pool of exposures is not removed from the balance sheet of the originator credit institution.
T
Total exposure – see exposure value. Trading book – The interest rate trading book includes all securities and interest rate derivatives that are held for trading purposes in the treasury function. These are revalued daily at market prices (marked to market) and any changes in value are immediately recognised in income.
Traditional securitisation – a securitisation involving the economic transfer of the exposures being securitised to a securitisation special purpose entity which issues securities. This is accomplished by the transfer of ownership of the securitised exposures from the originator credit institution or through sub-participation. The securities issued do not represent payment obligations of the originator credit institution.