![[2013 PHILIPPINE DISASTER REPORT] - cdrc-phil.com · The 2013 Philippine Disaster Report concisely presents information on disasters that ... Frequency of Disaster Occurrence in the](https://static.fdocuments.in/doc/165x107/5b8dbb0709d3f223638c7cbd/2013-philippine-disaster-report-cdrc-phil-the-2013-philippine-disaster.jpg)
2012 Philippine disaster report - Citizens Disaster Response Center
13
2012 Citizens’ Disaster Response Center (CDRC) Research and Public Information Department [2012 PHILIPPINE DISASTER REPORT] A consolidated report on the different disasters that occurred in the Philippines in 2012, the frequency of occurrence, as well as the effects of these disasters on communities.
Transcript of 2012 Philippine disaster report - Citizens Disaster Response Center
2012
Citizens’ Disaster Response Center (CDRC) Research and Public Information Department
[2012 PHILIPPINE DISASTER REPORT] A consolidated report on the different disasters that occurred in the Philippines in 2012, the frequency of occurrence, as well as the effects of these disasters on communities.

2012 Philippine Disaster Report
Introduction
The 2012 Philippine Disaster Report concisely presents information on disasters that occurred in the
Philippines in 2012. Through graphs, tables and charts, it provides an overview of the type of disasters
that occurred, the frequency of occurrence, as well as the effects of these disasters on communities.
Where available, direct economic costs to agriculture and infrastructure are reported. A review of the
major disasters that occurred in the Philippine islands within the past decade is also presented.
A substantial portion of the data in this report were gathered through CDRC's disaster monitoring
system, which relies on reports from Citizens' Disaster Response Network (CDRN), a network of 16
regional centers all over the country. Overview and supporting data were taken from the Department of
Social Welfare and Development-Disaster Operations Monitoring and Information Center (DSWD-
DROMIC), the National Disaster Risk Reduction and Management Council (NDRRMC), and articles in
major newspapers. CDRC verified the data in this report through various sources to ensure accuracy. The
triangulation method of comparing and contrasting credible sources of data was used.

1. How did the Philippines fare in 2012?
In 2012, a total of 471 natural and human-induced disasters were reported in the Philippines. These
killed 1,615 people, and affected more than 2.8 million families or 12 million people, and caused over
Php 39.9 billion in economic damages.
Compared to the 2011 data, 2012 posed a 9% increase in the number of disaster events recorded. (see
Figure 1)
Figure 1: Frequency of Disaster Occurrence in the Philippines, 2011 and 2012 (natural and human-
induced disasters)
Source: CDRC Database 2012
However, when it comes to the number of affected population, the 2012 figure shows that the human
impact data is much lower compared to 2011 (see Figure 2).
Figure 2: Disaster Affected Population in the Philippines, 2011 and 2012
Source: CDRC Database 2012

2. How did the Philippines fare compared to other countries?
In the world disasters data, the Philippines topped the list of countries with the most number of people
killed by natural disasters in 2012. According to the EM-DAT: The OFDA/CRED International Disaster
Database, 2,360 people died in the Philippines due to natural disasters. CRED attributed this to Typhoon
Pablo (Bopha), which according to their own monitoring, resulted to 1,901 deaths.
Figure 3: No. of people killed worldwide by natural disasters in 2012
Source: EM-DAT: The OFDA/CRED- International Disaster Database
The Philippines also placed second in the world data in terms of the number of people affected by
natural disasters -- with 12.5 million people affected, according to CRED (see Figure 4).
Figure 4: No. of people affected worldwide by natural disasters in 2012 (in million)
Source: EM-DAT: The OFDA/CRED- International Disaster Database

3. What were the top 5 disasters in 2012?
In terms of frequency, flood topped the list with 143 reported incidents, or 30% of the total number of
disaster events monitored in 2012. This was followed by fire with 115 incidents -- majority of which
occurred in urban centers, particularly in congested urban poor communities. Meanwhile, landslide
occurred 106 times, while storm surge 29 times, and armed conflict 24 (see Figure 5).
The high number of flooding incidents can be attributed to the Southwest Monsoon which inundated
much of Luzon in August of 2012.
Figure 5: Top 5 Disasters in the Philippines in Terms of Frequency, 2012
Source: CDRC Database 2012
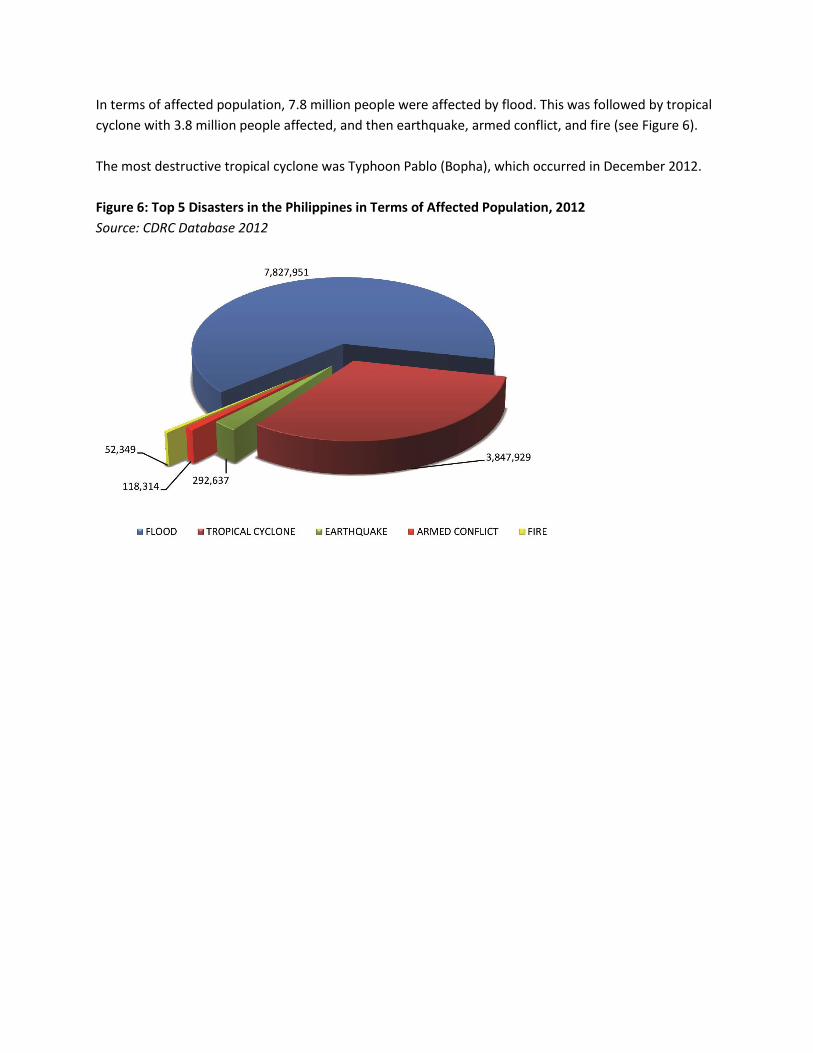
In terms of affected population, 7.8 million people were affected by flood. This was followed by tropical
cyclone with 3.8 million people affected, and then earthquake, armed conflict, and fire (see Figure 6).
The most destructive tropical cyclone was Typhoon Pablo (Bopha), which occurred in December 2012.
Figure 6: Top 5 Disasters in the Philippines in Terms of Affected Population, 2012
Source: CDRC Database 2012
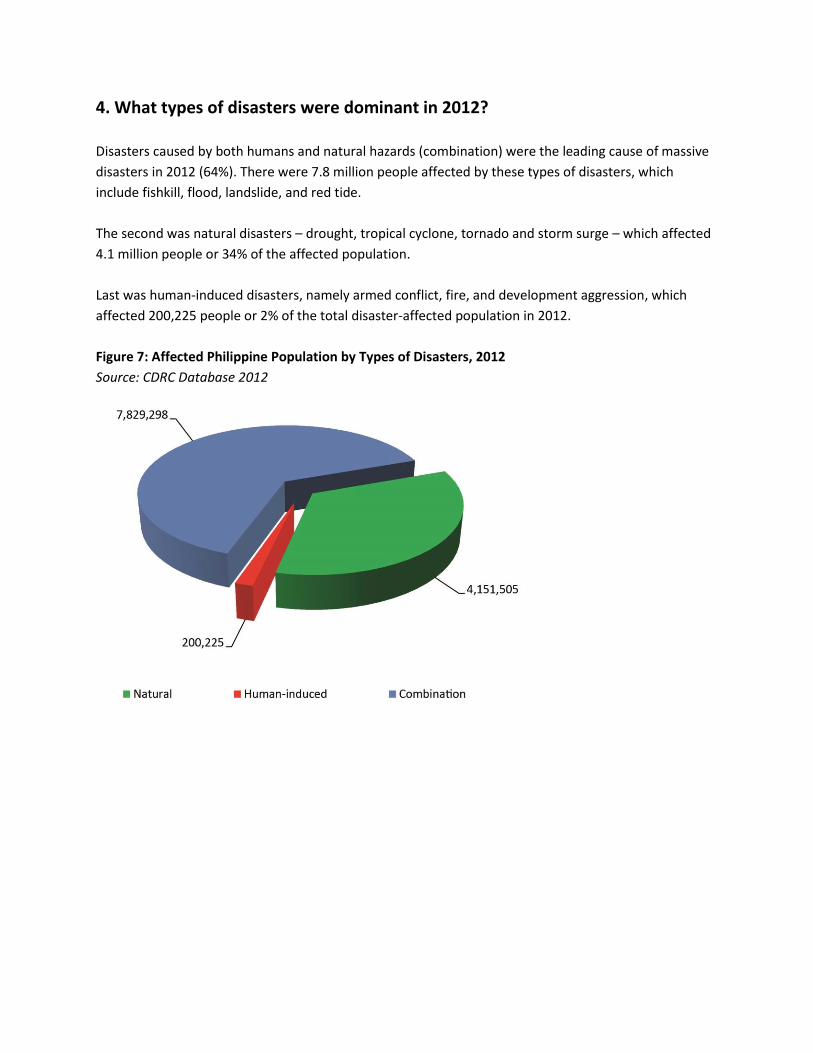
4. What types of disasters were dominant in 2012?
Disasters caused by both humans and natural hazards (combination) were the leading cause of massive
disasters in 2012 (64%). There were 7.8 million people affected by these types of disasters, which
include fishkill, flood, landslide, and red tide.
The second was natural disasters – drought, tropical cyclone, tornado and storm surge – which affected
4.1 million people or 34% of the affected population.
Last was human-induced disasters, namely armed conflict, fire, and development aggression, which
affected 200,225 people or 2% of the total disaster-affected population in 2012.
Figure 7: Affected Philippine Population by Types of Disasters, 2012
Source: CDRC Database 2012
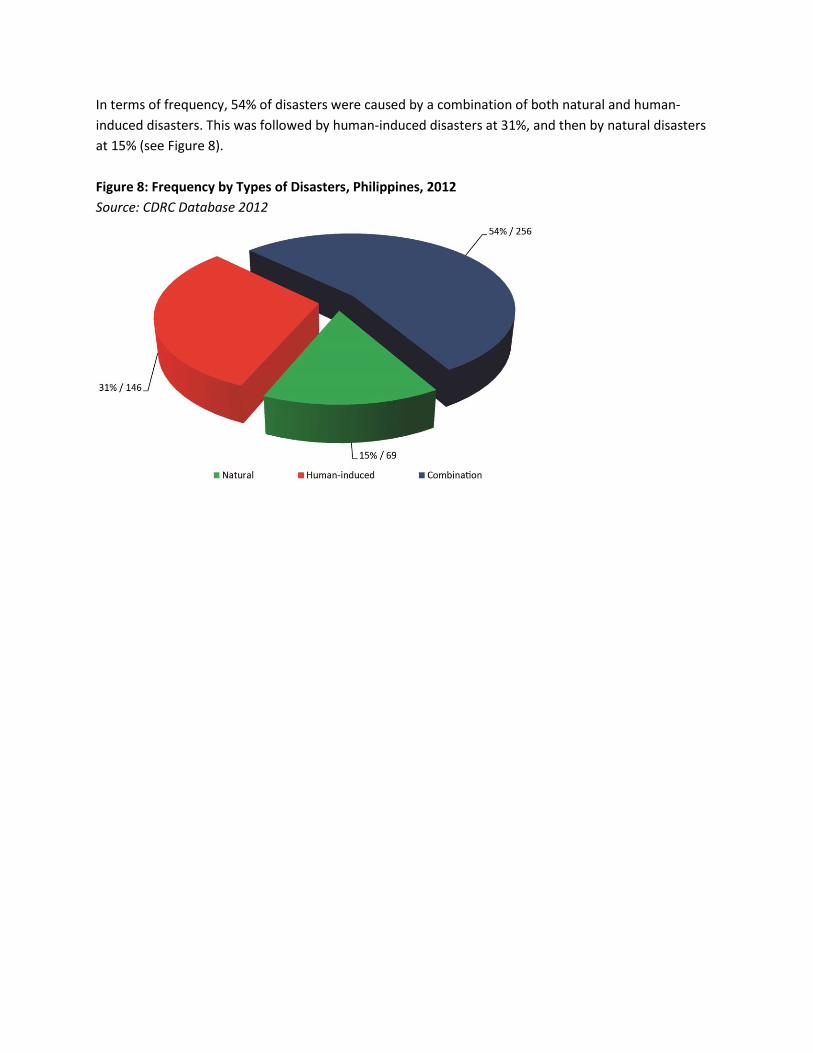
In terms of frequency, 54% of disasters were caused by a combination of both natural and human-
induced disasters. This was followed by human-induced disasters at 31%, and then by natural disasters
at 15% (see Figure 8).
Figure 8: Frequency by Types of Disasters, Philippines, 2012
Source: CDRC Database 2012

5. What disasters had the highest mortality rate?
The major cause of mortality rate last year was tropical cyclone, followed by flood, fire, landslide, and
armed conflict. Tropical cyclone killed 1,205 people in 2012 (see Figure 9). Of this number, 1,067 deaths
were due to the effects of Typhoon Pablo (NDRRMC data). This was followed by flood (163 deaths), fire
(95 deaths), landslide (80 deaths), and armed conflict (46 deaths).
Figure 9: Top 5 Disasters in the Philippines in Terms of Casualties, 2012
Source: CDRC Database 2012
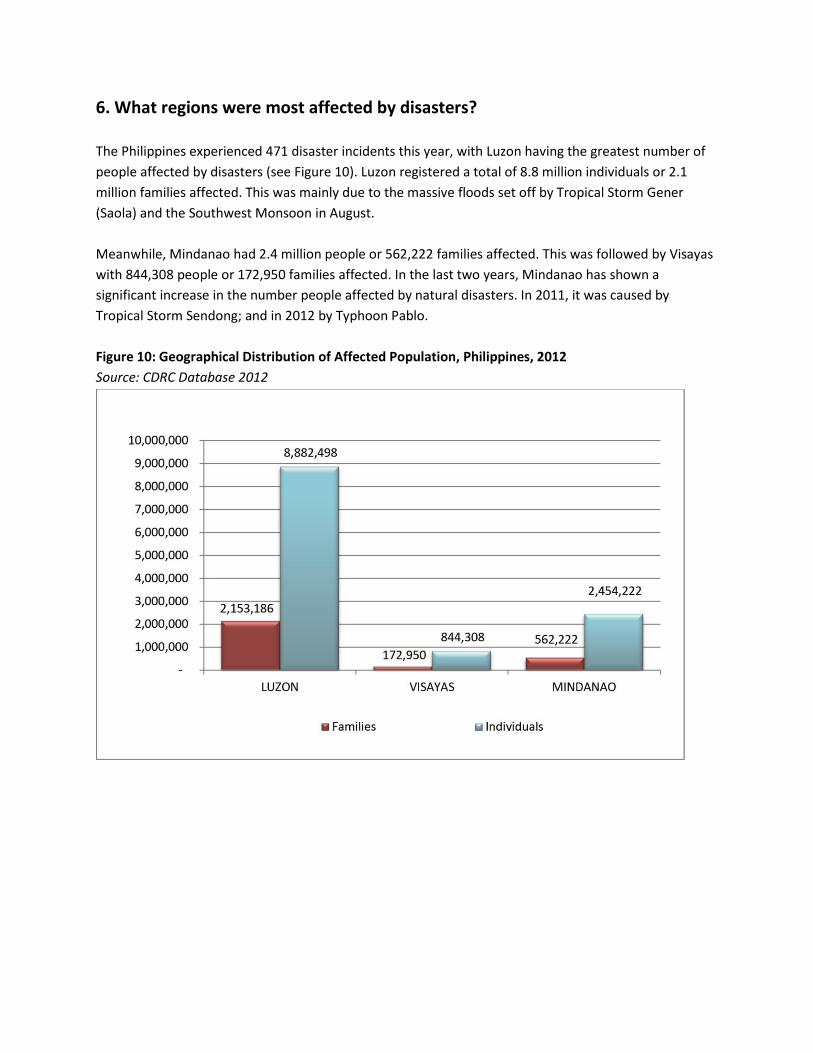
6. What regions were most affected by disasters?
The Philippines experienced 471 disaster incidents this year, with Luzon having the greatest number of
people affected by disasters (see Figure 10). Luzon registered a total of 8.8 million individuals or 2.1
million families affected. This was mainly due to the massive floods set off by Tropical Storm Gener
(Saola) and the Southwest Monsoon in August.
Meanwhile, Mindanao had 2.4 million people or 562,222 families affected. This was followed by Visayas
with 844,308 people or 172,950 families affected. In the last two years, Mindanao has shown a
significant increase in the number people affected by natural disasters. In 2011, it was caused by
Tropical Storm Sendong; and in 2012 by Typhoon Pablo.
Figure 10: Geographical Distribution of Affected Population, Philippines, 2012
Source: CDRC Database 2012

7. What were the trends in the last 10 years?
In 2005, disaster frequency has shown a downward trend. But in the last two years, it started to register
a sharp increase (see Figure 11). In fact, based on the 10-year data collated by CDRC, 2012 showed an
all-time high with 471 disasters recorded.
Figure 11: Frequency of Disasters, Philippines, 2003-2012 (10-year period)
Source: CDRC Database 2012

An increasing trend in the number of affected people can also be seen in the last five years. Tropical
cyclones usually contribute to the spikes in the number of affected people – for instance in 2009 for
Tropical Storm Ondoy (Ketsana) and in 2011 for Tropical Storm Sendong (Washi).
Figure 12: Number of Affected Persons, Philippines, 2003-2012 (10-year period)
Source: CDRC Database 2012

References:
1. Alliance for the Advancement of People’s Rights, Monitoring Report on Displaced Population
Due to Armed Conflict, 2012
2. Centre for Research on the Epidemiology of Disasters (CRED), Université catholique de Louvain
Brussels – Belgium, EM-DAT: The OFDA/CRED- International Disaster Database,
http://www.emdat.be
3. Centre for Research on the Epidemiology of Disasters (CRED), CRED CRUNCH, Issue No. 31,
March 2013
4. Citizens' Disaster Response Center, Inc., Databank, 2012
5. Citizens' Disaster Response Center, Inc., Disaster Alerts, 2012, http://www.cdrc-phil.com/
6. Citizens' Disaster Response Center, Inc., Annual Report, 2012
7. Citizens' Disaster Response Network (CDRN), Incident Reports, 2012
8. Department of Social Welfare and Development, Disaster Response Operations Monitoring and
Information Center (DSWD-DROMIC), Disaster Reports, 2012, http://disaster.dswd.gov.ph/
9. Kalipunan ng Damayang Mahihirap, Monitoring Report of Demolition Incidents in Urban Poor
Communities, 2012
10. National Disaster Risk Reduction and Management Council, Incidents Monitored from January 1
- December 31, 2012, http://www.ndrrmc.gov.ph/
11. News reports from major dailies: The Philippine Star, Philippine Daily Inquirer and Manila
Bulletin, 2012
12. Philippine Atmospheric, Geophysical and Astronomical Services Administration (PAGASA),
http://www.pagasa.dost.gov.ph/
13. Philippine Institute of Volcanology and Seismology (PHIVOLCS),
http://www.phivolcs.dost.gov.ph/