2012 Moving toward comparability: Assessing per student ... · 2 INTRODUCTION Educational...
33
Calhoun: The NPS Institutional Archive Faculty and Researcher Publications Faculty and Researcher Publications 2012 Moving toward comparability: Assessing per student costs in K-12 Eger, Robert J. http://hdl.handle.net/10945/41258
Transcript of 2012 Moving toward comparability: Assessing per student ... · 2 INTRODUCTION Educational...

Calhoun: The NPS Institutional Archive
Faculty and Researcher Publications Faculty and Researcher Publications
2012
Moving toward comparability:
Assessing per student costs in K-12
Eger, Robert J.
http://hdl.handle.net/10945/41258

1
MOVING TOWARD COMPARABILITY: ASSESSING PER STUDENT COSTS IN K-12
Forthcoming
Journal of Public Budgeting, Accounting and Financial Management
Robert J. Eger III, is an Associate Professor, Graduate School of Business and Public Policy, Naval Postgraduate School. His teaching and research interests are in government and nonprofit accounting, financial management, and public policy.
Bruce D. McDonald III, is an Assistant Professor, Department of Political Science, Indiana University-South Bend. His teaching and research interests are in defense administration, US economic policy, and policy modeling.
ABSTRACT
The current classifications for public school costs are provided by the National Center for Educational Statistics. To improve comparability between school districts, we provide an alternative classification with fewer numbers of expenditure categories, distinctions between school-based and non-school based administration costs, and school levels. The new classification is then applied to five comparable urban school districts. We find (1) that teacher salaries per student are affected by school level disaggregation; (2) that separating administrative costs into school and non-school based provides for an observable cost relationship; and (3) that curriculum and instructional support per student differ by school level disaggregation. The alternative classification may assist auditors and investigators whose role is to assess the costs performance of urban school districts by providing comparable school level and cost type.

2
INTRODUCTION
Educational expenditures are an increasingly compelling presence in government finance. During the 2005-06 school year, total public expenditures for elementary and secondary schools in the United States reached $526.6 billion. Of these expenditures, about 86% ($451 billion) were current expenditures1 (National Center for Education Studies [NCES], 2009). On a per student basis, annual education expenditures were $9,769, or about 38% higher than the Organisation for Economic Co-Operation & Development (OECD) average of $7,065 (NCES, 2009). Although dramatic increases in the cost of education have been cited as a recent occurrence (U.S. Bureau of the Census [Census], 2008), Hoxby (2004) traces the rise in costs from $4,800 in 1970 to $9,230 in 2000, after adjusting for inflation. The cost of financing public education is high, but the real issue is that the costs have risen for each of the last three decades.
Although discussion on education expenditures is typically reserved for federal and state levels, 44% ($231.2 billion) of the education expenses in the 2005-06 school year were incurred by local governments (Census, 2008). The overwhelming cost of public school financing poses a significant burden on local governments, whose expenditures on elementary-secondary education has increased over the last decade despite increased competition for other spending priorities. In school year 1992-93, about 34.5% of local government expenditures were on K-12 education, increasing to 35.6% in 2005-06 (Census, 2007). In addition to the cost factors, there are complicating policy factors, such as No Child Left Behind, that compel state and local governments to find a way of balancing tighter budgets. The current financial crisis faced by many state and local governments has forced cuts in public school expenditures, a problem further complicated as “[s]tate legislatures have focused on public education efficiency as a result of the increased mandated funding for other needs, specially Medicaid and prisons" (Clancy & Patton, 1996, p.272).
From these policy issues in public school financing, studies of public school efficiency and performance have emerged (Dodson & Garrett, 2004; Greene & Kang, 2004; Hanushek, 1997; William, 1996, 1998). It is our understanding that the main limitation of these studies is in their policy implications, including school consolidation (Chakraborty, Biswas, & Lewis, 2000; Dodson & Garrett, 2004), private and charter school competition (Dee, 1998; Greene & Kang, 2004), and adjustment in input factors (Anderson, Shughart, & Tollison, 1991). The critical assumptions of these studies are: (1) the relationship between input

3
factors such as instruction, supply, and administration and outputs/performance is essentially the same between the elementary and secondary schools; (2) school-based and non-school based administrative factors have the same impact on the outputs; and, (3) cost accounting methods across school districts in different states are comparable. If the first two assumptions are not correct, the results in the prior studies may mislead the reform efforts in public school administration in the sense that different policy alternatives are needed for different dimensions of the issue. The third assumption poses a limitation of external validity of those studies since the institutional and organizational characteristics of the school districts might be different. In such a case, any finding from one school district cannot be applied to districts in any other state. This presents a severe limitation when providing baseline performance criteria.
This study aims to suggest an alternative costs classification, taking into account the assumptions of prior studies. We introduce distinctions between school-based and non-school based administration costs and between elementary and secondary schools to provide an identification of possible sources of inefficiency. After developing a classification system with few categories and sub-categories, we apply it to five school districts with similar characteristics (Atlanta, Boston, Mobile, Newark, and Nashville) to demonstrate comparability in use. To accomplish these tasks, the remainder of this paper is organized as follows. The next section integrates the current literature of public school efficiency and performance. Sections III and IV provide an alternative classification system of costs classification and its application to the five school districts for the period of 2003-2005, respectively. Finally, Section V concludes and points out the study limitations. Suggestions of further research are also provided.
SCHOOL EFFICIENCY, PERFORMANCE, AND COST ACCOUNTING
The studies estimating the cost of financing public school systems is largely precipitated by the introduction of, or attempts to introduce, major school finance reforms. For instance, in 1992, Kansas transferred major public school decisions (e.g. taxation and spending decisions) to the state (Johnston & Duncombe, 1998). In 1995, the Ohio Supreme Court ruled that the system of financing public education in Ohio was unconstitutional on the ground that it had not lived up to the promise of providing “adequate” public education (Ruggiero, 2001). The Court-dictated overhaul of Ohio’s public school system effectively mandated the determination of the base costs of providing adequate
4
public education throughout the state. Five years prior to the Ohio case, the New Jersey Supreme Court declared the state’s school financing system unconstitutional. The state government responded by passing the Quality Education Act, which increased state aid by almost 25 percent and phased-out general aid to wealthy school districts (Firestone & Goertz, 1996). It is reasonable to assume that most subsequent policy decisions of state governments to implement school finance reforms have been informed by cost and efficiency studies on their respective public school systems.
There are three major approaches in measuring cost or efficiency of providing public education. The most common approach is ratio analysis which examines the relationship of single inputs and single outputs. The primary weakness of this method is its lack of comparability. For instance, annual per-student expenditure (which is a common ratio indicator) is difficult to compare across school districts, especially ones that belong to different states because school districts vary in the socio-economic context. School districts with a higher percentage of students in need will require more resources (Ruggiero, 2001). The use of average costs has also been criticized. Cost averaging can hide real spending differences among schools and transfers money away from schools in poverty neighborhoods and towards those in more affluent parts of the district (Hill, 2006).
The second approach is regression analysis, which tries to explicitly estimate the relationship between inputs and outputs, and define the residuals corresponding to each observation as the inefficiency value of the decision-making units (e.g. district or school-level) (Mancebon & Bandres, 1999). The advantage of regression analysis over ratio analysis is that it can control for other variables (e.g. socio-economic variables) that influence the public school expenditures at the school or district level. Using regression analysis and its derivatives, several studies have applied the stochastic approach in estimating efficiency in the public school system. For instance, using a stochastic frontier approach (SFA), Dodson and Garrett (2004) found evidence for economies of scale in teacher salary expenses, supply costs, and total costs across Arkansas school districts. Also employing SFA, Dopuch and Gupta (1997) estimated that the Missouri school districts may have had as much as $394 million of excess expenditures in their operations for the year 1990-91.
The third technique, data envelopment analysis (DEA), is non-parametric, which derives efficiency scores of a school or school district by solving a mathematical programming model in which a benchmarked

5
school is used as the comparative. The difference between regression models and the mathematical programming models like DEA is that the former specify an appropriate functional form that links the input and outputs of the education production process while the latter assumes that the education production frontier has a partially implicit character (Mancebon & Bandres, 1999). The DEA method earns more popularity in efficiency studies of the education sector because of the difficulty of specifying functional forms (Rubin, 2004). Using DEA, Ruggiero (2001) estimated that Ohio public schools were only 84 percent efficient, indicating over-spending in excess of $600 per student. Employing the same DEA approach, Banker et al. (2004) also found significant allocative inefficiencies in the Texas public school system using a panel of 555 public schools.
The critical question of the school efficiency studies is whether “school districts become too large and exceed their point of efficiency” (William, 1998, p.514). This is a question of the relationship between resources expended and outputs/performance scores (Coleman et al., 1966), which reflects an interest in the top-down accountability (Hanushek, 1997; Rubin, 2004). To answer the question, a wide range of input factor measures have been used, including per-student instructional expenditures (Dee, 1998; Sebold & Dato, 1981), teacher salaries and experience with various operationalizations such as student demographic and achievement data (Clancy & Patton, 1996; Cybulski et al., 2005; Dodson & Garrett, 2004), operating expenditures (Banker, Janakiraman, & Natarajan, 2004; Chakraborty, Biswas, & Lewis 2000), total expenditures (Dopuch & Gupta, 1997), and quantities of administrators, teachers, professional support staff, and teaching aides (Grosskopf et al., 1999). In his review of 377 educational performance studies, Hanushek (1997) broke down measures of resources devoted to schools into three categories of the real resources of classroom (teacher education, teacher experience, and teacher-pupil ratios), financial aggregates of resources (expenditures per student and teacher salary), and measures of other resources in schools (specific teacher characteristics, administrative inputs, and facilities). Out of the studies, 163 examined the relationship between per-student expenditures and student performance, with 27% finding significantly positive effects of expenditures, and seven percent of the studies reporting significantly negative effects. There is variation in the results depending on levels of aggregation. For example, at the school level, only 17% of the 83 studies found positive significant evidence of expenditures, while at the district level, 28% of 43 studies reported positive significant results. Hanushek’s (1997) review is an indication of the complexity and low consistency of studying, reporting,

6
and communicating the performance and efficiency of public schools and school districts. "The selection of input measures is less consistent with numerous characteristics being studied as determinants of school or student performance" (Rubin, 2004, p.150). Part of the problem is due to “the lack of consensus regarding the education production function and associated difficulties with measurement” (Rubin, 2004, p.161).
Mensah, Schoderbek, and Werner (2009) approach the information needed in cost-effective management by identify factors controllable by school district superintendents to institute reforms to improve their operations and achieve greater cost efficiency and effectiveness. Mensah, Schoderbek, and Werner (2009) use a single state, New Jersey, school data to empirically identify cost-effective tools providing a potential yield of valuable insight into the trade-offs made by the management of public-sector institutions. Their results indicate that for New Jersey, school level variables of elementary, middle, and high schools are statistically significant control factors in their test score equations. They end the study by stating that the results may not be generalizable to other states, the measures they use may be state specific.
While providing valuable knowledge on parts of educational efficiency and performance, these studies are limited in informing institutional and organizational characteristics of public school production such as school-based and non-school based expenditures. Moreover, they are limited in providing information on relative contribution of different functions/objects of expenditures to outputs/outcomes. Such issues as the relative efficiency of school-based administration versus non-school based administration in districts, which is further confounded by varying sizes and/or administrative functions at the elementary versus secondary school level, however are not addressed in the current literature. This lacuna is at odds with the reform efforts where the use of administrative tools, such as cost accounting and performance audits, could provide school officials identifiable and controllable factors to institute reforms that improve operations and achieve greater cost efficiency and effectiveness.
So what drives the confounding prior research results? It is conceivable that the limitation of the previous studies is based on the composition of the available data which conforms to the cost accounting classifications provided by the NCES as observed in Table 1. Although the classification recommended by the NCES is quite comprehensive and well-organized, there are a couple of important limitations in its application to practice and research. First, the classification does not distinguish between levels of schools. The aggregated, district level data
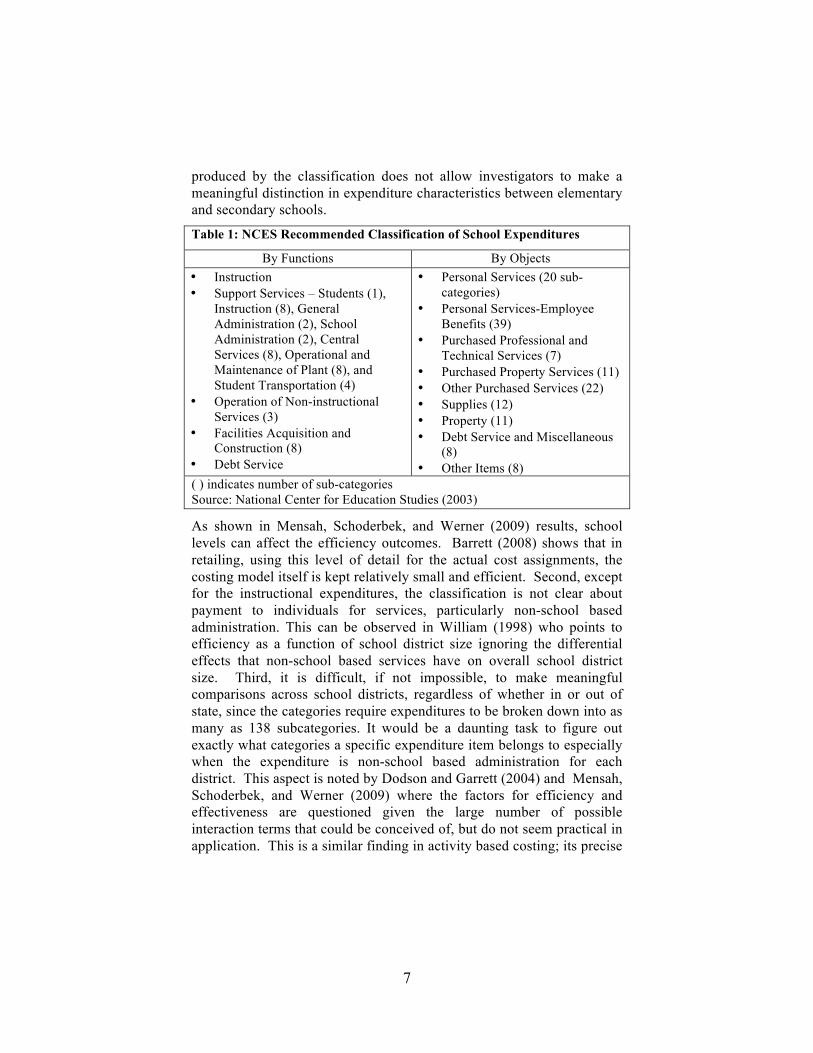
7
produced by the classification does not allow investigators to make a meaningful distinction in expenditure characteristics between elementary and secondary schools.
Table 1: NCES Recommended Classification of School Expenditures
By Functions By Objects • Instruction • Support Services – Students (1),
Instruction (8), General Administration (2), School Administration (2), Central Services (8), Operational and Maintenance of Plant (8), and Student Transportation (4)
• Operation of Non-instructional Services (3)
• Facilities Acquisition and Construction (8)
• Debt Service
• Personal Services (20 sub-categories)
• Personal Services-Employee Benefits (39)
• Purchased Professional and Technical Services (7)
• Purchased Property Services (11) • Other Purchased Services (22) • Supplies (12) • Property (11) • Debt Service and Miscellaneous
(8) • Other Items (8)
( ) indicates number of sub-categories Source: National Center for Education Studies (2003)
As shown in Mensah, Schoderbek, and Werner (2009) results, school levels can affect the efficiency outcomes. Barrett (2008) shows that in retailing, using this level of detail for the actual cost assignments, the costing model itself is kept relatively small and efficient. Second, except for the instructional expenditures, the classification is not clear about payment to individuals for services, particularly non-school based administration. This can be observed in William (1998) who points to efficiency as a function of school district size ignoring the differential effects that non-school based services have on overall school district size. Third, it is difficult, if not impossible, to make meaningful comparisons across school districts, regardless of whether in or out of state, since the categories require expenditures to be broken down into as many as 138 subcategories. It would be a daunting task to figure out exactly what categories a specific expenditure item belongs to especially when the expenditure is non-school based administration for each district. This aspect is noted by Dodson and Garrett (2004) and Mensah, Schoderbek, and Werner (2009) where the factors for efficiency and effectiveness are questioned given the large number of possible interaction terms that could be conceived of, but do not seem practical in application. This is a similar finding in activity based costing; its precise
8
measurement of costs ignores the constraints of resources, an important aspect of school expenditures.
In the following sections, building upon the prior literature and the NCES recommended classification of public school expenditures, a classification system is derived that could lessen the limitations of the NCES classification to assist investigators and researchers. The new classification system is applied to the five comparable public school systems in this study.
A NEW EXPENDITURE CLASSIFICATION
The classification of school system expenditures into categories requires a balance between making distinctions that illuminate spending patterns and provide a basis for comparison with other districts on the one hand, and ensuring that the classification is not at such a micro level of detail that comparison between districts is impractical on the other. Our chosen method of classification is based on the literature that addresses school expenditures and the NCES.
To begin, divide total expenditures by a school district into two types: payments to individuals for services, and other costs. This isolates human capital service provision toward school districts, providing a direct link to measuring efficient and effective management of human capital in an analysis. Payments to individuals for services are categorized by both school-based and non-school based human capital costs:
• Teachers’ salaries;
• Non-school based administrative salaries (includes all administrative staff not located in schools);
• School-based administrative salaries (includes school principals and assistant principals, magnet coordinators and department chairs);
• Benefits;
• Other non-salary compensation (includes stipends and bonuses earned by salaried staff);
• Payments to paraprofessionals (includes all individuals who works under the supervision of a teacher or another professional staff member);

9
• Payments for non-educational support (includes janitors, secretaries, bus drivers, mechanics, and all support staff that do not directly deal with education or instructional support);
• Professional, non-administrative salaries (includes payments to all professionals that have a market outside the school system for their profession); and,
• Payments for curriculum and instructional support (includes librarians, coaches, and any staff involved with the instruction of students but who is not in a typical classroom setting).
Payments for other costs are categorized by purchased goods and services, maintenance and utilities, and travel. This removes the non-human capital costs associated with school districts into a separate category.
Next, divide expenditures between school-based and non-school based expenditures. The metric used is an allocation metric in which each individual payment category is identified as either direct or indirect expenditure to a school or a direct or indirect expenditure that was non-school based. We have not included expenditures on capital or nutrition in the classification, as these are highly variable “lumpy” expenditures that make comparative analysis difficult between districts.
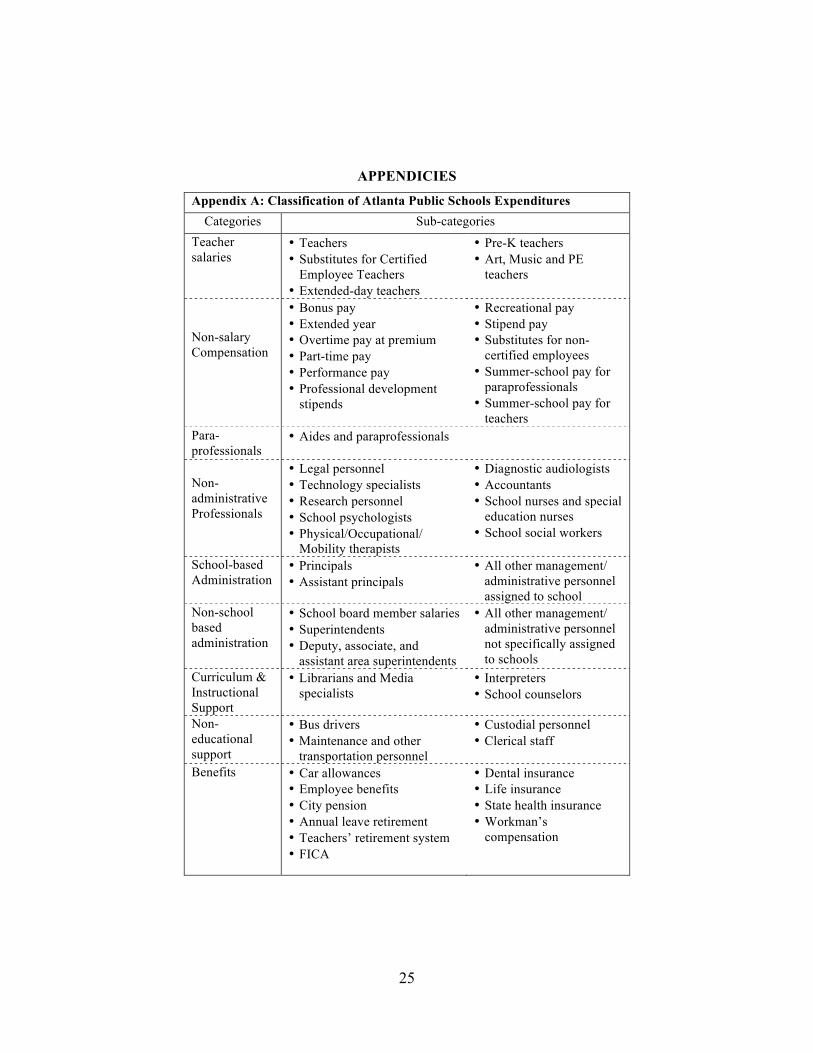
Finally, all expenditures are calculated on a per-student basis to aid with the comparison to other school districts and address economies of scale. Appendix A provides a detailed demonstration of how Atlanta Public Schools expenditures are classified according to this classification.
Expenditures of Atlanta Public Schools
Using the new classification system, Appendix B provides the break-down of Atlanta Public Schools expenditures for fiscal years 2003, 2004, and 2005 respectively, where “fiscal year 2003” corresponds to “school year 2003-04” and so on. Expenditures are broken down into elementary, middle, and high school, as well as non-school (non-school is defined as spending outside of the school). The last column of each table gives an estimate of aggregate expenditures per student, where aggregated expenditures include both school-based and non-school based expenditures. For Atlanta Public Schools the 2003 estimated cost per student is $13,510, for 2004 it is $12,550, and for 2005 it is $11,881.
Before turning to the comparative analysis, we consider some aspects of Atlanta Public Schools’ expenditures that strike us as worthy
10
of further investigation. Overall and consistently over this time period, we find that the major contributors to per-student costs in our analysis are teacher salaries, benefits, and purchased goods which are common fixed costs associated with public school districts.
Overall, per student costs have decreased by 7.1 percent from 2003 to 2004, and by an additional 8.3 percent from 2004 to 2005. This is significant given the decline in the total number of students enrolled in 2005 from 2003. Given the presence of fixed costs of service delivery the prior literature categories would have expected declines in student population to cause per student expenditures to rise, at least in the short-run. Note also that our data have not been adjusted for inflation, another factor that would have led us to expect per student costs to rise.
Our second main finding, now turning to the composition of expenditures, is that school based expenditures are roughly 65 percent of total system expenditures during the years under study: 65.2 percent in 2003, 63.7 percent in 2004, and 66.5 percent in 2005. The figure of 65 percent has been applied as a target in some states where concerns have been raised that too large a proportion of expenditures were non-school based (Eggers et al 2005; Embry 2005). By this measure, Atlanta Public Schools would be said to be meeting the appropriate targets.
The third finding involves the administrative costs per student, which does present some matter of concern. When separating school and non-school based administration we find that the costs of non-school administration have held approximately constant at $420 per student in 2003, $412 in 2004, and $414 in 2005. This constant cost is in contrast to school-based administration which has declined over the period of study from $856 per student in 2003, to $696 in 2004, and finally to $585 in 2005. Combining school-based and non-school based administration, in each of the three years under study, expenditures per student on administration were about $1,000. We cannot say at this point, without comparison to other districts, whether such a level is unreasonable, but at least it suggests there could be some value in investigating why per student administrative costs are so high overall. There could also be value in investigating why non-school based administrative costs have not followed the trend of school-based administrative costs.
Details regarding the size of expenditures for Atlanta Public Schools are provided in Table 2, which lists the ratio of each category’s expenditure as it relates to total expenditures per year. In the study period, the percent of school-based teacher salary has increased by more

11
than 9 percentage points, while the percents of non-salary compensation and non-school based teacher salaries have decreased significantly.
Table 2: Expenditures of Atlanta Public Schools 2003 2004 2005
School Non-
School School Non-
School School Non-
School Teacher salary 27.2% 2.6% 32.9% 2.8% 36.5% 1.2% Non-Salary Compensation 2.4% 1.9% 1.6% 2.0% 1.3% 1.6% Paraprofessionals 2.2% 0.0% 2.4% 0.1% 2.6% 0.2% Non-administrative Professionals 0.6% 0.7% 0.7% 0.9% 0.8% 1.2% School Based Administration 6.4% 0.0% 5.7% 0.0% 5.1% 0.0% Non-School Based Administration 0.0% 3.2% 0.0% 3.4% 0.0% 3.6% Curriculum & Instructional Support 2.0% 0.0% 2.2% 0.0% 2.3% 0.0% Non-education Support 2.2% 3.9% 2.6% 4.1% 2.4% 4.3% Benefits 9.4% 5.1% 9.1% 8.3% 8.8% 5.3% Purchased Goods 9.4% 15.3% 6.6% 8.6% 4.4% 10.8% Maintenance & Utilities 1.7% 1.4% 1.8% 2.5% 1.8% 2.7% Travel 0.2% 0.3% 0.2% 0.2% 0.1% 0.3% Other 0.1% 1.9% 0.0% 1.4% 0.0% 2.5% All data are compiled by the authors’ from the data provided by the school districts.
As described above, the percent of school based administrative expenditures decreased from 6.4 to 5.1 percent of costs. On the other hand, the percent of non-school based administrative costs has increased from 3.2 to 3.6 percent of costs over the 3 year period.
EXPENDITURES AT FIVE COMPARABLE SCHOOL DISTRICTS
The ability to compare school expenditures across districts has been a downfall in the NCES classification of education cost accounting, leading to issues when assessing performance audits. After developing and demonstrating a new classification for Atlanta Public Schools in the previous section, there is some benefit in demonstrating the use of the

12
proposed classification across school districts. To do so, we select a sample of school districts with which to compare Atlanta Public Schools based on the following criteria: district size, student-teacher ratio, percent of students that are economically disadvantaged, and the district’s racial composition following the criteria provided in Murray, Evans and Schwab (1998). Using an equal weight based methodology that gives equal weights to each criterion; we allow all districts to be retained within the possible comparison set. For racial composition we performed two separate calculations. One is based solely on the representation of minority groups within the district while the other includes a score for the representation of African American students specifically. For each of the above criterion, the comparative districts’ values were subtracted from those of Atlanta. Districts were then ranked according to the proximity of the district’s characteristics to those of Atlanta. For each ranking, 1 is equivalent to Atlanta, and all factors are weighted equally. These factors do not include measures of either student performance or per pupil expenditures, which are intentionally excluded. Scores on standardized tests were also omitted. The validity of standardized tests has become a contentious and debatable metric, and previous research indicates no direct relationship between expenditures and student test scores. Of the districts meeting the comparison criteria, only four (Boston, Mobile, Nashville, and Newark) were able to provide the necessary data in the short time-line available for the study.
Some caveats are in order before moving to analyze the expenditures in the school districts. First, for many types of expenditures, it is a judgment call for the accountants as to how to classify the expenditure. School systems are complex organizations and there are bound to be some instances where expenditures might be classified one way but placed under a different classification at a different time. These difficulties arise, for example, in distinguishing between what counts as salary or non-salary compensation, or by whether individuals are professionals, paraprofessionals, or offering support for curriculum and instruction.
Second, for each of the school districts studied there are occasionally variations in the amount spent in certain categories that appear unusually large from year to year. Here are some examples.
• In Atlanta, purchased goods and services fell from over $178 million in 2003 to just under $111 million in 2004 and under $103 million in 2005.

13
• In Newark, non-administration professionals spending went from about $75 million in 2003 down to about $50 million in 2004 and back up over $75 million again in 2005.
• In Boston, curriculum and instructional support rose from around $42 million in 2003 to about $49 million in 2004, but then fell to around $27 million in 2005.
• In Nashville, other costs vary from $9 million in 2003 to over $141 million in 2005.
To assess and compare expenditures across districts, it is necessary to look at expenditure trends over a longer period of time than that for which we have data. This study is aware of making too much of particular categories of spending when there is a chance that some types of expenditure are being classified in varying ways across districts, and even within a district from year to year.
Third, each school district is reliant upon different revenue sources. These sources may change the expenditure policies of the district. For example, Atlanta has relied upon the Special Purpose Local Option Sales Tax (SPLOST) while no other district in this study used this form of revenue. Another example of this can be seen with grants. Compared to Atlanta, Boston receives a larger amount of their revenue from grants.
Using the New Classification to Measure and Compare Costs
To begin the comparison, we offer the traditional cost per student in Table 3 as found in the prior literature aggregating all non-capital and non-nutrition costs. Keeping in mind the limited time series available, from 2003 to 2005, total costs per student have been falling in Atlanta and Boston, while rising in Mobile, Nashville, and Newark. Worth noting in Atlanta’s figures is that 2003 had an anomalously high level of purchased goods and services. Per-student costs in Atlanta on purchased goods and services have fallen from $3,288 in 2003 to $1,876 in 2004 and $1,762 in 2005. Should we exclude purchased goods and services from total costs, per-student costs in Atlanta were lower in 2003 than in 2004 or 2005.

14
Table 3: Total Costs per Student, Excluding Capital and Nutrition
Sc School District 2003 2004 2005
Atlanta Boston Mobile Nashville Newark
$13,290 $12,600
N/A $7,289
$15,700
$12,159 $13,388 $7,620 $8,579
$16,610
$11,596 $11,443 $9,580 $9,969
$17,170 All data are compiled by the authors’ from the data provided by the school districts.
Teacher Salaries
Moving beyond the costs offered in Table 3, the study explores categorical costs based on our classifications. In general, teacher compensation in Atlanta is lower than Boston and Newark, although greater than Mobile and Nashville. Averaging teacher salaries over the study period from 2003 through 2005, salary expenditures average $4,220 per student in Atlanta, $5,016 per student in Boston, $2,615 in Mobile, $3,269 in Nashville, and $5,153 per student in Newark. To explain these differences, we look at three important aspects of compensation; retirement benefits, cost of living factors, and education levels. Looking at retirement benefits, one cause may be Social Security participation. For example, while Mobile, Nashville, and Newark have chosen to participate in the Social Security system, Atlanta teachers do not. Alternatively, Boston teachers participate in the Social Security system if their date of hire is after 1986. Using the 2005 Social Security contribution, employees are required to contribute 6.2 percent of taxable earnings to the Social Security system. This contribution to the Social Security system is applied to earnings up to a maximum $90,000. Therefore, it would be reasonable to assume that teachers’ salaries in the Atlanta should be higher than teachers’ salaries in the other cities to adjust for the lack of federal retirement benefits that non-Atlanta teachers will be receiving. To provide an illustration of the difference, in 2005 the maximum benefit that an individual could receive from the Social Security system was $23,268 annually. A teacher in Atlanta would not be eligible for this benefit.
How closely do average teacher salaries mirror the cost of living in these cities? In this respect there is some evidence that compensation is higher relative to the cost of living in Atlanta than in the other cities. Based on recent cost-of-living comparisons (New York Times 2006):

15
• The cost of living in Boston is 26.6% higher than Atlanta, but teacher salary plus non-salary compensation per student is only 16.1% higher in Boston than Atlanta;
• The cost of living in Mobile is 13.2% lower than Atlanta, but teacher salary plus non-salary compensation per student is 40.4% lower in Mobile than Atlanta;
• The cost of living in Newark is 17.5% higher than Atlanta, but teacher salary plus non-salary compensation per student is only 12.7% higher in Newark than Atlanta; and
• The cost of living in Nashville is 10.2% lower than Atlanta, but teacher salary plus non-salary compensation per student is 20% lower in Nashville than Atlanta.
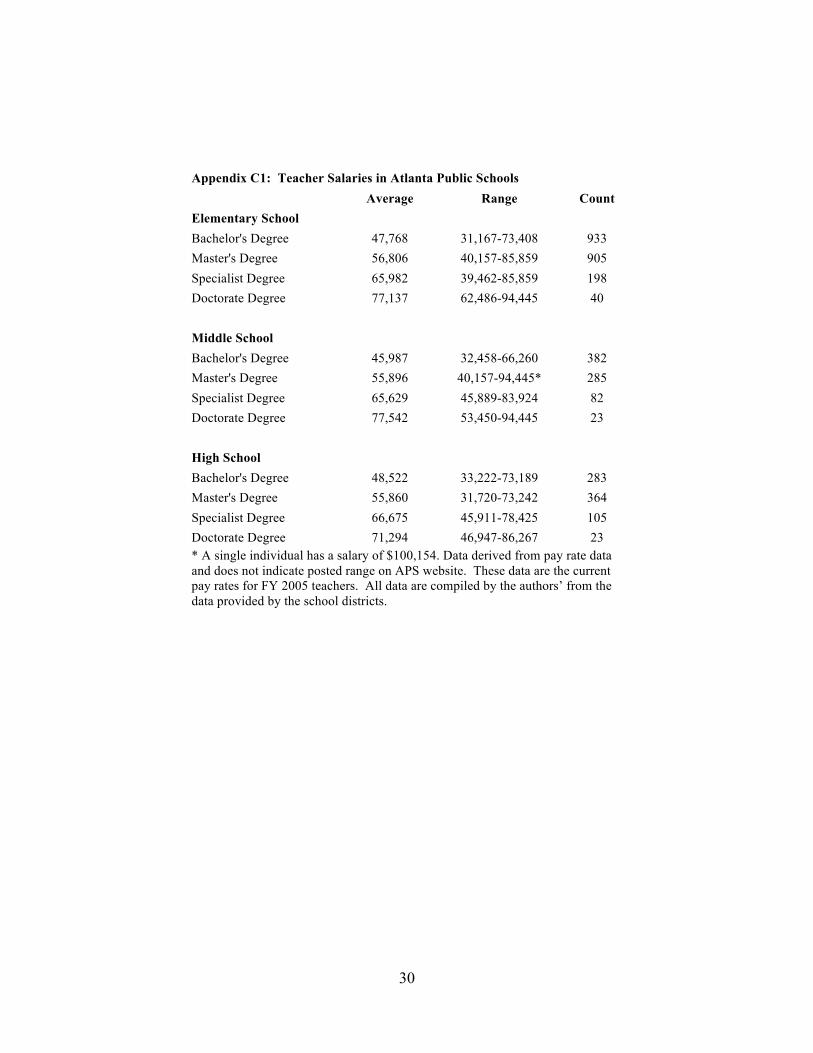
The tables in Appendix C provide figures for 2005 for different levels of teacher certification, with the average salary at each grade and the salary range. In general, Boston teachers are more likely to have an advanced degree. In Boston, 83 percent of elementary, 79 percent of middle, and 82 percent of high school teachers have a Master’s degree or above, while for Mobile the corresponding figures are 51 percent of elementary, 51 percent of middle, and 45 percent of high school teachers. For Atlanta, the corresponding figures are 55 percent of elementary, 51 percent of middle, and 63 percent of high school teachers with a Master’s degree or above. Unsurprisingly, when the data are evaluated, teachers’ salaries appear to be affected by retirement benefits, location costs of living, and education levels of the teacher. That said Atlanta appears to have a higher teacher salary plus non-salary composition than the other four districts when retirement benefits, location costs of living, and education levels of the teacher are taken into account.
To offer a distinction based on school levels, we obtained data on salary scales from Atlanta, Boston, and Mobile by school level, elementary, middle, and high school. Unfortunately, neither Nashville nor Newark provided data broken down by school level. Table 4 offers total teacher salaries for 20052 which are composed of both school-based and non-school based salaries, the most common measure in the extant literature. Using Table 4 and the districts for which we have data at the school level, we can assess the impact on teacher salaries of school-based and non-school based classifications. Table 4, the aggregated salaries, when compared to Table 5, salaries differentiated by school levels, shows that Atlanta has teacher non-school salaries at $136 per student, Boston at $429 per student, and Mobile at $44 per student.

16
Table 4: Teacher Total Salaries in Thousands of Dollars in 2005
School District Total
Students Total Teacher
Salaries Per Student Atlanta 49,924 217,826 4.363 Boston 57,954 285,041 4.920 Mobile 64,747 174,708 2.700 Nashville 70,000 233,410 3.334 Newark 42,217 226,035 5.350 All data are compiled by the authors’ from the data provided by the school districts.
Thus, non-school salaries are not equally applied to these school districts. Therefore, without school level data, salaries are over stated in each district; however the largest overstatement of salaries is with the Boston school district. This outcome implies that school level data on salaries provides an important metric to assist practitioners and researchers in removing non-school based salaries, which overstate school salaries for teachers.
Table 5: Teacher School-Based Salaries in Thousands of Dollars in 2005
School District Total Students
Elementary
Middle High
Per Student
Atlanta 49,924 122,184 40,548 48,321 4.227 Boston 57,954 127,415 49,101 83,775 4.491 Mobile 64,747 89,326 34,612 48,031 2.656 All data are compiled by the authors’ from the data provided by the school districts.
Administrative Costs
Disaggregating school-based and non-school-based administrative expenditures, we begin by comparing the non-school based administrative costs across districts. Using the same metric, per student costs as found in Tables 3 through 5, we show non-school based administrative costs per student in Table 6 for 2005. Amongst the districts there is a wide range of non-school based administrative costs, with Atlanta’s non-school based administrative costs at the highest costs per student, and Newark’s at about one-half the cost per student when compared to Atlanta. This disaggregation would provide both Atlanta and Newark the opportunity to look at both effectiveness and efficiency regarding these costs. That being said, we also note that non-school based administrative costs are similar for Boston, Mobile, and Nashville

17
at about $10 per student. The non-school based administrative costs are in aggregate form since they are not associated with a specific school level, a similar outcome found with firms in senior management overhead costs.
Table 6: Non-school Based Administrative Costs in Thousands of Dollars in 2005
School District Total
Students Administrative Costs Per Student
Atlanta 49,924 20,667 0.414 Boston 57,954 7,147 0.123 Mobile 64,747 6,497 0.100 Nashville 70,000 4,204 0.060
Newark 42,217 9,046 0.214 All data are compiled by the authors’ from the data provided by the school districts.
Regarding school-based administrative costs, Table 7 offers a breakdown by school level for the three districts that reported non-aggregated school-based administrative costs. Atlanta and Boston’s school-based administrative costs are similar while Mobile’s are less than one-half either Atlanta’s or Boston’s per student costs. Combining Tables 6 and 7 is the most common measure in the extant literature for administrative costs, which would assume that school-based and non-school based administrative costs are distributed equally across school districts. This assumption underlying the aggregate does not allow for school level differences in administrative costs or the differences underlying school based and non-school based administrative costs.
Table 7: School-Based Administrative Costs in Thousands of Dollars in 2005
School District Total Students Elementary Middle High Per Student
Atlanta 49,924 13,819 5,885 9,484 0.585 Boston 57,954 14,405 6,816 12,449 0.581 Mobile 64,747 6,485 3,546 4,125 0.219 All data are compiled by the authors’ from the data provided by the school districts.

18
Curriculum & Instructional Support
Table 8 provides our last category of costs that are broken down by school level. In Table 8, aggregate curriculum & instructional support costs are shown for each school district for 2005. The costs per student vary widely among the school districts with Newark having the highest per student expenditure and Mobile the lowest expenditure. Table 9, follows the orientation of the prior tables, breaking this cost down by
Table 8: Curriculum & Instructional Support Costs in Thousands of Dollars in 2005
School District
Total Students
Curriculum & Instructional Support Costs
Per Student
Atlanta 49,924 13,368 0.268 Boston 57,954 27,317 0.471 Mobile 64,747 1,725 0.027 Nashville 70,000 16,821 0.240
Newark 42,217 36,168 0.857 All data are compiled by the authors’ from the data provided by the school districts.
school level. As found in the prior tables, breaking this cost down by school level, for at least Boston, substantially changes per student costs in the disaggregated data.
Table 9: Curriculum & Instructional Support Costs in Thousands of Dollars in 2005
School District Total Students Elementary Middle High
Per Student
Atlanta 49,924 6,598 3,207 3,502 0.267 Boston 57,954 1,402 1,807 6,160 0.162 Mobile 64,747 135 53 1,537 0.027 All data are compiled by the authors’ from the data provided by the school districts.
CONCLUSION
In this paper, an alternative classification of public school costs is developed and applied that can provide information on school-based and non-school based expenditures, costs paid to individuals and other costs, and costs by elementary, middle, and high schools. Using Atlanta
19
Public Schools as our base, our classification has a much smaller number of categories and sub-categories of expenditures than that recommended by the NCES providing a systematic basis for comparisons across school districts. Given the comparison the following conclusions can be noted:
• Teacher salaries per student are affected by school level disaggregation.
• Administrative costs for school-based and non-school based expenditures provide for an observable cost relationship.
• Curriculum and Instructional Support per student differ by school level.
Prior criticisms of the NCES classification was the complexity of the categories and the limits the classification posed to compare districts. In this study an attempt is made to use a cost accounting focus to provide a new classification system that provides investigators, performance auditors, and researchers the opportunity for comparative analysis within a framework of consistent classifications of expenditures.
The main limitation of this study is in its data coverage. Inclusion of more comparable school districts in this program of study could yield more insights into the expenditure patterns of public school districts. Extending the number of years of data will assist in making comprehensive and time invariant conclusions within the analysis.

20
NOTES
1. Current expenditures are understood as noncapital, typically recurrent expenditures necessary for the operation of a business. This includes expenses such as salaries, benefits, supplies, etc.
2. Choice of year has no effect on the described outcomes. Data for all years are available from authors’ upon request.

21
REFERENCES
Anderson, G. M., Shugart, W.F., & Tollison, R.D. (1991). “Educational Achievement and the Cost of Bureaucracy.” Journal of Economic Behavior and Organization, 15 (1): 29-45.
Banker, R. D., Janankiraman, S., & Natarajan, R. (2004). “Analysis of Trends in Technical and Allocative Efficiency: An Application to Texas Public School Districts.” European Journal of Operational Research, 154 (2):477-491.
Barrett, R. (2008). “The Challenges of Transactional Costing.” Journal of Performance Management, 21 (1): 3-9.
Chakraborty, K., Biswas, B. & Lewis, W. C. 2000. Economies of scale in public education: an econometric analysis. Contemporary Economic Policy, 18 (2): 238-247.
Clancy, D. K. & Patton, T. K. (1996). “Service Efforts and Accomplishments Reporting: A Study of Texas Public Schools.” Public Budgeting & Financial Management, 8 (2): 272-302.
Coleman, J.S., Campbell, E.Q., Hobson, C.J., McPartland, J., Mood, A., Weinhold, F., & York, R.L. (1966). Equality of Educational Opportunity. Washington, DC: U.S. Department of Health, Education, and Welfare, Office of Education.
Cybulski, T., Hoy, W.K., & Sweentland, S. R. (2005). “The Roles of Collective Efficacy of Teachers and Fiscal Efficiency in Student Achievement.” Journal of Educational Administration, 43 (4/5): 439-461.
Dee, T. S. (1998). “Competition and the Quality of Public Schools.” Economics of Education Review, 17 (4): 419-427.
Dodson, M. E., III & Garrett, T. A. (2004). “Inefficient Education Spending in Public School Districts: A Case for Consolidation?” Contemporary Economic Theory, 22 (2): 270-280.
Dopuch, N., & Gupta, M. (1997). “Estimation of Benchmark Performance Standards: An Application to Public School Expenditures.” Journal of Accounting and Economics, 23 (2):141-161.
Eggers, W. D., Snell, L., Wavra, R., & Moore, A. T. (2005). “Driving More Money into the Classroom: The Promise of Shared Services.” Reason Foundation Report, August 2005.

22
“65% Order Fits First Class Education’s Agenda.” (2005, August 30), Austin-American Statesman.
Firestone, W. A., & Goertz, M. E. (1996). “Waste Not, Want Not: School Finance Reform and Educational Equity in New Jersey.” Public Budgeting and Financial Management, 8 (2): 224-46.
Grosskopf, S., Hayes, K. J., Taylor, L. L., & Weber, W. L. (1999). “Anticipating the Consequences of School Reform: A New Use of DEA.” Management Science, 45 (4): 608-620.
Hanushek, E. A. (1997). “Assessing the Effects of School Resources on Student Performance: An Update.” Educational Evaluation and Policy Analysis, 19 (2): 141-164.
Hill, P. (2006). “Getting Hold of District Finances: A Make-Or-Break Issue for Mayoral Involvement in Education.” Harvard Educational Review, 76 (2): 178-189.
Hoxby, C. M. (2004). “Productivity in Education: The Quintessential Upstream Industry.” Southern Economic Journal, 71 (2): 209-231.
Johnston, J. M., & Duncombe, W. (1998). Balancing Conflicting Policy Objectives: The Case of School Finance Reform. Public Administration Review, 58 (2): 145-58.
Mancebon, M. J. & Bandres, E. (1999). “Efficiency Evaluation in Secondary Schools: The Key Role of Model Specification and Ex-Post Analysis of Results.” Educational Economics, 7 (2): 131-152.
Mensah, Y. M., Schoderbek, M. P., & Werner, R. H. (2009). “A Methodology for Evaluating the Cost-Effectiveness of Alternative Management Tools in Public-Sector Institutions: An Application to Public Education.” Journal of Management Accounting Research, 21 (1): 203-239.
Murray, S. E., Evans, W. N. & Schwab, R. M. (1998). “Education-Finance Reform and the Distribution of Education Resources.” American Economic Review, 8 (4): 789−812.
National Center for Educational Statistics. (2004). Financial Accounting for Local and State School Systems: 2003. Washington, DC: U.S. Department of Education.
National Center for Educational Statistics. (2009). The Condition of Education 2009. Washington, DC: U.S. Department of Education.

23
New York Times. (2006). Comparing Costs of Urban Living. [On-line]. Available at http://salary.nytimes.com. [Retrieved April 26, 2006]
Rubin, M. A. (2004). “Improving the Current Status of School Performance Reporting.” Journal of Public Budgeting, Accounting & Financial Management, 16 (2): 147-170.
Ruggiero, J. (2001). “Determining the Base Cost of Education: An Analysis of Ohio School Districts.” Contemporary Economic Policy, 19 (3): 268-279.
Sebold, F. D. & Dato, W. (1981). “School Funding and Student Achievement: An Empirical Analysis.” Public Finance Quarterly, 9 (1): 91-105.
U.S. Bureau of the Census. (2007). State and Local Government Finances: 2005. Washington, DC: U.S. Government Printing Office.
U.S. Bureau of the Census. (2008). Public Education Finances: 2004. Washington, DC: U.S. Government Printing Office.
William, G. C. (1996). “An Inquiry into the Feasibility of a National Accounting Policy for Public Schools.” Public Budgeting and Financial Management, 8 (2): 209-223.
William, G. C. (1998). “A Cost Efficiency Analysis of School Districts: Is Larger More Efficient?” Journal of Public Budgeting, Accounting & Financial Management, 19 (4): 513-526.

24
ACKNOWLEDGEMENT
Robert J. Eger III acknowledges the financial support of the Atlanta Civic League and Atlanta Public Schools for this project.
25
APPENDICIES
Appendix A: Classification of Atlanta Public Schools Expenditures Categories Sub-categories
Teacher salaries
• Teachers • Substitutes for Certified
Employee Teachers • Extended-day teachers
• Pre-K teachers • Art, Music and PE
teachers
Non-salary Compensation
• Bonus pay • Extended year • Overtime pay at premium • Part-time pay • Performance pay • Professional development
stipends
• Recreational pay • Stipend pay • Substitutes for non-
certified employees • Summer-school pay for
paraprofessionals • Summer-school pay for
teachers Para-professionals
• Aides and paraprofessionals
Non-administrative Professionals
• Legal personnel • Technology specialists • Research personnel • School psychologists • Physical/Occupational/
Mobility therapists
• Diagnostic audiologists • Accountants • School nurses and special
education nurses • School social workers
School-based Administration
• Principals • Assistant principals
• All other management/ administrative personnel assigned to school
Non-school based administration
• School board member salaries • Superintendents • Deputy, associate, and
assistant area superintendents
• All other management/ administrative personnel not specifically assigned to schools
Curriculum & Instructional Support
• Librarians and Media specialists
• Interpreters • School counselors
Non-educational support
• Bus drivers • Maintenance and other
transportation personnel
• Custodial personnel • Clerical staff
Benefits
• Car allowances • Employee benefits • City pension • Annual leave retirement • Teachers’ retirement system • FICA
• Dental insurance • Life insurance • State health insurance • Workman’s
compensation

26
Appendix A: Classification of Atlanta Public Schools Expenditures (Cont.)
Categories Sub-categories
Purchased Goods and Services
• Books, textbooks and periodicals
• Computer software • Contracted services • Expendable equipment • Depreciation
• Purchases or leases of buses, computers, and other equipment
• Purchased professional and technical services
• Rentals of equipment and vehicles
• Supplies Maintenance and Utilities
• All utilities • Repair and maintenance
services
• Water and sewer services
Travel • Travel by School Board members
• Airfares, food, Lodging, Mileage, Registration and Miscellaneous
Capital • Land acquisition and development
• Building acquisition, construction and improvements
School Nutrition
• Purchased food and acquisitions from USDA
• School nutrition programs
• Small kitchen equipment • Warehouse
All data are compiled by the authors’ from the data provided by the school districts.

27
Appendix B1: Atlanta 2003 Estimated Cost Per Student (in $ thousands): 50,991 Students
Elementary Middle High Total
School Non-
School Per
Student
Teacher salaries $114,925 $36,231 $33,219 $184,375 $17,481 $3.959 Non-salary Compensation 7,576 3,571 5,305 16,452 12,678 0.571
Para-professional 11,485 1,899 1,242 14,626 274 0.292
Non-administrative Professionals
2,470 818 630 3,918 5,013 0.175
School-based Administration 20,044 8,321 15,300 43,665 0 0.856
Non-School based Administration 0 21,397 0.420
Curriculum & Instructional support
7,269 3,097 3,176 13,542 19 0.266
Non-education support 9,079 3,198 2,831 15,108 26,180 0.810
Benefits 37,875 12,665 12,849 63,389 34,855 1.927 Purchased goods 36,437 19,130 8,332 63,899 103,767 3.288 Maintenance & Utilities 6,185 2,342 2,697 11,224 9,632 0.409
Travel 846 113 364 1,323 1,792 0.061 Other 107 70 256 433 12,611 0.256 Total $254,298 $91,455 $86,201 $431,954 $245,699 $13.290 See Appendix A for category definitions. Totals do not always precisely add due to rounding. All data are compiled by the authors’ from the data provided by the school districts.

28
Appendix B2: Atlanta 2004 Estimated Cost Per Student (in $ thousands): 49,580 Students
Elementary Middle High Total School
Non-School
Per Student
Teacher salaries $120,786 $38,968 $38,691 $198,445 $16,671 $4.339
Non-salary Compensation 5,128 1,878 2,584 9,590 11,820 0.432
Para-professional 11,165 1,941 1,119 14,225 635 0.300
Non-administrative Professionals
2,962 866 614 4,442 5,543 0.201
School-based Administration 17,088 6,712 10,693 34,493 0 0.696
Non-School based Administration 0 20,437 0.412
Curriculum & Instructional support
7,164 2,963 3,371 13,498 (24) 0.272
Non-education support 9,191 3,243 2,943 15,377 24,876 0.812
Benefits 32,589 11,649 10,794 55,032 50,043 2.119 Purchased goods 16,351 7,023 16,423 39,797 51,744 1.846
Maintenance & Utilities 5,971 2,334 2,332 10,637 14,981 0.517
Travel 524 122 269 915 1,196 0.043 Other 36 31 31 98 8,349 0.170 Total $228,955 $77,730 $89,864 $396,549 $206,271 $12.159 See Appendix A for category definitions. Totals do not always precisely add due to rounding. All data are compiled by the authors’ from the data provided by the school districts.

29
Appendix B3: Atlanta 2005 Estimated Cost Per Student (in $ thousands): 49,924 Students
Elementary Middle High Total School
Non-School
Per Student
Teacher salaries $122,184 $40,548 $48,321 $211,053 $6,773 $4.363
Non-salary Compensation 3,358 1,588 2,537 7,483 9,335 0.337
Para-professional 11,427 2,538 1,225 15,190 1,060 0.325
Non-administrative professionals
3,200 921 669 4,790 6,875 0.234
School-based Administration 13,819 5,885 9,484 29,188 0 0.585
Central Administration 20,667 0.414
Curriculum & Instructional support
6,598 3,207 3,502 13,307 61 0.268
Non-education support 8,148 2,822 2,994 13,964 25,061 0.782
Benefits 29,745 10,526 10,491 50,762 30,784 1.633 Purchased goods 10,226 5,939 9,530 25,695 62,268 1.762
Maintenance & Utilities 5,975 2,427 2,258 10,660 15,587 0.526
Travel 438 75 184 697 1,558 0.045 Other 27 20 65 112 14,656 0.296 Total $215,145 $76,496 $91,260 $382,901 $194,685 $11.569 See Appendix A for category definitions. Totals do not always precisely add due to rounding. All data are compiled by the authors’ from the data provided by the school districts.
30
Appendix C1: Teacher Salaries in Atlanta Public Schools
Average Range Count Elementary School Bachelor's Degree 47,768 31,167-73,408 933 Master's Degree 56,806 40,157-85,859 905 Specialist Degree 65,982 39,462-85,859 198 Doctorate Degree 77,137 62,486-94,445 40
Middle School
Bachelor's Degree 45,987 32,458-66,260 382 Master's Degree 55,896 40,157-94,445* 285 Specialist Degree 65,629 45,889-83,924 82 Doctorate Degree 77,542 53,450-94,445 23
High School
Bachelor's Degree 48,522 33,222-73,189 283 Master's Degree 55,860 31,720-73,242 364 Specialist Degree 66,675 45,911-78,425 105 Doctorate Degree 71,294 46,947-86,267 23 * A single individual has a salary of $100,154. Data derived from pay rate data and does not indicate posted range on APS website. These data are the current pay rates for FY 2005 teachers. All data are compiled by the authors’ from the data provided by the school districts.

31
Appendix C2: Teacher Salaries in Boston Public Schools
Average Range Count Elementary School Bachelor's Degree 60,516 40,707-65,310 291 Bachelor's Degree + 15 credit hours 63,506 42,110-67,109 335 Master's Degree 62,963 43,508-68,915 523 Master's Degree+ 15 credit hours 65,919 44,914-70,719 508 Master's Degree+30 credit hours 69,343 46,317-72,523 486 Master's Degree+ 45 credit hours 72,023 47,717-74,332 396 Master's Degree +60 credit hours 74,625 49,323-76,336 1,048 Doctorate Degree 77,294 55,319-78,009 69 Middle School Bachelor's Degree 58,736 40,707-65,310 114 Bachelor's Degree + 15 credit hours 61,301 42,110-67,109 156 Master's Degree 62,758 43,508-68,915 180 Master's Degree+ 15 credit hours 66,663 44,914-70,719 189 Master's Degree+30 credit hours 69,529 46,317-72,523 162 Master's Degree+ 45 credit hours 72,043 47,717-74,332 137 Master's Degree +60 credit hours 73,975 49,323-76,336 320 Doctorate Degree 76,757 55,319-78,009 39 High School Bachelor's Degree 59,446 40,707-65,310 121 Bachelor's Degree + 15 credit hours 64,858 42,110-67,109 195 Master's Degree 63,711 43,508-68,915 195 Master's Degree+ 15 credit hours 67,557 44,914-70,719 271 Master's Degree+30 credit hours 70,163 46,317-72,523 190 Master's Degree+ 45 credit hours 72,265 47,717-74,332 224 Master's Degree +60 credit hours 74,871 49,323-76,336 469 Doctorate Degree 77,519 55,319-78,009 66 Note for a small number of Boston teachers we were unable to precisely identify type of school or salary, and so they are not included here. All data are compiled by the authors’ from the data provided by the school districts.

32
Appendix C3: Teachers’ Salaries in Mobile Public Schools
Average Salary Range Count Elementary School Bachelor's Degree 33,040 29,538-37,364 1,063 Master's Degree 40,066 29,538-54,276 1,041 Specialist Degree 44,239 40,288-49,257 57 Doctorate Degree 42,814 29,538-48,832 7 Middle School Bachelor's Degree 33,380 29,538-37,364 372 Master's Degree 39,620 29,538-47,571 365 Specialist Degree 44,270 40,288-45,527 20 Doctorate Degree 46,125 45,710-46,541 2 High School Bachelor's Degree 33,723 29,538-62,371 429 Master's Degree 41,035 29,538-57,723 462 Specialist Degree 48,917 34,368-60,037 34 Doctorate Degree 48,081 39,286-60,279 8 All data are compiled by the authors’ from the data provided by the school districts.