2012 MED Report - TowardGreen Growth inMediterranean Countries
161
2012 MED Report ≈≈≈≈≈≈≈≈≈≈≈≈ Toward Green Growth in Mediterranean Countries Implementing Policies to Enhance the Productivity of Natural Assets ≈≈≈≈≈ Revised on 15 June 2012 (based on version dated 17 April 2012) to take into account comments by H. Kim on the overview (5 March 2012) and comments by participants in the last consultation (particularly from the delegation of the Egyptian Ministry of Finance and the civil society working group).
-
Upload
cmi-marseille -
Category
Documents
-
view
220 -
download
1
description
Implementing Policies to Enhance the Productivity of Natural Assets. Revised on 15 June 2012 (based on version dated 17 April 2012) to take into account comments by H. Kim on the overview (5 March 2012) and comments by participants in the last consultation (particularly from the delegation of the Egyptian Ministry of Finance and the civil society working group).
Transcript of 2012 MED Report - TowardGreen Growth inMediterranean Countries
2012 MED Report
≈≈≈≈≈≈≈≈≈≈≈≈
Toward Green Growth in
Mediterranean Countries
Implementing Policies to Enhance the Productivity of Natural Assets
≈≈≈≈≈
Revised on 15 June 2012 (based on version dated 17 April 2012) to take into account comments by H. Kim on the overview (5 March
2012) and comments by participants in the last consultation (particularly from the delegation of the Egyptian Ministry of
Finance and the civil society working group).

iii
Contents
Foreword vi
Acknowledgments vii
Overview: Objectives, messages, and chapter summaries 1
Objectives 1
Key messages and recommendations 2
Chapter summaries 9
Introduction: The case for a green growth agenda in Mediterranean countries 15
What is green growth about? 16
Economic performance in the southern and eastern Mediterranean countries 17
The Mediterranean as a hotspot of environmental degradation 18
Mainstreaming the environment in economic policies 21
Chapter 1 Short-term double-dividend opportunities 23
Enhancing energy efficiency 23
Improving public health by reducing air and water pollution 26
Upgrading solid waste management and resource efficiency 32
Chapter 2 Maximizing the productivity of natural assets while dealing with trade-offs 36
Optimising water supply and quality 36
Managing coastal areas to maximise ecosystem services and sustainable tourism 42
Toward sustainable urbanisation 45
Cooperating to make fisheries sustainable 49
Chapter 3 Environmental action and job creation 57
iv
A tense demographic context and a low rate of job creation 57
Mechanisms for green impact on economic activity and jobs 61
Jobs and greening: Neither myth nor automatic dividend 62
Chapter 4 Doing Green: Assessing environmental progress and identifying strengths and priorities in environmental action
67
Action-oriented environmental indicators for Mediterranean countries 68
Using multicriteria analysis to identify strengths and priorities 71
Assessing subnational environmental performance 77
Green national accounting for the Mediterranean countries 79
Chapter 5 Tools for environmental action and the implementation of a green growth agenda 84
Promoting social equity and economic growth through environmental fiscal reforms 84
Promoting tradable rights and payments for ecosystem services 90
Corporate social responsibility and socially responsible investment in Mediterranean countries 93
Changing consumer and producer behaviour: Promoting ecolabels and certification 98
Chapter 6 Conclusions and call for action 106
Green growth is pure economics—and can generate benefits 106
Green growth for the Mediterranean is feasible 107
A blend of market and nonmarket instruments will be needed to maximise the potential for co-benefits 109
Green actions and expected outcomes: A typology for decision making 111
Avoiding irreversibility and overcoming stalemates 112
Maximizing synergies and dealing with trade-offs 113
Recommendations to policy makers and other stakeholders 114
Call for action 114
References 119
v
Annexes 128
A1. Case study on water access in Egypt using Demographic and Health Surveys (DHS) 129
A2. Multicriteria methodology 130
A3. Application of multicriteria analysis to EPI indicators 132
A4. Multicriteria analysis using subnational Turkish data 135
A5. Main environmental institutions and governance in selected countries 137
A6. Acronyms and abbreviations used in the report 148
A note concerning the geographic focus of the 2012 MED Report The primary focus of this report is on the countries of the southern rim of the Mediterranean from
Morocco to Turkey, referred to as the southern and eastern Mediterranean countries, or SEMCs. The
countries are Algeria, Egypt, Jordan, Lebanon, Libya, Morocco, Syria, Tunisia, Turkey, and West
Bank and Gaza. They do not necessarily have more environmental work to do than the European or
Balkan countries, but their socioeconomic conditions may make adoption of a green agenda more
challenging.
Some parts of the report apply equally to the SEMCs and wealthier countries in the Mediterranean
region. Where this is so, the report may refer simply to Mediterranean countries, without
distinguishing between the northern and southern rims. In some cases the report cites studies based on
a smaller or larger sample of countries, which may be organised in groups different from those
generally used in the report. For that reason, not all data presented in the report may be directly
comparable.
vi
Foreword
Job creation and natural resources management are two of the most daunting challenges faced by
Mediterranean countries. Since the Arab Spring began in February 2011, those issues have been
compounded by swelling demand for greater social equity and relief from grinding poverty.
Green growth offers a way to achieve sustainable development by enhancing the productivity of
natural assets while preventing the negative social consequences of environmental degradation. In
other words, stopping environmental degradation can improve social welfare while helping to create
employment opportunities. In so doing, green growth can generate co-benefits. This is true
everywhere on the planet, but particularly so in the Mediterranean, where natural assets such as water
and coastal areas have long been under intense pressure. Without prompt action, that pressure will
grow, as climate change amplifies water scarcity and erodes biodiversity.
As a facilitator of dialogue between local and international stakeholders, the Center for
Mediterranean Integration is well placed to contribute to a shift to green growth in the region by
promoting studies that reveal where co-benefits have already been obtained and how best practices in
promoting green growth can be replicated or adapted in neighbouring countries.
The 2012 MED Report: Toward Green Growth in Mediterranean Countries is the product of a
cooperative and consultative process in which national policy makers, partners, experts, and local
private stakeholders were invited to share their experiences and expectations concerning the issues
facing the region. The need to discuss those issues in a published report was confirmed by public and
private decision makers in regional and local consultations. Tackling the multidimensional challenge
of growth in the context of a vulnerable natural environment requires cooperation, coordination, and a
comprehensive set of measures.
The objective of this report is to share sustainable economic options with decision makers and to
present evidence from recent experiences in Mediterranean countries that green growth presents an
outstanding opportunity to create good jobs and promote social cohesion. Starting with a few specific
sectors, the 2012 MED Report offers some promising pathways to sustainable economic growth in the
region. The goal of the report team is to open the debate and issue a call for action on environmental
problems. We have real opportunities to shape our future, but we must chart a different course from
the one we have followed so far, and we must do it now.
—Mats Karlsson, Director
Center for Mediterrean Integration

vii
Acknowledgments
The 2012 MED Report, a publication of the Center for Mediterranean Integration (CMI), was
produced by a consortium led by the World Bank in partnership with the Agence Française de
Développement (AFD), the European Investment Bank (EIB), Plan Bleu (UNEP/MAP regional
activity centre), and the Forum Euro-Méditerranéen des Instituts de Sciences Economiques
(FEMISE). In an effort to gather material for the report, the consortium organised a series of national
and regional consultations to identify relevant case studies and stakeholder experiences with
environmental and growth issues in the southern and eastern countries of the Mediterranean. The team
benefited greatly from a wide range of comments and advice from about 300 policy makers, private
individuals, and academics who participated in the consultations and joined an e-community created
for the consultation process. Because it takes stock of local experiences, the report is rooted in
Mediterranean good practices.
The preparation of the report was coordinated by a team led by Gilles Pipien, senior environment
specialist (World Bank), with Jean-Pascal Bassino, senior economist (World Bank consultant), and
Frédéric Blanc, senior economist (FEMISE). The process took place under the overall leadership of
Mats Karlsson, director of the CMI, Junaid Ahmad, sector director (WB/MNSSD), and Luis
Constantino and Hoonae Kim, sector managers (WB/MNSSD). Contributions were received from
Hala Abou-Ali, Slimane Bedrani, Julien Hanoteau (FEMISE consultants), and Kostas Tsakas
(FEMISE); Sara Fernandez, Hugues Ravenel, Nathalie Rousset, and Didier Sauzade (Plan Bleu);
Hynd Bouhia, Marion Dovis, Charlotte de Fontaubert, Yusuf Kocoglu, Thomas Lagoarde-Segot, Anil
Markandya, and Jean-Louis Weber (World Bank consultants). The team is equally appreciative of the
comments received from the following World Bank peer reviewers: Dan Biller, Milan Brahmbhatt,
Hocine Chalal, Marianne Fay, Caroline Freund, Glenn-Marie Lange, and Michael Toman.The report
was edited by Steven Kennedy (World Bank consultant).
The 2012 MED Report team would like to acknowledge the valuable comments and inputs
received from steering committee members and experts consulted at various stages of the process:
Nathalie Abu-Ata (World Bank), Kulsum Ahmed (World Bank), Christian Averous (Plan Bleu), Peter
Carter (EIB), Nathalie Girouard (OECD), Stéphane Hallegatte (World Bank), Kirk Hamilton (World
Bank), Alexander Kremer (World Bank), Thierry Latreille (AFD), Myriam Linster (OECD), Sergio
Margulis (World Bank), Daniel Ottolenghi (EIB), Valérie Reboud and Dominique Rojat (AFD),
Armin Riess (EIB), Jocelyne Vauquelin (AFD), and Xavier Vincent (World Bank).
The team wishes to highlight the specific contribution of members of a civil society working
group that provided recommendations: Helmy Abouleish (Egypt), Nadia Abu Yahia Lawton (Jordan),
Christian Averous (France), Siham Ayouch (Morocco), Slimane Bedrani (Algeria), Alaa Ezz (Egypt),
Iacovos Gkanoulis (Greece), Wafik Grais (Egypt), Jelena Knezevic (Montenegro), Rida Lamrini
(Morocco), Beti Minkin (Turkey), Rafik Missaoui (Tunisia), Roby Nathanson (Israel), Aldo Ravazzi
Douvan (Italy), Mohammed Salem (West Bank), and Sibel Sezer Eralp (Turkey).
About the partners Created in 2009, the CMI is a World Bank–administered platform for multipartner programs designed
to encourage forward thinking for the Mediterranean region. The CMI strives to act as an honest
viii
broker among stakeholders in the region, contributing to a constructive dialogue in which knowledge,
experience, and solutions related to common problems are identified and discussed. The 2012 MED Report is an outcome of the CMI’s Environment and Water cluster. The report benefited from
information received from World Bank experts and consultants involved in the Environment and
Water cluster and other CMI programs. The team wishes specifically to acknowledge colleagues at
the CMI for their constant support and assistance, particularly Soumia Driouch, and Salomé Dufour.
The Agence Française de Développement (AFD) is France’s development-assistance agency. Its
missions are to reduce poverty and inequality, promote sustainable economic growth, and protect
global public goods that benefit all humanity. The mission of protecting global public goods
encompasses the fight against climate change and pandemics, the preservation of biodiversity, the
promotion of social and environmental responsibility, and the provision of aid to countries weakened
by strife, war, or natural disaster.
The European Investment Bank (EIB) is the European Union’s financing institution. Its
shareholders are the 27 member states of the Union, which provide its capital. The EIB’s role is to
provide long-term finance in support of investment projects. Outside the EU, the EIB is active in more
than 150 countries, including the Mediterranean partner countries, working to implement the financial
pillar of the EU’s external cooperation and development policies (private sector development,
infrastructure development, security of energy supply, and environmental sustainability).
Plan Bleu, a French nongovernmental organization, is a partner in regional environmental
cooperation under the framework of the United Nations Environment Programme’s Mediterranean
Action Plan (UNEP/MAP). Plan Bleu produces information and knowledge to alert decision makers
and other stakeholders of environmental risks and sustainable development issues in the
Mediterranean, and to shape future scenarios to guide decision making.
FEMISE is a Euro-Mediterranean network operating since 1997 and formally established in 2005.
Network members include more than 90 research centres in economics, representing the 37 partners
of the Barcelona Declaration. FEMISE is jointly coordinated by the Institut de la Méditerranée
(France), and the Economic Research Forum (Egypt). Its aim is to produce and disseminate research-
based recommendations on economic and social issues in the Mediterranean.
Overview: Objectives, Messages, and Chapter Summaries
The environment-economy nexus is key to meeting the challenges facing Mediterranean countries. By mainstreaming the
environment in economic policies and promoting a green growth agenda at the national and regional levels, countries can foster
economic growth, job creation, social equity, and sustainable management of natural resources. But moving toward green
growth requires a comprehensive set of policies and close partnerships between public and private stakeholders.
Policies designed to improve and protect the environment (“green policies”) can generate widely
shared social and economic gains (“co-benefits”), especially when combined with complementary
actions that tackle other fundamental structural problems in the economy. Economic performance can
be improved and social welfare boosted by incorporating environmental considerations into sectoral
and cross-sectoral planning. Inevitably, however, any such process will create winners and losers. An
equitable green growth agenda is one that emphasises policies that bring benefits far in excess of their
costs.
That is the message of the 2012 MED Report, the product of (i) a consultative process involving
experts and stakeholders from countries on the eastern, southern, and northern rims of the
Mediterranean countries, and (ii) an extensive literature review.
Objectives
The report’s aim is to examine success stories from the Mediterranean countries that highlight the
social returns to be obtained by mainstreaming the environment in the development agenda in the
region and to review trade-offs, with a view to identifying policies that yield the highest net benefit.
The report also intends to advance the ongoing debate among policy makers on potential green
growth policies and investments, and on the policy mix that offers the greatest chance of maximizing
the benefits of green policies. The 2012 MED Report includes an assessment of national strengths and
priorities in environmental action.
In cooperation with beneficiary countries in the southern and eastern Mediterranean and key
partners, the CMI has implemented a comprehensive new framework program—the Environment and
Water Program—of which the 2012 MED Report is a component. The Environment and Water
MED 2012 ≈≈≈ TOWARD GREEN GROWTH IN MEDITERRANEAN COUNTRIES
2
Program deals with issues related to natural resources, land degradation, solid and hazardous waste,
and climate change. Its overall goal is to offer a common vision for mainstreaming environmental
issues in the economic development agendas of Mediterranean countries.1
Key messages and recommendations
The case for adopting a green growth agenda
1. In southern and eastern Mediterranean countries (SEMCs), demand is growing for a new paradigm of growth and development (Galal 2011). Green growth provides an opportunity simultaneously to foster economic growth, job creation, and social equity. A policy agenda based on
green growth could contribute to achieving development objectives in SEMCs by raising the
productivity of natural assets and other production factors and reducing the negative effects of
environmental degradation, which disproportionately affect the poorest households and most
vulnerable segments of the region’s population. Well-designed green policies have the potential to
generate immediate co-benefits. In addition to long-term and direct gains from better environmental
management, net job creation and productivity gains can be expected when implementing green
policies. This is especially true if environmental policies are combined with complementary actions
that tackle fundamental structural problems in the economy.
2. Green growth policies aim at making growth processes more resource-efficient, cleaner, and more resilient—without necessarily slowing them (World Bank 2012). Environmental degradation
reduces the quality of life in the region but also hampers economic efficiency, job creation, and
growth prospects. By contrast, green growth policies aim to promote economic development, social
equity, and inclusiveness—without compromising the environment (Hallegate and others 2011).
Green growth policies can be designed to maximise short-term gains so as to compensate as much as
possible for the upfront costs associated with the transition. In other words, they can be designed to
manage inevitable trade-offs. They can also raise resilience in the face of external shocks and can be
made compatible with other important national policy objectives.
3. Aligning environmental and economic policies is urgent, both to maintain the resilience of some of the most productive ecosystems in the region and to reverse the effects of current environmental degradation. The implications of unsustainable development are particularly severe in
the Mediterranean region, where natural conditions (in particular a chronic water shortage) have a
negative impact on welfare and economic activity. The region’s unique but threatened ecosystem
underpins the livelihoods of millions of people, not only through fisheries, agriculture, and forests, but
also by attracting more international tourists than any other world region. Environmental degradation
threatens key sectors such as tourism, upon which many countries of the region depend (Croitoru and
Sarraf 2010; Larsen 2010). The tourism sector provides a good example of the economy-environment
nexus. The sector is an essential component of the economies of the SEMCs, with receipts accounting
1 The Center for Mediterranean Integration (CMI) in Marseille, was created in 2009 by the governments of Egypt, France, Jordan, Lebanon, Morocco, and Tunisia, together with the European Investment Bank (EIB) and the World Bank. The aim of the CMI is to support sustainable development through access to knowledge. A key objective of the centre is to explore green policies capable of maximizing both economic and environmental returns through multiple programmes, including this 2012 MED report.
MED 2012 ≈≈≈ TOWARD GREEN GROWTH IN MEDITERRANEAN COUNTRIES
3
for most of the region’s $22 billion surplus in trade in services, thus making up for half of the overall
trade deficit of the same set of countries (FEMISE 2007). But some of the most valuable natural
assets of the Mediterranean region face a risk of irreversible degradation that could affect present and
future economic prosperity and the welfare of local populations. In particular, pristine coastal areas
that could support high-value-added and labour-intensive tourism activities are threatened by
uncontrolled development.
Issues and opportunities 4. Decision makers can face hard choices and trade-offs between economic and environmental goals, but opportunities to reap co-benefits are also available. Sound environmental policies can
help solve economic problems such as urban congestion, health conditions related to air and water
pollution, and low agricultural productivity. But environmental policies also imply trade-offs,
especially over time. Some of these trade-offs cannot be offset by co-benefits and will therefore
require tough choices from policy makers. The 2012 MED Report identifies several types of
opportunities. Presently, natural resources such as water and energy are used inefficiently, imposing
both economic and environmental costs. By using resources more efficiently it is possible to generate
simultaneous environmental, economic, and employment benefits. Achieving greater efficiency
entails overcoming significant institutional and political-economy obstacles, but some benefits are
quickly achievable, as attested by the success stories presented in the report.
5. Co-benefits can be substantial. Managing natural assets presents important opportunities to
protect the environment, create jobs, and lower operating costs. For example, installing energy-
efficient shells on new buildings (including insulated roofs, walls, and windows) by 2030 has the
potential to reduce energy costs and CO2 emissions—but also to create an estimated 1.3 million jobs
in building, construction, and maintenance in the SEMCs (Plan Bleu 2011). Reducing leakage from
the water supply network to prevent overextraction from aquifers is also among the most effective
management measures that emerge from case studies (Plan Bleu 2010). Improving access to water in
urban areas that presently have the lowest access (less than 50 litres per capita per day) can result in
sizable environmental and health benefits; in the case of Jordan the overall benefit/cost ratio is 2:1
(WHO/UNEP 2008). Lastly, policies to improve waste management and control air and water
pollution can generate positive outcomes with minimum effort.
6. In urban planning and in the management of coastal zones, significant trade-offs and distributional effects can be addressed. Urban sprawl encroaches on fertile land that is already in
short supply and on coastal areas that have a high potential for sustainable tourism. But even here co-
benefits can be obtained by introducing incentives that influence the behaviour of private agents in
desired directions. For example, it is possible to tax increased land values when granting development
rights—as, for example, in the Amman Master Plan. Such a tax provides incentives to reduce
environmental degradation, while generating financial resources for the greening of Amman and the
conservation of heritage areas (Beauregard and Marpillero-Colomina 2011). Agglomeration effects in
major urban areas are valuable as engines of economic growth and job creation (World Bank 2009a).
Policies to promote concentration can prevent and mitigate negative environmental effects of
urbanization while preserving welfare and growth objectives.
7. Despite the likelihood of upfront and localised job losses, green growth policies have the potential to produce a net gain in jobs, while also preserving many existing jobs. The net impact of
green policies on jobs depends on the balance between job creation and job destruction. Policies can
MED 2012 ≈≈≈ TOWARD GREEN GROWTH IN MEDITERRANEAN COUNTRIES
4
be designed to maximise the former and minimise the latter—for example, by implementing a sound
institutional framework for job creation. Evidence in developed countries suggests that well-designed
environmental regulation and taxes do not necessarily have a negative impact on competitiveness and
jobs, but may in fact have a positive impact when well articulated with other policies. Empirical
results show ambiguous effects of green growth strategies on jobs, meaning sometimes there are gains
but there could be challenges especially in the short run. These gains are clearly highlighted in two
recent reports produced in the region, one by the Arab Forum for Environment and Development
(AFED 2011) and the other by the Economic and Social Council of the Kingdom of Morocco
(CESRM 2012). Under optimistic scenarios, some recent studies suggest that the net job gains could
reach 10 per cent of the total jobs needed in SEMCs to accommodate demographic trends (FEMISE
2011, UNEP 2011). However, converting potential jobs into real jobs would require that green
policies be combined with complementary actions to tackle structural labour market issues.
Making the shift to a green economy and to green growth 8. The experiences of countries that have tackled environmental challenges should be shared so as
to better address the common environmental challenges faced by Mediterranean countries. Relying
on various existing indicators, national strengths and priorities can be identified, ranging from
pesticide regulation to marine protection, on both the southern and northern shores of the
Mediterranean. A more accurate assessment can be based on indicators devised especially for the
purpose (OECD 2011, 2012). Because the entire region shares certain priorities, in particular, on air
pollution and water management, positive experiences can be replicated and worst practices avoided.
Of particular note for both public authorities and private actors are the potentially long-lasting
consequences of environmentally harmful subsidies and mismanagement of coastal zones in the
northern Mediterranean that are affecting tourism and fisheries.
9. Because any green growth agenda will produce winners and losers, compensation
mechanisms are needed to ease disruption in negatively affected sectors and facilitate social
acceptance of the shift to green policies. Entrenched rent-seeking behaviours are largely to blame for
environmental degradation. But the people of the SEMCs have clearly demonstrated their willingness
to modify the status quo. The depth of popular support offers an opportunity to shift to green growth,
provided ways can be found to minimise the opposition of potential losers, and ideally induce them to
envision long-term gains and support green policies.
10. Some initial steps toward green growth do not require new financial resources. Phasing out
perverse incentives—such as fuel subsidies that are environmentally harmful, economically costly,
and socially regressive—is not an easy task. But if such reforms are implemented, substantial public
funds would be freed up, which is good news for governments facing budget constraints. Through
complementary policies such as cash transfers, such a change can be made without hurting the poor.
Oil subsidy reforms in Indonesia and Iran are among the best examples of this process (IMF 2011a).
More generally, environmental taxes, market mechanisms, norms and standards, and regulations are
tools that do not require upfront finance.
11. Regional cooperation and partnerships between the public and private sectors can help
mobilise the additional funding needed to implement a comprehensive green growth agenda.
Experiences recorded in the case studies summarised in the 2012 MED Report indicate that some
projects are likely to attract support from multilateral or bilateral donors; others, such as renewable
energy generation, are candidates for local or foreign private investors. Additional funding for large-
MED 2012 ≈≈≈ TOWARD GREEN GROWTH IN MEDITERRANEAN COUNTRIES
5
scale municipal solid waste management and for initiatives in energy efficiency and renewable energy
may be expected through innovative finance mechanisms. Private agents can contribute to the effort—
and benefit from it—by improving the efficiency of their use of natural resources.
Policies and incentives to achieve green growth objectives 12. A mix of mutually reinforcing policies will be needed to accelerate the shift to green
growth—among them price-based mechanisms, regulations, targeted taxation, innovation and
industrial policies, investments, product and process standards, ecolabelling, and communication
campaigns. Nonmarket approaches can reinforce the effectiveness of market-based policies and
compensate for the market failures and behavioural biases that sometimes prevent prices from
affecting consumer behaviour.
13. Prices, in particular, are critical to increase efficiency. Green growth policies normally rely
on pricing to internalise the positive and negative externalities of natural resource use. Putting a price
on natural assets (notably water) is a way of enhancing their productivity and avoiding their wasteful
use. Similarly, assigning a value to negative external effects—notably of fossil fuel consumption—
can facilitate a change in the behaviour of private agents. Proper pricing takes into account the social
cost of an activity on the environment, on health, and on social equity. The first steps in the process of
getting prices right are the gradual reduction of harmful subsidies and the conversion of ambiguous
subsidies into well-targeted cash transfers.
14. A variety of economic incentives are needed to nudge producers and consumers into alignment with the green growth agenda.
• Fiscal incentives for investments in more fuel-efficient equipment would reduce air pollution
and carbon emissions, while also reducing imports of fossil fuels and preserving
nonrenewable resources for export (IMF 2011a). Such incentives could be funded by
reallocating a fraction of existing energy subsidies in sustainable and politically feasible
ways. Intense awareness campaigns can ensure public support, especially with regard to energy and water subsidies.2
• Introducing market instruments for the allocation of water resources would improve
economic efficiency by providing a larger share of this scarce resource to producers able to
increase its productivity. Such instruments should be accompanied by complementary actions
to ensure that they do not hurt the poor or place too great a burden on a few economic sectors.
Such coordinated action requires institutional capacity as well as political will, since those
who once had free access to a resource would have to pay for it.
• Energy and water satellite accounts, as part of national accounting frameworks (including the
World Bank WAVES program), would provide useful information to policy makers to track progress and to identify priorities for action.
• Vigorously enforced regulations built on the polluter-pays principle could generate finance
for green growth actions designed to provide tangible results in the short and medium term.
Transitional support and other complementary measures need to be considered to avoid imposing a negative shock on the economic system.
2 As proposed during the consultation process by the delegation from the Egyptian Ministry of Finance.
MED 2012 ≈≈≈ TOWARD GREEN GROWTH IN MEDITERRANEAN COUNTRIES
6
• Private initiatives to include environmental practices in assessments of publicly traded
companies—such as the Egyptian stock exchange’s Economic and Social Governance Index
and the Istanbul stock exchange’s Sustainability Index Project—can foster a sense of social and environmental responsibility among producers and investors.
• Ecolabelling is among the best known of an emerging class of incentives that help consumers
express their concern for the environment through informed buying decisions. By combining
ecolabelling and soft loans to consumers, Tunisia has successfully nudged consumers toward energy efficiency (GEF 2007).
Identifying priorities for action
15. Looming threats to public health and the risk of irreversible changes in the environment are an immediate priority for public authorities, whose actions will have greater impact if taken in the context of a larger agenda. Better control of water pollution and solid waste is needed to improve and
protect public health. A combination of regulatory and market-based instruments is needed to reduce
the risk that the suboptimal management of fish stocks, agricultural soils, and coastal zones will
become irreversible owing to a loss of resilience (Steward 2004). National priorities depend on local
conditions, and development priorities are different across SEMCs. The report can help identify
strengths and priorities using available indicators of environmental action, at both the regional and
national levels. It can help to tailor national green agendas that suit national priorities, development
conditions, and local social and economic factors.
16. Mediterranean countries can take advantage of their common features to identify mutually beneficial priorities. Country environmental analyses undertaken by the World Bank (2004a, 2005,
2010a, 2011d) provide information for Egypt, Jordan, Lebanon, and Tunisia that indicates the
presence of similar priorities and constraints amid the diversity of national environmental conditions.
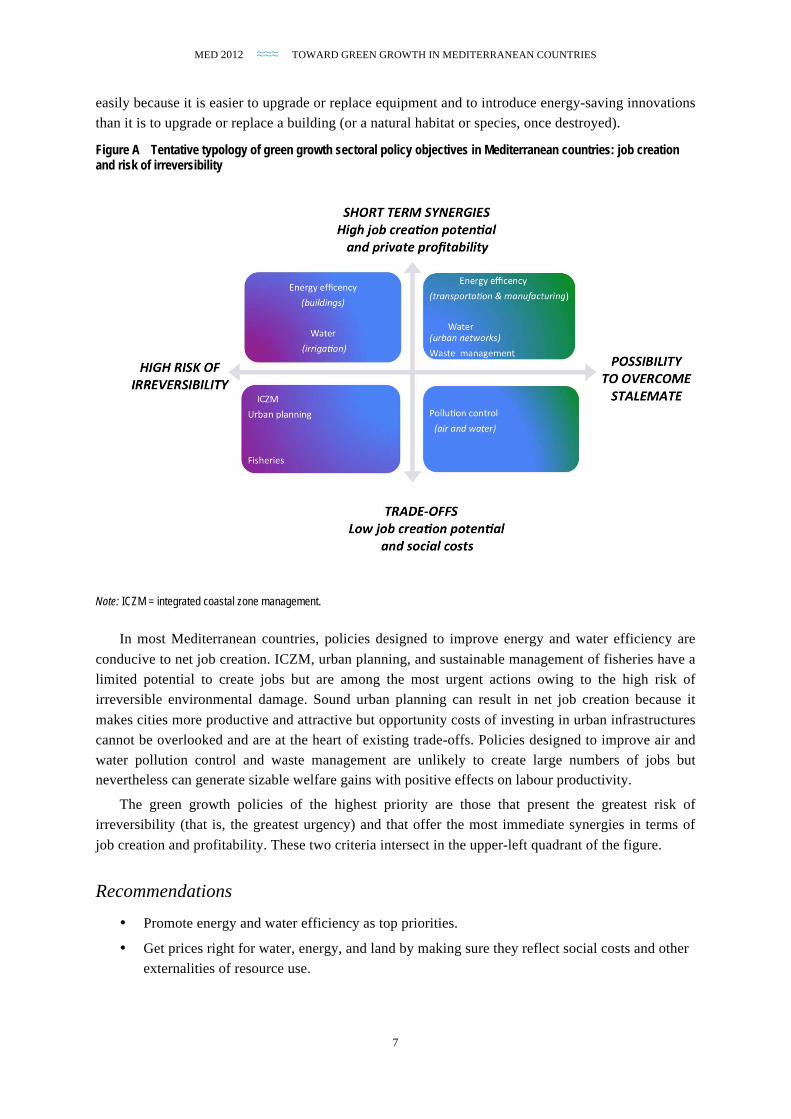
Green growth sectoral policy objectives can be classified as shown in figure A, in which the y-axis
represents the extent of potential synergy in the development of new economic activities and jobs (net
job creation), and the x-axis the risk of irreversibility or “lock-in” entailed by today’s decisions on the
left end of the continuum, and the possibility of overcoming social and political stalemates, often
traceable to inertia, on the right.3 In its use of the inertia concept, this approach is consistent with that
developed in chapter 7 of the World Bank’s report, Inclusive Green Growth: The Pathway to
Sustainable Development (2012). Energy efficiency in buildings is deemed to present a high risk of
irreversibility because buildings, once erected, are replaced slowly. Moving to the right on the
continuum, inefficiencies in energy use for transportation and manufacturing that have high
economic, social, and Environmental costs (and that thus offer high synergies) can be addressed more
3 Among the social and economic choices that may be considered irreversible (or locked in) are those affecting biodiversity (extinction is forever), climate (CO2 and methane molecules have a long residence time in the atmosphere), infrastructure and settlements (roads and buildings are long-lived assets; the development of cities is driven by transport infrastructure, and their form is quasi-irreversible), and technological solutions (innovation and R&D investments have a tendency to focus on existing, proven technologies). Inertia is a related concept, connoting the persistence of behavioral, technical, and institutional components of socioeconomic systems—among them consumption habits, the longevity of infrastructure and other aspects of the build environment, financing models, and government institutions. Specific policies focusing on sectors with high inertia are required, in addition to economy-wide policies (Lecocq and others 1998; Jaccard and Rivers 2007; Vogt-Schilb and Hallegatte 2011).
MED 2012 ≈≈≈ TOWARD GREEN GROWTH IN MEDITERRANEAN COUNTRIES
7
easily because it is easier to upgrade or replace equipment and to introduce energy-saving innovations
than it is to upgrade or replace a building (or a natural habitat or species, once destroyed).
Figure A Tentative typology of green growth sectoral policy objectives in Mediterranean countries: job creation and risk of irreversibility
Note: ICZM = integrated coastal zone management.
In most Mediterranean countries, policies designed to improve energy and water efficiency are
conducive to net job creation. ICZM, urban planning, and sustainable management of fisheries have a
limited potential to create jobs but are among the most urgent actions owing to the high risk of
irreversible environmental damage. Sound urban planning can result in net job creation because it
makes cities more productive and attractive but opportunity costs of investing in urban infrastructures
cannot be overlooked and are at the heart of existing trade-offs. Policies designed to improve air and
water pollution control and waste management are unlikely to create large numbers of jobs but nevertheless can generate sizable welfare gains with positive effects on labour productivity.
The green growth policies of the highest priority are those that present the greatest risk of
irreversibility (that is, the greatest urgency) and that offer the most immediate synergies in terms of
job creation and profitability. These two criteria intersect in the upper-left quadrant of the figure.
Recommendations • Promote energy and water efficiency as top priorities.
• Get prices right for water, energy, and land by making sure they reflect social costs and other
externalities of resource use.
MED 2012 ≈≈≈ TOWARD GREEN GROWTH IN MEDITERRANEAN COUNTRIES
8
• Reduce regressive subsidies to enhance the social acceptance of a green agenda, and combine
with complementary measures to cancel the negative impact on the poor.
• Tackle market failures through institutional innovation, regulation, ecolabelling, and
innovation and industrial policy.
• Nudge producers and consumers toward behaviours that reduce air and water pollution and improve waste management.
• Set medium-term objectives for urban planning, coastal zone management, and fisheries.
• Cooperate at the regional level for exchange of best practices and know-how. This kind of
cooperation should include capacity building for implementing economic environmental
accounts, especially at the macro level.
• Exploit innovative financial sources such as carbon facilities for new investment. Also, green
economy credit lines could be created, targeting in particular local SMEs4
• Engage the private sector to assume greater environmental responsibility and leverage private finance.
The CMI, in cooperation with the Office de Coopération Économique pour la Méditerranée et
l’Orient (OCEMO), Plan Bleu, the Forum Euro-Méditerranéan des Instituts de Sciences Economiques
(FEMISE), and other partners, supported a working group of experts from civil society organizations
in the North and South that worked in parallel with the 2012 MED Report to develop
recommendations to implement a green economy in the Mediterranean. Their recommendations
(Working Group on Green Economy 2012) converge with those presented in chapter 6 hereof.
Call for action
17. Launching national green growth strategies in each country will enable the coherent
implementation of public policies tailored to each local setting. These strategies will require strong
national leadership and will be more likely to produce results if they are developed jointly by all
major stakeholders in the society. A prerequisite of successful strategies is diagnostic work to identify
the issues, challenges, and opportunities on the basis of which priorities have been selected. Close
monitoring should be provided both to verify implementation and to make it possible to publicise
results and adjust the course of implementation if necessary. Implementation depends strongly on key
skills and competencies that will have to be developed—for example, by setting up programs to train
practitioners in key occupations. Innovation—technological and social—will be indispensable. The
involvement of large firms and the financial sector will encourage and support risk-taking and
innovation by small and medium-sized enterprises. Pilot projects, developed and implemented with
concerned citizens, as well as model initiatives in public services, can sow seeds that grow gradually
but steadily. Successful implementation will have to be measured at the local level. The task will be to
pair increased competitiveness of subnational entities with progress toward an efficient green
economy.
18. At the regional level, it is time to move beyond the very fruitful sharing of experiences to
place green growth on the Mediterranean agenda. The regional level is the right one for making
concerted efforts within a framework of integration favourable to the development of the entire
Mediterranean region. If the green economy can also be an efficient economy, then the major policies
4 As proposed by the delegation of the Egyptian Ministry of Finance during a consultation on the report.
MED 2012 ≈≈≈ TOWARD GREEN GROWTH IN MEDITERRANEAN COUNTRIES
9
of the Mediterranean region should develop in that direction. Green growth policies should be part of
the G8’s Deauville process, supported by the Union for the Mediterranean, and on the agenda at
meetings between finance ministers. Pertinent knowledge is available in the region, within the
universities and specialised institutions and organizations.5 One orientation could be to create a
Mediterranean green growth platform, or, as a first step, to forge a Mediterranean link with the green
growth knowledge platform launched recently by the World Bank, in partnership with OECD and
UNEP. Existing mechanisms for deliberation such as the Mediterranean Commission for Sustainable
Development and the Mediterranean Strategy for Sustainable Development could be redeployed or
strengthened to contribute to the green growth process. Financial institutions are accustomed to
coordination—they could collaborate to create green investment funds.
Placing green growth on the Mediterranean agenda is urgent; it is feasible; and it is necessary for
the advancement of the people of the region.
Chapter summaries
Introduction: The case for a green growth agenda in Mediterranean countries
Green growth and the Mediterranean socioeconomic context. In 2011 demand increased in the
southern and eastern Mediterranean countries (SEMCs) for a policy shift toward a new social
paradigm fostering economic growth, job creation, and social equity (FEMISE 2011a). A green
growth agenda could contribute to achieving those objectives by raising efficiency and productivity
while reducing negative environmental externalities that disproportionately affect the poorest
households and most vulnerable segments of the population.
The environment-economy nexus. The environment-economy nexus is at the heart of the
challenges facing all the countries of the Mediterranean rim. The current level of environmental
degradation is unsustainable and inefficient, hampering economic activity, job creation, and growth,
and lowering welfare, notably through threats to public health. Green growth policies can make
growth processes more resource-efficient, clean, and resilient without necessarily slowing them,
thereby helping to achieve the objectives of job creation and social equity (World Bank 2012).
The risks of loss of resilience and irreversibility. Mainstreaming the environment into economic
policies must be done without delay to avoid locking the economy into unsustainable patterns and
causing irreversible environmental damage. Immediate action is needed to maintain the resilience of
productive ecosystems that provide essential economic services. While sustainable development is
important for all regions of the world, the implications of delay in addressing environmental threats
are particularly severe in the Mediterranean region, where natural conditions (in particular a chronic
water shortage) already negatively affect economic activity and welfare.
Balancing winners and losers. Although environmental degradation exacts a social cost that often
exceeds cumulative private gains, economic actors that reap private gains from environmental damage
are reluctant to accept an end to the status quo. Greater recognition of the true value of environmental
5 Relevant knowledge is abundantly represented within FEMISE, the Economic Research Forum in Cairo, the United Nations Environment Programme’s Mediterranean Action Plan Regional Activity Centre (UNEP/MAP/REC), the Arab Forum for Environment and Development, and other organisations.
MED 2012 ≈≈≈ TOWARD GREEN GROWTH IN MEDITERRANEAN COUNTRIES
10
assets is therefore needed to ensure that those assets are optimally—and sustainably—used. Various
institutional arrangements and policy tools are available to address distributional issues, ensure social
equity, and compensate property owners who stand to lose from measures taken to protect
environmental assets for the public good.
Chapter 1. Short-term opportunities to reap co-benefits Case studies of energy efficiency, pollution control, and solid waste management indicate that
combined economic and environmental gains (synergies or “co-benefits”) are within reach in the short
term. These gains exist because the current use of natural resources is highly inefficient, resulting in
unnecessary economic costs and unnecessary environmental degradation. Potential improvements are
as follows.
Enhancing energy efficiency. Greater energy efficiency has positive implications for all sectors.
With the rapid pace of urbanization in the SEMCs, energy efficiency in buildings could also deliver
long-term savings on energy expenditures and environmental benefits. It is also a large potential
source of new jobs. For example, installing energy-efficient shells for new buildings by 2030 would
create an estimated 1.3 million jobs (Plan Bleu 2011). A large share of the inputs would be imported,
but jobs in installation and maintenance are mainly local.
Improving public health through water and air pollution control. Rapid, ongoing urbanization
exacerbates the effects of water and air pollution on human health. Water pollution is particularly
worrisome in the Mediterranean countries, causing chronic shortages and intermittent deliveries of
water for households, industries, and farms. Air-pollution-related health conditions in the SEMCs are
traceable largely to transportation and industrial emissions—as in the developed countries. Lessening
air and water pollution is unlikely to result in massive job creation, but it would raise labour
productivity and protect public health, thereby reducing spending on health care and increasing
demand for other goods and services that contribute to individual and social welfare.
Upgrading solid waste management. Owing to rapid population growth, industrialization, and
urbanization, a 50 per cent increase in waste generation is expected over the next 15 years in the
SEMCs (Sherif 2010). Much of that waste will contain recoverable resources. To handle the
anticipated increase, municipalities will have to find ways to upgrade their waste management
practices. Different strategies are being explored in the SEMCs to improve recovery rates and
generate new revenues, particularly through the Clean Development Mechanism (CDM) and by
charging fees. In the meantime, composting has the potential to generate additional value added
(SWEEP-Net 2010).
Chapter 2. Maximizing the productivity of natural assets while dealing with trade-offs Decision makers face hard choices and trade-offs in the management of freshwater resources, coastal
areas, urban development, and fish stocks. Nevertheless, it does appear possible to improve the
productivity of natural assets while ensuring sustainable development.
Sustainable management of water resources. Agricultural producers throughout the region suffer
from water shortages, and in some areas water stress also affects households, tourism, and
manufacturing. Improving water efficiency in agriculture, which consumes more water than any other
MED 2012 ≈≈≈ TOWARD GREEN GROWTH IN MEDITERRANEAN COUNTRIES
11
sector, can increase output and value-added (and, therefore, food security) while also freeing up water
for other higher-productivity sectors. Technologies to improve efficiency, such as drip irrigation and
fuels made from agricultural by-products, are readily available and do not cost much. Expanding their
use would benefit producers and consumers by cutting costs and raising the international
competiveness of local companies, with concomitant effects on economic growth and employment.
Integrated coastal zone management (ICZM). Rapid urbanization in the SEMCs is both a driver
and a consequence of economic development (World Bank 2009). But it also concentrates people in
narrow and increasingly overcrowded coastal zones, causing urban sprawl to encroach on fertile land
that is already in short supply in many countries. The current pace of urbanization and coastal zone
degradation means that delaying action is costly and likely to result in irreversible change. Upgrading
the management of coastal zones through ICZM—a method for ensuring that coastal resources are
used in a sustainable manner—would help to maximise ecosystem services and revenues from
sustainable tourism. Finding a balance between environmental protection and economic and social
development—without depriving societies of the economic benefits that urbanization delivers through
agglomeration effects—requires that costs and benefits be quantified. Quantification makes it possible
to evaluate individual projects targeted for either protection or development.
Toward sustainable urbanization. The current demographic pressures in the SEMCs, coupled
with environmental degradation, call for a review of traditional approaches to urban development so
that territorial development plans do not remain disconnected from sound environmental policies and
growth-generating programs. In addition to population growth, rural exodus and unemployment are
exacerbating the challenges faced by urban areas. Successful experiences with environmentally
sensitive city planning from around the world suggest that the objectives of inclusive, sustainable, and
resource-efficient urban growth can be achieved in the SEMCs.
Cooperating to make fisheries sustainable. Decades of mismanagement of coastal zones and fish
stocks on the northern shore of the Mediterranean provide lessons for decision makers on the southern
shore, offering them an opportunity to consider a more sustainable path. Overfishing in the southern
and eastern Mediterranean is less severe than in the northern Mediterranean, but some stocks are
already at risk, making immediate action a necessity to avoid irreversible environmental and
economic losses. Preserving threatened environmental assets helps preserve ecosystems, and thus the
jobs and incomes of lower-income households. Downsizing of the fleet should be carried out with a
view to protecting small-scale fisheries and dependent coastal communities. To that end, two
differentiated management regimes could be envisaged, one designed for large-scale fleets (where
capacity adjustment and economic efficiency are the core) and the other targeted at small-scale fleets
in coastal communities (with a focus on social objectives).
Chapter 3. Environmental action and job creation
Over the next two decades, 30 to 40 million new jobs will have to be created to maintain the current
rate of employment in the SEMCs. Much more would be needed to bring these economies to full
employment. Taking steps to reduce environmental degradation and enhance the benefits of natural
assets has the potential, at the country level, to create more new jobs than it destroys.
A tense demographic context and a low rate of job creation. The Mediterranean countries need
millions of new jobs—now and in the years to come. In the SEMCs, around 30 per cent of the
population is under the age of 15. Over the next two decades more than 80 per cent of the new labour

MED 2012 ≈≈≈ TOWARD GREEN GROWTH IN MEDITERRANEAN COUNTRIES
12
force in the Euro-Mediterranean region will be located on the southern shore. Without massive job
creation, social stability is in peril.
Mechanisms of the green impact on economic activities and jobs. Green growth creates jobs—but
it also destroys them. For example, gains in renewable energy may parallel losses in petrochemicals.
Ensuring that more jobs are created than destroyed requires measures to accelerate growth and to
reduce the cost of labour relative to environmental assets (by raising the value of the latter), as well as
robust policies to improve the skills of the workforce. Low-productivity jobs can help reduce
unemployment, but high-productivity jobs promote economic growth over the long term. National
policies can provide incentives inducing a gradual shift toward the balance of skilled and unskilled
jobs that best suits each country.
Jobs and greening: Neither myth nor automatic dividend. The cost of environmental degradation
in the SEMCs is estimated at 3–6 per cent of their average gross domestic product (GDP) each year
(Croitoru and Sarraf 2010; Larsen 2010; EU 2011). Avoiding these losses through policies aimed at
reducing negative environmental effects would stimulate economic activities. Although addressing
environment degradation is not a silver bullet when it comes to reducing unemployment, a positive
impact can be expected if policies are well designed. The Arab Forum for Environment and
Development (AFED) advocates that efficient combinations of public policies, innovative approaches,
business models, green investment opportunities have the potential to produce sizable gains in terms
of job creation and economic benefits (AFED 2011).
Tentative estimates of gross and net job creation. According to preliminary results released by the
Economic and Social Council of the Kingdom of Morocco (CESRM 2012), Morocco has the potential
to create about 100,000 new jobs before 2030 in four sectors affected by green policies: renewable
energies; energy efficiency; sewerage and liquid waste management; and urban solid waste
management. A recent macro-level study of Mediterranean countries (FEMISE 2011b) suggests that
likely net job gains from green growth could be on the order of 10 per cent of the total job creation
required by the region in the next 10 years. While a green growth path is recommended, its efficacy
depends on every policy step taken along the way. A prerequisite for realizing the potential job
creation of green growth is to accompany green policies with complementary actions designed to
tackle structural problems in the labour market.
Chapter 4. “Doing green”: Assessing environmental progress and identifying strengths and priorities in environmental action
A key element in the design of effective green policies is to improve the monitoring of environmental
action. Collecting a multitude of progress indicators and constructing “green national accounts” can
better inform decision makers responsible for setting national and local priorities.
Action-oriented environmental indicators for Mediterranean countries. Monitoring the state of
environmental assets, the impact of economic activities, and the effectiveness of responses aimed at
preventing or addressing environmental degradation is essential for identifying priorities for action.
Such data inform policy makers about areas for progress and reasonable targets, while enabling the
community to identify good practices. Environmental progress can be assessed at the national and
subnational level using a framework devised by the OECD (2011) that relies on indicators of
productivity of environmental resources, the natural asset base, the environmental quality of life,
economic opportunities, and policy responses.
MED 2012 ≈≈≈ TOWARD GREEN GROWTH IN MEDITERRANEAN COUNTRIES
13
Using multicriteria analysis to identify strengths and priorities. The assessment of environmental
performance can be based on a multicriteria method that sorts each country using a series of
indicators. The 2012 MED Report documents existing policy-related indicators of environmental
performance, focusing on a data set covering most Mediterranean countries. The Environmental
Performance Index database (EPI 2010) attempts to sort—among 25 individual indicators—those
related to natural endowments and environmental status and those related to public policy and
environmental action. Although sizable differences related to environmental protection can be
observed across countries, similar weaknesses are apparent across the Mediterranean region,
particularly with respect to air pollution and water management.
Assessing subnational diversity in environmental progress. Considering the wide range of within-
country spatial diversity in socioeconomic and natural conditions in the region, indicators of
environmental status and action have to be collected and monitored at the subnational level. Several
indicators that are particularly relevant in the Mediterranean context display great within-country
variation, in addition to international variation. Identifying areas that offer high social returns requires
taking into account natural constraints and socioeconomic conditions that hamper or facilitate the
implementation of environment-related economic policies.
“Green national accounts” for Mediterranean countries. Green national accounting is an
excellent way to inform policy makers and other stakeholders about the level of the nation’s
environmental effort and the effectiveness of its actions. Considering the level of water stress already
experienced in most areas, constructing so-called water satellite accounts using a consistent national
framework is among the most useful steps to be considered. Because improving energy efficiency has
been identified as a policy option that promises mutually reinforcing economic and environmental
gains, energy satellite accounts are also important.
Chapter 5. Tools for environmental action and the implementation of a green growth agenda
The critical step in shifting to green (or greener) growth is to implement effective tools of
environmental action—in particular fiscal reform, market-based instruments, and incentives for
environmental responsibility. The success stories and best practices of Mediterranean countries can be
replicated or adapted to fit various socioeconomic and environmental settings.
Promoting social equity and economic growth through environmental fiscal reforms. Some of the
financial resources required to implement a green growth agenda can be mobilised by reallocating
public expenditures and introducing environmental fiscal reforms. In particular, phasing out fuel
subsidies, while not necessarily an easy target, introduces the right incentives for producers and
consumers and offers the tantalizing promise of economic growth and job creation through energy
efficiency. Recent experiences in Indonesia, Iran, and Jordan indicate that phasing out fuel subsidies
can be made socially acceptable through a gradual process with a clear road map and a comprehensive
package of compensating measures for lower-income households (IMF 2011a).
Promoting tradable rights and payments for ecosystem services. Market-based instruments—such
as individual or collective transferable quota systems for fisheries, or payment for ecosystems services
in water catchment areas—have been recently introduced on both the northern and southern shores of
the Mediterranean. Experiences in northern Morocco and other areas indicate a potential for the
diffusion of such innovations. Similarly, ICZM that combines regulatory instruments and tradable
MED 2012 ≈≈≈ TOWARD GREEN GROWTH IN MEDITERRANEAN COUNTRIES
14
building rights has been tested in some tourist areas of the Mediterranean. The results point to
promising solutions in situations where potential losers from reforms can be expected to block
progress unless their concerns are taken into account.
Environmental and social responsibility. The role of the private sector in enhancing the economic
benefits of environmental assets could be stimulated by public incentives, both regulatory and fiscal.
In the meantime, environmental responsibility on the part of producers and investors should be
encouraged. Promising policy initiatives are being tried in emerging countries in the Mediterranean
and elsewhere. The time is ripe to launch sustainable stock market indices, national and regional, with
methodological input from the region’s first movers, Egypt and Turkey, and from other regions of the
world.
Changing consumer and producer behaviour: Promoting ecolabels and certification. Environmental regulation is not without cost to consumers and producers. But the perception among
private agents of a trade-off between environmental regulations and profits may be reduced by
policies that produce social and macroeconomic benefits. The increasing popularity of product-
oriented environmental policy in the Mediterranean and elsewhere is based on a perception that the
abatement of pollution from industrial and other large sources is now within reach. Ecolabelling and
product certification can be effective instruments that encourage sustainable consumption by
providing consumers with information about the environmental impact of particular products and
services. Companies are rewarded through public recognition, further encouraging proactive
environmental management.
Chapter 6. Conclusions and call for action Shifting to green growth requires implementing a policy mix that includes many different
components, including price- and market-based mechanisms, but also norms and regulations,
innovation and industrial policies, and investments. Chapter 6 briefly explores some of those
components, identifying several opportunities to test the promise of green growth.
Finally, some guidelines for national green growth strategies are presented. At the regional level,
if the green economy can also be an efficient economy, then the major policies of the Mediterranean
region should develop in that direction: It is urgent, possible, and necessary.
I N T R O D U C T I O N
The Case for a Green Growth Agenda in Mediterranean Countries
≈≈≈ In this chapter
What is green growth about?
Economic performance in southern and eastern Mediterranean countries
The Mediterranean as a hotspot of environmental degradation
Mainstreaming the environment in economic policies
The Arab Spring signals a shift in popular political priorities
toward a new social paradigm of social equity, job creation, and poverty alleviation. In that paradigm, economic progress can
contribute to social stability when it is visible to the population and fairly shared within the society.
In the past decade, the southern and eastern Mediterranean countries (SEMCs) 6 have made
tremendous efforts to increase their openness to trade, investment, and international cooperation.
Despite the economic crisis that hit Europe and the United States at the end of the decade, growth of
gross domestic product (GDP) in the SEMCs was greater than 4 per cent per year on average during
2000–09, nearing the level that would allow the SEMCs to truly converge with their European
neighbours (FEMISE 2011a). But while the decade was one of the best in a very long time from the
perspective of economic integration, most of the progress benefitted an elite closely linked with
politicians and businessmen (Galal 2011). Over time, the gap between the progress seen by the
international community, local politicians, and media and as perceived by the population in their daily
lives gradually broadened, culminating in the events of 2011. Although macroeconomic balances
were kept under control despite the financial crisis and steep increases in the prices of food and
energy, the SEMCs did not succeed in the challenge of creating jobs, or in reducing territorial
disparities within countries.
The challenge now is to put in place a new development model for more inclusive growth while
keeping intact the economic stabilisation accomplished during the previous period. A green growth
agenda could contribute—at least as well as standard growth models—to achieving those objectives
6 The primary focus of this report is on the countries of the southern rim of the Mediterranean from Morocco to Turkey, referred to as the southern and eastern Mediterranean countries (SEMCs).
MED 2012 ≈≈≈ TOWARD GREEN GROWTH IN MEDITERRANEAN COUNTRIES
16
by raising the productivity of natural assets and other production factors while simultaneously
reducing the negative by-products of growth that disproportionately affect the poorest households and
most vulnerable segments of the population.
A close look at the environment-economy nexus sharpens the case for adoption of a green growth
agenda in the SEMCs. On the one hand, the SEMCs need an efficient and focused growth path; on the
other, the current level of environmental degradation hampers economic efficiency, job creation,
growth prospects, and welfare (Croitoru and Sarraf 2010, Larsen 2010). It would appear to be the
perfect time to take action to increase the efficiency of use of natural assets. Unless environmental
protection is built into mainstream economic policies very soon, there is a high risk that
environmental degradation will become irreversible in the SEMCs, causing the loss of some of their
most productive ecosystems. The implications of the loss of ecosystem resilience are particularly
severe in the Mediterranean owing to the combination of unfavourable natural conditions (particularly
chronic water shortage) and socioeconomic constraints related to rapid population growth and
urbanisation.
What is green growth about?
Green growth is a means of increasing the sustainability of economic and social development. It is
based on recognition of the environment as an asset and on the implementation of a set of well-
designed policies that engage and commit stakeholders. Green growth goes beyond specific
environmental goals such as enhancing environmental amenities, controlling air and water pollution,
improving water management, and preserving biodiversity; it also includes climate change mitigation.
Green growth is about the implementation of sustainable development strategies in the short term
(1–2 years) and medium term (5–10 years), focusing on what should be done immediately and over
the next 5–10 years to seize the opportunities that green policies can offer while avoiding irreversible
changes. Green growth also takes into account real-world constraints on sustainable development,
such as regional priorities (notably job creation in the SEMCs), political and social obstacles to
effective collective action, and the need for rapid GDP growth in developing countries. Thus, green
growth policies can be understood as a set of policies that minimise the costs of transitioning to
sustainable growth, offsetting those costs, wherever possible, through direct environmental benefits
and potential economic co-benefits. Environmental management under the green growth scenario
becomes a productive investment, directly comparable to investment in physical capital, by virtue of
including natural assets in the analysis of production processes.
Green growth is about making growth processes more resource efficient, clean, and resilient
without necessarily slowing them. Green growth policies are thus an essential part of implementing
sustainable development (Hallegatte and others 2011). Such policies allow countries to better capture
environmental benefits and to maximise co-benefits—outcomes that are beneficial for the
environment as well as for the economy and for social equity. Therefore, green growth is compatible
with most short- and medium-term national policy objectives.
Green growth seems particularly well adapted to the SEMCs because it consolidates variety of the
region’s issues and solutions related to economic performance and the environment. As an alternative
development model, green growth will modify the distribution of wealth: There will be “winners” and

MED 2012 ≈≈≈ TOWARD GREEN GROWTH IN MEDITERRANEAN COUNTRIES
17
“losers” in the shift to such an agenda. But the people of the SEMCs have clearly demonstrated their
willingness to modify the status quo, and a green agenda appears consistent with the modifications
sought. That coincidence offers an opportunity to shift more easily to green growth than might
otherwise be possible, provided ways can be found to induce potential losers to support rather than
oppose green growth policies.
Although environmental degradation exacts a social cost that far exceeds cumulative private
gains, economic actors that reap private gains from environmental damage are reluctant to accept the
end of the status quo. Various institutional arrangements and policy tools are available to address
distributional issues, ensure social equity, and compensate property owners who stand to lose from
measures taken to protect environmental assets for the public good. At the same time, greater
recognition of the true value of environmental assets is needed to ensure that those assets are
optimally—and sustainably—used.
Economic performance in the SEMCs
To succeed, a green agenda should be based on a solid economic foundation. Before the financial
crisis, the SEMCs performed relatively well economically, with an average real growth rate of around
4.7 per cent during 2000–07. With the advent of deep recessions in the United States and Europe, that
rate decreased to just 3.1 per cent in 2008–09 (FEMISE 2011a and b). Growth picked up in 2010,
with a rate close to 4.9 per cent, suggesting that the SEMCs would return to pre-crisis growth levels.
In fact, the limited financial openness of the SEMCs has protected them from financial turmoil and
will continue to do so, to some extent. In recent years, the SEMCs have followed a significant
opening trend in trade and foreign direct investment (FDI), attracting growing volumes of capital
through a series of reforms to integrate the region into the world economy. That trend has produced
positive spillovers and even an increase in global factor productivity. Since 1995 the simple average
of most-favoured-nation customs duties, for instance, went down from 24 per cent, while the ratio of
trade to GDP increased from 47 to 66 per cent (FEMISE-EIB 2010), and foreign investment flows
multiplied by almost seven times between 2002 and 2008, with continuous improvements in the
business climate and a newly found interest for emerging sectors.
Nevertheless, the SEMC average growth model has some built-in limitations that prevent the
region from catching up more quickly.
First, the model is based mainly on capital accumulation, and before the 2000s, total factor
productivity contributed only marginally to growth. Human capital accumulation, while positive, also
had a limited effect.
Second, the high growth rates in recent years have been accompanied by increasing inflation (an
average regional rate of 8.9 per cent in 2009), mainly because of the SEMCs’ vulnerability to
international food and energy prices. Among the 10 SEMCs, 7 or 8 are net hydrocarbon importers.
Therefore, for the majority of the SEMCs, the rise in oil and food prices could materialise into a loss
of roughly 3 per cent of GDP (IMF 2011b). Higher inflation rates have been sustained by
expansionary fiscal policies aimed at trying to protect the population from the international crisis—
with only limited success.
MED 2012 ≈≈≈ TOWARD GREEN GROWTH IN MEDITERRANEAN COUNTRIES
18
Third, the SEMCs generally have failed to spread the benefits of growth throughout their
societies. While poverty remains lower than in many regions (less than 20 per cent of the population
was living below the $2-a-day poverty line in 2005), a large share of the population is close to the
poverty line, making them vulnerable to any external shock. The 2007–08 increase in commodity
prices produced an uptick in poverty in most countries of the region (World Bank 2009b). Inequalities
have grown during the recent economic turmoil, and the countries of the region suffer from an
asymmetry in poverty changes over high- and low-growth periods: recessions have larger negative
effects on poverty than the positive effects of periods of high growth because of the unequal
distribution of gains from growth (World Bank 2010b).
Fourth, the SEMCs lack strong social safeguards. Social protection systems have been highly
fragmented, with poor management of resources and varying coverage. They cover a small portion of
the population. Workers in the informal sector and in rural areas lack meaningful protection (FEMISE
2009), even though the ratios of social-protection spending to GDP (and government revenue) are
quite high. The inefficiency of the system stems from poor allocations of expenditures. In fact, most
social safety nets in the region are subsidy schemes, which exert continuous pressure on the fiscal
budget. Such schemes generally benefit the rich more than the poor and suffer from considerable
leakages (World Bank 2010b).
Fifth, budgets in the SEMC countries have always been under pressure, a trend that will only
worsen. During the 2000–07 period, the average fiscal deficit was 4.4 per cent of GDP. Fiscal
imbalances jumped on average to more than 5.1 per cent of GDP in 2010 and are expected to increase
to 6.7 per cent in 2011. To date, despite the international crisis, external debt remains under control.
In 2010 it averaged 52.4 per cent of GDP and is expected to increase slightly to 53.6 per cent of GDP
in 2011. The SEMCs have used a share of their past growth to clear debts (FEMISE 2009). Their
external debt follows the same path and will stay within the limits of 30–35 per cent of GDP.
Sixth, the SEMCs are undergoing a demographic transition characterised by rapid increases in the
total population and potential workforce. The SEMCs’ populations are young: almost one SEMC
resident in three is under 15 years of age. This means that more than 80 million young people will be
competing to enter the formal labour market over the next 20 years and that the SEMCs must attain
job-creation rates higher than the growth rate of the working-age population. In fact they were able to
do just that for a few years in the mid-2000s but not since 2007; the negative trend may persist with
the international crisis. It is expected, for instance, that the number of jobs in the region will increase
by about 2.2 per cent, while the working-age population will increase by 2.7 per cent per year over the
next two decades. Even in the 2000s, with an average annual growth rate of 4.5–5.5 per cent, the
SEMCs were not able to make significant progress in the labour participation rate (on average less
than 50 per cent) or the unemployment rate (on average above 10 per cent, but 25 per cent among
those aged 15–24 years; FEMISE 2011a).
The Mediterranean as a hotspot of environmental degradation
The Mediterranean region is a study in environmental contrasts. Although real progress has been
made on reducing pollution in the Mediterranean Sea and preserving biodiversity, a great deal
remains to be done to properly manage scarce water and energy resources and to mitigate the effects
of climate change.
MED 2012 ≈≈≈ TOWARD GREEN GROWTH IN MEDITERRANEAN COUNTRIES
19
First, the region has to deal with constrained resources. The main issue on this front concerns
water. The region is affected by water shortages, both acute and chronic. On average, the SEMCs’
inhabitants enjoy less than 1,000 cubic meters (m3) of water per year per capita, and 80 million face
water shortages (less than 500 m3/capita/year). Where the deficit is greatest, people resort to so-called
nonconventional water resources, such as reusing wastewater and desalinisation. Demand for water
has doubled in the past 50 years, with agriculture remaining the top consumer. Diversions, leaks, and
waste (particularly in agriculture) still represent nearly 40 per cent of total demand for water. To meet
growing demand, countries are increasing their exploitation of non renewable water sources (16
km3/year for the entire region) thereby aggravating the already serious problem of salinization. In this
context, economic instruments are expected to optimise the allocation and use of a scarce and
unevenly distributed resource. Forests and soils may be regarded as other constrained resources.
Historically marked by forests and open grazing areas, the terrestrial ecosystems of the Mediterranean
have seen, in the north, a more or less vigorous return of wooded areas as marginal agricultural and
grazing areas are abandoned and as reforestation campaigns have taken effect. In the SEMC region,
by contrast, pressures on ecosystems remain very strong, particularly in the Maghreb, owing to the
clearing of marginal land for cultivation, overharvesting of wood, and overgrazing. The traditional
uses for wooded areas and pastures (wood for fuel, grazing), while increasingly outdated in the north,
remain essential in the SEMCs. Meanwhile, these areas are increasingly recognised as local and
global public goods, essential for the protection of soils and water, for combating erosion and
desertification, for absorbing greenhouse gases, and for maintaining biodiversity among animals and
plants. But they are regularly ravaged by fire. In the north, the growing incidence of fire touched
600,000 hectares in 2007, entailing costly prevention and containment efforts. Elsewhere in the
region, the incidence of fire is lower, but growing (61,000 hectares in the south in 2005; 80,000
hectares in the east in 2007). The risk of fire increases as grazing recedes and brush grows up on
pastureland. It will only increase as the climate changes and dry seasons become longer—and even
drier.
Second, the land itself is in transition. Coastal zones and cities have to share priorities. The pride
of the Mediterranean, its coasts, host an immense natural, cultural, and economic endowment, as well
as daunting pressures—chief among them being telluric and marine pollution, urbanisation, fishing,
aquaculture, tourism, resource extraction, and invasive marine species. Coastal zones shelter two
remarkable ecosystems: aquatic habitats for magnoliophyta (such as Posidonia, a key Mediterranean
ecosystem) and coralligenous assemblages. It is notable that the Mediterranean contains 7–8 per cent
of all known marine species in a sea that represents just 0.8 per cent of the world’s oceans. That
biodiversity is concentrated in the western basin and in shallow waters (0–50 metres deep). Forty per
cent of the Mediterranean coastline has been built up and is occupied. Urbanisation is accelerating:
two out of three inhabitants of the region live in urban areas. More than half of urban dwellers live in
towns and small cities of fewer than 300,000 inhabitants. These urbanised or semi-urbanised spaces
are characterised by a dispersion of population and employment and by a twin trend toward peri-
urbanisation and metropolitanisation over ever-greater expanses. The historical vulnerability of
Mediterranean cities to meteorological accidents, earthquakes, and coastal erosion will be aggravated
by these changes—and by the effects of climate change.
Third, the region has begun to suffer from specific pollution leading to specific issues. The World
Health Organization (WHO) in 2006 indicated a strong impact of environment degradation on the
burden of disease and above-average impacts in the region’s most populous countries. Those negative
impacts on health translate into economic development issues as they affect labour productivity and
MED 2012 ≈≈≈ TOWARD GREEN GROWTH IN MEDITERRANEAN COUNTRIES
20
government expenditures. According to the WHO, water quality and air pollution are the main
challenges. On a positive note, the heavy metal content of seawater is low and appears to be getting
even lower. Eutrophication linked to fertilizer runoff, having risen over the past 20 years, remains
confined to certain areas such as the northern Adriatic, the Gulf of Lion, and the Nile Delta. On the
other hand, local marine pollution created by cities, industries, and tourist resorts is considerable.
Large quantities of macro-waste have been detected on beaches and in the high sea. On another front,
in the SEMCs access to sanitation and purification of wastewater lag behind access to potable water,
but the situation in the region is much better than the world average. Since the 1990s, with support
from regional and international sources, large investments have been made in the SEMCs. As yet,
however, not all wastewater has been treated and purified. With the exception of Morocco, where
more than 80 per cent of collected wastewater is treated, the SEMCs still lack adequate treatment
facilities.
The lack of sanitation and water-treatment infrastructure degrades the quality of water and other
resources and makes it more difficult to supply clean water. Air quality is often a concern in major
cities in the SEMCs. Inhabitants are more exposed to outdoor urban or industrial air pollution than to
indoor air pollution. Again, the urbanisation trend will reinforce the air pollution impact unless strong
actions are taken. Waste constitutes one of the most serious pressures on the environment. Closely
correlated with the level of economic development and associated changes in consumption and
production, quantities of waste products have risen steadily. The organic composition of waste is
dropping, while the share composed of materials with a high heat potential is rising quickly, owing to
increases in packaging. With regard to toxicity, technological advances have made it possible to
reduce the use of some substances (such as heavy metals) that still pose health risks, often because
specialised systems to trap them have not been developed (as in the case of small household
appliances). Systems of treatment and elimination using methods calibrated to particular waste
sources continue in the north and are beginning in the south, through advances in recycling and the
recovery of valuable materials.
Fourth, the region is a hotspot of climate change consequences (Plan Bleu 2010). Since 1970,
temperatures in south-western Europe (the Iberian peninsula and southwest France) have risen by
about 2°C, a rise also detected in North Africa. Changes in patterns of rainfall are already perceptible,
with drops of nearly 20 per cent detected in some areas of southern Europe. Climate change is likely
to affect the Mediterranean environment in the following ways:
• The water cycle will change with increases in evaporation rates and decreases in precipitation.
Substantial reduction in flow is expected for the Rhone, Po, and Ebre. The water question is central to the problem of sustainable development in the region because:
− Soil composition will suffer from advancing desertification.
− Terrestrial and marine ecosystems will change. Some species will move north or to
higher ground, while less mobile and more sensitive species become extinct and new
species take their places. The sea bottom will gradually become warmer, and low-lying shorelines will be inundated, hastening the erosion of cliffs and beaches.
− Forests will become more vulnerable to fires and pests. These changes will affect human
activities, particularly agriculture and fishing (reduction in yields and catches), tourism
(heat waves, water scarcity affecting tourist areas), coastal zones and infrastructure
(increased exposure to waves, coastal storms, and other extreme weather events;
MED 2012 ≈≈≈ TOWARD GREEN GROWTH IN MEDITERRANEAN COUNTRIES
21
advancing salinization; shrinking volumes of groundwater; intrusion of seawater into aquifers), and human health (heat waves).
Fifth, some essential Mediterranean economic activities reinforce the vulnerability of the SEMCs
to environmental degradation, in particular, agriculture, fisheries, and tourism. Mediterranean
agriculture is largely rain fed and strongly affected by soil and water conditions. The greatest
productivity gains over the past 40 years have been achieved in irrigated areas, which have more than
doubled during this period. Farming practices, meanwhile, have also changed to maximise yields,
notably through specialisation and intensification of crops. These improvements have been
accompanied by increases in the use of fertilizers and pesticides. Alongside this evolution, organic
farming has developed in a heterogeneous fashion, primarily in the north (led by Italy and Slovenia).
Despite progress on several fronts, the SEMCs’ food dependency has only grown. Water scarcity and
the exhaustion of arable land, aggravated by climate change, are likely to continue to affect the
region’s agriculture. Tourism is essential for every country that borders the Mediterranean Sea. Lying
at the crossroads of three continents, the countries of the region account for nearly 30 per cent of all
international tourist arrivals, though their share has shrunk in recent years with unrest in the region
and the growth of tourism elsewhere. A key source of jobs and foreign exchange, international
tourism contributes mightily to the economic development of host countries. But countries in which it
is the leading sector of the economy are highly vulnerable to dips in tourist activity. Airplanes and
automobiles, the two main forms of transportation for tourists, contribute significantly to atmospheric
pollution. And the seasonal nature and geographic concentration of tourism accentuates its
environmental impact and puts pressure on water resources (leading to conflicts among users), natural
environments (development of the coasts), and waste management. Inland from the coasts, tourism
has been slow to develop.
Mainstreaming the environment in economic policies
The specific combination of socioeconomic and environmental constraints just described indicates a
sense of urgency, but also a favourable time to make changes. Making the case for adopting a green
growth agenda in Mediterranean countries —that is, a set of actions aimed at enhancing the economic
benefits of environmental assets—requires analysing the channels by which efficient environmental
preservation leads to a high-growth path. This report begins by exploring case studies suggesting that
the co-benefits of economic and environmental gains are within reach in a number of sectors, while
decision makers face hard choices in other areas. Short-term double-dividend opportunities, for
example, are identified in relation to energy efficiency, pollution control, and solid waste management
(chapter 1). Decision makers have to deal with trade-offs in the management of freshwater resources,
coastal areas, urban development, and fish stocks; that said, it seems possible to improve the
productivity of natural assets while ensuring sustainable development (chapter 2). Taking steps to
reduce environmental degradation and enhance the benefits from natural assets can result in sizable
net job creation or preservation of existing jobs in various sectors, and in net country-level job
creation (chapter 3). One key element of designing effective green policies is to improve the
monitoring of environmental actions. Collecting a large array of progress indicators and constructing
green national accounts can better inform decision makers in the setting of national and local
priorities (chapter 4). Mediterranean countries are currently experimenting with a variety of tools for
shifting to green growth, including fiscal reform, the promotion of market-based instruments, and
MED 2012 ≈≈≈ TOWARD GREEN GROWTH IN MEDITERRANEAN COUNTRIES
22
incentives for environmental responsibility. Success stories and best practices can be replicated or
adapted to fit a variety of socioeconomic and environmental settings (chapter 5). The report’s
conclusion proposes that a set of mutually reinforcing policies along the four main axes is required for
a shift toward green growth, involving action at both the national and regional level.
C H A P T E R O N E
Short-Term Opportunities for Co-Benefits
≈≈≈
In this chapter
Enhancing energy efficiency
Enhancing public health by reducing air and water pollution
Upgrading solid waste management and resource efficiency
Case studies on the key sectors of energy efficiency, pollution control, and solid waste management indicate that there is low-hanging fruit within reach. Genuine opportunities to achieve co-benefits exist—that is, actions that can yield positive outcomes for both the environment and economic performance. In most cases, some tangible results could be obtained even in the short term, within one to two years, in local experiments. Such outcomes could be expected to spur the dissemination of best practices and to consolidate and generalise positive results at the country level.
Enhancing energy efficiency
The aim of this section is to demonstrate that investing in energy efficiency is a win-win proposition.
It is good for the environment, it produces a good return on investment (ROI), and it creates jobs.
Faced with growing concerns about the possible consequences of climate change, mitigation and
adjustment have become policy buzzwords. There are many issues and challenges, and actions must
be implemented on a very tight timetable, given the warnings issued by the scientific community. To
be effective, responses must reflect solidarity between the richest and the most vulnerable countries.
Strategies and action plans must focus on the most energy-consuming sectors, marshalling technology
to achieve energy savings and reduce greenhouse gas emissions.
Mediterranean countries, located in an area considered as a hotspot of climate change, are
especially vulnerable. The region’s population could reach 360 million inhabitants by 2030, and
primary energy could rise by 50 per cent. In addition, the rapidly increasing energy dependence of the
southern and eastern Mediterranean countries (SEMCs) makes it necessary to anticipate heavy
MED 2012 ≈≈≈ TOWARD GREEN GROWTH IN MEDITERRANEAN COUNTRIES
24
investments on the supply side (in renewable energy) and to take bold steps on the demand side
(reducing energy consumption).
The SEMCs are experiencing rapid urbanisation (over three-quarters of the population in the
SEMCs will live in urban areas by 2030) and massive demand for housing. By 2030 experts predict a
need for nearly 42 million additional housing units.
Buildings are the leading consumer of electricity and the second-highest consumer of fossil fuels
(after transportation). The stakes are high in the building sector because both demand (energy
efficiency) and supply (integration of renewables) play a role in improving the situation. Globally, it
is estimated that the potential energy savings in this sector are as high as 40 per cent through actions
that are already economically viable.
With support from the European Investment Bank (EIB), Plan Bleu produced a study that
provides an overview of the construction sector in the SEMCs and analyses what could or should be
its place in the context of ambitious policies for the control of energy demand. While the
recommendations may apply to the entire construction sector, this report focuses on the residential
sector (70 per cent of carbon dioxide [CO2] emissions and 27 per cent of energy consumption can be
traced to housing) and especially on new residential housing in the formal sector. Regulatory actions
and technical and financial resources for existing buildings and for the informal sector should be
further investigated.
The potential for energy savings in the construction sector has not been exploited at fair value,
and recent construction practices, based on international standards, are unsuited in most cases to the
climate of the SEMCs. In many cases, to be reasonably comfortable, occupants must invest in
equipment such as heaters and air conditioners—which are expensive for consumers and society.
Beyond the specificities of the SEMCs, the barriers to action as well as the gains to be had are
quite similar to what we can see at the European and global levels. Therefore, the transfer of
knowledge and skills through North–South and South–South partnerships should be encouraged in all
its forms.
Plan Bleu’s analysis of the best practices adopted by Mediterranean countries and of the
mechanisms that might permit generalisation of those practices to the SEMCs has gelled into two
scenarios. The first is the trend, or reference, scenario. The second, the breakout scenario, takes into
account the implementation of proactive policies to control energy demand and integrate renewable
energy into current supplies. Plan Bleu also conducted a complementary study to assess the job
content of the breakout scenario.
The breakout scenario is deliberately ambitious to take into account the above-mentioned stakes.
It involves a high number of jobs created compared with other studies. The difference is almost
entirely explained by the fact that in the Plan Bleu breakout scenario, investments in energy efficiency
are huge. The ratio of jobs created per unit of investment is about the same as in other studies: about
10 jobs created for every €1 million invested.
Measures envisioned in the breakout scenario The energy-efficiency measures envisioned in the breakout scenario, corresponding to use of the most
mature technologies in the SEMCs, are as follows:
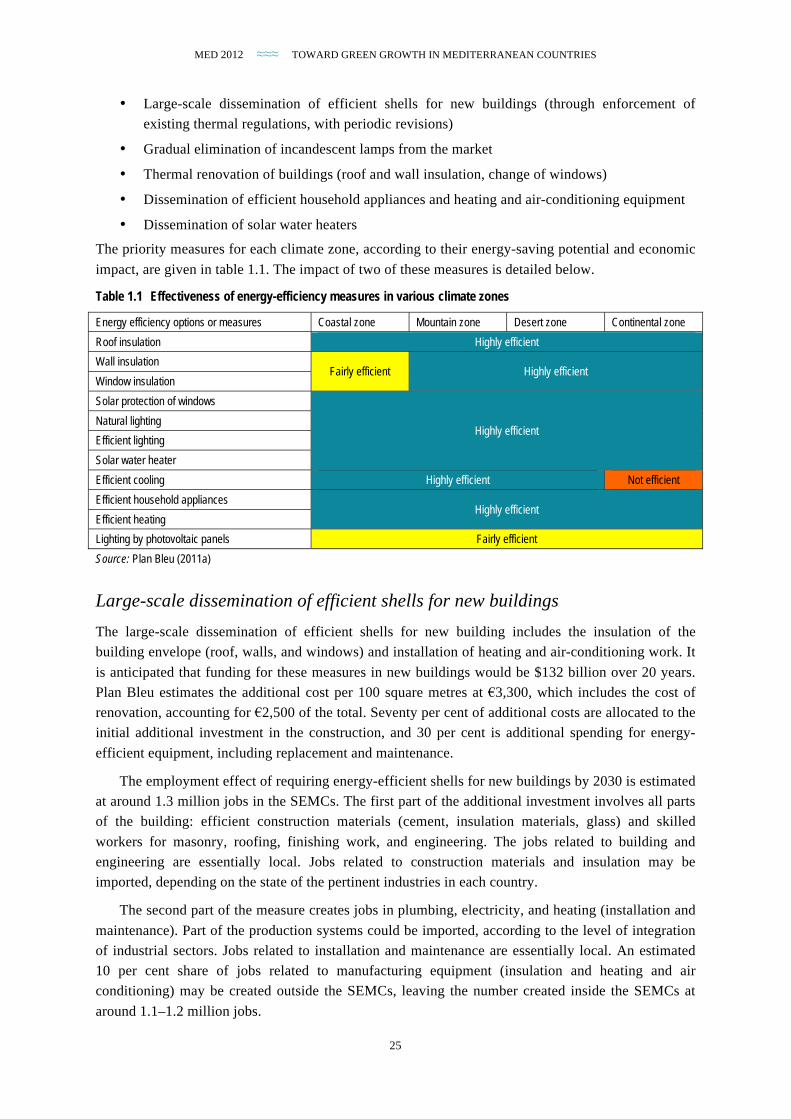
MED 2012 ≈≈≈ TOWARD GREEN GROWTH IN MEDITERRANEAN COUNTRIES
25
• Large-scale dissemination of efficient shells for new buildings (through enforcement of
existing thermal regulations, with periodic revisions)
• Gradual elimination of incandescent lamps from the market
• Thermal renovation of buildings (roof and wall insulation, change of windows)
• Dissemination of efficient household appliances and heating and air-conditioning equipment
• Dissemination of solar water heaters
The priority measures for each climate zone, according to their energy-saving potential and economic
impact, are given in table 1.1. The impact of two of these measures is detailed below.
Table 1.1 Effectiveness of energy-efficiency measures in various climate zones
Energy efficiency options or measures Coastal zone Mountain zone Desert zone Continental zone
Roof insulation Highly efficient
Wall insulation Fairly efficient Highly efficient
Window insulation
Solar protection of windows
Highly efficient Natural lighting
Efficient lighting
Solar water heater
Efficient cooling Highly efficient Not efficient
Efficient household appliances Highly efficient
Efficient heating
Lighting by photovoltaic panels Fairly efficient
Source: Plan Bleu (2011a)
Large-scale dissemination of efficient shells for new buildings The large-scale dissemination of efficient shells for new building includes the insulation of the
building envelope (roof, walls, and windows) and installation of heating and air-conditioning work. It
is anticipated that funding for these measures in new buildings would be $132 billion over 20 years.
Plan Bleu estimates the additional cost per 100 square metres at €3,300, which includes the cost of
renovation, accounting for €2,500 of the total. Seventy per cent of additional costs are allocated to the
initial additional investment in the construction, and 30 per cent is additional spending for energy-
efficient equipment, including replacement and maintenance.
The employment effect of requiring energy-efficient shells for new buildings by 2030 is estimated
at around 1.3 million jobs in the SEMCs. The first part of the additional investment involves all parts
of the building: efficient construction materials (cement, insulation materials, glass) and skilled
workers for masonry, roofing, finishing work, and engineering. The jobs related to building and
engineering are essentially local. Jobs related to construction materials and insulation may be
imported, depending on the state of the pertinent industries in each country.
The second part of the measure creates jobs in plumbing, electricity, and heating (installation and
maintenance). Part of the production systems could be imported, according to the level of integration
of industrial sectors. Jobs related to installation and maintenance are essentially local. An estimated
10 per cent share of jobs related to manufacturing equipment (insulation and heating and air
conditioning) may be created outside the SEMCs, leaving the number created inside the SEMCs at
around 1.1–1.2 million jobs.

MED 2012 ≈≈≈ TOWARD GREEN GROWTH IN MEDITERRANEAN COUNTRIES
26
Thermal renovation of buildings
The second component—for equipment and maintenance—focuses primarily on the insulation of
walls, roofs, and windows. It is anticipated that implementing these measures in new buildings will
cost €49 billion over 20 years. The existing housing stock is composed mainly of family housing, and
the additional costs for existing housing will be lower than for new housing. In addition, Plan Bleu
estimates that the rate of replacement of single windows with double-glazed windows will be low in
coastal areas, driving up costs for a 100 square-metre home to €2,500.
Table 1.2 Employment potential associated with thermal renovation of buildings in 2030 (Syndex estimate)
Universal adoption of efficient
shells for new buildings of which, from initial additional
investment
of which, from additional investment in energy efficient
equipment
Total jobs created by 2030 1,384,680 933,240 451,440
Algeria 349,317 235,431 113,886
Egypt 390,228 263,004 127,224
Israel 36,715 24,745 11,970
Jordan 23,078 15,554 7,524
Lebanon 16,784 11,312 5,472
Morocco 158,399 106,757 51,642
Syria 100,704 67,872 32,832
Palestine 22,029 14,847 7,182
Tunisia 12,588 8,484 4,104
Turkey 421,698 284,214 137,484
Libya 31,470 21,210 10,260
Source: Plan Bleu (2011a).
These figures assume that the renovations are done by skilled tradesmen. These jobs are local;
however, equipment manufacturing (insulation, glass, wood, windows, and so on) may be imported.
Finally, the combination of the five breakout measures may create 2.9 million jobs in the SEMCs
by 2030. These estimates take into account informal jobs and relate to gross creation—that is, they do
not take into account the displacement or destruction of jobs. These new jobs are also conditioned on
the implementation of industrial policies that promote local production of materials and equipment
necessary for efficient housing. Given the productivity increase in sectors, job creation may be greater
in the early years and lesser in the end.
Improving public health by reducing air and water pollution The rapid, ongoing process of urbanisation exacerbates the health impacts of water and air pollution.
Water pollution is particularly worrying in the Mediterranean countries due to freshwater stress,
resulting in intermittent delivery and/or chronic shortages. Air-pollution-related health conditions in
the SEMCs are mostly related to transportation and industrial emissions, and are, therefore, of a
similar nature as in developed countries.
Health is a human right that has both an individual and a macroeconomic impact. In addition to
the direct cost for the society in terms of social expenditures, pathologies related to environmental
MED 2012 ≈≈≈ TOWARD GREEN GROWTH IN MEDITERRANEAN COUNTRIES
27
factors affect labour productivity; both result in short- and long-term losses that are an impediment to
economic development. Acting to decrease the burden of environment degradation on health will have
direct economic outcomes.
Analysis based on individual data can inform decision makers in the design of micro-level actions
(with comparatively low cost) that could target the population most affected by the environmental
burden of disease. The bottom-up approach and household surveys are efficient tools to reach such an
objective.
The burden of environment-related disease on economic growth and social equity
The World Health Organization (WHO) (Prüss-Üstün and Corvalán 2006) shows that environmental
degradation impacts the burden of disease and its unequal distribution among developing and
developed countries. Several SEMCs perform poorly compared to countries in other regions with
comparable per capita income. According to the WHO data, the most populated Mediterranean
countries are affected by above-average negative impacts.
On average at the global level, 17 per cent of deaths are due to environmental factors in
developed countries, but the figure rises to 25 per cent in developing countries. Children are the most
vulnerable, with environmental factors accounting for 36 per cent of their deaths. The number of
healthy life years lost to environmental risk factors per capita was about five times greater in children
under 5 years of age than in the total population. The total number of healthy life years lost per capita
as a result of environmental factors per capita is 15 times higher in developing countries than in
developed countries. In the SEMCs, too, the environmental burden of disease falls disproportionately
on children and adults from lower-income households. These circumstances affect economic
development prospects and social equity through: (i) reduced labour productivity, (ii) reduced female
workforce participation, (iii) defensive expenditures reducing the purchasing power of lower-income
households and therefore the demand for nonbasic foodstuffs and other superior goods and services,
and (iv) defensive government expenditures for preventive and curative public health.
The WHO (Prüss-Üstün and Corvalán 2006) identifies diarrhoea and lower respiratory infections
as the two groups of diseases with the largest absolute burden attributable to modifiable
environmental factors, which put issues of water and air quality on the forefront. Environmental
contributions to diarrhoea and lower respiratory infections account for around 4 per cent and 3.5 per
cent of the disability-adjusted life year (DALY), respectively, at the global level. While
environmental factors explain around half of the DALY for respiratory diseases, the burden of disease
is almost exclusively environmental for diarrhoea.
Diseases related to water pollution
Information available for a number of SEMCs indicates that a sizable share of the population lacks
either access to piped water, or a sewage connection, or both (table 1.3). This statistic has not only a
human cost but also an economic one. World Bank studies have estimated the cost of water pollution
among the SEMCs at 0.6 per cent of gross domestic product (GDP) in Tunisia, 0.8 per cent in Algeria
and Jordan, 1.23 per cent in Morocco, and 1.02 per cent in Lebanon in 2000. The cost of air pollution
was estimated at 1.2 per cent of the GDP in Jordan, 2.1 per cent in Egypt, 1.02 per cent in Lebanon,
0.94 per cent in Algeria in 2002, and 1.03 per cent in Morocco (Croitoru and Sarraf 2010; METAP
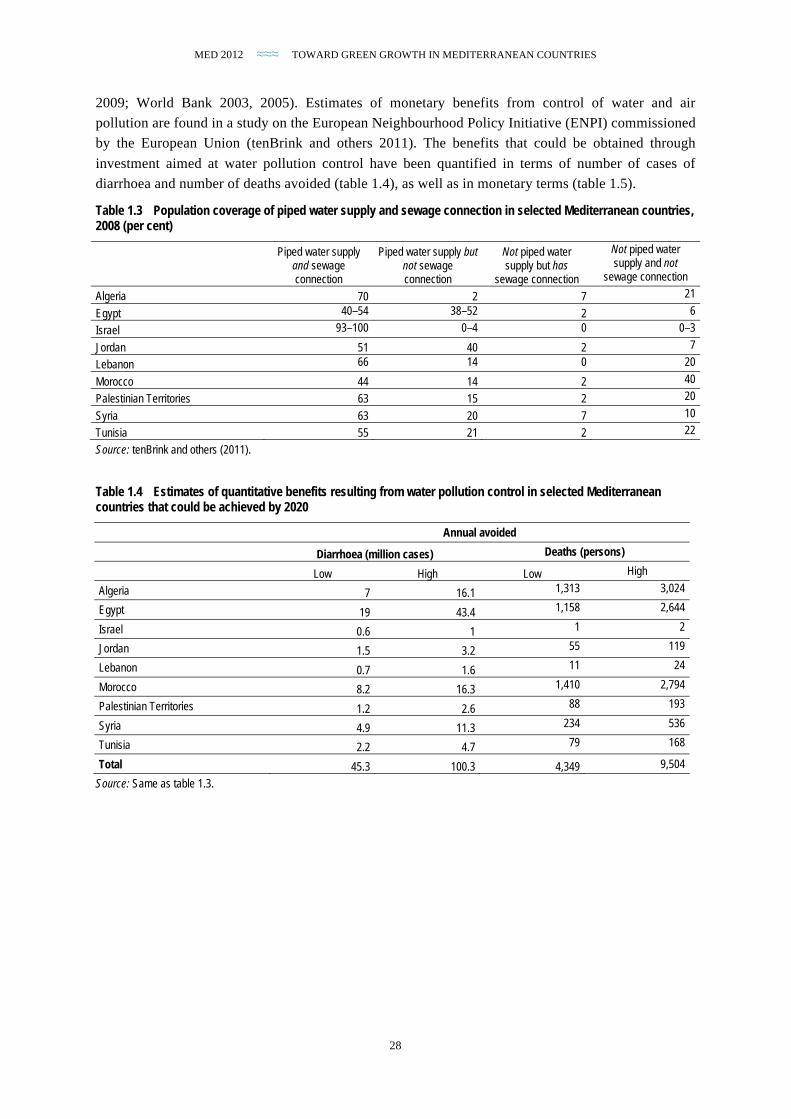
MED 2012 ≈≈≈ TOWARD GREEN GROWTH IN MEDITERRANEAN COUNTRIES
28
2009; World Bank 2003, 2005). Estimates of monetary benefits from control of water and air
pollution are found in a study on the European Neighbourhood Policy Initiative (ENPI) commissioned
by the European Union (tenBrink and others 2011). The benefits that could be obtained through
investment aimed at water pollution control have been quantified in terms of number of cases of
diarrhoea and number of deaths avoided (table 1.4), as well as in monetary terms (table 1.5).
Table 1.3 Population coverage of piped water supply and sewage connection in selected Mediterranean countries, 2008 (per cent)
Piped water supply and sewage connection
Piped water supply but not sewage connection
Not piped water supply but has
sewage connection
Not piped water supply and not
sewage connection Algeria 70 2 7 21
Egypt 40–54 38–52 2 6
Israel 93–100 0–4 0 0–3
Jordan 51 40 2 7
Lebanon 66 14 0 20
Morocco 44 14 2 40
Palestinian Territories 63 15 2 20
Syria 63 20 7 10
Tunisia 55 21 2 22
Source: tenBrink and others (2011).
Table 1.4 Estimates of quantitative benefits resulting from water pollution control in selected Mediterranean countries that could be achieved by 2020
Annual avoided
Diarrhoea (million cases) Deaths (persons)
Low High Low High
Algeria 7 16.1 1,313 3,024
Egypt 19 43.4 1,158 2,644
Israel 0.6 1 1 2
Jordan 1.5 3.2 55 119
Lebanon 0.7 1.6 11 24
Morocco 8.2 16.3 1,410 2,794
Palestinian Territories 1.2 2.6 88 193
Syria 4.9 11.3 234 536
Tunisia 2.2 4.7 79 168
Total 45.3 100.3 4,349 9,504
Source: Same as table 1.3.
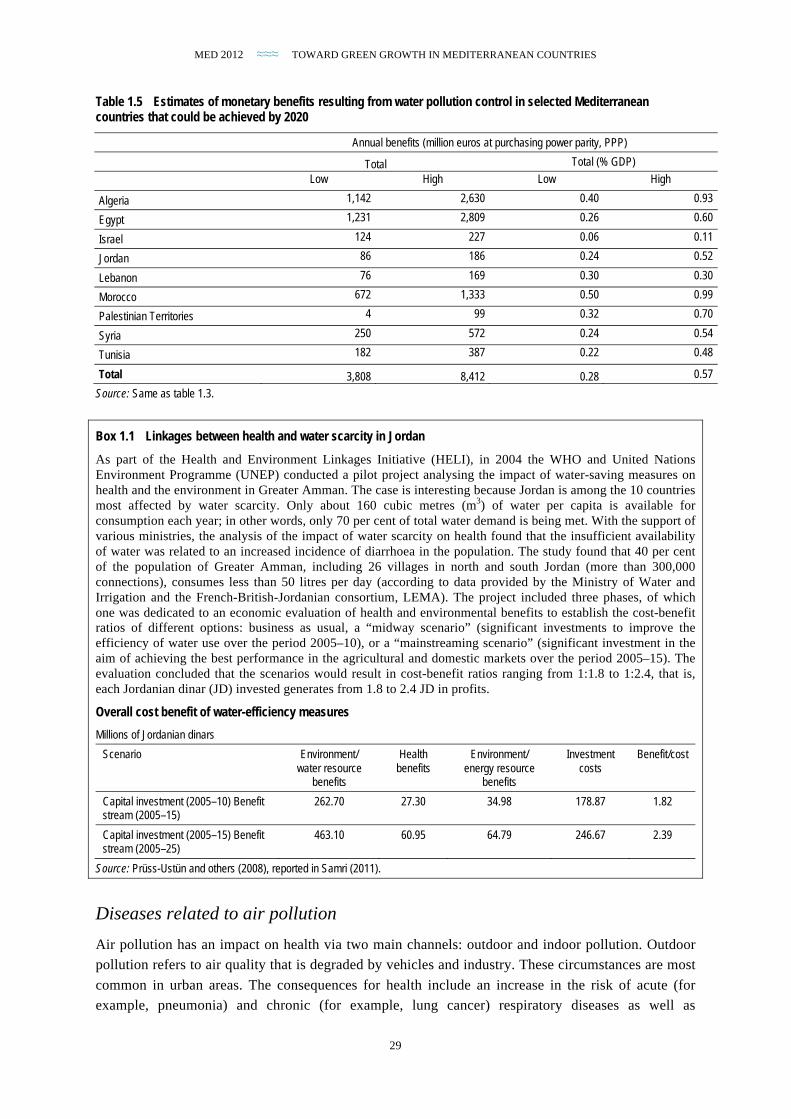
MED 2012 ≈≈≈ TOWARD GREEN GROWTH IN MEDITERRANEAN COUNTRIES
29
Table 1.5 Estimates of monetary benefits resulting from water pollution control in selected Mediterranean countries that could be achieved by 2020
Annual benefits (million euros at purchasing power parity, PPP)
Total Total (% GDP)
Low High Low High
Algeria 1,142 2,630 0.40 0.93
Egypt 1,231 2,809 0.26 0.60
Israel 124 227 0.06 0.11
Jordan 86 186 0.24 0.52
Lebanon 76 169 0.30 0.30
Morocco 672 1,333 0.50 0.99
Palestinian Territories 4 99 0.32 0.70
Syria 250 572 0.24 0.54
Tunisia 182 387 0.22 0.48
Total 3,808 8,412 0.28 0.57
Source: Same as table 1.3.
Box 1.1 Linkages between health and water scarcity in Jordan
As part of the Health and Environment Linkages Initiative (HELI), in 2004 the WHO and United Nations Environment Programme (UNEP) conducted a pilot project analysing the impact of water-saving measures on health and the environment in Greater Amman. The case is interesting because Jordan is among the 10 countries most affected by water scarcity. Only about 160 cubic metres (m3) of water per capita is available for consumption each year; in other words, only 70 per cent of total water demand is being met. With the support of various ministries, the analysis of the impact of water scarcity on health found that the insufficient availability of water was related to an increased incidence of diarrhoea in the population. The study found that 40 per cent of the population of Greater Amman, including 26 villages in north and south Jordan (more than 300,000 connections), consumes less than 50 litres per day (according to data provided by the Ministry of Water and Irrigation and the French-British-Jordanian consortium, LEMA). The project included three phases, of which one was dedicated to an economic evaluation of health and environmental benefits to establish the cost-benefit ratios of different options: business as usual, a “midway scenario” (significant investments to improve the efficiency of water use over the period 2005–10), or a “mainstreaming scenario” (significant investment in the aim of achieving the best performance in the agricultural and domestic markets over the period 2005–15). The evaluation concluded that the scenarios would result in cost-benefit ratios ranging from 1:1.8 to 1:2.4, that is, each Jordanian dinar (JD) invested generates from 1.8 to 2.4 JD in profits.
Overall cost benefit of water-efficiency measures
Millions of Jordanian dinars
Scenario Environment/ water resource
benefits
Health benefits
Environment/ energy resource
benefits
Investment costs
Benefit/cost
Capital investment (2005–10) Benefit stream (2005–15)
262.70 27.30 34.98 178.87 1.82
Capital investment (2005–15) Benefit stream (2005–25)
463.10 60.95 64.79 246.67 2.39
Source: Prüss-Ustün and others (2008), reported in Samri (2011).
Diseases related to air pollution Air pollution has an impact on health via two main channels: outdoor and indoor pollution. Outdoor
pollution refers to air quality that is degraded by vehicles and industry. These circumstances are most
common in urban areas. The consequences for health include an increase in the risk of acute (for
example, pneumonia) and chronic (for example, lung cancer) respiratory diseases as well as
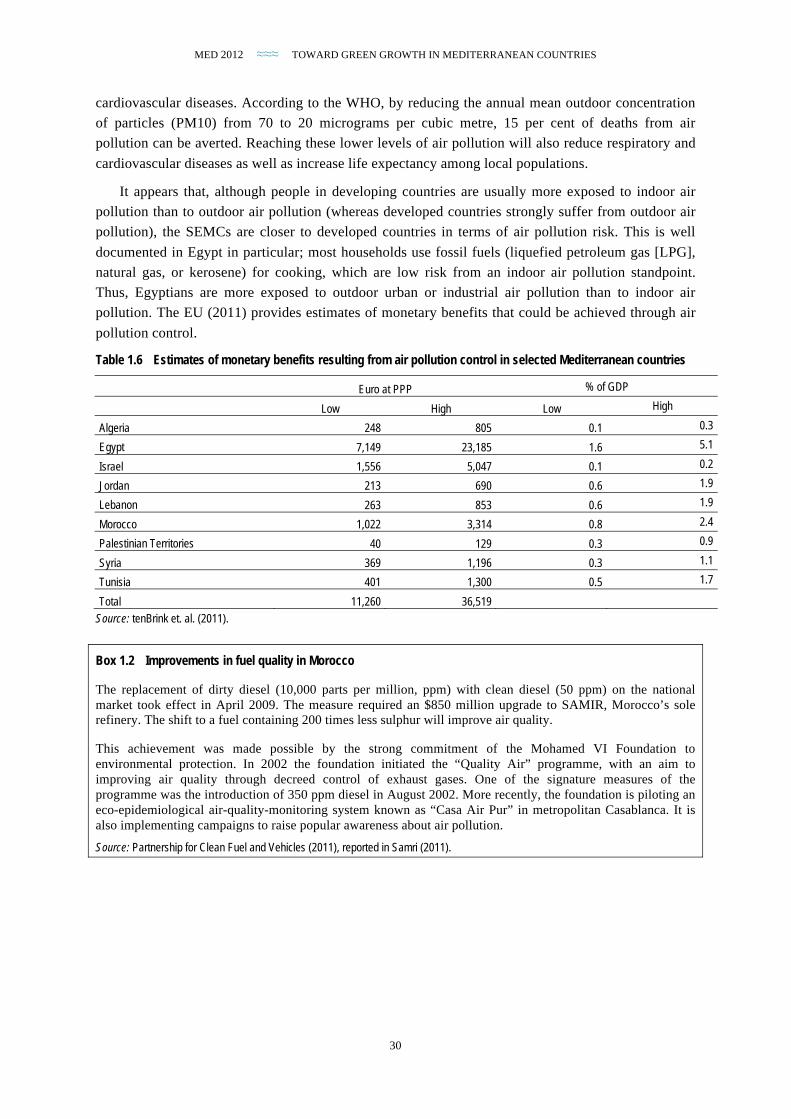
MED 2012 ≈≈≈ TOWARD GREEN GROWTH IN MEDITERRANEAN COUNTRIES
30
cardiovascular diseases. According to the WHO, by reducing the annual mean outdoor concentration
of particles (PM10) from 70 to 20 micrograms per cubic metre, 15 per cent of deaths from air
pollution can be averted. Reaching these lower levels of air pollution will also reduce respiratory and
cardiovascular diseases as well as increase life expectancy among local populations.
It appears that, although people in developing countries are usually more exposed to indoor air
pollution than to outdoor air pollution (whereas developed countries strongly suffer from outdoor air
pollution), the SEMCs are closer to developed countries in terms of air pollution risk. This is well
documented in Egypt in particular; most households use fossil fuels (liquefied petroleum gas [LPG],
natural gas, or kerosene) for cooking, which are low risk from an indoor air pollution standpoint.
Thus, Egyptians are more exposed to outdoor urban or industrial air pollution than to indoor air
pollution. The EU (2011) provides estimates of monetary benefits that could be achieved through air
pollution control.
Table 1.6 Estimates of monetary benefits resulting from air pollution control in selected Mediterranean countries
Euro at PPP % of GDP
Low High Low High
Algeria 248 805 0.1 0.3
Egypt 7,149 23,185 1.6 5.1
Israel 1,556 5,047 0.1 0.2
Jordan 213 690 0.6 1.9
Lebanon 263 853 0.6 1.9
Morocco 1,022 3,314 0.8 2.4
Palestinian Territories 40 129 0.3 0.9
Syria 369 1,196 0.3 1.1
Tunisia 401 1,300 0.5 1.7
Total 11,260 36,519
Source: tenBrink et. al. (2011).
Box 1.2 Improvements in fuel quality in Morocco
The replacement of dirty diesel (10,000 parts per million, ppm) with clean diesel (50 ppm) on the national market took effect in April 2009. The measure required an $850 million upgrade to SAMIR, Morocco’s sole refinery. The shift to a fuel containing 200 times less sulphur will improve air quality.
This achievement was made possible by the strong commitment of the Mohamed VI Foundation to environmental protection. In 2002 the foundation initiated the “Quality Air” programme, with an aim to improving air quality through decreed control of exhaust gases. One of the signature measures of the programme was the introduction of 350 ppm diesel in August 2002. More recently, the foundation is piloting an eco-epidemiological air-quality-monitoring system known as “Casa Air Pur” in metropolitan Casablanca. It is also implementing campaigns to raise popular awareness about air pollution.
Source: Partnership for Clean Fuel and Vehicles (2011), reported in Samri (2011).

MED 2012 ≈≈≈ TOWARD GREEN GROWTH IN MEDITERRANEAN COUNTRIES
31
Evidence from micro-level data A review of country-level studies analysing the links between environmental conditions and human
health using household survey data reveal a lack of pertinent microeconomic research on the SEMCs;
exceptions are Abou-Ali (2003) and Deveto and others (2011).7
The quality of infrastructure and access to water and sanitation are the main determinants of the
prevalence of diarrhoea. The neighbourhood seems to play a major role, but other factors should be
taken into account, including the availability of information about drinking water contamination to
encourage households to purify their water. Enhancing mother’s education reduces the mortality risk.
Evidence related to air pollution shows that the impact of the different sources of air pollution
depends on the level of development of the country (Van der Klaauw and Wang 2011; Jacoby and
Wang 2004; Boy, Bruce, and Delgado 2002; Pitt, Rosenzweig, and Hassan 2006).
Microeconomic analysis based on household data reveals that although Egypt has one of the
highest connection rates to piped water among the SEMCs, inadequate access to safe water still has a
sizable impact on child health. This suggests that the situation could be worse in other countries
where the connection rate is lower (box 1.3). In the meantime, an analysis of individual data allows an
identification of districts with the highest prevalence of morbidity. Such information can be used by
decision makers to determine priorities in the allocation of public health expenditures and investment
in infrastructures aimed at upgrading water access and sanitation.
Box 1.3 Case study on water access in Egypt using Demographic and Health Surveys (DHS)
This case study, undertaken as part of the 2012 MED Report, seeks to evaluate the impact of a defective access to water on child health based on a representative cross-sectional DHS of Egyptian households collected in 2008.
Since it is impossible to observe the situation of individuals both with and without defective access to water, impact evaluation determines a counterfactual so as to isolate the effects of access to water from other factors. This is implemented through the use of a control group, which is compared to the treatment group.
An overall and significant difference on the prevalence of diarrhoea between the two groups is found. The impact on diarrhoea is about 4.5 per cent higher for children facing defective access to drinking water. Including water cut-offs in the definition of defective access provides an overall and significant difference with a mean value of about 2.5 per cent. These findings suggest that despite an extended connection rate to piped water the problem relating to water access and water quality remain important.
Source: 2012 MED Report team. Note: The overall household response rate was 99.1 per cent.
Spatial distribution of negative externalities and the environmental burden of disease The issue of water and air pollution has specific spatial dimensions. Not all parts of a country are hit
in the same way. A strong correlation is usually observed between district-level prevalence of
7 Existing studies on the impact of air and water pollution using household data cover America (Argentina, Brazil, Peru, Guatemala), Asia (China, Philippines, Bangladesh, India, Malaysia, Indonesia, Vietnam), and Africa (Ethiopia, Kenya, Ghana). Evidence related to water pollution is presented particularly by Jalan and Ravallion (2003); Fink and Günther (2010); Fink, Günther, and Hill (2010); and Van der Klaauw and Wang (2011). 8 Result from a random experimental approach (Jalan and Somanathan 2008).
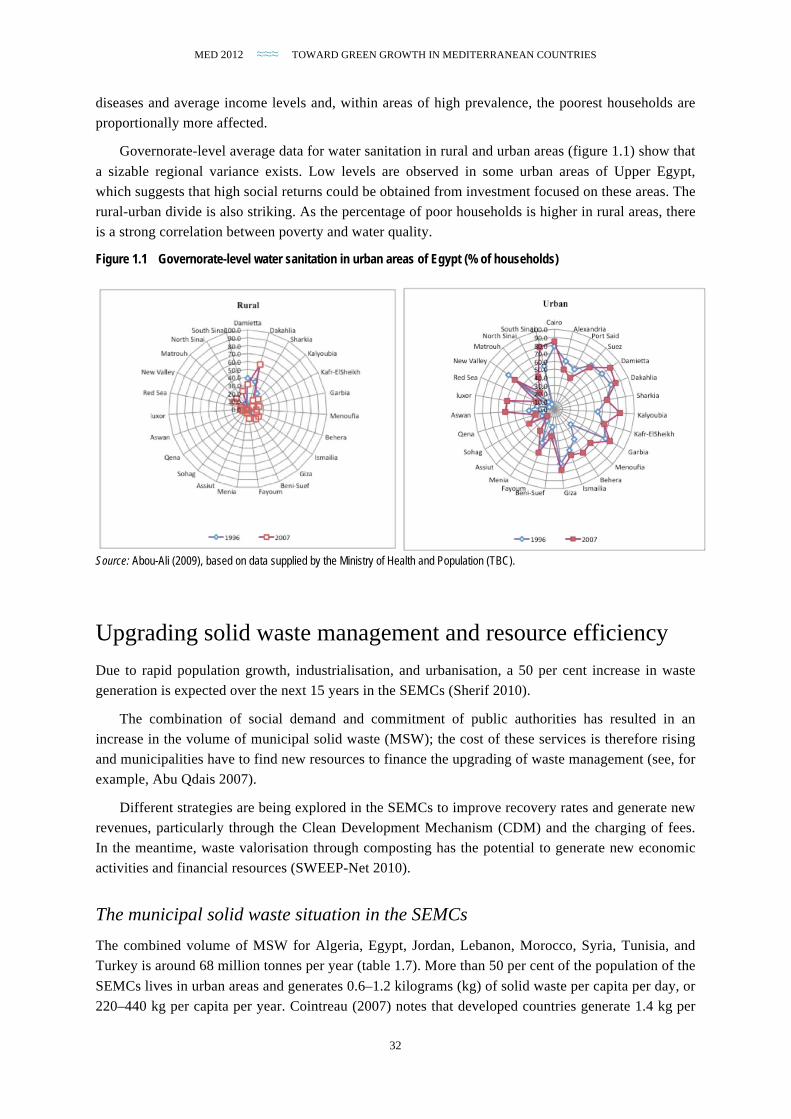
MED 2012 ≈≈≈ TOWARD GREEN GROWTH IN MEDITERRANEAN COUNTRIES
32
diseases and average income levels and, within areas of high prevalence, the poorest households are
proportionally more affected.
Governorate-level average data for water sanitation in rural and urban areas (figure 1.1) show that
a sizable regional variance exists. Low levels are observed in some urban areas of Upper Egypt,
which suggests that high social returns could be obtained from investment focused on these areas. The
rural-urban divide is also striking. As the percentage of poor households is higher in rural areas, there
is a strong correlation between poverty and water quality.
Figure 1.1 Governorate-level water sanitation in urban areas of Egypt (% of households)
Source: Abou-Ali (2009), based on data supplied by the Ministry of Health and Population (TBC).
Upgrading solid waste management and resource efficiency Due to rapid population growth, industrialisation, and urbanisation, a 50 per cent increase in waste
generation is expected over the next 15 years in the SEMCs (Sherif 2010).
The combination of social demand and commitment of public authorities has resulted in an
increase in the volume of municipal solid waste (MSW); the cost of these services is therefore rising
and municipalities have to find new resources to finance the upgrading of waste management (see, for
example, Abu Qdais 2007).
Different strategies are being explored in the SEMCs to improve recovery rates and generate new
revenues, particularly through the Clean Development Mechanism (CDM) and the charging of fees.
In the meantime, waste valorisation through composting has the potential to generate new economic
activities and financial resources (SWEEP-Net 2010).
The municipal solid waste situation in the SEMCs
The combined volume of MSW for Algeria, Egypt, Jordan, Lebanon, Morocco, Syria, Tunisia, and
Turkey is around 68 million tonnes per year (table 1.7). More than 50 per cent of the population of the
SEMCs lives in urban areas and generates 0.6–1.2 kilograms (kg) of solid waste per capita per day, or
220–440 kg per capita per year. Cointreau (2007) notes that developed countries generate 1.4 kg per
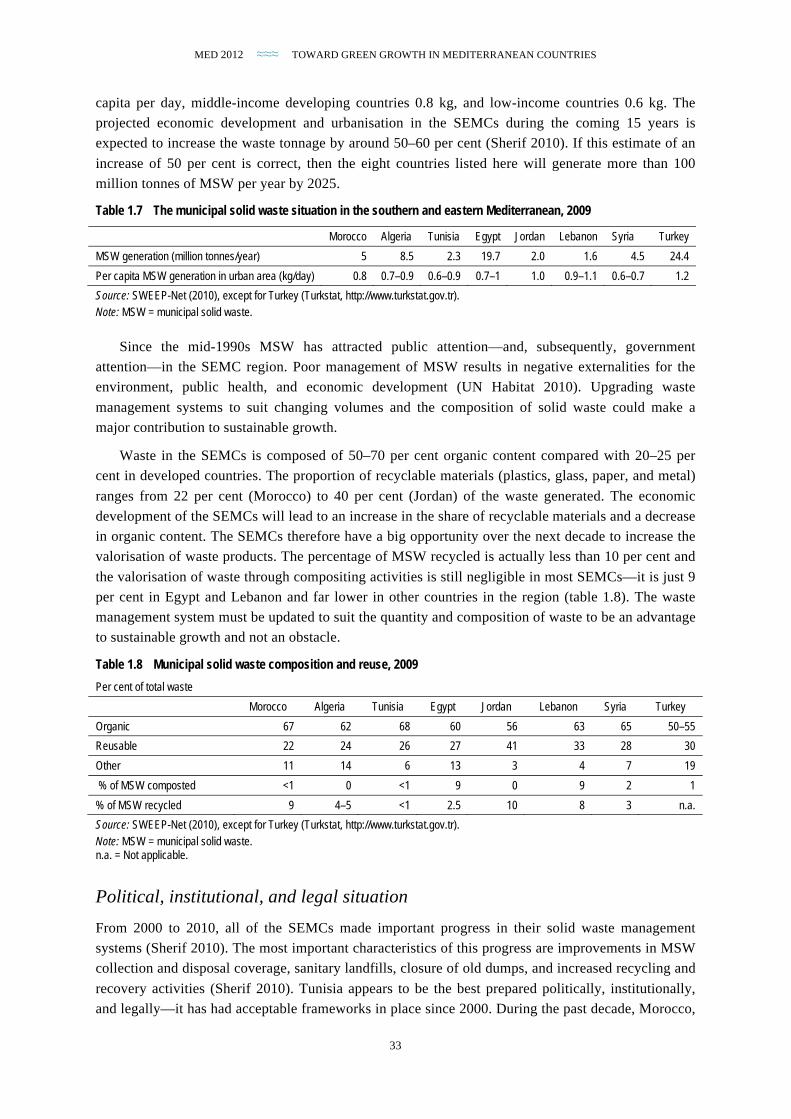
MED 2012 ≈≈≈ TOWARD GREEN GROWTH IN MEDITERRANEAN COUNTRIES
33
capita per day, middle-income developing countries 0.8 kg, and low-income countries 0.6 kg. The
projected economic development and urbanisation in the SEMCs during the coming 15 years is
expected to increase the waste tonnage by around 50–60 per cent (Sherif 2010). If this estimate of an
increase of 50 per cent is correct, then the eight countries listed here will generate more than 100
million tonnes of MSW per year by 2025.
Table 1.7 The municipal solid waste situation in the southern and eastern Mediterranean, 2009
Morocco Algeria Tunisia Egypt Jordan Lebanon Syria Turkey
MSW generation (million tonnes/year) 5 8.5 2.3 19.7 2.0 1.6 4.5 24.4
Per capita MSW generation in urban area (kg/day) 0.8 0.7–0.9 0.6–0.9 0.7–1 1.0 0.9–1.1 0.6–0.7 1.2
Source: SWEEP-Net (2010), except for Turkey (Turkstat, http://www.turkstat.gov.tr). Note: MSW = municipal solid waste.
Since the mid-1990s MSW has attracted public attention—and, subsequently, government
attention—in the SEMC region. Poor management of MSW results in negative externalities for the
environment, public health, and economic development (UN Habitat 2010). Upgrading waste
management systems to suit changing volumes and the composition of solid waste could make a
major contribution to sustainable growth.
Waste in the SEMCs is composed of 50–70 per cent organic content compared with 20–25 per
cent in developed countries. The proportion of recyclable materials (plastics, glass, paper, and metal)
ranges from 22 per cent (Morocco) to 40 per cent (Jordan) of the waste generated. The economic
development of the SEMCs will lead to an increase in the share of recyclable materials and a decrease
in organic content. The SEMCs therefore have a big opportunity over the next decade to increase the
valorisation of waste products. The percentage of MSW recycled is actually less than 10 per cent and
the valorisation of waste through compositing activities is still negligible in most SEMCs—it is just 9
per cent in Egypt and Lebanon and far lower in other countries in the region (table 1.8). The waste
management system must be updated to suit the quantity and composition of waste to be an advantage
to sustainable growth and not an obstacle.
Table 1.8 Municipal solid waste composition and reuse, 2009
Per cent of total waste
Morocco Algeria Tunisia Egypt Jordan Lebanon Syria Turkey
Organic 67 62 68 60 56 63 65 50–55
Reusable 22 24 26 27 41 33 28 30
Other 11 14 6 13 3 4 7 19
% of MSW composted <1 0 <1 9 0 9 2 1
% of MSW recycled 9 4–5 <1 2.5 10 8 3 n.a.
Source: SWEEP-Net (2010), except for Turkey (Turkstat, http://www.turkstat.gov.tr). Note: MSW = municipal solid waste. n.a. = Not applicable.
Political, institutional, and legal situation From 2000 to 2010, all of the SEMCs made important progress in their solid waste management
systems (Sherif 2010). The most important characteristics of this progress are improvements in MSW
collection and disposal coverage, sanitary landfills, closure of old dumps, and increased recycling and
recovery activities (Sherif 2010). Tunisia appears to be the best prepared politically, institutionally,
and legally—it has had acceptable frameworks in place since 2000. During the past decade, Morocco,

MED 2012 ≈≈≈ TOWARD GREEN GROWTH IN MEDITERRANEAN COUNTRIES
34
and, to a lesser extent, Algeria and Syria, made the greatest efforts to improve their MSW
management; their situation in 2000 was the worst in the region, and they are just catching up. Some
important progress remains to be made: Egypt and Lebanon have to improve their currently
incomplete legal, regulatory, and institutional frameworks; Algeria, Syria, and Jordan have to increase
participation of the private sector in waste collection and disposal.
Financial considerations As discussed above, most of the SEMCs have improved—and are actively seeking to further
improve—their MSW management services (box 1.4). But the cost of solid waste services is
increasing and local government bodies have to find a way to finance it. There are two main financial
needs: the ordinary MSW collection cost and the long-term infrastructure cost. To finance MSW
services, the SEMCs need to raise collection fees; in many SEMCs, there is no specific MSW cost-
recovery system. Recent experiences in Jordan have shown that the recovery rate can be dramatically
improved—Amman boasts a 60 per cent cost-recovery rate (GTZ-ERM-GKW 2004). MSW
collection fees could be collected inexpensively via the electricity bill, as in Egypt and Jordan. An
important challenge for the SEMCs in the coming years will be to establish an efficient cost-recovery
system.
Financing waste management infrastructure requires long-term capital. A national scheme in
Tunisia gives municipalities access to low-interest loans. The CDM has the potential of becoming an
important source of revenue to complement other sources of long-term capital. The SEMCs currently
have a modest share of the global carbon market with less than 1 per cent of the registered projects,
which is the same level as Honduras (Biscaglia 2010). Projects under CDM are opportunities for the
SEMCs to get financial support for long-term investment while attracting international firms for
collaboration and reaping technological spillovers from them. According to Sherif (2007), carbon
sales revenues are commonly in the range of 10 to 50 per cent of total revenues for power and waste
management projects. He underlines that, in Tunisia, CDM could generate $6 million of the $23
million needed for solid waste management projects. The complexity of CDM procedures can be
solved with international assistance.
Box 1.4 Public-private partnership in Egypt
A public-private partnership between worldwide environmental services company Veolia and the Governorate of Alexandria not only improved the region’s environmental situation, but also led to multiple positive externalities: 4,500 jobs were created in the formal sector with better work conditions for waste pickers and training sessions for workers as well as valorisation of waste though composting. In addition, Alexandria became more attractive for investors and tourists. Key elements of this success were the involvement of the local authority (Governorate of Alexandria) and the CDM procedure with the World Bank (UN Habitat 2007; Veolia 2006). Thanks to the quality of the waste management system, the Governorate of Alexandria has won the “Metropolis” first prize for global waste management and the cleanliness of its public places. But since 2007 the situation has deteriorated somewhat because of a change in local authorities’ relations with Veolia and the problem of informal waste pickers, who compete with formal recycling activities. This case study underlines the importance of political and institutional arrangements.
MED 2012 ≈≈≈ TOWARD GREEN GROWTH IN MEDITERRANEAN COUNTRIES
35
Box 1.5 Eco-Lef in Tunisia
The Eco-Lef programme, which concerns the recycling of packaging waste using a pay-by-weight system, is a successful operation and generates numerous positive economic effects: higher collection of plastics and metal; creation of job opportunities in the formal sector; creation, partly by university graduates, of 200 micro-firms specialised in recycling; and creation of a national market of plastic reuse and exportation of plastic waste (METAP 2004). Producer responsibility as well as successful experience with the active development of plastics recycling via Eco-Lef in the city of Sousse was underlined as remarkable by the UN Habitat report “Solid Waste Management in the World’s Cities” (UN Habitat 2010). Sousse also took up the challenge to prevent plastics from entering the waste stream and set up the Shams project. The campaign is very intensive and includes door-to-door collection of the waste separated at the houses of about 5,000 inhabitants. To finance the Eco-Lef system, Tunisia developed multiple financing sources: participation fees, ecological taxes, and the CDM of the World Bank Carbon Finance program.
C H A P T E R T W O
Maximising the Productivity of Natural Assets While Dealing with Trade-Offs
≈≈≈
In this chapter
Optimizing water supply and quality
Managing coastal areas to maximise ecosystem services and sustainable tourism
Moving toward sustainable urbanisation
Cooperating for sustainable fisheries
Decision makers face hard choices and trade-offs in the management of freshwater resources, coastal areas, urban development, and fish stocks; nevertheless, it does appear possible to improve the productivity of these natural assets while ensuring sustainable development.
Optimising water supply and quality
In the Mediterranean region the volume of
water withdrawn (from natural water
resources) and produced (thanks to
nonconventional water resources, such as
treated wastewater reuse and desalination)
doubled over the second half of the
twentieth century. Future analyses also
suggest that in a business-as-usual scenario,
the pressure exerted on resources will
intensify by 2025 (Benoît and Comeau
2005).
Irrigation accounts for almost 65 per cent of water withdrawals throughout the whole of the
Mediterranean, possibly even exceeding 80 per cent in the southern and eastern Mediterranean
countries (SEMCs). Total water-use efficiency for the Mediterranean countries stands at between 50
and 85 per cent (Thivet and Blinda 2007).
Key messages
Effective demand management reduces water tensions.
Improving water services brings significant social and economic benefits.
Paying for environmental services and improving institutions and allocation systems significantly reduces the costs of the investments needed in the water sector and its negative externalities.
MED 2012 ≈≈≈ TOWARD GREEN GROWTH IN MEDITERRANEAN COUNTRIES
37
But in some countries, the share of abstractions dedicated to electricity production (storage in
hydroelectric dams or for cooling thermal power stations) may also prove significant. Although only a
tiny share is consumed, these abstractions nonetheless have a major impact on water system quality
by limiting sediment and fish transit, creating a pollution risk (thermal pollution by power stations),
and limiting the dilution or self-cleansing capacity of rivers when hydroelectric dams’ releases do not
coincide with periods of low water.
For domestic and other industrial water uses, final consumption levels are also low. More than 80
per cent of the water is actually returned to the environment as wastewater, its quality being more or
less affected according to the wastes it contains (black water and grey water from domestic effluents,
water from commercial establishments including hospitals, industrial effluents including hazardous
chemicals, storm water, and other urban runoff) and to the type of treatment applied.
Reducing water tensions through effective demand management In the Mediterranean supply-driven policies have reached the physical, financial, and environmental
limit of their ability to deal with water scarcity. Trends lead to an unsustainable gap between supply
and demand, worsened by the impacts of climate change on hydrology and evapotranspiration.
Improving the efficiency of water use and allocation can effectively limit water crises. In this region,
agriculture is a key factor to unlock the “water potential.”
Water demand management (WDM) is a set of technical, political, institutional, economic,
training, and awareness-raising tools intended to encourage better use of existing water supply before
considering increasing supply. WDM thus encompasses measures intended to improve water use
efficiency both within the various uses and between uses.
WDM can unlock significant water volumes: in 2005 losses and minuses represented 40 per cent
of the total Mediterranean region’s water demand. By 2025, improving water-use efficiency could
save the equivalent of 25 per cent of the total future regional water demand (Benoît and Comeau
2005; Thivet and Blinda 2007).
In various Mediterranean case studies (UNEP 2011; Plan Bleu 2010; Jagannathan, Shawky, and
Kremer 2009; Rinaudo 2008a, 2008b; Maton 2008; AFD 2008; World Bank 2007; Kayaga and Smout
2007; Brooks, Thompson, and Fattal 2007; Maggiera, Taha, and Nolte 2006; Baroudy, Lahlou, and
Attia 2005), WDM has also proved to be a more cost-effective and generally better way to allocate
limited financial resources than, for instance, dam building, water transfers, or desalination, globally
(box 2.1) and in areas facing water scarcity (box 2.2).
MED 2012 ≈≈≈ TOWARD GREEN GROWTH IN MEDITERRANEAN COUNTRIES
38
Box 2.1 Economic evaluation of water savings across the Mediterranean
In 2010 Plan Bleu carried out an economic analysis based on a set of the Mediterranean case studies: the Tensift basin (Morocco), the Hérault region (France), the Ardèche basin (France), the Karditsa region (Greece), the Guadalquivir basin (Spain), the IPEST university establishment (Tunisia), the Amman-Zarqa basin (Jordan), and the Gabès oasis (Tunisia). The evaluation was based on a cost-efficiency analysis and the evaluation of discount rates and payback periods. The main conclusions of the comparative analysis of the case studies are presented here.
When comparing measure-by-measure analysis (unit economic results) In the drinking water sector:
• Where the drinking water supply network’s initial yield is low, the most effective solutions entail the reduction of leakage from the network.
• Installing water-efficient appliances is an effective solution for users and the service provider only when the additional demand that can be connected to the water supply network without exceeding its capacity is rising.
In the irrigation sector:
• Publicly owned and operated gravity-fed distribution canals can be optimised by pressurising them. Moreover, significant volumes can be saved by renovating or waterproofing the supply system: leakage may represent as much as 30 per cent of abstractions.
• The effectiveness of measures to improve hydraulic efficiency within the public supply system and in irrigated areas largely depends on the systems’ initial hydraulic efficiency and irrigation techniques.
For instance, in the Western Hérault study, the unit cost of water may triple depending on the initial hydraulic efficiency of the irrigation system.
The case studies also reveal major spatial variability in cost-effectiveness ratios, particularly in the case of conversion to localised irrigation techniques. Under the Syrian national programme for converting to modern irrigation, for instance, it costs twice as much per hectare to convert from gravity fed to drip irrigation than to convert from gravity-fed to sprinkler and enhanced gravity-fed systems.
Analyses conducted in the field of agricultural water use tend to be limited to financial costs, without factoring in economic and environmental externalities. Moreover, of these financial costs, often only investment costs are included, while operation and maintenance (O&M) costs tend to be ignored. But the various irrigation techniques have different O&M costs: these costs also influence the attractiveness of a technical solution. Thus, for example, in the Guadalquivir basin, irrigators with pressurised systems spend on average 10.5 per cent of their gross income on water, while irrigators using gravity-fed systems spend only about 4 per cent.
None of the evaluations take into account the positive external effects that may stem from losses within networks, such as aquifer replenishment.
WDM measures may be of economic interest to irrigators since they secure their water supply, promote more efficient water use, and even increase the volume allocated to agriculture if water is a limiting factor. In that case, WDM measures do not release water for other uses or into the environment. The redistribution of water to other uses depends on the introduction of incentives or contractual or coercive measures, allowing for more flexible water rights. The results suggest that enforcing abstraction regulations may prove cost-effective.
For other uses:
• Allowing for more flexible use of the water stored in existing reservoirs is effective.
• Solutions aimed at limiting diffuse pollution are effective.
• Solutions involving increased supply, such as transfers or seawater desalination, are least effective.
When looking at entire projects
Aside from measure-by-measure evaluations, the studies also assessed the cost-effectiveness ratios of various combinations of measures according to their goals: either to ease pressure on the environment or to meet new
MED 2012 ≈≈≈ TOWARD GREEN GROWTH IN MEDITERRANEAN COUNTRIES
39
anthropogenic demand:
• Besides being the most cost-effective, measures reducing leakage in the network and the installation of water efficient appliances may make a significant contribution toward meeting future drinking water demand.
• Various elements need to be taken into account in project design:
− The large spatial variation in the effectiveness of certain measures.
− The significance of seasonal variability in the effectiveness of the measures.
− Only measures with a negative ratio are likely to be spontaneously implemented, since they represent a clearly identified net profit for the beneficiary of the measure. Measures with low but positive ratios, on the other hand, generally demand collective financing (public, international, or some other source), particularly those that are related to indivisible investments with high fixed costs.
Source: Plan Bleu 2010.
Box 2.2 Managing water scarcity in the Neste system
The Compagnie d’aménagement des coteaux de Gascogne (CACG) was created in the early 1960s as a regional development agency for the southwest of France (Gascony), focusing on hydraulics and agriculture. The CACG was more specifically in charge of managing the Neste system, that is, all the rivers of Gascony that are recharged by a canal withdrawing water from the Neste River, an upstream tributary of the Garonne River.
Between the 1960s and the mid-1980s, the CACG mainly developed water supply (that is, dams and irrigation networks), while riparian individual irrigation also significantly increased within the Neste River system. At the end of the 1980s, the Neste River system faced a significant crisis, with increasing conflicts among users intensified by recurrent and intense drought periods. To solve it, the CACG fostered the creation of a users’ community (the “Neste commission”) and negotiated the implementation of a combination of contractual and economic instruments to manage water scarcity, including step pricing (discontinuous series of price levels, increasing with water demand) and quotas (defined according to rate and volume limits). To do so, a waiting list for quota redistribution had to be defined and agreed upon collectively. When the quota is exceeded, the marginal price of water dramatically increases. The contract fixes penalties for the user (in case of withdrawing above the subscribed flow or lack of water meter) and for the CACG (in case it had to reduce the quota because of a lack of supply prediction and management). Water price is based on the “sustainability cost,” or the full cost of the water less the cost of the initial investment. With such a price, no new investment is possible, but budgetary constraints are met and sustainable O&M is ensured without having to resort to public funding. This integrated system developed to manage water scarcity has lasted since then, while also being regularly negotiated and adapted within the Neste Commission. In other words, it has become an “institution.”
Source: Tardieu 2008.
The social and economic benefits of improved water services
The World Health Organisation (WHO) estimates returns of $3 to $34 for each $1 invested in safe
drinking water and basic sanitation, depending on the region and technology used (World Water
Assessment Programme 2009). In the Palestinian territories, the Word Bank estimated the cost of
polluting domestic water in West Bank aquifers, from solid waste leakage and domestic wastewater,
to be $6.5 million in 2005. The avoidable costs of disease in 2005, if small-scale wastewater treatment
plants were implemented in all rural areas of the West Bank, were estimated at just under $8 million
(Shankar and Abu-Ata 2004).
Drinking water accessibility and quality carry important technical, financial, social, political, and
sanitation challenges. A first step in addressing these challenges is to better grasp the social
construction of water services, their collective funding, and the rules that legitimate their functioning.
MED 2012 ≈≈≈ TOWARD GREEN GROWTH IN MEDITERRANEAN COUNTRIES
40
Water services are defined as the provision of water of a given quality, quantity, and reliability at
a specific location. The definition emphasises outputs—what people receive—rather than
infrastructure: how to define drinking water and sanitation services that are financially, equitably, and
sanitarily sustainable?
When water network supply is unsatisfactory, consumers cope by installing storage tanks or
private pumping and treatment facilities, or by paying for expensive alternative water supplies. But
the poorest consumers must spend labour and time fetching water from public outlets (Lee and
Schwab 2005).
In most urban public water systems around the world, charges often barely cover recurrent O&M
costs, leaving scant, if any, funds to recover the capital costs of modernisation and expansion.
According to a survey in 132 cities in high-, middle-, and low-income countries, 39 per cent of the
cities did not recover even their O&M costs. There are three possible sources of financing: user
tariffs, local and national public expenditure, and external aid. Recourse to these sources should be
preceded and accompanied by efficiency measures to control operating costs and by careful project
selection and design to ensure the best return on scarce resources (World Water Assessment
Programme 2009), including the comparative evaluation of collective (network-based) and
autonomous solutions for drinking water and sanitation services.
Water as an urban service is framed by policies reflecting compromises among at least partly
conflicting concerns: efficiency, social equity, service management, and expansion (Jaglin and Zérah
2010). Territorial and social equalisation systems developed for water pricing are always based on
specific compromises. They are dynamic conventions that require regular public scrutiny and
adaptation (Touzi, Barraqué, and Treyer 2010).
Access to safe water, sanitation, and hygiene also represents a significant health stake (Rajab
2006; Yassin, Amr, and Al-Najar 2006; Ayoub and Malaeb 2006; Mohamed and others 1998).
In the Mediterranean, treated wastewater (TWW) reuse systems can be an effective solution to
deal with local water tensions (at a national or regional level, TWW only amounts to 3 per cent of the
water demand), as well as environmental and sanitary issues. The more critical the water scarcity is,
the higher the extent of wastewater reuse, irrespective of its quality parameters. But the safe and
controlled reuse of wastewater requires a functioning sanitation system. Wastewater can be valued for
various uses, such as for agriculture, urban uses other than drinking, golf courses, aquaculture,
industries, groundwater or wetlands recharge, or keeping river flows from falling too low. These uses
require different water-quality levels and associated treatment technologies. Like any other hydraulic
project, the TWW reuse projects face constraints related to transport and storage, including temporal
discrepancies between wastewater supply and reuse and water-quality issues involving bacteriology,
salinity, and heavy metals (BRL 2011; AHT Group AG 2009a, 2009b, 2009c) (box 2.3).
MED 2012 ≈≈≈ TOWARD GREEN GROWTH IN MEDITERRANEAN COUNTRIES
41
Box 2.3 Reusing wastewater
Tunisia
In the Hammamet region, the Office national de l’assainissement (ONAS) implemented a tertiary treatment system to allow Hammamet wastewater to be reused by two golf courses. The objectives were to (i) reduce the pressure exerted on the overexploited coastal aquifer, (ii) reduce the wastewater discharges on the coastline, and (iii) provide water to the golf courses. In addition to the ONAS, the Commissariat régional de développement agricole (CRDA), the Agence nationale de l’aménagement du territoire (ANAT), Tunisia’s health and tourism ministries, and the golf managers actively contributed to the project design and financing. The project created 170 jobs and contributed to the maintenance of the touristic attractiveness of the region. But reducing the exploitation of the coastal aquifer greatly depends on the economic and institutional measures accompanying this innovation.
Jordan
Jordan is one of the most water-deprived countries of the Middle East and has some of the highest groundwater depletion rates. In 2000 the Jordanian authorities faced a major problem: Amman’s treatment plant became saturated due to rapid urbanisation, leading to a significant increase in pollution of the Zarka River and its associated King Tahal dam, with eutrophication risks that were detrimental to downstream irrigating farmers. The Water Jordan Authority (WJA) and Jordan Valley Authority (JVA) decided to build a bigger treatment plant allowing downstream water reuse. The project was based on a public-private partnership (build, operate, and transfer); the private operator charged urban users fees, while the JVA billed the farmers. The results were very positive. The water quality level was high enough to allow its direct reuse in fruit and vegetable production. More than 3,500 direct jobs have been created, along with around 20,000 indirect jobs.
The water transportation costs of the project are limited since the treated wastewater is discharged by gravity into the river. Today, more than 70 million cubic metres (m3) of reclaimed wastewater are used either directly or indirectly each year in Jordan, making up around 10 per cent of the total national water supply. This progress is due to the steady evolution of Jordan’s wastewater policy framework. Standards governing wastewater use have gone through four iterations. Initial standards were introduced in 1982 but were replaced first with the 1989 WHO Guidelines and then, in 1995, with a more comprehensive set of standards dealing with wastewater use and environmental discharges.
Finally, in 2003 more stringent standards were promulgated following a multiyear consultation process with stakeholders. Under the new standards, groundwater recharge is permitted, but not for potable use. Jordan’s experience demonstrates that wastewater use has great potential in water-scarce areas, but that planning for wastewater use must be integrated coherently with water resources planning, environmental management, and financial arrangements.
Source: BRL 2011; Bartone and Mara 2010.
The benefits of paid environmental services, better institutions, and more-efficient allocation systems
Is it more effective to pollute and then treat water than to avoid polluting in the first place? Not
always, especially when an increasing number of parameters have to be taken into account and when
dealing with nonpoint source pollution.
This reality makes it necessary to renew the relations that govern water and territories thanks to
instruments such as payments for environmental services, incentive pricing for decreasing the amount
of wastewater produced, improvements to hydrosystems’ autofiltration capacities, and a larger range
of technological solutions.
Investing in the ecosystem service of water purification can be an effective alternative to building
expensive treatment plants (Salzman 2005). Maintaining wetlands on the flood plains can contribute
to flood control (Salzman, Thompson, and Daily 2001; Ferraro 2008). In Syria, Greece, Italy,
MED 2012 ≈≈≈ TOWARD GREEN GROWTH IN MEDITERRANEAN COUNTRIES
42
Morocco, Algeria, and Egypt, watershed protection is the most valuable forest benefit, and in Tunisia
it is second only to grazing (Croitoru 2007). In Croatia, Egypt, Tunisia, and Turkey, clean production
processes have reduced the amounts of pollution emitted (box 2.4).
Box 2.4 Examples of pollution reduction thanks to clean production processes
In Turkey, a tire factory in the Izmit region reduced its water consumption by nearly three-quarters, from 900,000 litres a day to 250,000 litres, thereby reducing its discharges into the community sewers as well. A detailed analysis made it possible to replace a cooling system with a closed-circuit system for an investment cost of $5,000 and a return time of two years.
In Egypt, one of the largest tinned food manufacturers (Montazah, near Alexandria) underwent an eco-audit and introduced measures to reduce energy consumption: insulating steam pipes, replacing leaky parts, fitting a pressure regulator to the sterilisers, and improving the recuperation system and boiler efficiency. Water consumption was reduced by monitoring, installing sprinklers (so that water flows only when needed), and improving the water collection and recycling system. The savings in water, steam, and energy (nearly 40 per cent savings in fuel consumption) made it possible to reduce discharges and amortise investments over 1 to 44 months.
One of Croatia’s biggest dairy companies, LURA, in Zagreb-Lurat, undertook measures such as employee training, reducing the diameter of cleaning pipes, and changing the hot water circuit that reduced effluents by 286,000 m3 a year (or 27 per cent) and drinking water by 280,000 m3 a year. These simple, low-cost measures (investment of €31,000) inspired employees, saved water and energy (equivalent to €328,000 a year), and reduced effluents, with an investment amortisation of less than one month.
In Tunisia a manufacturer of car batteries identified 19 ways of preventing contamination and pollution (acids, lead scoria, and wastewater) and saving lead and energy. The costs of the new measures were $522,500, while savings amounted to $1.5 million a year.
Source: Benoît and Comeau 2005.
Managing coastal areas to maximise ecosystem services and sustainable tourism
Integrated coastal zone management (ICZM) is a method for ensuring that coastal resources are used
in a sustainable manner. The Protocol for the Integrated Management of Mediterranean Coastal Zones
was signed in Madrid in January 2008 by 14 contracting parties to the Barcelona Convention after a
six-year consultation period. The protocol recognises the important economic role of coastal zones in
promoting development and employment in the Mediterranean, but it also stresses the importance of
protecting the natural resource base to ensure that future growth is indeed green and that the region’s
development is indeed sustainable.
ICZM relies on a number of measures to achieve its goals, including institutional coordination;
physical limits on coastal development; integration of environmental concerns into the regulation of
agriculture, fisheries, tourism, mining, energy production, and infrastructure development in coastal
zones; creation of protected areas where appropriate; wider public participation in the ICZM process;
and awareness raising, training, and research. A greater role is envisaged for international cooperation
in managing coastal resources in the Mediterranean.
Of particular relevance to this review is the role of economic and financial instruments (article 17
of the protocol). These promote the adoption of “relevant financial and economic instruments
intended to support local, regional and national initiatives for the integrated management of coastal
MED 2012 ≈≈≈ TOWARD GREEN GROWTH IN MEDITERRANEAN COUNTRIES
43
zones” and the establishment of “taxes and charges intended to dissuade and prevent activities
damaging to the coastal zone, the product of which shall be assigned to the maintenance and
management of coastal areas.”
To date most of the work in ICZM has been in the legislative and regulatory sphere, with some
attention being given to increasing public participation and improving governance. Yet, little has been
done to help strike a balance between environmental protection and economic and social
development. This requires quantification of the costs and benefits of the actions from which one can
evaluate individual projects that are nominated for protection or development. Key to this work is
establishing the links between proposed improvements and flows of ecosystem services and services
produced solely or chiefly through human activity (Markandya and others 2008). Research has been
ongoing in this area, but only a small amount of it has been put into practise.
Examples of good practice In spite of these shortcomings, some coastal resources have indeed been managed in a way that
promotes development while ensuring that the environment is protected. Boxes 2.5 and 2.6 provide
examples from Morocco and Tunisia, respectively; other success stories can be found in Algeria and
Egypt.
Wanted: New tools for promoting green growth As noted, to be effective in promoting green growth the authorities have to make more use of
financial and economic instruments. Three such instruments merit special mention: (i) transferable
development rights, (ii) a development or land tax, and (iii) an eco tax or tourism tax.
Under a system of transferable development rights, an authority that restricts development in one
area compensates those who lost value as a result of the restrictions by allocating rights in other areas.
Such systems have been an effective planning tool in municipalities and districts in the United States
and elsewhere. Alternatively, authorities that were given coastal development rights could share the
benefits with those whose rights were denied. A similar approach is found in Italy, where the so-
called perequazione urbanistica has allowed areas to be protected by arranging the transfer of benefits
from other areas since the early 1980s.
Another important instrument that can protect coastal development is land taxation. It may be
possible to tax increased land values when development rights are accorded for coastal areas. This can
generate much-needed revenues that can help finance the development or protection of other areas,
including transfers to these areas to make up for restricting development. Such tax transfers could, for
example, fund programs to promote job creation in the area.
Frequently, the creation of new tourism developments creates a demand for local public services
that cannot be met from the normal sources of funds, such as property taxes. In such cases a special
charge on tourists can be levied to cover the additional costs. An eco tax or a tourism tax, depending
on what it is used for, has been introduced in a number of countries with limited tax capacities, such
as Bhutan, Nepal, and the Dominican Republic. It has also been tried in a developed region—the
Balearic Islands in Spain.
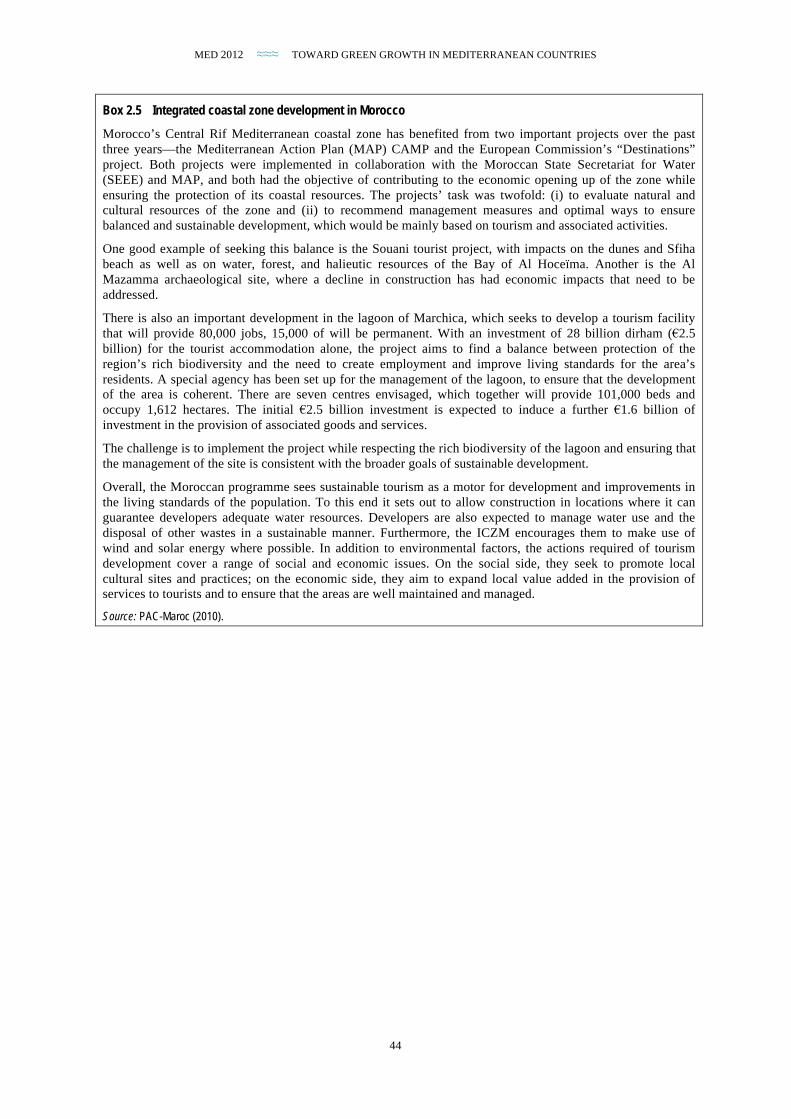
MED 2012 ≈≈≈ TOWARD GREEN GROWTH IN MEDITERRANEAN COUNTRIES
44
Box 2.5 Integrated coastal zone development in Morocco
Morocco’s Central Rif Mediterranean coastal zone has benefited from two important projects over the past three years—the Mediterranean Action Plan (MAP) CAMP and the European Commission’s “Destinations” project. Both projects were implemented in collaboration with the Moroccan State Secretariat for Water (SEEE) and MAP, and both had the objective of contributing to the economic opening up of the zone while ensuring the protection of its coastal resources. The projects’ task was twofold: (i) to evaluate natural and cultural resources of the zone and (ii) to recommend management measures and optimal ways to ensure balanced and sustainable development, which would be mainly based on tourism and associated activities.
One good example of seeking this balance is the Souani tourist project, with impacts on the dunes and Sfiha beach as well as on water, forest, and halieutic resources of the Bay of Al Hoceïma. Another is the Al Mazamma archaeological site, where a decline in construction has had economic impacts that need to be addressed.
There is also an important development in the lagoon of Marchica, which seeks to develop a tourism facility that will provide 80,000 jobs, 15,000 of will be permanent. With an investment of 28 billion dirham (€2.5 billion) for the tourist accommodation alone, the project aims to find a balance between protection of the region’s rich biodiversity and the need to create employment and improve living standards for the area’s residents. A special agency has been set up for the management of the lagoon, to ensure that the development of the area is coherent. There are seven centres envisaged, which together will provide 101,000 beds and occupy 1,612 hectares. The initial €2.5 billion investment is expected to induce a further €1.6 billion of investment in the provision of associated goods and services.
The challenge is to implement the project while respecting the rich biodiversity of the lagoon and ensuring that the management of the site is consistent with the broader goals of sustainable development.
Overall, the Moroccan programme sees sustainable tourism as a motor for development and improvements in the living standards of the population. To this end it sets out to allow construction in locations where it can guarantee developers adequate water resources. Developers are also expected to manage water use and the disposal of other wastes in a sustainable manner. Furthermore, the ICZM encourages them to make use of wind and solar energy where possible. In addition to environmental factors, the actions required of tourism development cover a range of social and economic issues. On the social side, they seek to promote local cultural sites and practices; on the economic side, they aim to expand local value added in the provision of services to tourists and to ensure that the areas are well maintained and managed.
Source: PAC-Maroc (2010).
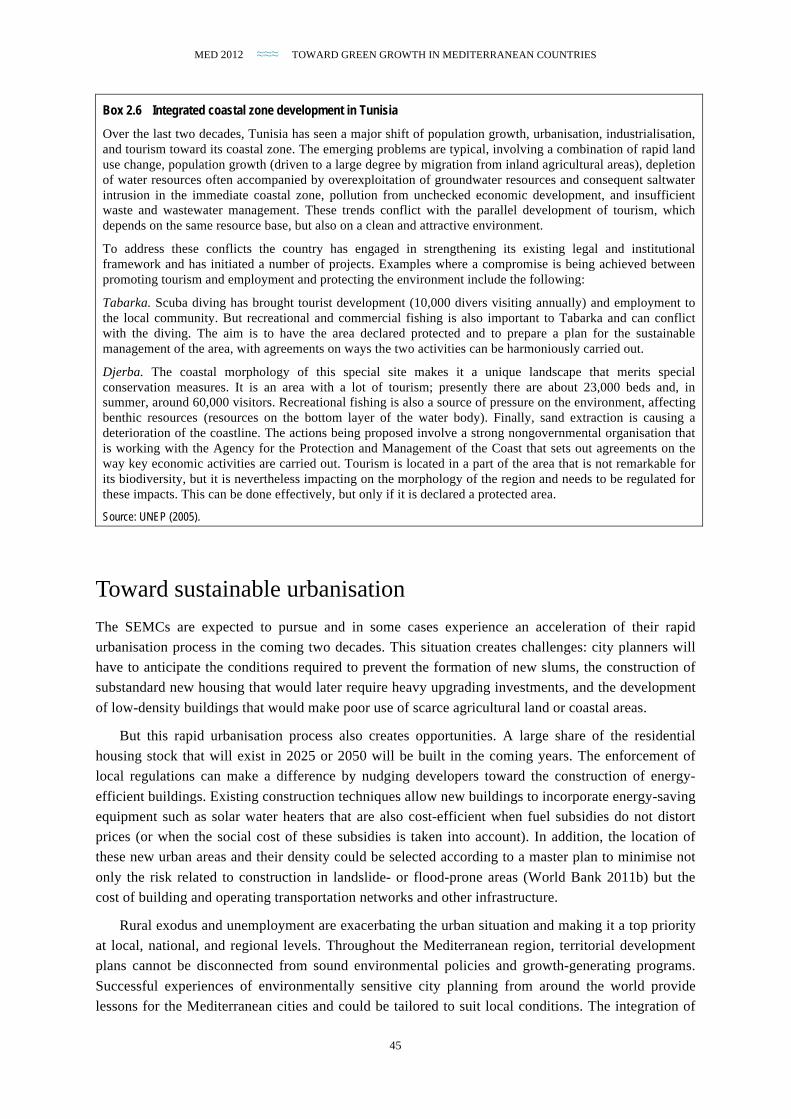
MED 2012 ≈≈≈ TOWARD GREEN GROWTH IN MEDITERRANEAN COUNTRIES
45
Box 2.6 Integrated coastal zone development in Tunisia
Over the last two decades, Tunisia has seen a major shift of population growth, urbanisation, industrialisation, and tourism toward its coastal zone. The emerging problems are typical, involving a combination of rapid land use change, population growth (driven to a large degree by migration from inland agricultural areas), depletion of water resources often accompanied by overexploitation of groundwater resources and consequent saltwater intrusion in the immediate coastal zone, pollution from unchecked economic development, and insufficient waste and wastewater management. These trends conflict with the parallel development of tourism, which depends on the same resource base, but also on a clean and attractive environment.
To address these conflicts the country has engaged in strengthening its existing legal and institutional framework and has initiated a number of projects. Examples where a compromise is being achieved between promoting tourism and employment and protecting the environment include the following:
Tabarka. Scuba diving has brought tourist development (10,000 divers visiting annually) and employment to the local community. But recreational and commercial fishing is also important to Tabarka and can conflict with the diving. The aim is to have the area declared protected and to prepare a plan for the sustainable management of the area, with agreements on ways the two activities can be harmoniously carried out.
Djerba. The coastal morphology of this special site makes it a unique landscape that merits special conservation measures. It is an area with a lot of tourism; presently there are about 23,000 beds and, in summer, around 60,000 visitors. Recreational fishing is also a source of pressure on the environment, affecting benthic resources (resources on the bottom layer of the water body). Finally, sand extraction is causing a deterioration of the coastline. The actions being proposed involve a strong nongovernmental organisation that is working with the Agency for the Protection and Management of the Coast that sets out agreements on the way key economic activities are carried out. Tourism is located in a part of the area that is not remarkable for its biodiversity, but it is nevertheless impacting on the morphology of the region and needs to be regulated for these impacts. This can be done effectively, but only if it is declared a protected area.
Source: UNEP (2005).
Toward sustainable urbanisation
The SEMCs are expected to pursue and in some cases experience an acceleration of their rapid
urbanisation process in the coming two decades. This situation creates challenges: city planners will
have to anticipate the conditions required to prevent the formation of new slums, the construction of
substandard new housing that would later require heavy upgrading investments, and the development
of low-density buildings that would make poor use of scarce agricultural land or coastal areas.
But this rapid urbanisation process also creates opportunities. A large share of the residential
housing stock that will exist in 2025 or 2050 will be built in the coming years. The enforcement of
local regulations can make a difference by nudging developers toward the construction of energy-
efficient buildings. Existing construction techniques allow new buildings to incorporate energy-saving
equipment such as solar water heaters that are also cost-efficient when fuel subsidies do not distort
prices (or when the social cost of these subsidies is taken into account). In addition, the location of
these new urban areas and their density could be selected according to a master plan to minimise not
only the risk related to construction in landslide- or flood-prone areas (World Bank 2011b) but the
cost of building and operating transportation networks and other infrastructure.
Rural exodus and unemployment are exacerbating the urban situation and making it a top priority
at local, national, and regional levels. Throughout the Mediterranean region, territorial development
plans cannot be disconnected from sound environmental policies and growth-generating programs.
Successful experiences of environmentally sensitive city planning from around the world provide
lessons for the Mediterranean cities and could be tailored to suit local conditions. The integration of

MED 2012 ≈≈≈ TOWARD GREEN GROWTH IN MEDITERRANEAN COUNTRIES
46
environmental considerations in urban strategic planning can contribute to green growth, sustainable
job creation, and improved living conditions.
Planning eco-cities The concept of an Eco2 city (that is, an “ecological city as economic city”) was launched by the World
Bank in 2009 to respond to the challenge of rapid, unplanned urbanisation. Eco2 cities are set up to
create economic opportunities for their citizens in a way that is inclusive, sustainable, and resource
efficient. At the same time, they have the objective of protecting and nurturing local ecology and
global public goods, protecting the environment, and preparing for future generations. The concept of
an Eco2 city was first experimented in Europe and North America. The experience of Curitiba, Brazil,
however, demonstrates that the approach could be tailored to middle-income countries such as those
in the Mediterranean region.
Curitiba has implemented innovative, imaginative, and practical solutions that demonstrate that
resource constraints need not be a barrier to sustainable, ecological and economic urban planning and
development—and that sustainable planning is in fact an investment in the future of a city’s economy
and the welfare of its people. Through innovative approaches to urban planning, city management,
and transport planning, Curitiba has been able to sustainably absorb a population increase from
361,000 (in 1960) to 1,797,000 (in 2007) and create jobs accordingly. In fact, the poor have always
been an integral part of the city’s initiatives, and have benefited from community housing and small
business assistance programs. Through an innovative waste collection and recycling programme, the
poor can exchange collected waste for transport coupons and food.
In the Mediterranean region, the Amman Master Plan (AMP) provides one of the most
comprehensive examples of strategic urban planning. The AMP envisions the future of the Greater
Amman Municipality (GAM), a city that should absorb a population of 4 million new residents by
2025, and determines the location of high-density, mixed-use (HDMU) development in selected areas
and the conditions for their development. HDMU development will be banned in red zones
corresponding to landslide areas, heritage sites, and important cultural sites, as well as industrial areas
and transportation transfer stations. Sites suitable for HDMU development are identified as green
zones, while other possibilities might eventually be considered in orange zones in which development
can take place.
The massive investments required for building new transportation infrastructure and the
opportunity cost of losing agricultural land in coastal areas make the construction of high-rise
buildings an attractive proposition. Social equity can be enhanced if public authorities collect a larger
share of the additional land rent generated by urban expansion. In particular, the introduction of
payment for development rights can generate public revenues that would render the greening of
existing urban areas more affordable (box 2.7).
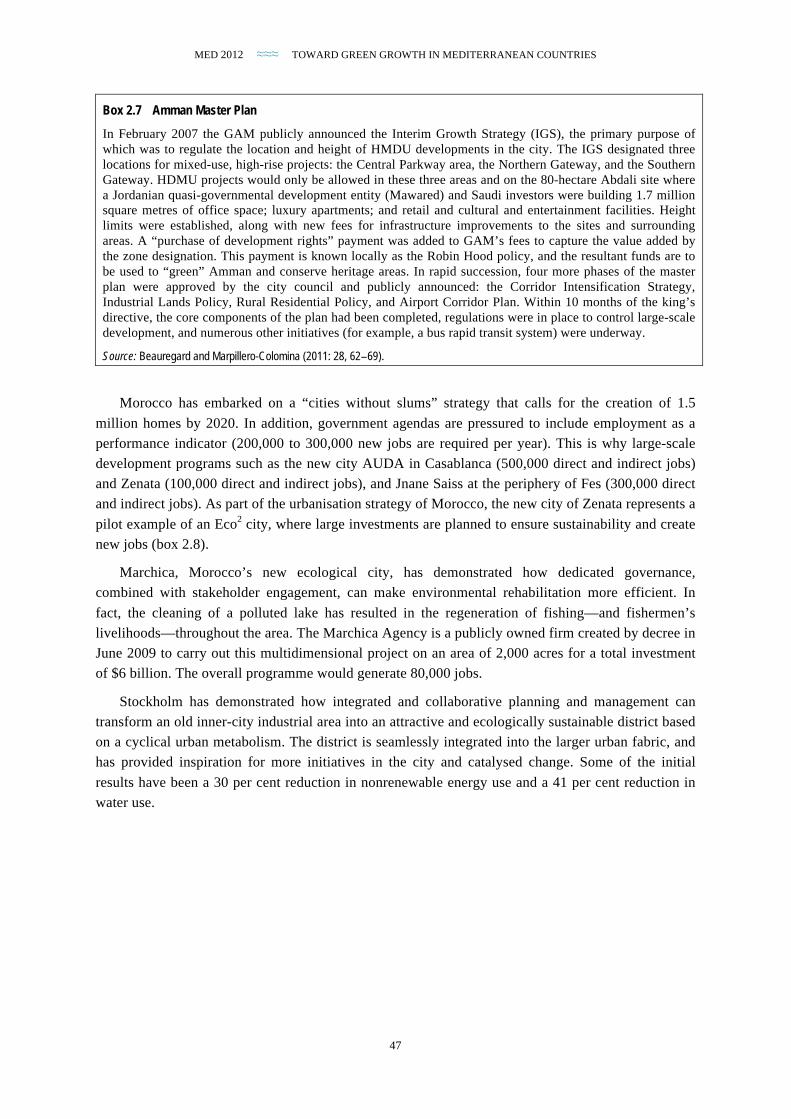
MED 2012 ≈≈≈ TOWARD GREEN GROWTH IN MEDITERRANEAN COUNTRIES
47
Box 2.7 Amman Master Plan
In February 2007 the GAM publicly announced the Interim Growth Strategy (IGS), the primary purpose of which was to regulate the location and height of HMDU developments in the city. The IGS designated three locations for mixed-use, high-rise projects: the Central Parkway area, the Northern Gateway, and the Southern Gateway. HDMU projects would only be allowed in these three areas and on the 80-hectare Abdali site where a Jordanian quasi-governmental development entity (Mawared) and Saudi investors were building 1.7 million square metres of office space; luxury apartments; and retail and cultural and entertainment facilities. Height limits were established, along with new fees for infrastructure improvements to the sites and surrounding areas. A “purchase of development rights” payment was added to GAM’s fees to capture the value added by the zone designation. This payment is known locally as the Robin Hood policy, and the resultant funds are to be used to “green” Amman and conserve heritage areas. In rapid succession, four more phases of the master plan were approved by the city council and publicly announced: the Corridor Intensification Strategy, Industrial Lands Policy, Rural Residential Policy, and Airport Corridor Plan. Within 10 months of the king’s directive, the core components of the plan had been completed, regulations were in place to control large-scale development, and numerous other initiatives (for example, a bus rapid transit system) were underway.
Source: Beauregard and Marpillero-Colomina (2011: 28, 62−69).
Morocco has embarked on a “cities without slums” strategy that calls for the creation of 1.5
million homes by 2020. In addition, government agendas are pressured to include employment as a
performance indicator (200,000 to 300,000 new jobs are required per year). This is why large-scale
development programs such as the new city AUDA in Casablanca (500,000 direct and indirect jobs)
and Zenata (100,000 direct and indirect jobs), and Jnane Saiss at the periphery of Fes (300,000 direct
and indirect jobs). As part of the urbanisation strategy of Morocco, the new city of Zenata represents a
pilot example of an Eco2 city, where large investments are planned to ensure sustainability and create
new jobs (box 2.8).
Marchica, Morocco’s new ecological city, has demonstrated how dedicated governance,
combined with stakeholder engagement, can make environmental rehabilitation more efficient. In
fact, the cleaning of a polluted lake has resulted in the regeneration of fishing—and fishermen’s
livelihoods—throughout the area. The Marchica Agency is a publicly owned firm created by decree in
June 2009 to carry out this multidimensional project on an area of 2,000 acres for a total investment
of $6 billion. The overall programme would generate 80,000 jobs.
Stockholm has demonstrated how integrated and collaborative planning and management can
transform an old inner-city industrial area into an attractive and ecologically sustainable district based
on a cyclical urban metabolism. The district is seamlessly integrated into the larger urban fabric, and
has provided inspiration for more initiatives in the city and catalysed change. Some of the initial
results have been a 30 per cent reduction in nonrenewable energy use and a 41 per cent reduction in
water use.
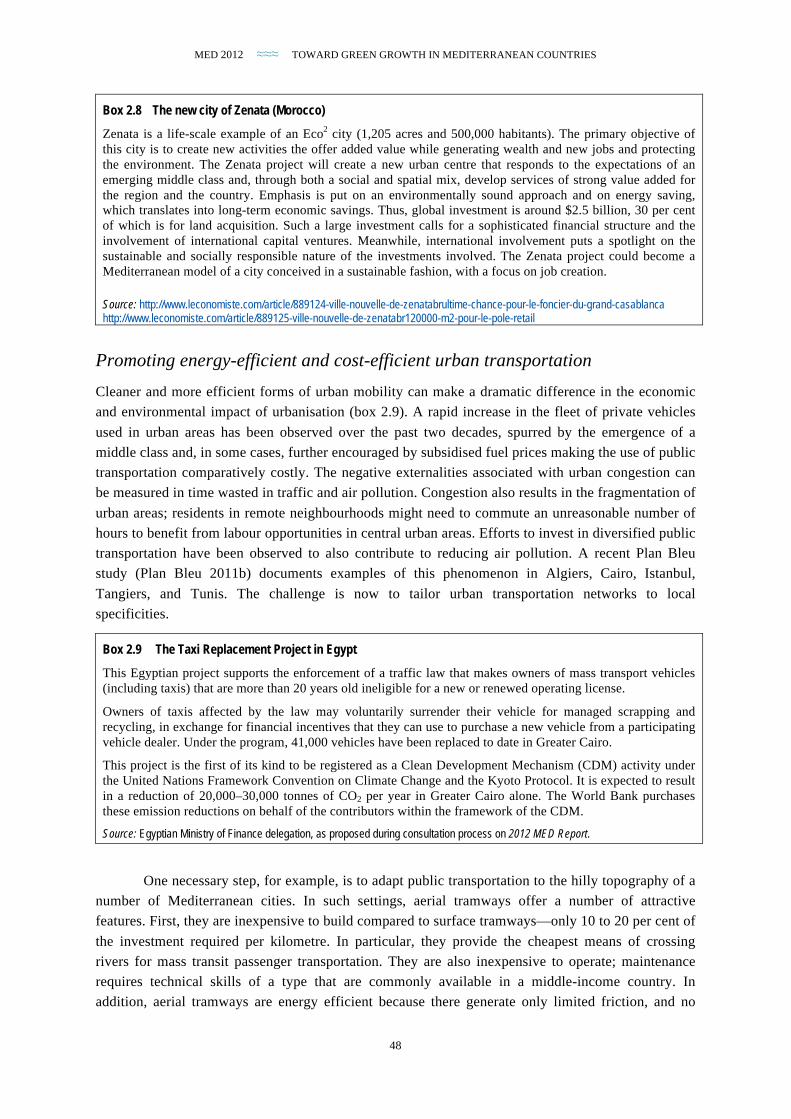
MED 2012 ≈≈≈ TOWARD GREEN GROWTH IN MEDITERRANEAN COUNTRIES
48
Box 2.8 The new city of Zenata (Morocco)
Zenata is a life-scale example of an Eco2 city (1,205 acres and 500,000 habitants). The primary objective of this city is to create new activities the offer added value while generating wealth and new jobs and protecting the environment. The Zenata project will create a new urban centre that responds to the expectations of an emerging middle class and, through both a social and spatial mix, develop services of strong value added for the region and the country. Emphasis is put on an environmentally sound approach and on energy saving, which translates into long-term economic savings. Thus, global investment is around $2.5 billion, 30 per cent of which is for land acquisition. Such a large investment calls for a sophisticated financial structure and the involvement of international capital ventures. Meanwhile, international involvement puts a spotlight on the sustainable and socially responsible nature of the investments involved. The Zenata project could become a Mediterranean model of a city conceived in a sustainable fashion, with a focus on job creation.
Source: http://www.leconomiste.com/article/889124-ville-nouvelle-de-zenatabrultime-chance-pour-le-foncier-du-grand-casablanca http://www.leconomiste.com/article/889125-ville-nouvelle-de-zenatabr120000-m2-pour-le-pole-retail
Promoting energy-efficient and cost-efficient urban transportation Cleaner and more efficient forms of urban mobility can make a dramatic difference in the economic
and environmental impact of urbanisation (box 2.9). A rapid increase in the fleet of private vehicles
used in urban areas has been observed over the past two decades, spurred by the emergence of a
middle class and, in some cases, further encouraged by subsidised fuel prices making the use of public
transportation comparatively costly. The negative externalities associated with urban congestion can
be measured in time wasted in traffic and air pollution. Congestion also results in the fragmentation of
urban areas; residents in remote neighbourhoods might need to commute an unreasonable number of
hours to benefit from labour opportunities in central urban areas. Efforts to invest in diversified public
transportation have been observed to also contribute to reducing air pollution. A recent Plan Bleu
study (Plan Bleu 2011b) documents examples of this phenomenon in Algiers, Cairo, Istanbul,
Tangiers, and Tunis. The challenge is now to tailor urban transportation networks to local
specificities.
Box 2.9 The Taxi Replacement Project in Egypt
This Egyptian project supports the enforcement of a traffic law that makes owners of mass transport vehicles (including taxis) that are more than 20 years old ineligible for a new or renewed operating license.
Owners of taxis affected by the law may voluntarily surrender their vehicle for managed scrapping and recycling, in exchange for financial incentives that they can use to purchase a new vehicle from a participating vehicle dealer. Under the program, 41,000 vehicles have been replaced to date in Greater Cairo.
This project is the first of its kind to be registered as a Clean Development Mechanism (CDM) activity under the United Nations Framework Convention on Climate Change and the Kyoto Protocol. It is expected to result in a reduction of 20,000–30,000 tonnes of CO2 per year in Greater Cairo alone. The World Bank purchases these emission reductions on behalf of the contributors within the framework of the CDM.
Source: Egyptian Ministry of Finance delegation, as proposed during consultation process on 2012 MED Report.
One necessary step, for example, is to adapt public transportation to the hilly topography of a
number of Mediterranean cities. In such settings, aerial tramways offer a number of attractive
features. First, they are inexpensive to build compared to surface tramways—only 10 to 20 per cent of
the investment required per kilometre. In particular, they provide the cheapest means of crossing
rivers for mass transit passenger transportation. They are also inexpensive to operate; maintenance
requires technical skills of a type that are commonly available in a middle-income country. In
addition, aerial tramways are energy efficient because there generate only limited friction, and no
MED 2012 ≈≈≈ TOWARD GREEN GROWTH IN MEDITERRANEAN COUNTRIES
49
motorisation of the cabin is required. They also provide high-frequency service—up to every 5 or 20
seconds at times of peak use—and they can traverse steep slopes, and therefore easily connect
neighbourhoods at different elevations. Finally, their impact is extremely limited in terms of land use
and therefore barely affects other modes of transportation during construction. The main downside of
aerial tramways is that their maintenance usually requires a complete suspension of operations during
a few days per year. But this has not prevented local urban authorities in settings as various as
Algiers, Barcelona, Medellin, Rio de Janeiro, and Portland from investing in aerial tramways as a
mass transit option. Among the Mediterranean countries, Algeria offers the best example of an urban
transportation programme making extensive use of an aerial tramway (box 2.10).
Box 2.10 Urban transportation by aerial tramway in Algeria
In Constantine, a city of 750,000 residents, the 1.5-kilometre aerial tramway inaugurated in 2008 has been a great success. It links the central part of the city to an industrial area (147 metres different in elevation). It accommodates up to 24,000 passengers per day (40 cabins of 15 places each, operated from 6 a.m. to 11 p.m.). The same type of equipment is also in operation in Skikda (189,000 residents) and Tlemcen (179,000). Three new lines are under construction in Algiers, and a total of 10 new projects are under way in Algeria as a whole.
Source: La percée du tramway aérien, Ville, Rail et Transport, March 24, 2010.
Lessons Set housing and job creation as top priorities. The priority throughout the Mediterranean region is to
create jobs and stimulate wealth-generating activities, in addition to developing appropriate housing
for the expanding population. Thus, any territorial development initiative should fit into the national
strategic agenda, as should the goal of sustainability. Green growth means optimal and long-term
development on the one hand; on the other hand, it focuses on social concerns and involves civil
society actors as partners in the urbanisation process. In fact, urbanisation performance should be
evaluated based on household stability, job creation, organised mobility systems, and a positive
environmental assessment.
Establish public and private sector partnerships to support green growth. The main challenge
faced by large urbanisation programs is to identify appropriate sources of finance. Large investments
are called for when setting up new urban centres and restructuring existing cities. Such investments
require the involvement of both the public and the private sector. Thus, pension funds and investment
funds with long-term horizons will be the most appropriate for such initiatives. The example of the
new city of Zenata is very illustrative, as it is managed through the development arm of Caisse de
Dépôt et de Gestion, which managed a public sector pension fund of around €40 billion. Tunisia has
also started work in establishing a similar model for the expansion and sustainable development of its
cities, with job creation as the primary objective. Defining projects that are bankable paves the way
for the successful public-private partnerships (PPPs) required to support green growth.
Involve civil society and strengthen local governance. Since the Arab Spring, incorporating the voice
of civil society has become increasingly seen as a key to the success of sustainable cities. An
integrated approach requires the involvement of civil society and all stakeholders in every stage of the
process—from conceptualisation to implementation to maintenance and beyond. Improving the
capacity of local governance is key to successful territorial management and sustainable urbanisation.
MED 2012 ≈≈≈ TOWARD GREEN GROWTH IN MEDITERRANEAN COUNTRIES
50
Cooperating to make fisheries sustainable
The aims of this section are twofold: first, to assess the current economic and social value of marine
fisheries to the Mediterranean region and, second, and perhaps more important, to estimate the
sector’s potential economic and social value if it were managed optimally. Setting the conditions that
will put marine fisheries on a more sustainable path is critical from an economic and social
standpoint. The immediate goal is to avoid the predicted Tragedy of the Commons (Harding 1968), or
a “race for the last fish” and its attendant destruction of critical marine ecosystems, the cost of which
will be borne by present and future generations. Meanwhile, effective planning can maximise the
economic benefits to be derived from marine environmental assets over the long run, while
considering employment. These objectives can only be achieved through greater cooperation at the
regional, national, and local levels.
Sustainable fisheries in the Mediterranean have been documented over millennia. Taking
advantage of the great ecological diversity of this enclosed sea, multispecific and multigear fisheries
were developed over time and today have come to represent a particularly important socioeconomic
sector in most of the region’s coastal countries. Fisheries are an important source of nutrition,
employment, and income, and they meet a growing demand for fish products emblematic of the
Mediterranean art of living so prized by tourists. Most if not all Mediterranean fisheries, however,
now face serious challenges resulting from a series of impacts: environmental degradation,
overexploitation of stocks, and poor management of shared resources. In addition, the impacts of
climate change are now starting to be felt, exacerbating the impacts on both ecosystems and species.
These growing difficulties are not specific to the Mediterranean, but rather mirror a global
fisheries crisis that is now abundantly clear. This point is widely documented in recent studies carried
out at a global level by the United Nations Environment Programme (UNEP) (Sumaila 2011), the
World Bank (World Bank, FAO and World Fish Center 2010; Garcia 2009; World Bank 2009e), and
the FAO (2010). These authoritative studies illustrate not only the extent of the problem (85 per cent
of stocks worldwide are either fully exploited, overexploited, depleted, or recovering from depletion),
but also some of the root causes of the problem, including the completely irrational system of
subsidies, which worldwide fuels overfishing to a significant degree.
To the extent possible, results have been updated from various statistical sources (Eurostat,
UNData, FishStat, FAO country profiles) and detailed for each coastal state. Recommendations drawn
at the regional level by the General Fisheries Commission for the Mediterranean (GFCM) European
level in the wake of the preparation of the next Common Fishery Policy and the International
Convention for the Conservation of Atlantic Tuna (ICCAT) have also been incorporated into a new
set of propositions laid out in this report, which focuses on marine fisheries instead of inland captures
and aquaculture.
The total catch from the Mediterranean marine-capture fisheries rose from 420,000 tonnes in
1950 to approximately 1,000,000 tonnes in the 1980s (figure 2.1, left), with a peak of 1,093,000
reached in 1995. The level of catches has been slowly decreasing ever since, with the exception of a
short-burst increase in 2006, which was essentially due to an exceptional level of landings for small
pelagics, species that are very sensitive to environmental variations. The total landed value (figure
2.1, right) presents a different pattern, with a clear peak in 1985 at $3 billion (three times the 1950
value per tonne), followed by a steady decrease to $1.5 billion, which is similar to the value reached
in 1975 in real 2000 dollars. The significant difference in landed values between the southern

MED 2012 ≈≈≈ TOWARD GREEN GROWTH IN MEDITERRANEAN COUNTRIES
51
Mediterranean countries and the northern and eastern Mediterranean countries can be explained by
the very low valorisation for catches sold locally in the southern Mediterranean countries.
While employment in capture fisheries has declined since the 1990s in countries on the northern
shore of the Mediterranean, figures are much higher on the southern shore, where 319,000 individuals
are still employed in the sector, including postharvest (table 2.1). More than 55 per cent of this
workforce is employed in small-scale fisheries, which play an important role in the social fabric and
cultural identity of many Mediterranean coastal regions, and where employment related to capture
fisheries in the southern rim countries can reach almost 1.3 per cent of the total active population.
(The figures do not include aquaculture employment or upstream activities such as boat construction,
engine maintenance, gear manufacture, and so on.)
Figure 2.1 Landings and landed value of regional marine fisheries: 1950–2008
Source: Sea Around Us (landings and values) and CGPM (recent landings). Note: NEMC: North and East Mediterranean countries; SMC: South Mediterranean countries.
Table 2.1 Mediterranean marine capture fishing employment, 2008 (estimates)
Area
Fishing fleet (no. of
vessels) Artisanal
vessels (%)
Direct fisheries
employment (‘000s)
Total employment
(‘000s) Value of catch
($ million) Indirect output
multiplier Indirect output
($ million)
NEMC 49,700 82 102 138 1,136 2.5 2,840
SMC 32,307 85 147 319 175 1.5 263
Total 82,000 83 249 458 1,311 2.4 3,103
Source: FAO FishStat; Sea Around Us project; employment in marine fisheries, including downstream activities, estimated by Plan Bleu from Sacchi (2011) and Dyck and Sumaila (2010); active population of the Mediterranean countries, year 2008, extracted from UNDATA; ratio coastal population /total population: Plan Bleu estimate, from various national sources. Note: NEMC = northern and eastern Mediterranean countries; SMC = southern Mediterranean countries.
In spite of the importance of this sector for so many coastal populations, most of these fisheries
are exploited at an unsustainable level (which directly threatens stocks and leads to the long-term
depletion of the whole sector), increasing economic costs and leading to employment losses. An
analysis prepared for Plan Bleu (Garcia 2011) indicates that in the span of 15 years, from 1991 to
2006, the percentage of fishery resources in the senescent phase has increased from 15 per cent to
MED 2012 ≈≈≈ TOWARD GREEN GROWTH IN MEDITERRANEAN COUNTRIES
52
nearly 60 per cent, affecting especially the most valuable species (bottom fishes, lobsters) and the top
predators (tuna, sharks, and rays), which are known to play key roles in the trophic chain.
The situation is slightly less worrisome in the home fishing areas of the southern rim countries,
where the number of resources in the senescent phase has increased by only a third, while it has more
than doubled in other Mediterranean countries. The essential findings of this analysis are summarised
below.
Marine fisheries are crucial, both socially and economically, to the Mediterranean region,
providing animal protein and supporting food security for over 452,000,000 people (table 2.1).9 An
estimated 32 per cent of this population lives in close proximity to coastal areas, relying on fish
resources not just for food but also for their livelihoods—from fishing and induced activities, but also
increasingly from fishing tourism (Attané, Courbage, and Batisse 2001). Currently, the Mediterranean
fisheries deliver annual revenues that amount to around $1.3 billion and support 458,000 jobs directly
and indirectly (Dyck and Sumaila 2010). When the total direct and indirect economic effects arising
from fish populations in the regional economy are accounted for, the total contribution of the sector to
national economic outputs is estimated at some $3.1 billion a year.
That said, the Mediterranean marine fisheries, particularly those on the northern rim, are not only
overexploited, but have been underperforming in both economic and social terms for decades. The
Mediterranean countries currently generate a negative rent of $1 billion a year from fishing, when the
total cost of fishing ($1.6 billion) and subsidies ($727 million) are deducted from the total value of
$1.3 billion that fishing generates (table 2.2). (This appalling result does not extend to all fisheries,
however, as some southern artisanal fisheries still succeed in generating positive rents—see Idrissi
and others 2003.)
Investments that will help achieve sustainable levels of fishing can secure a vital revenue stream
in the long run. If the current path is maintained, overexploitation and operating deficits will increase,
requiring still higher subsidies. Any effort to increase the sustainability of fisheries will require a
reorientation of public expenditures, in particular a reduction in harmful subsidies. It is imperative
that fisheries management be strengthened to allow overfished and depleted stocks to recover. This
can be accomplished, for example, by decommissioning vessels and equitably relocating employment
in the short term. It is estimated that an investment of $3 billion10 would reduce excess capacity, allow
depleted stocks to recover, and could result in a 66 per cent increase of catch per unit effort (CPUE) in
the long term, in spite of an expected 17 per cent drop in total Mediterranean catches.
Transitioning Mediterranean fisheries to a sustainable model would dramatically increase their
resource rent, from a negative $1 billion to an estimated positive $315 million year. The total value
added to the economy of the region from fishing in such a scenario is estimated at $668 million year,
compared to the current negative $222 million. Not accounting for the potential boost to recreational
fisheries and multiplier and nonmarket values that are likely to be realised, the potential present value
of reforming fisheries is at least six times the cost of required investment.11
9 Population of the Mediterranean countries estimated by Plan Bleu, from the World Development Index for the year 2008. 10 This figure is based on the estimated reduction of fishing effort of sustainable fisheries scenario (see table 2.2) and on average costs of vessel buyback and of crew retraining used by Sumaila (2011). 11 The present value of benefits induced by the sustainable fisheries scenario is estimated by discounting the yearly flow of change in added value between current situation and sustainable fisheries scenarios (that is, $929 million) over the next 50 years at 3 percent and 5 percent.

MED 2012 ≈≈≈ TOWARD GREEN GROWTH IN MEDITERRANEAN COUNTRIES
53
Bringing and keeping the capacity of the fishing fleets in line with the sustainable fishing scenario
will improve the wealth of the nation and the individual revenues of remaining fishermen but will
inevitably lead to less overall employment in the catching sector. It should be considered, however,
that the employment losses could be more significant in the business-as-usual scenario. History shows
us that overexploitation can lead to disasters, as in the case of cod exploitation in Newfoundland, the
largest cod fishery in the world, where the industry and associated employment collapsed entirely in
the early 1990s. Because of irreversible changes to the ecosystem, Newfoundland’s cod industry has
not recovered to date in spite of a moratorium on fishing. Making fisheries sustainable through
reform—and implementing this reform in such a way as to cushion the effect on impacted
populations—is a key issue of political import.
Table 2.2 Sustainable fisheries, key economic figures; Comparison between two scenarios, current situation and sustainable fisheries as modelled
Source: Methods from Sumaila (2011), World Bank (2009e), Arnason (2007b), Srinivasan (2010), and Lam and others (2010). Data from Sea Around us Project and FishStatJ.
A number of other available management tools and funding sources can be used to move the
regional fisheries sector from its current underperforming state to one that delivers higher, but socially
acceptable benefits, while achieving sustainable levels of fishing in the long run for the benefit of
current and future generations. The necessary downsizing of the fleet should be carried out with a
view to protecting small-scale fisheries and associated and dependent coastal communities, while
allowing larger fleets to undergo the necessary adaptations. To that end, two differentiated
management regimes could be envisaged: one, designed for large-scale fleets with capacity
adjustment and economic efficiency at the core, and the other, targeted at small-scale fleets in coastal
communities with a focus on social objectives. In line with the principles of the future European
Common Fisheries Policy (CFP), arrangements for the large-scale segment could include economic
incentives for fleet adaptation such as market-based allocation mechanisms, while small-scale coastal
fisheries would be managed through direct allocation of quotas or effort or through collective
schemes. The approach to public financial support could be different for the two segments: the large-
scale fleet would be expected to be economically self-reliant, while public funding may help the
small-scale segment adapt to changing conditions toward more sustainable fisheries, thereby
strengthening its economic viability, and maintaining its contribution to the life of coastal
communities. These proposals are illustrated in the two following cases: the first, about the
emblematic Bluefin Tuna large scale fishery and, the second, presenting reforms in the Moroccan
small-scale artisanal fisheries.
Unit Current situation Sustainable fisheries
Harvest thousands of tonnes 1,053 876
Fishing effort Index 1 0.46
Price of landings $ / tonne 1,300 1,600
Value of landing $ millions 1,345 1,415
Cost of fishing $ millions 1,618 736
Subsidies $ millions 727 363
Rent $ millions –999 315
Wages $ millions 631 287
Payment to capital $ millions 146 66
Total value-added $ millions –222 668
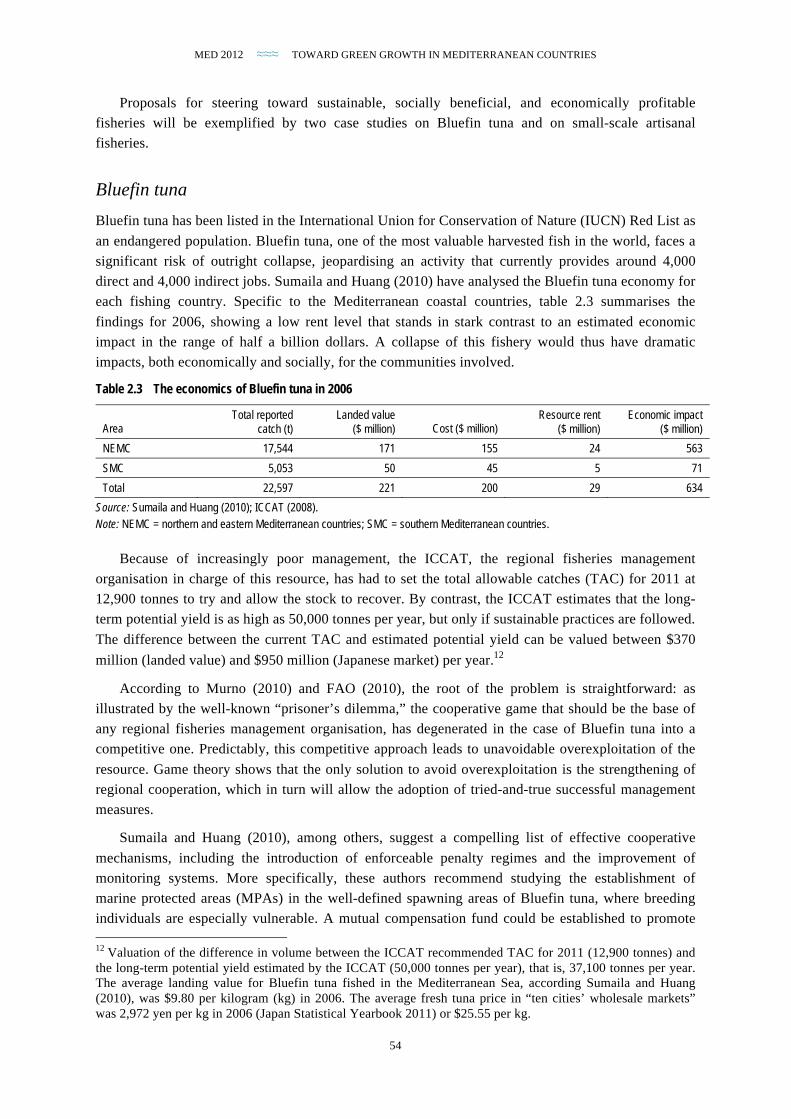
MED 2012 ≈≈≈ TOWARD GREEN GROWTH IN MEDITERRANEAN COUNTRIES
54
Proposals for steering toward sustainable, socially beneficial, and economically profitable
fisheries will be exemplified by two case studies on Bluefin tuna and on small-scale artisanal
fisheries.
Bluefin tuna Bluefin tuna has been listed in the International Union for Conservation of Nature (IUCN) Red List as
an endangered population. Bluefin tuna, one of the most valuable harvested fish in the world, faces a
significant risk of outright collapse, jeopardising an activity that currently provides around 4,000
direct and 4,000 indirect jobs. Sumaila and Huang (2010) have analysed the Bluefin tuna economy for
each fishing country. Specific to the Mediterranean coastal countries, table 2.3 summarises the
findings for 2006, showing a low rent level that stands in stark contrast to an estimated economic
impact in the range of half a billion dollars. A collapse of this fishery would thus have dramatic
impacts, both economically and socially, for the communities involved.
Table 2.3 The economics of Bluefin tuna in 2006
Area Total reported
catch (t) Landed value
($ million) Cost ($ million) Resource rent
($ million) Economic impact
($ million)
NEMC 17,544 171 155 24 563
SMC 5,053 50 45 5 71
Total 22,597 221 200 29 634
Source: Sumaila and Huang (2010); ICCAT (2008). Note: NEMC = northern and eastern Mediterranean countries; SMC = southern Mediterranean countries.
Because of increasingly poor management, the ICCAT, the regional fisheries management
organisation in charge of this resource, has had to set the total allowable catches (TAC) for 2011 at
12,900 tonnes to try and allow the stock to recover. By contrast, the ICCAT estimates that the long-
term potential yield is as high as 50,000 tonnes per year, but only if sustainable practices are followed.
The difference between the current TAC and estimated potential yield can be valued between $370
million (landed value) and $950 million (Japanese market) per year.12
According to Murno (2010) and FAO (2010), the root of the problem is straightforward: as
illustrated by the well-known “prisoner’s dilemma,” the cooperative game that should be the base of
any regional fisheries management organisation, has degenerated in the case of Bluefin tuna into a
competitive one. Predictably, this competitive approach leads to unavoidable overexploitation of the
resource. Game theory shows that the only solution to avoid overexploitation is the strengthening of
regional cooperation, which in turn will allow the adoption of tried-and-true successful management
measures.
Sumaila and Huang (2010), among others, suggest a compelling list of effective cooperative
mechanisms, including the introduction of enforceable penalty regimes and the improvement of
monitoring systems. More specifically, these authors recommend studying the establishment of
marine protected areas (MPAs) in the well-defined spawning areas of Bluefin tuna, where breeding
individuals are especially vulnerable. A mutual compensation fund could be established to promote 12 Valuation of the difference in volume between the ICCAT recommended TAC for 2011 (12,900 tonnes) and the long-term potential yield estimated by the ICCAT (50,000 tonnes per year), that is, 37,100 tonnes per year. The average landing value for Bluefin tuna fished in the Mediterranean Sea, according Sumaila and Huang (2010), was $9.80 per kilogram (kg) in 2006. The average fresh tuna price in “ten cities’ wholesale markets” was 2,972 yen per kg in 2006 (Japan Statistical Yearbook 2011) or $25.55 per kg.
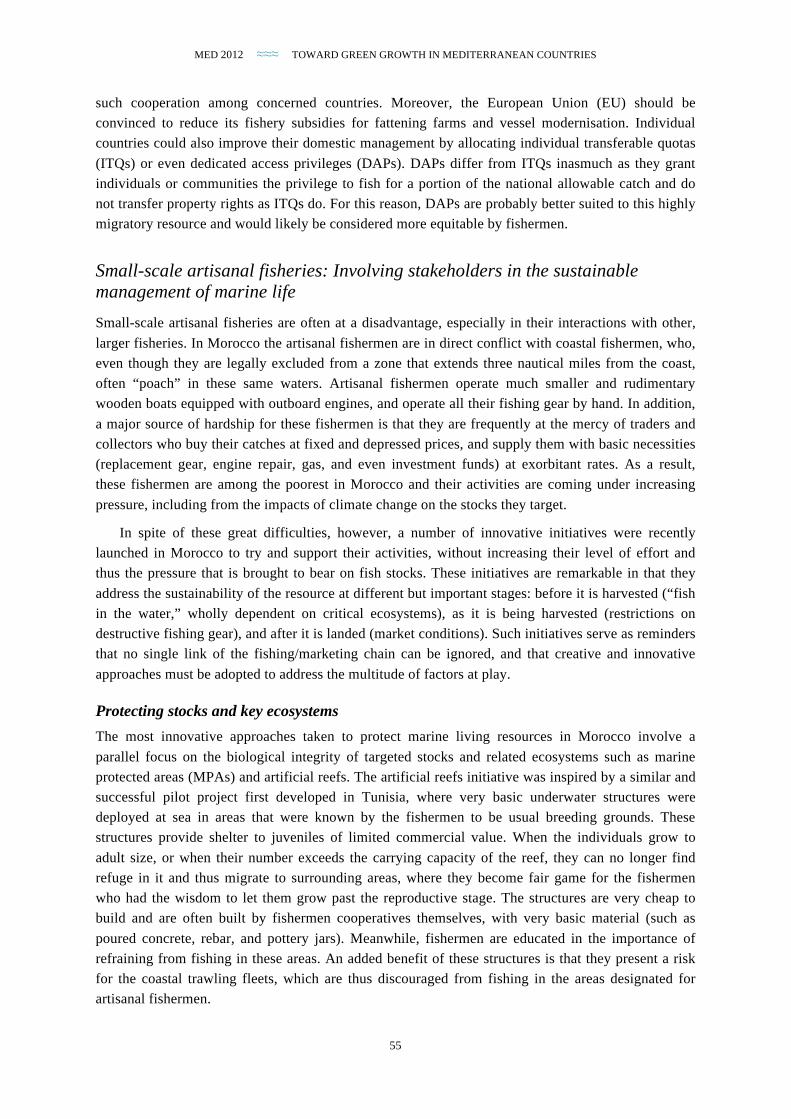
MED 2012 ≈≈≈ TOWARD GREEN GROWTH IN MEDITERRANEAN COUNTRIES
55
such cooperation among concerned countries. Moreover, the European Union (EU) should be
convinced to reduce its fishery subsidies for fattening farms and vessel modernisation. Individual
countries could also improve their domestic management by allocating individual transferable quotas
(ITQs) or even dedicated access privileges (DAPs). DAPs differ from ITQs inasmuch as they grant
individuals or communities the privilege to fish for a portion of the national allowable catch and do
not transfer property rights as ITQs do. For this reason, DAPs are probably better suited to this highly
migratory resource and would likely be considered more equitable by fishermen.
Small-scale artisanal fisheries: Involving stakeholders in the sustainable management of marine life Small-scale artisanal fisheries are often at a disadvantage, especially in their interactions with other,
larger fisheries. In Morocco the artisanal fishermen are in direct conflict with coastal fishermen, who,
even though they are legally excluded from a zone that extends three nautical miles from the coast,
often “poach” in these same waters. Artisanal fishermen operate much smaller and rudimentary
wooden boats equipped with outboard engines, and operate all their fishing gear by hand. In addition,
a major source of hardship for these fishermen is that they are frequently at the mercy of traders and
collectors who buy their catches at fixed and depressed prices, and supply them with basic necessities
(replacement gear, engine repair, gas, and even investment funds) at exorbitant rates. As a result,
these fishermen are among the poorest in Morocco and their activities are coming under increasing
pressure, including from the impacts of climate change on the stocks they target.
In spite of these great difficulties, however, a number of innovative initiatives were recently
launched in Morocco to try and support their activities, without increasing their level of effort and
thus the pressure that is brought to bear on fish stocks. These initiatives are remarkable in that they
address the sustainability of the resource at different but important stages: before it is harvested (“fish
in the water,” wholly dependent on critical ecosystems), as it is being harvested (restrictions on
destructive fishing gear), and after it is landed (market conditions). Such initiatives serve as reminders
that no single link of the fishing/marketing chain can be ignored, and that creative and innovative
approaches must be adopted to address the multitude of factors at play.
Protecting stocks and key ecosystems The most innovative approaches taken to protect marine living resources in Morocco involve a
parallel focus on the biological integrity of targeted stocks and related ecosystems such as marine
protected areas (MPAs) and artificial reefs. The artificial reefs initiative was inspired by a similar and
successful pilot project first developed in Tunisia, where very basic underwater structures were
deployed at sea in areas that were known by the fishermen to be usual breeding grounds. These
structures provide shelter to juveniles of limited commercial value. When the individuals grow to
adult size, or when their number exceeds the carrying capacity of the reef, they can no longer find
refuge in it and thus migrate to surrounding areas, where they become fair game for the fishermen
who had the wisdom to let them grow past the reproductive stage. The structures are very cheap to
build and are often built by fishermen cooperatives themselves, with very basic material (such as
poured concrete, rebar, and pottery jars). Meanwhile, fishermen are educated in the importance of
refraining from fishing in these areas. An added benefit of these structures is that they present a risk
for the coastal trawling fleets, which are thus discouraged from fishing in the areas designated for
artisanal fishermen.
MED 2012 ≈≈≈ TOWARD GREEN GROWTH IN MEDITERRANEAN COUNTRIES
56
In parallel, the Kingdom of Morocco has recently launched a national initiative focusing on
MPAs. Here again, the approach is predicated upon the recognition that some critical habitats must be
protected from destructive fishing practices and that stocks must be spared at least during some of
their life stages (particularly around breeding grounds and nurseries). MPAs are being set up in full
cooperation with the fishermen themselves, and with the understanding that those who bear the costs
of the MPAs (particularly the opportunity cost of not fishing in these areas) will also be the ones who
will reap the benefits expected (in the form of increased biomass in areas surrounding the MPAs).
Improving fish landings. Protecting the fish while they are still in the water is necessary, but far
from sufficient to reduce poverty among artisanal fishermen. While they can expect healthier stocks,
and thus higher CPUE, fishermen also recognise the importance of maintaining the quality of fish
once caught. To that end, a national initiative aimed at improving landing sites and port access was
recently launched, which specifically addresses the need for adequate infrastructures to keep the
catches fresh as long as possible. A network of landing sites is thus being built along both the
Mediterranean and the Atlantic coast, with access to water, electricity, and ice, and open markets
where prices are determined by supply and demand. The goal is for fishermen to increase their
revenue by increasing the quality of the catches they land, without increasing the volume of their
landings.
Encouraging ownership of resources throughout the value chain The final level at which direct support is being provided to the fishermen is through the marketing of
the landed catches. When looking at the value chain for the fisheries sector in Morocco, it quickly
becomes apparent that the largest marginal increase in value occurs very early on, at the so-called first
sale stage, where the fishermen sell and completely lose ownership of their catches. A small number
of fishing cooperatives have attempted to capture that increase in value by grouping and purchasing
all the landings from their members and then reselling to various intermediaries, thus cutting out, to
the extent possible, the middlemen who traditionally take advantage of artisanal fishermen under
pressure.
Although the initiatives described are still at an embryonic stage, some key lessons already stand
out:
• Reducing poverty, in the long run, can only be achieved by increasing the quality of the
catches, not their quantity.
• Efforts cannot be applied to the targeted stocks alone, but instead must take into account key
and related ecosystems.
• Intervention should occur at all stages: when the resources are still in the water, when they are landed, and as they enter the transformation and marketing cycle.
• Small-scale fishermen are almost always better off when they organise and form
cooperatives. These cooperatives in turn must be supported by local, regional, and national
authorities and their capacity expanded.
• Regional lesson sharing is key; for example, the artificial reefs being built in Morocco were
initially piloted in Tunisia for similar fisheries.
• Because fishing initiatives are complex and interrelated, different donors are required to
cooperate to avoid overlap and gaps. The various activities described above were funded by
the Government of Morocco, Japanese bilateral assistance (Japan International Cooperation

MED 2012 ≈≈≈ TOWARD GREEN GROWTH IN MEDITERRANEAN COUNTRIES
57
Agency, or JICA), U.S. bilateral assistance (Millennium Challenge Corporation, or MCC), and the World Bank.
C H A P T E R T H R E E
Environmental Action and Job Creation
≈≈≈ In this chapter
A tense demographic context and a low rate of job creation
Sectoral mechanisms of green impact on economic activity and jobs
Jobs and greening: Neither myth nor automatic dividend
Over the next two decades, 30 to 40 million new jobs must be
created to maintain the current rate of employment in the southern and eastern Mediterranean countries (SEMCs), and even more
jobs are needed to reach full employment. Taking steps to reduce environmental degradation and increase the benefits derived from
natural assets can result in net job creation or the preservation of existing jobs in individual sectors and in the economy as a whole.
But this potential impact is not automatic and will require well-designed policies to maintain or create a sound overall
macroeconomic framework.
A tense demographic context and a low rate of job creation
The coming years will require the SEMCs to create unprecedented numbers of decent jobs to absorb
rising numbers of newcomers to the labour market. This is in part because the age pyramid in these
countries is dominated by young people. Although demographic growth rates have slackened and
fertility rates are converging toward European levels, the impact of high fertility rates in the past is
now being felt. Youth unemployment rates, troubling as they are now, are expected to soar by 2030.
Still more jobs will be required as female participation in the economy increases, and to meet the
needs of the high proportion of the population that is not economically active. Increasing labour
participation would be the easiest way of accelerating economic growth.
Previous chapters have highlighted approaches that seek to increase economic activity (and thus
job creation) using proenvironment policies in certain sectors. Can isolated sectoral effects produce a
net positive impact for the economy as a whole? Provided that environmental policy is well designed,
does green growth hold the potential for net job creation? The answer is a qualified yes. Several

MED 2012 ≈≈≈ TOWARD GREEN GROWTH IN MEDITERRANEAN COUNTRIES
59
macroeconomic analyses have shown that green policies can result in net job creation of significant
magnitude in various regions of the world. Some studies estimate the gain at 10 per cent of the overall
need for new jobs in the SEMCs.
The demographic pattern of the working population and the labour market situation in the 10
SEMCs (Algeria, Egypt, Israel, Jordan, Lebanon, Morocco, Palestine, Syria, Tunisia, and Turkey, all
of which belong to the EuroMed partnership and to which all of the following figures apply) make job
creation the most important objective of the coming years (table 3.1). For every three people in the
region one is under the age of 15 and will soon hope to find work, inflating the labour supply. The
under-15 group represents 81.5 million people in a total population of 269 million. This is not merely
a demographic question or a matter of duelling estimates or expected effects. These are people who
will be looking for work in the coming 20 years, and they are already more numerous than the number
of formal jobs available. The issue is economic, and it is urgent.
There is already a substantial gap between the number of people potentially seeking employment
and the number of jobs formally on offer (187 million people over 15, of which 173 million are
potentially economically active, compared with 74 million jobs currently on offer). The participation
rate, therefore, is below 50 per cent: fewer than half of inhabitants of working age are actively
employed or seeking a job in the SEMCs. Therefore, 96 million people of working age are not
currently in the labour market. A significant number undertake informal work as a matter of survival,
but their productivity is low, and they are relegated to the margins of social protection measures. Thus
the official unemployment rate of 11.6 per cent—8.5 million people—is almost certainly an
underestimate. Bringing informal workers into the formal (and more productive) sector would
increase income and accelerate economic growth.
Table 3.1 Demographic indicators in the southern and eastern Mediterranean labour markets in 2007
Total population *** Number under 15
Proportion under 15
Population of working age (15
and older) Active
population ** [a] Jobs **
269,215,108 81,540,022 30.3% 187,675,086 83,463,607 74,810,990
Table 3.2 Activity indicators in the southern and eastern Mediterranean labour markets in 2007
Population of working age (15 and older)* [1]
Active population 2007** [2]
Number of non active [3]=[1]–[2]
Rate of activity [2]/[1]
No. of unemployed
[4]
Rate of unemployed
[4]/[2]
Number of nonactives
and unemployed
[3]+[4]
187,675,086 83,463,607 95,904,812 44.47% 8,652,617 11.57% 104,557,429 Source: Blanc 2011, based on * UN Population Division quinquennial estimates and projections; ** ILO, LABORSTA Labour Statistics Database; *** World Bank, WDI online. Note: Active population is the sum of the employed and unemployed.
The distribution is very unequal between the European Union’s 27 countries (EU-27) and the
SEMCs. The SEMCs represent 34 per cent of the total population of the Euro-Med region. They have
half of its young population (49.8 per cent of those under 15) but only a quarter of the employees
(25.5 per cent). In other words, Europe currently accounts for 70 per cent of the jobs, but it has less
than half of the population under 15. These figures indicate that the currently active population is
concentrated in the northern Mediterranean, whereas the active population of tomorrow will be
centred in the southern Mediterranean.
MED 2012 ≈≈≈ TOWARD GREEN GROWTH IN MEDITERRANEAN COUNTRIES
60
From 2007 to 2030, the working-age population (those over 15) will increase in the SEMCs by
more than 87 million people, according to the United Nations’ mid-range scenario forecast. These
additional potential workers greatly outnumber the formal jobs currently on offer.
To maintain current activity and unemployment rates in the face of the wave of newcomers, the
SEMCs will have to create 34 million jobs in the coming 20 years—about 1.5 million jobs per year.
That target should be seen as the bare minimum because, even if it is met, the SEMCs will have more
than 150 million non-economically active inhabitants in 2030. (The number of new jobs needed to
maintain the current absolute numbers of nonworking people is around 95 million, or more than 4
million per year from now through 2030.)
Before the 2008 financial crisis and the Arab Spring, the number of jobs in the SEMCs rose at an
annual rate of 2 per cent—around 1.2 million jobs per year. Those figures take into account the
negative growth observed in Turkey, which lost 600,000 jobs between 2005 and 2007. For the nine
other countries, growth in the 2004–07 period preceding the current global crisis exceeded 3.5 per
cent per year, which translates into about 1.8 million jobs created per year. That figure owes much to
Egypt’s performance during the period.
Within the tense demographic context of the SEMCs, the potential for job creation is limited by
several structural factors. Whatever the potential of green growth to create jobs, the actual outcome
will depend on traditional structural policies. (See World Bank 2011c for a recent focus on green
growth and structural policies in South Africa.) As discussed below, some important employment
issues in the SEMCs must be tackled if green growth is to fulfil its potential to create jobs.
First, the public sector can no longer be viewed as the employer of last resort (IMF 2003;
FEMISE 2003). The public sector in the SEMCs is large and shows low productivity; moreover, the
macroeconomic context, coupled with globalization, make it difficult for countries to develop without
cultivating their competitiveness in accordance with international standards. Second, other structural
issues must be solved before the SEMCs can create sufficient productive jobs, among them: (i) the
effects of the large informal sector, (ii) the quality of education and human capital, and (iii) the
effectiveness of institutions that aim to reduce the mismatch between demand for and supply of skills
(World Bank 2004a).
The informal sector in the region accounts for an estimated at 40 per cent of total employment,
according to the International Labour Organization (ILO) (FEMISE 2007), which in good part
explains the low labour-market participation rate shown in table 3.2. A first consequence of the low
participation rate is that attempts to reform labour markets through legal reforms targeting formal
labour seldom bear fruit because they concern only a minority of the working-age population.
Informality is sometimes seen as having positive effects—notably in enabling people to avoid abject
poverty, providing the society with a hedge against social instability (until now), and introducing
some flexibility in labour markets that are considered too rigid by serving as an incubator of firms and
individuals that later join the formal sector. In these respects, the SEMCs’ experiences have been
mixed, and the Arab Spring has now clearly shown that the negative effects of the bloated informal
sector far exceed its purported benefits.
In general, the extent of informality in the region raises three major problems:
• A large share of workers and firms are excluded from the scope and effect of active policies.
• Informal employment, while enabling millions to survive, does not typically meet the standard of a “decent” job or provide social stability.
MED 2012 ≈≈≈ TOWARD GREEN GROWTH IN MEDITERRANEAN COUNTRIES
61
• Informality creates a “low-productivity trap” that exerts pressure on the entire economic
system. This point may be of importance as the region looks to shift to a greener growth
strategy, as productivity issues loom large in shaping the actual effects of green growth measures, a point discussed further on.
• Because informal firms and workers are usually not subject to taxation, government revenues
are raised from a narrow base, requiring higher rates. High rates in turn reduce the return on
investment and increase the barriers for firms moving from the informal to the formal sector.
With regard to education, the SEMCs suffer from a mismatch between educational outcomes and
labour market demand, despite the remarkable progress achieved during the past four decades (World
Bank 2007; FEMISE 2007). The countries of the region consistently allocate as much as 5 per cent of
their gross domestic product (GDP) and around 20 per cent of their government budgets to education,
which has enabled them to push down illiteracy rates, but higher education in the SEMCs still does
not assure the graduate a job. For example, 80 per cent of the unemployed in Egypt have a secondary
education, whereas those with secondary education make up on 42 per cent of the labour force. The
corresponding figures are 44 per cent and 45 per cent in Jordan, 38 per cent and 20 per cent in
Algeria, and 30 per cent and 16 per cent in Morocco.
A second limitation of the region’s education systems lies in the relative prevalence of humanities
and social sciences relative to engineering and sciences. Students of the sciences represent less than
20 per cent of enrolments in most cases, far below the best performers in Asia and Latin America. As
a consequence, the private sector cannot attract the competencies it needs for its development,
especially since so many graduates have incentives to wait for a public sector job or to emigrate. The
mismatch between graduates’ competencies and available jobs lowers the level of total factor
productivity in the region, and this has little to do with the quality of educational systems. This
misallocation of labour factors assumes even greater importance under a green growth strategy that
may create jobs, as potential jobs without workers is only half a solution and a new problem. Lifelong
learning and vocational training systems focused on mid-level qualifications will be necessary to
realise the job-creating potential of green growth.
With regard to institutions, the evidence is that labour market laws and institutions affect job
creation because they skew the allocation of resources, as well as the smoothness and the speed of
allocation. Nearly all studies of the job impact of green policies agree that those two points are key to
realizing the potential of green growth to create jobs. And the labour framework is not the only thing
at stake here: The business environment will play an equally important role. How easy is it to set up a
new business, obtain private domestic financing, or trade internationally? The key role of the business
environment derives from the fact that most green growth outcomes, particularly the short-term
effects, stem from a better allocation of resources and factors. Putting in place frameworks that
support speed and smooth adjustments is a key to success.
It is also clear that a political reform that affects the social contract is a very sensitive and
complex issue in the SEMCs, given social pressure to protect employment. The challenge is to
introduce further flexibility into the social contract, as has already been done on the hiring side (by
introducing temporary contracts), to make it easier for firms to adjust to demand. This can be
successfully tackled only within the context of an expansion of social protection.
Two other issues should be underlined. The first concerns women’s participation to the labour
market. Independently of questions of ethics and equality, designing special vocational training
programs that prepare women to join the labour market would seem to meet the twin objectives of
MED 2012 ≈≈≈ TOWARD GREEN GROWTH IN MEDITERRANEAN COUNTRIES
62
remedying structural impediments to employment in the SEMCs and maximizing their green growth
potential. The second issue relates to training institutions. General education is not the only way to
develop human capital. Vocational training as practiced with good results in Canada, France,
Germany, and elsewhere is probably an efficient method of addressing the skill mismatch issue in the
SEMCs.
To draw maximum benefit from the job creating potential of green growth, the SEMCs will need
to tackle the root causes of the slow pace of job creation. Structural changes to address informality,
make education more relevant, and make the labour market more efficient will interact positively with
green growth measures, as shown in the following pages, to encourage smooth and speedy
adjustments in labour markets.
Mechanisms for green impact on economic activity and jobs
Poor environmental policy has a negative economic impact that is often immediate. But well-designed
and well-implemented environmental policies could also have positive economic effects, even in the
short term. This could be done by treating the environment as an asset and establishing environmental
management policies that preserve and enhance the potential of natural assets. Where this is done,
environmental achievements can improve national macroeconomic performance. To assess the extent
to which policy deficiencies affect economic development and job creation in the SEMCs, one must
understand how (and how intensely) they affect the economy, particularly job creation. This section
will present some channels through which green policies exert their economic effects. Reference will
be made to case studies presented in previous sections of the report to illustrate potential impact of
better environmental policies on jobs and economic growth.
As indicated in the 2012 World Bank report, Inclusive Green Growth: The Pathway to
Sustainable Development, environmental regulation can contribute to growth in various ways, mainly
by (i) increasing factors that contribute to economic production, natural capital, and human capital
through improvements in health, education, cohesion, and stability; (ii) increasing economic
efficiency through better exploitation of existing technologies, which also lowers production costs and
therefore improves competitiveness (as the economy approaches its production frontier); and (iii)
increasing innovation and knowledge spillovers in the overall economy, allowing it to produce more
with fewer resources (that is, shifting the production frontier). Moreover, co-benefits can extend to
social welfare by (i) increasing resilience to environmental and economic shocks (for example, oil
shocks and volatility in commodity prices) and (ii) increasing inclusive growth, as the poorest
households appear to be those most affected by environmental degradation and least able to support
the private costs of remediation.
The environment has specific characteristics relative to other economic assets that may prevent its
efficient use. In particular, the “common property” nature of environmental assets may lead to
inefficient exploitation and often to overexploitation. Moreover, the value of the services it provides is
hard to estimate and, in fact, is commonly underestimated. The rationale for green policies is that they
lead to more efficient uses of natural assets through measures such as taxation, reallocation of
subsidies, and the creation of tradable property rights, among others. These policies change the
structure of production and consumption by affecting relative prices. Doing this in an efficient way
MED 2012 ≈≈≈ TOWARD GREEN GROWTH IN MEDITERRANEAN COUNTRIES
63
may generate economic co-benefits in the short term, which can offset or compensate for the
inevitable cost of applying these policies.
Environmental regulations often increase production costs and promote changes in technologies.
The increase in production costs results in reduced output, and thus reduced employment. But the
change in technology can lead firms to substitute labour for capital and energy, thus modifying the
labour-intensity of the production system and creating jobs. Morgenstern, Pizer, and Shih (2000) find
that this second channel is important in the United States and that the combination of the two channels
leads to job creation in some industries and job destruction in others.
The role of innovation was initially formalised by Porter and Van der Linde (1995). Since that
influential paper appeared, economists’ views of how environmental protection also protects the
economy have evolved. Previously, protection had been considered only as a burden, as firms were
required to allocate inputs and bear new costs to reduce pollution in an essentially unproductive way
that reduced profits. The common view is that in a competitive world efficient firms will take steps to
reduce pollution as a step toward competitive advantage if opportunities to profit from environmental
protection exist. Porter and Van deer Linde proposed a view based on the notion that pollution is often
a waste of resources. Reducing pollution in such a scheme may lead to a more efficient use of
resources and improve productivity, pushing the firm to the production frontier (the “X-efficiency”
argument). The authors argued that well-designed environmental protection can trigger innovation
“that may partially or more than fully offset the costs of complying with them” in some cases.
The so-called Porter analysis is another view in which environmental protection is not always
detrimental to growth. It has stimulated much political (and economic) debate. The chief critique of
the hypothesis rests on the assumption that firms always maximise profit, an assumption questioned
by Porter, especially in presence of imperfect information, imperfectly functioning (or absent)
institutions, and market failures. On the whole, the Porter analysis explains mechanisms of
opportunities rather than stating laws. It does not support the idea that environmental regulations
always lead to innovation (only well-designed regulations do so), or that innovation always offsets
regulation costs. A weak endorsement of the view holds that the Porter mechanism accelerates
innovation but does not necessarily increase firms’ profitability. Others go a step further, arguing that
innovation increases firms’ competitiveness, often completely offsetting regulation costs. Theoretical
papers have explored ways to explain the innovation mechanism, for example, through the rational
behaviour of managers (Aghion and others 1997), the existence of market failures (André and others
2009), organizational failure, and so on. Other papers that have conducted empirical tests; most of
these have found evidence that at least supports the notion of an innovation boost. Results are less
conclusive on the link between environmental protection and productivity and profitability. A positive
link with productivity often appears, but there is a delay before it has a positive effect on profit.
Although inconclusive, these results do indicate that the trade-off between environmental protection
and competitiveness is not as simple or inevitable as is commonly believed.
Jobs and greening: Neither myth nor automatic dividend
There is a growing literature about the relationship between environmental protection and the
economy, particularly in relation to jobs. Meyer (1992), ranking the 50 U.S. states, shows that the
most ambitious in terms of environmental protection were also the ones with the highest levels of

MED 2012 ≈≈≈ TOWARD GREEN GROWTH IN MEDITERRANEAN COUNTRIES
64
growth and job creation over the 1973–89 period. Bedzek (1993, 1995) shows that strict
environmental standards may also foster economic development in U.S. industry and rejects a
negative relationship. Goodstein (1994) tests the relationship between environmental protection and
employment and finds that ex ante estimates of the cost of protection are much higher than their
actual cost. He also discusses the conditions under which environmental protection can lead to
increased employment. Morgenstern, Pizer, and Ahih (1998) show that increases in environmental
spending in heavy polluting industries do not cause net job losses, as the overall demand effect is
mitigated by employment increases associated with new environmental spending. Renner (2000)
estimates that creating environmentally sustainable economies generated 14 million jobs worldwide.
Simulations have estimated the potential net impact of environmental action on jobs. Geller,
DeCicco, and Laitner (1992) estimate the impact of a “high efficiency” scenario for energy-
consuming sectors at 1 million net new jobs in 10 years. Bernow and others (1999) estimate the
impact of U.S. compliance with the Kyoto Protocol and find a potential of 900,000 net new jobs in 10
years. Bedzek, Wending, and Diperna (2008) investigate the link between environmental protection
and the U.S. economy and the qualitative aspects of created jobs. They provide three findings using
an industrial survey in the United States:
• Growth, job creation, and environmental protection are complementary. Investments in environmental protection create and displace jobs, but with a positive net effect.
• Most of the created jobs are conventional ones (such as those of accountants, engineers, and
factory workers); ecology-related jobs are only a small fraction.
• Created jobs are concentrated in manufacturing, professional services, information, and
scientific and technical services.
Some contest the positive net impact of green policies. For Michaels and Murphy (2009), most of
the positive results were found in studies that suffer from methodological weaknesses. Not taking into
account ideological objections (for example, views about Keynes or about the government’s ability to
make efficient choices), Michaels and Murphy highlight some biases that undercut claims of job
creation from green policies. These biases mainly consist of underestimations of the costs of green
programs, underestimation of the impact on other economic sectors of the shift of labour and capital
resources to green activities, the assumption that no skill shortages will appear, and the absence of a
labour productivity effect. The fiscal impact on the overall economy of taxing non-green operations is
also seen as a major drawback that may drive down the growth rate. However, it should be underlined
that the costs of environmental regulations and taxes in most industrial sectors constitute only a minor
part of production costs. Therefore, their impact may be considered marginal relative to other choice
factors such as labour skills, business framework, financial sector efficiency. Hourcade and Quirion
(2004), for example, estimated the impact on marginal cost of a €20 per tonne CO2 tax in the
European Union to be lower than the impact of exchange rates variations, even in energy-intensive
sectors. This negative effect of green taxes is confirmed by an analysis of U.K. firms (Martin and
others 2011), the results of which pointed to a significant positive impact on energy efficiency but no
impact on economic performance. Anger and Oberndorfer (2008) reached the same conclusion in
their study on German firms regarding the impact of the European Emission Trading Scheme.
The U.S. Congressional Budget Office (CBO 2010) reviewed three different studies that
estimated the employment impact of green measures on the U.S. economy. The main findings are not
positive: Green measures will create winners and losers. In the detailed results, the CBO finds an
overall negative effect on manufacturing. This sector will possibly lose net jobs, while higher raw job
MED 2012 ≈≈≈ TOWARD GREEN GROWTH IN MEDITERRANEAN COUNTRIES
65
creation will occur in services. In quantitative terms, the net effect may be positive, but the CBO
points out the risk of high localised costs (for example, in communities that depend heavily on one
losing sector), a negative effect on the real wages of particular workers, and the risk of a decline in
international competitiveness in some industries. Their analysis also highlights that the contents of the
green policies, the adjustment speed of the labour force and capital, and the accompanying adjustment
measures are decisive in determining the final impact.
The German experience with policies to promote renewable energy, considered a model, was
examined by Fondel and others (2009), who take a sceptical view. Examining the German experience
of promoting renewable energy through massive subsidies and guaranteed feed-in tariffs, they find the
programme weak in terms of efficiency, mainly because of the high cost of the achieved reductions in
carbon dioxide (CO2) emissions. Moreover, they find that the overall economic impact of the changes
was small relative to the subsidies provided. The green jobs created under the programme went to
people who were already employed; moreover, those jobs appeared likely to vanish with the end of
subsidies. In the end, the authors argue that the (relative) failure of the German experience (given the
considerable achievement of renewables installation) can be traced to the policy tools used and not the
principle. Better economic impacts might be had with a less distortionary scheme and more public
investment in research and development (R&D), rather than subsidies. However, by focusing on the
economic impact alone, Fondel’s team overlooks the main aim and outcome of the German policies:
The policy objectives were not only to reduce emissions, but also to promote innovation, to reduce
renewable energy costs, and to trigger a long-term transition in the energy system (del Rio Gonzalez
2008; Vogt-Schilb and Hallegatte 2011; Grau and others 2011).
Conte and others (2010) have questioned the potential of green policies in the 27 member
countries of the European Union (EU-27). They examine various policy options (and mixes) in the
EU context designed to allow the EU to meet its 2020 gas emissions target. Policy options differ,
mainly in their capacity to tackle two market failures—first, the absence of spontaneous demand for
green technologies, and second, the lack of incentives for firms to invest green. Through simulations
of GDP growth and employment impacts (among others), the authors find that it is possible to achieve
mutually reinforcing economic and environmental results. The overall impact on growth and jobs may
be negative when the policy mix is not efficient (in particular, when it does not address the two
market failures), but at the same time there are policy mixes that lead, under the same model and in
the same context, to positive gains, both in terms of growth and job creation. The sign of the impact
(gain or loss) as well as the magnitude are therefore dependent on the adopted policy mix, the
efficiency of which does not rely on simple lump sum taxes but on a combination of labour incentives
and R&D measures (in green and other sectors). With appropriate sets, the magnitude of net overall
job gains may vary between +0.15 and +0.30 per cent of total employment. This net positive effect on
European employment is confirmed by Jaeger and others (2011), who find that increasing the
European target for lowering gas emissions by 20 to 30 per cent may lead to the creation of around 6
million new jobs within the EU-27.
The United Nations Environment Programme (UNEP, 2011) reports that “a green economy grows
faster than a brown economy over time, while maintaining and restoring natural capital.” In a green
scenario, additional investments amounting to 2 per cent of global GDP are allocated to the greening
of selected sectors. According to UNEP’s simulation, the average annual rate of job growth between
2011 and 2050 may be between 0.08 and 0.13 per cent higher in the green scenario, despite jobs
losses in sectors based on resource extraction. It is important to note that the additional jobs come not
MED 2012 ≈≈≈ TOWARD GREEN GROWTH IN MEDITERRANEAN COUNTRIES
66
only from the additional amounts invested. Compared to another scenario in which additional
investments equivalent to 2 per cent of GDP are injected into the brown economy, the green scenario
still exhibits higher job creation. Gains are present in the short term and long term (from 6 to 9.5 per
cent of total employment by 2015 and from 1.5 to 1.6 per cent of total employment by 2050). Such
estimates applied to the SEMCs would imply additional net job creation ranging from 440,000 to
750,000 jobs in five years and between 2.8 and 3.3 million new jobs by 2050.
Two recent regional studies produced by Mediterranean institutions show interesting results. The
Arab Forum for Environment and Development (AFED), an international nongovernmental
organization, published a report in November 2011 entitled “Sustainable Transition in a Changing
Arab World.” The authors stipulate that “transitioning to the green economy is not only an option for
the Arab region, rather it is an obligation to secure a proper path to sustainable development.”
Addressing eight sectors—agriculture, water, energy, industry, cities and buildings, transportation,
tourism, and waste management—the report argues that through efficient combinations of public
policies, innovative approaches, business models, and green investment opportunities substantial
gains in job creation and economic growth are possible (box 3.1).
Box 3.1. The green economy in a changing Arab World
In a 2011 report entitled “Green Economy in a Changing Arab World,” the Arab Forum for Environment and Development (AFED) endeavours to explain the underperformance of Arab economies over the past four decades. For the AFED, the countries of the region “have adopted aggressive economic growth models, but in doing so have gravely undermined progress on social and environmental issues.” Inattention to those issues contributed to poverty, unemployment, food and water insecurity, and environmental degradation.
According to the report, “a green economy places great emphasis on the efficient use and deployment of natural assets to diversify the economy, which in turn provides immunity against the volatilities and recessionary pressures of the global economy.” The authors estimate that the average annual cost of environmental degradation in Arab countries is close to 5 per cent of their combined GDP in 2010—about $95 billion.
Nearly all of the analysed sectors can contribute significantly to economic growth. For example, “a 25% per cent reduction in energy subsidies would free up over $100 billion over a three-year period.” That amount could be shifted to finance conversion to green energy sources or to generate other benefits. The report estimates that a 30 per cent reduction in energy requirements, based primarily on more efficient industrial processes, would result in annual savings of 150,000 billion kWh or $12.3 billion. Higher energy efficiency, accompanied by increased use of public transport and hybrid vehicles, could generate annual savings of $23 billion.
Energy efficiency in buildings could also produce huge co-benefits. The report estimates that greater efficiency in buildings has the potential to cut energy consumption by 217 billion kWh, representing annual savings of $17.5 billion and a 29 per cent reduction in projected CO2 emissions by 2020. Moreover, “spending $100 billion in greening 20 per cent of the existing building stock in Arab countries over the next 10 years, by investing an average of $10,000 per building for retrofitting, is expected to create four million jobs.”
“Because it is labour intensive and stimulates the demand for products, systems, and services in other industries” waste management also offers the potential for job creation. Effective waste management would save Arab countries $5.7 billion annually, according to the report.
Source: AFED 2011.
The Economic and Social Council of the Kingdom of Morocco recently published a summary of
its ongoing work on the potential of the green economy in the country (CESRM 2012). The
preliminary results in four sectors (renewable energies, energy efficiency, sewerage and liquid waste
management, and urban solid waste management) point to a potential of almost 100,000 new jobs for
Morocco before 2030 (box 3.2).
MED 2012 ≈≈≈ TOWARD GREEN GROWTH IN MEDITERRANEAN COUNTRIES
67
Box 3.2. The job potential of the green economy in Morocco
The following figures are extracted from “Green Economy: Opportunities for Creating Wealth and Jobs,” a preliminary draft report from the Economic and Social Council of the Kingdom of Morocco (March 2012).
The Council analysed four sectors—renewable energy, energy efficiency, sewage disposal, and management of solid waste—and identified the green jobs potential in each, with the proviso that necessary accompanying measures are put in place.
The analysis reports the following potential for direct job creation, by sector:
• Renewable energy: more than 23,000 jobs by 2025
• Energy efficiency: more than 40,000 jobs by 2030
• Sewage disposal and discharges: 10,000 jobs by 2020
• Solid waste: more than 11,000 jobs by 2025. Among its cross-cutting recommendations and accompanying measures for the transition to a green economy in Morocco, the report lists the following:
• Creating administrative tools to implement and support green economy
• Strengthening financial instruments through the creation of environmental funds
• Diversifying governance, land management, and sectoral management, public and private, with the creation of delegated management agencies
• Mobilisation and commitment of public and private actors, including nongovernmental organisations, to ensure the involvement of all relevant actors, coordinated by renowned NGOs such as the Mohamed VI Foundation for Environmental Protection.
Source: CESRM 2012.
A recent macro-level study of the SEMCs (FEMISE 2011b) suggests that the potential of job
gains from green growth could reach a similar magnitude (3.5 to 4 million in 20 years). The study
simulates the impact on net job creation of reducing environmental degradation in five SEMCs
(Algeria, Egypt, Morocco, Syria, and Tunisia). The value used for environmental degradation ranges
from 2 to 5 per cent of GDP in those countries, according to the Mediterranean Technical Assistance
Program (Croitoru and Sarraf 2010) and other estimates (for example, Bartelmus 2009; Larsen 2011).
In a best-case scenario the simulation shows that by reducing the negative effects of environmental
degradation on productive natural assets, factor productivity, and demand for new products and
services the potential for job creation in the SEMC region could be 6.8 per cent higher in the coming
20 years—accounting for 10 per cent of total necessary job creation.
Such results are important, as they confirm the possibility of sizable net positive effects on the
whole economy. Despite the limitations of such a modelling exercises, they are generally consistent
with the idea that a green growth agenda should not be automatically associated with job losses. They
point to the possibility of potential co-benefits of sizeable magnitude for near-term growth, especially
in certain sectors and when green policies are well combined with other reforms to tackle fundamental
structural issues. The main message of such studies is this: a more efficient and effective green
growth path may generate economic co-benefits, even in terms of jobs, and depends on well-designed
green policy actions taken in a suitable macroeconomic framework.
The limits of the models may be handled by combining sectoral and national approaches for
different countries, though the lack of accurate and comparable data remains a problem. As discussed
in the next chapter, the issue of generating data to monitor and explore the channels of the green
economy should be a high priority.
C H A P T E R F O U R
Doing Green: Assessing Environmental Progress and Identifying Strengths and
Priorities in Environmental Action
≈≈≈ In this chapter
Action-oriented environmental indicators for Mediterranean countries
Using multicriteria analysis to identify strengths and priorities
Assessing subnational environmental performance
Green accounting in the Mediterranean
One key to designing effective green policies is to improve the monitoring of environmental actions. Collecting a large array of indicators of progress and constructing green national accounts can better inform decision makers in the setting of national and local priorities.
Existing indicators allow assessment of various aspects of country-level environmental performance
and can inform decision makers as they identify priorities in public policies aimed at enhancing the
economic benefits of environmental assets.
If Mediterranean countries outside the Organisation for Economic Co-operation and Development
(OECD) were to begin compiling the indicators of environmental effort presented in the OECD’s
recent green growth report (OECD 2011), it would become possible to compare their environmental
performance to that of socioeconomically and geographically comparable OECD countries.
Additional indicators of environmental performance could be devised to better inform decision
makers of the most policy-relevant issues in Mediterranean countries.
Multicriteria analysis can be used to assess areas of comparative strength and priorities in national
environmental performance.
* The authors are grateful to Kirk Hamilton (World Bank) and Myriam Linster (OECD) for useful comments and suggestions.
MED 2012 ≈≈≈ TOWARD GREEN GROWTH IN MEDITERRANEAN COUNTRIES
69
Considering the variance of environmental indicators observed in most Mediterranean countries,
subnational-level data could also help decision makers allocate public investment across districts or
provinces.
Setting up a green national accounts system is useful to provide a more accurate understanding of
national trends in welfare, consumption, and production sustainability, and of the level of efficiency
in societies’ uses of natural resources. The United Nations and the developed countries have begun to
implement a new system of integrated economic environmental accounts, making available strong
expertise and experiences in the field.
Action-oriented environmental indicators for Mediterranean countries
This section examines the availability of action-oriented environmental indicators and argues that the
framework and list of indicators presented in the recent OECD report on green growth should be
regarded as a guide and a source of inspiration for devising additional measures of environmental
performance.
Availability and desirable properties for indicators of environmental performance Two types of indicators are available for Mediterranean countries: on the one hand, macro-level
measures based on the concepts of green national accounting and wealth accounting13; on the other,
indicators that measure the environmental state of specific natural assets.
Action-relevant measures of performance are critical to inform decision makers and assist them in
devising policies and determining paths to follow to reduce environmental degradation, implement
responses effectively, enhance the productivity of environmental assets, and maximise the social
return from natural capital. Environmental performance should be considered using a triple dividend
approach (at both micro and macro levels), meaning that environmental preservation/remediation
should be seen in terms of economic growth and employment, as well as promoting social well-being
and equity.
The assessment of environmental performance could be based on a criterion of proactivity. The
most relevant actions to consider are anticipatory or self-initiated measures. This means that different
stakeholders would be expected to implement voluntary responses aimed at remediation and
prevention, even in the absence of coercion (by international agreements or local regulations).
The recent OECD green growth report released in May 2011 highlights that, although indicators
of environmental state have been extensively collected and analysed during the past decades,
comparatively little is available on outcomes and achievements in environmental policy. In practical
In particular, the environmentally adjusted net domestic product (EDP) approach (Bartelmus 2009); the Index
of Sustainable Economic Well-being (Daly and Cobb 1989); the Genuine Saving and Comprehensive Wealth (World Bank); and the System of Environmental and Economic Accounts (SEEA, UN). Within the SEEA framework, water (and energy) satellite accounts can be constructed and are particularly relevant in the case of Mediterranean countries.
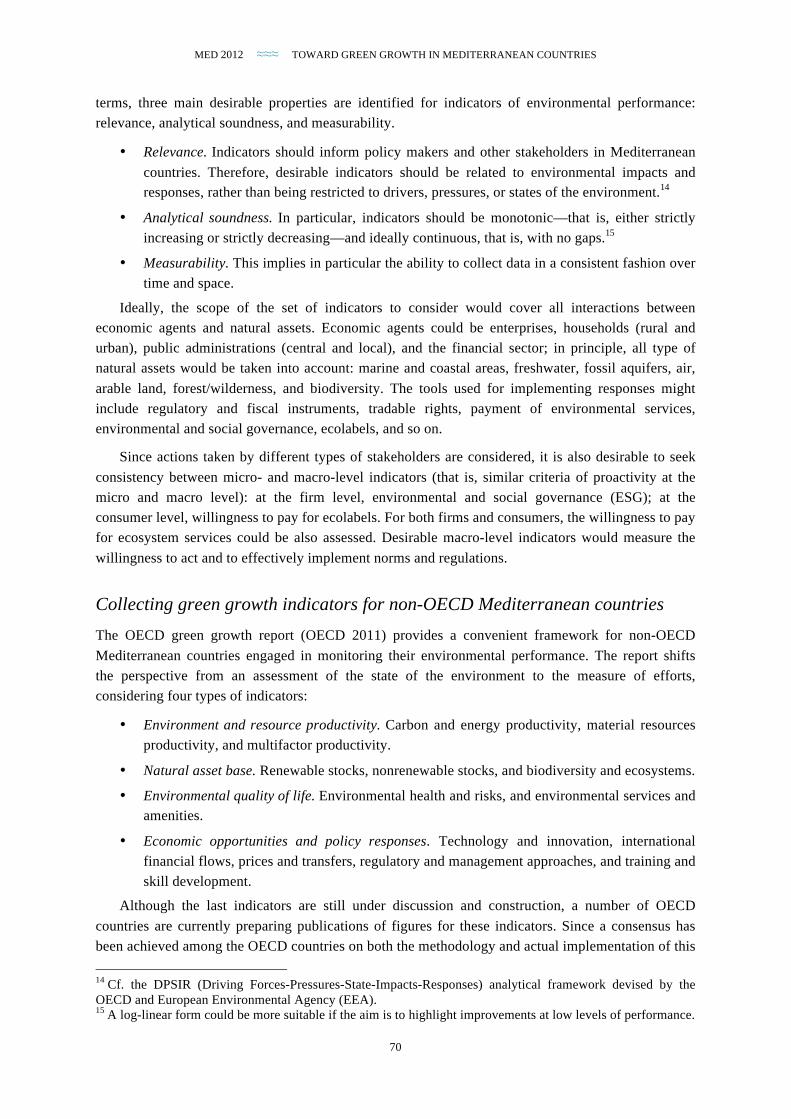
MED 2012 ≈≈≈ TOWARD GREEN GROWTH IN MEDITERRANEAN COUNTRIES
70
terms, three main desirable properties are identified for indicators of environmental performance:
relevance, analytical soundness, and measurability.
• Relevance. Indicators should inform policy makers and other stakeholders in Mediterranean
countries. Therefore, desirable indicators should be related to environmental impacts and responses, rather than being restricted to drivers, pressures, or states of the environment.14
• Analytical soundness. In particular, indicators should be monotonic—that is, either strictly
increasing or strictly decreasing—and ideally continuous, that is, with no gaps.15
• Measurability. This implies in particular the ability to collect data in a consistent fashion over
time and space.
Ideally, the scope of the set of indicators to consider would cover all interactions between
economic agents and natural assets. Economic agents could be enterprises, households (rural and
urban), public administrations (central and local), and the financial sector; in principle, all type of
natural assets would be taken into account: marine and coastal areas, freshwater, fossil aquifers, air,
arable land, forest/wilderness, and biodiversity. The tools used for implementing responses might
include regulatory and fiscal instruments, tradable rights, payment of environmental services,
environmental and social governance, ecolabels, and so on.
Since actions taken by different types of stakeholders are considered, it is also desirable to seek
consistency between micro- and macro-level indicators (that is, similar criteria of proactivity at the
micro and macro level): at the firm level, environmental and social governance (ESG); at the
consumer level, willingness to pay for ecolabels. For both firms and consumers, the willingness to pay
for ecosystem services could be also assessed. Desirable macro-level indicators would measure the
willingness to act and to effectively implement norms and regulations.
Collecting green growth indicators for non-OECD Mediterranean countries The OECD green growth report (OECD 2011) provides a convenient framework for non-OECD
Mediterranean countries engaged in monitoring their environmental performance. The report shifts
the perspective from an assessment of the state of the environment to the measure of efforts,
considering four types of indicators:
• Environment and resource productivity. Carbon and energy productivity, material resources
productivity, and multifactor productivity.
• Natural asset base. Renewable stocks, nonrenewable stocks, and biodiversity and ecosystems.
• Environmental quality of life. Environmental health and risks, and environmental services and amenities.
• Economic opportunities and policy responses. Technology and innovation, international
financial flows, prices and transfers, regulatory and management approaches, and training and
skill development.
Although the last indicators are still under discussion and construction, a number of OECD
countries are currently preparing publications of figures for these indicators. Since a consensus has
been achieved among the OECD countries on both the methodology and actual implementation of this
14 Cf. the DPSIR (Driving Forces-Pressures-State-Impacts-Responses) analytical framework devised by the OECD and European Environmental Agency (EEA). 15 A log-linear form could be more suitable if the aim is to highlight improvements at low levels of performance.

MED 2012 ≈≈≈ TOWARD GREEN GROWTH IN MEDITERRANEAN COUNTRIES
71
programme, the non-OECD Mediterranean countries that collect data would be able to benchmark
their environmental indicators relative to those collected by those OECD countries with similar
socioeconomic conditions and natural constraints (particularly, water stress and climate).
Devising and collecting additional action-oriented indicators Although the approaches and list of indicators presented in the OECD’s 2011 green growth report are
convenient, it is not ideally suited to the natural conditions and priorities of the Mediterranean
countries. Additional indicators could be devised in a similar fashion, in consultation with experts and
policy makers, to cover other environmental assets that are particularly relevant to the Mediterranean.
A tentative typology for additional classes of indicators, with some preliminary examples, could
be as follows:
• Reducing impacts. Minimising natural capital consumption (degradation/depletion), ratio of
harmful to total (including ambiguous) subsidies in fisheries, ratio of fuel subsidies to
“optimal” price (Ley and Boccardo 2009), and share of coastline consumed annually.
• Implementing responses. Addressing environmental degradation and its implications for
human well-being, share of solid waste recycled (per cent of volume), share of consumer
durables covered by ecolabels, and compliance with Global Reporting Initiative guidelines by listed companies (percentage).
• Improving the physical productivity of natural capital. Improving energy efficiency, water
efficiency, and the physical productivity of other environmental assets; water efficiency in
agriculture (by crop, output in tonne per cubic meter of water); and energy efficiency in new residential constructions (energy per square meter).
• Maximising the social return on natural capital. Ensuring social equity in the distribution of
revenues from natural assets, and in the exposure to negative externalities; share of coastal
wasteland reused for new development projects (%); and enforcement of payment for ecosystem services schemes for water catchment areas (%).
Devising indicators of environmental performance, collecting raw data corresponding to these
indicators, and monitoring change over time would allow decision makers to assess the return on
investment (ROI) for various types of environment-related public actions. Regional cooperation is
critical to ensure that the indicators most relevant in the Mediterranean context, in particular those of
water efficiency, can be collected in a consistent manner at regular intervals. The number of countries
should be large enough to allow performing multicriteria analysis or other approaches in the
international comparison of performance. Regional cooperation is also critical to guaranteeing that the
results of the surveys are released in an objective way on a periodic basis.
Public authorities may be concerned that some results indicate poor national-level performance in
certain areas. But since most indicators are influenced by local natural endowments or socioeconomic
conditions, changes over time are at least as important as absolute levels. Granting researchers free
access to a database of national-level indicators of environmental performance would stimulate new
streams of study and generate public interest in national achievements.
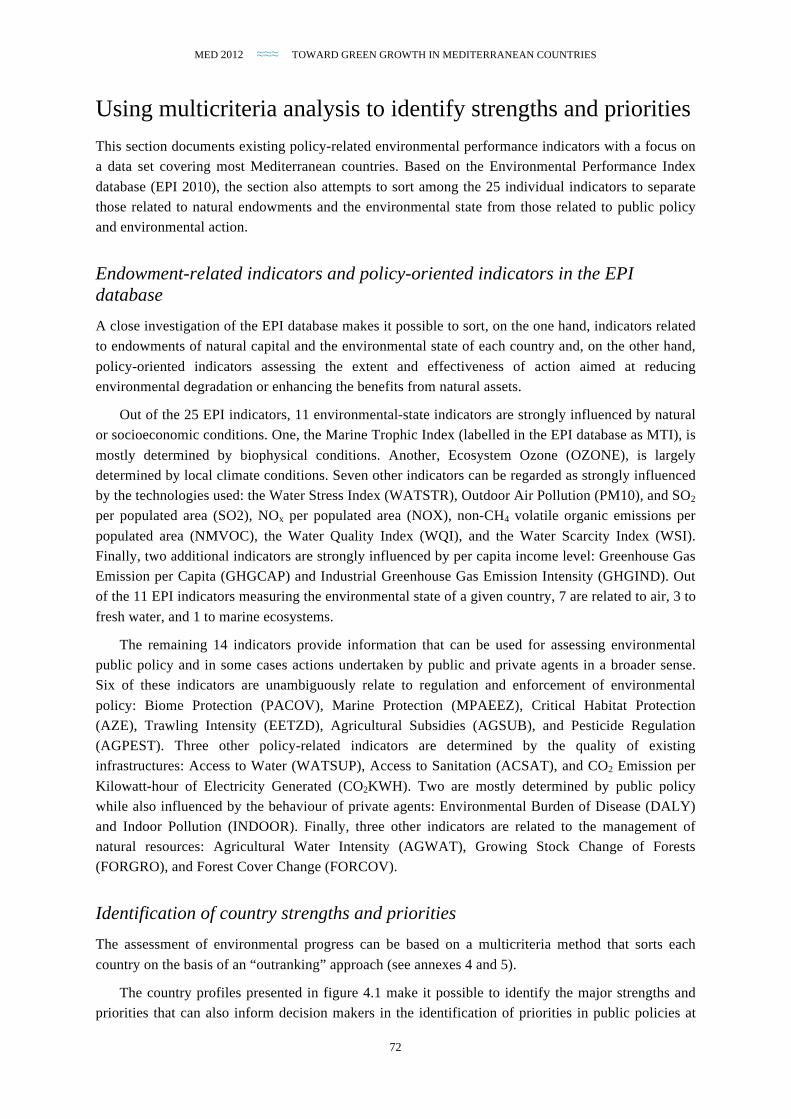
MED 2012 ≈≈≈ TOWARD GREEN GROWTH IN MEDITERRANEAN COUNTRIES
72
Using multicriteria analysis to identify strengths and priorities This section documents existing policy-related environmental performance indicators with a focus on
a data set covering most Mediterranean countries. Based on the Environmental Performance Index
database (EPI 2010), the section also attempts to sort among the 25 individual indicators to separate
those related to natural endowments and the environmental state from those related to public policy
and environmental action.
Endowment-related indicators and policy-oriented indicators in the EPI database A close investigation of the EPI database makes it possible to sort, on the one hand, indicators related
to endowments of natural capital and the environmental state of each country and, on the other hand,
policy-oriented indicators assessing the extent and effectiveness of action aimed at reducing
environmental degradation or enhancing the benefits from natural assets.
Out of the 25 EPI indicators, 11 environmental-state indicators are strongly influenced by natural
or socioeconomic conditions. One, the Marine Trophic Index (labelled in the EPI database as MTI), is
mostly determined by biophysical conditions. Another, Ecosystem Ozone (OZONE), is largely
determined by local climate conditions. Seven other indicators can be regarded as strongly influenced
by the technologies used: the Water Stress Index (WATSTR), Outdoor Air Pollution (PM10), and SO2
per populated area (SO2), NOx per populated area (NOX), non-CH4 volatile organic emissions per
populated area (NMVOC), the Water Quality Index (WQI), and the Water Scarcity Index (WSI).
Finally, two additional indicators are strongly influenced by per capita income level: Greenhouse Gas
Emission per Capita (GHGCAP) and Industrial Greenhouse Gas Emission Intensity (GHGIND). Out
of the 11 EPI indicators measuring the environmental state of a given country, 7 are related to air, 3 to
fresh water, and 1 to marine ecosystems.
The remaining 14 indicators provide information that can be used for assessing environmental
public policy and in some cases actions undertaken by public and private agents in a broader sense.
Six of these indicators are unambiguously relate to regulation and enforcement of environmental
policy: Biome Protection (PACOV), Marine Protection (MPAEEZ), Critical Habitat Protection
(AZE), Trawling Intensity (EETZD), Agricultural Subsidies (AGSUB), and Pesticide Regulation
(AGPEST). Three other policy-related indicators are determined by the quality of existing
infrastructures: Access to Water (WATSUP), Access to Sanitation (ACSAT), and CO2 Emission per
Kilowatt-hour of Electricity Generated (CO2KWH). Two are mostly determined by public policy
while also influenced by the behaviour of private agents: Environmental Burden of Disease (DALY)
and Indoor Pollution (INDOOR). Finally, three other indicators are related to the management of
natural resources: Agricultural Water Intensity (AGWAT), Growing Stock Change of Forests
(FORGRO), and Forest Cover Change (FORCOV).
Identification of country strengths and priorities The assessment of environmental progress can be based on a multicriteria method that sorts each
country on the basis of an “outranking” approach (see annexes 4 and 5).
The country profiles presented in figure 4.1 make it possible to identify the major strengths and
priorities that can also inform decision makers in the identification of priorities in public policies at
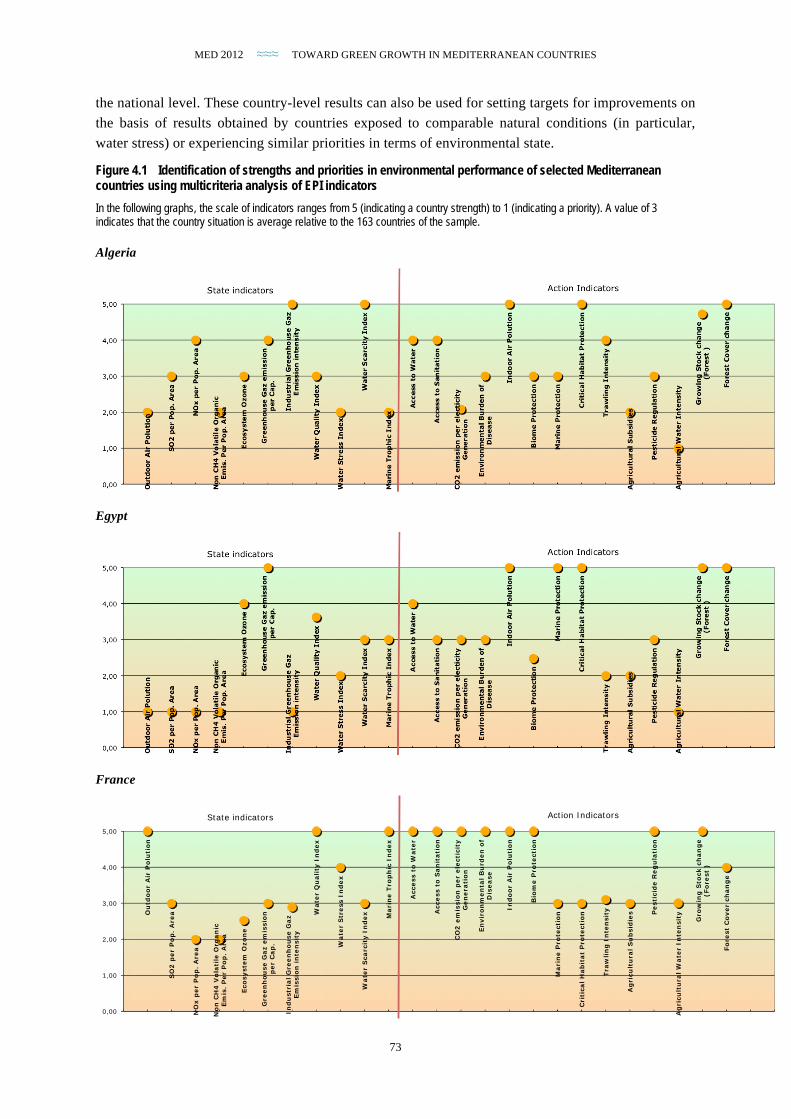
MED 2012 ≈≈≈ TOWARD GREEN GROWTH IN MEDITERRANEAN COUNTRIES
73
the national level. These country-level results can also be used for setting targets for improvements on
the basis of results obtained by countries exposed to comparable natural conditions (in particular,
water stress) or experiencing similar priorities in terms of environmental state.
Figure 4.1 Identification of strengths and priorities in environmental performance of selected Mediterranean countries using multicriteria analysis of EPI indicators In the following graphs, the scale of indicators ranges from 5 (indicating a country strength) to 1 (indicating a priority). A value of 3 indicates that the country situation is average relative to the 163 countries of the sample.
Algeria
Egypt
France
Ou
tdo
or
Air
Po
luti
on
SO
2 p
er
Po
p.
Are
a
NO
x p
er
Po
p.
Are
a
No
n C
H4
Vo
lati
le O
rgan
ic
Em
is.
Per
Po
p.
Are
a
Eco
syste
m O
zo
ne
Gre
en
ho
use G
az e
mis
sio
n
per
Cap
.
In
du
str
ial G
reen
ho
use G
az
Em
issio
n i
nte
nsit
y
Wate
r Q
uality
In
dex
Wate
r S
tress I
nd
ex
Wate
r S
carc
ity I
nd
ex
Mari
ne T
rop
hic
In
dex A
ccess t
o W
ate
r
Access t
o S
an
itati
on
CO
2 e
mis
sio
n p
er
ele
cti
cit
y
Gen
era
tio
n
En
vir
on
men
tal B
urd
en
of
Dis
ease
In
do
or
Air
Po
luti
on
Bio
me P
rote
cti
on
Mari
ne P
rote
cti
on
Cri
tical H
ab
itat
Pro
tecti
on
Tra
wlin
g I
nte
nsit
y
Ag
ricu
ltu
ral S
ub
sid
ies
Pesti
cid
e R
eg
ula
tio
n
Ag
ricu
ltu
ral W
ate
r In
ten
sit
y
Gro
win
g S
tock c
han
ge
(Fo
rest
)
Fo
rest
Co
ver
ch
an
ge
0,00
1,00
2,00
3,00
4,00
5,00
State indicators Action Indicators
Ou
tdo
or
Air
Po
luti
on
SO
2 p
er
Po
p.
Are
a
NO
x p
er
Po
p.
Are
a
No
n C
H4
Vo
lati
le O
rgan
ic
Em
is.
Per
Po
p.
Are
a
Eco
syste
m O
zo
ne
Gre
en
ho
use G
az e
mis
sio
n
per
Cap
.
In
du
str
ial G
reen
ho
use G
az
Em
issio
n i
nte
nsit
y
Wate
r Q
uality
In
dex
Wate
r S
tress I
nd
ex
Wate
r S
carc
ity I
nd
ex
Mari
ne T
rop
hic
In
dex
Access t
o W
ate
r
Access t
o S
an
itati
on
CO
2 e
mis
sio
n p
er
ele
cti
cit
y
Gen
era
tio
n
En
vir
on
men
tal B
urd
en
of
Dis
ease
In
do
or
Air
Po
luti
on
Bio
me P
rote
cti
on
Mari
ne P
rote
cti
on
Cri
tical H
ab
itat
Pro
tecti
on
Tra
wlin
g I
nte
nsit
y
Ag
ricu
ltu
ral S
ub
sid
ies
Pesti
cid
e R
eg
ula
tio
n
Ag
ricu
ltu
ral W
ate
r In
ten
sit
y
Gro
win
g S
tock c
han
ge
(Fo
rest
)
Fo
rest
Co
ver
ch
an
ge
0,00
1,00
2,00
3,00
4,00
5,00
State indicators Action Indicators
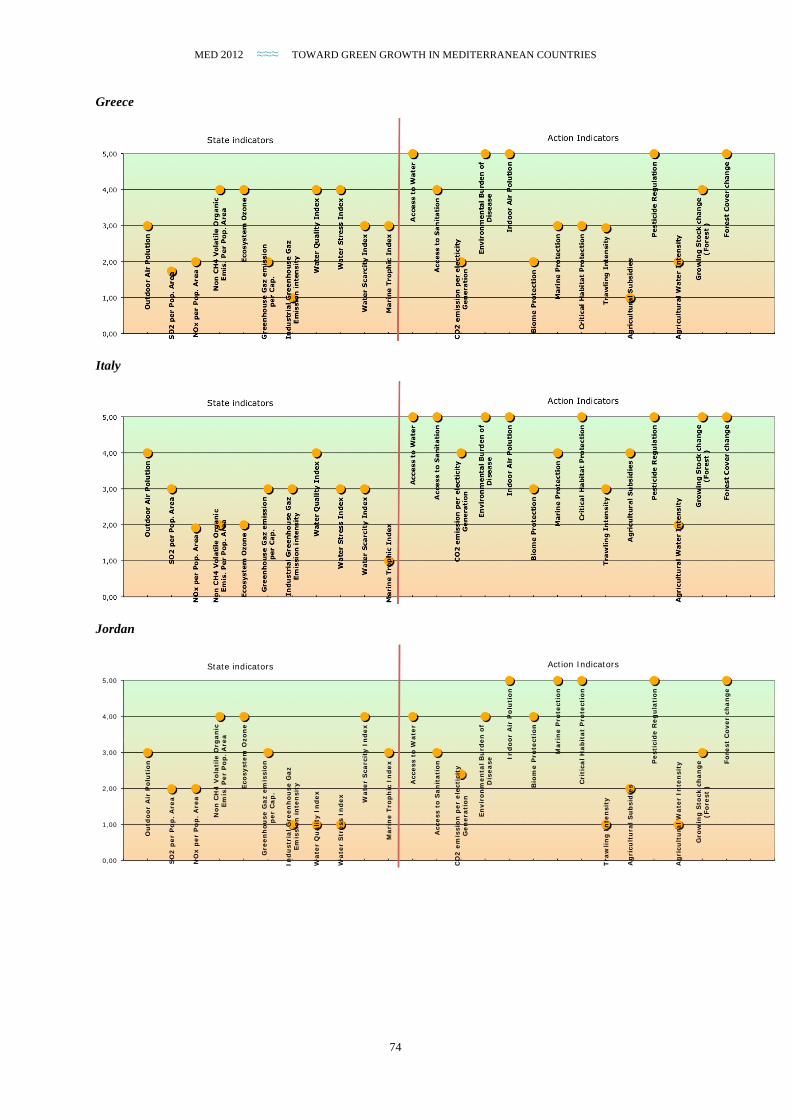
MED 2012 ≈≈≈ TOWARD GREEN GROWTH IN MEDITERRANEAN COUNTRIES
74
Greece
Italy
Jordan
Ou
tdo
or
Air
Po
luti
on
SO
2 p
er
Po
p.
Are
a
NO
x p
er
Po
p.
Are
a
No
n C
H4
Vo
lati
le O
rgan
ic
Em
is.
Per
Po
p.
Are
a
Eco
syste
m O
zo
ne
Gre
en
ho
use G
az e
mis
sio
n
per
Cap
.
In
du
str
ial G
reen
ho
use G
az
Em
issio
n i
nte
nsit
y
Wate
r Q
uality
In
dex
Wate
r S
tress I
nd
ex
Wate
r S
carc
ity I
nd
ex
Mari
ne T
rop
hic
In
dex
Access t
o W
ate
r
Access t
o S
an
itati
on
CO
2 e
mis
sio
n p
er
ele
cti
cit
y
Gen
era
tio
n
En
vir
on
men
tal B
urd
en
of
Dis
ease
In
do
or
Air
Po
luti
on
Bio
me P
rote
cti
on
Mari
ne P
rote
cti
on
Cri
tical H
ab
itat
Pro
tecti
on
Tra
wlin
g I
nte
nsit
y
Ag
ricu
ltu
ral S
ub
sid
ies
Pesti
cid
e R
eg
ula
tio
n
Ag
ricu
ltu
ral W
ate
r In
ten
sit
y
Gro
win
g S
tock c
han
ge
(Fo
rest
)
Fo
rest
Co
ver
ch
an
ge
0,00
1,00
2,00
3,00
4,00
5,00
State indicators Action Indicators O
utd
oo
r A
ir P
olu
tio
n
SO
2 p
er
Po
p.
Are
a
NO
x p
er
Po
p.
Are
a
No
n C
H4
Vo
lati
le O
rgan
ic
Em
is.
Per
Po
p.
Are
a
Eco
syste
m O
zo
ne
Gre
en
ho
use G
az e
mis
sio
n
per
Cap
.
In
du
str
ial G
reen
ho
use G
az
Em
issio
n i
nte
nsit
y
Wate
r Q
uality
In
dex
Wate
r S
tress I
nd
ex
Wate
r S
carc
ity I
nd
ex
Mari
ne T
rop
hic
In
dex
Access t
o W
ate
r
Access t
o S
an
itati
on
CO
2 e
mis
sio
n p
er
ele
cti
cit
y
Gen
era
tio
n
En
vir
on
men
tal B
urd
en
of
Dis
ease
In
do
or
Air
Po
luti
on
Bio
me P
rote
cti
on
Mari
ne P
rote
cti
on
Cri
tical H
ab
itat
Pro
tecti
on
Tra
wlin
g I
nte
nsit
y
Ag
ricu
ltu
ral S
ub
sid
ies
Pesti
cid
e R
eg
ula
tio
n
Ag
ricu
ltu
ral W
ate
r In
ten
sit
y
Gro
win
g S
tock c
han
ge
(Fo
rest
)
Fo
rest
Co
ver
ch
an
ge
0,00
1,00
2,00
3,00
4,00
5,00
State indicators Action Indicators
Ou
tdo
or
Air
Po
luti
on
SO
2 p
er
Po
p.
Are
a
NO
x p
er
Po
p.
Are
a
No
n C
H4
Vo
lati
le O
rgan
ic
Em
is.
Per
Po
p.
Are
a
Eco
syste
m O
zo
ne
Gre
en
ho
use G
az e
mis
sio
n
per
Cap
.
In
du
str
ial G
reen
ho
use G
az
Em
issio
n i
nte
nsit
y
Wate
r Q
uality
In
dex
Wate
r S
tress I
nd
ex
Wate
r S
carc
ity I
nd
ex
Mari
ne T
rop
hic
In
dex
Access t
o W
ate
r
Access t
o S
an
itati
on
CO
2 e
mis
sio
n p
er
ele
cti
cit
y
Gen
era
tio
n
En
vir
on
men
tal B
urd
en
of
Dis
ease In
do
or
Air
Po
luti
on
Bio
me P
rote
cti
on
Mari
ne P
rote
cti
on
Cri
tical H
ab
itat
Pro
tecti
on
Tra
wlin
g I
nte
nsit
y
Ag
ricu
ltu
ral S
ub
sid
ies
Pesti
cid
e R
eg
ula
tio
n
Ag
ricu
ltu
ral W
ate
r In
ten
sit
y
Gro
win
g S
tock c
han
ge
(Fo
rest
)
Fo
rest
Co
ver
ch
an
ge
0,00
1,00
2,00
3,00
4,00
5,00
State indicators Action Indicators
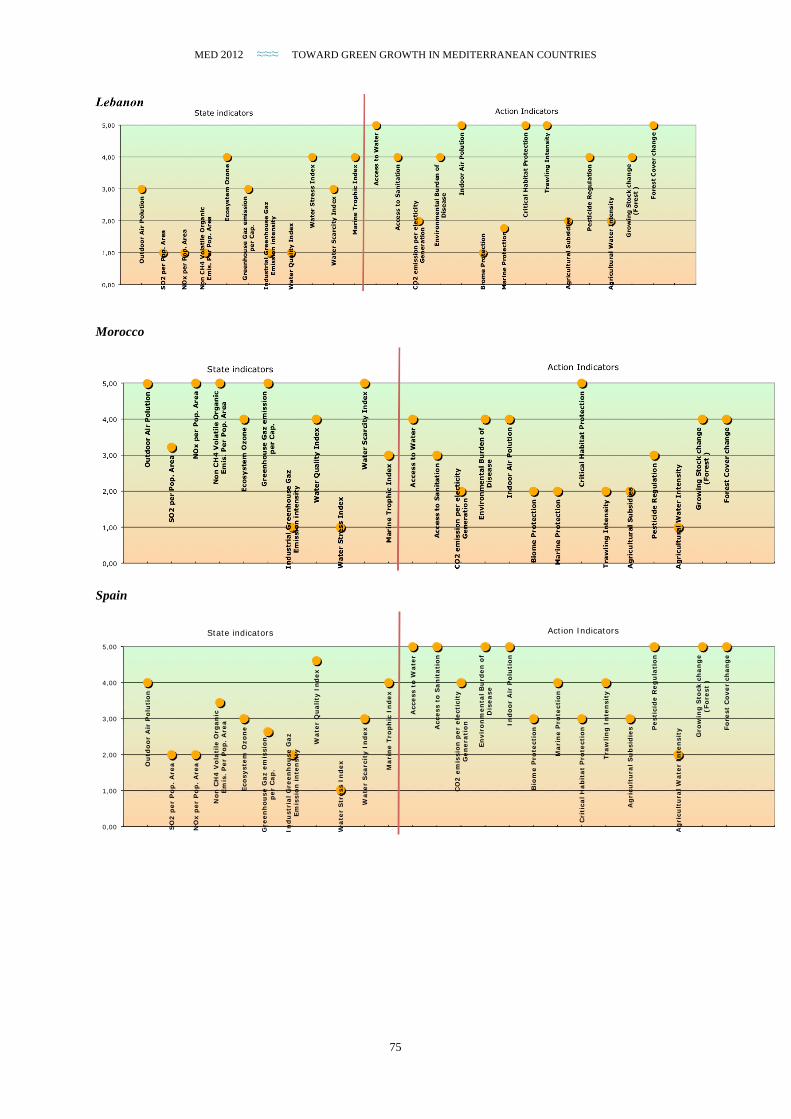
MED 2012 ≈≈≈ TOWARD GREEN GROWTH IN MEDITERRANEAN COUNTRIES
75
Lebanon
Morocco
Spain
Ou
tdo
or
Air
Po
luti
on
SO
2 p
er
Po
p.
Are
a
NO
x p
er
Po
p.
Are
a
No
n C
H4
Vo
lati
le O
rgan
ic
Em
is.
Per
Po
p.
Are
a
Eco
syst
em
Ozo
ne
Gre
en
ho
use
Gaz
em
issi
on
p
er
Cap
.
Ind
ust
rial G
reen
ho
use
Gaz
Em
issi
on
in
ten
sity
Wate
r Q
uality
In
dex
Wate
r S
tress
In
dex
Wate
r S
carc
ity I
nd
ex
Mari
ne T
rop
hic
In
dex
Acc
ess
to
Wate
r
Acc
ess
to
San
itati
on
CO
2 e
mis
sio
n p
er
ele
ctic
ity
Gen
era
tio
n
En
vir
on
men
tal B
urd
en
of
Dis
ease
Ind
oo
r A
ir P
olu
tio
n
Bio
me P
rote
ctio
n
Mari
ne P
rote
ctio
n
Cri
tica
l H
ab
itat
Pro
tect
ion
Tra
wlin
g I
nte
nsi
ty
Ag
ricu
ltu
ral S
ub
sid
ies
Pest
icid
e R
eg
ula
tio
n
Ag
ricu
ltu
ral W
ate
r In
ten
sity
Gro
win
g S
tock
ch
an
ge
(Fo
rest
)
Fo
rest
Co
ver
chan
ge
0,00
1,00
2,00
3,00
4,00
5,00
State indicators Action Indicators
Ou
tdo
or
Air
Po
luti
on
SO
2 p
er
Po
p.
Are
a
NO
x p
er
Po
p.
Are
a
No
n C
H4
Vo
lati
le O
rgan
ic
Em
is.
Per
Po
p.
Are
a
Eco
syste
m O
zo
ne
Gre
en
ho
use G
az e
mis
sio
n
per
Cap
.
In
du
str
ial G
reen
ho
use G
az
Em
issio
n i
nte
nsit
y
Wate
r Q
uality
In
dex
Wate
r S
tress I
nd
ex
Wate
r S
carc
ity I
nd
ex
Mari
ne T
rop
hic
In
dex
Access t
o W
ate
r
Access t
o S
an
itati
on
CO
2 e
mis
sio
n p
er
ele
cti
cit
y
Gen
era
tio
n
En
vir
on
men
tal B
urd
en
of
Dis
ease
In
do
or
Air
Po
luti
on
Bio
me P
rote
cti
on
Mari
ne P
rote
cti
on
Cri
tical H
ab
itat
Pro
tecti
on
Tra
wlin
g I
nte
nsit
y
Ag
ricu
ltu
ral S
ub
sid
ies
Pesti
cid
e R
eg
ula
tio
n
Ag
ricu
ltu
ral W
ate
r In
ten
sit
y
Gro
win
g S
tock c
han
ge
(Fo
rest
)
Fo
rest
Co
ver
ch
an
ge
0,00
1,00
2,00
3,00
4,00
5,00
State indicators Action Indicators
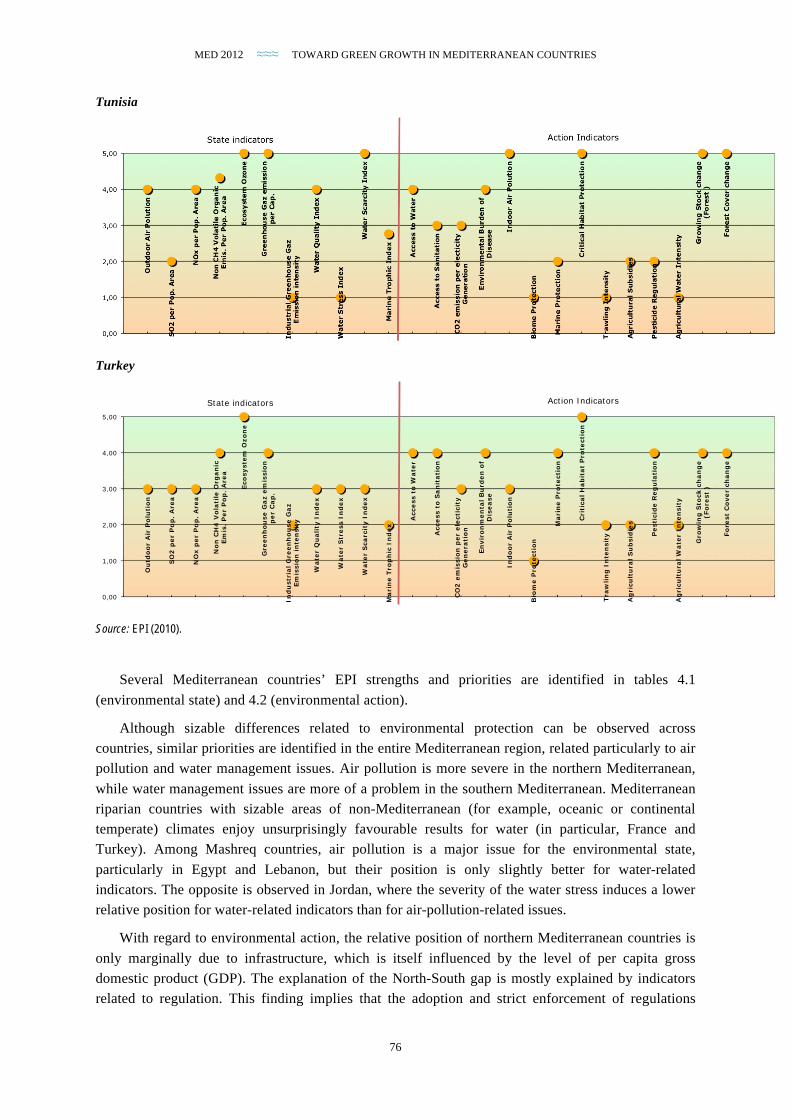
MED 2012 ≈≈≈ TOWARD GREEN GROWTH IN MEDITERRANEAN COUNTRIES
76
Tunisia
Turkey
Source: EPI (2010).
Several Mediterranean countries’ EPI strengths and priorities are identified in tables 4.1
(environmental state) and 4.2 (environmental action).
Although sizable differences related to environmental protection can be observed across
countries, similar priorities are identified in the entire Mediterranean region, related particularly to air
pollution and water management issues. Air pollution is more severe in the northern Mediterranean,
while water management issues are more of a problem in the southern Mediterranean. Mediterranean
riparian countries with sizable areas of non-Mediterranean (for example, oceanic or continental
temperate) climates enjoy unsurprisingly favourable results for water (in particular, France and
Turkey). Among Mashreq countries, air pollution is a major issue for the environmental state,
particularly in Egypt and Lebanon, but their position is only slightly better for water-related
indicators. The opposite is observed in Jordan, where the severity of the water stress induces a lower
relative position for water-related indicators than for air-pollution-related issues.
With regard to environmental action, the relative position of northern Mediterranean countries is
only marginally due to infrastructure, which is itself influenced by the level of per capita gross
domestic product (GDP). The explanation of the North-South gap is mostly explained by indicators
related to regulation. This finding implies that the adoption and strict enforcement of regulations
Ou
tdo
or
Air
Po
luti
on
SO
2 p
er
Po
p.
Are
a
NO
x p
er
Po
p.
Are
a
No
n C
H4
Vo
lati
le O
rgan
ic
Em
is.
Per
Po
p.
Are
a
Eco
syste
m O
zo
ne
Gre
en
ho
use G
az e
mis
sio
n
per
Cap
.
In
du
str
ial G
reen
ho
use G
az
Em
issio
n i
nte
nsit
y
Wate
r Q
uality
In
dex
Wate
r S
tress I
nd
ex
Wate
r S
carc
ity I
nd
ex
Mari
ne T
rop
hic
In
dex
Access t
o W
ate
r
Access t
o S
an
itati
on
CO
2 e
mis
sio
n p
er
ele
cti
cit
y
Gen
era
tio
n
En
vir
on
men
tal B
urd
en
of
Dis
ease In
do
or
Air
Po
luti
on
Bio
me P
rote
cti
on
Mari
ne P
rote
cti
on
Cri
tical H
ab
itat
Pro
tecti
on
Tra
wlin
g I
nte
nsit
y
Ag
ricu
ltu
ral S
ub
sid
ies
Pesti
cid
e R
eg
ula
tio
n
Ag
ricu
ltu
ral W
ate
r In
ten
sit
y
Gro
win
g S
tock c
han
ge
(Fo
rest
)
Fo
rest
Co
ver
ch
an
ge
0,00
1,00
2,00
3,00
4,00
5,00
State indicators Action Indicators O
utd
oo
r A
ir P
olu
tio
n
SO
2 p
er
Po
p.
Are
a
NO
x p
er
Po
p.
Are
a
No
n C
H4
Vo
lati
le O
rgan
ic
Em
is.
Per
Po
p.
Are
a
Eco
syste
m O
zo
ne
Gre
en
ho
use G
az e
mis
sio
n
per
Cap
.
In
du
str
ial G
reen
ho
use G
az
Em
issio
n i
nte
nsit
y
Wate
r Q
uality
In
dex
Wate
r S
tress I
nd
ex
Wate
r S
carc
ity I
nd
ex
Mari
ne T
rop
hic
In
dex A
ccess t
o W
ate
r
Access t
o S
an
itati
on
CO
2 e
mis
sio
n p
er
ele
cti
cit
y
Gen
era
tio
n
En
vir
on
men
tal B
urd
en
of
Dis
ease
In
do
or
Air
Po
luti
on
Bio
me P
rote
cti
on
Mari
ne P
rote
cti
on
Cri
tical H
ab
itat
Pro
tecti
on
Tra
wlin
g I
nte
nsit
y
Ag
ricu
ltu
ral S
ub
sid
ies
Pesti
cid
e R
eg
ula
tio
n
Ag
ricu
ltu
ral W
ate
r In
ten
sit
y
Gro
win
g S
tock c
han
ge
(Fo
rest
)
Fo
rest
Co
ver
ch
an
ge
0,00
1,00
2,00
3,00
4,00
5,00
State indicators Action Indicators
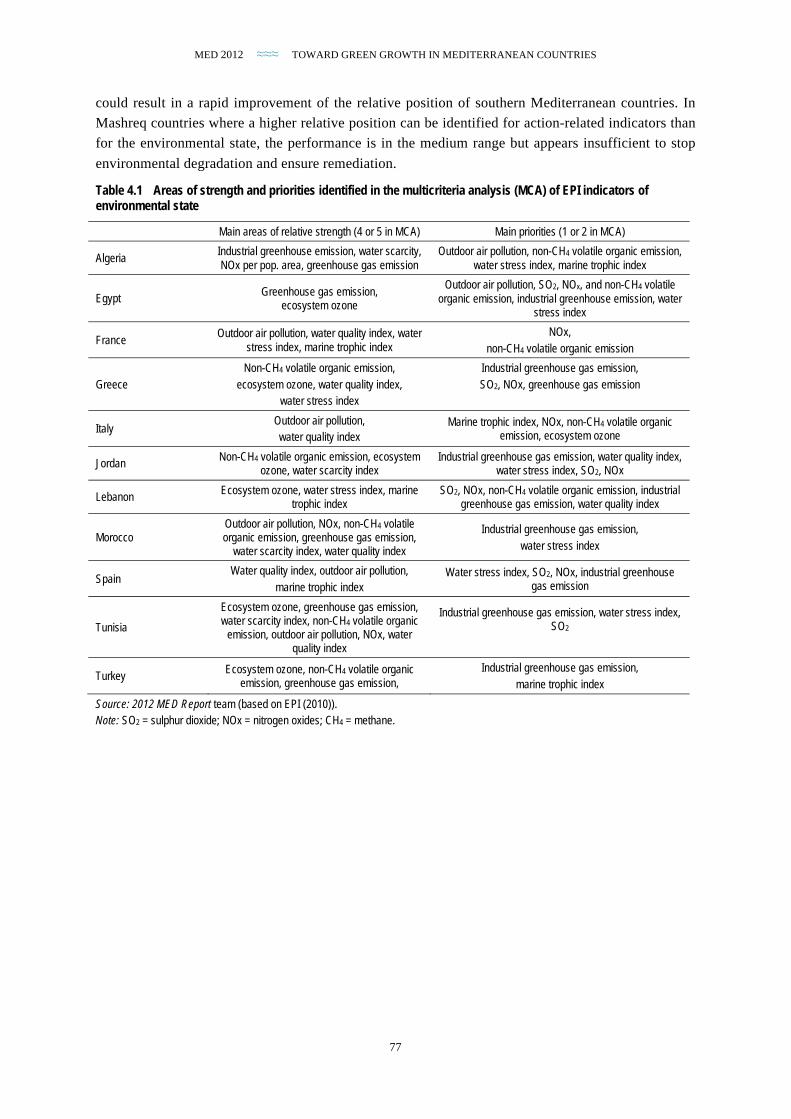
MED 2012 ≈≈≈ TOWARD GREEN GROWTH IN MEDITERRANEAN COUNTRIES
77
could result in a rapid improvement of the relative position of southern Mediterranean countries. In
Mashreq countries where a higher relative position can be identified for action-related indicators than
for the environmental state, the performance is in the medium range but appears insufficient to stop
environmental degradation and ensure remediation.
Table 4.1 Areas of strength and priorities identified in the multicriteria analysis (MCA) of EPI indicators of environmental state
Main areas of relative strength (4 or 5 in MCA) Main priorities (1 or 2 in MCA)
Algeria Industrial greenhouse emission, water scarcity, NOx per pop. area, greenhouse gas emission
Outdoor air pollution, non-CH4 volatile organic emission, water stress index, marine trophic index
Egypt Greenhouse gas emission,
ecosystem ozone
Outdoor air pollution, SO2, NOx, and non-CH4 volatile organic emission, industrial greenhouse emission, water
stress index
France Outdoor air pollution, water quality index, water
stress index, marine trophic index NOx,
non-CH4 volatile organic emission
Greece Non-CH4 volatile organic emission,
ecosystem ozone, water quality index, water stress index
Industrial greenhouse gas emission, SO2, NOx, greenhouse gas emission
Italy Outdoor air pollution, water quality index
Marine trophic index, NOx, non-CH4 volatile organic emission, ecosystem ozone
Jordan Non-CH4 volatile organic emission, ecosystem
ozone, water scarcity index Industrial greenhouse gas emission, water quality index,
water stress index, SO2, NOx
Lebanon Ecosystem ozone, water stress index, marine
trophic index SO2, NOx, non-CH4 volatile organic emission, industrial
greenhouse gas emission, water quality index
Morocco Outdoor air pollution, NOx, non-CH4 volatile organic emission, greenhouse gas emission,
water scarcity index, water quality index
Industrial greenhouse gas emission, water stress index
Spain Water quality index, outdoor air pollution,
marine trophic index Water stress index, SO2, NOx, industrial greenhouse
gas emission
Tunisia
Ecosystem ozone, greenhouse gas emission, water scarcity index, non-CH4 volatile organic
emission, outdoor air pollution, NOx, water quality index
Industrial greenhouse gas emission, water stress index, SO2
Turkey Ecosystem ozone, non-CH4 volatile organic
emission, greenhouse gas emission, Industrial greenhouse gas emission,
marine trophic index
Source: 2012 MED Report team (based on EPI (2010)). Note: SO2 = sulphur dioxide; NOx = nitrogen oxides; CH4 = methane.
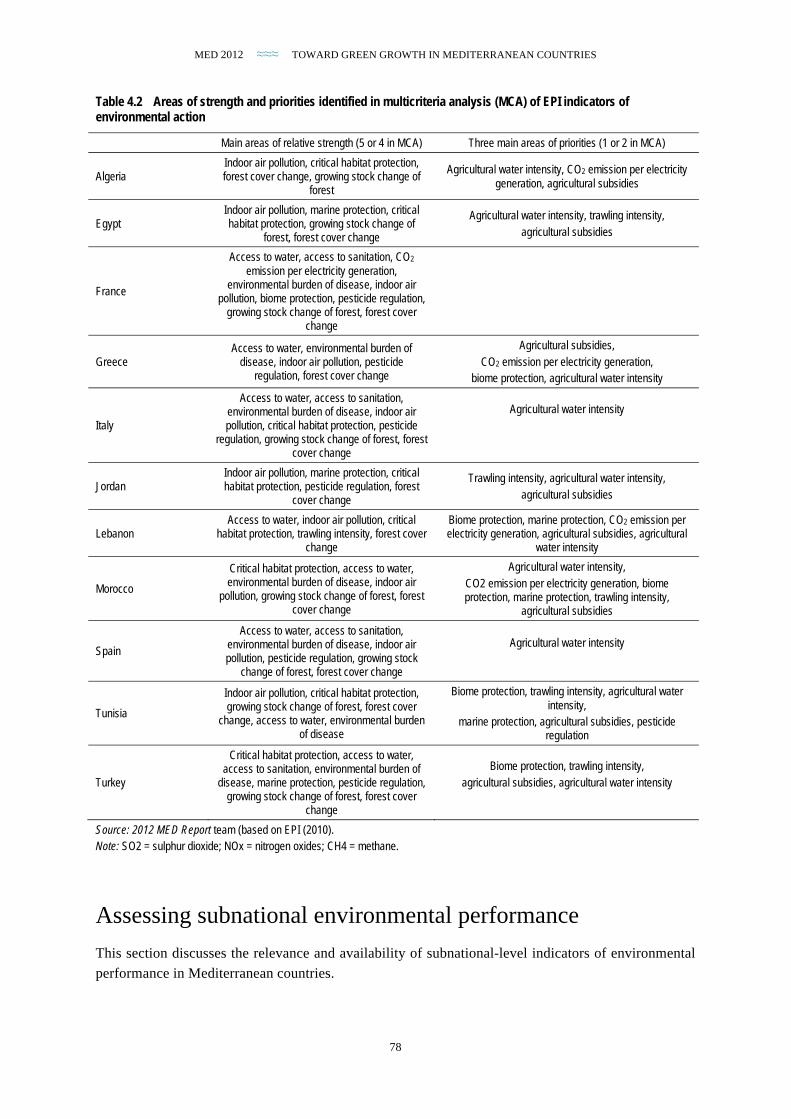
MED 2012 ≈≈≈ TOWARD GREEN GROWTH IN MEDITERRANEAN COUNTRIES
78
Table 4.2 Areas of strength and priorities identified in multicriteria analysis (MCA) of EPI indicators of environmental action
Source: 2012 MED Report team (based on EPI (2010). Note: SO2 = sulphur dioxide; NOx = nitrogen oxides; CH4 = methane.
Assessing subnational environmental performance
This section discusses the relevance and availability of subnational-level indicators of environmental
performance in Mediterranean countries.
Main areas of relative strength (5 or 4 in MCA) Three main areas of priorities (1 or 2 in MCA)
Algeria Indoor air pollution, critical habitat protection, forest cover change, growing stock change of
forest
Agricultural water intensity, CO2 emission per electricity generation, agricultural subsidies
Egypt Indoor air pollution, marine protection, critical habitat protection, growing stock change of
forest, forest cover change
Agricultural water intensity, trawling intensity, agricultural subsidies
France
Access to water, access to sanitation, CO2
emission per electricity generation, environmental burden of disease, indoor air
pollution, biome protection, pesticide regulation, growing stock change of forest, forest cover
change
Greece Access to water, environmental burden of
disease, indoor air pollution, pesticide regulation, forest cover change
Agricultural subsidies, CO2 emission per electricity generation,
biome protection, agricultural water intensity
Italy
Access to water, access to sanitation, environmental burden of disease, indoor air pollution, critical habitat protection, pesticide
regulation, growing stock change of forest, forest cover change
Agricultural water intensity
Jordan Indoor air pollution, marine protection, critical habitat protection, pesticide regulation, forest
cover change
Trawling intensity, agricultural water intensity, agricultural subsidies
Lebanon Access to water, indoor air pollution, critical
habitat protection, trawling intensity, forest cover change
Biome protection, marine protection, CO2 emission per electricity generation, agricultural subsidies, agricultural
water intensity
Morocco
Critical habitat protection, access to water, environmental burden of disease, indoor air
pollution, growing stock change of forest, forest cover change
Agricultural water intensity, CO2 emission per electricity generation, biome protection, marine protection, trawling intensity,
agricultural subsidies
Spain
Access to water, access to sanitation, environmental burden of disease, indoor air pollution, pesticide regulation, growing stock
change of forest, forest cover change
Agricultural water intensity
Tunisia
Indoor air pollution, critical habitat protection, growing stock change of forest, forest cover
change, access to water, environmental burden of disease
Biome protection, trawling intensity, agricultural water intensity,
marine protection, agricultural subsidies, pesticide regulation
Turkey
Critical habitat protection, access to water, access to sanitation, environmental burden of
disease, marine protection, pesticide regulation, growing stock change of forest, forest cover
change
Biome protection, trawling intensity, agricultural subsidies, agricultural water intensity
MED 2012 ≈≈≈ TOWARD GREEN GROWTH IN MEDITERRANEAN COUNTRIES
79
Relevance and availability of subnational environmental indicators
District-level data could inform policy makers involved in the allocation of public resources among
districts and urban areas. Considering the wide range of within-country spatial diversity in
socioeconomic and natural conditions across Mediterranean countries (average per capita income,
population density, literacy, rainfall as well as urbanisation, coastal area usages, arable land, forest
cover, and so on), it is desirable to collect and monitor indicators of environmental state and action at
the subnational regional level (for example, NUTS 2 of the Eurostat database).
A sizable regional variance can be observed, for instance, for levels of air pollution recorded in
Mediterranean urban areas documented by the Eurostat Urban Audit database, which covers the
European Union (EU) Mediterranean countries, Croatia, and Turkey. This data set includes in
particular: (i) number of days ozone concentration exceeds 120 µg/m³ (days per year) and (ii) number
of days with particulate matter concentrations (PM10) exceeding 50 µg/m³ (days per year).
This information could be used as benchmarks for setting reasonable objectives across
Mediterranean countries. What is more, cities in which the best performance can be observed may be
used as models of best practices (unless natural conditions, such a topography, along with wind and
rainfall regimes explain a large part of the performance in air pollution).
Regional variance in environmental performance in Turkey and multicriteria analysis
The methodology already used for a country-level multicriteria analysis of the EPI database is
employed for analysing Turkish data. The same weight is given to each of the eight indicators
covering three areas: air pollution, water sanitation, and waste management (4, 2, and 2 indicators
respectively). Regional profiles are presented for a selection of Turkish regions in annex 6. The main
results can be summarised as follows:
• The best environmental performance is observed in regions that include large cities, which
indicate that income levels positively influence the ranking.
• The Istanbul region is the best performer, largely due to excellent water access and treatment.
For waste collection and air quality, the results are excellent compared to other regions but improvements are still possible.
• The Izmir region has a similar profile albeit with performances lower than Istanbul for waste
collection. A performance gap also exists for sulphur dioxide (SO2), but the comparison of
changes over time suggests that this region is approaching Istanbul’s levels.
• The Ankara region is somehow lagging behind, mostly due to air pollution, but unlike the
Izmir region, it does not seem to be closing the gap. Wastewater treatment is, however,
comparatively good, suggesting that specific factors, including perhaps local climate conditions, explain relatively bad air pollution.
• Trabzon and Lanliurfa have the lowest ranking, mostly due to infrastructure-related issues
(water and waste management), while air quality is comparatively good.
MED 2012 ≈≈≈ TOWARD GREEN GROWTH IN MEDITERRANEAN COUNTRIES
80
Green national accounting for the Mediterranean countries Setting up a green national accounts system will help provide a more accurate understanding of
national trends in welfare, consumption, production sustainability, and efficiency in society’s use of
natural assets.
The United Nations and the developed countries have begun to implement a new system of
integrated economic environmental accounts, making available expertise and experience in the field.
These previous experiences can help Mediterranean countries develop a faster and more efficient
system adapted to priorities in water, energy, land (including use of soil), and fisheries.
Environmental accounts need to deliver clear messages regarding the consequences of variation in
various indicators. Their main strength is that they provide indicators in formats that are harmonised
with the national accounts commonly used by policy makers. Environmental accounts are integrated
with national accounts and can be used jointly to feed enlarged macroeconomic analysis and models.
Regarding the impacts of economic activities, it is essential that accounts give a clear sense of
context. This context can be geographical, historical, or political. The use of geo-referenced databases
and geographical information systems helps produce accounts meeting these conditions.
Economic growth in the Mediterranean region, and green growth in particular, faces specific
environmental constraints related to water scarcity, concentration of population in the coastal zone,
and depletion of fisheries. Subsoil resources (oil, phosphate, fossil water) are abundant only in a small
number of countries and are nonrenewable regardless. At the same time, nature provides unique
natural assets such as climate and landscapes that provide many economic opportunities. Careful
management of natural resources is a necessity for all development programs. Economic-
environmental accounts are designed to be integrated with the UN System of National Accounts 2008
(SNA). They are prone to delivering biophysical and monetary data to support macroeconomic,
sectoral, and regional green growth assessments and forward-looking modelling.16
Purposes of green accounting Accounts—private, public, or national—are tools for performance assessment and for control of
information quality and fairness. Performance is measured first as the difference between receipts and
expenditures (benefit or loss), and as a change in net wealth (net wealth of physical assets, credits, and
debts). Regarding an economy’s interaction with the physical world, performance can be assessed as
well as the ratio between the creation of economic value (expressed in monetary units) and the use of
natural resources (expressed in appropriate physical units).
The purpose of environmental-economic accounts is to supply the missing elements (such as use
of natural resources, disposal of residuals, real price of commodities, effects of depletion and
degradation of natural assets, and accessibility to ecosystems services) and allow decision makers to
consider the broader picture when addressing issues such as well-being, sustainability of consumption
16 “The SEEA 2003 [System of Integrated Environmental and Economic Accounts] is a satellite system of the System of National Accounts. It brings together economic and environmental information in a common framework to measure the contribution of the environment to the economy and the impact of the economy on the environment. It provides policy makers with indicators and descriptive statistics to monitor these interactions as well as a database for strategic planning and policy analysis to identify more sustainable paths of development” (http://unstats.un.org/unsd/envaccounting/pubs.asp).
MED 2012 ≈≈≈ TOWARD GREEN GROWTH IN MEDITERRANEAN COUNTRIES
81
and production patterns and resource-use efficiency, risks and adaptability to changing conditions,
and ecological debts.
Worldwide case studies have provided experience on the usefulness of integrated accounts for
policy making. Examples are water use recorded by economic sectors (agriculture, hydroelectricity,
water supply, municipal services, households), which can be compared to relevant indicators of
consumption and value added. Advanced tools have been developed that combine the regular
monetary input-output tables used by modellers with physical data on water use to test scenarios of
economic development in hybrid national accounting matrices. Another important application of this
methodology relates to the United Nations Framework Convention on Climate Change (UNFCCC)
greenhouse gas (GHG) inventories, reporting of which is converted into an economic classification to
allow correct calculation of the GHG/GDP ratio and sector analysis. Another example of application
of the System of Integrated Environmental and Economic Accounts (SEEA) is the production of
accounts of environmental protection that measure the national effort and compare the relative burden
of the central government, the local government, industries, and households. Where produced, these
accounts are appreciated by the eco-business as an assessment of market trends in their domain.
Taking stock of the progress, in 2007, the UN Statistical Commission decided to upgrade the
SEEA 2003 to an international standard. The revised SEEA will be available in 2012 or 2013. SEEA
Volume 1 addresses subjects mostly related to the SNA statistical units. It includes supply and use
tables of economic resources and corresponding assets in physical units, and accounts of residuals.
Natural assets valuation is addressed as well as the calculation of resource depletion. A special
chapter presents environmental protection and management accounts with particular attention to
environmental taxes and subsidies. The SEEA Volume 2 will address ecosystem accounts in physical
and monetary units. Ecosystem assets and ecosystem services encompass the renewable economic
resources managed and operated for profits into broader systems that deliver private values and public
goods all together. Valuation will highlight the benefits of ecosystem services intertwined with the
economic values of commodities or real estate and, when possible, the value of unpaid externalities.
Because the SEEA is about national accounts, valuation methodologies will have to be compatible
with the SNA standards. The main SEEA handbook will be supplemented by specific manuals for
water, energy, land and ecosystems, and agriculture/forestry/fisheries. This initiative responds to
recurrent policy demands for improving the current measurement of economic performance delivered
by conventional national accounts aggregates.
Such demand for green national accounts dates from the 1992 “Agenda 21” and has been recently
reiterated by the Economics of Ecosystems and Biodiversity (TEEB) report, the European “Beyond
GDP” initiative and its follow-up, in particular by the Stiglitz-Sen-Fitoussi Commission, in
discussions related to the green economy (United Nations Environment Programme, UNEP) and
green growth (OECD), in the 2010 Convention on Biological Diversity (CDB) Aichi-Nagoya
Strategy, and in the Wealth Accounting and the Valuation of Ecosystem Services (WAVES) global
partnership launched in 2011 by the World Bank as a continuation of its pioneering work in the
calculation of “genuine savings” and wealth.
MED 2012 ≈≈≈ TOWARD GREEN GROWTH IN MEDITERRANEAN COUNTRIES
82
Green accounting in the Mediterranean
Learning from previous attempts at green accounting . . . Environmental accounts are not a new subject in the Mediterranean region. The most visible efforts
and achievements are in the domain of water accounts, where balances have been compiled since the
pioneering work of Jean Margat for the United Nations Educational, Scientific and Cultural
Organization (UNESCO) and Plan Bleu. Water accounts were one topic of MEDSTAT I and II, the
statistical capacity-building programme of the Euro-Mediterranean cooperation. MEDSTAT/Water
has been used by the UN Statistical Division and the UN Economic and Social Commission for
Western Asia (ESCWA) as a test case for the interim “SEEA-Water” manual, implementation of
which is still on the agenda.
An excessive burden was put on the shoulders of national statistical offices, which were both
understaffed and inexperienced in water science. This problem could be overcome by more directly
and actively involving the various national agencies that collect water data, such as environment,
agriculture and public works ministries, water agencies, and meteorological offices. International
programmes are also sources of information: Food and Agriculture Organization (FAO) Aquastat,
Global Earth Observation (GEO), and global change programmes.
A “SEEA-Energy” handbook has been drafted to bridge energy statistics and economic-
environmental accounts. It will give adequate methodological support for the implementation of such
accounts.
. . . to build an efficient system Priorities for implementing economic-environmental accounts in the Mediterranean region are water,
energy, socio-ecological landscapes (including agriculture, urban and tourism areas, and coastal
zones) and fisheries, followed by soil, forests, and wetlands. Although data are scattered across
countries, ministries and agencies within countries, and research programmes, significant information
exists as attested by the developments steered by national and international organisations and
programmes since the Plan Bleu report of 1989. The coordination of these activities is progressing.
Existing international cooperative programmes such as the Euro-Mediterranean Partnership initiative
and World Bank’s WAVES could provide an institutional umbrella for such endeavours and mobilise
capacities for short-term implementation of a priority set of accounts.
Land cover and use accounts can benefit from the development of surveys from satellite images,
which are available in all countries of the region at a medium scale and in most of them at higher
resolution. Mediterranean countries that are members of the EEA (European Environmental Agency)
are regularly covered by the Corine land cover programme, while other countries have similar maps
with the support of the FAO (EEA 2006). The EEA and FAO methodologies are compatible. Satellite
images are abundant and usually free, and space agencies are keen to support the development of
applications. One example in the region is GLOBWETLANDS II, which the European Space Agency
has focused on the Mediterranean at the kind request of the Ramsar Convention and the EEA. The
Global Earth Observation (GEO) secretariat, which covers all space agencies, has decided to include
support of environmental accounting in its new 2012–15 work plan. In addition to open data access,
cloud computing systems developed by major IT companies now offer advanced data-processing
possibilities. Meanwhile, in the course of the SEEA revision, the FAO has undertaken the

MED 2012 ≈≈≈ TOWARD GREEN GROWTH IN MEDITERRANEAN COUNTRIES
83
development of a specific handbook for agriculture, forestry, and fisheries that will support
accounting developments.
Coasts are both rich in potential and under high stress from human activities, particularly in the
Mediterranean. Several research programmes have addressed this issue. PEGASO’s ongoing research
of the Mediterranean and Black Sea coasts includes ecosystem capital accounting coordinated with
current SEEA development. The new European research known as MEDINA, which covers North
African countries, will provide additional monitoring data on coasts and lagoons as well as seas and
fisheries. Such programmes can provide inputs in the short term and allow systematic accounting of
coasts at a low marginal cost.
Data dispersion is a major concern for environmental accounting implementation in water and
other domains. The involvement of national statistical offices is important because of such offices’
responsibility and expertise in national accounting. A more decentralised approach to data collection
and assimilation into statistical and geographical databases—one that involves all institutional
sectors—is necessary.
Implementation guidelines The macro approach is the only way to begin to implement economic environmental accounts, as the
final product is a macro vision of the relation between the economy and the environment. But macro
accounts must be downscaled to the sectoral and local levels where statistics are more readily
available. Meanwhile, findings must be accessible to local actors, not just central decision makers.
Local institutions are examined in the EEA report (2010). For businesses, integrating ecosystem and
biodiversity into financial accounting standards is a relatively recent concern. Very large companies
seem to be leading the move toward the inclusion of environmental and sustainable development
items in accounting standards to better account for risks, responsibilities, costs, and options.
Recent examples of raising interest are, for example, the activity of EMAN, the Environmental
and Sustainability Management Accounting Network of business accountants, or the “2030 Water
Resources Group” report on “Charting Our Water Future: Economic Frameworks to Inform Decision
Making” (World Bank 2009a). Meanwhile, the UNEP Finance Initiative, a global partnership between
the UNEP and financial sector, is active in the green economy. Another example is the Biodiversity
Accountability Framework of Houdet, Trommetter, and Weber (2010), which aims at promoting
reporting standards that integrate financial and biodiversity and ecosystem services (BES).
“Water Costs and Accounts, Proposal for an Eco-Integrated Approach” is a study that summarises
the findings of a group of Spanish researchers gathered around an economist (J.-M. Naredo) and a
thermodynamicist (A. Valero). Early work on Spain was presented before the OECD as far back as
1986. The originality of the method is its integration of quantity and quality into one single
measurement. It is particularly relevant for arid countries. Based on this methodology, Naredo (2007)
proposed a strict calculation of physical and economic costs that match the requirements of the
European Water Framework Directive.

MED 2012 ≈≈≈ TOWARD GREEN GROWTH IN MEDITERRANEAN COUNTRIES
84
Box 4.1 The TEEB, a useful example for the Mediterranean
In 2010 the EEA conducted a methodological study for the TEEB called “Ecosystem Accounting for the Cost of Biodiversity Losses: The Case of Coastal Mediterranean Wetlands” (EEA 2010), containing monographs on four wetlands: Donana, Camargue, Amvrakikos, and the Danube Delta. Important findings of the study relate to the linkages between ecosystem services and natural capital, to the expression in statistical units of the concept of “socio-ecological systems” (Gallopin 1991; Glaser 2008), thereby allowing them to be used in national accounts. Other findings concern the need to address ecosystem services at multiple scales; for example, by providing the geographical and economic contexts of local wetlands, including their key role in supporting birds’ migratory flyways. The study concludes with a discussion of the complementarity of top-down and bottom-up approaches, as opposed to previous attempts to generalise microaccounts up to the national level. These conclusions are presented in the EEA report and summarised in the TEEB D1.
Source: EEA (2010).
C H A P T E R F I V E
Tools for Environmental Action and the Implementation of a Green Growth Agenda
≈≈≈ In this chapter
Promoting social equity and economic growth through environmental fiscal reforms
Promoting tradable rights and payments for ecosystem services
Environmental and social responsibility
Changing consumer and producer behaviour: promoting ecolabels and certification
To shift to green (or greener) growth, it is critical to implement
effective tools of environmental action—in particular, fiscal reform, the promotion of market-based instruments, and
environmental responsibility. Some success stories and best practices experienced in Mediterranean countries can be
replicated or adapted to fit other socioeconomic and environmental settings.
Promoting social equity and economic growth through environmental fiscal reforms
Mediterranean countries and other middle-income countries that have recently introduced
environment-related taxation have experienced positive outcomes that have yielded “co-benefits,” that
is, both environmental and economic gains (Goulder 2002; World Bank 2005; OECD 2005).
Environmental fiscal reforms (as discussed in GTZ 2004, 2010; World Bank 2008; UNEP 2010;
OECD 2011) imply, in particular, a phasing out of fuel subsidies to encourage energy efficiency while
reducing pro-rich transfers that are a burden on public finance. For such a policy to gain wide
acceptance and generate economic gains, it should be accompanied by measures promoting the use of
improved or alternative technologies along with payment of transitory compensation to the main
losers. Shifting from fuel subsidies to fuel taxation, along with phasing out untargeted food subsidies
that tend to negatively affect health conditions, can allow governments to reallocate expenditures for
other purposes such as the promotion of energy and water efficiency. Shifting from untargeted food
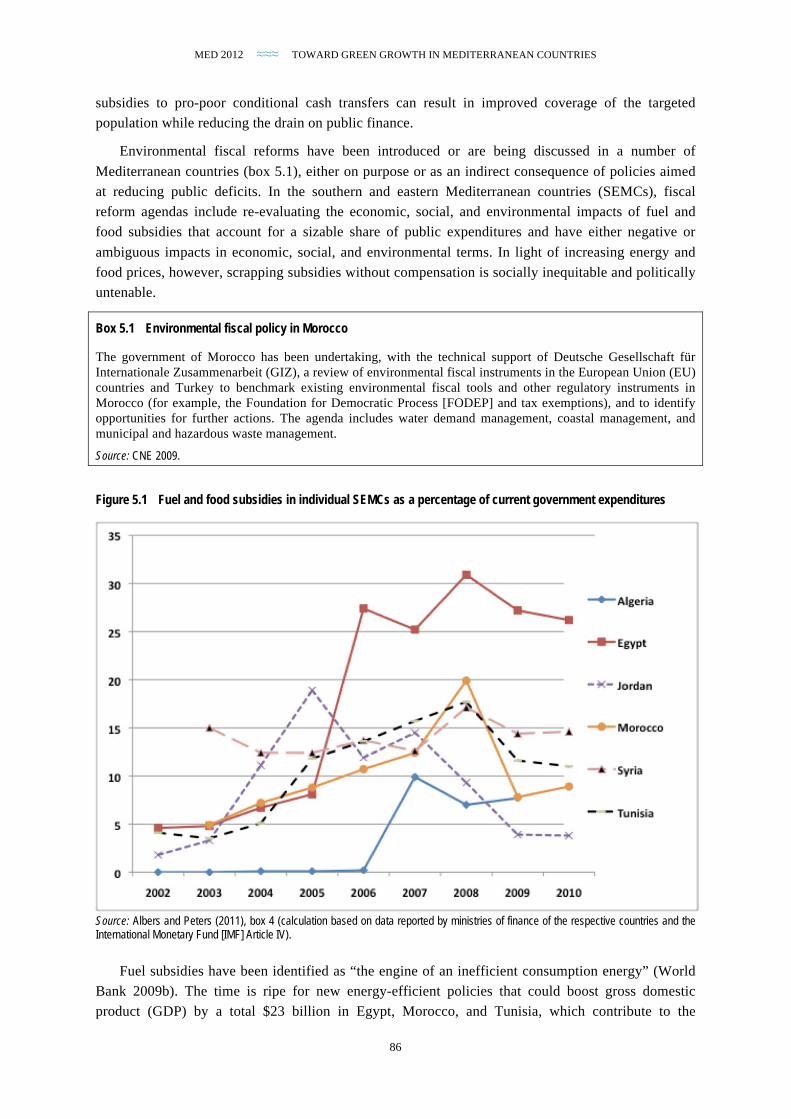
MED 2012 ≈≈≈ TOWARD GREEN GROWTH IN MEDITERRANEAN COUNTRIES
86
subsidies to pro-poor conditional cash transfers can result in improved coverage of the targeted
population while reducing the drain on public finance.
Environmental fiscal reforms have been introduced or are being discussed in a number of
Mediterranean countries (box 5.1), either on purpose or as an indirect consequence of policies aimed
at reducing public deficits. In the southern and eastern Mediterranean countries (SEMCs), fiscal
reform agendas include re-evaluating the economic, social, and environmental impacts of fuel and
food subsidies that account for a sizable share of public expenditures and have either negative or
ambiguous impacts in economic, social, and environmental terms. In light of increasing energy and
food prices, however, scrapping subsidies without compensation is socially inequitable and politically
untenable.
Box 5.1 Environmental fiscal policy in Morocco
The government of Morocco has been undertaking, with the technical support of Deutsche Gesellschaft für Internationale Zusammenarbeit (GIZ), a review of environmental fiscal instruments in the European Union (EU) countries and Turkey to benchmark existing environmental fiscal tools and other regulatory instruments in Morocco (for example, the Foundation for Democratic Process [FODEP] and tax exemptions), and to identify opportunities for further actions. The agenda includes water demand management, coastal management, and municipal and hazardous waste management.
Source: CNE 2009.
Figure 5.1 Fuel and food subsidies in individual SEMCs as a percentage of current government expenditures
Source: Albers and Peters (2011), box 4 (calculation based on data reported by ministries of finance of the respective countries and the International Monetary Fund [IMF] Article IV).
Fuel subsidies have been identified as “the engine of an inefficient consumption energy” (World
Bank 2009b). The time is ripe for new energy-efficient policies that could boost gross domestic
product (GDP) by a total $23 billion in Egypt, Morocco, and Tunisia, which contribute to the
MED 2012 ≈≈≈ TOWARD GREEN GROWTH IN MEDITERRANEAN COUNTRIES
87
improvement of environmental performance and social welfare. According to the International Energy
Agency (IEA), consumption subsidies accounted for as much as half of the full cost of supply in
several SEMCs, equivalent to an annual cash transfer of $150–$300 per person in 2009.
Fuel subsidies also tend to be pro-rich transfers. A recent International Monetary Fund (IMF)
study using a large sample of developing countries shows that, on average, the top income quintile
captures six times as much in subsidies as the bottom quintile (Arze del Granado, Coady, and
Gillingham 2010). Almost immediate improvements can be achieved by reducing fuel subsidies and
reallocating the major part of expenditures as transfer payments to all households. Such a policy
introduced in Iran in December 2010 resulted in a sharp decline in fuel consumption while increasing
the disposable income of the poorest households (IMF 2011a).
Box 5.2 Mechanisms to mitigate negative effects of economic reforms: The Egyptian Social Fund for Development
The Social Fund for Development (SFD) was created by the government of Egypt in 1991 to mitigate the adverse effects of the Economic Reform and Structural Adjustment Program (ERSAP) launched in the early 1990s. SFD mobilises national and international resources to invest in social development, with priority given to job creation through development of micro and small enterprises (MSEs) and improvement in the quality of life of low-income groups. The Small Enterprises Law of 2004 reinforced the key role of SFD in developing MSEs in Egypt. With its headquarters in Cairo, the SFD works through a network of 32 regional offices covering the 27 governorates of Egypt in addition to more than 500 nongovernmental organisations and more than 12 banks. SFD covers the following areas: (i) small enterprise development, (ii) microfinance development, (iii) community infrastructure development, (iv) human resources development, and (v) business services.
The mission of the SFD’s Small Enterprise Development Group (SEDG) is to establish, develop, support, and finance job-creating MSEs through an integrated package of financial and nonfinancial services. It seeks to address critical areas for MSE development, such as insufficient access to markets, limited access to finance, and underdeveloped managerial capabilities,
SFD’s microfinance sector supports income-generating activities and seeks to create sustainable job opportunities with the aim of supporting poor families, especially female-headed households, financing existing and new microenterprises and cooperating with microfinance institutions and NGOs to upgrade their microlending services.
Source: Egyptian Ministry of Finance delegation, as proposed during the consultation process of the 2012 MED Report.
The case for shifting to fuel taxation
Drastic changes in energy policy have been introduced in developing Mediterranean countries.
Turkey shifted from relatively low to extremely high fuel tax rates (among the highest in the world)
during the 2000s. Impact assessments undertaken in anticipation of the policy reform pointed toward
a possible “double dividend” of environmental fiscal policy—both economic and environmental
gains. But the positive outcomes observed can in fact be regarded as evidence of a triple dividend:
higher fuel prices provided incentives for energy efficiency in manufacturing and transportation and
also resulted in the rapid development of public urban transportation infrastructure, reducing both
urban pollution and the time and cost of commuting for lower-income people. Indirect effects and
spillovers include recent developments in the manufacturing of transportation equipment, solar water,
heat pumps, and energy-efficient consumer durables.
By reducing energy consumption, energy-efficiency programs could improve fiscal balance, and
some of the savings could be directed toward targeted transfers to the poor and the upgrading of the
social safety net (World Bank 2009b). Since 2008 Jordan has had a successful policy aimed at
eliminating fuel subsidies (box 5.3).
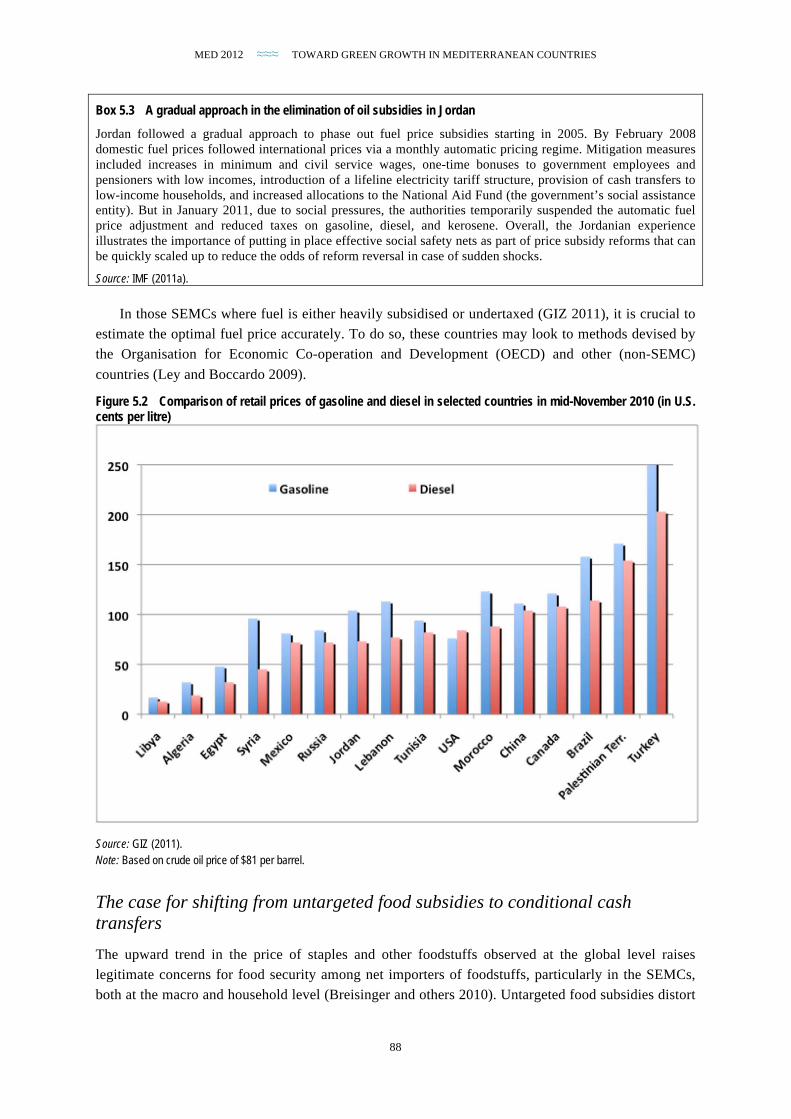
MED 2012 ≈≈≈ TOWARD GREEN GROWTH IN MEDITERRANEAN COUNTRIES
88
Box 5.3 A gradual approach in the elimination of oil subsidies in Jordan
Jordan followed a gradual approach to phase out fuel price subsidies starting in 2005. By February 2008 domestic fuel prices followed international prices via a monthly automatic pricing regime. Mitigation measures included increases in minimum and civil service wages, one-time bonuses to government employees and pensioners with low incomes, introduction of a lifeline electricity tariff structure, provision of cash transfers to low-income households, and increased allocations to the National Aid Fund (the government’s social assistance entity). But in January 2011, due to social pressures, the authorities temporarily suspended the automatic fuel price adjustment and reduced taxes on gasoline, diesel, and kerosene. Overall, the Jordanian experience illustrates the importance of putting in place effective social safety nets as part of price subsidy reforms that can be quickly scaled up to reduce the odds of reform reversal in case of sudden shocks.
Source: IMF (2011a).
In those SEMCs where fuel is either heavily subsidised or undertaxed (GIZ 2011), it is crucial to
estimate the optimal fuel price accurately. To do so, these countries may look to methods devised by
the Organisation for Economic Co-operation and Development (OECD) and other (non-SEMC)
countries (Ley and Boccardo 2009).
Figure 5.2 Comparison of retail prices of gasoline and diesel in selected countries in mid-November 2010 (in U.S. cents per litre)
Source: GIZ (2011). Note: Based on crude oil price of $81 per barrel.
The case for shifting from untargeted food subsidies to conditional cash transfers
The upward trend in the price of staples and other foodstuffs observed at the global level raises
legitimate concerns for food security among net importers of foodstuffs, particularly in the SEMCs,
both at the macro and household level (Breisinger and others 2010). Untargeted food subsidies distort
MED 2012 ≈≈≈ TOWARD GREEN GROWTH IN MEDITERRANEAN COUNTRIES
89
prices, do not sufficiently reach poor households, and have negative health and environmental
consequences.
The causal role of staple food, sugar, and edible oil subsidies in the prevalence of obesity among
Egyptian lower-income urban households is well documented (Asfaw 2007). For this group, changes
in relative prices have resulted in a rise in demand for subsidised goods that already account for an
extremely high share of caloric intake of the poor. This has led to lower food diversity, aggravating
malnutrition in this group (Jensen and Miller 2010).
Soft wheat and sugar subsidies are particularly harmful for health. They reduce the demand for
locally produced staples and pulses that are close substitutes,17 and even to some extent for high-
protein, high-calorie nuts (almonds), and high-calorie dried fruits (dates, figs, grapes). This further
reduces the diversity of the sources of micronutrients and vegetal proteins. Food subsidies for
imported edible oil also shift the demand from locally produced, relatively high nutritional quality
foodstuffs (almond and olive oil) to imported edible oils and fats of lower nutritional quality.
Food subsidies also have an indirect negative effect on soil conservation and natural fertility. Not
only do they lower incentives to maintain a diversified production of annual crops that favour
biodiversity of microfauna (insects and bacteria), they also discourage the cultivation of beans, which
enhance the soil’s nitrogen content, and unirrigated orchards, which prevent water and wind erosion.
Other methods of cash transfer allow better targeting of lower-income households (Muller and
Bibi 2010) without affecting other groups much (Dhehibi and Gil 2003) (box 5.4). Experimental
programs in Latin America have shown that conditional cash transfers to the target population have a
number of advantages, particularly with regard to nutrition, health, and education (Bassett 2008). A
regional targeting method could be used to reduce undercoverage of the target population in remote
rural regions, where data collection remains less dependable than in urban areas (Douidich and others
2008).
17 Durum, barley, oats, rye, millet, buckwheat, potatoes, lens, beans, chickpeas, peas, broad beans, and so on.
MED 2012 ≈≈≈ TOWARD GREEN GROWTH IN MEDITERRANEAN COUNTRIES
90
Box 5.4 A new methodology for shifting untargeted food price subsidies to targeted cash transfers in Tunisia
Untargeted food subsidies have traditionally been the main way to protect the purchasing power and nutritional health of the poor in the SEMCs. But these schemes largely miss their intended target.
The three main reasons are as follows: (i) untargeted food subsidies amount to transferring the same amount of cash to all households, including medium- and higher-income ones; (ii) subsidies do not benefit rural households producing self-consumed basic foodstuffs, even though these households are usually among the poorest across all the Mediterranean countries; and (iii) subsidised basic foodstuffs tend to be used as feed for poultry, although per capita consumption of poultry and eggs is conspicuously higher for higher- and middle-income households than for lower-income households.
Current public finance constraints and adjustment programs impose cuts on ambiguous food subsidies that fail to reach the intended targeted population. Muller and Bibi (2010) propose a new methodology to target direct transfers against poverty. Using data from Tunisian household surveys, they estimate focused transfers that greatly improve anti-poverty targeting performances and result in particularly low levels of undercoverage of the poor. In countries where reasonably accurate household survey data are available, the methodology is comparatively easy to implement.
Source: GEF (2007)..
The case for promoting organic food production Since the prevalence of poverty in Mediterranean countries is higher in rural areas than in urban ones
(in percentage of households), food security should be considered as a serious issue in rural areas. The
degree of exposure to food price shocks for rural households depends on land distribution and the
diversity of crops cultivated, which influences the share of self-consumption in total food supply.
Hence, at the household level as well as the macro level, promoting self-reliance (achieving food
security through trade) may be more effective than aiming for self-sufficiency in cereals. Small-scale
cereal producers or stockbreeders in dry land areas of Mediterranean countries are among the most
specialised agricultural households and, therefore, the most vulnerable.
Organic food production or more conventional low-pesticide production are viable pro-poor
options. While organic production is essentially a niche market (in particular for export to Europe or
the Gulf countries), low-pesticide production has the potential to become the standard since it can
result in a reduction in the use of intermediate consumptions that are useless for crops and tend to be
harmful for human health. In both cases, it appears possible to maximise the per capita (or per
household) income of small-scale producers by raising unit prices or reducing intermediate
consumption per unit produced. The adoption of organic production techniques usually results in a
higher value added per unit produced, thereby enhancing land productivity and water efficiency; when
appropriate know-how transfer programs are implemented, organic yields per hectare are not
necessarily lower than those obtained by small-scale conventional producers. In addition, since the
domestic and international trade of organic production is increasingly associated with fair-trade
criteria and objectives, the unit prices paid to producers tend to be substantially higher than for
nonorganic crops. Furthermore, lower inputs of pesticides per hectare and the increased diversity of
crops inherent to organic production techniques benefit both biodiversity and soil conservation. In the
meantime, reducing pesticide use tends to reduce intermediate consumption while requiring more
labour inputs. Shifting to organic production could therefore yield a triple dividend: economic, social,
and environmental.
Figure 5.3 Share of agricultural land under organic cultivation in Mediterranean countries
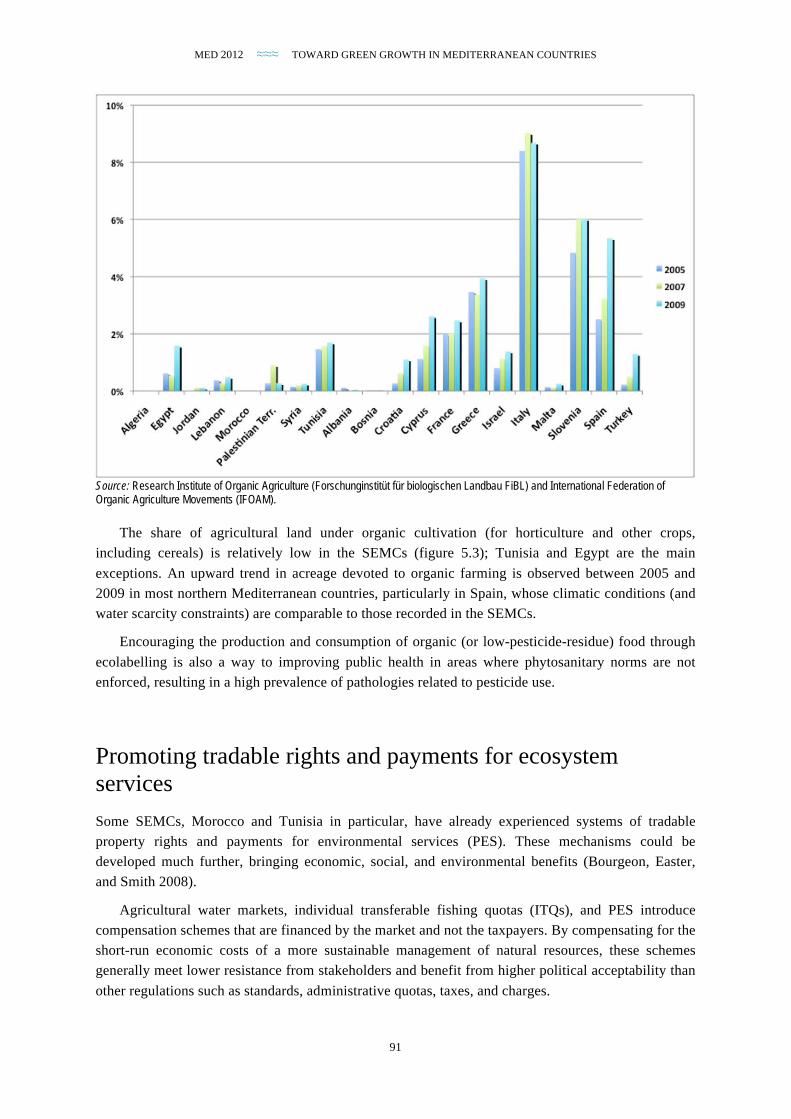
MED 2012 ≈≈≈ TOWARD GREEN GROWTH IN MEDITERRANEAN COUNTRIES
91
Source: Research Institute of Organic Agriculture (Forschunginstitüt für biologischen Landbau FiBL) and International Federation of Organic Agriculture Movements (IFOAM).
The share of agricultural land under organic cultivation (for horticulture and other crops,
including cereals) is relatively low in the SEMCs (figure 5.3); Tunisia and Egypt are the main
exceptions. An upward trend in acreage devoted to organic farming is observed between 2005 and
2009 in most northern Mediterranean countries, particularly in Spain, whose climatic conditions (and
water scarcity constraints) are comparable to those recorded in the SEMCs.
Encouraging the production and consumption of organic (or low-pesticide-residue) food through
ecolabelling is also a way to improving public health in areas where phytosanitary norms are not
enforced, resulting in a high prevalence of pathologies related to pesticide use.
Promoting tradable rights and payments for ecosystem services
Some SEMCs, Morocco and Tunisia in particular, have already experienced systems of tradable
property rights and payments for environmental services (PES). These mechanisms could be
developed much further, bringing economic, social, and environmental benefits (Bourgeon, Easter,
and Smith 2008).
Agricultural water markets, individual transferable fishing quotas (ITQs), and PES introduce
compensation schemes that are financed by the market and not the taxpayers. By compensating for the
short-run economic costs of a more sustainable management of natural resources, these schemes
generally meet lower resistance from stakeholders and benefit from higher political acceptability than
other regulations such as standards, administrative quotas, taxes, and charges.

MED 2012 ≈≈≈ TOWARD GREEN GROWTH IN MEDITERRANEAN COUNTRIES
92
These mechanisms require legal and institutional reforms such as the decentralisation of natural
resources management. Several SEMCs, such as Morocco, Tunisia, and Turkey, have already
implemented such reforms.
Under certain conditions, the development of
irrigation water trading would result in significant
benefits, including higher revenues and more employment
for the local populations, productivity gains in the farming
sector, and lower water use. Water reform raises
productive efficiency, and this leads to lower input prices,
all else being equal (Diao, Roe, and Doukkali 2005). The
efficient use of water and dissemination of efficient
irrigation techniques would induce a reduction in the use
of freshwater, for example, by as much as 47 per cent in
certain sectors of Tunisian farming (Boubaker 2010).
Water markets favour the efficient use of water, but it is
necessary to enable interdistrict and intersector transfers
so as to maximise this outcome. Simulations for the north-
western Tunisian area of Bouhertma (governorate of
Jendouba) show that with interregional and intersectoral
water trading, farmers’ revenues would increase substantially, by as much as 7 per cent or 9.36 per
cent respectively (Zekri and Easter 2005). In Morocco the magnitude of differences in shadow prices
suggests that allowing agricultural producers to trade water use rights would lead to significant drops
in the production of industrialised protected crops (in particular, sugar) and increased production of
fruits, vegetables, and tubers (for example, watermelon, tomatoes, potatoes) (table 5.1).
Fishing is another industry that could benefit from tradable property rights. Any policy aimed at
reducing overfishing and moving to sustainable management must have two essential objectives: the
setting of the total allowable catches (TAC) and the definition, recognition, and enforcement of
property rights on the resource. A likely third objective is the appropriation of resource rent for the
benefit of local fisheries or the government, as illustrated by the example of “Namibianisation” below.
This rent can serve to mitigate, or in some cases totally offset, the potential short-run economic and
social (employment) costs induced by a reduction in the TAC.
The main purpose of the ITQ schemes is to help fishing industries to comply with a reduction in
the TAC in an efficient way. The Australian experience with ITQs in southern Bluefin tuna (SBT)
offers a good illustration of this efficient process. In 1982 Australia, Japan, and New Zealand agreed
to limit their catches of SBT, and in 1984 Australia implemented an ITQ scheme within its fishing
zones. Quotas (shares of the TAC) were granted at no cost to 136 incumbent companies and fishers on
a boat-by-boat basis (Meany 2001), and the TAC has been reduced almost yearly. The Australian
SBT fishing sector has complied with the regulation and restructured quickly. After just two years,
two-thirds of the boats—mainly the smallest and oldest, or generally the least productive—had left
the fishery, selling their quotas (one-third of the total) to others (Campbell 2001). This concentration
increased economic efficiency, which was further improved by capital investment in new fishing
techniques and equipment. The fishermen who had decided to quit the sector sold their quotas and
thus received monetary compensation financed by the market (that is, Japanese consumers) and not by
the Australian taxpayers. The implementation of ITQs in Iceland in the early 1980s offers another
Table 5.1 An assessment of shadow prices in agriculture in Morocco
Crop Shadow price (dirham per cubic meter)
Sugarcane 2.364
Other cereals 3.012
Sugar beats 3.042
Fodder 3.047
Barley 3.291
Maize 3.426
Citrus 3.692
Legumes 5.603
Sunflower 6.219
Wheat 7.498
Vegetables 7.498
Source: Bouhia (2001: table 4–29).

MED 2012 ≈≈≈ TOWARD GREEN GROWTH IN MEDITERRANEAN COUNTRIES
93
good illustration of this market-based financing of fishing-fleet restructuring and decommissioning
(Arnason 2002).
Market-based solutions such as these require governments to reform their legal systems and
design institutional arrangements that minimise transaction costs. One method is through
decentralisation, involving the transfer of governance and management of natural resources to local
communities (Johansson 2000). Morocco, Tunisia, and Turkey have already decentralised irrigation
water management. Turkey is a leader in the transfer of irrigation schemes to water-user associations
(WUAs). The transfer to WUAs of nearly all large surface-irrigation schemes (accounting for half of
the total irrigated area) developed by the state appears to be complete (Cakmak 2010). Water
decentralisation was implemented in Morocco in 1984 (law 2/1984), providing the legal basis for the
establishment of WUAs and defining their role for the operation and management of irrigation water.
In 1995 a new law set a more favourable context for the decentralisation at the basin level (CEDARE
2006).
Since the 1990s, the Tunisian government has transferred the local management, control,
servicing, and maintenance to groupements d’intérêt collectif (GICs). In each governorate, a
government water agency allocates water among GICs, and then the GICs distribute water rights to
their members (farmers). They also have the right to collect taxes among users so as to finance the
servicing and maintenance of the local infrastructures. The government’s role is restricted to
maintaining and servicing the larger infrastructures, creating a supportive institutional context,
defining and enforcing water rights, and monitoring and regulating externalities and third-party
effects.
The same could be done with fish stocks. The OECD (2003) explains that centralised
governmental management of fisheries is costly, ranging from 3 per cent to as much as 20 per cent of
the aggregate landed value, with an average of 6 to 8 per cent. Arnason (2007a) explains that
decentralisation is more efficient, reducing the cost of providing information and incentives. In the
decentralisation process, the author includes all fisheries management services such as setting,
monitoring, and enforcing of the TAC. Under ITQ systems, these services can be regarded as a club
good (nonrivalrous but excludable), which can be effectively provided by the club (Buchanan 1965).
ITQ holders constitute a well-defined club that can manage fisheries effectively (Arnason 2007a).
Authorities should grant some of the rights at no cost to compensate the actors potentially hurt by
the environmental reform. For example, the market value of quotas can offset the revenue loss of an
agent obliged to reduce its natural resource use. In the same vein, the initial quota distribution can
serve to increase the political acceptability of the environmental reform (Stavins 1998).
In the case of irrigation water markets, Thobani (1997) recommends an allocation of the rights
free of charge based on historic usage but taking into account potential negative third-party effects
such as drops in income, output, employment, or land value. He adds that new rights should be sold
(auctioned) by authorities in a transparent way. The initial rights allocation is a central issue (FAO
2006) and might be influenced by equity principles that often drive water policy objectives.
Nonetheless, equity and efficiency dimensions should be separated, as the former refers to a policy
objective whereas the latter refers to a managerial objective (Johansson 2000).
An alternative to tradable property rights is administrative pricing—for example, adjusting the
price of irrigation water or access to fish stocks. But experience has demonstrated that administrative
pricing is generally inappropriate. For example, in Egypt, to induce a 15 per cent decrease in water
MED 2012 ≈≈≈ TOWARD GREEN GROWTH IN MEDITERRANEAN COUNTRIES
94
demand, it would be necessary to raise water prices by an amount equivalent to 25 per cent of
farmers’ average net income (Perry 1996). This would be politically infeasible.
Box 5.5 Irrigation water markets in Chile and Morocco
The Chilean water reform of 1981 is the only countrywide example of a reform based on water markets. This has led to significant local transfers of use rights, mainly in regions with water scarcity, from farmers to other more efficient farmers, industrial firms, and water utilities. The reform has induced efficiency gains and increased farming income through crop substitution and investment in more efficient water management and irrigation techniques. The increased output has been accompanied by job creation and poverty reduction.
The Chilean authorities designed an institutional context that encouraged local exchange and decentralised water management, creating local WUAs in charge of monitoring, distributing, and enforcing the rights.
This reform has nonetheless suffered from an incomplete definition of property rights, the lack of a clear judicial framework devoted to conflict resolution, the nonintegration of equity concerns during the initial rights allocation, and the absence of integrated water resources management (Bauer 2005).
Water trading has existed for decades in Morocco in the large-scale irrigation areas of Nfis and Haut Ziz (Shobha 2006) and the area of Bitit (CEDARE 2006). In Bitit the system is based on both an accurate specification of water rights and a clear and transparent rule for permits allocation, the “Jrida,” managed by farmers themselves. Such initiatives emerged to compensate for the rigidities of the use rights repartition operated by the Regional Agricultural Development Offices (ORMVA). In Nfis allocation of water quotas is based on irrigated land surfaces and introduces significant disparities among farmers in the marginal benefits of water use. The Moroccan examples underline the need to separate water rights from land ownership, and to allow complete or partial transfers of water rights to nonagricultural sectors (Shobha 2006; CEDARE 2006).
Box 5.6 ITQ systems in Morocco and Namibia
Namibia reformed its fisheries soon after independence, implementing an ITQ system for several fish species in 1994. More than 15 years later, the system has permitted the recovery and rebuilding of fish stocks, except for sardines. The domestic fish-processing sector has developed from zero plants in 1991 to 20 in 2003, employing 8,000 people. An additional 6,000 people are working on vessels, 68 per cent of which are Namibian.
At independence (in 1990), the fleet was half Namibian; in 2003 it was 71 per cent Namibian, and it continues to attract foreign capital. Namibians controlled only 17 per cent of the hake quotas in 1991, but by 2003 they controlled 96 per cent. The onshore processing of fish products contributed to another 1.4 per cent of GDP in 2009. The fishing and fish-processing sector, largely export oriented, is the third-largest economic sector of the country, after farming and mining.18 The Namibian government is now pursuing a conservative resource management policy along with a strict enforcement of fisheries regulation. It participates actively in regional conventions and programs for the integrated and sustainable management of shared marine resources.19
The Moroccan fishery management system was reformed with the introduction of an ITQ system in 2004, following the 2001–03 collapse of the cephalopod populations. The Moroccan ministry of fisheries sets each year’s TAC. The TAC was 12,300 tonnes in 2009 and was reduced to 10,000 tonnes in 2010, despite strong opposition by local fishing industries. The TAC was then separated into fixed allowable catches (FAC), one for each of the three segments of the sector: coastal fisheries, artisanal fisheries, and freezers. FACs are divided into quotas that are allocated to vessels owners, based on historical catches. In the artisanal sector, quotas are allocated to villages rather than to individuals. Quotas can then be traded, but only within the segment (Steward 2004).
18 U.S. Department of State, www.state.gov. 19 The Convention on Conservation and Management of Fisheries Resources in the South-East Atlantic (Seafo Convention) and the Benguela Current Large Marine Ecosystem (BCLME) program.
MED 2012 ≈≈≈ TOWARD GREEN GROWTH IN MEDITERRANEAN COUNTRIES
95
Box 5.7 Payment for environmental services
The SEMCs have significant potential to boost revenue and employment through the improved management of environmental assets. The Tunisian cork oak forest of Iteimia is an important generator of employment for local populations in Tunisia, thanks to the production of cork and to the raising of livestock and crops (Campos and others 2008). Similarly, Mavsar and Farreras (2010) estimate the benefits of better conservation of the Moroccan forest of Bouhacem, located near Chefchaouen. The authors use a contingent valuation method (questionnaires given to a representative sample of the population) to estimate the aggregate willingness to pay for the provision of the environmental services rendered by this forest: biodiversity, hydroecological services, soil conservation, and recreational services. The interviewed population revealed its willingness to pay for better management of the forest, including a halt in deforestation; better conservation of the forest’s biodiversity; a reduction in soil erosion; and the development of forest-based recreational activities. Aggregating the results for the entire local population, the authors conclude that people would be ready to pay, on an annual basis, a total of 1.096 million dirhams, in 2010 values, for better management and conservation of this forest.
Corporate social responsibility and socially responsible investment in Mediterranean countries
There are significant firm-level gains to be had from greening production processes and investment
strategies. To this end, several multilateral and private initiatives are mainstreaming responsible
investment. Meanwhile, a number of practical solutions are being proposed by a wide spectrum of
actors seeking to overcome current challenges in environmental and social reporting. In this section
we review several promising policy initiatives in emerging countries, with a focus on stock
exchanges, carbon finance, and public policy, both within and outside the SEMC region. These
findings suggest that future sustainable development strategies in the SEMC region could include the
following elements20:
• The creation of a sustainability committee at each stock exchange with a mandate to improve
listing requirements, environmental and social governance (ESG) data collection, and
stakeholder engagement (in line with the United Nations Conference on Trade and
Development [UNCTAD], Principles for Responsible Investment [PRI], and Global Compact’s recommendations).
• The creation of a network of sustainability committees with a mission to develop a
regionwide, mandatory, integrated triple-bottom-line reporting system for listed companies (in line with the key performance indicators).
• A multilateral financing scheme for firm-level ESG data collection, with the operational side outsourced to a third party (in line with the South African experience).
• The launch of broad-, sector-, and issue-based national and regional sustainable stock market
indices (with methodological input from the region’s first movers, Egypt and Turkey).
• The introduction of a set of banking and administrative corporate social responsibility (CSR)
incentives for unlisted companies (in line with the Moroccan experience).
• A shift in the priorities of public financial institutions toward the financing of innovative green infrastructures (in line with the Moroccan experience).
20 The full list of strategy suggestions is included in the background paper, pp. 29−30.
MED 2012 ≈≈≈ TOWARD GREEN GROWTH IN MEDITERRANEAN COUNTRIES
96
• The creation of a voluntary regional carbon market and support of local eligible projects with
additional multilateral financing (in line with the Brazilian and Moroccan experiences).
Review of evidence
Over the past 20 years management scholars have sought to establish a business case for CSR.21 The
literature highlights two key mechanisms through which CSR could favourably impact firm
performance. On the one hand, refocusing managerial decisions on eco-efficiency could cut costs at
the firm level (Epstein and Roy 2001). Indeed, implementing a sustainability strategy may allow firms
to substitute existing inputs for cheaper materials, resulting in higher operational efficiency. In
addition, the financial industry is increasingly embracing the objectives of CSR (as shown by the
widespread development of sustainability indices and the inclusion of environmental objectives in the
stock selection processes of mutual funds). As a consequence, focusing on CSR can improve relations
between firms and their capital suppliers, ultimately lowering the cost of external finance and driving
up the net present value (NPV) of selected investment projects. Finally, a good CSR track enables
managers to improve contacts with regulators and civil society. This mitigates the costs of adverse
regulations and hedges a firm against reputational risk (for example, by mitigating adverse NGO
campaigns and media representations). In addition, CSR should help firms increase cash inflows. This
may be accomplished through innovative CSR-related products or production processes that create
new market opportunities, enhanced consumer loyalty, and increased labour productivity (firms
practicing CSR can easily recruit, motivate, and retain talented employees).
Several empirical studies have sought to identify the existence of a specific premium for socially
responsible investment (SRI) strategies. Typically, researchers have composed mutually exclusive
portfolios based on a variety of CSR indicators, and then measured the differences in portfolio returns
over a given horizon. For instance, Blank and Daniel (2002) have suggested that investing in an
equally weighted eco-efficient portfolio yields higher risk-adjusted returns than a standard diversified
portfolio.
Another group of studies analyse the financial implications of CSR based on multifactor models,
whereby expected returns depend on exposure to a variety of risk factors and on an “alpha”
corresponding to the regression’s intercept term and capturing abnormal returns. In comparison to
portfolio studies, this framework allows us to observe (i) whether CSR improves returns on
investment and (ii) whether CSR policy affects risk exposure. In an influential study, Derwall and
others (2005) analysed the impact of eco-efficiency on an unbalanced sample of 450 U.S. companies
from 1995 to 2003 and found that a high ecoefficiency portfolio appeared to earn a positive and
significant 3.98 per cent alpha, while the alpha on the low eco-efficiency portfolio was negative and
not significant. In addition, a positive and significant alpha was observed on the difference portfolio.
These findings suggest that, in line with the “business case for CSR,” eco-efficient companies tend to
generate superior returns. This may explain why many portfolio studies report superior performance
for SRI strategies, in spite of a restricted set of investment opportunities.
Similarly, Guenster and others (2010) matched the Innovest database to the Centre for Sustainable
Resource Processing (CSRP) and Compustat U.S. databases, yielding an unbalanced sample of 519 21 Following the European Commission, CSR is defined here as “a concept whereby companies decide voluntarily to contribute to a better society and a cleaner environment” (COM 2001: 4) by integrating “social and environmental concerns into their business operations and in their interaction with their stakeholders” (COM 2001: 6).

MED 2012 ≈≈≈ TOWARD GREEN GROWTH IN MEDITERRANEAN COUNTRIES
97
companies for the 1996–2004 period, and investigated the impact of eco-efficiency on Tobin’s Q.
They reported a positive and significant coefficient on the eco-efficiency variable. A one-point gain in
the eco-efficiency ranking caused Q to increase by 0.07, corresponding to an increase of 3.2 per cent
of the sample’s average value. In addition, the negative coefficient on the low eco-efficiency dummy
appeared larger than the positive coefficient on the high eco-efficiency dummy, suggesting that
investors are particularly sensitive to downside environmental risk. Overall, these findings suggest
that environmental performance is a powerful driver of financial performance. One important
implication is that investors may use environmental information releases to forecast firm valuation.
Box 5.8 Listing requirements in Malaysia
In September 2006 the Bursa Malaysia began shifting its policies toward ESG by encouraging publicly listed companies to follow a triple-bottom-line approach to information disclosure. It launched a four-dimensional CSR reporting framework focusing on the following:
• Environment (climate change, energy, biodiversity, waste management, wildlife)
• Community (employee voluntarism, education, youth development, the underprivileged, graduate employment, children)
• Marketplace (green products, stakeholder engagement, ethical procurement, supplier management, vendor development, social branding, corporate governance)
• Workplace (employee involvement, workplace diversity, gender issues, human capital development, quality of life, labour rights, human rights, health and safety)
Adherence to these principles was initially voluntary, following a “one-size-does-not-fit-all” approach. Then, in 2007, Bursa Malaysia mandated CSR Asia to conduct an online survey on CSR practices within the exchange. A questionnaire was sent to all listed companies, and respondents were compared to a random international sample of 200 companies. The analysis highlighted that the policy failed to improve the companies’ CSR record significantly. Only 32.5 per cent of listed companies were in the above-average categories for CSR practices; only 4.5 per cent were in the leading category, 67 per cent of them being multinational companies. In addition, companies in regulated industries (alcohol, gambling, tobacco) scored the best result. This study showed an overall lack of awareness and knowledge of CSR in Malaysia. Authorities reacted by making CSR disclosure part of the listing requirements of Bursa Malaysia as of December 2007 (Appendix 9C, Part A, paragraph 29).
Source: www.bursamalaysia.com.
MED 2012 ≈≈≈ TOWARD GREEN GROWTH IN MEDITERRANEAN COUNTRIES
98
Box 5.9 Sustainable indices: Egypt and Turkey
On March 23, 2010, the S&P/Egypt Stock Exchange Economic and Social Governance Index (S&P–EGX ESG) was launched at the Egyptian Exchange. This index gathers a subset of 30 companies selected from the 100 largest, most liquid companies, using both quantitative (internal) and qualitative (external) ESG information.
The creation of the index was powered by the Egyptian Corporate Responsibility Centre, a task force comprising the United Nations Development Programme (UNDP), the Egyptian Ministry of Investment, and the Egyptian Exchange. The selection of index constituents is based on a three-step process. In the first step, each listed company is assigned a quantitative ranking based on the sum of three subrankings reflecting the transparency and disclosure of corporate governance, environmental practices, and social governance. In the second step, leading companies undergo a qualitative analysis based on independent sources of information (media, trade unions, environmental organisations) and have their performance ranked on a scale of 1 to 5, with 5 indicating the highest ESG performance. Finally, a composite score is calculated for each company by summing the qualitative score and the quantitative score, thereby establishing the final ESG ranking. The top 100 stocks are chosen as the eligible pool, and the top 30 stocks are included in the index. Each year companies are assigned new scores based on their latest filings, news, and other material information in the public domain. The index is adjusted for aberrations on a quarterly basis.
It should be noted that the higher the ESG score, the more weight a company has in the index. This implies that the best ESG performers attract a higher share of an index tracker portfolio. The ESG performance of the index is rather positive: the average ESG score of the 100 largest Egyptian companies has improved by nearly 40 per cent between 2006 and 2009, and members of the S&P/EGX ESG Index have improved their score by approximately 80 per cent.
A similar policy is currently being implemented in Turkey, where the Istanbul Stock Exchange Sustainability Index Project was launched in August 2010. This project was powered by the Istanbul Stock Exchange and the Turkish Business Council for Sustainable Development, which gathered 29 Global Compact member companies. Company assessment has been outsourced to a third-party vendor, with input from Dow Jones and Sustainability and Sustainable Asset Management.
Source: S&P/EGX ESG Index Methodology, S&P 2010.
Box 5.10 The Brazilian Carbon Market
Since September 2005 BM&F Bovespa (Bolsa de Valores, Mercadorias & Futuros de São Paulo) has operated a carbon market within the framework of the Clean Development Mechanism (CDM) outlined in Article 12 of the Kyoto Protocol. The CDM enables industrialised countries to meet part of their emission reduction target by financing greenhouse gas (GHG) reduction projects in developing countries. The Brazilian Carbon Market consists of two entities: a project data bank (the Carbon Facility) and an electronic Carbon Credit Auction platform. Projects are screened by UN-certified designated national authorities prior to inclusion in the Carbon Facility. On the supply side, foreign government entities, multilateral organisations, and NGOs can announce their intention to participate and state the type of project they seek. Electronic carbon credit auctions are then scheduled by BM&FBovespa on an ad hoc basis and are open to all global carbon market participants. The first auction was organised in 2007. It involved 14 international institutions, and about 800,000 Certified Emission Reductions (CERs) were sold at the price of 16.20 per tonne of carbon dioxide (CO2).
Source: http://wbcarbonfinance.org/Router.cfm?Page=Projport&ProjID=54386.
MED 2012 ≈≈≈ TOWARD GREEN GROWTH IN MEDITERRANEAN COUNTRIES
99
Box 5.11 The Moroccan CGEM CSR label
In 2006 the Confédération Générale des Entreprises du Maroc (CGEM) launched a CSR label recognising firms’ commitments to sustainable development. To make the label attractive to Moroccan businesses, a number of financial and administrative incentives were designed in partnership with public and private stakeholders:
• Domestic and international banks (Crédit Agricole du Maroc, Groupe Banques Populaires, Banque Marocaine pour le Commerce et l’Industrie) offer lower interest rates, cheaper account management, and lower banking fees to labelled firms.
• National administrations (social security, customs, tax authorities) offer faster and simplified procedures to labelled firms.
• The CGEM CSR label is granted following a three-step process. In the first step, the applicant selects one of the eight accredited auditors, which include local and international companies (such as VIGEO or Grant Thornton). In the second step, the appointed auditor provides a report and a set of recommendations. In the third step, the company submits an action plan with detailed objectives. These are evaluated by an independent board that can (i) grant the label for two years, (ii) grant the label subject to the company’s implementing key actions and agreeing to undergo another audit within the next six months, or (iii) reject the application.
Source: www.cgem.ma.
Box 5.12 Public institutions: The Moroccan Caisse des Dépôts et de Gestion (CDG)
The Caisse des Dépôts et de Gestion (CDG) is a public financial institution created in 1959 with a view to mobilising and allocating long-term savings toward strategic projects in line with the Morocco’s development objectives. As part of its quality control, the CDG increasingly incorporates the principles of sustainable development into its operations. In addition, the CDG has begun supporting projects based on their environmental externalities:
• In 2009 a joint venture was established with the French Caisse des Dépôts et Consignations (CDC) to create the Société Forestière de la Caisse des Dépôts et de Gestion (SFCDG), an investment fund of 200 million dirhams to reforest 25,000 hectares within 10 years, while progressively incorporating sustainability principles in the wood production sector. The fund is 70 per cent owned by the CDG and 30 per cent owned by the CDC.
• The CDG is also participating (with the CDC and the European Investment Bank, EIB) in the creation of the Fonds Capital Carbone Maroc, an investment fund whose objective is to promote Kyoto Protocol–relevant projects within the framework of the CDM. One of the fund’s objectives is to leverage political support for renewable energy projects such as the Moroccan solar plan (targeting an output of 2,000 megawatts [MW] by 2020) and the Moroccan wind plan (targeting an output of 1,440 MW by 2012).
Source: Caisse de Dépôt et de Gestion (2009).
Changing consumer and producer behaviour: Promoting ecolabels and certification
Environmental regulation is not without cost to consumers and producers. But private agents’
perception that good environmental practices and profits are mutually exclusive may be reduced by
policies that produce social and macroeconomic benefits, including improvements in living standards
and the modernisation of industry practices. The increasing popularity of product-oriented
environmental policy in the Mediterranean and elsewhere is based on consumers’ perception that
changes in their behaviour can contribute to reducing pollution from industrial and other large
sources. It is now more important than ever to look at the nonpoint source pollution and resource use
associated with private consumption (Geyer-Allély and Eppel 1997; Sitarz 1994).

MED 2012 ≈≈≈ TOWARD GREEN GROWTH IN MEDITERRANEAN COUNTRIES
100
Ecolabelling and product certification can encourage sustainable consumption by providing
consumers with information about the environmental impact of particular products and services.
Companies are rewarded through public recognition, further encouraging proactive environmental
management.
Ecolabels and certification: Rationale and impact Ecolabels applied to consumer products (appliances, automobiles, food) provide information on the
environmental performance or effects of the labelled items. They are generally awarded by an
impartial third party that authorises the use of the label on products within a certain category.
Ecolabels may be voluntary, but some labelling systems are now required by law in most OECD
countries, notably for major appliances and automobiles. They are a greening measure that aim to
help consumers take environmental concerns into account when shopping. Requiring ecolabels is a
demand-side management policy. They generally cost the public little (in general a small share of the
budget of a National Green Agency, most of it invested in communication) and generate high returns
in terms of saved energy consumption. See, for example, Meyers and others (2003) for the U.S. case.
Part of the cost is supported by consumers, as they replace old appliances with new and more efficient
models. Such expenditures in turn generate savings for households over time—even as policy
measures and incentives may dramatically change the timing of returns on investment. It should also
be noted that mandatory ecolabelling seems to be more effective than any voluntary schemes.
On the producer side, companies are rewarded through public recognition, thus encouraging
attitudes toward more proactive environmental management.
The idea is to label the least harmful products in such a way that consumers can distinguish them
from others. The hope is that consumers’ choices will give producers of (relatively) environmentally
friendly products a competitive advantage, allowing them to gradually push less environmentally
friendly products out of the market (OECD 2007). In addition, it is hoped that the anticipated
competitive advantage gives companies an incentive to develop new products that are less harmful to
the environment (OECD 1991; EPA 1998). Promoting ecolabelling in the Mediterranean region
could:
• Expand the region’s market access into environmentally conscious zones.
• Ensure that environmental considerations do not act as a barrier to trade.
• Reduce costs of production, thereby increasing competitiveness.
• Demonstrate the region’s proactive engagement in the era of green consumerism.
• Promote the ideals of green procurement.
• Develop policies that give priority to sustainable consumption and production.
• Reverse the impacts of climate change.
The practice of ecolabelling is still very new in the Mediterranean region, and promises to be more effective if it takes into consideration several lessons learned elsewhere:
• Increase awareness among consumers, producers, and public agencies about the economic and environmental benefits of ecolabelling.
• Make ecolabels simple and readily understandable.
• Design proper trade and industrial policies that give priority to ecolabelling.
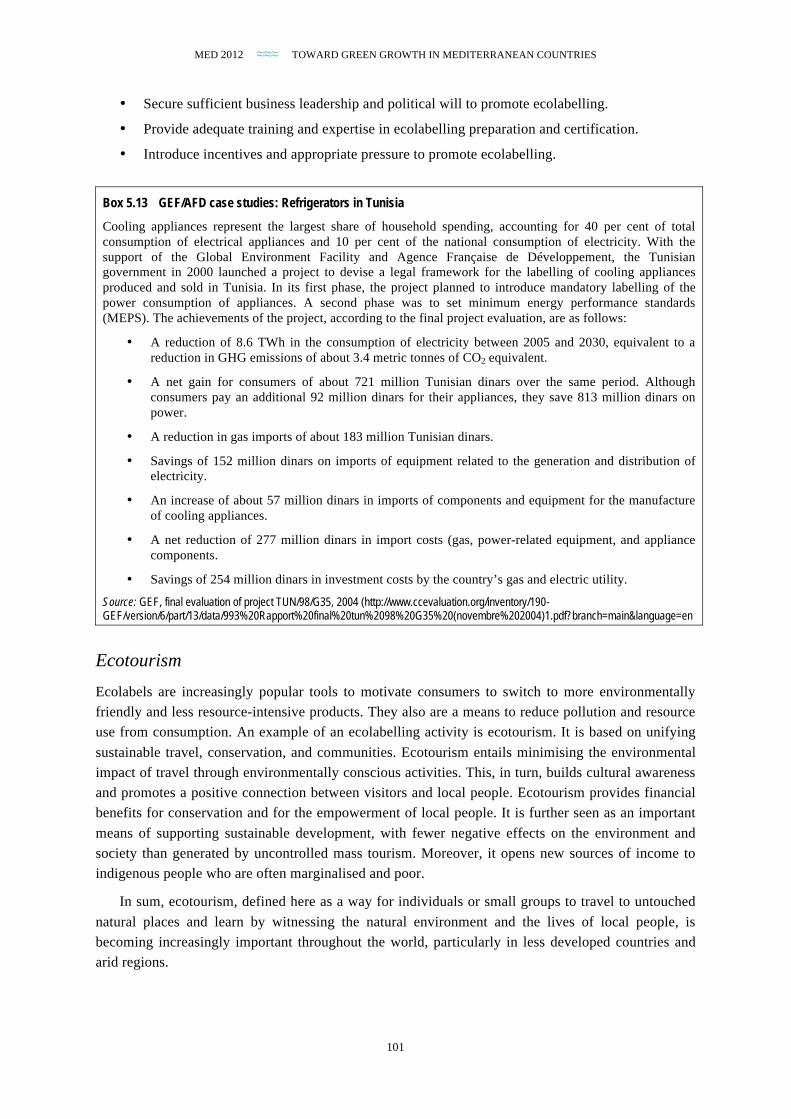
MED 2012 ≈≈≈ TOWARD GREEN GROWTH IN MEDITERRANEAN COUNTRIES
101
• Secure sufficient business leadership and political will to promote ecolabelling.
• Provide adequate training and expertise in ecolabelling preparation and certification.
• Introduce incentives and appropriate pressure to promote ecolabelling.
Box 5.13 GEF/AFD case studies: Refrigerators in Tunisia
Cooling appliances represent the largest share of household spending, accounting for 40 per cent of total consumption of electrical appliances and 10 per cent of the national consumption of electricity. With the support of the Global Environment Facility and Agence Française de Développement, the Tunisian government in 2000 launched a project to devise a legal framework for the labelling of cooling appliances produced and sold in Tunisia. In its first phase, the project planned to introduce mandatory labelling of the power consumption of appliances. A second phase was to set minimum energy performance standards (MEPS). The achievements of the project, according to the final project evaluation, are as follows:
• A reduction of 8.6 TWh in the consumption of electricity between 2005 and 2030, equivalent to a reduction in GHG emissions of about 3.4 metric tonnes of CO2 equivalent.
• A net gain for consumers of about 721 million Tunisian dinars over the same period. Although consumers pay an additional 92 million dinars for their appliances, they save 813 million dinars on power.
• A reduction in gas imports of about 183 million Tunisian dinars.
• Savings of 152 million dinars on imports of equipment related to the generation and distribution of electricity.
• An increase of about 57 million dinars in imports of components and equipment for the manufacture of cooling appliances.
• A net reduction of 277 million dinars in import costs (gas, power-related equipment, and appliance components.
• Savings of 254 million dinars in investment costs by the country’s gas and electric utility.
Source: GEF, final evaluation of project TUN/98/G35, 2004 (http://www.ccevaluation.org/inventory/190-GEF/version/6/part/13/data/993%20Rapport%20final%20tun%2098%20G35%20(novembre%202004)1.pdf?branch=main&language=en
Ecotourism Ecolabels are increasingly popular tools to motivate consumers to switch to more environmentally
friendly and less resource-intensive products. They also are a means to reduce pollution and resource
use from consumption. An example of an ecolabelling activity is ecotourism. It is based on unifying
sustainable travel, conservation, and communities. Ecotourism entails minimising the environmental
impact of travel through environmentally conscious activities. This, in turn, builds cultural awareness
and promotes a positive connection between visitors and local people. Ecotourism provides financial
benefits for conservation and for the empowerment of local people. It is further seen as an important
means of supporting sustainable development, with fewer negative effects on the environment and
society than generated by uncontrolled mass tourism. Moreover, it opens new sources of income to
indigenous people who are often marginalised and poor.
In sum, ecotourism, defined here as a way for individuals or small groups to travel to untouched
natural places and learn by witnessing the natural environment and the lives of local people, is
becoming increasingly important throughout the world, particularly in less developed countries and
arid regions.
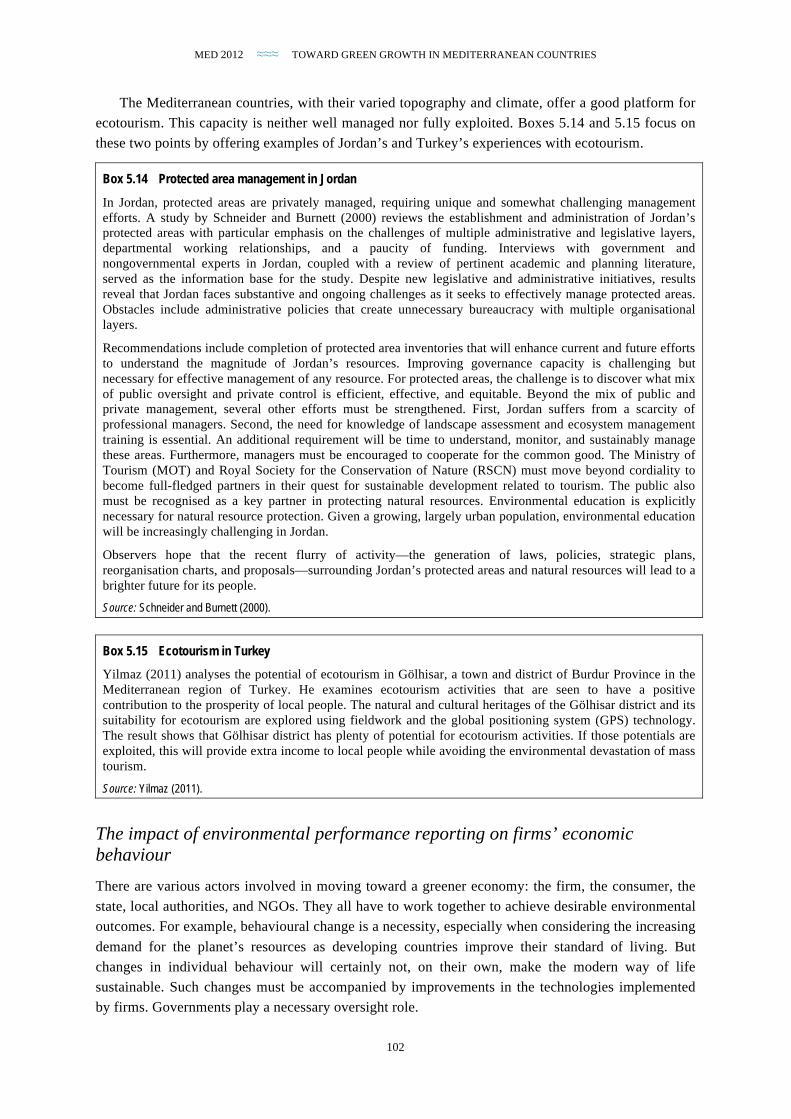
MED 2012 ≈≈≈ TOWARD GREEN GROWTH IN MEDITERRANEAN COUNTRIES
102
The Mediterranean countries, with their varied topography and climate, offer a good platform for
ecotourism. This capacity is neither well managed nor fully exploited. Boxes 5.14 and 5.15 focus on
these two points by offering examples of Jordan’s and Turkey’s experiences with ecotourism.
Box 5.14 Protected area management in Jordan
In Jordan, protected areas are privately managed, requiring unique and somewhat challenging management efforts. A study by Schneider and Burnett (2000) reviews the establishment and administration of Jordan’s protected areas with particular emphasis on the challenges of multiple administrative and legislative layers, departmental working relationships, and a paucity of funding. Interviews with government and nongovernmental experts in Jordan, coupled with a review of pertinent academic and planning literature, served as the information base for the study. Despite new legislative and administrative initiatives, results reveal that Jordan faces substantive and ongoing challenges as it seeks to effectively manage protected areas. Obstacles include administrative policies that create unnecessary bureaucracy with multiple organisational layers.
Recommendations include completion of protected area inventories that will enhance current and future efforts to understand the magnitude of Jordan’s resources. Improving governance capacity is challenging but necessary for effective management of any resource. For protected areas, the challenge is to discover what mix of public oversight and private control is efficient, effective, and equitable. Beyond the mix of public and private management, several other efforts must be strengthened. First, Jordan suffers from a scarcity of professional managers. Second, the need for knowledge of landscape assessment and ecosystem management training is essential. An additional requirement will be time to understand, monitor, and sustainably manage these areas. Furthermore, managers must be encouraged to cooperate for the common good. The Ministry of Tourism (MOT) and Royal Society for the Conservation of Nature (RSCN) must move beyond cordiality to become full-fledged partners in their quest for sustainable development related to tourism. The public also must be recognised as a key partner in protecting natural resources. Environmental education is explicitly necessary for natural resource protection. Given a growing, largely urban population, environmental education will be increasingly challenging in Jordan.
Observers hope that the recent flurry of activity—the generation of laws, policies, strategic plans, reorganisation charts, and proposals—surrounding Jordan’s protected areas and natural resources will lead to a brighter future for its people.
Source: Schneider and Burnett (2000).
Box 5.15 Ecotourism in Turkey
Yilmaz (2011) analyses the potential of ecotourism in Gölhisar, a town and district of Burdur Province in the Mediterranean region of Turkey. He examines ecotourism activities that are seen to have a positive contribution to the prosperity of local people. The natural and cultural heritages of the Gölhisar district and its suitability for ecotourism are explored using fieldwork and the global positioning system (GPS) technology. The result shows that Gölhisar district has plenty of potential for ecotourism activities. If those potentials are exploited, this will provide extra income to local people while avoiding the environmental devastation of mass tourism.
Source: Yilmaz (2011).
The impact of environmental performance reporting on firms’ economic behaviour
There are various actors involved in moving toward a greener economy: the firm, the consumer, the
state, local authorities, and NGOs. They all have to work together to achieve desirable environmental
outcomes. For example, behavioural change is a necessity, especially when considering the increasing
demand for the planet’s resources as developing countries improve their standard of living. But
changes in individual behaviour will certainly not, on their own, make the modern way of life
sustainable. Such changes must be accompanied by improvements in the technologies implemented
by firms. Governments play a necessary oversight role.

MED 2012 ≈≈≈ TOWARD GREEN GROWTH IN MEDITERRANEAN COUNTRIES
103
One way to encourage firms to make necessary changes is through environmental performance
reporting. Environmental performance encompasses a firm’s efforts to minimise the negative
environmental impacts of its products throughout their life cycle (Labatt and White 2002). It measures
how successful a firm has been in reducing and minimising its adverse impact on the environment. By
requiring such reporting, policy makers can pressure firms to internalise the external costs associated
with their emissions.
Over the past 25 years, American firms have shown that environmental management means more
than just compliance with existing regulations (Jones, Seville, and Meadows 2002). While compliance
with some environmental regulations is compulsory, some companies, in the pursuit of increased
market share, have been freely adopting other environmental regulations. According to Kautto and
Melanen (2004), customers may be the principal source of pressure to improve firms’ environmental
performance.
According to some economic theories, environmental performance reporting leads to positive
financial outcomes for firms, resulting in a win-win situation in which both the society and the firm
gain from the internalisation of external costs. Society benefits alongside the health of ecosystems and
individual beneficiaries; firms see higher benefits in the medium term as they reduce production costs,
win market share, and gain the confidence of their customers. But environmental performance may
also lead to negative financial effects, as investments such as abatement and transaction costs in
general result in higher production costs and lower profits. On average, environmental performance
reporting, especially as driven by regulations, has a neutral effect on financial outcomes when the
costs of adaptation are shifted to the demand side.
In principle the relationship between environmental and economic performance is not
straightforward. It depends on several factors such as efficiency, the way that environmental
investments are carried out, the timing of the investments, the market structure facing the firm, and
demand responses to the supplied goods.
Capital modernisation According to Porter (1991) and Porter and Van der Linde (1995a, 1995b) a given regulation’s ability
to produce a win-win situation is often exemplified by higher firm profitability due to reduced
production costs and increased consumer satisfaction, leading to higher sales volumes. But the
adoption of regulations may have two effects, according to Xepapadeas and de Zeeuw (1999). Using a
model in which firms can invest in machines with different characteristics, where newer machines are
more productive and “cleaner” but also more expensive than older machines, Xepapadeas and de
Zeeuw (1999) isolate two effects resulting from the introduction of a stricter environmental policy in
the form of a tax on emissions:
• A productivity effect. If a firm is downsizing due to stricter environmental policy
accompanied by modernisation—that is, a reduction in the average age of capital stock—then the average productivity of the capital stock increases.
• A profit/emission effect. Profits and emissions decrease under stricter environmental policy.
But if capital stock can be composed of newer, more productive machines rather than older,
less productive machines, an environmental tax would have a smaller effect on profits. The
results of Xepapadeas and de Zeeuw (1999) show that although a stricter environmental
policy cannot be expected to provide a win-win situation that both reduces emissions and
increases profitability in an industry, one may expect increased productivity of the capital

MED 2012 ≈≈≈ TOWARD GREEN GROWTH IN MEDITERRANEAN COUNTRIES
104
stock, along with a relatively less severe impact on profits and more emission reductions,
when the stricter policy induces modernisation of the capital stock. The trade-off between
environmental conditions and profits remains, but is less sharp as the industry is downsized
and modernised.
Different industries will be variously affected by going green Environmental management and its positive impacts on competitiveness, as well as timing related to
introducing green products, may also play a decisive role in the relationship between environmental
and economic performance (see, for example, Vogel 1995). If released too early, there may not be
sufficient demand for a green good due to its higher costs compared to nongreen substitutes and lower
consumer willingness to pay. Increase in profits depends on the demand and supply elasticity of the
product. For example, the more elastic the demand, the more production quantity changes and the less
market prices change. When it is difficult to shift the cost, companies bear more of it. On the other
hand, if the supply curve is elastic the change in market price leads to change in supply, and vice
versa. Besides the importance of the price elasticity of a product, the size and sign of the relationship
between environmental and financial outcomes also depends on the market where the firm is
operating. Competitive markets with free entry are different from oligopolistic as well as monopolistic
markets where profits are, in general, warranted.
Review of instruments that stimulate behaviour for better environmental performance Many believe that the nature of environmental policy is changing. In much of the world during the
last couple of decades of the twentieth century, environmental policy was dominated by “command-
and-control” approaches (Andrews 1994; Hays 1987; tenBrink 2002) but a shift to fiscal policies has
been observed from the late 1990s. Under command and control, government agencies develop a set
of rules or standards. These determine technologies to be used or avoided; amounts of pollutants that
can be emitted from a particular waste pipe, smokestack, or factory; or the amounts or kinds of
resources that may be extracted from a common resource such as a fishery or a forest. The agencies
then issue commands in the form of regulations and permits to control the behaviour of private firms,
other government agencies, or individuals. This approach can be found as far back as the 4,000-year-
old Code of Hammurabi, which prescribes penalties for faulty construction.22
Experiments with market-based environmental policies spread in the late 1980s and early 1990s.
This change came in response both to theoretical developments in economics and to the continued
resistance to command-and-control policies of those regulated. Using market-based approaches,
instead of detailing what can and cannot be done, governments place a constraint or tax on pollution
or resource extraction. Those targeted by a given policy decide how best to economise on the affected
activities. One of the best-known market-based strategies is tradable emission permits (Tietenberg
1985, 2002; Rose 2002). Another market-based approach is a pollution tax, which provides an
incentive for producers to reduce environmental impacts while compensating society as a whole
(Freeman 1993; Kneese and Bower 1968).
Although command-and-control and market-based approaches have dominated European and
U.S. environmental policy in the past, other approaches are also emerging. These include
22http://www.yale.edu/lawweb/avalon/hammenu.htm.
MED 2012 ≈≈≈ TOWARD GREEN GROWTH IN MEDITERRANEAN COUNTRIES
105
environmental education efforts aimed at both the public and students and information-based efforts
for energy conservation, such as home energy audits and appliance-labelling programs. We can
classify such approaches into five types:
• Command and control
• Market based
• Education
• Provision of information
• Investment
• Voluntary measures
The first two approaches constitute the traditional tools that have been most prominent over the
past quarter century in the developed world; the last three are the new tools that are the subject of
current implementation. Traditionally, explicit external controls are placed on behaviour: those who
do not do as prescribed face specific tangible sanctions. The new tools rely more on implicit sources
of behavioural control, so that the resulting behaviour is likely to be perceived as voluntary.
Education includes the provision of information in a systematic and structured way, but usually goes
further, encouraging deeper understanding and, perhaps, values and norms regarding behaviours. In
other words, new tools use education and the provision of information to try to change behaviour, and
the changes in behaviour are voluntary in the sense that they are not driven by specific regulatory
directives, externality taxes, or permit markets.
Review of the role of the government in enforcing environmental performance Government, often in cooperation with stakeholders, must design the institutions that will implement
tradable permits or pollution taxes. It must set the level of pollution allowed or the tax rate, as well as
penalties for breaking the rules. It may also require market participants to provide accurate
information on their resource use or pollutant emissions. All these activities involve command and
control. New tools based on education, information, and voluntary measures are present in every
command-and-control and market-based policy as well. New measures, whether command and
control or market based, always involve a learning curve in which those affected must learn how to
operate efficiently in the face of the changed environment. As public information and the way it is
presented are crucial, let us consider how public information is offered in Indonesia.
The problem of how to offer public information to Indonesian consumers in a simple,
understandable way was overcome by a number of jurisdictions through the development of a public
rating system. Rating systems simplify the flow of information to the public by summarizing a
regulated firm’s performance into a grade. The grading scale can be simple or complicated. Table 5.2
provides an example of public grading in Indonesia. Support of the local media is critical to public
information campaigns. To ensure accurate press reports and to foster a working relationship with the
media, the environmental management programme should invite reporters to a detailed presentation
of the information campaign, including an explanation of how the information was collected and
analysed. The information should also be in a format that can be easily communicated by the
broadcast and print media.
Ideally, an information strategy should be flexible enough to accommodate regulated firms with
different characteristics. It should be simple and easily understandable by the public. Finally, it should
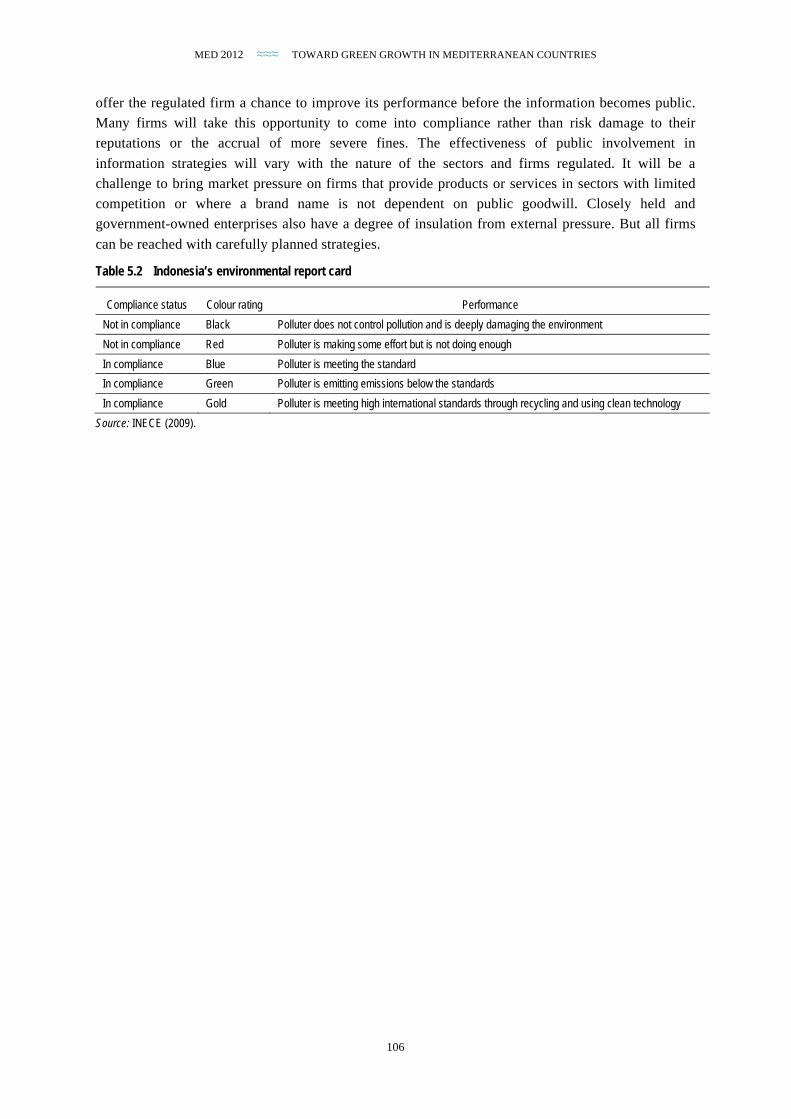
MED 2012 ≈≈≈ TOWARD GREEN GROWTH IN MEDITERRANEAN COUNTRIES
106
offer the regulated firm a chance to improve its performance before the information becomes public.
Many firms will take this opportunity to come into compliance rather than risk damage to their
reputations or the accrual of more severe fines. The effectiveness of public involvement in
information strategies will vary with the nature of the sectors and firms regulated. It will be a
challenge to bring market pressure on firms that provide products or services in sectors with limited
competition or where a brand name is not dependent on public goodwill. Closely held and
government-owned enterprises also have a degree of insulation from external pressure. But all firms
can be reached with carefully planned strategies.
Table 5.2 Indonesia’s environmental report card
Compliance status Colour rating Performance
Not in compliance Black Polluter does not control pollution and is deeply damaging the environment
Not in compliance Red Polluter is making some effort but is not doing enough
In compliance Blue Polluter is meeting the standard
In compliance Green Polluter is emitting emissions below the standards
In compliance Gold Polluter is meeting high international standards through recycling and using clean technology
Source: INECE (2009).
C H A P T E R S I X
Conclusions and Call for Action
≈≈≈
Shifting to green growth requires a policy mix made up of many different components—among them price- and market-based
mechanisms, norms and regulations, industrial and innovation policies, and investments. Local conditions in the Mediterranean
region are diverse, particularly in terms of water stress, energy subsidies, and relative factor prices. Therefore, public
environmental actions must be tailored to suit national priorities and development objectives.
Nevertheless, many common features can be observed among Mediterranean countries. Country
environmental analyses undertaken by the World Bank (2004a, 2005, 2010a, 2011d) provide
information for Egypt, Jordan, Lebanon, and Tunisia that indicates the presence of similar priorities
and constraints amid the diversity of national environmental conditions. Therefore, the tools that will
be the most appropriate and cost-effective for environmental action are above all sector-specific. The
next section examines tools that can be used to advantage in key sectors of a typical Mediterranean
country.
Green growth is pure economics—and can generate benefits
Green growth should be carefully considered by southern and eastern Mediterranean countries
(SEMCs) as a means of enhancing the sustainability of economic and social development. It is argued
in this report that a green growth agenda could, in principle, help the SEMCs meet some of their main
challenges, particularly those related to economic growth, job creation, and social equity. Through
case studies the report demonstrates that well-designed green policies have the potential to generate
both environmental and economic benefits, or “co-benefits.”
Case studies in some important sectors have illustrated interesting characteristics in the
Mediterranean context, correcting some erroneous assumptions related to the costs of such policies. It
has been shown that green policies are not overly costly, nor need they be harmful to growth or jobs.
They have the potential to favour innovation, to improve daily life for poor households, and to
promote wiser use of the region’s environmental assets while avoiding irreversible damage, notably to
the environment.
MED 2012 ≈≈≈ TOWARD GREEN GROWTH IN MEDITERRANEAN COUNTRIES
108
“Green” and “growth” are not natural opposites. At the same time, green policies are not “silver
bullets” or, in isolation, miraculous tools capable of quickly solving all of the problems of the
Mediterranean region. They are not even new, being commonly based on a more efficient use of
resources. They are, simply, tools to make growth processes more resource efficient, clean, and
resilient.
As common economic tools, green policies are subject to some well-known principles:
• Green policies cannot remove all structural sources of economic inefficiency; indeed, they
can deliver their potential benefits only when other structural bottlenecks are corrected. This
is particularly true in terms of jobs. New job opportunities may be created by green policies,
but those opportunities will not translate into higher employment unless workers with the
required competencies can be found and the business framework is adapted. A green growth
agenda should be combined with other structural policies to stimulate the economic potential of the region.
• In the short term, green policies will have economic costs—chiefly in the form of investment,
operating costs, and opportunity costs. Trade-offs will be unavoidable, both in conventional
economic terms and in terms of social acceptance of changes to the status quo. However,
from the Mediterranean case studies examined in this report, it appears that there are
possibilities to offset costs and trade-offs by maximizing synergies and co-benefits. An
efficient combination of market-based instruments, carefully crafted regulations, and effective
institutions can facilitate a fruitful shift toward green growth.
Green growth for the Mediterranean is feasible
In some cases, green policies may bring co-benefits in the short term and at low cost. The report
identifies co-benefit opportunities for private agents that would require little public intervention. In
these cases, market-based instruments, combined with well-designed institutions for enforcing
regulations and monitoring results, can ensure a smooth transition toward green growth. Several of
those opportunities involve energy efficiency (box 6.1).
The advantages of demonstrating co-benefits in the short term are twofold. On the one hand,
doing so would serve to rally social support for changing the unsustainable status quo; on the other, it
would create financial space to tackle more complex and costly issues fraught with trade-offs between
potential uses or potential users. In such cases, a deeper and more sustained public intervention may
be necessary to correct market failures and supply a share of the needed investment.
Box 6.1. Co-benefits obtainable in the short term and at low cost: the case of energy efficiency
The Mediterranean case studies highlight substantial but inexpensive short-term co-benefits that can be expected from energy efficiency. It is clear that the potential for energy savings has not yet been exploited. A look at the region’s building sector, for example, reveals that using efficient shells for new buildings could create up to 1.3 million new direct jobs and cut energy use by 60 per cent, at an additional cost ranging from 3 to 10 per cent. In almost all cases, savings from reduced consumption of an increasingly expensive resource can offset these additional costs.
Source: Plan Bleu (2011a).
MED 2012 ≈≈≈ TOWARD GREEN GROWTH IN MEDITERRANEAN COUNTRIES
109
Where the right incentives exist, producers and consumers will modify their behaviour to
capitalise on opportunities, with important outcomes in terms of overall energy consumption. From
the producer perspective, studies in Germany and the United Kingdom have shown that investments
to reduce consumption effectively increase energy efficiency with no negative effect on performance
(see chapter 3). From the consumer perspective, the case of eco-labelling of domestic appliances in
Tunisia, for example, indicates that expected savings on electricity consumption over 20 years are
almost 9 times higher than the cost of replacing the appliances.
It seems clear that shifting from fuel subsidies to fuel taxation should be considered as a pillar of
any green growth agenda (box 6.2). Reducing fuel subsidies and reallocating part of the savings to
compensate the most vulnerable households can achieve real improvements. The main challenge is to
secure social acceptance for a policy that will increase fuel costs for many who have become
accustomed to paying lower-than-optimal prices.
Box 6.2. Harmful fuel subsidies
Cutting energy subsidies from the national budget can result in savings for the economy as a whole. In Egypt, for example, subsidizing domestic fuel prices cost the nation 62.7 billion Egyptian pounds in 2008/09, increasing an increase of more than 56 per cent from 2006/07. Fuel subsidies account for 67 per cent of total subsidies and 18 per cent of public expenditures (El-Deken, Farag, and Hamdy 2011). In addition to their fiscal burden, fuel subsidies are discourage investment in energy efficiency and provide disproportionate benefit to richer households (which use more fuel). A recent study by the International Monetary Fund in developing countries shows that, on average, the top income quintile captures six times as much from fuel subsidies as the bottom quintile (Arze del Granado, Coady, and Gillingham 2010).
Recent Mediterranean experiences with reducing fuel subsidies have been mixed. Turkey
implemented a policy of cutting subsidies and raising taxes and now has among the highest fuel tax
rates in the world. In Jordan, a gradual shift toward high taxation began in 2008 but was stopped in
January 2011 because of social pressure. A similar policy introduced in Iran in December 2010
resulted in a sharp decline in fuel consumption while increasing the disposable income of the poorest
households (IMF 2011a). These cases illustrate that initiatives to alter subsidy schemes should include social safety nets as part of the reform package. Safety nets should be designed to protect poor
households (those that cannot afford higher fuel prices) from the potentially debilitating effects of
price increases.
Another promising area for action is waste management. Here the expected co-benefits are
slightly different from those promised by energy efficiency. Given the current low rate of recycling
(less than 10 per cent) and the expected increase in the proportion of recyclable materials with
economic development, the monetization of waste products recovered through recycling will
represent an important economic opportunity for the SEMCs over the next decade.
In some countries (such as Egypt), informal waste management and recycling already provide
informal jobs. A more efficient waste management system would transform these activities into
decent jobs and productive enterprises. In its recent report on the green economy, the Economic and
Social Council of the Kingdom of Morocco (CESRM 2012) estimates that waste management has the
potential to create more than 11,000 direct jobs.
Moreover, by reducing tangible disamenities, an efficient waste management system may be a
good way to reinforce the social acceptance of green policies. Two key issues should be considered to
ensure the success of the transformation of the waste management system: technology choices and
MED 2012 ≈≈≈ TOWARD GREEN GROWTH IN MEDITERRANEAN COUNTRIES
110
cost recovery/financing. In terms of technology choices, case studies show that an important condition
of success is to avoid competing with the informal sector. Technology choices should follow informal
practice and attempt to integrate the informal sector into the formal system. Thus, choices should
favour labour-intensive methods (for example, separation rather than incineration). Part of the early
success of the Alexandria waste management system was its close cooperation between private
partners, local government, and informal workers.
In terms of cost recovery, the waste management system will have to raise collection fees. Recent
experiences in Jordan have shown that the cost-recovery rate can be dramatically improved: Amman
boasts a 60 per cent cost-recovery rate (GTZ-ERM-GKW 2004). Fees could be collected efficiently
by being added to electricity bills, as in Egypt and Jordan.
The control of water and air pollution provides good illustrations of important social benefits
associated with indirect economic benefits that accumulate over time. According to the World Health
Organization, environmental factors explain about half of disabilities from respiratory disease, and
almost all cases of diarrhoea. In addition to these daily-life disamenities, pollution imposes economic
costs. Through the METAP programme (2009), the World Bank estimates that the cost of water
pollution in SEMCs ranges from 0.8 to 2 per cent of GDP.
Reductions in disamenities from pollution can be counted on to raise social support for green
policies in the short term. Further growth in support can be expected as the economic co-benefits of
those reductions (such as the preservation of human and natural resources, with their attendant impact
on factor productivity) accumulate over time. Pollution-abatement technologies are already available,
but investment and operating costs remain a major bottleneck. Nevertheless, several case studies have
shown positive cost-benefit results (box 6.3).
Box 6.3. A high return on investment in water distribution and sanitation
The World Health Organization estimates returns of $3 to $34 for each $1 invested in safe drinking water and basic sanitation, depending on the region and technology used (World Water Assessment Programme 2009). In Greater Amman, each dinar invested in water efficiency may generate about 2 dinars in profit, in addition to the expected health improvement.
The initial investment required to control pollution may appear high relative to its impact, which
is believed to be mainly indirect. However, the indirect impact may well be complemented by a
substantive direct impact. The Economic and Social Council of the Kingdom of Morocco, for
example, estimated that the measures adopted to obtain cleaner water offer the potential to create
some 10,000 jobs (CESRM 2012). The report also highlights in four detailed cases the possibilities of
integrating private initiatives to increase the efficiency of resource use and obtain economic returns in
the short term (from one to forty months).
A blend of market and nonmarket instruments will be needed to maximise the potential for co-benefits
Successful application of green policies in water resource management, as in other sectors, will
require the right balance of market and nonmarket instruments. In water as elsewhere, strategic public
MED 2012 ≈≈≈ TOWARD GREEN GROWTH IN MEDITERRANEAN COUNTRIES
111
interventions, financing, and support will be decisive, because of the important trade-offs that must be
faced before major co-benefits materialise.
Those trade-offs will come in various forms—including opportunity costs and the presence of
obvious winners and losers. In the case of water, for example, it may be possible, as with energy
efficiency, to obtain quick co-benefits (and so reduce tensions) through demand-side management.
But, in contrast to the situation with energy efficiency, it will also be necessary to build infrastructure
and upgrade institutions to ensure access to all users. The costs of those investments can be reduced
and efficient distribution encouraged by charging appropriate prices for environmental services and
streamlining institutions and allocation systems. But these steps require public intervention.
Another specificity of the water sector is the very real risk of irreversible depletion of fossil
aquifers and other nonrenewable assets. That risk, which must be factored into the trade-off equation,
provides a classic justification for public intervention.
The related cases of coastal zone management and urban planning—both aspects of land
management—illustrate the needed mix of market instruments, accompanied by well-crafted
regulations and efficient institutions to correct market failures and monitor actions. Public
intervention is needed chiefly to reallocate rents and ensure a fair distribution among potential uses
and potential users, while avoiding irreversible degradation of natural assets that cannot be
regenerated. In terms of financial and economic instruments, three such instruments are worth
mentioning: (i) transferable development rights, (ii) a development or land tax, and (iii) an eco tax or
tourism tax.
Box 6.4. Efficient territorial management to foster co-benefits
In the Moroccan lagoon of Marchica, the centre of an effort to develop a tourism facility providing 80,000 jobs (of which 15,000 would be permanent), a balance must be found between the compelling need to create jobs and improve living standards for the residents of the area, on the one hand, and, on the other, the need to protect biodiversity and other natural assets. A special agency has been set up to manage the lagoon, with the objective of ensuring a coherent plan to develop the area.
In the case of urban planning, the massive investments required to build new transportation
infrastructure and the opportunity cost of losing agricultural land in coastal areas make the
construction of high-density buildings an attractive proposition. Social equity can be enhanced if
public authorities collect a larger share of the additional land rent generated by urban expansion. In
particular, charging fees for development rights would generate revenue that could be used, in part, to
make existing urban areas greener. A more detailed analysis can be found in the recent Center for
Mediterranean Integration–World Bank report on adaptation to climate change and preparedness for
natural disasters in the coastal cities of North Africa (CMI–World Bank, 2011). Such a concept was
introduced in Jordan in the Greater Amman master plan, under which a payment for development
rights is added to municipal fees (see box 2.7).
The case of fisheries provides a final example of the dividends paid by green policies. In this case,
the dividend is expressed in terms of costs avoided. The urgent actions needed in the fisheries sector
come with costs, both social and financial, but they are essential to avoiding the even greater future
cost that would come with the disappearance of fishing in the Mediterranean.
Most Mediterranean fisheries are exploited in a way that threatens the entire sector with depletion,
which would exact immense economic costs, not least in terms of the extinction of jobs if not of
species of fish. The action required to preserve natural assets (and, in the long term, the livelihoods of
MED 2012 ≈≈≈ TOWARD GREEN GROWTH IN MEDITERRANEAN COUNTRIES
112
those who exploit those assets) involves downsizing the fishing fleet. But whereas larger firms may be
able to weather the changes, it will be more difficult for small-scale fisheries and dependent coastal
communities to do so.
In response to the dilemma, two differentiated management regimes are envisaged: one designed
for application to large fleets that are believed to have the capacity to adjust, and the other targeting
small-scale fleets in coastal communities. Here, public funding may help the small-scale segment to
adapt to the changes needed to sustain fisheries. The paramount goal of both regimes is to strengthen
the economic viability of the industry and to maintain its contribution to the life of coastal
communities.
Other arrangements may be found to help fishermen to generate sufficient revenues. In studying
the value chain for the fisheries sector in Morocco, it was found that the largest marginal increase in
value occurs with the first sale. A small number of fishing cooperatives have attempted to capture that
increase in value by grouping together and purchasing all of their members’ landings for resale to
various intermediaries, thus cutting out, to the extent possible, those intermediaries that traditionally
take a large share of value added.
Agricultural soils and coastal zones face some of the same threats as fisheries—notably the threat
of irreversible damage—and are candidates for similar combinations of regulatory and market-based
solutions (Steward 2004).
Green actions and expected outcomes: a typology for decision making
The similarities in the environmental challenges facing Mediterranean countries make it possible
to devise a common framework for green actions and their expected outcomes at the sector level.
Considering the risk of irreversible degradation of environmental assets and the importance of job
creation in the political agendas of these countries, green growth sectoral policy objectives may be
classified as shown in figure 6.1, in which the y-axis represents the extent of potential synergy in the
development of new economic activities and jobs (net job creation), and the x-axis the risk of
irreversibility or “lock-in” entailed by today’s decisions.
Among the social and economic choices that may be considered irreversible (or locked in) are
those affecting biodiversity (extinction is forever), climate (CO2 and methane molecules have a long
residence time in the atmosphere), infrastructure and settlements (roads and buildings are long-lived
assets; the development of cities is driven by transport infrastructure, and their form is quasi-
irreversible), and technological solutions (innovation and R&D investments have a tendency to focus
on existing, proven technologies). Inertia is a related concept connoting the persistence of
behavioural, technical, and institutional components of socioeconomic systems—among them
consumption habits, the longevity of infrastructure and other aspects of the built environment,
financing models, and government institutions. In its use of the inertia concept, this approach is
consistent with that developed in chapter 7 of the World Bank’s report on green growth (2012).
Specific policies focusing on sectors with high inertia are required, in addition to economy-wide
policies (Lecocq and others 1998; Jaccard and Rivers 2007; Vogt-Schilb and Hallegatte 2011).

MED 2012 ≈≈≈ TOWARD GREEN GROWTH IN MEDITERRANEAN COUNTRIES
113
With reference to the figure, energy efficiency in buildings is deemed to present a high risk of
irreversibility because buildings, once erected, are replaced slowly. Toward the other end of the
continuum, inefficiencies in energy use for transportation and manufacturing that have high
economic, social, and environmental costs can be addressed more easily because it is easier to
upgrade or replace equipment and to introduce energy-saving innovations than it is to upgrade or
replace a building (or a natural habitat or species, once destroyed).
The green growth policies of the highest priority are those that present the greatest risk of
irreversibility (that is, the greatest urgency) and that offer the most immediate synergies in terms of
job creation and profitability. These two criteria intersect in the upper-left quadrant of the figure.
Figure 6.1. Tentative typology of green growth sectoral policy objectives in Mediterranean countries: job creation and risk of irreversibility
Note: ICZM = integrated coastal zone management.
Avoiding irreversibility and overcoming stalemates
On the x-axis, the sectors in which it is comparatively easy to overcome stalemates appear on the
right, and those exposed to high risks of irreversibility on the left. On both sides, the degree of
(ir)reversibility can be traced to environmental or institutional constraints, or, in most cases, to a
combination of the two.
To take one example, the objective of upgrading waste management and improving air and water
pollution control can be achieved within a relatively short time. But an element of irreversibility exists
when heavy metal contamination affects soils and fresh water. Accordingly, waste management is
positioned on the right half of the figure but close to the centre.
MED 2012 ≈≈≈ TOWARD GREEN GROWTH IN MEDITERRANEAN COUNTRIES
114
Energy efficiency in transportation and manufacturing are placed further to the right because
energy-saving innovations can be introduced and existing equipment upgraded in the short term with
a low degree of inertia, as dictated by patterns of replacement of capital stock in these sectors (in
general, around 10 years).
By contrast, energy efficiency in buildings, which can be easily introduced in new dwellings and
nonresidential construction, shows a much higher inertia (stalemate) because buildings typically are
replaced only at long intervals. The inertia is amplified in the Mediterranean context by the effect of
fuel subsidies, which reduces the cost of air conditioning and therefore the incentives to improve the
energy efficiency of old buildings.
The obstacles to improving water management are different in the urban and rural (irrigation)
contexts. While various experiences in developed and developing countries show that urban networks
can be renovated in a short time, given sufficient investment capacity, irrigation systems are exposed
to the risk of irreversible degradation from depletion of aquifers (particularly fossil aquifers) and the
political difficulties of reallocating water among agricultural producers.
In most countries, even higher risks of irreversibility are observed in coastal zone management,
urban planning, and fisheries (the latter owing to the risk of loss of resilience of depleted fish stocks).
However, as highlighted in chapter 3, the extent of environmental degradation is usually less severe in
the SEMCs than on the northern shore—an indication that action is urgently required to avoid a
replication of the damage done along the northern rim.
Maximizing synergies and dealing with trade-offs
On the y-axis, too, a continuum exists. Environmental actions related to energy efficiency promise the
highest co-benefits, notably the potential for substantial job creation (as highlighted in chapter 1).
Sustainable management of fisheries, by contrast, is unlikely to result in sizable net job creation; in
some cases it would, at best, preserve only some of the existing jobs.
The y-axis also distinguishes those sectors in which, with the right incentives, private firms might
be expected to bear most of the burden of new investment required from in which public investment
will likely be required. In some sectors, open competition would be the most efficient way to involve
the private sector, for instance in energy efficiency of buildings, whereas public-private partnerships
would be more suitable in other areas, such as water supply.
Public investment, of course, can widen the scope of environmental action, but where investments
promise private profit improvements can be expected even where public budgets are severely
constrained. Market failures and large social costs characterise the sectors in the bottom quadrants of
the figure. Public investment will be required if improvements are to be achieved. The private sector
can lend support in these sectors but will not compensate for the lack of public investment.
In the case of air and water pollution, private gains for polluters, resulting from lax or absent
regulation, are usually far lower than the true social cost of pollution (diseases, disamenities, loss of
productivity, loss of value added in agriculture, fisheries, tourism, and other sectors). Better control of
water pollution and solid waste is needed to improve and protect public health. Although policies
designed to improve air and water pollution control are unlikely to generate large numbers of jobs,
MED 2012 ≈≈≈ TOWARD GREEN GROWTH IN MEDITERRANEAN COUNTRIES
115
they can nevertheless result in sizable welfare gains with positive effects on labour productivity that
build over time to create spillovers and long-term gains.
Integrated coastal zone management, urban planning, and sustainable management of fisheries
have a limited potential to create jobs but are among the most urgent actions, owing to the high risk of
irreversible environmental damage. Sound urban planning can result in net job creation because it
makes cities more productive and attractive, but the opportunity costs of investing in urban
infrastructure cannot be overlooked—they are at the heart of the trade-offs facing the region.
The report has highlighted the need for green strategies that are coherent at the national level, and
for the engagement of all stakeholders. Close monitoring is key to achieving coherence in public
actions and should be based on indicators that reflect local conditions relative to other countries and
region, and that make it possible to analyse local actions. Methodologies such as the one proposed in
chapter 4 allow for fine-tuning at the national level so as to maximise the potential outcomes. Such
methodologies should be expanded by creating specific indicators derived from the green national
accounting systems described in this report.
Extending monitoring to the subnational level will also be of great importance, as shown in the
“Doing Green” exercise in chapter 4. The subnational approach may also foster the convergence of
national, regional, and local initiatives with social acceptance of the green agenda.
Looming threats to public health and the risk of irreversible damage to the environment are an
immediate priority for public authorities, whose actions will have greater impact if taken in the
context of a larger agenda. Environmental action can be undertaken at the central and local
government levels, as well as by municipalities, communities, and individual producers, consumers,
and investors.
Recommendations to policy makers and other stakeholders23
• Promote energy and water efficiency as top priorities.
• Get prices right for water, energy, and land by making sure they reflect social costs and other externalities of resource use.
• Reduce regressive subsidies to enhance the social acceptance of a green agenda, and combine with complementary measures to cancel the negative impact on the poor.
• Tackle market failures through institutional innovation, regulation, ecolabelling, and
innovation and industrial policy.
• Nudge producers and consumers toward behaviours that reduce air and water pollution and
improve waste management.
23 The CMI, in cooperation with the Office de Coopération Économique pour la Méditerranée et l’Orient
(OCEMO), Plan Bleu, the Forum Euro-Méditerranéan des Instituts de Sciences Economiques (FEMISE), and
other partners, supported a working group of experts from civil society organizations in the North and South that
worked in parallel with the 2012 MED Report to develop recommendations to implement a green economy in
the Mediterranean. Their recommendations (Working Group on Green Economy 2012) converge with those
presented in chapter 6 hereof.
MED 2012 ≈≈≈ TOWARD GREEN GROWTH IN MEDITERRANEAN COUNTRIES
116
• Set medium-term objectives for urban planning, coastal zone management, and fisheries.
• Cooperate at the regional level for exchange of best practices and know-how. This kind of
cooperation should include capacity building for implementing economic environmental accounts, especially at the macro level.
• Exploit innovative financial sources such as carbon facilities for new investment. Also, green economy credit lines could be created, targeting in particular local SMEs.24
• Engage the private sector to assume greater environmental responsibility and leverage private finance.
Call for action
Toward efficient economic policies
The stakes for the region are clear: jobs, welfare, and development. And popular demand for change
has been made increasingly clear over the past year. These social and economic challenges are, at
bottom, political, and they call for political responses.
The situation of the SEMCs pose major challenges of the sustainable development of natural
resources: water, energy, soils, and ecosystems. It is vital that the region summon the will and the
capacity to manage its precious and scarce natural capital in a sustainable way, particularly because
that capital is threatened both by human activity at the local level (in the form of uncontrolled
urbanisation, for example) and by global climate change (the Mediterranean is a global hot spot of
climate change).
It is therefore urgent and imperative that the region should identify and implement economic
policies that encompass both economic development and the sustainable management of natural
assets. In so doing, the region will be able to enjoy simultaneously the benefits of a prosperous
economy and a healthy environment.
The indispensable new policies will have to be implemented on a territorial basis. The World
Bank’s World Development Report 2009: Reshaping Economic Geography demonstrated that
economic development is based on competition among territories at all levels: continental, regional,
national, and subnational (local). One of the engines of that competition is the mobilisation of
citizens, local actors, and the private sector. The case studies presented in this report provide ample
evidence that successes are locally based (box 6.5) and built on social initiatives and innovations that
allow all local actors, including those who had benefited from the waste of natural resources, to obtain
returns and reap gains in the short or medium term.
Box 6.5. Co-benefits from small-scale local initiatives It was the 50 Moroccan inhabitants and farmers of the oasis, gathered together in the Al Madania cooperative, who worked out a way to manage water better and, in so doing, to increase their cultivated area, and thus their agricultural production and their income. It was their success that induced the return of the young people whose labour was essential to the survival of what they had built (see chapter 1).
24 As proposed by the delegation of the Egyptian Ministry of Finance during a consultation on the report.
MED 2012 ≈≈≈ TOWARD GREEN GROWTH IN MEDITERRANEAN COUNTRIES
117
It is through voluntarism and the mobilisation of human capital at the national, local, and regional
levels that green growth and an efficient economy become possible and come to thrive.
Toward national green growth strategies
This report has shown that the paths to green growth are closely dependent on local circumstances.
Platitudes about tailored policies are not enough. Within each country, choices of priorities are there
to be made. The paths to their implementation will depend on cultural and institutional contexts. It is
at this same level—the national level—that the overall coherence of approaches must be assured, if
only because it is at that level that sector-specific actions can be made to reinforce each other. For
example, wise water management depends on wise energy management, just as the preservation of
agricultural land depends on effective management of urbanisation.
It would appear indispensable, therefore, to recommend that national green growth strategies
should be launched in every country. To succeed, such strategies will require strong guidance at the
national level. They will produce results to the extent that they have been worked out in close
consultation with all of the country’s major stakeholders.
A prerequisite of successful strategies is diagnostic work to identify the issues, challenges, and
opportunities on the basis of which priorities have been selected. Governments will then be able to
deploy the full panoply of instruments described in chapter 5—regulatory, economic and financial,
and institutional.
Close monitoring should be provided both to verify implementation and to make it possible to
publicise results and adjust the course of implementation if necessary. Chapter 4 proposes a variety of
indicators, drawing inspiration from those of the Organisation for Economic Co-operation and
Development (OECD 2012). Putting in place a suitable system of national accounts (see chapter 5)
will facilitate transparent monitoring, accompanied by economic and monetary valuation of the results
obtained, both social and environmental.
Implementation depends strongly on key skills and competencies that will have to be developed—
for example, by setting up programs to train practitioners in key occupations (FEMISE 2012). It is
clear that innovation—both technological and social—will be indispensable (box 6.6), and
unnecessary disturbances in the labour market must be avoided. Communications will have to be
finely calibrated to avoid misunderstandings and hasty reactions from those who believe that they
might stand to lose from the changes under way.
The involvement of large firms and the financial sector will encourage and support risk-taking
and innovation by small and medium-sized enterprises.
Box 6.6. Financial resources for innovation
The Egyptian Governorate of Alexandria gave the task of solid waste management and sanitation to an international company that agreed to protect jobs. Through the company’s recovery of methane from waste, the governorate has earned carbon credits. In Morocco, FODEP, a special fund devoted to industrial pollution abatement, is now able to support important innovations such as the use of oil cake to supply electricity to olive oil factories). In Algeria, since 1998, the European Investment Bank has supported pollution abatement in plants in Skikda and Annaba on the northeast coast, helping those plants to achieve sharp increases in productivity.
Source: EIB internal report.
MED 2012 ≈≈≈ TOWARD GREEN GROWTH IN MEDITERRANEAN COUNTRIES
118
Pilot projects, developed and implemented with concerned citizens, as well as model initiatives in
public services, can sow seeds that grow gradually but steadily (box 6.7).
Box 6.7. Pilot projects to prepare new regulations
During a period of urban expansion, the Tunisian government introduced regulatory changes to improve the energy efficiency of new buildings over a long experimental period (1998–2008) that was known as “experimental anticipation.” The project was led by ANME, the national agency for energy management, in cooperation with several ministries and concerned professionals. A total of 46 pilot projects were carried out across the country, involving buildings of all types. The participatory approach encompassed a full range of stakeholders, including architects, developers, and manufacturers of building materials, as well as the general public. Improvements made to building designs and construction practices resulted in a reduction of 33 per cent in energy consumption. Tradesmen and technicians received special training through programs that have now been expanded to include the entire country. Manufacturers invested in new products (such as new forms of insulation) and created new jobs. The pragmatic regulations that governed the program were widely accepted.
Source: AFD 2008.
Successful implementation will have to be measured at the local level. The task will be to pair
increased competitiveness of subnational entities with progress toward an efficient green economy. At
the community level (fishing villages, agricultural villages, oases, and hydrological basins), residents
have a better understanding than anyone else of the problems they face and are in a better position to
devise consensual solutions to those problems. Here, the private sector has a major role (box 6.8).
Box 6.8. Public-private partnership can make the difference
A public-private partnership that helped farmers in the Oued El Guerdane basin of Morocco to improve their management of underground and dammed water involved them in process of setting prices, developing irrigation techniques, and expanding the area under cultivation. The 11,000 jobs created or preserved were essential to the financial viability of the operation. The farmers now pay for the water they use.
But, with the strong trend in the SEMCs toward urbanisation (and even the formation of
megacities), the epicentre of the green economy will be found in the cities. Armed with a vision of
urban development, local authorities can plan and coordinate their efforts, mobilizing knowledge and
investments in urban planning, urban migrations, management of public services, and other areas (box
6.9).
Box 6.9. Territorial cohesion as an engine of green growth policy
The gradual mobilisation of the city of Amman, which now leads a Mediterranean Ecocities network, began with deliberations over the master plan, which extended into the vital management of water, a resource so scarce that it seriously affects the health of a large number of inhabitants.
On Morocco’s coast, the development of the city of Nador and its lagoon, as a city and a tourist destination, required a coordinated approach by a dedicated national agency, the Marchica Agency, which began by investing heavily in waste management, urban sanitation, and reforestation. Today, urbanisation and tourism are creating jobs and raising the quality of life. Investments are expanding.
Regional cooperation to foster green growth Green growth policy objectives can be achieved in a national framework but regional cooperation
could further enhance the scope and cost-effectiveness of national policies. Public and private foreign
investment is required in order to overcome stalemate, ensure social acceptance, and set a momentum
in the implementation of a green growth agenda. Official assistance and funding by nonprofit
MED 2012 ≈≈≈ TOWARD GREEN GROWTH IN MEDITERRANEAN COUNTRIES
119
organisations could play a significant role in some areas, such biodiversity preservation, that are not
attractive for the private sector but are nevertheless of critical importance.
Two other specific areas of regional cooperation appear particularly relevant:
• Design, collection, publication and analysis of indicators of environmental actions at the national and subnational level; and
• Dissemination of best practices, know-how, and appropriate technologies.
The regional level is the right one for making concerted efforts within a framework of integration
favourable to the development of the entire Mediterranean region.
If the green economy can also be an efficient economy, then the major policies of the
Mediterranean region should develop in that direction. Green growth policies should be part of the
G8’s Deauville process, supported by the Union for the Mediterranean, and on the agenda at meetings
between finance ministers.
Pertinent knowledge is available in the region, within the universities and specialised institutions
and organizations—among them the Forum Euro-Méditerranéan des Instituts de Sciences
Economiques (FEMISE), the Economic Research Forum in Cairo, the United Nations Environment
Programme’s Mediterranean Action Plan Regional Activity Centre (UNEP/MAP/REC), and the Arab
Forum for Environment and Development.
Instruments to share knowledge are essential prerequisite to move toward green agendas. During
the consultation process of the 2012 MED Report, and particularly during the final regional
conference in Marseille on 23–24 May, experts and partners, including the civil society working
group formed at the beginning of 2012, proposed the launch of a regional platform for the exchange
of knowledge on green growth. Such a platform should make it possible to:
• Launch a tool to gather data on green growth policy efforts undertaken by countries, in the manner discussed in chapter 4
• Survey and analyse the region’s successes and failures in order to draw lessons from those
experiences and share them
• Mobilise competencies to support national efforts to launch and implement green strategies and to set up green national accounts (linked to the WAVES project)
• Arrange colloquia to develop recommendations for public policies to promote green growth
• Deliver high-level training for top decision makers in Mediterranean countries, a sort of “academy for sustainable development and green growth”
• Develop proposals for an information site on regional green growth challenges in the
Mediterranean (data, statistics).
The importance of exchanging and disseminating knowledge and experience led the OECD, the
World Bank, and UNEP in 2011 to launch the global Green Growth Knowledge Platform.25 Now
would seem to be a good time to develop a Mediterranean component for this existing global
platform.
Existing mechanisms for deliberation such as the Mediterranean Commission for Sustainable
Development and the Mediterranean Strategy for Sustainable Development can be redeployed or
25 http://www.greengrowthknowledge.org/.

MED 2012 ≈≈≈ TOWARD GREEN GROWTH IN MEDITERRANEAN COUNTRIES
120
strengthened to contribute to the green growth process. Financial institutions are accustomed to
coordination—they could collaborate to create green investment funds to support the spread of green
innovation, for example, by financing small and medium-sized enterprises.
Placing green growth on the Mediterranean agenda is urgent; it is feasible; and it is necessary for
the advancement of the people of the region.
References
Abou-Ali, H. 2003. Water and Health in Egypt; an Empirical Analysis. PhD. Dissertation, University of Gothenburg, Department of Economics.
———. 2009. Water sanitation in Egypt. Economic Research Forum (Cairo). Unpublished manuscript.
Abu Qdais, H. A. 2007. “Techno-Economic Assessment of Municipal Solid Waste Management in Jordan.” Waste Management 27 (2007): 1666–72.
AFD (Agence française de développement). 2008. Analyse économique de l’allocation et de la programmation des ressources en eau—Cas du bassin du Tensift. Paris: AFD.
AHT Group AG. 2009a. Identification et Elimination des Goulets d’Etranglement pour l’Utilisation des Eaux Usées dans le Cadre de l’Irrigation ou autres Usages, 129. National Report on Morocco, BEI-FEMIP, April.
———. 2009b. Identification et Elimination des Goulets d’Etranglement pour l’Utilisation des Eaux Usées dans le Cadre de l’Irrigation ou autres Usages, 103. National Report on Tunisia, BEI-FEMIP, May.
———. 2009c. Identification and Removal of Bottlenecks for Extended Use of Wastewater for Irrigation or for Other Purposes, 30. Summary Report, BEI-FEMIP, September.
Albers, R. and Peeters, M., 2011. Food and energy prices, government subsidies and fiscal balances in south Mediterranean countries.” European Economy Economic Papers 437.
Andrews, C. 1994. “Policies to Encourage Clean Technologies.” In Industrial Ecology and Global Change, ed. R. Socolow, C. Andrews, F. Berkhout, and V. Thomas. Cambridge, UK: Cambridge University Press.
Arab Forum for Environment and Development (AFED) (2011). Arab Environment 4. Green Economy; Sustainable Transition in a Changing Arab World. 2011 Report of the Arab Forum for Environment and Development. Beirut.
Arze del Granado, J., D. P. Coady, and R. Gillingham. 2010. “The Unequal Benefits of Fuel Subsidies: A Review of Evidence for Developing Countries.” IMF Working Paper WP/10/202, International Monetary Fund, Washington, DC.
Arnason, R. 2002. A Review of International Experiences with ITQs. CEMARE Report No. 58, University of Portsmouth, Portsmouth.
———. 2007a. “Fisheries Self-Management under ITQ.” Marine Resource Economics 22 (4): 373–90.
———. 2007b. An Excel Program to Estimate Parameters and Calculate Fisheries Rents. Rome: Food and Agriculture Organization.
Asfaw, A. 2007. “Do government food price policies affect the prevalence of obesity? Empirical evidence from Egypt.” World Development 35 (4): 687–701.
Attané, I., Y. Courbage, and M. Batisse. 2001. La démographie en méditerranée. Economica, Les fascicules du Plan Bleu, Paris.
Ayoub, G. M., and L. Malaeb. 2006. “Impact of Intermittent Water Supply on Water Quality in Lebanon.” International Journal of Environment and Pollution 26 (4): 379–97.
Bartelmus, P. (2009). The cost of natural capital consumption: Accounting for a sustainable world economy. Ecological Economics. 68, 1850-1857.
Baroudy, E., A. Lahlou Abid, and B. Attia, eds. 2005. Managing Water Demand. Policies, Practices and Lessons from the Middle East and North Africa Forums,75. UK: IDRC and IWA Publishing.
Bartone, C., and D. Mara. 2010. Improving Wastewater Use in Agriculture: An Emerging Priority, 169. Report, World Bank, Washington, DC, June.
MED 2012 ≈≈≈ TOWARD GREEN GROWTH IN MEDITERRANEAN COUNTRIES
122
Bassett, L. 2008, Can Conditional Cash Transfer Programs Play a Greater Role in Reducing Child Undernutrition? World Bank SP Discussion Paper 0835.
Bauer, C. 2005. “In the Image of the Market: The Chilean Model of Water Resources Management.” International Journal of Water 3 (2): 146–65.
Beauregard, R. A., and A. Marpillero-Colomina. 2011. “More Than a Master Plan: Amman 2025.” Cities 28: 62−69.
Benoît, G., and A. Comeau (dir.). 2005. “Méditerranée, les perspectives du Plan Bleu sur l’environnement et le développement,” 428. Plan Bleu, Éditions de l’Aube.
Bernow, S., W. Dougherty, M. Duckworth, S. Kartha, M. Lazams, and M. Ruth. 1999. America’s Global Warming Solutions. Boston, MA: Tellus Institute and Stockholm Environment Institute.
Biscaglia, A. 2010. “Lessons Learned from Developing CDM Projects in the MENA region.” CDC Side Event—Carbon Expo Cologne, May 27.
Blanc, F. 2008. “Economic Simulation of Energy Development Strategies in the Southern Countries of the Mediterranean: Egypt, Morocco, Tunisia.” In Climate Change and Energy in the Mediterranean,, 550, 263−307. Sophia Antipolis: UNEP Plan Bleu and EIB.
———. 2009. “The Economic Cost of Energy Strategies in Mediterranean Countries.” ICE Review 846: 85−100.
———. 2011. “Employment Perspective in the Mediterranean.” In Tomorrow, the Mediterranean: Scenarios and Projections for 2030 (69–108). Paris: IPEMED.
Blank, H. D., and W. E. Daniel. 2002. “The Eco-Efficiency Anomaly.” Working paper, Innovest Strategic Value Advisors (June), New York.
Boubaker, D. 2010. “Productive Efficiency in Water Usage: An Analysis of Differences among Citrus Producing Farms Sizes in Tunisia.” Third meeting of the African Association of Agricultural Economists, Cape Town, South Africa, September 19–23.
Bouhia, H. 2001. Water in the Macro Economy: Integrating Economics and Engineering into an Analytical Model. UK: Ashgate.
Bourgeon, J. -M., W. Easter, and R. Smith. 2008. “Water Markets and Third Party Effects.” American Journal of Agricultural Economics 90 (4): 902–17.
Boy E., N. Bruce and H. Delgado, 2002. Birth weight and exposure to kitchen wood smoke during pregnancy in rural Guatemala, Environmental Health Perspectives 110, pp.
Breisinger, C., van Rheenen , T. Ringler, C. Nin Pratt, A., Minot, N., Aragon, C., Yu, B., Ecker, O., and Zhu, T., 2010, Food Security and Economic Development in the Middle East and North Africa : Current State and Future Perspectives, IFPRI Discussion Paper 00985.
BRL. 2011. REUT-Perspectives opérationnelles et recommandations pour l’action, 295. Final report and annexes, Agence Française de Développement. February.
Brooks, D. B., L. Thompson, and L. El Fattal. 2007. “Water Demand Management in the Middle East and North Africa: Observations from the IDRC Forums and Lessons for the Future.” Water International 32 (2): 193–204.
Buchanan. J.M. 1965. “A economic théory of clubs”. Economica, 32 (12(), 1-14.
Cakmak, E. 2010. Agricultural Water Pricing: Turkey. Paris: OECD.
Campbell, D. 2001. “Change in the Fleet Capacity and Ownership of Harvesting Rights in the Australian Southern Bluefin Tuna Fishery.” FAO Fisheries Technical Paper 412, Food and Agriculture Organization, Rome.
Campos, P., H. Daly-Hassen, J. Oviedo, P. Ovando, and A. Chebil. 2008. “Accounting for Single and Aggregated Forest Incomes: Application to Public Cork Oak Forests in Jerez (Spain) and Iteimia (Tunisia).” Ecological Economics 65: 76–86.
CBO (Congressional Budget Office). May 2010. “How Policies to Reduce Greenhouse Gas Emissions Could Affect Employment.” Economic and Budget Issue Brief, Washington, DC.
CDG (Caisse de Dépôt et de Gestion). 2009. Rapport Annuel 2009. Rabat.
MED 2012 ≈≈≈ TOWARD GREEN GROWTH IN MEDITERRANEAN COUNTRIES
123
CEDARE (Centre for the Environment and Development in the Arab Region and Europe). 2006. Water Conflicts and Conflict Management in the Middle East and North Africa Region. Cairo, Egypt: CEDARE.
CMI–World Bank. 2011. “Climate Change Adaptation and Natural Disaster Preparedness in the Coastal Cities of North Africa.” Marseilles
Conseil National de l’Environnement (CNE), 2009, Les instruments économiques au service de la protection de l’environnement au Maroc, Royaume du Maroc, Conseil National de l’Environnement (available in bilingual Arabic and French format).
Cointreau, S. 2007. “The Growing Complexities and Challenges of Solid Waste Management in Developing Countries.” Keynote address at the annual meeting of the International Solid Waste Association (ISWA), Amsterdam (September).
COM, 2001 (Ed). Green paper: Promoting a European framework for Corporate Social Responsibility, COM 366 final, 18.7.2001, Brussels: Commission of the European Communities.
Conte, A., A. Labat, J. Varga, and Z. Zarnic. 2010. “What is the Potential of Green Innovation? An Assessment of EU Climate Policy Options.” DG ECFIN, Economic Papers 413, June 2010, Brussels.
Croitoru, L. 2007. “How Much are Mediterranean Forests Worth?” Forest Policy and Economics 9: 536–45.
Croitoru, L., and M. Sarraf. 2010. The Cost of Environmental Degradation: Case Studies from the Middle East and North Africa. Washington, DC: World Bank.
Daly, H., and J. Cobb. 1989. For the Common Good. Beacon Press, Boston.
del Rio Gonzalez, P. 2008. “Policy Implications of Potential Conflicts between Short-Term and Long-Term Efficiency in CO2 Emissions Abatement.” Ecological Economics 65 (2): 292–303.
Derwall, J., N. Gueünster, R. Bauer, and K. Koedijk. 2005. “The Eco-efficiency Premium Puzzle.” Financial Analysts Journal 61: 51–63.
Deveto F., E. Duflo, P. Dupas, W. Pariente and V. Pons, 2011. Happiness on tap: piped water adoption in urban Morocco, NBER Working Paper Series, Working Paper 16933.
Dhehibi, B. and Gil, J.M. 2003, Forecasting food demand in Tunisia under alternative pricing policies. Food Policy, 28, 167–186.
Diao, X., T. Roe, and R. Doukkali. 2005. “Economy-Wide Gains from Decentralized Water Allocation in a Spatially Heterogeneous Agricultural Economy.” Environment and Development Economics 10 (3): 249–69.
Douidich, M., Ezzrari, A. and Lanjouw, P. 2008, Simulating the Impact of Geographic Targeting on Poverty Alleviation in Morocco: What Are the Gains from Disaggregation? World Bank, Policy Research Working Paper 4724.
Driss. 2011. “La problématique santé environnement: un enjeu de développement en Méditerranée (CMI EW1.4).” Marseilles. Center for Mediterranean Integration, Mimeo.
Dyck, J. A., and U. R. Sumaila. 2010. “Economic Impact of Ocean Fish Populations in the Global Fishery.” Journal of Bioeconomics 12 (3): 227–43.
EEA (European Environmental Agency). 2006. Land Accounts for Europe 1990–2000. EEA Report No 11/2006 drafted by R. Haines-Young and J.-L. Weber. http://reports.eea.europa.eu/eea_report_2006_11/en.
———. 2010. Ecosystem Accounting for the Cost of Biodiversity Losses: The Case of Coastal Mediterranean Wetlands. Technical Report No 3/2010 drafted by R. Haines-Young, M. Potschin, P. Kumar, J.-L. Weber , and others. www.eea.europa.eu/publications/ecosystem-accounting-and-the-cost.
EPA (U.S. Environmental Protection Agency). 2008. “Principles of Environmental Impact Assessment Review.” Washington, DC.
EPI (Environmental Performance Index). 2010. Environmental Performance Index 2010. Yale University. http://epi.yale.edu/Files.
Epstein, M. J., Roy, M.-J., 2001. Sustainability in action: Identifying and measuring the key performance drivers. Long Range Planning 34 (5), 585–604.
MED 2012 ≈≈≈ TOWARD GREEN GROWTH IN MEDITERRANEAN COUNTRIES
124
Eurostat. 2009. MEDSTAT II, Rapport final—Statistiques de l’environnement, Cécile Roddier-Quéfélec et. al. EC/EuroMed, Eurostat, September. http://epp.eurostat.ec.europa.eu/portal/page/portal/medstat/documents/RFS_Environnement_FR.pdf.
FAO 2006. Modern Water Rights: Theory and practice, FAO Legislative Studies Series 92, Rome.
———. 2010. The State of World Fisheries and Aquaculture 2010. Rome.
———. “FishStatJ, Software for Fishery Statistical Time Series.” www.fao.org/fishery/statistics/software/fishstatj/en.
FEMISE. 2003. “Femise Report on the Euromediterranean Partnership 2003.” Marseille. September. http://www.femise.org/PDF/Femise_A2003gb.pdf
———. 2007. “The Challenge of Employment in the Mediterranean Countries.” FEMISE Research Report FEM3d-02. November. http://www.femise.org/PDF/ci2006/FEM3d-02FR.pdf
———. 2009. “Mediterranean Partner Countries Facing the Crisis.” Annual FEMISE Report on the Euromediterranean Partnership. http://www.femise.org/PDF/Femise_A2008-9gb.pdf.
———. 2011a. “Towards a New Med Region: Achieving Fundamental Transitions.” Annual FEMISE Report on the Euromediterranean Partnership. October. http://www.femise.org/PDF/Femise_A2011gb.pdf.
———. 2011b. “Towards Green Growth in Mediterranean Countries: Potential Impact on Jobs Creation.” Presentation by F. Blanc at FEMISE 2011 annual conference, Marseille, 15–16 December. http://www.femise.org.
———. Forthcoming 2012. “Skills Development to Promote the Emergence of Knowledge-Based Economies.” Center for Mediterranean Integration, Marseille.
FEMISE-EIB. 2010. “The Crisis and Ways out of It in the Mediterranean Countries.” Marseille. November. http://www.femise.org/en/2011/01/publications/pourquoi-les-pays-mediterraneens-ont-tenu-le-choc-de-la-crise/
Ferraro, P. J. 2008. “Asymmetric Information and Contract Design for Payments for Environmental Services.” Ecological Economics 65: 810–21.
Fink, G., and I. Günther. 2010. Water, Sanitation and Child Health – Evidence from the 172 DHS surveys, Policy Research Working Paper 5275, World Bank, Washington, DC.
Fink, G., I. Günther, and K. Hill. 2010. Water, Sanitation and Child Health – Evidence from the Demographic and Health Surveys 1986 – 2007, Working Paper
Fondel, M., N. Ritter, C. M. Schmidt, and C. Vance. 2009. “Economic Impacts from the Promotion of Renewable Energy Technologies—The German Experience.” Ruhr Economic Papers 156, Essen, Germany.
Freeman, A. M. 1993. The Measurement of Environmental and Resource Values: Theory and Methods. Washington, DC: Resources for the Future.
Galal, Ahmed. 2011. “Egypt Post January 2011: An Economic Perspective.” Policy Perspective 3, Economic Research Forum Newsletter. July.
Garces-Restrepo, C., Vermillion D., and G. Munos. 2007. Irrigation Management Transfer. Worldwide efforts and results, FAO Water Reports Series 32, Rome.
Garcia, S. 2009. Rising to Depletion? Towards a Dialogue on the State of National Marines Fisheries. Washington, DC: World Bank.
Garcia, S. M. 2011. “Long-Term Trends in Small Pelagic and Bottom Fisheries in the Mediterranean: 1950–2008.” Plan Bleu, Sophia-Antipolis, France.
Geller, H., J. DeCicco, and S. Laitner. 1992. Energy Efficiency and Job Creation: The Employment and Income Benefits from Investing in Energy Conservation Technologies. Report Number ED922, American Council for an Energy Efficient Economy, Washington, DC, November.
Geyer-Allély, E. and Eppel, J.. 1997. Consumption and Production Patterns, Making the Change, in OECD Policy Approach for the 21st Century. Paris. OECD.
GIZ. 2011. International Fuel Prices. http://www.gtz.de/en/themen/29957.htm
MED 2012 ≈≈≈ TOWARD GREEN GROWTH IN MEDITERRANEAN COUNTRIES
125
Goodstein, E. B. 1994. “Jobs and the Environment: The Myth of a National Trade-Off.” Economic Policy Institute, Washington, DC (“Jobs or the Environment? No Trade-off,” Challenge (January–February 1995): 41–45.
Grau, T., M. Huo, and K. Neuhoff. 2011. “Survey of Photovoltaic Industry and Policy in Germany and China.” Climate Policy Institute Report, Berlin.
GTZ (Deutsche Gesellschaft für Technische Zusammenarbeit), 2004, Environmental fiscal reform for sustainable reduction and poverty reduction; workshop proceeding and country case studies. Eschborn/Bonn.
GTZ 2010, Environmental fiscal reform: a practice-oriented training for policy makers, administration officials, consultants, and NGO representatives. Eschborn/Bonn.
Guenster, N., J. Derwall, R. Bauer, and K. Koedijk. 2011. “The Economic Value of Corporate Eco Efficiency.” European Financial Management 17 (4): 679–704.
Hallegatte, S., G. Heal, Marianne Fay, and D. Treguer. 2011. “From Growth to Green Growth: A Framework.” Policy Working Paper 5872, World Bank, Washington, DC.
Harding, G. 1968. “The Tragedy of the Commons.” Science 162: 1243–48.
Hays, S. 1987. Beauty, Health and Permanence: Environmental Politics in the United States, 1955–1985. Cambridge, UK: Cambridge University Press.
Houdet, J., M. Trommetter, and J. Weber. 2010. “Promoting Business Reporting Standards for Biodiversity and Ecosystem Services,” 16. The Biodiversity Accountability Framework, Orée. http://www.business-biodiversity.eu/default.asp?Menue=153&News=310
ICCAT (International Commission for the Conservation of Atlantic Tuna). 2008. Report of the 2008 Atlantic Bluefin Tuna Stock Assessment Session. Madrid, Spain: ICCAT.
Idrissi, M., Y. Zahri, R. Houssa, B. Abdelaoui, and N. El Ouamari. 2003. “Pêche artisanale dans la lagune de Nador: exploitation et aspects socio-économiques.” Artisanal Fishery Communities in the Mediterranean, two case studies, FAO COPEMED Project, Madrid, Spain.
IMF (International Monetary Fund). 2011a. “Regional Economic Outlook, Middle East and Central Asia.” World Economic and Financial Surveys, International Monetary Fund, Washington, DC.
———. 2011b. “Mideast Unrest Shows Need to Consider Bigger Picture.” Middle East Briefing, International Monetary Fund, Washington, DC, April 8.
INECE (International Network for Environmental Compliance and Enforcement). 2009. Principles of Environmental Compliance and Enforcement Handbook. Washington, DC: INECE.
Jaccard, M, and N. Rivers. 2007. “Heterogeneous Capital Stocks and the Optimal Timing for CO2 Abatement.” Resource and Energy Economics 29(1): 1–16.
Jaeger, C., L. Paroussos, D. Mangalagiu, R. Kupers, A. Mandel, and J. D. Tàbara. 2011. “A New Growth Path for Europe: Generating Prosperity and Jobs in the Low-Carbon Economy.” Synthesis Report, German Federal Ministry for the Environment, Nature Conservation and Nuclear Safety, February.
Jagannathan, N. V., A. M. Shawky, and A. Kremer, eds. 2009. Water in the Arab World: Management Perspectives and Innovations?, 523. Washington, DC: World Bank.
Jaglin, S., and M-H Zérah. 2010. “Eau des villes: repenser des services en mutation. Introduction.” Revue Tiers Monde 3 (203): 7–22.
Jalan J. and M. Ravallion, 2003. Does piped water reduced diarrhea for children in rural India?, Journal of Econometrics 112, pp. 153-173.
Jalan J. and E. Somanathan, 2008. The importance of being informed: Experimental evidence on demand for environmental quality, Journal of Development Economics 87, pp. 14-28.
Jensen, R.T and Miller, N.J A (2010), “Revealed Preference Approach to Measuring Hunger and Malnutrition”, NBER Working Paper 16555.
Johansson, Robert C. 2000. “Pricing Irrigation Water: A Literature Survey.” Policy Research Working Paper Series 2449, World Bank, Washington, DC.
MED 2012 ≈≈≈ TOWARD GREEN GROWTH IN MEDITERRANEAN COUNTRIES
126
Jones, A., D. Seville, and D. Meadows. 2002. “Resource Sustainability in Commodity Systems: The Sawmill Industry in the Northern Forest.” System Dynamics Review 18 (2): 171–204.
Kautto, P., and M. Melanen. 2004. “How Does Industry Respond to Waste Policy Instrument—Finnish Experiences.” Journal of Cleaner Production 12: 1–11.
Kayaga, S. M., and I. K. Smout. 2007. “Water Demand Management: A Key Building Block for Integrated Resource Planning for the City of the Future.” Paper presented at First SWITCH Scientific Meeting, University of Birmingham, Birmingham, January 9–10.
Kneese, A. V., and B. T. Bower. 1968. “Managing Water Quality : Economics, Technology, Institutions.” Baltimore, MD: John Hopkins University Press for Resources for the Future.
Labatt, S., and R. White. 2002. Environmental Finance: A Guide to Environmental Risk Assessment and Financial Products. Hoboken, NJ: John Wiley and Sons.
Lam, W. Y. V., U. R. Sumaila, J. A. Dyck, D. Pauly, and R. Watson. 2010. “Construction and Potential Applications of a Global Cost of Fishing Database.” Working Paper No. 2010–13, Fisheries Centre, University of British Columbia, Vancouver, Canada.
Larsen, B. 2010. The Cost of Environmental Degradation in the Middle East and North Africa—Selected Issues. Cairo: Economic Research Forum.
———. 2011. “Cost Assessment of Environmental Degradation in the Middle East and North Africa Region: Selected Issues.” ERF Working Papers No. 583, Economic Research Forum, Cairo.
Lecocq, F., J. Hourcade, and M. Ha Duong. 1998. “Decision Making under Uncertainty and Inertia Constraints: Sectoral Implications of the When Flexibility.” Energy Economics 20(5-6): 539–555.
Lee, E. J., and K. J. Schwab. 2005. “Deficiencies in Drinking Water Distribution Systems in Developing Countries.” Journal of Water and Health 3.2: 109–27.
Ley, E., and Boccardo, J., 2010. The Taxation of Motor Fuel International Comparison, World Bank, Policy Research Working Paper 5212.
Maggiera, P., S. Taha, and L. Nolte. 2006. “Water Demand Management in the Middle East and North Africa. Management of Environmental Quality.” An International Journal 17 (3): 289–98.
Markandya, A., S. Arnold, M. Cassinelli, and T. Taylor. 2008. “Protecting Coastal Zones in the Mediterranean: An Economic and Regulatory Analysis.” Journal of Coastal Conservation 12:145–159.
Maton, L. 2008. “Evaluation économique du programme de mesures de gestion quantitative des ressources en eau dans l’Ouest de l’Hérault,” 89. Volume 1: Scénario tendanciel et analyse coût efficacité pour l’usage agricole de l’eau, BRGM. Orléans, France.
Mavsar, R., and V. Farreras. 2010. “Gestion durable du capital naturel de la forêt de Bouhachem: Garantie des bénéfices sociaux, économiques et environnementaux.” CTFC Working Paper. Barcelona.
Meany, T. 2001. “The Introduction of Individual Transferable Quotas into the Australian Sector of the Southern Bluefin Tuna Fishery.” In “Case Studies on the Allocation of Transferable Quota Rights in Fisheries,” ed. R. Shotton, FAO Fisheries Technical Paper 411, Rome.
METAP (Mediterranean Environmental Technical Assistance Program). 2004. “PA&CP 06 National Program for Recovery and Reutilization of Used Packaging Waste—Eco-Lef Tunisia.” Regional Guidelines Case Study, GTZ-ERM-GKW, May 20, World Bank, Washington, DC.
———. 2009. Legal and institutional coastal zone assessment in Lebanon and environmental degradation, remedial and averted costs in northern Lebanon coastal zone, Report for World Bank, Washington, DC.
Meyer, S. S. 1992. Environmentalism and Economic Prosperity: Testing the Environmental Impact Hypothesis. Cambridge, MA: Massachusetts Institute of Technology Project on Environmental Policies and Policy.
Mohamed, M. A. M., M. A. Osman, T. L. Potter, and R. E. Levin. 1998. “Lead and Cadmium in Nile River Water and Finished Drinking Water in Greater Cairo, Egypt.” Environment International 24 (7): 767–72.
Morgenstern, R. D., W. A. Pizer, and J. S. Ahih. 1998. Jobs versus Environment: Is There a Trade-off? Resources for the Future, Washington, DC.

MED 2012 ≈≈≈ TOWARD GREEN GROWTH IN MEDITERRANEAN COUNTRIES
127
Muller, C., Bibi., S. (2010). Refining targeting against poverty: evidence from Tunisia. Oxford Bulletin of Economics and Statistics, 72, 3, 381-410.
Munro, G. R. 2010. “From Drain to Gain in Capture of Fisheries Rents: A Synthesis Study.” Food and Agriculture Organization of the United Nations, Rome.
Naredo, J. M. 2007. “Costes y cuentas del agua.” Proposals from the eco-integrator report, Seminar on water costs and accounts in Catalonia, in cooperation with the Directiva Marco del Agua, Agencia Catalana del Agua, June 18–19. www.fnca.eu/fnca/docu/docu229.pdf.
OECD (Organisation for Economic Co-operation and Development). 1991. The State of the Environment. Paris.
———. 2003a. environmentally harmful subsidies: policy issues and challenges Paris.
———. 2005. Environmentally Harmful Subsidies, Challenges for Reforms. Paris.
———. 2007. Instrument Mixes for Environmental Policies. Paris.
———. 2007. “Business and the Environment: Policy Incentives and Corporate Responses. Paris.
——-—. 2011. Towards Green Growth. Green Growth Synthesis Report. Paris.
PAC-Maroc (Programme d’Aménagement Côtier du Rif central). 2010. “Gestion Intégrée de la Zone Côtière du Rif Central: Rapport de synthèse final.”
Perry, C. J. 1996. “Alternative Approach to Costs Sharing for Water Services to Agriculture in Egypt.” Research Report No. 2, International Irrigation Management Institute, Colombo, Sri Lanka. Productivity Commission. 2006. Rural Water Use and the Environment: The Role of Market Mechanisms. Research Report, Melbourne.
Pitt M., M. Rosenzweig and M.N. Hassan, 2006. Sharing the burden of disease: gender, the household division of labour and health effects of indoor air pollution, CID Working Paper 119, Center for International Development, Harvard University, Cambridge, MA.
Plan Bleu. 2010. Economic Evaluation of Water Demand Management in the Mediterranean. Study Report, Plan Bleu (UNEP/MAP), Sophia Antipolis.
———. 2011a. Energy Efficiency, building and Climate Change in the Mediterranean. Plan Bleu (UNEP/MAP), Sophia Antipolis.
Plan Bleu. 2011b. “Urban Mobility and Sustainable Development in the Mediterranean: Regional Diagnostic Outlook.” Blue Plan Paper 9, Plan Bleu (UNEP/MAP), Sophia Antipolis.
Porter, M. 1991. “Towards a Dynamic Theory of Strategy.” Strategic Management Journal 12 (Winter Special Issue): 95–117.
Porter, M., and C. van der Linde. 1995a. “Green and Competitive.” Harvard Business Review (September–October): 120–34.
———. 1995b. “Toward a New Conception of the Environment: Competitiveness Relationship.” Journal of Economic Perspectives 9 (4): 97–118.
Prüss-Ustün, A., R. Bos, F. Gore, J. Bartram. 2008. “Safer water, better health. Costs, benefits and sustainability of interventions to protect and promote health.” WHO/UNEP. World Health Organization. Geneva.
Prüss-Üstün, A., and C. Corvalán. 2006. Preventing Disease through Healthy Environments, towards an Estimate of the Environmental Burden of Disease. Geneva: WHO.
Rajab, M. 2006. “Enjeux historiques et politiques des mobilisations sociales autour de la question de l’eau à Tripoli.” Séminaire “L’accès aux services urbains en réseau dans les villes libanaises.” Rectorate of Lebanon University, Beirut.
Renner, M. 2000. “Working for the Environment: A Growing Source of Jobs.” Worldwatch Paper 152, Worldwatch Institute, Washington, DC.
Rinaudo, J. D. 2008a. “Evaluation économique du programme de mesures de gestion quantitative des ressources en eau dans l’Ouest de l’Hérault,” 82. Volume 2: Trends and Cost-Benefit Analysis for the Use of Potable Water. BRGM. Orléans..
———. 2008b. “Evaluation économique du programme de mesures de gestion quantitative des ressources en eau dans l’Ouest de l’Hérault,” 33. Volume 3: Combining the Measures. BRGM. Orléans, France.
MED 2012 ≈≈≈ TOWARD GREEN GROWTH IN MEDITERRANEAN COUNTRIES
128
Rose, A., and G. Oladosu. 2002. “Greenhouse Gas Reduction in the U.S.: Identifying Winners and Losers in an Expanded Permit Trading System.” Energy Journal 23(1): 1–18.
Sacchi, J. 2011. “Analysis of Economic Activities in the Mediterranean: Fisheries and Aquaculture Sectors.” Plan Bleu, Sophia-Antipolis.
Salzman, J. 2005. “Creating Markets for Ecosystem Services: Notes from the Field.” New York U Law Rev 80: 870–961.
Salzman, J., B. H. Thompson Jr., and G. C. Daily. 2001. “Protecting Ecosystem Services: Science, Economics, and Law.” Stanford Environmental Law Journal 20: 309–32.
Schneider, I. E., and G. W. Burnett. 2000. Profile: Protected Area Management in Jordan. Environment Management 25 (3): 241–46.
Sea around Us Project, Large Marine Ecosystems (LME). “Global Database: Catches, Values and Subsidiaries.” www.seaaroundus.org/.
Shankar, K., and N. Abu-Ata. 2004. “West Bank and Gaza—Wastewater Treatment and Reuse Policy Note,” 38. World Bank, Washington, DC.
Sherif A., 2007, The Cost of Inaction in the Middle East and North Africa (MNA) Countries, Presented at the Conference on Horizon 2020 and Private Sector Involvement Athens 22–23 October 2007
———. 2010. The Solid Waste Management Situation in the Mashreq and the Maghreb Countries, Challenge and Opportunities. SWEEP-Net Report, Belvedere, Tunisia. July.
Shobha, S. 2006. “Water, Food Security and Agricultural Policy in the Middle East and the North Africa Region.” MENA Working Paper Series 47, World Bank, Washington, DC.
Srinivasan, U. T. 2010. “Food Security Implication of Global Marine Catch Losses due to Overfishing.” Journal of Bioeconomics 12: 183–200.
Steward, C. 2004. “Legislating for Property Rights in Fisheries,” 201. FAO Legislative Study 83, Food and Agriculture Organization, Rome.
Sitarz, D. (ed.). 1994. Agenda 21: The Earth Summit Strategy to Save Our Planet. Boulder, CO: EarthPress.
Sumaila, U. R. 2011. “Fisheries.” In Towards a Green Economy: Pathways to Sustainable Development and Poverty Eradication. Nairobi: United Nations Environment Programme.
Sumaila, U. R., and L. Huang. 2010. “Managing Bluefin Tuna in the Mediterranean Sea.” Working Paper 576, Economic Research Forum, Cairo, Egypt.
SWEEP-net. 2010. “Country Report and Profile.” www.sweep-net.org/content/country-profiles.
Tardieu, H. 2008. “Rareté de l’eau, nouveaux défis pour la gestion opérationnelle des aménagements hydrologiquement et politiquement durables.” La Houille Blanche 6 (December): 85–92.
tenBrink P. 2002. Voluntary Environmental Agreements: Process, Practice, and Future Use. Sheffield, Eng: Greenleaf Publishing.
tenBrink, P., S. Bassi, A. Farmer, A. Hunt, M. Lago, B. Larsen, J. Spurgeon, G. Tucker, M. Van Acoleyn, F. Doumani, and W. Van Breusegem. 2011. Analysis for European Neighbourhood Policy (ENP) and the Russian Federation on the Social and Economic Benefits from Enhanced Environmental Protection. Regional Report: ENPI South. A Synthesis Report on Algeria, Egypt, Israel, Jordan, Lebanon, Morocco, occupied Palestinian Territories, Syria and Tunisia. Brussels.
Thivet, G., and M. Blinda. 2007. “Améliorer l’efficience d’utilisation de l’eau pour faire face aux crises et pénuries d’eau en Méditerranée,” 13. Sophia-Antipolis, Plan Bleu.
Thobani, M. 1997. “Formal Water Markets.” World Bank Research Observer 12(2): 161–179.
Tsur, Y., and A. Dinar. 1995. “Efficiency and Equity Considerations in Pricing and Allocating Irrigation Water.” World Bank Policy Research Paper 1460, Washington, DC.
Tietenberg, T. H. 1985. Emissions Trading: An Exercise in Reforming Pollution Policy. Washington, DC: Resources for the Future.
MED 2012 ≈≈≈ TOWARD GREEN GROWTH IN MEDITERRANEAN COUNTRIES
129
———. 2002. “The Tradable Permits Approach to Protecting the Commons: What Have We Learned?” In E. Ostrom, T. Dietz, N. Dolsak, P. Stern, S. Stonich, and E. Weber (eds.), The Drama of the Commons. Washington, DC: National Academy Press.
Touzi, S., B. Barraqué, and S. Treyer. 2010. “Le service de l’eau potable en Tunisie. Le modèle de régulation tarifaire face aux défis futurs.” Tiers Monde 203: 61–80.
UNEP (United Nations Environment Programme). 2005. Gestion des Zones Cotières en Tunisie. CAR/PAP/PAM (Centre d’Activités Regionales/Programme d’Actions Prioritaires/Plan d\Action pour la Méditerranée), Split, Croatia. http://www.pap-thecoastcentre.org/pap_tunisie.pdf.
———. 2011. Towards a Green Economy: Pathways to Sustainable Development and Poverty Eradication. http://www.unep.org/greeneconomy/.
UN Habitat. 2007. “Guiding Principles on Access to Basic Services for All: Documented Best Practices.” Governing Council of the United Nations Human Settlements Program, Nairobi, April 16–20.
Van der Klaauw B. and L. Wang, 2011. Child mortality in rural India, Journal of Population Economics 24, pp. 601-628.
Veolia. 2006. “Waste Management System in Alexandria, Egypt: An Innovative and Sustainable Public-Private-Partnership to Improve the Living Environment in a Large Developing City.” Submission of an initiative for the UN-Habitat Scroll of Honour, August.
Vogel, D. 1995. Trading Up: Consumer and Environmental Regulation in a Global Economy. Cambridge, MA: Harvard University Press.
Vogt-Schilb, A., and S. Hallegatte. 2011. “When Starting with the Most Expensive Option Makes Sense: Use and Misuse of Marginal Abatement Cost Curves.” Policy Research Working Paper 5803, World Bank, Washington, DC.
Working Group on Green Economy. 2012. Toward a Green Economy in the Mediterranean Region: Environment as an Opportunity for Job Creation and Growth. Report of a conference held in Marseille, 23–24 May. http://green-economy-in-med.com/wp-content/imgocem642/2012/03/recommendations-WG-ANG.pdf.
World Bank. 2004a. Unlocking the Employment Potential in the Middle East and North Africa: Toward a New Social Contract. MENA Development Report, World Bank, Washington, DC.
———. 2004b. Country Environmental Analysis, Tunisia. Washington, DC: World Bank.
———. 2005. Country Environmental Analysis, Egypt. Washington, DC: World Bank.
———. 2007. Making the Most of Scarcity: Accountability for Better Water Management Results in the Middle East and North Africa. MENA Development Report, World Bank, Washington, DC.
———. 2009a. World Bank Development Report: Reshaping Economic Geography. Washington, DC: World Bank.
———. 2009b. From Privilege to Competition: Unlocking Private-Led Growth in the Middle East and North Africa. MENA Development Report, World Bank, Washington, DC.
———. 2009c. “Systems of Cities: Harnessing Urbanization for Growth and Poverty Alleviation.” World Bank Urban and Local Government Strategy, Washington, DC.
———. 2009d. Eco² Cities Synopsis. Washington, DC: World Bank.
———. 2009e. The Sunken Billions: The Economic Justification for Fisheries Reform. Washington, DC: World Bank.
———. 2010a. Country Environmental Analysis, Jordan. Washington, DC: World Bank.
———. 2010b. “Note on Recent Trends of Poverty in the Middle East and North Africa.” http://web.worldbank.org/WBSITE/EXTERNAL/COUNTRIES/MENAEXT/EXTMNAREGTOPPO-VRED/contentMDK:22475121~pagePK:3400417 3~piPK:34003707~theSitePK:497110,00.html.
———. 2011a. “Wealth Accounting and the Valuation of Ecosystem Services (WAVES): A Global Partnership.” Paper prepared by the World Bank, ESA/STAT/AC.238, UNCEEA/6/7, for the Sixth Meeting of the UN Committee of Experts on Environmental-Economic Accounting, New York, June 15–17. http://untats.un.org/unsd/envaccounting/ceea/meetings/UNCEEA-6-7.pdf.

MED 2012 ≈≈≈ TOWARD GREEN GROWTH IN MEDITERRANEAN COUNTRIES
130
———. 2011b. “North African Coastal Cities Address Natural Disaster and Climate Change.” Summary of the regional study, Center for Mediterranean Integration, World Bank, Washington, DC, June 2011.
———. 2011c. “South Africa Economic Update: Focus on Green Growth.” SEAU, World Bank, Washington, DC.
———. 2011d. Country Environmental Analysis, Lebanon. Washington, DC: World Bank.
———. 2012. Inclusive Green Growth: The Pathway to Sustainable Development. Washington, DC: World Bank.
World Bank, FAO, and World Fish Center. 2010. The Hidden Harvests, the Global Contribution of Capture Fisheries. Washington, DC: World Bank.
World Water Assessment Programme. 2009. The United Nations World Water Development Report 3: Water in a Changing World. Paris: UNESCO; London: Earthscan.
Xepapadeas, A., and A. de Zeeuw. 1999. Environmental Policy and Competitiveness: The Porter Hypothesis and the Composition of Capital. Journal of Environmental Economics and Management 37 (2): 165–82.
Yassin, M. M., S. S. A. Amr, and H. M. Al-Najar. 2006. “Assessment of Microbiological Water Quality and its Relation to Human Health in Gaza Governorate, Gaza Strip.” Public Heath 120: 1177–87.
Yilmaz, O. 2011. Analysis of the Potential for Ecotourism in Gölhisar District. Procedia - Social and Behavioral Sciences 19: 240–49.
Zekri, S., and W. Easter. 2005. “Estimating the Potential Gains from Water Markets: A Case Study from Tunisia.” Agricultural Water Management 72: 161–75.
Annexes
≈≈≈
A1. Case study on water access in Egypt using Demographic and Health Surveys (DHS)
A2. Multicriteria methodology
A3. Application of multicriteria analysis to EPI individual indicators
A4. Multicriteria analysis using subnational Turkish data
A5. Main environmental institutions and governance in selected countries
A6. Acronyms and abbreviations used in the report
MED 2012 ≈≈≈ TOWARD GREEN GROWTH IN MEDITERRANEAN COUNTRIES
132
A1. Case study on water access in Egypt using Demographic and Health Surveys (DHS) This case study, undertaken as part of the 2012 MED Report, seeks to evaluate the impact of
insufficient access to water on child health based on a representative cross-sectional DHS of Egyptian
households collected in 2008. The overall household response rate was 99.1 per cent.
We focus on diarrhoea, which is common in all areas of Egypt; the prevalence of irrigation-
related waterborne diseases such as schistosomiasis is more localised. The survey consists of three
separate questionnaires: a household questionnaire, a women’s questionnaire covering all married (or
once-married) women between ages 15 and 49, and a health issues questionnaire.
Using a selective set of indicators to assess the impacts of environmental factors on health is
important. For this reason, inadequate access to safe drinking water is defined using two indicators.
We first turn our attention to water sources. In the questionnaire, improved sources include water
obtained from a piped source within the dwelling, a public tap, a tube hole or borehole, or a protected
well or spring. This makes it possible to ascertain water quality. But to better ascertain actual access
to water, we use another measure to identify problems of quantity when the time required to reach the
water source exceeds 5 minutes. Then the first indicator combines unimproved drinking water sources
and nonneighbourhood access to water (5 per cent of households). As water cut-offs may reveal
difficulties in access, we add a second indicator accounting for cases that report daily (or almost
daily) water cut-offs. This represents 15 per cent of households questioned.
Propensity score matching techniques are used in order to isolate the impact of insufficient access
to water from other factors and to control for potential selection bias. This allows us to understand
what would have happened if access to water was better. Since it is impossible to observe the situation
of individuals both with and without defective access to water, impact evaluation determines a
counterfactual so as to isolate the effects of access to water from other factors. This is implemented
through the use of a control group, which is compared to the treatment group.
An overall and significant difference on the prevalence of diarrhoea between the two groups is
found. The impact on diarrhoea is about 4.5 per cent higher for children facing defective access to
drinking water when access is defined according to the first indicator (type of drinking water source
and time to get to the water source). Including water cut-offs in defective access (second indicator)
provides an overall and significant difference with a mean value of about 2.5 per cent. These results
are robust to five different estimators of matching. These findings suggest that despite an extended
connection rate to piped water, problems of water access and water quality remain important.
Children suffering from severe diarrhoea cannot go to school. Diarrhoea weakens the health of
children, making them more vulnerable to illness. It may impact all members of a household because
ill children need someone at home to look after them, preventing parents or sisters or brothers from
going to school or to work. In this way, it is a general loss for the household in terms of money or
investment in the level of education of their children.
MED 2012 ≈≈≈ TOWARD GREEN GROWTH IN MEDITERRANEAN COUNTRIES
133
A2. Multicriteria methodology This method assigns each country of the sample to a hierarchical class.26 Class n°5, for instance,
includes the best-performing economies with regard to the chosen criteria; class n°4 covers those
economies less powerful than class n°5 but more powerful than class n°3; and so forth.
The assignment of an economy to a class rests on the comparison of the performances of this
economy to previously established hierarchical profiles. The “outranking” principle means that, for a
given set of criteria, country A outranks profile i when it obtains “at least as good” a result as that of
the profile considered in a majority of cases. If country A outranks profile n°1, it is assigned to class
n°5. If not, it is compared with profile n°2 and, in the event of a positive result, assigned to class n°4;
or compared with the next profiles, etc. If the country is outranked by all the profiles, it is assigned to
the last class.
In order to have robust results, the outranking must be without ambiguity. In addition to the
inaccuracy of statistical measurements, it is advisable to know when the value of a statistical indicator
must be judged better than another value. Does an indicator of solid waste collection of 17.5 per cent
really outclass a rate of 17 per cent? To address this issue, we use the notion of pseudo-criteria by the
mean of the definition of thresholds of indifference (Sa) and strict preference (Sp). The indifference
threshold makes it possible to define, for a criterion, a minimal value Sa below which the difference
between an economy and a profile, for this criterion, will be considered as nonrelevant. If the
threshold of indifference Sa is set at 0.5 per cent, the two values 17 per cent and 17.5 per cent are
equivalent. If the threshold is set at 0.2, a value of 17 per cent is regarded as worse than 17.5 per cent,
while a value of 17.3 per cent is regarded as equivalent to 17.5 per cent.
The threshold of strict preference Sb (defined also for each criterion) indicates the value beyond
which there is a clear outranking. Sb is generally higher than Sa. In our example, by setting Sa at 0.2
and Sb at 0.5, we consider that a value of 17.3 per cent is equivalent to 17.5 per cent, but that a value
of 17 per cent (17.5 Sb) is worse than the two others.
Provided with these thresholds, the method calculates for each country a degree of outranking
relative to each profile taking into account all criteria. The degree varies between 0 and 1 and
indicates the relevance of the assertion: “this country outranks this profile.” If, for a given profile, this
degree is higher than a given value (70 per cent in the multicriteria analysis performed in the
document), the country outranks this profile. This degree is used to set the position of the point on the
graph.
The procedure used to establish the profiles and the thresholds is critical in order to obtain results.
In the multicriteria analysis performed in the document, we adopted as a norm the 80th percentile of
the distribution for profile 1, the 60th percentile for profile 2, the 40th percentile for profile 3, and the
26 We build here on the “electre-tri” method. 27 This description implies that equal weight is given to each indicator. An alternative approach is possible with unequal weights that could be justified by data availability constraints if the objectives of the multicriteria analysis are to obtain an overall result with an equal weight for different domains of environmental performance.
MED 2012 ≈≈≈ TOWARD GREEN GROWTH IN MEDITERRANEAN COUNTRIES
134
20th percentile for profile 4. The percentiles of the distribution are also used for the calculation of the
thresholds.
MED 2012 ≈≈≈ TOWARD GREEN GROWTH IN MEDITERRANEAN COUNTRIES
135
A3. Application of multicriteria analysis to EPI indicators The weighting of indicators adopted by the researchers who devised the EPI (Environmental
Performance Index) does not seem suitable for the multicriteria analysis. In the EPI database, the 11
indicators we identify as related to environmental state have a dominant weight of 64.6 per cent in
total, of which 25 per cent is for the “environmental burden of disease” alone. Furthermore, we can
note that, among action-related indicators, those measuring public policy influencing the quality of air
is dominant (29 per cent, out of a mere 35.4 per cent for all action-related indicators).
In order to address these imbalances, an alternative weighting is adopted that gives the same
weight for each group (i.e., state and action) and a similar weight for each subgroup (air-related
indicators on the one hand, fresh- and marine-water-related indicators on the other). Among indicators
of environmental state, we give a 25 per cent weight for air-related indicators, and 25 per cent for
water. Similarly, each of the four subdomains of environmental action is given the same weight of
12.5 per cent each of the 4 subdomains identified above (in 2.2, regulation, infrastructures, behaviour,
and natural resources). An equal weight is given within to each of the 6, 3, 2, and 3 indicators
included in these subdomains, respectively.
Among the 166 countries of the sample, only 2 are in class 5 (best performance) and 32 in class 1
(worst performance). The same countries are at the top and bottom of the Mediterranean sample:
Spain is at the end of class 4 and Cyprus at the end of class 2. The averages for southern and northern
countries are in the same range, in the lower half of class 3. Overall, Mediterranean countries are also
in midrange for the different indicators and have, therefore, few areas of remarkable strength or
weakness.
In the EPI database, some values are for a number of countries and indicators. For southern and
eastern Mediterranean countries, data are entirely missing for “critical habitat protection” and
“agricultural subsidies.” For the purpose of multicriteria analysis, the average for the southern or
northern Mediterranean region was used as a proxy.
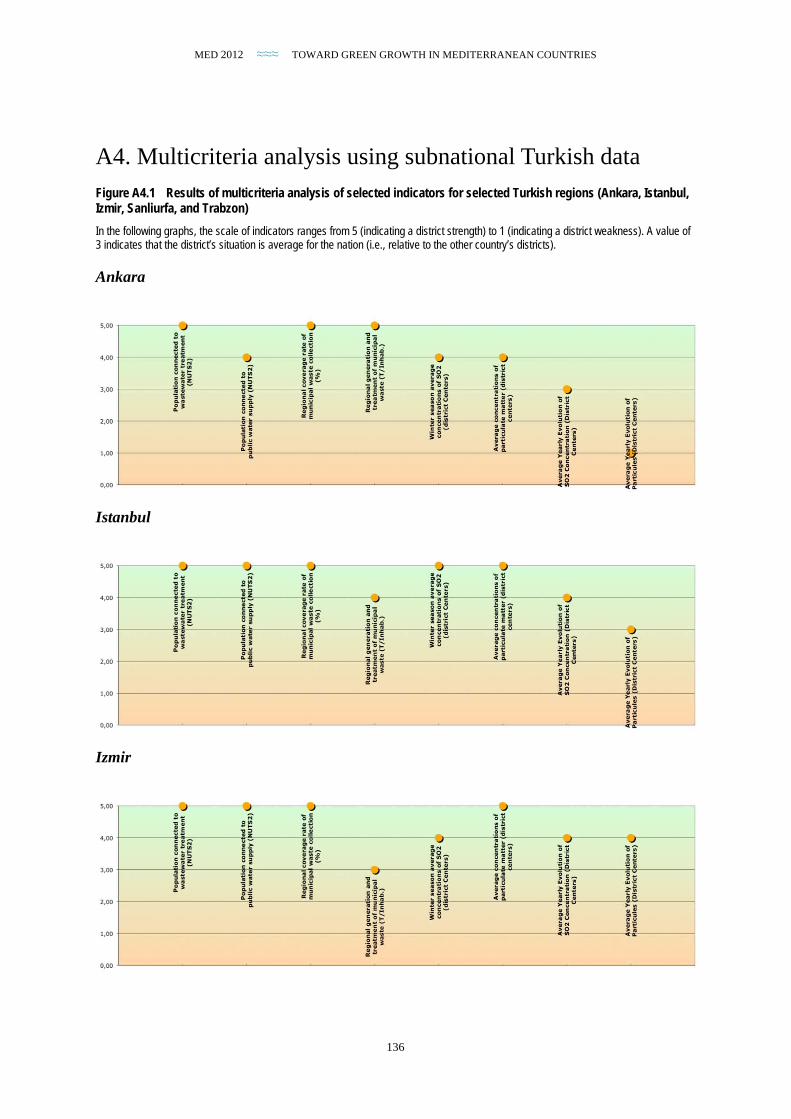
MED 2012 ≈≈≈ TOWARD GREEN GROWTH IN MEDITERRANEAN COUNTRIES
136
A4. Multicriteria analysis using subnational Turkish data
Figure A4.1 Results of multicriteria analysis of selected indicators for selected Turkish regions (Ankara, Istanbul, Izmir, Sanliurfa, and Trabzon)
In the following graphs, the scale of indicators ranges from 5 (indicating a district strength) to 1 (indicating a district weakness). A value of 3 indicates that the district’s situation is average for the nation (i.e., relative to the other country’s districts).
Ankara
Istanbul
Izmir
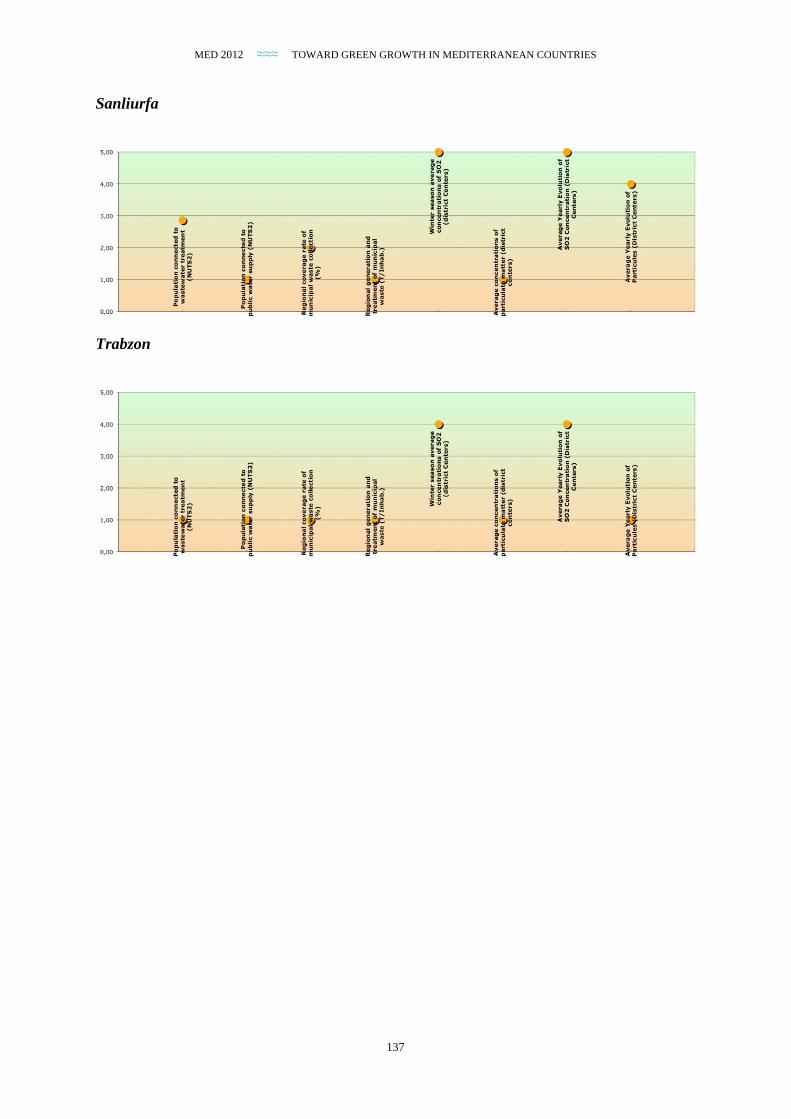
MED 2012 ≈≈≈ TOWARD GREEN GROWTH IN MEDITERRANEAN COUNTRIES
137
Sanliurfa
Trabzon
MED 2012 ≈≈≈ TOWARD GREEN GROWTH IN MEDITERRANEAN COUNTRIES
138
A5. Main environmental institutions and governance in selected countries
The main institutions involved with environmental issues in Algeria
Institutions reporting to the Ministry of Regional Development and Environment The Ministère de l’Aménagement du Territoire et de l’Environnement (MATE, Ministry of Regional
Development and Environment) has two general directorates, one of which is the Direction Générale
de l’Environnement et du Développement Durable (General Directorate for the Environment and
Sustainable Development). Its missions are carried out by five offices:
• Direction de la Politique Environnementale Urbaine (Directorate of Urban Environmental
Policy), with three subdirectorates
• Direction de la Politique Environnementale Industrielle (Directorate of Industrial
Environmental Policy), with four subdirectorates
• Direction de la Conservation de la Diversité Biologique, du Milieu Naturel, des Aires
Protégées, du Littoral, du Changement Climatique (Directorate for Conservation of Biological
Diversity, the Natural Environment, Protected Areas, Coastlines, and Climate Change), with
four subdirectorates
• Direction de l’Evaluation des Etudes Environnementales (Directorate of Environmental
Research and Assessments), with two subdirectorates
• Direction de la Sensibilisation, de l’Education Environnementale et du Partenariat
(Directorate of Environmental Education, Awareness, and Partnerships), with two subdirectorates.
The ministry includes agencies, offices, and centres at the central level:
• Agence Nationale des Déchets (National Waste Products Agency). This agency is responsible
for promoting the sorting, collection, transportation, processing, and commercialization of waste products.
• Observatoire National de l’Environnement et du Développement Durable (ONEDD, National
Observatory for the Environment and Sustainable Development). ONEDD is responsible for
establishing and managing networks to observe and measure pollution and to monitor various environments.
• Centre National de Développement des Ressources Biologiques (CNDRB, National Centre
for Biological Resource Development) is responsible for inventorying the nation’s stocks of
wildlife, plant life, habitats, and ecosystems, and for the exploitation and preservation of these
natural assets.
• Centre National des Technologies de Production plus Propre (CNTPP, National Centre for
Cleaner Production Technologies) pursues the following objectives: (i) promoting the transfer
of know-how and the exchange of technical information on and experience with clean
production; (ii) encouraging industry to respect the environment by favouring manufacturing
MED 2012 ≈≈≈ TOWARD GREEN GROWTH IN MEDITERRANEAN COUNTRIES
139
processes that generate less pollution and consume fewer natural resources; (iii) improving
the productivity and competitiveness of Algerian enterprises within the context of compliance with environmental requirements.
• Centre de Développement des Énergies Renouvelables (CDER, Centre for Development of
Renewable Energy) is responsible for managing and monitoring the implementation of
projects falling under national research programs in renewable energy, nuclear technology, and hydrocarbons.
• Conservatoire National des Formations à l’Environnement (CNEFE, National Conservatory
for Environmental Training) is responsible for providing training in fields related to the environment.
At the wilaya level, MATE has 48 environmental directorates, each responsible for carrying out
environmental policy and ensuring compliance with environmental regulations.
At the commune level, there are offices responsible for public health, management of household
wastes, and drinking water.
Other institutions involved in environmental matters The Ministère des Ressources en Eau (MRE, Ministry of Water Resources) deals with problems
related to the quality of water destined for human consumption and of wastewater. The ministry
includes the Direction de l’Assainissement et de la Protection de l’Environnement (Directorate of
Sanitation and Environmental Protection), which oversees the following agencies and offices:
• 5 basin-level hydrography agencies:: Oranie–Chott Chergui (OCC), Algerois-Hodna-
Soummam (AHS), Constantinois-Seybousse-Mellegue (CSM), Sahara, Cheliff–Zahrez (CZ).
• Office National de l’Assainissement (National Sanitation Office), responsible for wastewater
management.
• Agence Nationale des Ressources Hydrauliques (ANRH, National Agency for Hydraulic Resources), responsible for quantitative and qualitative assessments of water resources.
• Agence Nationale de Réalisation et de Gestion des Infrastructures Hydrauliques pour
l’Irrigation et le Drainage (AGID, National Agency for the Implementation and Management
of Hydraulic Infrastructure for Irrigation and Drainage).
The main institutions involved with environmental issues in Egypt
Background In 1992, the first Environmental Action Plan (NEAP) was a crucial step toward environmental
management. The plan led in 1994 to an environmental protection law and to the restructuring of the
Egyptian Environmental Affairs Agency (EEAA). The national government and the United Nations
Development Programme established the Technical Cooperation Office for the Environment (TCOE)
within the EEAA in 1992 to plan, along with donors, actions and projects identified in the NEAP.
In June 1997, the first full-time Ministry of State for Environmental Affairs (MSEA) was
established by presidential decree, with the EEAA being its executive arm.
In 1999, with the support of UNDP, the MSEA revised the NEAP of 1992 to “represent Egypt’s
agenda for environmental actions over 15 years.”
MED 2012 ≈≈≈ TOWARD GREEN GROWTH IN MEDITERRANEAN COUNTRIES
140
Institutions at the central level The MSEA, acting through EEAA, has the missions of preparing the national plans for environmental
protection, preparing the emergency environmental plan to cope with disasters, preparing draft
legislation concerning the environment, implementing experimental projects, preparing environmental
training and planning policy, drafting the necessary norms and standards to ensure that the
environment is not polluted, formulating the basis and procedures for assessing the environmental
impact of projects, and supervising the Environmental Protection and Development Fund.
The EEAA includes:
• Central Department of Engineering Affairs
• General Directorate of Environmental NGO Affairs
• General Directorate of Planning and Monitoring
• General Directorate for the Board of Directors’ Secretariat
• General Directorate of Legal Affairs
• General Directorate of Financial and Administrative Inspection
• General Directorate of Citizen Services
• General Directorate for the Elsalam Garden
• Department of Security
• Department of Public Relations
The EEAA also supervises:
• Central Department of Publications, Culture, and Environmental Awareness
• Sector of Financial and Administrative Affairs
• Sector of Nature Protection
• Sector of Branch Affairs
• Sector of Environmental Quality
• Sector of Environmental Management
The environmental policies formulated by the MSEA are carried out fin accordance with four
main principles: (i) strengthening the integrative capacity of central and local government, (ii)
strengthening public-private partnerships, (iii) strengthening partnerships with environmental
nongovernmental organizations, and (iv) integrating gender issues in environmental policies and
programs.
Environmental management issues can also be found in other ministries or institutions, but they
often have limited experience. Coordination with the EEAA is not apparent.
Institutions at the decentralised level The EEAA develops the “capacities and partnerships necessary to strengthen its presence in the
governorates.” There is a network of regional branch offices (RBOs) as well as environmental
management units (EMUs); each of the 26 governorates has an EMU. An EEAA decree in 2001
defined the policies and operational procedures of RBOs. Coordination between the EEAA, its RBOs,
and the EMUs is explained in detail in a study by the Organizational Support Programme with support
from the Danish Government.
MED 2012 ≈≈≈ TOWARD GREEN GROWTH IN MEDITERRANEAN COUNTRIES
141
Meanwhile, most relevant ministries and national institutions have a department or unit mandated
with environmental management issues.
In the last decade, the EEAA has been providing support for development of environmental action
plans in the governorates of Sohag and Dahkaliya with support from the Environmental Assessment
and Management initiative of the United Kingdom Department for International Development
(DFID). Environmental improvements to benefit the poor in Sohag and Dakahliya have been achieved
through community projects focusing on solid waste management. The programs in Sohag and
Dahkaliya received the European Environment Award for the year 2000.
Based on the success of those activities, the government intends to pursue similar plans in the
governorates of Qena, Beni Sueif, and Aswan, and in the Delta governorate of Damietta. In Qena and
Damietta, baseline studies for background information have already started with support from DFID.
In Beni Sueif and Aswan, support for the EMUs is expected from the Danish Government.
Policy and planning
Waste management Solid waste management
• National strategy for integrated waste management (2000).
• Mediterranean Environmental Technical Assistance Program report (2004).
• Strategic framework for recycling (2006).
Hazardous waste management
• National strategy for managing hazardous waste from health facilities.
• An integrated strategy for managing hazardous substances and waste is in preparation.
Private sector participation
• A strategy on private sector participation (PSP) is being prepared.
For the time being, nine private companies (including three international companies) are involved
in waste collection in major governorates. Also, the informal sector and small private businesses
conduct door-to-door collection in other places. Meanwhile, contracts for integrated solid waste
management with international companies include sorting, recycling and composting of organic
waste. Also, two projects receive carbon credits: a composting and sorting facility for the area south
of Cairo and a project for flaring gas from landfills in Borg El Arab and El-Hammam.
Air quality The EEAA’s Environmental Information and Monitoring Programme (EIMP) has been monitoring air
pollution and collecting relevant data since 1998. Under the supervision of the EEAA, the Centre for
Environmental Hazard Mitigation (CEHM) at Cairo University and the Institute of Graduate Studies
and Research (IGSR) at Alexandria University both operate the air quality–monitoring network.
Coastal water The EIMP also has a coastal water monitoring component focusing on pollution of the coastal waters
of Egypt, the coast of the Mediterranean Sea, and the Red Sea region. It was implemented by the
IGSR at Alexandria University and by the National Institute of Oceanography and Fisheries. The
MED 2012 ≈≈≈ TOWARD GREEN GROWTH IN MEDITERRANEAN COUNTRIES
142
programme monitors pollutants in coastal areas to respond to changes in water quality due to human
uses.
The main institutions involved with environmental issues in Jordan
Background information In 1991, Jordan introduced a National Environmental Strategy (NES) with the help of the
International Union for the Conservation of Nature (IUCN) and the U.S. Agency for International
Development (USAID). Meanwhile, Jordan developed an economic and social development plan for
the 1993–97 period that would prioritise environmental issues and identify major environmental
challenges.
Until 1995, if the government needed to take environmental action it had to rely on a multitude of
overlapping laws and gaps with regard to environmental issues. The 1995 environmental protection
law consolidated national environmental protection authority under the newly created General
Cooperation for Environmental Protection (GCEP). In 1996 the National Agenda 21 project was
initiated to provide a national environmental strategy and action plan for the twenty-first century.
In 2003, a new environmental protection law was passed and the CGEP was transformed into the
Ministry of Environment (MoE).
The national energy strategy was modernised in 2006 with the goal of diversifying local energy
resources, increasing the share of the domestic energy resources, reducing dependency on oil imports,
and increasing environmental protection.
In 2009 the Second National Communication Report focused on specific sectors (including
agriculture, energy, and waste) where environmental measures are considered important.
Institutions at the central level
Ministry of Environment (MoE)
Under the environment law, the MoE is the competent authority to protect the environment in the
Kingdom; it is responsible for carrying out the law and related rules and regulations. It is also
responsible at the national, regional, and international levels for cooperation and coordination with
donors and other outside agencies on environmental issues.
The Environmental Protection Law of 2003 gave the MoE authority to deal with issues related to
environmental protection; authorized NGOs to work in environmental protection; created a strategy
for environmental awareness, education, and connection; established a ban on dangerous substances;
improved contact with other countries and with international environmental organizations; set up an
advisory board; and set fines for various infractions causing harm to the environment (Saed 2006).
The MoE includes among others, governorate-level environmental directorates, a Directorate for
Inspection and Pollution Control, a Directorate for Environmental Impact Assessment, a Directorate
for Waste Management and Chemicals, a Directorate for Nature Protection, a Directorate for
Awareness and Environmental Media, and a Directorate for Planning and International Cooperation.
MED 2012 ≈≈≈ TOWARD GREEN GROWTH IN MEDITERRANEAN COUNTRIES
143
Policy and Planning
Water
Many governmental and nongovernmental agencies monitor water quality in Jordan, but the level of
coordination is very poor. Assessment, policy and planning functions are not clearly separated from
services. Regulatory entities include many water users, thus generating a conflict of interest.
The Ministry of Water and Irrigation has been trying to tackle the situation, in partnership with
outside entities, through projects such as the Red Sea–Dead Sea Conduit Initiative, but lack of
financial resources is still a great constraint.
The Water and Environment Research and Study Centre (WERSC) is the research centre for the
Ministry of Water and Irrigation and other public and private agencies.
Air
In Jordan, there is a deficit of coordination among the various institutions involved in air quality
monitoring and assessment.
The main institutions involved with environmental issues in Lebanon
General comments The Ministry of Environment (MoE) was created in 1993 to study, propose, and implement national
environmental policies. It is in charge of protecting Lebanon’s environment. The first environmental
protection law was adopted in 1988. In 2002 a National Code of the Environment was introduced to
define the basis and norms for environment protection. Legislation to restructure the MoE was passed
in 2005.
There is a clear lack of human and financial resources and a need for a national environmental
plan. Meanwhile, the implementation of Lebanon’s 2002 environment law has been stalled, despite
pressing needs for its implementation, because the government is incapable of issuing executive
decrees. A decree on strategic environmental assessment has been approved by the Council of State
but is awaiting approval by the Council of Ministers.
An overall environmental strategy was approved in August 2005 in connection with the
restructuring of the MoE. But the draft National Environmental Action Plan (NEAP) of 2005 has yet
to be approved. An environmental analysis now under way with World Bank support could provide
more insight.
Authorities The MoE is the official authority for environmental protection and policy. Its role is to set general
policies, projects, and plans on issues related to environmental safety and sustainability of natural
resources. It can also propose means for implementation and monitoring.
Other ministries play a role as well.
• Industrial permits are issued by Mohafaza under the authority of the Ministry of Interior.
• The Council for Development and Reconstruction manages major infrastructure projects.
MED 2012 ≈≈≈ TOWARD GREEN GROWTH IN MEDITERRANEAN COUNTRIES
144
• MoE regional offices in Lebanon’s municipalities are responsible for certain infrastructure
and for providing basic services, such as wastewater treatment and solid waste management.
Other ministries such as those of Public Health, of Energy and Water, of Public Works and Transport,
and of Agriculture, as well as the Higher Council for Urban Planning and the National Council for
Scientific Research, are also involved to some degree in environmental matters.
Since 2002, the MoE has supervised the National Council for Quarries, which approves and sets
standards for quarry operations.
Finally, some sector-specific plans have been prepared (management of solid waste, wastewater,
and quarries), and various ministries, together with the Council for Development and Reconstruction,
are trying to implement projects to address the needs identified in those plans.
Policy and planning
Air and water quality
Air quality is not systematically monitored. Very little wastewater treatment capacity is in operation,
despite initiatives to improve the situation.
Waste management
No effective solutions are in place for industrial, hospital, or slaughterhouse waste. Municipalities are
responsible for waste management, but lack of funds and know-how, as well as an inefficient tax
system, have worsened environmental problems. Only a handful of municipalities have sorting
facilities, and not all of them are operative. Meanwhile, the Emergency Initiative for Rehabilitation
Employment Services and Development, supported by Italy’s aid agency, invested in the development
of a sound solid waste management strategy in Lebanon and began pilot initiatives in collaboration
with two Italian NGOs (COSV-CISP and UCODEP). The agency funded a project in four locations
(Kherbet Selim, Bent Jbail, Kfar Sir, Aytaroun) to address the core problems of waste management
for domestic communities.
Also, the Environment and Energy Programme of the UNDP office in Lebanon reinforces
institutional capacity and offers policy support to the authorities, especially for environmental
sustainability.
Support is also provided by the UN Early Recovery Programme to respond to environmental
harm done by the 2006 war.
The UNDP Energy and Environment Programme implements several national projects (i) to
reduce ozone depleting substances and implement energy audits; (ii) to fight desertification and
floods; and (iii) to encourage energy efficiency.
The main institutions involved with environmental issues in Morocco
The word environment appeared in Moroccan government as early as 1972 with the creation of the
Ministère de l’Urbanisme, de l’Habitat et de la Protection de l’Environnement (Ministry of Urbanism,
Housing, and Environmental Protection). But a separate Ministry of the Environment was not created
until 1995. Two years later, that ministry was abolished, and the environmental portfolio was included
in a new Ministère de l’Agriculture, de l’Equipement et de l’Environnement (Ministry of Agriculture,
Infrastructure, and Environment), with its own secretary of state. In 1998, a new secretariat of state
MED 2012 ≈≈≈ TOWARD GREEN GROWTH IN MEDITERRANEAN COUNTRIES
145
for water and the environment (SEEE) became part of the Ministère de l’Aménagement du Territoire,
de l’Environnement, de l’Urbanisme et de l’Habitat (Ministry of Regional Development,
Environment, Urbanism, and Housing). In 2007, SEEE was transferred to the Ministère de l’Energie,
des Mines et de l’Eau (Ministry of Energy, Mines, and Water).
To carry out its missions the SEEE has:
• Four central directorates:
o Direction Générale de l’Hydraulique (General Directorate of Hydraulics)
o Direction des Aménagements Hydrauliques (Directorate of Hydraulic Development)
o Direction de la Recherche et de la Planification de l’Eau (Directorate of Water Research and Planning)
o Direction des Affaires Générales et Techniques (Directorate of General and Technical Affairs)
• One directorate operating as an autonomous service (SEGMA). The Direction de la
Météorologie Nationale (National Meteorological Directorate) has four regional directorates
for meteorology in the northern, central, southern, and eastern zones of the country.
• One public body operating as an industrial or commercial entity: the Office National de l’Eau
Potable (National Office for Potable Water).
• The Conseil Supérieur de l’Eau et du Climat (High Council on Water and Climate) is
responsible under the water law of 1995 for the general direction of national water and
climate policy and for reviewing the national strategy on climate change and its impact on
water resources, the national water plan, and plans for integrated water resource management.
The council accords special importance to the allocation of water among water-using sectors,
to water transfers, and to provisions for the commercial use and protection of water resources.
Although the council’s missions are set forth in detail, the legislature left open to the
government the possibility of submitting to the council other questions related to national water policy.
• The Conseil National de l’Environnement (CNE, National Environmental Council),
established in 1980, is a coordinating body for entities concerned with the environment
(ministries, local governments, industry, NGOs, and academics). Its chief mission is to work
to protect the environment by preserving the ecological balance of natural settings, improving
the living conditions of the people, and integrating environmental concerns into the process of economic and social development so as to ensure that development is sustainable.
Oddly, SEEE has no directorate for the environment.
At the regional level, one finds:
• Financially autonomous public regional institutions structured as corporations serving the
country’s hydrological basins: Sebou, Oum Er Rbia, Tensift, Loukkos, Souss-Massa-Draa, Moulouya, Bouregreg et de la Chaouia, Guir-Ziz-Ghris, Sakia El Hamra–Oued Eddahab;
• 16 regional observatories that monitor the environment and sites for the disposal, processing,
and recycling of solid and liquid wastes, including wastewater, that handle up to 260 million
cubic metres per year. The network of observatories was created in 2010 as part of the implementation of Morocco’s environmental charter.
MED 2012 ≈≈≈ TOWARD GREEN GROWTH IN MEDITERRANEAN COUNTRIES
146
• Regional environmental councils, complemented by wilaya-level and provincial councils that
serve as local coordinating units.
The main institutions involved with environmental issues in Tunisia
Background Establishment of the institutional framework for environmental protection in Tunisia commenced
with the creation in 1991 of the Ministère de l’Environnement et de l’Aménagement du Territoire
(Ministry of the Environment and Regional Development). Chief among its functions was monitoring
and coordinating government actions and programmes related to the environment. At the time, the
Ministère de l’Agriculture et des Ressources Hydrauliques (MARH, Ministry of Agriculture and
Water Resources) was responsible for managing natural resources.
In 2005, the environment was separated from regional development, and the Ministère de
l’Environnement et du Développement Durable (MEDD, Ministry of Environment and Sustainable
Development) was formed.
The government that was formed on 17 January 2011 created a Ministry of Agriculture and the
Environment.
Institutions at the central level
The former MEDD (2005–11) comprised:
• A general directorate for environment and quality of life.
• A general directorate for sustainable development.
• A directorate for international cooperation and partnerships.
The MEDD oversaw:
• The Agence Nationale de Protection de l’Environnement (ANPE, National Environmental
Protection Agency), created in 1988 and still operating. In addition to its headquarters units,
the ANPE maintains eight regional offices, one in each of the country’s major regions. The ANPE’s two principal missions are as follows:
o To contribute to the development of the government’s overall policy to control
pollution and protect the environment, and to implement that policy through specific
sectoral measures and general measures called for by and consistent with the national development plan.
o To propose to the competent authorities measures of a general or specific nature
designed to ensure the application of the government’s policy on control of pollution
and protection of the environment, especially measures to preserve the environment
and to strengthen mechanisms conducive to such preservation, and, generally, to
propose measures to prevent natural and industrial risks and catastrophes.
• The missions of the Observatoire Tunisien de l’Environnement et du Développement Durable
(OTED, Tunisian Observatory on the Environment and Sustainable Development) are as follows:
o To develop and implement information systems related to the environment and sustainable development.
MED 2012 ≈≈≈ TOWARD GREEN GROWTH IN MEDITERRANEAN COUNTRIES
147
o To produce statistics and indicators on the environment and development, notably indicators of sustainable development.
o To contribute to studies of various environmental problems.
o By providing information, to contribute to the incorporation of the concept of sustainable development into decision-making processes.
o To regularly publish reports and documents on the state of the environment.
• The Centre International des Technologies de l’Environnement de Tunis (CITET, Tunis
International Centre for Environmental Technologies), which, since its founding in June
1996, has been dedicated to the expansion of national competencies in the use of
environmental technologies for sustainable development in Tunisia and the Arabian and
Mediterranean region. CITET plays a fundamental role in upgrading environmental capacity
in firms through a panoply of technical assistance services that enable firms to meet national and international standards and thereby increase their competitiveness.
• The Agence de Protection et d’Aménagement du Littoral (APAL, Agency for Coastal
Protection and Development).
Le Ministère de l’Agriculture et des Ressources Hydrauliques The former MARH administered the following institutions responsible for water and related
environmental problems:
• Bureau de l’Inventaire et des Recherches Hydrauliques (BIRH, Bureau of Water Monitoring and Research).
• Bureau de Planification et des Equilibres Hydrauliques (BPEH, Bureau of Hydraulic Planning
and Equilibrium).
• Direction Générale des Ressources en Eau (DGRE, General Directorate for Water
Resources).
• Direction Générale du Génie Rural et de l’Exploitation des Eaux (DGGREE, General Directorate of Rural Engineering and Water Use).
• Direction Générale des Barrages et des Grands Travaux Hydrauliques (DGBGTH, General Directorate of Dams and Large Hydraulic Facilities).
• Institut National des Recherches en Génie Rural, Eau et Forêts (INRGREF, National Institute
for Research in Rural Engineering, Water, and Forests).
• Régie des Sondages Hydrauliques (RSH, Water Survey Office).
• Société d’Exploitation du Canal et des Adductions des Eaux du Nord (SECADENORD,
Northern Canal and Water Conveyance Company).
• Société Nationale d’Exploitation et de Distribution des Eaux (SONEDE, National Water Use and Distribution Company).
• Office National de l’Assainissement (ONAS, National Sanitation Office).
SONEDE is a public operating company with the mission of producing and distributing drinking
water throughout Tunisia. It is responsible for the operation and maintenance of facilities for
capturing, treating, and distributing water.
MED 2012 ≈≈≈ TOWARD GREEN GROWTH IN MEDITERRANEAN COUNTRIES
148
ONAS is the lead organization in the area of protecting water resources and fighting all sources of
pollution. It is a financially autonomous public institution with a corporate structure, operating under
the Ministry of Agriculture and the Environment.
Institutions at the decentralised level The MARH maintained 24 regional agricultural development commissions responsible for local
monitoring of the implementation of government policy related to agricultural and water resources.
The MEDD operated regional offices that were to be transferred to the new Ministry of
Agriculture and the Environment.
Planning and investment related to the distribution of drinking water in rural areas are carried out
by the DGGREE within the MARH and by water-user associations. Rural sanitation is still at the
stage of pilot projects.
The main institutions involved with environmental issues in Turkey
Background Turkey’s first environmental law was passed in 1983. The Ministry of Environment was inaugurated
eight years later, in 1991. The national Seventh Development Plan (1996–2000) called for
development of a national environmental strategy, in response to which the National Environmental
Action Plan (NEAP) was drafted.
A climate change adaptation strategy was to be submitted to the Ministry of Environment and
Forestry in late 2010. A project entitled “Developing Turkey’s National Climate Change Action Plan”
was established to draft the plan. Turkey’s First National Climate Change Action Plan was released
by the Ministry of Environment and Forestry in 2011.
Environmental affairs are administered at the central and local levels.
Institutions at the central level
Ministries
Central administration is split among provinces, districts, and other regions. Apart from the Prime
Ministry, which is devoted to harmonization and coordination, the most important institutions dealing
with environmental issues at the central level are:
• The State Planning Organization (DPTSPO), which prepares five-year development plans,
yearly investment plans, and so on.
• The Ministry of Environment and Forestry (ÇOBMoEF), which provides general coordination for the development and application of the environment policies.
• The Undersecretariat of Maritime Affairs, which is responsible for managing and developing
maritime systems and services.
• The Ministry of Environment and Urbanization.
• The Ministry of Agriculture and Rural Affairs, which is responsible for water quality,
monitoring, protection, and uses of seas and inland waters.
MED 2012 ≈≈≈ TOWARD GREEN GROWTH IN MEDITERRANEAN COUNTRIES
149
• The Ministry of Energy and Natural Resources (ETKB), which is responsible for setting
energy policy and targets, among other matters.
Energy efficiency strategy Organizations responsible for energy efficiency policy are the aforementioned Ministry of Energy and
Natural Resources and the General Directorate of Electrical Power Resources Survey and
Development Administration (EIE) / National Energy Conservation Centre (NECC). The first is
responsible for formulating policies and overseeing their implementation, whereas the second focuses
on implementation and coordination of energy efficiency programmes.
Each ministry participates in the national energy efficiency strategy. Among the most important
participants is the Ministry of Environment and Forestry, which focuses on environmentally friendly
energy efficiency projects, environmental protection legislation, and control over emissions from
heating and power plants.
Waste management An effective and sustainable waste management system has long been lacking in Turkey. A reform of
the Turkish waste industry now seems likely.
Institutions at the decentralised level Local administrations are charged with protecting environment quality. Sectoral unions are
responsible for monitoring application of the law. Environmental NGOs such as TEMA and ÇEVKO
are formed by civil initiative.
Local bodies also contribute to the national energy efficiency strategy. Municipalities are
responsible for making decisions about municipal infrastructure, for planning and implementing
energy efficiency in municipal supply structures, for supervising building insulation and energy
performance measures, for improving the rate of uptake, and for increasing public awareness.
MED 2012 ≈≈≈ TOWARD GREEN GROWTH IN MEDITERRANEAN COUNTRIES
150
A6. Acronyms and abbreviations used in the report $ U.S. dollar
€ euro
AFD Agence française de développement
AFED Arab Forum for Environment and Development
AMP Amman Master Plan
ANAT Agence Nationale de l’Aménagement du Territoire (Tunisia)
APAL Agency for the Protection and Management of the Coast
BCLME Benguela Current Large Marine Ecosystem
BES biodiversity and ecosystem services
CACG Compagnie d’aménagement des coteaux de Gascogne (France)
CBO U.S. Congressional Budget Office
CDC Caisse des Dépôts et Consignations (France)
CDG Moroccan Caisse des Dépôts et de Gestion
CDM Clean Development Mechanism
CEA cost-efficiency analysis
CEDARE Centre for the Environment and Development in the Arab Region and Europe
CER certified emission reductions
CESRM Conseil économique et social du Royaume du Maroc
CFP Common Fisheries Policy
CGEM Confédération Générale des Entreprises du Maroc
CH4 methane
CMI Center for Mediterranean Integration (Marseille)
CNE Conseil National de l’Environnement, Morocco
CO2 carbon dioxide
COM Commission of the European Communities
CPUE catch per unit effort
CRDA Commissariat régional de développement agricole (Tunisia)
CSR corporate social responsibility
DAPs dedicated access privileges
DHS demographic and health surveys
DPSIR driving forces-pressures-state-impacts-responses (OECD model)
EEA European Environmental Agency
EFR environmental fiscal reforms
EIB European Investment Bank
ENPI European Neighbourhood Policy Initiative
MED 2012 ≈≈≈ TOWARD GREEN GROWTH IN MEDITERRANEAN COUNTRIES
151
EPI Environmental Performance Index
ERF Economic Research Forum, Cairo
ESCWA UN Economic and Social Commission for Western Asia
ESG environmental and social governance
EU European Union
EU-27 the 27 member countries of the European Union
FAC fixed allowable catch
FAO Food and Agriculture Organization(United Nations)
FDI foreign direct investment
FEMISE Forum Euro-Méditerranéan des Instituts de Sciences Economiques
FiBL Forschunginstitüt für biologischen Landbau (Research Institute of Organic Agriculture)
FODEP Foundation for Democratic Process
GAM Greater Amman Municipality
GDP gross domestic product
GEF Global Environment Facility
GEO Global Earth Observation
GFCM General Fisheries Commission for the Mediterranean
GFCM /SAC General Fishing Commission for the Mediterranean, Scientific Advisory Committee
GHGCAP greenhouse gas emission per capita
GHGIND industrial greenhouse gas emission intensity
GIC Groupements d’Intérêt Collectif
GIZ Deutsche Gesellschaft für Internationale Zusammenarbeit (formerly GTZ)
GPS global positioning system
GTZ now GIZ
HDMU high density, mixed use
HELI Health and Environment Linkages Initiative
ICCAT International Commission for the Conservation of Atlantic Tuna (including the Mediterranean Sea)
ICES International Council for the Exploration of the Sea
ICZM integrated coastal zone management
IEA International Energy Agency
IFOAM International Federation of Organic Agriculture Movements
IGS Interim Growth Strategy
IMF International Monetary Fund
INECE International Network for Environmental Compliance and Enforcement
ITQs transferable quotas
IUCN International Union for Conservation of Nature
JD Jordanian dinar
MED 2012 ≈≈≈ TOWARD GREEN GROWTH IN MEDITERRANEAN COUNTRIES
152
JICA Japan International Cooperation Agency
JVA Jordan Valley Authority
kg kilogram
LPG liquefied petroleum gas
m3 cubic metre
MAP Mediterranean Action Plan
MCA multicriteria analysis
MCC Millennium Challenge Corporation (United States)
METAP Mediterranean Environmental Technical Assistance Program
MOT Ministry of Tourism
MPA marine protected area
MSW municipal solid waste
MTI Marine Trophic Index
MW megawatt
NEMC northern and eastern Mediterranean countries;
NGO nongovernmental organisation
NMVOC non-CH4 volatile organic emissions per pop. area
NOx nitrogen oxides
NPV net present value
OCEMO Office de coopération économique pour la Méditerranée et l’Orient
OECD Organisation for Economic Co-operation and Development
ONAS Office National de l’Assainissement (Tunisia)
PES payments for environmental services
ppm parts per million
PPP purchasing power parity
R&D research and development
ROI return on investment
RSCN Royal Society for the Conservation of Nature
S&P–EGX ESG S&P/Egypt Stock Exchange Economic and Social Governance Index
SBT Southern Bluefin Tuna
SEEA System of Integrated Environmental and Economic Accounts (or Accounting)
SEEAW System of Environmental-Economic Accounts (or Accounting) for Water
SEEE Moroccan State Secretariat for Water and the Environment
SEMCs southern and eastern Mediterranean countries
SFCDG Société Forestière de la Caisse des Dépôts et de Gestion
SMC southern Mediterranean countries
SNA UN System of National Accounts
MED 2012 ≈≈≈ TOWARD GREEN GROWTH IN MEDITERRANEAN COUNTRIES
153
SO2 sulphur dioxide
SRI socially responsible investment
STECF Scientific, Technical and Economic Committee for Fisheries (EU)
TAC total allowable catch
TEEB The Economics of Ecosystems and Biodiversity
tonne metric ton (1,000 kilograms)
TWW treated wastewater
TWWR treated wastewater reuse
UNCTAD United Nations Conference on Trade and Development
UNEP United Nations Environment Programme
UNEP/MAP/RAC UNEP Mediterranean Action Plan Regional Activity Centre
UNESCO United Nations Educational, Scientific, and Cultural Organization
UNFCCC United Nations Framework Convention on Climate Change
UNSD United Nations Statistics Division
WATSTR Water Stress Index
WAVES Wealth Accounting and the Valuation of Ecosystem Services
WDM water demand management
WHO World Health Organization
WJA Water Jordan Authority (Jordan)
WQI Water Quality Index
WSI Water Scarcity Index
WTO World Trade Organization
WUA water-user association