Consistent performance for industries that demand reliability.

3353 Peachtree Road NE Suite 600, North Tower
Atlanta, GA 30326 404-446-2560 | www.nerc.com
2012 Long-Term Reliability Assessment
November 2012

Assessment Preparation
NERC | 2012 Long‐Term Reliability Assessment | November 2012
Page i
North American Electric Reliability Corporation
Atlanta Office
3353 Peachtree Road NE,
Suite 600 – North Tower
Atlanta, GA 30326
404.446.2560
Washington D.C. Office
1325 G Street NW,
Suite 600
Washington, DC 20005
202‐400‐3000
This assessment was prepared by NERC in its capacity as the Electric Reliability Organization1 and provides an independent
view of the 10‐year reliability outlook for the North American BPS,2 while identifying trends, emerging issues, and potential
risks. Additional insight will be offered regarding resource adequacy and operating reliability, as well as an overview of
projected electricity demand growth for individual assessment areas. The 10‐year period observed in this assessment is
from 2013‐2022, with the 2013 summer as the initial season. Information and data for the 2012 summer and 2012/2013
winter seasons are provided in NERC’s seasonal reliability assessments.3 This new approach eliminates overlap between
seasonal and long‐term assessments.
Additional inquiries regarding the information, data, and analysis in this assessment may be directed to the NERC Reliability
Assessment Staff:
NERC Reliability Assessment Staff Name Position Email Phone
Herb Schrayshuen Vice President and Director [email protected]
404‐446‐2563
John N. Moura Associate Director [email protected]
404‐446‐9731
Eric Rollison Engineer [email protected]
404‐446‐9738
Elliott J. Nethercutt Technical Analyst [email protected]
404‐446‐9722
Trinh Ly Junior Engineer [email protected]
404‐446‐9737
Michelle Marx Administrative Assistant [email protected]
404‐446‐9727
1 Section 39.11(b) of the U.S. FERC’s regulations provide that: “The Electric Reliability Organization shall conduct assessments of the adequacy of the Bulk‐Power System in North
America and report its findings to the Commission, the Secretary of Energy, each Regional Entity, and each Regional Advisory Body annually or more frequently if so ordered by the Commission.”
2 BPS reliability, as defined in the How NERC Defines BPS Reliability section of this report, does not include the reliability of the lower voltage distribution systems, which systems account for 80 percent of all electricity supply interruptions to end‐use customers.
3 NERC 2012 Summer Reliability Assessment and 2012/2013 Winter Reliability Assessment: http://www.nerc.com/page.php?cid=4|61.

Preface
NERC | 2012 Long‐Term Reliability Assessment | November 2012
Page ii
Preface The North American Electric Reliability Corporation (NERC) has prepared the following assessment in accordance with the
Energy Policy Act of 2005, in which the United States Congress directed NERC to conduct periodic assessments of the
reliability and adequacy of the bulk power system (BPS) of North America.4,5 NERC operates under similar obligations in
many Canadian provinces, as well as a portion of Baja California Norte, Mexico.
NERC is an international regulatory authority established to evaluate and improve the reliability of the BPS in North
America. NERC develops and enforces reliability standards; annually assesses seasonal and long‐term (10‐year) reliability;
monitors the BPS through system awareness; and educates, trains, and certifies industry personnel. NERC is the Electric
Reliability Organization for North America, subject to oversight by the U.S. Federal Energy Regulatory Commission (FERC)
and governmental authorities in Canada.6
Reliability Standards are the planning and operating rules that electric utilities follow to support and maintain a reliable
electric system. These standards are developed by the industry using a balanced, open, fair and inclusive process accredited
by the American National Standards Institute (ANSI). While NERC does not have authority to set Reliability Standards for
resource adequacy (e.g., reserve margin criteria) or to order the construction of resources or transmission, through
reliability assessment, NERC can independently assess where reliability issues may arise as well as identify emerging risks.
This information, along with NERC recommendations, is then available to policy makers and federal, state, and provincial
regulators to support decision making within the electric sector.
NERC Regional Entities NERC Regional Entities Map NERC Assessment Areas Map FRCC Florida Reliability Coordinating Council
MRO Midwest Reliability Organization
NPCC Northeast Power Coordinating Council
RFC ReliabilityFirst Corporation
SERC SERC Reliability Corporation
SPP‐RE Southwest Power Pool Regional Entity
TRE Texas Reliability Entity
WECC Western Electricity Coordinating Council
NERC prepares seasonal and long‐term assessments of the overall reliability and adequacy of the North American BPS,
which is divided into 26 assessment areas, both within and across the eight Regional Entity boundaries, as shown by the
corresponding table and maps above.7 To prepare these assessments, NERC collects and consolidates data from the eight
Regional Entities, including forecasts for on‐peak demand and energy, demand response, resource capacity, and
transmission projects. The use of this bottom‐up approach accounts for virtually all electricity supplied in the United States,
Canada, and a portion of Baja California Norte, Mexico. The information is analyzed to identify notable trends, emerging
issues, and potential concerns regarding future electricity supply, as well as the overall adequacy of the BPS to meet future
demand. Reliability assessments are developed with the intention of informing industry, policy makers, and regulators and
to aid NERC in achieving its mission—to ensure the reliability of the North American BPS.
4 H.R. 6 as approved by of the One Hundred Ninth Congress of the United States, the Energy Policy Act of 2005: http://www.gpo.gov/fdsys/pkg/BILLS‐109hr6enr/pdf/BILLS‐
109hr6enr.pdf. 5 The NERC Rules of Procedure, Section 800, further detail the Objectives, Scope, Data and Information requirements, and Reliability Assessment Process requiring annual
seasonal and long‐term reliability assessments. 6 As of June 18, 2007, the U.S. Federal Energy Regulatory Commission (FERC) granted NERC the legal authority to enforce Reliability Standards with all U.S. users, owners, and
operators of the bulk power system, and made compliance with those standards mandatory and enforceable. In Canada, NERC presently has memorandums of understanding in place with provincial authorities in Ontario, New Brunswick, Nova Scotia, Québec, and Saskatchewan, and with the Canadian National Energy Board. NERC standards are mandatory and enforceable in British Columbia, Ontario, New Brunswick, and Nova Scotia. NERC has an agreement with Manitoba Hydro making reliability standards mandatory for that entity, and Manitoba has adopted legislation setting out a framework for standards to become mandatory for users, owners, and operators in the province. In addition, NERC has been designated as the “electric reliability organization” under Alberta’s Transportation Regulation, and certain reliability standards have been approved in that jurisdiction; others are pending. NERC and NPCC have been recognized as standards‐setting bodies by the Régie de l’énergie of Québec, and Québec has the framework in place for reliability standards to become mandatory and enforceable in that jurisdiction.
7 A larger map of the assessment area boundaries is included in Appendix IV of this assessment.

Preface
NERC | 2012 Long‐Term Reliability Assessment | November 2012
Page iii
Assessment Preparation and Design The 2012 Long‐Term Reliability Assessment (2012LTRA) is published in accordance with Title 18, § 39.11 of the Code of
Federal Regulations,8 also referred to as Section 215 of the Federal Power Act, which instructs NERC to conduct periodic
assessments of the BPS. NERC’s obligation to produce a long‐term reliability assessment is further described by Section 803
of NERC’s Rules of Procedure,9 which calls for the development of an annual long‐term report with a 10‐year planning
horizon.
NERC prepared the 2012 Long‐Term Reliability Assessment with support from the Reliability Assessment Subcommittee
(RAS), under the direction of the NERC Planning Committee (PC). This report is based on data and information submitted by
each of the eight Regional Entities, which are represented on the RAS. Initial data and information was submitted in June
2012, and periodic updates occurred throughout the development of the report. Any other data sources included by NERC
staff are identified accordingly.
NERC uses a RAS peer review process in preparing both seasonal and long‐term reliability assessments to leverage the
knowledge and experience of subject matter experts representing NERC Regions, as well as the electricity industry at large.
This process provides an essential balance that ensures the validity of data and information provided by the Regional
Entities. Each regional self‐assessment is assigned to subcommittee members from other Regions to provide a
comprehensive review that is discussed and verified by the subcommittee in open meetings. The review process enables all
RAS members the opportunity to verify that each Regional Entity produces quality assessments that are accurate and offer
a comprehensive assessment for each assessment area. A complete draft of the document is further reviewed by the PC
and the Member Representatives Committee (MRC), fully vetting all findings and conclusions. Prior to release, the
assessment is submitted to the NERC Board of Trustees (BOT) for final review and approval.
The 2012LTRA is arranged as follows:
An “Executive Summary” presents notable findings and highlights brought forward from NERC’s reference case
projections for the long‐term outlook. This section also provides an overview of NERC‐wide reliability issues that have
been recognized by the industry as important emerging issues that need to be addressed. Additionally, highlights of
the projected resource adequacy are provided for the 26 assessment areas, along with area‐specific impacts and
potential vulnerabilities.
The “Key Reliability Findings” section includes highlights identified from the 2012LTRA Reference case. The reference
case incorporates known policy and regulation changes expected to take effect throughout the 10‐year timeframe,
assuming a variety of factors such as economic growth, weather patterns, and system equipment behavior. This
section provides NERC’s independent assessment of the 2012LTRA Reference case and recommendations to further
identify, study, or manage reliability concerns.
The “Emerging Reliability Issues in Focus” section supports the development of scenarios—the analysis of which can
indicate the sensitivity of the reference case to changes in pre‐specified conditions and provide insight into the risks to
regional reliability. Emerging reliability issues are generally known or unknown risks NERC and its stakeholders have
endorsed for assessment. Continued understandings of potential impacts to the BPS, the likelihood of those impacts,
and regional implications are important characteristics to NERC’s reliability assessment process.
The “Demands, Resources, and Reserve Margins” section provides summary tables and corresponding analysis of
projections of the electricity supply, demand, and transmission throughout North America.
The “Regional Reliability Assessments” section includes summary tables and corresponding text that provide a more
comprehensive and granular reliability outlook for each assessment area.
8 http://www.gpo.gov/fdsys/pkg/CFR‐2010‐title18‐vol1/pdf/CFR‐2010‐title18‐vol1‐sec39‐11.pdf. 9 NERC Rules of Procedure: http://www.nerc.com/page.php?cid=1|8|169.

Preface
NERC | 2012 Long‐Term Reliability Assessment | November 2012
Page iv
Report and Data Assumptions Forecasts cannot precisely predict the future. Instead, many forecasts report a baseline or “most likely” outcome and a
range of possible outcomes based on probabilities around the baseline or midpoint. Each NERC Region is responsible for
providing projections for NERC’s seasonal and long‐term reliability assessments. Projections are highly dependent on the
data, methodologies, model structures, and other assumptions that often vary by Region, Reliability Coordinator,
assessment area, or Balancing Authority.10 Generally, future generation projections are often derived from generation
queues and other area‐specific resource planning processes, while load projections are typically based on a non‐coincident
50/50 peak demand forecast probability. Additional information is available in Appendix IV and V of this assessment.
When aggregating this data to provide overall projections for the United States, Canada, or North America as a whole, NERC
strives to ensure these projections are as accurate as possible to aid the industry, regulators, and policy makers.
The 2012LTRA reference case for electricity supply and internal demand projections are as follows:
Data updates are included until September 2012. Any subsequent revisions or corrections may not be included or
otherwise represented in this assessment.
Average or normal weather conditions.
Based on the economic conditions and outlook at the time of analysis.
Generating and transmission equipment availability is based on historic performance.
Planned outages and additions to or upgrades of generation and transmission will be completed as scheduled.
Demand reductions expected from direct control load management and interruptible demand contracts will be
available if and when they are needed.
Other peak demand‐side management and demand response programs are included in net internal demand forecasts.
Electricity transfers between Regions are contractually arranged and occur as projected.
Federal, state, and provincial laws and regulations in effect at the time of data and information collection.
In the 2011 Long‐Term Reliability Assessment, NERC indicated that the Environmental Protection Agency’s (EPA) Cross‐State
Air Pollution Rule (CSAPR), combined with other environmental regulations, could directly impact power supply decisions
and grid reliability. On August 21, 2012, the D.C. Circuit Court vacated the CSAPR,11 which had originally required 23 states
to reduce annual SO2 and NOX emissions. Final data submission for this assessment may not reflect the full impact of the
vacated rule. The data collected for the 2012LTRA is generally based on the assumption that this rule would remain in
effect. However, since CSAPR did not mandate physical requirements for electric generators, the rule had a smaller bearing
on unit retirement decisions compared to other factors. Moreover, the likely drivers behind retirement decisions will be the
combination of other federal and state environmental rules, changing fuel costs (i.e., lower natural gas prices), and other
economic decisions. The status of these assumptions is represented in the reference case assessed in this report.
10 Additional information on the methods and assumption used by each Assessment Area are available through the following link:
http://www.nerc.com/files/2012LTRA_PartII.pdf. 11 The CSAPR was initially designed to replace EPA's 2005 Clean Air Interstate Rule (CAIR). A December 2008 court decision kept the requirements of CAIR in place temporarily
but directed EPA to issue a new rule to implement Clean Air Act requirements concerning the transport of air pollution across state boundaries. This action responds to the court's concerns. For additional information see the EPA website http://www.epa.gov/airtransport/.
Preface
NERC | 2012 Long‐Term Reliability Assessment | November 2012
Page v
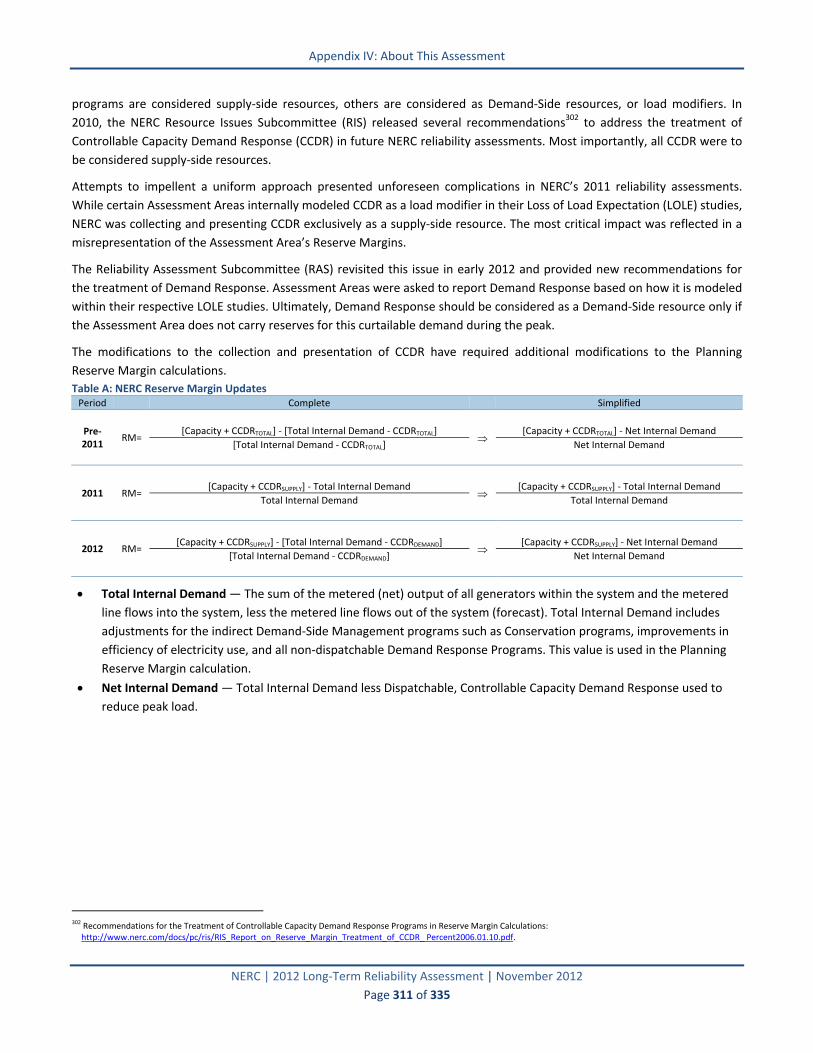
Enhancements A number of enhancements have been made to the 2012 Long‐Term Reliability Assessment in support of stakeholder
comments, the Reliability Assessment Improvement Plan,12 guidance from the Board of Trustees, and the Reliability
Assessment Subcommittee’s efforts to obtain additional information needed to sufficiently perform the long‐term reliability
assessment. This year, enhancements include:
An enhanced view of generator retirements and retrofits
o A supplemental request for information and data on known and potential generator retirements and
retrofits in the next 10 years (see Appendix IX for more information)
Probabilistic indices to supplement the Long‐Term Reliability Assessment
o The biannual probabilistic assessment report is designed to complement the Long‐Term Reliability
Assessment by providing additional probabilistic statistics of Loss of Load Hours (LOLH) and Expected
Unserved Energy (EUE). The analysis will provide results for the third and fifth year of the 2012 Long‐Term
Reliability Assessment—2014 and 2016 results (see Appendix VIII for more information)
Regional vulnerabilities and emerging issues identified in the report
o Emerging issues are developed for each assessment area that provide a more granular view on Region‐
specific issues that potentially affect long‐term BPS reliability
Risk‐type evaluations of key reliability findings and emerging reliability issues
o Evaluations of risks to operating reliability (security) compared to those that impact resource adequacy
o Preliminary support for the Reliability Issues Steering Committee (RISC) framework as this will evolve into
future reliability assessments
A Regional Methods and Assumptions document
o A separate document is published that details methods and assumptions used in the development of the
seasonal and long‐term reliability assessments for each NERC Assessment Area. This information is
modified only as frequently as the Assessment Area changes or enhances the process for assessing
reliability. This document is published to support the 2012 Long‐Term Reliability Assessment and can be
found on the NERC website.13
Modified 10‐year assessment period
o The 10‐year period observed in this assessment is from 2013‐2022, with the 2013 summer as the initial
season. Information and data for the 2012 summer and 2012/2013 winter seasons are provided in NERC’s
seasonal reliability assessments.14 This new approach eliminates overlap between seasonal and long‐term
assessments.
12 Reliability Assessment Improvement Plan : http://www.nerc.com/files/Reliability%20Improvement%20Report%20RAITF%20100208.pdf . 13 2012 LTRA Methods and Assumptions: http://www.nerc.com/files/2012LTRA_PartII.pdf. 14 NERC 2012 Summer Reliability Assessment and 2012/2013 Winter Reliability Assessment: http://www.nerc.com/page.php?cid=4|61.
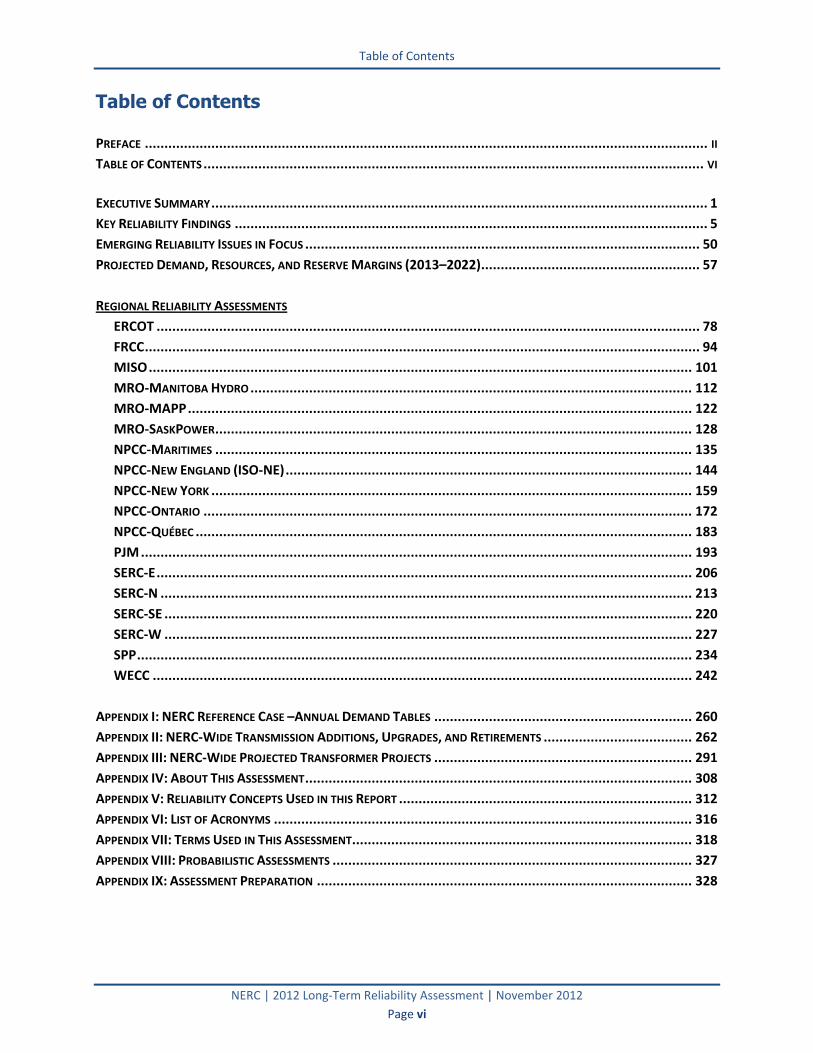
Table of Contents
NERC | 2012 Long‐Term Reliability Assessment | November 2012
Page vi
Table of Contents
PREFACE ................................................................................................................................................ II
TABLE OF CONTENTS ................................................................................................................................ VI
EXECUTIVE SUMMARY ............................................................................................................................... 1
KEY RELIABILITY FINDINGS ......................................................................................................................... 5
EMERGING RELIABILITY ISSUES IN FOCUS ..................................................................................................... 50
PROJECTED DEMAND, RESOURCES, AND RESERVE MARGINS (2013–2022) ........................................................ 57
REGIONAL RELIABILITY ASSESSMENTS
ERCOT ........................................................................................................................................... 78
FRCC .............................................................................................................................................. 94
MISO ........................................................................................................................................... 101
MRO‐MANITOBA HYDRO ................................................................................................................. 112
MRO‐MAPP ................................................................................................................................. 122
MRO‐SASKPOWER .......................................................................................................................... 128
NPCC‐MARITIMES .......................................................................................................................... 135
NPCC‐NEW ENGLAND (ISO‐NE) ........................................................................................................ 144
NPCC‐NEW YORK ........................................................................................................................... 159
NPCC‐ONTARIO ............................................................................................................................. 172
NPCC‐QUÉBEC ............................................................................................................................... 183
PJM ............................................................................................................................................. 193
SERC‐E ......................................................................................................................................... 206
SERC‐N ........................................................................................................................................ 213
SERC‐SE ....................................................................................................................................... 220
SERC‐W ....................................................................................................................................... 227
SPP .............................................................................................................................................. 234
WECC .......................................................................................................................................... 242
APPENDIX I: NERC REFERENCE CASE –ANNUAL DEMAND TABLES .................................................................. 260
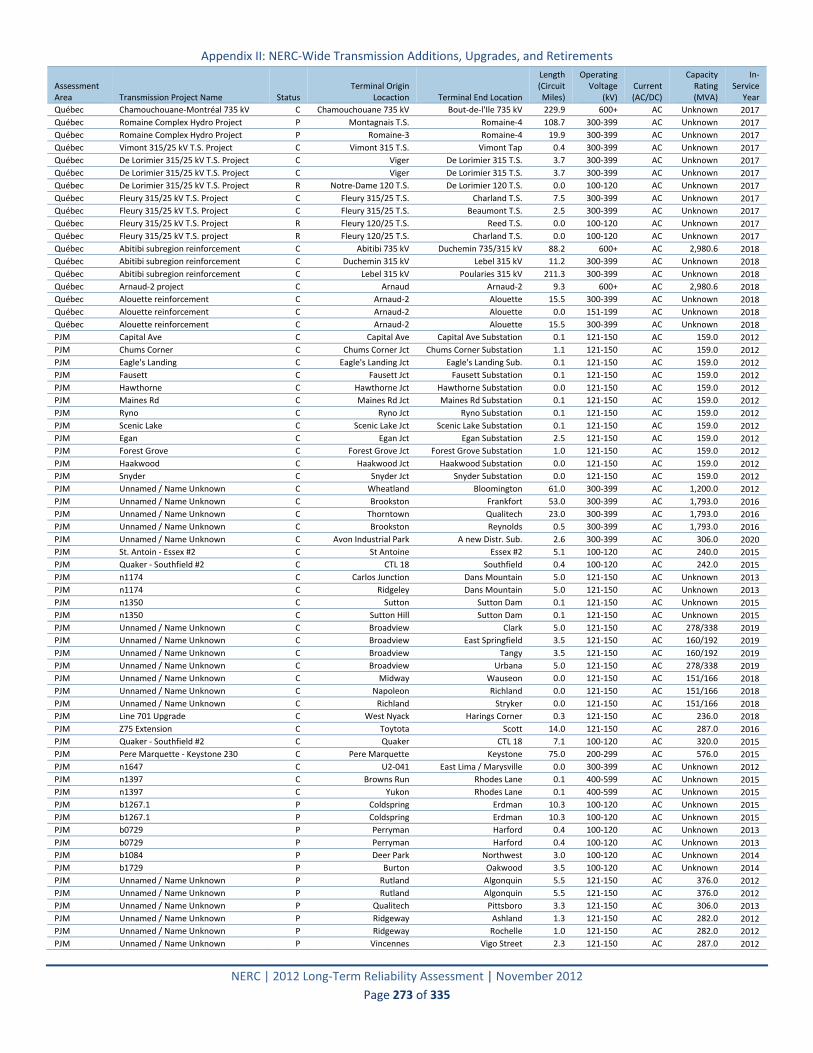
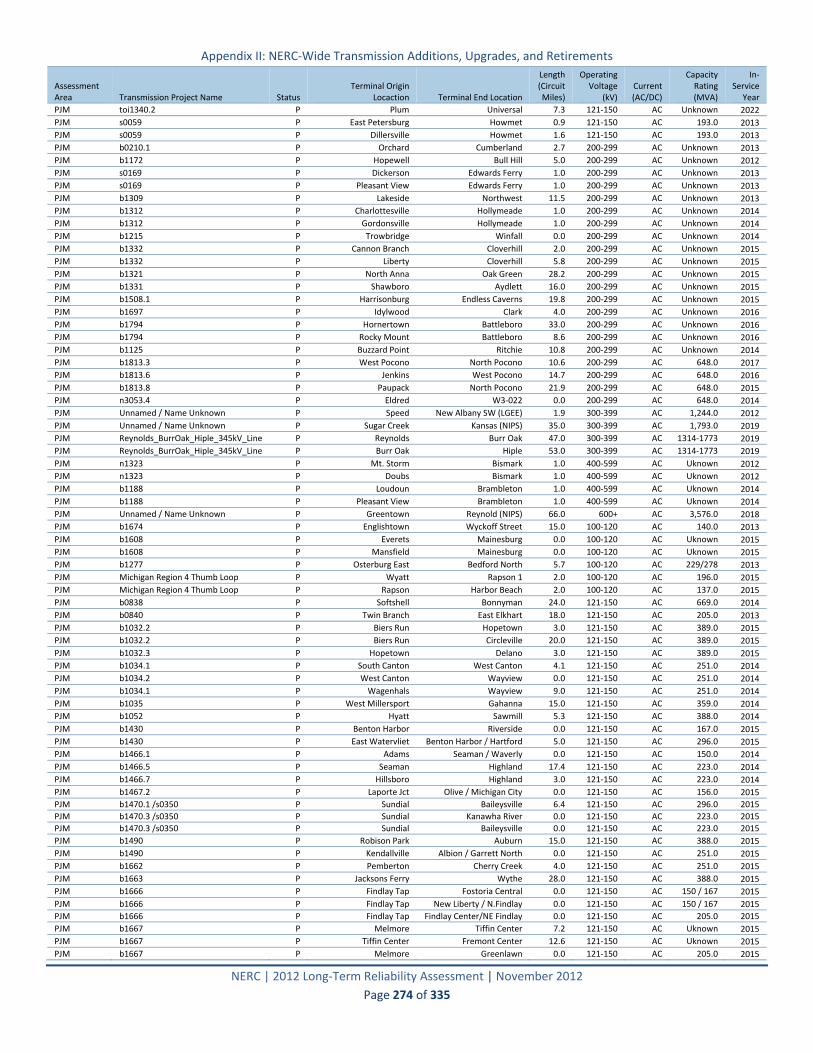
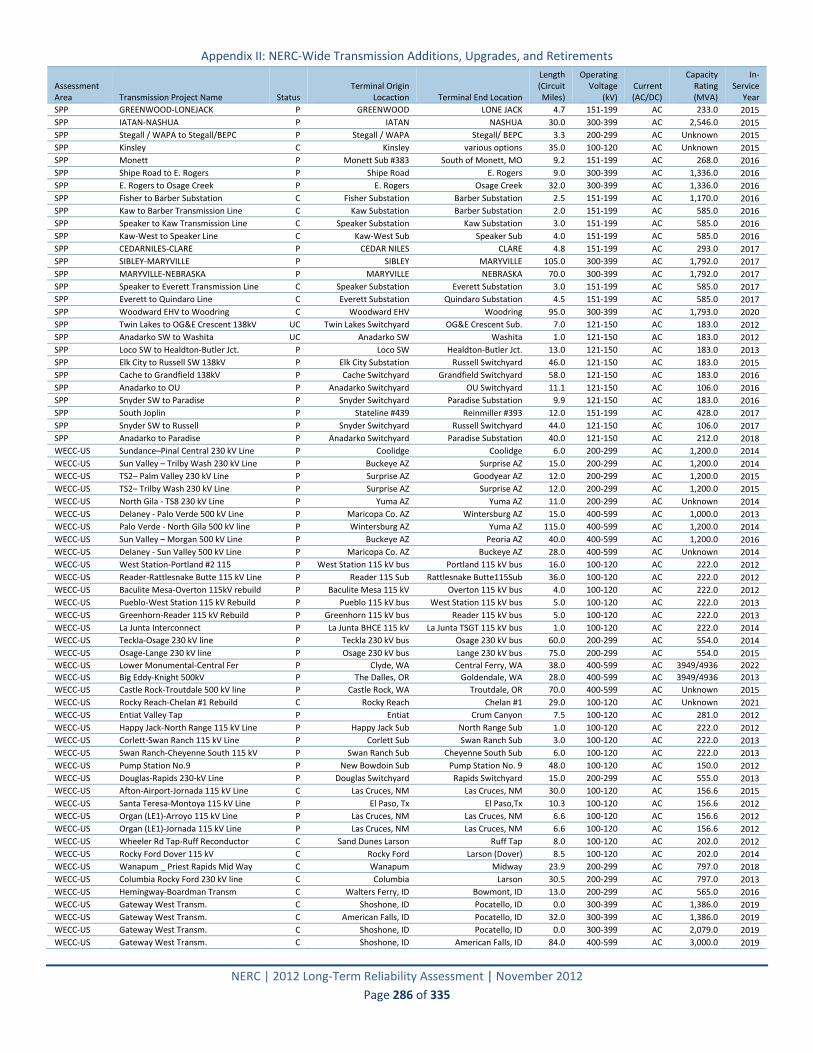
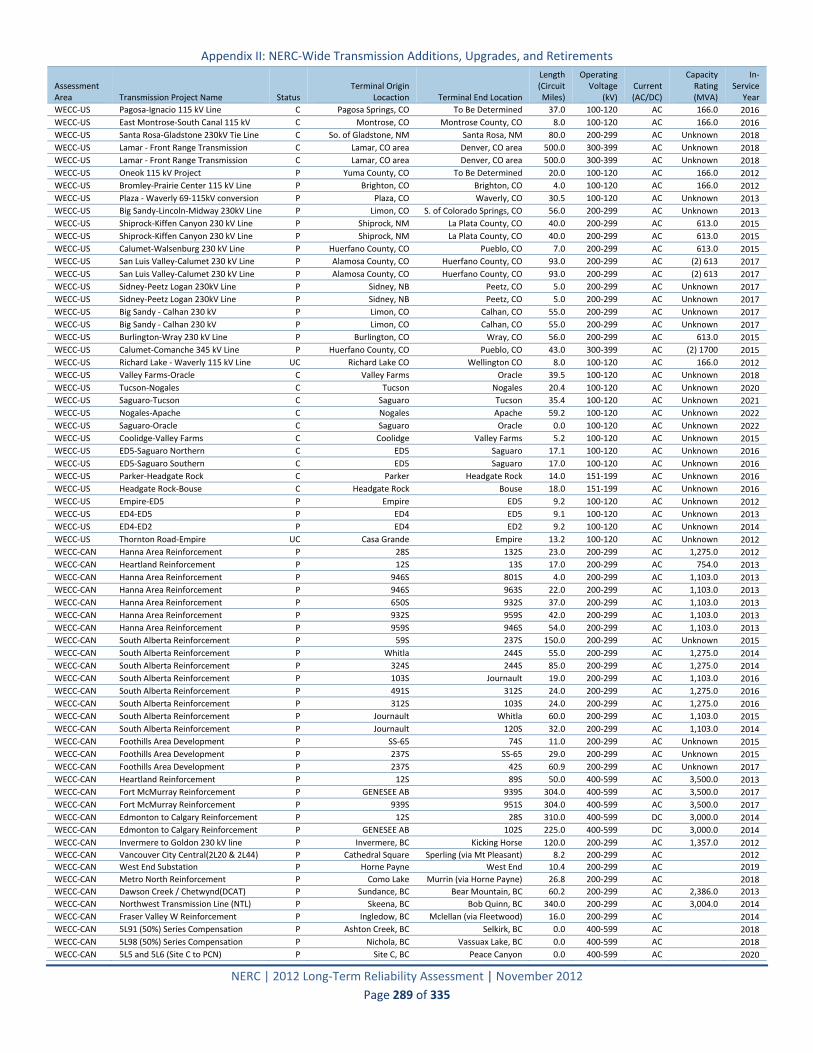
APPENDIX II: NERC‐WIDE TRANSMISSION ADDITIONS, UPGRADES, AND RETIREMENTS ...................................... 262
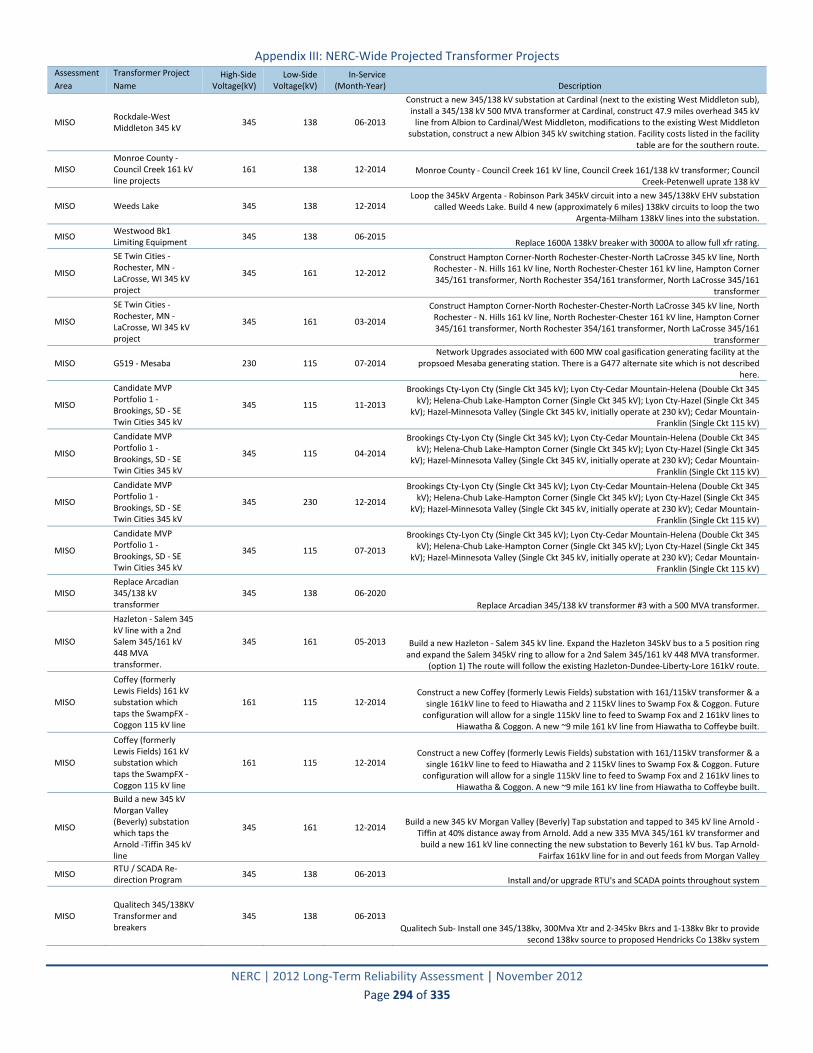
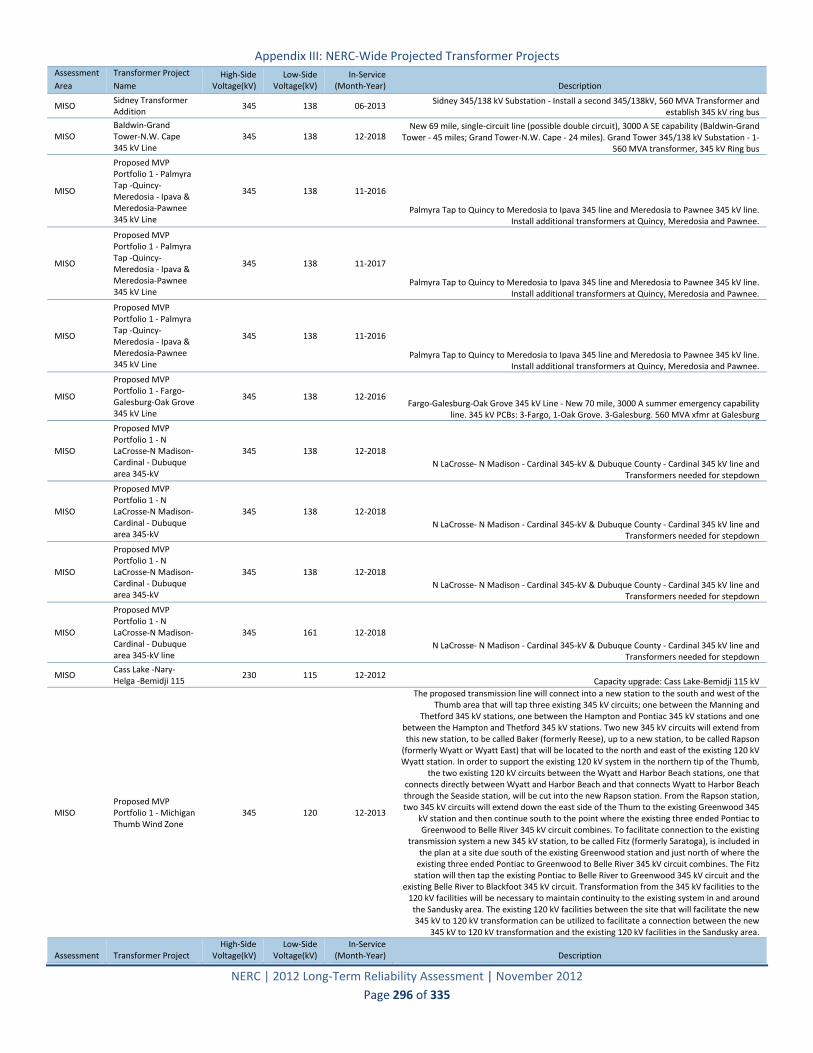
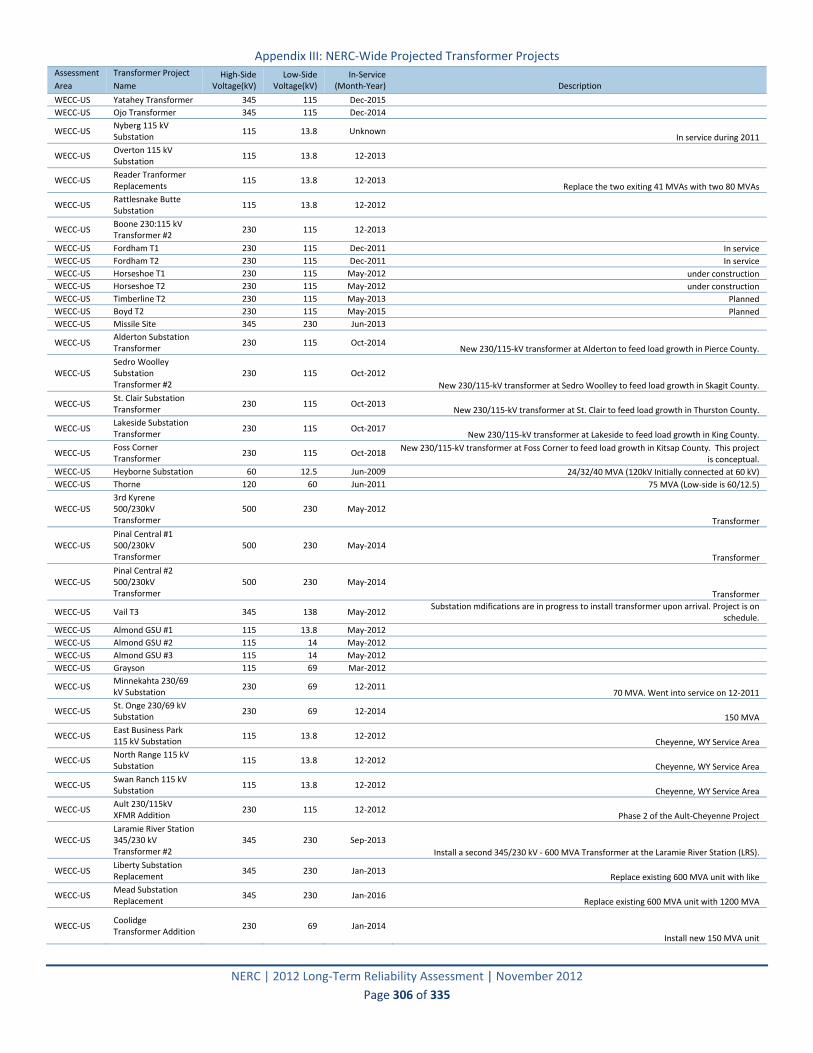
APPENDIX III: NERC‐WIDE PROJECTED TRANSFORMER PROJECTS .................................................................. 291
APPENDIX IV: ABOUT THIS ASSESSMENT ................................................................................................... 308
APPENDIX V: RELIABILITY CONCEPTS USED IN THIS REPORT ........................................................................... 312
APPENDIX VI: LIST OF ACRONYMS ........................................................................................................... 316
APPENDIX VII: TERMS USED IN THIS ASSESSMENT ....................................................................................... 318
APPENDIX VIII: PROBABILISTIC ASSESSMENTS ............................................................................................ 327
APPENDIX IX: ASSESSMENT PREPARATION ................................................................................................ 328

Executive Summary
NERC | 2012 Long‐Term Reliability Assessment | November 2012
Page 1 of 335
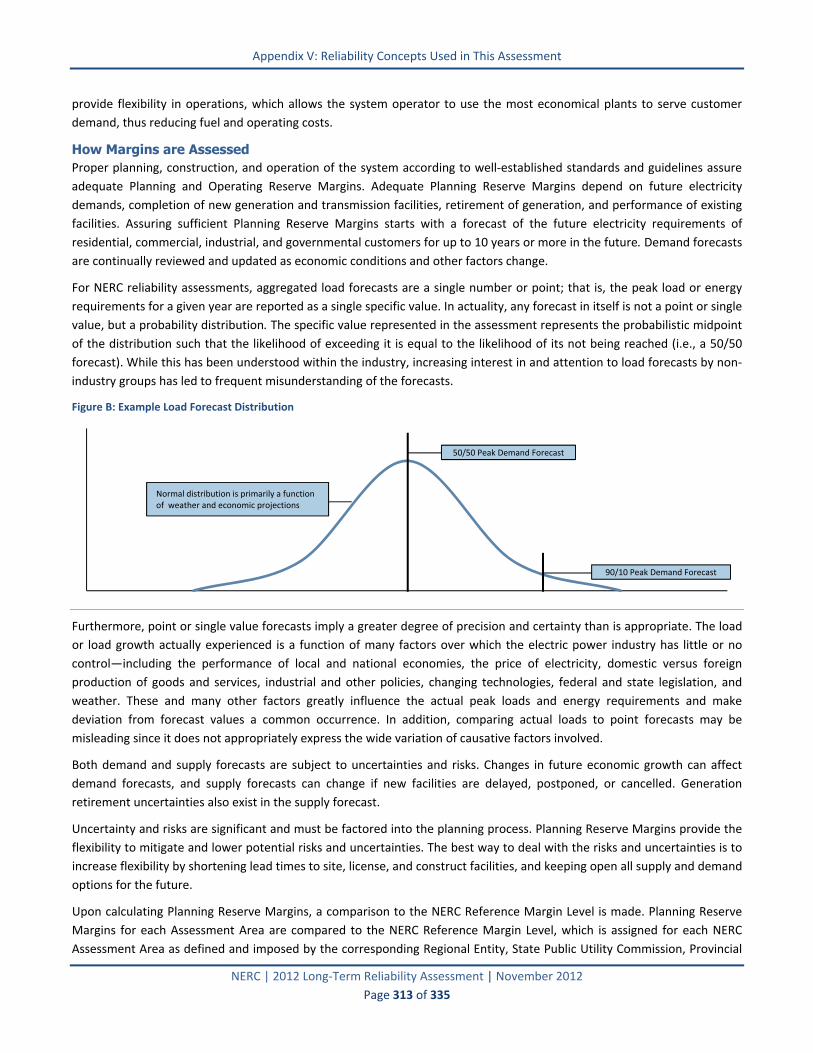
Executive Summary In preparing this assessment, NERC has evaluated key reliability indicators, including peak demand and energy forecasts,
resource adequacy, transmission development, changes in overall system characteristics and operating behavior, and other
influential or regulatory issues that may impact the reliability of the BPS.
Over the next 10 years, the electric industry will face a number of significant emerging reliability issues, which are explained
in detail throughout this report. Emerging reliability challenges will drive a transformational change for the industry that
could potentially result in a dramatically different resource mix with reliance on natural gas and renewable generation, a
need for enhanced modeling, a new risk and probabilistic framework built to address reliability challenges, and growing
critical infrastructure and protection concerns—both physical and cyber.
One of the most significant overarching findings of this report is a rapid change in resource mix in several areas across
North America. While the key factors driving this evolutionary change vary by region, fuel price economics, environmental
regulations, and renewable requirements are the most significant factors affecting the pace of change. Fundamentally,
substantial modifications to the bulk power system require a great deal of time to design, site, permit, and ultimately
construct. As projected in this report, a majority of new generation, as well as older generation expected to retire, will
contribute to a significant resource shift. As resources change both in system characteristics and geography, the
transmission system will be challenged to develop a more robust grid that is not only resilient to resource shifts, but also
other more extreme conditions.
With the exception of the challenges identified in Electric Reliability Council of Texas (ERCOT), the electricity industry has
prepared plans for the 2013‐2022 assessment period in an effort to provide reliable electric service across North America.
As identified in previous assessments, capacity resources in ERCOT have drifted to a level below reliability targets. In other
assessment areas, potential impacts of issues that are not yet fully understood could affect the implementation of current
plans.
While the highlights of this report are presented independently, they are cross‐cutting, and interdependencies between
many of these issues present unique challenges to the electricity industry. Growth in flexible resources, such as demand
response and quick‐start natural gas power generators, and increased transmission plans to integrate renewable resources
distant from load centers are encouraging trends. However, fundamental changes to planning and operating strategies
must consider evolving risks such as increased dependency on natural gas, uncertainties of variable and renewable
generation, and new vectors of penetration for emerging cyber and physical security threats. The confluence of these risks
are critically interdependent and must be strategically managed, monitored, and mitigated in order to preserve the
reliability of the BPS.

Executive Summary
NERC | 2012 Long‐Term Reliability Assessment | November 2012
Page 2 of 335
2012 Key Reliability Findings:
Increased dependence on natural gas for electricity in some areas has increased the need for all gas users, electric
system planners and operators, and policy makers to focus more sharply on the interaction between the electric
and gas industries. The adoption of highly efficient combined‐cycle technology by the electric power industry and
the emergence of shale gas have altered the relative economics of gas‐fired generation. As a result, the dependence
on natural gas by the electric power sector has increased significantly. Trends in fuel‐mix changes highlighted in this
assessment identify gas‐fired generation as the primary choice for new capacity with almost 100 GW of Planned and
Conceptual capacity expected over the next 10 years, which represents almost half of all new generation capacity.
For the majority of the bulk power system, Planning Reserve Margins appear sufficient to maintain reliability
through the long‐term horizon. However, there are significant challenges facing the electric industry that may shift
industry projections adding considerable uncertainty to the long term assessment. Future uncertainties include
electricity market changes, fuel‐prices (natural gas in particular), potential environmental regulations, and
renewable portfolio standards.
Starting as early as next year, the Electric Reliability Council of Texas (ERCOT) Planning Reserve Margin is anticipated
to be 13.4 percent, which is below the NERC Reference Margin Level and ERCOT planning target of 13.75 percent.
At these levels, the risk of insufficient generation resources to meet peak demand increases beyond reliability
targets.
Due largely to the unique confluence of final and potential environmental regulations, low natural gas prices, and
other economic factors, about 71 GW of fossil‐fired generation is projected to retire by 2022, with over 90 percent
retiring by 2017. With the exception of ERCOT, the retirement of this capacity does not pose significant resource
adequacy concerns. Reserve Margins are likely to be reduced, but to levels that are still above targets. However,
retirements over the next three to four years may raise issues related to system stability and the need for
transmission enhancements, which if not addressed could cause reliability concerns in some areas.
Significant Fossil-Fired Generator Retirements Over Next Five Years
Increased Risk of Capacity Deficiencies in ERCOT as Planning Reserve Margins Projected to Fall Below Targets
Resources Sufficient to Meet Reliability Targets in Most Areas
Increased Dependence on Natural Gas for Electricity Generation

Executive Summary
NERC | 2012 Long‐Term Reliability Assessment | November 2012
Page 3 of 335
All areas are projecting at least some increased availability of Demand‐Side Management (DSM) over the next 10
years to reduce peak demands, contributing either to the deferral of new generating capacity or improving operator
flexibility in day‐ahead or real‐time time operations. NERC‐wide, DSM is projected to total roughly 80,000 MW by
2022 (or about 7 percent of the on‐peak resource portfolio), offsetting approximately six years of peak demand
growth. However, unlike traditional generating resources with many decades of historic data for analysis, the long‐
term projections of DSM involve greater forecasting uncertainty—particulary with Demand Response resources.
As recent as five years ago, transmission was being constructed at a rate of about 1,000 circuit miles per year. In the
last five years, over 2,300 circuit miles were constructed per year, more than doubling actual builds in the previous
five years. With the current plans in place, that rate is expected to increase to 3,600 miles per year over the next
five years. NERC‐wide, almost a quarter of new transmission is specifically linked to the integration of renewable
generation.
Renewable resources are growing in importance in many areas of North America as the number of new facilities
continues to increase. The share of capacity from renewable resources will continue to grow, especially as
significant additions are projected for both wind and solar throughout North America. In 2012, renewable
generation, including hydro, made up 15.6 percent of all on‐peak capacity resources and is expected to reach
almost 17 percent in 2022. Contributing to this growth is approximately 20 GW of on‐peak Future‐Planned capacity
and an additional 21.5 GW of on‐peak Conceptual capacity. It is vital that these variable resources are integrated
reliably and in a way that supports the continued performance of the BPS and addresses both planning and
operational challenges.
A significant generation retrofit effort is expected over the next 10 years in order to comply with federal and state‐
level environmental regulations. A majority of environmental controls are expected to be put in place to meet air
regulations by April 2016. In total, 339 unit‐level retrofits on fossil‐fired generation will be needed, totaling about
160 GW. However, there is still significant uncertainty in the forecasted values as maintenance schedules have not
yet been fully evaluated by all areas.
Long-Term Generator Maintenance Outages for Environmental Retrofits
Renewable Resource Additions Introduce New Planning and Operational Challenges
Transmission Growth to Accommodate New and Distant Resources
Increases in Demand‐Side Management Help Offset Future Resource Needs
Executive Summary
NERC | 2012 Long‐Term Reliability Assessment | November 2012
Page 4 of 335
Future Reliability Challenges and Emerging Issue Risk Types A comprehensive reliability assessment of the North American BPS requires considerations of emerging issues and future
risks to reliability. While NERC is in the process of developing a strategic framework to address and prioritize high‐risk
issues, it is important to recognize how different risks can be exposed and what the potential impact could be to reliability.
Emerging risks identified in the current
and past long‐term reliability assessment
reports are shown in Figure 1. Two
fundamental and measurable
characteristics of BPS reliability form the
foundation of the concepts described in
this document—resource adequacy and
operating reliability (or system security).
Each issue in Figure I includes the
potential to impact these two
characteristics differently; therefore, the
impacts to system reliability can be
different and must be well understood.
The results are the product of combined
industry surveys, engineering judgment,
and NERC’s independent assessment.
By understanding these risks, the
electricity industry can be more
effective in mitigating adverse impacts.
With resource adequacy impacts, the
ability of the BPS to supply the
aggregate electrical demand and energy
requirements is compromised.
Operating reliability impacts include all other system disturbances that result in the unplanned or uncontrolled interruption
of customer demand, regardless of cause. Impacts that spread over a wide area of the grid are referred to as cascading
outages—the uncontrolled successive loss of system elements triggered by an incident at any location.
Going forward, an enhanced framework for developing strategic and tactical recommendations will help NERC and the
industry effectively focus resources on the critical issues needed to best improve the reliability of the BPS. The Reliability
Issues Steering Committee (RISC) is an advisory committee that reports directly to the NERC Board of Trustees and triages
and provides front‐end, high‐level leadership and accountability for nominated issues of strategic importance to reliability.
Ultimately, the recommendations will improve efficiency of NERC Reliability Standards development, engage high‐level
stakeholder leadership, and promote reliability excellence.15
15 RISC Website: http://www.nerc.com/page.php?cid=1|117|428.
Figure 1: Future Reliability Challenges and Emerging Issues as a Function of Resource Adequacy versus Operating Reliability Impacts

Key Reliability Findings
NERC | 2012 Long‐Term Reliability Assessment | November 2012
Page 5 of 335
Key Reliability Findings Each year, the Long‐Term Reliability Assessment (LTRA) forms the basis for the NERC reference case. This reference case
incorporates known policy and regulation changes that are expected to take effect throughout the 10‐year timeframe,
assuming a variety of factors such as economic growth, weather patterns, and system equipment behavior. This section
provides NERC’s independent assessment of the 2012 reference case and discusses key findings and challenges of managing
reliability concerns.
Significant Fossil-Fired Generator Retirements Over Next Five Years Largely due to the unique confluence of final and potential federal environmental regulations, low natural gas prices, and
other economic factors, approximately 71 GW of fossil‐fired generation16 is projected to retire by 2022, with over 90
percent retiring by 2017. Over the past three years, significant uncertainty surrounding fossil‐fired generation retirements
has been the most prominent emerging reliability issue assessed by NERC and the electric power industry. For the first time,
coal‐fired generation is projected to decline over the 10‐year assessment period. While significant fossil‐fired generation
retirements were expected (based on a 2011 NERC assessment), the magnitude of retirements remains uncertain due to
generator owners not revealing or announcing plans for unit retirements until recently.
For the 2012LTRA Reference case, approximately 44 GW of fossil‐fired capacity retirements has been confirmed to retire in
the next 10 years (Figure 2). Confirmed retirements are those that have been announced or otherwise included in a given
Planning Coordinator’s resource plans. Additionally, unconfirmed retirement projections have been reported, reaching a
total of 26 GW by 2022, a majority of which are projected to retire by 2017 (Figure 3). Projected retirements were forecast
by individual assessment areas based on reasonable expectations. For many assessment areas, existing studies and analyses
were applied as a basis for retirement projections over and above the amount that has already been confirmed. Some
assessment areas did not fully project additional retirements beyond confirmed amounts included in the reference case as
insufficient information was available to make a determination.17 For assessment areas that did not submit supplemental
retirement data, the 2012LTRA Reference case data was applied. Uncertainties still exist and more generators may retire
than what is projected in this assessment.
Figure 2: NERC‐Wide Cumulative Summer Fossil‐Fired Capacity Resource Retirements
16 NERC reviews the impacts of both controlled and variable resources in this assessment. Variable resources differ from conventional controllable resources, such as fossil‐fired
resources in a fundamental way: their fuel source (wind, sunlight, andmoving water) cannot presently be controlled or stored. Unlike coal or natural gas, which can be extracted from the earth, delivered to plants thousands of miles away, and stockpiled for use when needed, variable fuels must be used when and where they are available.
17 ERCOT, FRCC, NPCC‐New England, NPCC‐Ontario, and SERC Assessment Areas
613
1823
3742 42 43 43 44 44 45
1
4
5
9
12
2223 24 25 25 26
0
10
20
30
40
50
60
2011 2012 2013 2014 2015 2016 2017 2018 2019 2020 2021 2022
Gigaw
atts (G
W)
Confirmed Unconfirmed

Key Reliability Findings
NERC | 2012 Long‐Term Reliability Assessment | November 2012
Page 6 of 335
Figure 3: NERC‐Wide Confirmed Retirements by Fuel Type (Summer Capacity)
Capacity Type 2011 2012 2013 2014 2015 2016 2017 2018 2019 2020 2021 2022
Coal 2,131 6,380 8,597 12,496 23,615 26,719 27,198 27,971 28,067 28,650 28,650 28,650 Petroleum 1,531 2,880 4,088 4,719 4,909 6,221 6,221 6,221 6,221 6,221 6,221 6,221 Gas 2,405 4,195 5,565 6,086 7,530 7,919 8,121 8,365 8,417 8,493 8,493 8,611
Total 6,067 13,454 18,250 23,301 36,054 40,858 41,539 42,556 42,705 43,364 43,364 43,482
In the 2011 Long‐Term Reliability Assessment, NERC projected capacity losses due to retirements and derates associated
with environmental control impacts to generator ratings.18 Based on the results of the Moderate Case, 36 GW of
incremental capacity in coal, oil, and gas‐fired generation was identified for either retirement or for capacity reductions to
support additional station loads (deratings) by 2018. In the Strict Case, capacity reductions amount to approximately 59
GW. For retirements only, the study indicated a range of 7 GW to 18 GW for 2015 and 32 GW to 54 GW for 2018 (Moderate
to Strict Cases represent the ranges).19 Confirmed and unconfirmed retirements in the 2012LTRA Refernce case show
significantly more generators retiring than had previously been projected by NERC for 2015; however, 2018 projections are
more in line with last year’s study. This is believed to be due largely to a decrease in natural gas prices as well as the
extended compliance period associated with the EPA Mercury and Air Toxics Standard (MATS).20,21
On December 16, 2011, the Environmental Protection Agency (EPA) issued a rule to reduce emissions of toxic air pollutants
from power plants. Specifically, MATS will reduce emissions from existing and planned coal‐ and oil‐fired generators by
requiring the installation of environmental controls. These controls typically involve the addition of dry sorbent injection22
or a scrubber on units to control emission levels. Generation owners will ultimately be charged with deciding between
investing in the plant to ensure compliance, or closing it permenantly.
Adding to the regulatory constraint, low natural gas in recent years offers incentives for plant owners to convert existing
plants from coal to gas. Retirement decisions for existing coal‐ and oil‐fired units are often highly sensitive to the
replacement costs for that capacity—which, in effect is fuel cost dependent. Therefore, the option of converting these
existing units to natural gas becomes a more economically attractive alternative as gas prices decline. According to the 2011
NERC study on potential generator retirements, a $2 downward swing on natural gas prices could potentially double the
amount of retired coal‐fired generation as part of the NERC scenario analysis.23 Henry Hub natural gas prices have dropped
18 Extraction from 2011 Long‐Term Reliability Assessment: http://www.nerc.com/files/EPA%20Section.pdf. 19 Derates associated with generator retrofits are embedded within the 2012 LTRA reference case for projected capacity resources and generator ratings and have been
considered as part of the overall assessment. 20 http://www.epa.gov/mats/. 21 National Emission Standards for Hazardous Air Pollutants from Coal‐ and Oil‐fired Electric Utility Steam Generating Units and Standards of Performance for Fossil‐Fuel‐Fired
Electric Utility, Industrial‐Commercial‐Institutional, and Small Industrial‐Commercial‐Institutional Steam Generating Units, http://www.gpo.gov/fdsys/pkg/FR‐2012‐02‐16/pdf/2012‐806.pdf.
22 http://www.eia.gov/todayinenergy/detail.cfm?id=5430. 23 Based on Henry Hub Prices, 2011 Long‐Term Reliability Assessment, Table 35: Projected 2018 Coal Retirements Based on Gas‐Price Sensitivity:
http://www.nerc.com/files/2011%20LTRA_Final.pdf.
0
5,000
10,000
15,000
20,000
25,000
30,000
35,000
40,000
45,000
2011 2012 2013 2014 2015 2016 2017 2018 2019 2020 2021 2022
Megawatts (MW)

Key Reliability Findings
NERC | 2012 Long‐Term Reliability Assessment | November 2012
Page 7 of 335
almost $2 since NERC’s 2011 study on generation retirements, providing obvious incentives and greater economic benefits
to switch from coal or oil to gas generation (Figure 4).
Figure 4: Monthly Average Electric Generation Natural Gas Prices 2007–July 2012 (2010 dollars per million Btu)24
Other reasons for generation retirements include economic‐related decisions for continuing the operation of a given plant.
Decisions may be impacted by the plant’s age, past investment in environmental controls, and other regional‐specific issues
such as fuel mix, renewable portfolio standards, and impacts of other proposed environmental regulations.
While facility retirements are expected NERC‐wide—including in the United States and Canada—some assessment areas
will be impacted more than others will. It is important to note that absolute retirement impacts will only cause a resource
adequacy concern if retirements cause the Planning Reserve Margin to fall below the targets.25 For example, PJM is
projected to retire the largest amount of fossil‐fired capacity by 2022; however, even with 15 GW of generator retirements
confirmed, Planning Reserve Margins do not fall below the NERC Reference Margin Level until 2020. The plans for new
generation in PJM, along with available reserves, allow PJM the flexibility required to maintain resource adequacy through
the long term.
PJM, MISO, and the SERC Assessment Areas are projecting the highest amount of retirements (over 10 GW), as well as the
highest percentage relative to total capacity resources—11.9 percent, 11 percent, and 5.1 percent, respectively (Figure 5).
Ontario is also projected to retire 14.2 percent of its total capacity by 2014 (Table 1).
Figure 5: NERC‐Wide Confirmed and Projected Fossil‐Fired Capacity Retirements for 10‐Year Period
24 U.S. Department of Energy – Energy Information Administration: http://www.eia.gov/dnav/ng/hist/n3045us3m.htm. 25 Targets are based on resource planning analysis or regulatory criteria within Regions, NERC Assessment Areas, or Canadian provinces. In some cases, these targets are
mandatory. The target for each assessment area is applied as the NERC Reference Margin Level.
0
2
4
6
8
10
12
14
2007 2008 2009 2010 2011 2012
2010 Dollars ($)
NERC 2011 gas price assumptions for generation retirement study
NERC 2010 gas price assumptions for generation retirement study
1.6%
6.2%
11.0%
13.1%
1.7%
6.0%
14.6%
1.7%
11.9%
5.1% 5.5%4.8%
0
2,500
5,000
7,500
10,000
12,500
15,000
17,500
20,000
22,500
25,000
Megawatts (MW)
2022 Confirmed 2022 Unconfirmed Percentage of 2013 Anticipated Resources

Key Reliability Findings
NERC | 2012 Long‐Term Reliability Assessment | November 2012
Page 8 of 335
Table 1: Cumulative NERC‐Wide Confirmed and Unconfirmed Fossil‐Fired Capacity Retirements26 Assessment Area Certainty 2011 2012 2013 2014 2015 2016 2017 2018 2019 2020 2021 2022
ERCOT Confirmed 342 342 342 342 342 342 342 342 342 342 342 342
Unconfirmed ‐ 0 0 0 0 0 0 871 871 871 871 871
FRCC Confirmed 957 1,344 2,599 2,599 2,611 3,321 3,345 3,345 3,345 3,421 3,421 3,421
Unconfirmed ‐ 0 0 0 0 0 0 0 0 0 0 0
MISO Confirmed 1,012 2,170 2,281 2,281 2,281 2,281 2,281 2,281 2,281 2,281 2,281 2,281
Unconfirmed ‐ 252 364 364 364 364 9,626 9,626 9,626 9,626 9,626 9,626
MRO‐SaskPower Confirmed 0 0 201 201 262 262 262 262 262 262 262 262
Unconfirmed ‐ 0 0 0 0 0 0 0 0 0 278 278
NPCC‐New England Confirmed 0 0 0 587 587 587 587 587 587 587 587 587
Unconfirmed ‐ 0 0 0 0 0 0 0 0 0 0 0
NPCC‐New York Confirmed 219 1,204 1,204 1,204 1,204 1,204 1,204 1,204 1,204 1,204 1,204 1,204
Unconfirmed ‐ 0 1,342 1,342 1,342 1,342 1,342 1,342 1,342 1,342 1,342 1,342
NPCC‐Ontario Confirmed 920 920 920 2,699 4,002 4,112 4,290 4,494 4,546 4,546 4,546 4,664
Unconfirmed ‐ 0 0 0 0 0 0 0 0 0 0 0
NPCC‐Québec Confirmed 450 730 730 730 730 730 730 730 730 730 730 730
Unconfirmed ‐ 0 0 0 0 0 0 0 0 0 0 0
PJM Confirmed 0 1,367 1,601 3,518 12,215 14,578 14,578 14,578 14,578 14,578 14,578 14,578
Unconfirmed ‐ 0 1,038 1,931 4,289 7,373 7,373 7,373 7,373 7,373 7,373 7,373
SERC (E,N,SE,W) Confirmed 977 3,401 4,882 5,605 7,550 9,172 9,467 10,280 10,280 10,280 10,280 10,280
Unconfirmed ‐ 0 0 0 0 0 0 0 0 0 0 0
SPP Confirmed 0 0 130 130 676 926 926 926 926 926 926 1,457
Unconfirmed ‐ 496 700 737 1,305 1,851 2,108 2,108 2,108 2,116 2,116 2,116
WECC‐Total Confirmed 1,190 1,972 3,485 3,530 4,132 4,132 4,316 4,316 4,316 4,899 4,899 4,899
Unconfirmed ‐ 340 613 722 1,366 1,366 1,366 1,911 2,204 3,213 3,655 4,150
TOTAL‐NERC Confirmed 6,067 13,450 18,375 23,426 36,592 41,647 42,328 43,345 43,397 44,056 44,056 44,705 TOTAL‐NERC Unconfirmed ‐ 1,088 4,057 5,096 8,666 12,296 21,815 23,231 23,524 24,541 25,261 25,756
TOTAL‐NERC TOTAL 6,067 14,538 22,432 28,521 45,259 53,943 64,143 66,576 66,921 68,597 69,316 70,460
For all these reasons, NERC is projecting approximately 64.1 GW of capacity to be retired by 2017 and 70.5 GW by 2022.
With the exception of ERCOT, the retirement of this capacity does not pose significant resource adequacy concerns. Rather,
issues related to supporting system stability and transmission enhancements required as a result of retiring generation are
likely to cause some reliability concerns in areas that are impacted by large generator retirements (Figure 6).
Figure 6: NERC‐Wide Confirmed and Projected Fossil‐Fired Capacity Retirements (with 2011 as a base‐year)27
26 Net On‐Peak summer capacity.
27 Natural gas and coal/oil projections projections are aggregated from 2012 LTRA reference case data and represent net changes (i.e., there are increases in capacity throughout
the assessment period as well). Capacity changes are due to a combination of capacity retirements, derates, and maintenance outages. Unconfirmed retirements of oil and coal were provided through a supplemental data request. Details on this request are provided in Appendix IX. The 2012LTRA Reference case indicates approximaterly 32 GW of gas‐fired capacity is projected from 2012‐2022. This figure has a base‐year of 2011, with over 40 GW projected from 2011‐2022.
310
320
330
340
350
360
370
380
390
400
410
420
430
440
2008 2009 2010 2011 2012 2013 2014 2015 2016 2017 2018 2019 2020 2021 2022
Gigaw
atts (G
W)
Projected Coal/Oil Capacity Net Reductions: ‐35 GW
Projected Gas‐Fired Capacity: +40 GW
Unconfirmed Coal/Oil Capacity Retirements : ‐25.7 GW

Key Reliability Findings
NERC | 2012 Long‐Term Reliability Assessment | November 2012
Page 9 of 335
The retirement of larger and/or strategically situated generating units will cause changes to the power flows and the
performance of the bulk power system. These changing characteristics will require enhancements to the interconnected
transmission systems to provide reactive and voltage support, address thermal constraints, and provide for system stability.
System planners and operators must understand and study impacts of every generator that may be retired; in market
areas, this analysis is performed with a retirement request of the market participant. Federal environmental rule
compliance deadlines will challenge the electric industry’s planning horizons and processes. Transmission lines and facilities,
as well as power plants, are often planned and constructed over a long period of time. Therefore, sufficient time is needed
so that plans can be developed and implemented to accommodate generator retirements. If these decisions are made in a
time frame that does not allow for building new generation capacity or transmission enhancements, overall system
reliability could be adversely affected.
The lack of certainty has left system planners with little information on how the system might be changed in the future. For
example, in many of the deregulated market areas, the ISO/RTO, performing the Planning Coordinator function, has little
insight into the retirement decisions of generators serving the market. Many of the ISO/RTOs have challenges in identifying
generators that will retire, because the market rules or criteria do not require generators to inform the system operator
until 90 days prior to the requested retirement date or termination of an interconnection agreement. However, those areas
with a forward capacity market structure are able to foresee market participant withdrawals up to three years in the future.
For example, in PJM, almost 15 GW of existing fossil‐fired generation did not bid into the capacity market. While this
capacity has not all been officially announced to retire, the PJM planning process, along with this assessment, does not
include this generation in future reliability analyses. Areas without this capability or other methods to provide planning
coordination with sufficient lead time to determine reliability impacts are left with significant uncertainty as to the amount
and timing of retirements.
As a result of generator uncertainties, transmission plans needed to accommodate generator retirements are impacted.
System planners’ responsibilities include analyzing expected future changes in generation and transmission assets, such as
the retirement of a generating unit; customer demand; and emerging reliability issues. For example, once a system planner
learns that a power company intends to retire a generating unit, the system planner generally studies the electric system to
assess whether the retirement would cause reliability challenges and then identifies solutions to mitigate any impacts. The
solutions could be in the form of replacement capacity (generation or demand‐side resources), new transmission lines, or
other equipment, each with its own associated permitting and construction timelines.
Other compounding issues, such as dependency on gas‐fired generation, significant generator retrofit maintenance
outages, and an increasing need for system flexibility, will pose continued challenges for planners and operators of the
performance of the BPS. As more gas‐fired generation is brought on‐line in the bulk power system, gas dependency issues
must be addressed. Increased gas‐fired capacity may require additional gas pipeline infrastructure, increased coordination
with pipeline operators, and developing operational strategies to minimize potential fuel delivery issues. These issues were
highlighted in a recent NERC report28 on gas and electric interdependencies and are also highlighted later in this report.
When a Planning Coordinator receives a deactivation request from a Generator Owner, it simulates power flows and
stability of the bulk power system and assesses resource adequacy based on forecast system conditions. Detailed modeling
studies analyze system configurations against NERC and Regional Reliability Standards to identify transmission overloads,
voltage limitations, system stability, and other reliability performance conditions. The Planning Coordinator is required to
develop plans and implement solutions for each potential violation, which could otherwise lead to overloads, equipment
failure, instability, and, in the most extreme circumstances, uncontrolled, widespread cascading outages.
28 2011 NERC Special Assessment Report: A Primer of the Natural Gas and Electric Power Interdependency in the United States: http://www.nerc.com/files/Gas_Electric_
Interdependencies_Phase_I.pdf

Key Reliability Findings
NERC | 2012 Long‐Term Reliability Assessment | November 2012
Page 10 of 335
Based on information gathered from stakeholders and the Regional Entities, a large amount of retirements occurring over a
short period may cause reliability concerns. In some cases, these reliability issues could result in violations of NERC
Reliability Standards and, therefore, pose a threat to reliability if not addressed. System impact studies, conducted by
Planning Coordinators, will be able to identify impacts and potential mitigation strategies to address the announced and
planned retirement of facilities.
Overall, generation retirements need to be evaluated and analyzed in an integrated fashion. While the high degree of
uncertainty surrounding retirement decisions continues to be exceedingly difficult, power system planners must continue
not only to study the effects of individual generator impacts, but also to recognize the cumulative impacts of multiple
generator retirements.
Risk Assessment Summary
Impacted Assessment Area(s)
PJM
MISO
SERC
Impact Type Resource Adequacy ‐ Significant generator retirements can cause capacity deficiencies and may affect the power system’s ability to meet peak demands.
Magnitude of Impact
Operating Reliability – Local transmission reliability impacts due to large plant retirements
44 GW of Fossil‐Fired Generation Confirmed to Retire
24 GW of Fossil‐Fired Generation Projected to Retire
Likelihood of Impact Confirmed retirement capacity is very likely to retire based on the current schedule. However, it is possible that these plans change in the future depending on changes in regulations, technologies, and fuel prices.
Short terms; a majority of the retirements are expected by 2016
Recommendations
NERC NERC should continue to monitor retirements and emerging reliability issues stemming from significant generator retirements in the Long‐Term Reliability Assessments.
Generator Owners and Operators
Generator Owners and Operators that are disconnected from wide‐area planning functions (e.g., generator owners operating in an ISO/RTO), should provide Planning Coordinators timely and accurate information about the retirement plans for their units in order to adequately assess any reliability concerns. While changes to market rules are not necessarily needed, discussions should occur and expectations should be shared with independent authorities on reliability.
Planning Coordinators All Planning Coordinators should employ available tools and processes to ensure that BPS reliability is maintained through any resource transition. Regional wholesale competitive market operators should ensure markets are functioning effectively to support the development of new replacement capacity where needed.

Key Reliability Findings
NERC | 2012 Long‐Term Reliability Assessment | November 2012
Page 11 of 335
Increased Risk of Capacity Deficiencies in ERCOT as Planning Reserve Margins Projected to Fall Below Targets Starting as early as next year, the Electric Reliability Council of Texas (ERCOT)29 Planning Reserve Margin is projected to be
below the NERC Reference Margin Level. Specifically, for 2013 the Anticipated Reserve Margin of 13.4 percent is below the
ERCOT planning target (NERC Reference Margin Level) of 13.75 percent.30 At these levels, the risk of insufficient generation
resources to meet peak demand increases beyond the accepted target. Throughout the 10‐year assessment period, the
Planning Reserve Margin continues to degrade and is projected to fall below five percent by 2017 and approximately zero
by 2020 if more resources are not acquired. By not meeting the Planning Reserve Margin target of 13.75 percent, ERCOT is
unable to meet a “one‐event‐in‐ten” planning target.31 With ERCOT Planning Reserve Margins below the NERC Reference
Margin Level, ERCOT does not appear to have sufficient resources during the summer peak to maintain target resource
adequacy levels at any point throughout the assessment period (Figure 7 and Table 2).
Figure 7: ERCOT Summer Planning Reserve Margins
Table 2: ERCOT Planning Reserve Margins ERCOT‐Summer 2013 2014 2015 2016 2017 2018 2019 2020 2021 2022
ANTICIPATED 13.40% 8.91% 6.02% 5.69% 3.72% 3.82% 2.33% 0.04% ‐1.02% ‐2.26% PROSPECTIVE 13.40% 8.91% 6.02% 5.69% 3.72% 3.82% 2.33% 0.04% ‐1.02% ‐2.26% ADJUSTED POTENTIAL 13.72% 9.75% 7.06% 7.03% 5.04% 5.34% 3.84% 1.52% 0.44% ‐0.82%
NERC REFERENCE ‐ 13.75% 13.75% 13.75% 13.75% 13.75% 13.75% 13.75% 13.75% 13.75% 13.75%
ERCOT‐Winter 2013 2014 2015 2016 2017 2018 2019 2020 2021 2022
ANTICIPATED 53.03% 52.33% 47.01% 48.32% 40.96% 42.49% 40.71% 39.72% 37.78% 32.35% PROSPECTIVE 53.03% 52.33% 47.01% 48.32% 40.96% 42.49% 40.71% 39.72% 37.78% 32.35% ADJUSTED POTENTIAL 55.34% 57.43% 53.33% 56.81% 49.02% 52.00% 50.20% 49.10% 47.03% 41.24%
NERC REFERENCE ‐ 13.75% 13.75% 13.75% 13.75% 13.75% 13.75% 13.75% 13.75% 13.75% 13.75%
The projected capacity deficiencies may result in an increased probability of interruptions of firm load to maintain
reliability. Reserve margins are calculated using a 50/50 peak demand forecast.32 Therefore, these values represent what is
considered a normal summer with a normal electric peak demand. However, the onset of extreme and sustained hot
temperatures may cause ERCOT to initiate rotating outages to maintain the reliability of the interconnection and prevent
uncontrolled, cascading outages. As reserve margins decrease below reliability targets, the probability of rotating outages
29 The Electric Reliability Council of Texas (ERCOT) is the Independent System Operator for the ERCOT Interconnection and schedules power on an electric grid that connects
40,500 miles of transmission lines and more than 550 generation units. Texas Reliability Entity (TRE) is the Regional Entity responsible for assessing the reliability of the bulk power system within ERCOT.
30 The ERCOT Planning Target of 13.75 percent is a planning target applied based on a probabilistic analysis performed by ERCOT. See 2010 ERCOT Long Term System Assessment: http://www.ercot.com/content/news/presentations/2010/ERCOT%202010%20Long%20Term%20System%20Assessment.pdf ERCOT’s Planning Target is included as the NERC Reference Margin Level in this assessment.
31 Reliability planning for the bulk power system, or resource adequacy planning, has historically been based strictly on Loss of Load Expectation (LOLE), or the number of firm load shed events an electric system expects over a period of one or more years. The electric power industry has for decades used an LOLE of 1 day of firm load shed in 10 years as the primary, if not sole means for setting target reserve margins and capacity requirements in such resource adequacy analyses. While this is not a regulatory requirement in ERCOT, this planning criteria is the generally accepted industry standard for maintaining sufficient resources to meet peak demands.
32 Forecasts cannot precisely predict the future. Instead, many forecasts report a baseline or most likely outcome, and a range of possible outcomes based on probabilities around the baseline or midpoint. Actual demand may deviate from the midpoint projections due to variability in key factors that drive electricity use. For these forecasts, there is generally a long‐run 50 percent probability that actual demand will be higher than the forecast midpoint and a long‐run 50 percent probability that it will be lower.
‐4%
‐2%
0%
2%
4%
6%
8%
10%
12%
14%
16%
2013 2014 2015 2016 2017 2018 2019 2020 2021 2022
Key Reliability Findings
NERC | 2012 Long‐Term Reliability Assessment | November 2012
Page 12 of 335
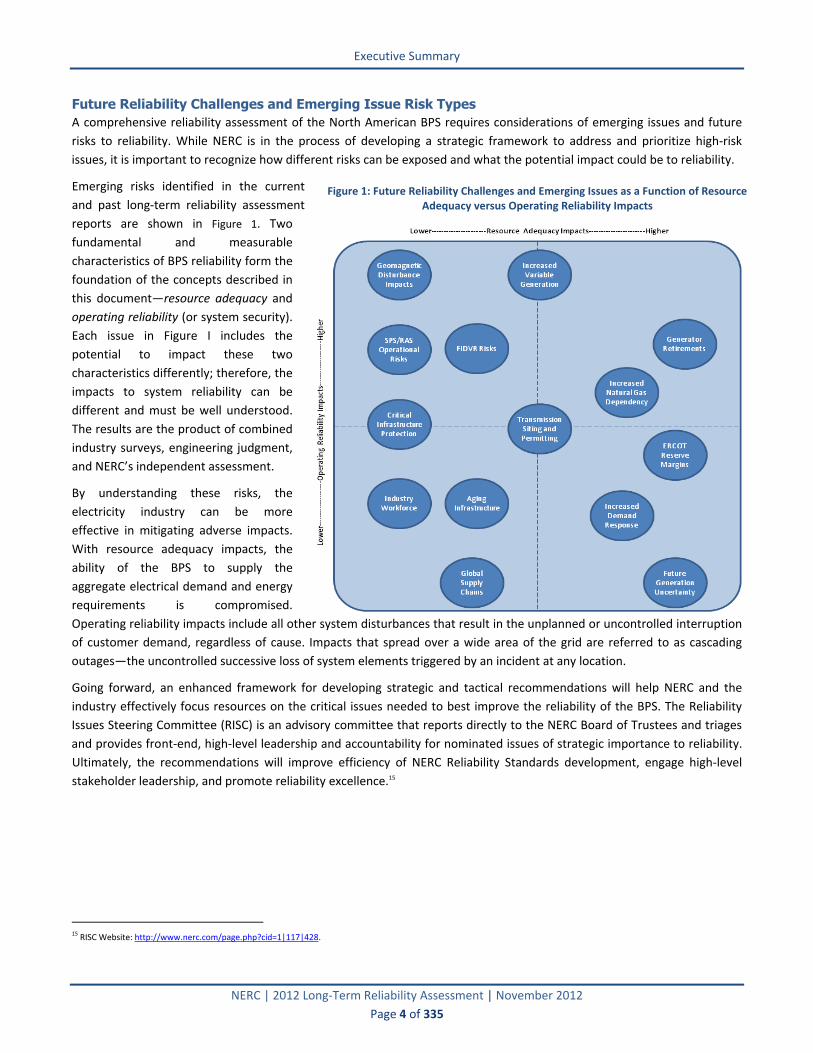
increases. Meeting resource adequacy targets in ERCOT over the next 10 years will largely be a function of the extent and
frequency of extreme and prolonged weather events and whether timely capacity additions can be integrated. Most
importantly, current forecasts do not appear to be sufficient to meet a “normal” peak demand forecast.33
With significant demand growth expected in Texas, even slight deviations from the peak demand forecast can significantly
impact the area’s flexibility on peak. Over the next 10 years, peak demand in ERCOT is expected to increase by almost
16,000 MW (or 23 percent), which is the largest growth across all NERC assessment areas (Figure 8).
Figure 8: ERCOT – Highest 10‐Year Projection for Peak Demand and Energy Growth
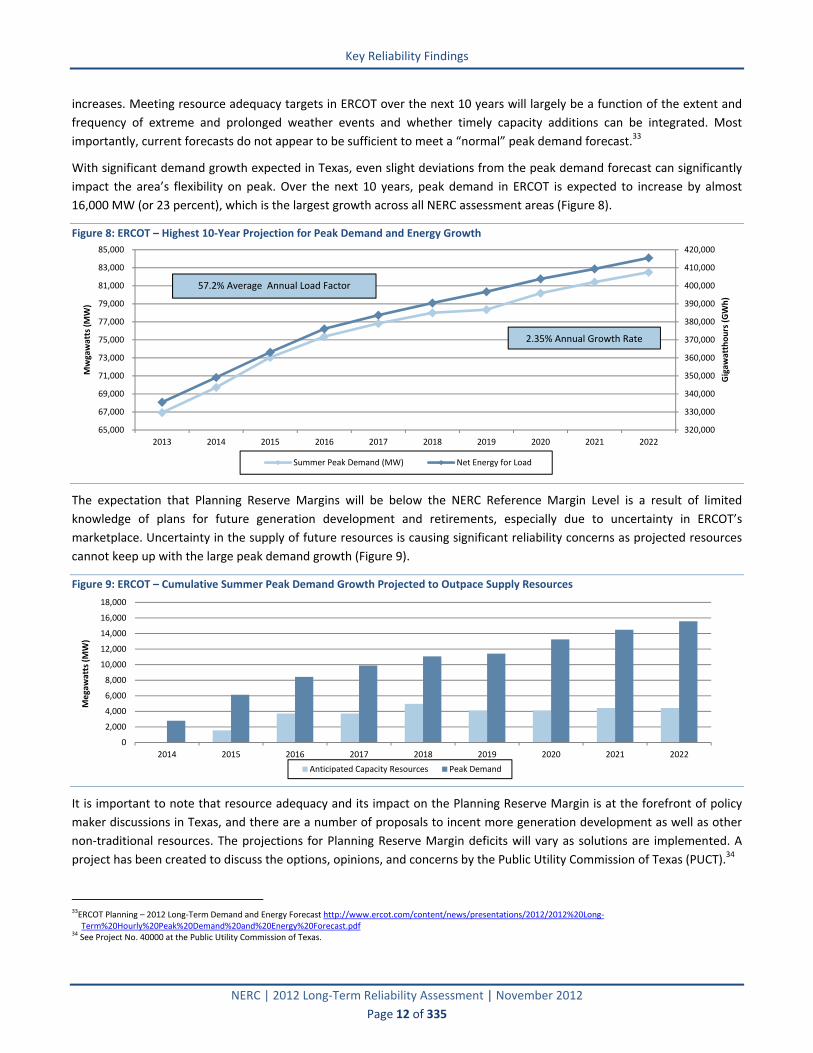
The expectation that Planning Reserve Margins will be below the NERC Reference Margin Level is a result of limited
knowledge of plans for future generation development and retirements, especially due to uncertainty in ERCOT’s
marketplace. Uncertainty in the supply of future resources is causing significant reliability concerns as projected resources
cannot keep up with the large peak demand growth (Figure 9).
Figure 9: ERCOT – Cumulative Summer Peak Demand Growth Projected to Outpace Supply Resources
It is important to note that resource adequacy and its impact on the Planning Reserve Margin is at the forefront of policy
maker discussions in Texas, and there are a number of proposals to incent more generation development as well as other
non‐traditional resources. The projections for Planning Reserve Margin deficits will vary as solutions are implemented. A
project has been created to discuss the options, opinions, and concerns by the Public Utility Commission of Texas (PUCT).34
33ERCOT Planning – 2012 Long‐Term Demand and Energy Forecast http://www.ercot.com/content/news/presentations/2012/2012%20Long‐
Term%20Hourly%20Peak%20Demand%20and%20Energy%20Forecast.pdf 34 See Project No. 40000 at the Public Utility Commission of Texas.
320,000
330,000
340,000
350,000
360,000
370,000
380,000
390,000
400,000
410,000
420,000
65,000
67,000
69,000
71,000
73,000
75,000
77,000
79,000
81,000
83,000
85,000
2013 2014 2015 2016 2017 2018 2019 2020 2021 2022
Gigaw
atthours (GWh)
Mwgawatts (MW)
Summer Peak Demand (MW) Net Energy for Load
57.2% Average Annual Load Factor
2.35% Annual Growth Rate
0
2,000
4,000
6,000
8,000
10,000
12,000
14,000
16,000
18,000
2014 2015 2016 2017 2018 2019 2020 2021 2022
Megawatts (MW)
Anticipated Capacity Resources Peak Demand
Key Reliability Findings
NERC | 2012 Long‐Term Reliability Assessment | November 2012
Page 13 of 335
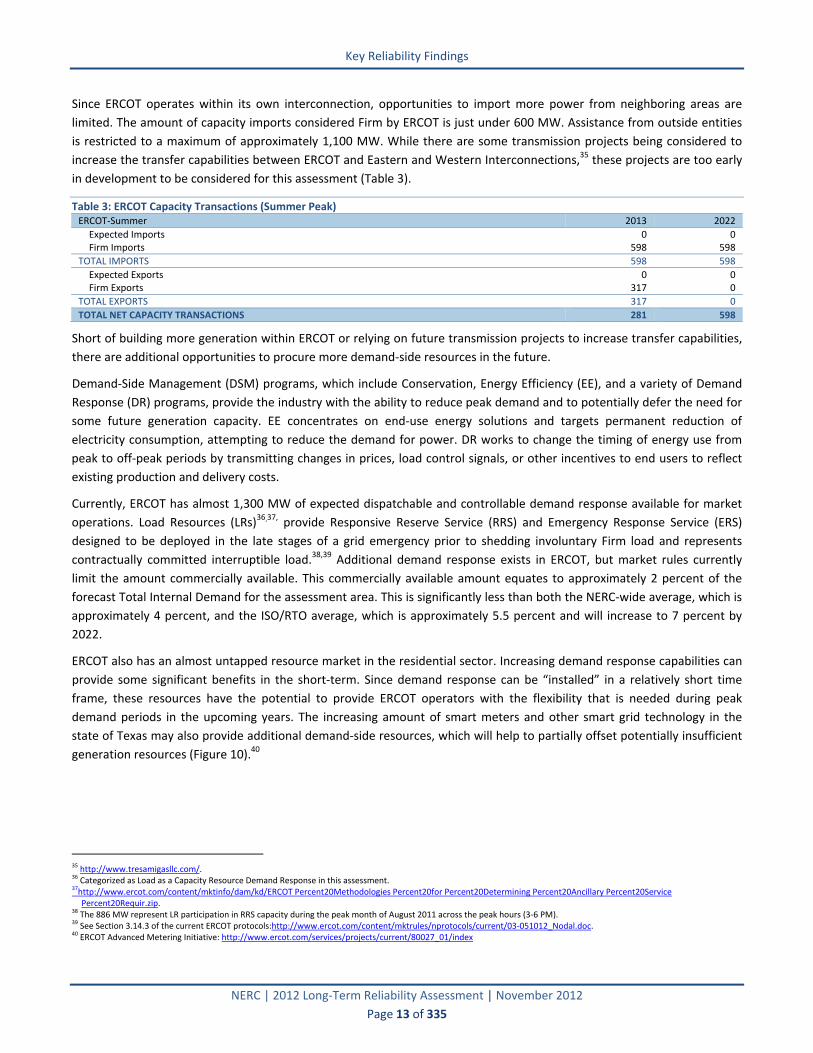
Since ERCOT operates within its own interconnection, opportunities to import more power from neighboring areas are
limited. The amount of capacity imports considered Firm by ERCOT is just under 600 MW. Assistance from outside entities
is restricted to a maximum of approximately 1,100 MW. While there are some transmission projects being considered to
increase the transfer capabilities between ERCOT and Eastern and Western Interconnections,35 these projects are too early
in development to be considered for this assessment (Table 3).
Table 3: ERCOT Capacity Transactions (Summer Peak) ERCOT‐Summer 2013 2022
Expected Imports 0 0Firm Imports 598 598
TOTAL IMPORTS 598 598
Expected Exports 0 0Firm Exports 317 0
TOTAL EXPORTS 317 0
TOTAL NET CAPACITY TRANSACTIONS 281 598
Short of building more generation within ERCOT or relying on future transmission projects to increase transfer capabilities,
there are additional opportunities to procure more demand‐side resources in the future.
Demand‐Side Management (DSM) programs, which include Conservation, Energy Efficiency (EE), and a variety of Demand
Response (DR) programs, provide the industry with the ability to reduce peak demand and to potentially defer the need for
some future generation capacity. EE concentrates on end‐use energy solutions and targets permanent reduction of
electricity consumption, attempting to reduce the demand for power. DR works to change the timing of energy use from
peak to off‐peak periods by transmitting changes in prices, load control signals, or other incentives to end users to reflect
existing production and delivery costs.
Currently, ERCOT has almost 1,300 MW of expected dispatchable and controllable demand response available for market
operations. Load Resources (LRs)36,37, provide Responsive Reserve Service (RRS) and Emergency Response Service (ERS)
designed to be deployed in the late stages of a grid emergency prior to shedding involuntary Firm load and represents
contractually committed interruptible load.38,39 Additional demand response exists in ERCOT, but market rules currently
limit the amount commercially available. This commercially available amount equates to approximately 2 percent of the
forecast Total Internal Demand for the assessment area. This is significantly less than both the NERC‐wide average, which is
approximately 4 percent, and the ISO/RTO average, which is approximately 5.5 percent and will increase to 7 percent by
2022.
ERCOT also has an almost untapped resource market in the residential sector. Increasing demand response capabilities can
provide some significant benefits in the short‐term. Since demand response can be “installed” in a relatively short time
frame, these resources have the potential to provide ERCOT operators with the flexibility that is needed during peak
demand periods in the upcoming years. The increasing amount of smart meters and other smart grid technology in the
state of Texas may also provide additional demand‐side resources, which will help to partially offset potentially insufficient
generation resources (Figure 10).40
35 http://www.tresamigasllc.com/. 36 Categorized as Load as a Capacity Resource Demand Response in this assessment. 37http://www.ercot.com/content/mktinfo/dam/kd/ERCOT Percent20Methodologies Percent20for Percent20Determining Percent20Ancillary Percent20Service
Percent20Requir.zip. 38 The 886 MW represent LR participation in RRS capacity during the peak month of August 2011 across the peak hours (3‐6 PM). 39 See Section 3.14.3 of the current ERCOT protocols:http://www.ercot.com/content/mktrules/nprotocols/current/03‐051012_Nodal.doc. 40 ERCOT Advanced Metering Initiative: http://www.ercot.com/services/projects/current/80027_01/index

Key Reliability Findings
NERC | 2012 Long‐Term Reliability Assessment | November 2012
Page 14 of 335
Figure 10: ERCOT – Demand Response Mix Less Than Industry Averages
While some enhancements have already been made—such as increasing the scarcity pricing cap—ERCOT, along with the
Public Utility Commission of Texas (PUCT), continues to identify and evaluate potential solutions to incentivize new capacity
resources. Some of these potential solutions include developing more demand‐side management resources with more
demand response programs and increasing conservation capabilities, implementing state‐mandated resource adequacy
targets, and enhancing existing market mechanisms, which may include further increasing scarcity pricing or integrating a
capacity component to the market structure.
The ongoing resource adequacy challenges in ERCOT are dynamic. The state regulator (PUCT) continues to be proactive in
developing solutions that will be most beneficial to the electric stakeholders across Texas.41 Most recently, changes in
wholesale market rules for ERCOT were adopted in an effort to increase incentives for new capacity investments and to
ensure reliability targets can be met.42
Ultimately, the resource adequacy concerns in ERCOT are more likely to impact the reliability of the BPS during peak
conditions or in an extreme event. Since capacity deficiencies are likely to result in having to implement emergency
operating procedures—which may include shedding firm load—uncontrolled cascading of the BPS is unlikely. However, the
likelihood of this impact is highly dependent on weather conditions and resulting impacts to peak demand, especially in the
summer. If actual peak demand increases beyond the summer forecast, the potential for rotating system outages grows.
Prolonged extreme conditions also increase the last several days during the summer peak season.
41 Resource Adequacy docket at the Public Utility Commission of Texas (Docket No. 40000) 42 http://www.puc.texas.gov/agency/rulesnlaws/subrules/electric/25.508/25.508.pdf
1.9% 1.9% 1.9% 1.9% 1.9% 1.9% 2.0% 2.1% 2.1% 2.2%
5.6%6.2% 6.3% 6.4% 6.6% 6.7% 6.7% 6.9% 6.9% 6.9%
4.0%4.4% 4.4% 4.5% 4.6% 4.6% 4.7% 4.8% 4.8% 4.8%
0
200
400
600
800
1,000
1,200
1,400
1,600
1,800
2,000
2013 2014 2015 2016 2017 2018 2019 2020 2021 2022
Megawatts (MW)
ERCOT ‐ Total Demand Response ERCOT ‐ Percentage of Total DR to Total Internal Demand
ISO/RTO Average ‐ Percentage of Total DR to Total Internal Demand NERC‐Wide Average ‐ Percentage of Total DR to Total Internal Demand

Key Reliability Findings
NERC | 2012 Long‐Term Reliability Assessment | November 2012
Page 15 of 335
Risk Assessment Summary Impacted Assessment Area(s)
ERCOT
Impact Type Resource Adequacy ‐ Significant generator retirements and lack of new resources can cause capacity deficiencies and may affect the power system’s ability to meet peak demands.
Magnitude of Impact
Degrading Reserve Margins: Anticipated Reserve Margin below NERC Reference Margin Level in every year and is zero by 2020 unless more capacity is added
Rotating System Outages: Capacity deficiencies can trigger emergency operating procedures that may include the shedding of firm load.
Likelihood of Impact With ERCOT Planning Reserve Margins projected to be below the NERC Reference Margin Level in 2013, the probability of a capacity deficiency is increased and will continue to increase throughout the assessment period unless more capacity is added.
Recommendations
NERC NERC should continue to assess plans and actions to address resource adequacy issues. Seasonal reliability assessments will provide a better short‐term view on the preparations to maintain reliability through the upcoming season.
ERCOT
ERCOT should consider alternative solutions to resource adequacy issues and provide a strategic plan outlining the measures it is taking to increase reserve margins and ensure reliability.
ERCOT should continue to provide information to the PUCT for continued development of policies in support of a solution to incease capacity resources.
Regulators NERC strongly recommends that the PUCT and ERCOT identify and implement near‐term and long‐term solutions to decrease the likelihood of a capacity deficiency. While there has been a significant amount of work done at the PUCT on addressing this issue,
43 there has been little progress on bringing new resources online.
43 Texas Public Utility Commission Proceeding to Ensure Resource Adequacy in Texas, http://www.puc.texas.gov/industry/projects/electric/40000/40000.aspx

Key Reliability Findings
NERC | 2012 Long‐Term Reliability Assessment | November 2012
Page 16 of 335
Resources Sufficient to Meet Reliability Targets in Most Areas NERC assesses resource adequacy by evaluating each Assessment Area’s Planning Reserve Margins—a deterministic
method based on traditional capacity planning.44 For the majority of the bulk power system, Planning Reserve Margins
appear sufficient to maintain reliability during the long‐term horizon. However, there are significant challenges facing the
electric industry that may shift industry projections and cause the NERC reference case to change, adding considerable
uncertainty not only in the long term, but in the short term as well. Where markets exist, signals for new capacity must be
effective for planning purposes, which can impact necessary lead times to construct new generation, as well as any
associated transmission. A transition to reduce environmental impacts through policy, specifically through regulatory
compliance deadlines, could ultimately conflict with existing planning and approval processes—both regional and
interregional.
Supply and Planning Reserve Margin projections in this assessment do not necessarily take into account all retirements of
generators due to all potential environmental regulations and other industry risks. While some generators have already
announced and planned for retirement, the majority of vulnerable generation resources have not finalized plans. A
significant amount of generation retirements can have a considerable impact on Planning Reserve Margins if new resources
and associated transmission cannot be constructed or acquired before the compliance deadlines. The results would drive
on‐peak Planning Reserve Margins lower than forecasted in this assessment. The uncertainty inherent in future generation
retirements is representative of the future supply forecast as well. Without a firm understanding of future generation
retirements, plans for replacement capacity are left uncertain (Figure 11).
Long‐term uncertainty can increase due to the growth in demand response, as well as shorter lead times for bringing on‐
line natural gas and renewable generation capacity. All of these drivers contribute to future uncertainty as system planners
can defer large capacity development projects for longer periods of time, allowing decisions to be made at a later time
without an impact to reliability.
Figure 11: Net Cumulative Change in Supply and Demand Forecasts; Supply Categories Show Different Degrees of Resource Uncertainty; Demand Growth Outpaces Supply
However, the long lead times for developing and constructing transmission are difficult to align with the shorter lead times
for resources. Although generating plant in‐service lead times have been significantly reduced (excluding environmental
permitting processes), transmission planning and approval necessary to integrate these new resources have not
experienced a similar lead‐time reduction (Figure 12).
44 Planning Reserve Margins in this report represent margins calculated for planning purposes (Planning Reserve Margins) not operational reserve margins that reflect real‐time
operating conditions. See Estimated Demand, Resources, and Reserve Margins for specific values.
0
20
40
60
80
100
120
2013 2014 2015 2016 2017 2018 2019 2020 2021 2022
Gigaw
atts (G
W)
Anticipated Prospective Adjusted Potential Net Internal Demand Total Internal Demand

Key Reliability Findings
NERC | 2012 Long‐Term Reliability Assessment | November 2012
Page 17 of 335
Figure 12: Future Net 10‐Year Capacity Change by Assessment Area
As mentioned earlier in this report, Planning Reserve Margins in ERCOT are projected to significantly decline over the
assessment period. Additionally, the approximately 5,000 MW of projected resources does not appear to be sufficient to
keep pace with peak demand growth. A considerable amount of Conceptual resources (which are included only as Adjusted
Potential Resources), appears to be the primary reason that Ontario, PJM, and the WECC assessment areas fall below the
NERC Reference Margin Level (Figure 13).
Figure 13: Assessment Areas with Anticipated Reserve Margins that fall below the NERC Reference Margin Level by 201445 (Left) and 2022 (Right)46
In general, long‐term planning (beyond five years) is inherently uncertain due to, among other things, varying market
practices and regulatory conditions, such as environmental regulations. In the areas where Anticipated Resources fall short
of meeting the NERC Reference Margin Level, Adjusted Potential Resources must be accelerated, if necessary. However,
Adjusted Potential Resources carry a higher degree of uncertainty because these resources are in the early stages of
45 When evaluating system requirements for new generation, SaskPower utilizes a mostlikely load forecast accounting for load risk to project demand requirements. This is not
based on a 50/50 probability. For the purpose of this study, utilization of a less conservative 50/50 load forecast probability would result in higher reserve margins ranging from approximately 16 to 23 percent. Furthermore, for the purpose of this assessment, the NERC Reference Margin Level is 11 percent (lower end of probabilistic EUE range) throughout the assessment period. Saskatchewan has planned for adequate resources to meet anticipated load throughout the assessment period.
46 Assessment Areas with no dates in parenthesis maintain Anticipated Reserve Margins that are above the NERC Reference Margin Level throughout the assessment period.
‐10,000
‐7,500
‐5,000
‐2,500
0
2,500
5,000
7,500
10,000
12,500
Megawatts (MW)
Anticipated Prospective Adjusted Potential
ERCOT
MRO‐SaskPower
(2014, 2016, 2020)
NPCC‐Ontario(2019‐2022)
PJM
WECC‐MEXW(2021 ‐2022)
ERCOT
MISO(2022)
WECC‐ROCK(2018 ‐2019,
2021‐2022)
WECC‐BASN(2019‐2022)
WECC‐CALN2018‐2022
WECC‐NWPP(2019‐2021)
MRO‐MAPP(2020‐2022)
WECC‐BC(2022‐2022)
MRO‐Manitoba(2022‐2022)
MRO‐SaskPower
(2014, 2016, 2020)

Key Reliability Findings
NERC | 2012 Long‐Term Reliability Assessment | November 2012
Page 18 of 335
development. Therefore, considerable progress in resource development must be made in order to bring these resources
online. Engineering studies, siting and permitting, and construction represent the activities required before these resources
can have reasonable expectation of going into service. Should peak demand grow faster than projected, additional
Conceptual resources should be developed, as they likely will be needed to maintain resource adequacy.
Risk Assessment Summary
Impacted Assessment Area(s)
ERCOT
MISO
MRO
NPCC‐Ontario
PJM
WECC
Impact Type Resource Adequacy ‐ Lower than anticipated capacity additions can contribute to a capacity shortage
Magnitude of Impact With the exception of ERCOT, all other impacted areas have at least five years to enhance plans to ensure sufficient resources are constructed or procured.
Likelihood of Impact
The likelihood of an event that impacts reliability is greatly reduced if proper planning processes sufficiently reflect resource uncertainties
Conceptual resources are generally in early planning stages and have a high degree of uncertainty associated with project completion
Recommendations
NERC NERC should consider evaluating generator uncertainties using a probabilistic risk basis, rather than a deterministic approach in its reliability assessment.

Key Reliability Findings
NERC | 2012 Long‐Term Reliability Assessment | November 2012
Page 19 of 335
Increased Dependence on Natural Gas for Electricity Generation The growth in natural gas demand within the electric sector has important implications on other gas‐consuming sectors,
such as commercial and residential heating or industrial manufacturing. Increased dependence on natural gas in the electric
sector has increased the need for all gas consumers, electric system planners and operators, and policy makers to focus
more sharply on the interaction between the electric and gas industries. For a variety of reasons, including the adoption of
highly efficient combined‐cycle technology by the electric power industry and the emergence of shale gas, both of which
have altered the relative economics of gas‐fired generation, the dependence on natural gas by the electric power sector has
increased significantly. Trends in fuel‐mix changes highlighted in this assessment identify gas‐fired generation as the
premier choice for new capacity with almost 100 GW expected over the next 10 years, which represents almost half of all
new generation capacity (Figure 14).
Figure 14: NERC‐Wide Future Gas‐Fired Capacity Serves Over Half the Projected Peak Total Internal Demand by 2016
Increasing gas‐fired generation to meet electric loads in the future does not come without dependency risks. Increased
dependence on natural gas can amplify the bulk power system’s exposure to disruptions of fuel supply, transportation, and
delivery. In order to accommodate a significant amount of gas‐fired generation, BPS planners must understand the different
functions gas‐fired generation will perform (i.e., baseload and midrange support versus load following and peaking
support). Risks to reliability must also be addressed through the three primary timeframes of system planning and
operations: Long and Short‐Term Planning (1–10 years), Operational Planning (1 day–1 year), and Operations (1 day–real‐
time) (Table 4).
Table 4: Reliability Considerations for Accommodating Large Amounts of Gas‐Fired Generation Long‐ and Short‐ Term Planning Operational Planning Operations
Gas supply and fuel security Seasonal and day‐ahead observability Information sharing and visibility
Dual‐fuel capabilities Coordinated operational procedures Communication and information exchange
Fuel transportation expectations Coordinated outage schedules Emergency operating procedures
Generator availability Increasing flexibility
Resource planning
Reliability assessment and resource adequacy studies
NERC’s Phase II effort on gas dependency targets these very issues. The report focuses on the different risks that can affect
BPS reliability, identifying practices that minimize vulnerabilities, and identifying approaches where coordinated inter‐
industry efforts could provide enhanced system reliability.
A key area of focus is the need for increased coordination between the two industries, particularly at a regional level. It is
important to understand the fundamental differences between how the two industries plan for the long term,
communicate with each respective stakeholder, and operate within different regulatory frameworks. While solutions to
mitigate increasing risks will be vast and Region‐specific, NERC should ensure that enhancements to planning processes will
48.2% 48.2%
49.9%
51.6%
52.2% 52.2% 52.0%
51.7% 51.5%51.1%
400
410
420
430
440
450
460
470
480
490
500
2013 2014 2015 2016 2017 2018 2019 2020 2021 2022
Gigaw
atts (G
W)
Conceptual Future‐Planned % Gas Capacity

Key Reliability Findings
NERC | 2012 Long‐Term Reliability Assessment | November 2012
Page 20 of 335
account for expected uncertainty in gas‐fired generation performance as well as potential contingencies on the pipeline
network. Furthermore, operational procedures should include a certain level of formalized coordination with the gas
pipeline industry, with specific attention on emergency operating procedures during extreme events. Each Region will have
unique issues to resolve; therefore, efforts to reduce these risks will vary. These new challenges include a reduction of fuel
supply diversification within the power industry, incorporating risks into planning processes and operational procedures,
and the need to adapt fuel procurement, transportation, and storage strategies (Figure 15).
Figure 15: Regional Differences Will Require Region‐Specific Solutions47
The amount of gas‐fired capacity additions also contributes to the regional differences and vulnerabilities that could impact
BPS reliability in the future. With natural gas as the premier fuel for new generation, gas‐fired capacity additions are largely
a function of forecasted peak demand increases and the amount of coal and oil‐fired generation within a given assessment
area. With significant generator retirements expected in the forecast, PJM is projecting approximately 40,000 MW of new
gas‐fired generation; however, over 37,000 MW are Conceptual and still in the early planning stages (Figure 16). No more
than 5,000 MW are either Planned or Conceptual in all other areas.
47 Source: Ventyx Velocity Suite, An ABB Company; modified by NERC staff to reflect NERC footprint. Text boxes added by NERC staff.

Key Reliability Findings
NERC | 2012 Long‐Term Reliability Assessment | November 2012
Page 21 of 335
Figure 16: Future Gas‐Fired Capacity Serves Over Half the Projected Peak Demand
Historically, the power industry has relied heavily on fuel diversification for generating electricity. While there are regional
differences, diversification strategies have had a number of significant benefits for the power industry. However, with the
projected increases in capacity of gas‐fired generation along with the projected reductions in coal capacity, gas‐fired
generation will be called upon more often. Gas‐fired generation will be used to meet base, intermediate, and peak load
requirements, effectively increasing overall capacity factors. According to its 2012 Annual Energy Outlook,48 the Energy
Information Administration (EIA) is projecting an approximately 110 GWh increase in gas‐fired generation, effectively
increasing gas‐fired generation to over 27 percent of all electric generation in 2015 and trailing off to 25 percent in the long
term (Figure 17).
Figure 17: Gas‐Fired Generation Significantly Increases Over Next Three Years
As shown in the NERC Phase I study on increasing gas dependencies, reliability challenges are more likely to occur during
the winter season.49 While electric generation is generally able to schedule and secure gas during the summer to meet
seasonal peak demand, this flexibility decreases during winter months when pipelines tend to peak and firm transportation
customers have scheduled their full entitlements. Cold weather can also be responsible for increased infrastructure and
supply disruptions, which are generally caused by freezing. Risks to gas well‐heads, generators, and pipeline infrastructure
due to freezing can expose the electric industry to significant capacity shortages. It is important to understand that while
firm gas transportation significantly decreases the likelihood that fuel delivery will be curtailed, extreme events, such as
well‐head freeze‐offs causing decreased gas production (a “force majeure” event),50 could potentially lead to common‐
mode failures of a significant amount of gas‐fired generators. Additionally, pipeline customers with gas use is designated as
48 U.S. Energy Information Administration's (EIA's) Annual Energy Outlook 2012 (AEO2012): www.eia.gov/forecasts/aeo/pdf/0383(2012).pdf. 49 2011 Special Assessment Report: A Primer of the Natural Gas and Electric Power Interdependency in the United States,
http://www.nerc.com/files/Gas_Electric_Interdependencies_Phase_I.pdf 50 Such agreements in fuel contracts relieve the lessee from liability for breach, if the party's performance is impeded as the result of a natural cause that could not have been
anticipated or prevented. This act of God must completely prevent performance and must be unanticipated.
0
5,000
10,000
15,000
20,000
25,000
30,000
35,000
40,000
45,000
Mwgawatts (MW)
Conceptual Planned
25%
26%
27%27%
26%26% 26%
26%25%
25%
900
925
950
975
1,000
1,025
1,050
1,075
1,100
1,125
1,150
2013 2014 2015 2016 2017 2018 2019 2020 2021 2022
Gigaw
atthours (GWh)
Natural Gas Generation (GWh) Natural Gas Generation Mix (% of Total)

Key Reliability Findings
NERC | 2012 Long‐Term Reliability Assessment | November 2012
Page 22 of 335
“human use” (typically local distribution companies and some commercial customers) always receive priority over electric
generation, which during emergencies and restoration efforts can have an impact to gas‐fired generation—even with
pipelines that have Firm capacity rights.
Dual fuel capabilities and a variety of storage options may help bridge the gap between the uncertainties of gas availability
during extreme events and maintaining a reliable source of capacity available to meet seasonal peak demands. Ultimately,
the right balance of firm pipeline capacity, dual‐fuel capabilities, and a variety of storage options will be regionally
dependent. Factors such as market structure, geography, fuel mix, and pipeline infrastructure will determine the extent of
gas dependency risks as well as what solutions are available.
Improvements in system reliability may be realized from having sufficient back‐up, dual‐fuel switching capabilities.
Obstacles to achieving such benefits include operational preparedness and state, federal, and provincial environmental
regulations, which effectively limit the amount of oil that can be burned. Current policies and rules that regulate back‐up oil
use and emissions for electric generation may need to be evaluated to ensure dual‐fuel capability can be maintained during
emergencies or other extreme conditions. Additionally, planning processes should consider back‐up fuel inventories,
changes in ramp and unit power capabilities, and the time requirements for fuel switch‐over. Without considering this
information, the amount of available dual‐fuel generation projected to be available may be overstated. Currently, 125 GW
of gas‐fired generation has dual‐fuel capabilities, and 58 percent of gas‐fired generation is tied to firm supply,
transportation, and delivery (Figure 18).
Figure 18: NERC‐Wide Gas‐Fired Generation Fuel Services and Dual Fuel Capabilities51
In early February 2011, a cold‐weather event impacted a significant amount of electric generation in Texas, Arizona, and
New Mexico.52 While much of the impact was related to insufficient weatherization, there were some issues with gas supply
and transportation. For the southwest as a whole, 67 percent of the generator failures (by MWh) were due directly to
weather‐related causes, including frozen sensing lines, frozen equipment, frozen water lines, frozen valves, blade icing, and
low temperature cutoff limits. At least another 12 percent were indirectly attributable to the weather (occasioned by
natural gas curtailments to gas‐fired generators and difficulties in fuel switching). Natural gas production losses stemmed
principally from three causes: gas well‐head freeze‐offs, icy roads limiting field crew’s access to remote well‐head sites, and
rolling electric blackouts or customer curtailments impacting gas production equipment.
51 This analysis shows results of where fuel service is known. Areas which did not provide results, and may have unknown fuel service, are not shown. 52 Joint FERC / NERC Report on Outages and Curtailments During the Southwest Cold Weather Event of February 1‐5, 2011, http://www.ferc.gov/legal/staff‐reports/08‐16‐11‐
report.pdf.
0
10
20
30
40
50
60
70
80
90
Fuel Service
Dual Fuel
Fuel Service
Dual Fuel
Fuel Service
Dual Fuel
Fuel Service
Dual Fuel
Fuel Service
Dual Fuel
Fuel Service
Dual Fuel
Fuel Service
Dual Fuel
Fuel Service
Dual Fuel
Fuel Service
Dual Fuel
Fuel Service
Dual Fuel
Fuel Service
Dual Fuel
ERCOT FRCC MISO MRO‐MAPP MRO‐SaskPower
NPCC‐New England
NPCC‐Ontario PJM SERC (E,N,SE,W)
SPP WECC‐Total
Gigaw
atts (G
W)
Firm Non‐Firm

Key Reliability Findings
NERC | 2012 Long‐Term Reliability Assessment | November 2012
Page 23 of 335
While extreme cold weather is less common in the Southwest, these conditions can arise every few years, without
substantial warning. Significant progress has been made to both the gas and electric industries’ preparations for managing
extreme cold weather events. Weatherization and enhanced emergency operating procedures have been implemented
because of the event and will be highlighted in the 2012/2013 Winter Reliability Assessment.53
It is inherent in the electric industry's role of providing reliable electricity to its customers to manage risks. However, it is
important to recognize that reliability comes at a cost, and the electric industry must maintain reliability, regardless of the
constantly shifting resource mix. The issue of deciding between reliability and cost must be addressed appropriately by all
participants of both industries. Industry regulators have a paramount responsibly to find common ground.
NERC will soon release a second phase of its ongoing assessment of the increased dependency on natural gas‐fired
generation.54 In its role of continuing to assess the reliability of the BPS through periodic and special reliability assessments,
NERC realized the necessity to identify more specific reliability needs. The NERC Phase II effort on increasing gas
dependency focuses on the different vulnerabilities that can affect BPS reliability, identifying ways that could minimize
those vulnerabilities, and identifying approaches in which coordinated inter‐industry activities could provide enhanced
system reliability. While solutions will be vast and Region‐specific, NERC must ensure that enhancements to planning
processes are made to account for any expected uncertainty in gas‐fired generation performance as well as potential
contingencies on the pipeline network. Furthermore, operational procedures must include a certain level of formalized
coordination with the gas pipeline industry, with specific focus on emergency procedures during extreme events.
Risk Assessment Summary
Impacted Assessment Area(s)
ERCOT
NPCC‐New England
MISO
PJM
Impact Type Resource Adequacy ‐ Significant (common‐mode) generator outages can cause capacity deficiencies.
Operating Reliability ‐ Transmission system impacts could manifest from significant gas‐fired generator outages.
Magnitude of Impact
During extreme cold weather conditions, gas‐fired generation with neither firm transportation nor dual‐fuel capabilities may not be available to produce electricity.
A significant gas supply or pipeline disruption can cause a substantial portion of gas‐fired generation to be unavailable.
Likelihood of Impact
Highly dependent on winter weather conditions
Increase in gas generation and capacity is expected by 2015
In the past 40 years, at least one significant event has occurred during each 10‐year period—at least two major events occurred between 2002 and 2011.
Recommendations
NERC
Identify guidelines, recommendations, alerts, or enhancements to reliability standards that support minimizing risks associated with natural gas dependencies.
Consider incorporating fuel risks and capacity impacts into resource adequacy and reliability assessments.
Enhance seasonal assessments of gas‐fired generation availability by identifying fuel transportation types and dual‐fuel reliability metrics.
Assess industry plans and procedures to mitigate severe fuel disruptions.
Planning Coordinators, Reliability Coordinators and Balancing Authorities
Enhancements to BPS planning processes that account for uncertainty in gas‐fired generation performance should be considered.
Operational procedures should include a certain level of formalized coordination with the gas supply and pipeline industry, as well as emergency procedures during extreme events
Regulators
State regulators should evaluate the associated risks of gas supply and transportation disruptions and ensure these risks are consistent with a level of risk that is known, expected and planned.
Current policies and rules that regulate back‐up oil use and emissions for electric generation may need to be evaluated to ensure dual‐fuel capability can be maintained during emergencies or extreme conditions.
53 NERC reliability assessment reports: http://www.nerc.com/page.php?cid=4|38.
54 NERC Gas and Electric Interdependency activities: Phase I and II study scope: http://www.nerc.com/docs/pc/ras/Draft2011GasStudyScope.pdf.

Key Reliability Findings
NERC | 2012 Long‐Term Reliability Assessment | November 2012
Page 24 of 335
Long-Term Generator Maintenance Outages for Environmental Retrofits A significant retrofit effort is expected over the next 10 years in order to comply with federal and state‐level environmental
regulations. A majority of environmental controls are expected to be put in place to meet air regulations by April 2016. In
total, 339 unit‐level foss‐fired generation retrofits will be needed, totaling about 160 GW.55 However, there is still
significant uncertainty in the “unconfirmed” values as maintenance schedules have not yet been fully evaluated by all areas
(Figure 19).
Figure 19: NERC‐Wide Confirmed & Unconfirmed (Projected) Maintenance Outages for Environmental Control Retrofits through 2016
Complying with proposed environmental regulations may result in generation capacity not being available during shoulder
months and off‐peak times during the operating day in the near‐term (2013–2016).56 Within this timeframe, some
generators may not have enough time to acquire permits, procure engineering services, design equipment, and
systematically shut down units for the purpose of retrofitting, while concurrently meeting reliability goals. Deactivations or
temporary de‐ratings associated with generating unit retrofits may avoid the need to procure replacement resources, but
they introduce additional complexities with scheduling outages to avoid temporary shortages that may occur if too much
capacity is taken out of service at the same time.
The challenge of timing and scheduling numerous major construction projects, both generation and transmission, to
maintain system reliability and avoid having key facilities unavailable at the same time, include:
Compressed timelines
Uncertainty related to scope of materials, equipment needs, and availability of skilled labor for these projects
Market forces outside of the entity’s control that could impact cost and delivery times of long lead items (fans,
large motors, transformers, fabricated equipment, etc.)
Outage durations, some as long as 12 weeks at a time, to cover tie‐ins and fan upgrades for baghouses and SCRs
Conflicts in outage windows due to the coordination of new compliance‐related projects/outages and existing
transmission construction programs and outages, located internally and externally to an area’s service territory
Managing reliability risks for units that will share common environmental controls such as common scrubbers or
baghouses
55 These values do not include retrofits that would be needed to meet 316(b) compliance, as this rule has not yet been finalized and plans have not yet been established.
Additionally, areas marked with a (*) were unable to provide this data at this time as the information is not available. In these cases, estimates from NERC’s 2011 Long‐Term Reliability Assessment were used and potential retrofits for 316(b) are included.
56 The shoulder months of the electric year are from March 1 through May 30 and October 1 through November 30.
59,255
33,669
21,08119,934
7,9845,590
4,634 4,0341,133 1,120
0
10,000
20,000
30,000
40,000
50,000
60,000
PJM* MISO SPP ERCOT* NPCC‐NYISO* WECC‐TL SERC FRCC NPCC‐ISO‐NE MAPP*
Megawatts (MW)
Confirmed ‐ Total Peak Capacity (MW) Unconfirmed ‐ Total Peak Capacity (MW)
158,434 MW, 339 Electric Generation Units

Key Reliability Findings
NERC | 2012 Long‐Term Reliability Assessment | November 2012
Page 25 of 335
Generators that are required to retrofit their plants with environmental controls and have chosen to remain online must be
in compliance with MATS by 2016 or submit a request for a waiver or extension—specifically, an Administrative Order.57
With a significant amount of retrofits to be completed from now (late 2012) through 2016, reduced system flexibility during
off‐peak periods could be encountered. Given the window for completing retrofits, many affected units may need to take
long‐term maintenance outages concurrently. Taking multiple units out of service for extended outage periods can
aggravate resource adequacy and reduce system flexibility and dispatch options, especially during seasons considered “off‐
peak”. Therefore, outage and retirement coordination must be a priority for the industry. If a reliability critical generator
cannot come into compliance with the MATS by April 2016, it may request from the EPA an Administrative Order to come
into compliance by as late as April 2017, following the pathway described in the December 16, 2011 policy document.
The EPA will rule on a generator’s requests for an Administrative Order (AO) to operate in noncompliance with the EPA’s
Mercury and Air Toxics Standards (MATS).58 As stated in the EPA Policy Memorandum, on a case‐by‐case basis, the EPA may
rely on identification or analysis of reliability risks upon the advice and counsel of reliability experts, including, but not
limited to FERC, RTO/ISOs, Planning Authorities, NERC, and state public service or utility commissions. However, the
decision to grant an AO to an owner/operator rests entirely with EPA. NERC, in concert with the Regional Entities, may be
requested by the EPA to provide a reliability assessment in relation to a pending AO request. This assessment may include
review of the recommendations, a resource adequacy assessment of the given area, gathering of additional information,
and additional study if required. Further, it may include all requirements for a reliable power system, including impacts on
Planning Reserve Margins, effects on local, regional, and interconnection‐wide operational reliability, and review of the
expected operating procedures that system planners and operators will use to address NERC Reliability Standards. These
studies include a measure of resource adequacy, power flow, transient stability, and system restoration plans. Plans for
transmission outage coordination (inter‐ and intra‐regional) may also be needed to implement necessary transmission
upgrades. To the extent that potential violations to NERC Reliability Standards are identified, FERC may also provide
comments to serve as guidance for EPA on whether there might be a violation of a Reliability Standard.59
Compressed compliance deadlines may challenge the electric industry’s planning horizons, existing planning processes, and
typical construction schedules. Successful implementation of environmental regulation compliance will be highly
dependent on the ability of units needed for reliability to obtain the necessary time needed to comply with certain
requirements. Given the timelines for compliance, many of the affected units may need to take maintenance outages
concurrently. The need to take multiple units out of service on extended scheduled outages can exacerbate resource
adequacy concerns and reduce needed flexibility, even during off‐peak periods. Outage coordination must be a priority to
avoid resource adequacy concerns during maintenance periods.
The timelines for retrofits vary by technology. Some retrofit technologies, such as flue gas desulfurization (FGD) and
selective catalyst reduction (SCR), are riskier than others because of the length of time it takes to complete the work
compared to the deadlines for compliance. It may be possible to receive an additional one‐year AO beyond the first‐year
extension, extending the compliance deadline into 2017. This second‐year extension will likely be limited to unique cases,
but does offer the flexibility that is needed to ensure generators that are critical for reliability can operate.
Existing authorities should be used to provide extensions where justified. Unit outages for maintenance due to retrofits will
affect both the capability to retrofit existing plants to meet required emission targets and the ability of industry to
coordinate the necessary outages in order to perform the retrofit. For example, to meet the MATS rule, one possible
retrofit solution is to install an air scrubber. It takes approximately 18 months—including planning and installation—for an
air scrubber to be installed into an existing facility, as scrubbing equipment is unique to each generator (Figure 20).
57 http://www.epa.gov/mats/pdfs/EnforcementResponsePolicyforCAA113.pdf 58 The EPA’s Enforcement Response Policy For Use Of Clean Air Act Section 113(a) Administrative Orders In Relation To Electric Reliability And The Mercury and Air Toxics
Standard (Dec. 16, 2011), http://www.epa.gov/compliance/resources/policies/civil/erp/mats‐erp.pdf. 59 The Commission’s Role Regarding the EPA’s Mercury and Air Toxics Standards: http://www.ferc.gov/whats‐new/comm‐meet/2012/051712/E‐5.pdf.

Key Reliability Findings
NERC | 2012 Long‐Term Reliability Assessment | November 2012
Page 26 of 335
However, scrubbers are not expected to be the premier choice for environmental controls at this point in time as some
Regions have indicated that direct sorbent injection (DSI) has been selected for a majority of known retrofits (activated
carbon injection (ACI) has also been selected). Therefore, longer‐term maintenance outages spanning over a year are only
expected for a fraction of retrofits.
Figure 20: Retrofit Project Timelines Relative to MATS Compliance Deadlines
With the limited outage windows before the 2016 compliance deadline, it will be increasingly important for the outage
coordination groups to have as much information as possible. In MISO, the development of a monthly maintenance margin
will aid in outage scheduling and will be updated seasonally to reflect current information.60 As part of MISO’s efforts to
best manage an expected influx of outage requests associated with recent environmental regulations, MISO conducted an
outage limit analysis to determine acceptable monthly outage levels that can be allowed to maintain reliable transmission
operations.61
MISO’s supply chain analysis,62 conducted by The Brattle Group, concluded that the March 2015 timeline requires more
construction than the industry has seen in the past and the greatest unknown risk is the amount of skilled labor available to
perform the retrofits. In addition, the type of technology necessary to bring a unit into compliance may require lengthy unit
outages that may run past the compliance deadline.
In PJM, significant uncertainty remains in the projections for maintenance outages. However, PJM will continue to
coordinate closely with BPS owners and operators in the area to analyze the impact of retiring generation, planned outage
to perform retrofits, and transmission maintenance outages required to reliably take retiring units out of service.
Generation Owners have indicated that while there appears to be sufficient time to complete environmental retrofits, if
there are delays in scheduling retrofit outages due to system constraint issues or capital budget limitations, then there may
be significant challenges in completing the retrofit outages in the required time to comply with environmental regulations.
In SPP, it is expected that the impact of retrofits will constrain the availability and increase the costs of qualified labor,
materials, and heavy equipment. These constraints, as well as the need to coordinate outage scheduling and complete
localized transmission reinforcement projects, will likely result in the compliance deadlines for certain units be extended.
SPP RTO is maintaining regular contact with individual entities to ensure that any specialized assessments can be completed
in time to identify and address circumstances in which additional time may be warranted. Surveys are still being completed
regarding expected retrofit and retirement plans, and SPP RTO expects to complete an initial analysis of this issue by the
end of the year.
60 https://www.midwestiso.org/Library/Repository/Communication%20Material/Power%20Up/EPA_Outage%20Limits%20Analysis.pdf. 61 https://www.midwestiso.org/Library/Repository/Communication%20Material/Power%20Up/EPA_Outage%20Limits%20Analysis.pdf. 62 https://www.midwestiso.org/Library/Repository/Communication Percent20Material/Key Percent20Presentations Percent20and Percent20Whitepapers/Supply
Percent20Chain Percent20and Percent20Outage Percent20Analysis Percent20of Percent20MISO Percent20Coal Percent20Retrofits Percent20for Percent20MATS.pdf
2012 2013 2014 2015 2016 2017 2018 2019
DSI
ACI
Baghouse
FGD‐Dry
SCR
FGD‐Wet
Minimum Time for Design, Permit, Construction and Installation Maximum Time for Design, Permit, Construction and Installation
MATS Compliance Deadline (with no Extension)
MATS Compliance Deadline(with 1‐year Extension)

Key Reliability Findings
NERC | 2012 Long‐Term Reliability Assessment | November 2012
Page 27 of 335
Risk Assessment Summary
Impacted Assessment Area(s)
MISO
PJM
SPP
Impact Type
Resource Adequacy ‐ Longer than expected maintenance outages can result in off‐peak resource adequacy concerns.
Operating Reliability ‐ The aggregated impact of multiple unit outages, combined with unforeseen system stresses, can impact system stability.
Magnitude of Impact 339 generation unit retrofits, comprising of almost 160 GW of capacity
Likelihood of Impact
Dependent on delays in retrofits and scheduled maintenance
While there are often procedures to manage and coordinate generator outages, unforeseen events can reduce the system operator’s ability to perform corrective actions.
Recommendations
NERC NERC should evaluate the retrofit efforts of generators in North America within its seasonal reliability assessment.
Regulators ERCOT should continue to consider alternative solutions to the resource adequacy issues.
Regulators should provide extensions where justified by independent authorities on electric reliability.

Key Reliability Findings
NERC | 2012 Long‐Term Reliability Assessment | November 2012
Page 28 of 335
Renewable Resource Additions Introduce New Planning and Operational Challenges Renewable resources are growing in importance in many areas of North America as the number of new facilities continues
to increase. Nameplate renewable capacity (including wind, solar, hyro, biomass, geothermal, and pumped storage) will
grow by approximately 60 GW by 2022, outpacing any other resource (Figure 21). Wind contribution during the peak is
typically only a fraction of the nameplate capacity, which grows by over 36 GW during the assessment period. Solar and
bioass will grow by 13.4 and 3.1 GW, respectively. A majority of the 580 GW of geothermal capacity additions will occur in
the first two years of the assessment period (by 2014). The same case applies to pumped storage resources, which will grow
to 466 MW by 2014 and remain constant through 2022.
Figure 21: Cumulative Future‐Planned Nameplate Renewable Capacity Additions Compared to Non‐Renewable Capacity Additions
Overall capacity contribution from renewable resources will continue to grow, especially as significant additions are
projected for both wind and solar throughout North America. In 2012, renewable generation, including hydro, made up
15.6 percent of all on‐peak capacity resources and is expected to reach almost 17 percent in 2022 (Figure 22). Contributing
to this growth is approximately 20 GW of on‐peak planned capacity and an additional 21.5 GW of on‐peak Conceptual
capacity. It is vital that these variable resources are integrated reliably and in a way that supports the continued
performance of the BPS and addresses both planning and operational challenges.63
Managing the variability of wind and solar resources will require more flexibility in the power system. The changes in the
bulk power system flows from both the variable generation and demand response implementation must be better
understood. The NERC Integrating Variable Generation Task Force (IVGTF) has completed significant work over the past
three years to address enhanced planning and operational reliability considerations when accommodating large amounts of
variable generation.64 The scope of work has addressed not only system‐specific considerations, but also those from a
regional and North American perspective.
63 Accommodating High Levels of Variable Generation: Summary Report: http://www.nerc.com/files/Special%20Report%20%20
Accommodating%20High%20Levels%20of%20Variable%20Generation.pdf. 64 Completed variable generation assessments and recommendations produced by the IVGTF: http://www.nerc.com/page.php?cid=4|61
0
10,000
20,000
30,000
40,000
50,000
60,000
70,000
2012 2013 2014 2015 2016 2017 2018 2019 2020 2021 2022
Megawatts (MW)
Gas Nuclear Other/Unknown Wind Solar Hydro Biomass Geothermal Pumped Storage

Key Reliability Findings
NERC | 2012 Long‐Term Reliability Assessment | November 2012
Page 29 of 335
Figure 22: On‐Peak Future‐Planned Renewable Capacity – Cumulative Net Change
Current 2022 Planned 2022 Planned & Conceptual
Capacity Share Capacity Share Change Capacity Share Change
Hydro 124,332 77.50% 128,742 71.01% 4,410 131,175 58.50% 6,843 Pumped Storage 21,697 13.53% 22,162 12.22% 465 22,627 10.09% 930 Geothermal 2,584 1.61% 3,333 1.84% 749 4,082 1.82% 1,498 Wind 5,219 3.25% 11,505 6.35% 6,286 32,105 14.32% 26,886 Biomass 4,780 2.98% 6,736 3.72% 1,956 8,692 3.88% 3,912 Solar 1,809 1.13% 8,833 4.87% 7,025 25,555 11.40% 23,747
TOTAL 160,420 100.00% 181,311 100.00% 20,891 224,235 100.00% 63,815
A key goal for power system planners is not only to determine how much capacity there is on a system, but also to
determine if that capacity can be reasonably expected to perform and operate on peak. Because wind power output is
often inversely correlated with demand in some regions, capacity output of wind plants during times of peak demand
generally amounts to a fraction of nameplate capacity (Figure 23). For example, the “expected on‐peak capacity” can
account for as little as 3 percent of a given area’s entire nameplate wind capacity. As noted by NERC in prior assessments,
consistent methods to determine on‐peak wind capacity are needed to ensure uniform measurement and resource
adequacy assumptions.65 As wind generation becomes a more significant contributor to an area’s capacity mix, probabilistic
planning techniques will be needed. Probabilistic planning techniques indicate that in most areas wind’s contribution to
capacity are generally in the range of 5 to ten percent of the wind energy nameplate capacity.66 Currenly, only MISO and
ERCOT have a probabilistic basis for determining this factor. More consistency is being achieved due to more experience
with larger portfolios of wind generation.
65 Currently, Regions and subregions (in particular, difference operating entities) use different methods to determine expected on‐peak values of wind capacity. The Integration
of Variable Generation Task Force is addressing this issue. The report Methods to Model and Calculate Capacity Contributions of Variable Generation for Resource Adequacy Planning is available on the NERC website at: http://www.nerc.com/files/IVGTF1‐2.pdf
66 http://www.nerc.com/docs/pc/ivgtf/ieee‐capacity‐value‐task‐force‐confidential%20%282%29.pdf
0
2
4
6
8
10
12
14
16
18
20
22
2013 2014 2015 2016 2017 2018 2019 2020 2021 2022
Gigaw
atts (G
W)

Key Reliability Findings
NERC | 2012 Long‐Term Reliability Assessment | November 2012
Page 30 of 335
Figure 23: On‐Peak Renewable Capacity – Cumulative Net Change67
From an assessment area perspective, southern California is expecting the most future renewable on‐peak capacity with
over 13 GW of new solar capacity. Significant on‐peak wind capacity is projected in both the United States and Canada,
totaling an increase of over 7.4 GW in WECC alone (Figure 23).
Figure 24: On‐Peak Renewable Capacity – Planned Additions by 202268
Solar generation will see more growth in both nameplate and on‐peak capacity during the next 10 years (Figure 25). Plans
for approximately 13.4 GW of nameplate capacity are projected to come into service, primarily in the WECC‐CALS and
WECC‐DSW subregions. Regional planners in these areas continue to assess the growing impacts of this variable resource
into the generation mix. One notable difference is the expected on‐peak capacity that can be reliably counted on to serve
peak demand. Across the dense installations of solar capacity in the Southwest, the two WECC assessment areas are
counting on approximately half of the installed capacity to serve peak demand.
67 For WECC‐CAN, the metric the on‐peak wind capacity is based actual performance for the last three winter seasons, as reported in the 2010‐2012 LTRA reference cases. WECC
is currently developing an enhanced approach to determine capacity contributions from variable generation. 68 This figure includes only those areas with significant renewable capacity additions and does not include capacity additions classified as Conceptual.
8.7%5.8%
18.7% 20.5%
13.0%
4.9%9.0%
2.9%8.7% 6.2%
18.8% 20.9%14.6%
7.5% 9.0%
16.5%
0
2,000
4,000
6,000
8,000
10,000
12,000
14,000
16,000
18,000
20,000
22,000
24,000
26,000
Current 2022 Planned
Current 2022 Planned
Current 2022 Planned
Current 2022 Planned
Current 2022 Planned
Current 2022 Planned
Current 2022 Planned
Current 2022 Planned
ERCOT MISO MRO‐MAPP, Manitoba Hydro,
SaskPower
NPCC‐TOTAL PJM SPP WECC‐CAN WECC‐US, MEXW
Megawatts (MW)
On‐Peak Capacity Derate Current Percentage of Installed Capacity 2022 Percentage of Installed Capcity
0
1,000
2,000
3,000
4,000
5,000
6,000
7,000
8,000
Mwgawatts (MW)
Wind Solar Hydro Biomass Geothermal Pumped Storage

Key Reliability Findings
NERC | 2012 Long‐Term Reliability Assessment | November 2012
Page 31 of 335
Figure 26: Solar Additions Primarily in the WECC‐CALS and WECC‐DSW Assessment Areas
Figure 27: Density Map of Future Wind and Solar Installed Capacity Additions69
Power system planners must consider the impacts of variable generation in power system planning and design and develop
the necessary practices and methods to maintain long‐term bulk power system reliability. Power system planning is
intended to ensure that a reliable and robust power system is available to the power system operator within the planning
horizon. The industry has already begun development of new planning methods and techniques that consider the
characteristics of variable generation assets to improve system reliability. These tools need to be expedited to ensure the
reliable operation of the bulk power system. New models need to take into account new technologies, such as storage,
variable demand such as demand response, and incorporation of flexible resources. For example, storage technologies, if
properly planned and implemented can provide the flexibility to accommodate large amounts of variable resources as an
alternative to the construction of more conventional flexible generation resources or transmission, if economical.
69 Source: Ventyx Velocity Suite, An ABB Company, modified by NERC staff to reflect NERC footprint.
55.2%
4.4%
53.1%45.8%
0
2,000
4,000
6,000
8,000
10,000
12,000
14,000
16,000
Current 2022 Planned Current 2022 Planned
WECC‐CALS, DSW REMAINING AREAS
Megawatts (MW)
Expected On‐Peak Capacity On‐Peak Derate Current Percentage of Total Capacity 2022 Percentage of Total Capcity
Key Reliability Findings
NERC | 2012 Long‐Term Reliability Assessment | November 2012
Page 32 of 335
Areas integrating wind resources have projected increases in transmission congestion, particularly when demand is low. As
wind resources are less predictable and follow the availability of their fuel (wind) rather than dispatch instructions from
operators or market based systems for traditional “controlled fuel” plants, different patterns in the use of transmission
capacity can emerge from this new variable fuel paradigm. In some cases, renewable resource availability may not be
correlated to demand, being available during the nighttime, for example, rather than during daily peak periods. Energy
storage may provide potential support by converting this energy to stored capacity. Further, some Regions report
challenges in managing the power system under the high variability of wind resources and report the need to provide
additional ancillary services (such as operating reserves) as specific challenges (see NERC’s 2012 Summer Reliability
Assessment).70
Power system planners are already familiar with designing a system that can be operated reliably while accommodating a
certain amount of variability and uncertainty, particularly as it relates to system demand and, to a lesser extent, to
conventional generation. However, large‐scale integration of variable generation can significantly alter familiar system
conditions due to increased supply variability and uncertainty. This presents new challenges to power system operators,
and planners will need to design a system that can accommodate variable generation in large quantities, providing
operators with the resources needed. In addition, system variability occurs from distribution system connected renewables
(also called embedded generation). Embedded generation capacity is less visible to system operators and introduces
additional variability to the perceived local demand forecast and load served.
Forecasting of variable generation resources is important in all timeframes, and there are many uses for longer‐range
forecasts from days and weeks (e.g., transmission outage planning and minimum generation issues) to years (e.g.,
integrated resource planning, where resource flexibility and ramping capabilities should be increasingly valued, and the
generation mix if not appropriately planned can raise bigger challenges/issues during operating timeframe). Such longer‐
term schedules are adjusted as they get closer to real‐time and the critical operating impacts to bulk power system
reliability tend to be closer to real time.
Regional differences will exist; however, this is largely an interconnection‐wide issue as policy and mandates requiring
energy from renewable generation expand. As policy and regulations on greenhouse gas emissions, notably CO2, and
mandated Renewable Portfolio Standards (RPS) are being developed by states and provinces throughout North America,
and as the economics of renewable resources continue to improve, the addition of renewable generation into the bulk
power system is expected to grow considerably in the near future. The level of commitment to renewable resources offers
benefits such as new generation resources, fuel diversification, and greenhouse gas reductions. However, renewable
commitments present significant new challenges that need to be properly addressed to maintain bulk power system
reliability.
Provincial and state Renewable Portfolio Standards (RPS) will increase renewable resources located where wind power
densities and solar development are favorable. Congress is also considering a federal RPS. Grid expansion is needed to
support the dispersed nature of renewable resources. The limited timeframe provided to meet RPS mandates requires that
current transmission siting and permitting processes be expedited. Federal, state, and provincial CO2 legislation is pending
throughout North America.
In the United States, a number of Regional and state activities have resulted in a variety of renewable portfolio standards.
In 2010, NERC’s Planning Committee created the Reliability Impacts of Climate Change Initiatives Task Force (RICCITF)71 to
70 2012 Summer Reliability Assessment: http://www.nerc.com/files/2012SRA.pdf 71 2010 Special Reliability Assessment: Reliability Impacts of Climate Change Initiatives: Technology Assessment and Scenario Development,
http://www.nerc.com/files/RICCI_2010.pdf

Key Reliability Findings
NERC | 2012 Long‐Term Reliability Assessment | November 2012
Page 33 of 335
review CO2 legislative and regulatory impacts on BPS reliability.72 Further, NERC staff prepared a report documenting
industry concerns and reliability considerations (Figure 28).73
Figure 28: Renewable Portfolio Targets in Most of the United States74
Individual state, provincial, and regional initiatives may not significantly affect BPS reliability. However, these combined
initiatives will begin to come to fruition concurrently with federal climate change policies underway in North America.
Industry planners should recognize and address potential impacts to meet the following climate change initiatives without
compromising system reliability.
State and Provincial Renewable Portfolio Standards: Renewable Portfolio Standards typically require load‐serving
entities in a given area to acquire a certain percentage of their energy supply from renewable resources by a target
year (for example, 20 percent by 2020). Twenty‐nine U.S. states and three Canadian provinces have some kind of
renewable portfolio standard in place. NERC has studied the reliability consideration resulting from accommodating
high levels of variable renewable resources.75
Other State and Provincial Climate Goals: All remaining Canadian provinces and six U.S. states have some form of
policy in place to address climate change and greenhouse gas emissions, either through specific capacity or energy
goals for electric generation or other means.
Regional Initiatives: Initiatives such as the Regional Greenhouse Gas Initiative in the Northeast (RGGI) and Western
Climate Initiative (WCI) have created multi‐state and cross‐border partnerships to reduce greenhouse gas emissions
on a regional basis.76
U.S. Federal Climate Change Legislation: The U.S. Senate and House of Representatives, as well as the EPA, have
considered in the recent past various legislative proposals to reduce carbon dioxide (CO2) emissions.
72 http://www.nerc.com/filez/riccitf.html 73 http://www.nerc.com/files/2008‐Climate‐Initiatives‐Report.pdf 74 Source: Database of State Incentives for Renewables & Efficiency: http://www.dsireusa.org/. 75 Numerous special assessments on accommodating high‐levels of variable generation: http://www.nerc.com/page.php?cid=4|61 76 Regional Greenhouse Gas Initiative (http://www.rggi.org/) and Western Climate Initiative (http://www.westernclimateinitiative.org/)

Key Reliability Findings
NERC | 2012 Long‐Term Reliability Assessment | November 2012
Page 34 of 335
As states and provinces begin adopting a variety of approaches to greenhouse gas emission regulation, the prospect grows
for federal regulation. Further, an April 2007 United States Supreme Court decision77 determined greenhouse gas regulation
fell under the purview of the U.S. Environmental Protection Agency.
Transmission
Transmission planning processes to integrate large amounts of variable generation rely on a number of factors, including:
Whether government renewable policies or mandates exist;
Level of variable generation mandated and available variable generation in remote locations;
Time horizon across which capital investments in variable generation are to be made; and
Geographic footprint across which the investments occur.
In order to ensure reliability, transmission is needed to achieve the following:
Interconnect variable energy resources planned in remote Regions
Accommodate the variable generation output with uniformity across a broad geographical region and resource
portfolio
Deliver ramping capability and ancillary services from inside and outside a Balancing Authority area to equalize
supply and demand
Transmission system expansion is vital to unlocking the capacity available from variable generation. In those Regions with a
competitive generation marketplace, regulatory targets such as Renewable Portfolio Standards heavily influence the
location and timing of renewable generation investments and their development. Furthermore, government policy and any
associated cost allocations (i.e., who pays for transmission, additional ancillary services, and ramping capability) will be a
key driver for variable generation capacity expansion. Therefore, an iterative approach between transmission and
generating resource planning is required to cost‐effectively and reliably integrate all resources.
Transmission expansion, including greater connectivity between Balancing Authorities, and coordination on a broader
regional basis, is a tool that can aggregate variable generators and lead to the reduction of overall variability. Sufficient
transmission capacity serves to accommodate the output of individual variable and conventional generation plants across a
broader geographical region. Large balancing areas or participation in wider‐area balancing management may be needed to
enable high levels of variable resources. As long as existing transmission pathways are not congested, transmission
expansion may not be required to achieve the benefits of larger balancing areas. Shared ramping capability and ancillary
services between adjacent areas also provide additional reliability benefits, depending on how existing and planned inter‐
area transmission assets are used.
Currently, high‐voltage transmission overlay expansions are being conceptualized in various parts of the NERC footprint.
High‐Voltage Alternating Current (HVAC), High‐Voltage Direct Current (HVdc) transmission, or a hybrid of both provides
expansion alternatives for this overlay approach. HVAC can interconnect to the existing AC grid to support new generation
and load centers as the grid evolves. However, for very long, over‐ground distances (wind sites are often hundreds of miles
away from demand centers), dedicated HVdc may be a more suitable solution. In addition to long distances, offshore
applications also offer technical challenges that can preclude HVAC cables. With the advent of voltage‐source converter
(VSC) technologies, additional HVdc benefits (e.g., reactive power control voltage and frequency control) have proven
useful in other renewable energy projects, such as offshore wind plants, and can be useful in many other generation
projects as well.
77 http://www.supremecourtus.gov/opinions/06pdf/05‐1120.pdf

Key Reliability Findings
NERC | 2012 Long‐Term Reliability Assessment | November 2012
Page 35 of 335
Risk Assessment Summary
Impacted Assessment Area(s)
ERCOT
MISO
SPP
WECC
Impact Type
Resource Adequacy ‐ Large and unexpected down ramps can contribute to a capacity shortage.
Operating Reliability ‐ Distributed and variable generation can have unforeseen impacts to system stability and voltage support if not sufficiently modeled.
Magnitude of Impact
Sufficient transmission is needed to reliably interconnect 80 GW of projected renewable generation on‐peak capacity.
Renewables are expected to provide 20 percent of expected on‐peak capacity in 2022. This value reflects de‐rates for nameplate renewable resources.
Likelihood of Impact
The likelihood of an event that impacts reliability is greatly reduced if proper planning processes, operational procedures, and operator training have been implemented.
Increasing operator experience with variable resource characteristics and behaviors should enhance system operators’ ability to manage unpredicted events.
Recommendations
NERC
The IVGTF should complete their work on planning and operating requirements for integrating large amounts of
variable generation.78
NERC should address recommendations for adopting probabilistic approaches for determining capacity contributions of variable generation.
79
NERC should enhance its Reliability Standards by organizing Standard Authorization Requests or supporting existing standard development processes that have been identified by the Integration of Variable Generation Task Force:
o Distributed Resources80
o Standard Models81
o Interconnection Requirements82
NERC should develop metrics that measure flexibility needs for variable generation.83
Recommendations for operational planning and real‐time operations o Forecasting
84
o Operating Criteria and Ancillary Services85
o Operating Practices, Procedures, and Tools86
Generator Owners and Operators
Variable Generator Owners should explore whether their resources have the technical abilities of providing enhanced
(ancillary) services to the BPS.
Planning and Reliability Coordinators
Requirements for operational flexibility and reliability criteria should be re‐examined for systems with large amounts
of variable resources.
78 http://www.nerc.com/filez/ivgtf.html 79 http://www.nerc.com/files/IVGTF1‐2.pdf 80 http://www.nerc.com/files/IVGTF_TF‐1‐8_Reliability‐Impact‐Distributed‐Resources_Final‐Draft_2011%20%282%29.pdf 81 http://www.nerc.com/files/Standards%20Models%20for%20Variable%20Generation.pdf 82 http://www.nerc.com/files/2012_IVGTF_Task_1‐3.pdf 83 http://www.nerc.com/files/IVGTF_Task_1_4_Final.pdf 84 http://www.nerc.com/files/Varialbe%20Generationn%20Power%20Forecasting%20for%20Operations.pdf 85 http://www.nerc.com/files/IVGTF2‐3.pdf 86 http://www.nerc.com/files/IVGTF2‐4.pdf

Key Reliability Findings
NERC | 2012 Long‐Term Reliability Assessment | November 2012
Page 36 of 335
Transmission Growth to Accommodate New and Distant Resources The future reliability of the BPS is largely dependent on the ability to site, permit, and build new transmission assets in a
timely manner. The existing electric transmission systems and planned additions over the next 10 years appear adequate to
reliably meet customer electricity requirements. However, delays to transmission construction due to permitting and siting
have been observed and continue to inhibit the industry from constructing new and potentially vital transmission
infrastructure. While these deferments do not currently pose a reliability concern, the importance of a secure transmission
infrastructure is amplified when one considers the significant addition of variable generation resources, pending
environmental legislation in both the United States and Canada, and increased demand projections throughout North
America in the assessment’s 10‐year horizon. It is important that local, state, provincial, and federal regulators work
together to develop timely and effective solutions to minimize potential delays. The process to site new transmission
continues to be difficult, time‐consuming, and expensive due to local opposition and environmental concerns, especially
when lines are planned to cross state borders. Negotiations still delay and, in some cases, stop needed projects from being
built. As a result, transmission permitting, siting, and construction can take significantly longer (i.e., 7–10 years) than
permitting, siting, and construction of generation.
NERC continues to monitor the progress of transmission projects across North America. While transmission planning is
dynamic (i.e., a project is needed one year, but can be deferred due to a change in demand forecasts), plans should reflect
realistic expectations in order to reliably support system needs in the future. For example, ERCOT plans to install a
significant amount of transmission circuit miles by 2013. Once in‐service, these lines will provide ERCOT with better
methods to manage existing and potential congestion problems and will support recently completed Competitive
Renewable Energy Zone (CREZ) projects in Western Texas. Large transmission line additions and upgrades are also
projected within the MISO footprint, with more than half of these upgrades resulting from a need to reliably integrate
renewable generation resources. Minor additions are expected throughout the MRO Assessment Areas to integrate
hydropower resources in Manitoba and improve reliability in the MAPP Assessment Area while accommodating for
projected load growth in SaskPower.
An analysis of the past 16 years shows that planned transmission (greater than 200 kV)87 during the next five years would
nearly triple the average circuit miles that have historically been constructed during a five‐year period. Through this analysis
period, the number of actual miles constructed over five‐year periods has roughly averaged 7,100 circuit miles. During the
next five years, about 18,700 miles are planned, which continues to exceed recent historical averages.88 However, during
the previous and consecutive five‐year periods (2003–07 through 2007–11), industry was successful in meeting its
projections. From 2006 through the end of 2011, industry has exceeded the average transmission additions (circuit miles),
constructing the most transmission during a five‐year period since the 1991‐1995 period89 (Figure 29). As recent as five
years ago, transmission was being constructed at a rate of about 1,000 circuit miles per year. In the last five years, over
2,300 circuit miles were constructed per year, more than doubling actual builds in the previous five years. With the current
plans in place, that rate is expected to increase to 3,600 miles per year over the next five years.
87 Transmission data prior to 2009 is limited to 200 kV and above. 88 Significant recent and projected transmission additions are still well below additions made 40‐50 years ago when much of the current grid was built 89 1990 is the first year this type of data was digitized. Previously data was not collected on five‐year plans.

Key Reliability Findings
NERC | 2012 Long‐Term Reliability Assessment | November 2012
Page 37 of 335
Figure 29: Historical Actual Miles Added for Rolling Five‐Year Periods and Projected Five‐Year Plans, 200kV and Above90
Stakeholders within the electric industry continually assess the ability of their internal transmission system and
interconnections with other systems not only to meet regional requirements, but also to meet compliance with NERC
Reliability Standards. Once a set of transmission alternatives has been identified, the project can take up to ten or more
years to complete from project identification to final certification and energization of elements. A majority of the time in
this process is devoted to the siting, permitting, and land acquisition process, which has no definitive time frame and can
vary greatly depending on the geographic location of proposed additions.
NERC‐wide, almost a quarter of new transmission is specifically linked to the integration of renewable generation.
Therefore, areas with larger increases in projected renewables are generally the areas with significant transmission
additions. Projected transmission additions in ERCOT, MISO, and WECC are largely due to the future renewable additions
that are expected over the next 10 years (Figure 30 and Table 30).
Figure 30: New Transmission Projects (by Circuit Miles) Driven by Reliability and the Integration of Renewable Resources
90 Historic data has been revised for some areas based on the original submission of erroneous data for existing and planned circuit miles.
01,0002,0003,0004,0005,0006,0007,0008,0009,00010,00011,00012,00013,00014,00015,00016,00017,00018,00019,00020,00021,000
90‐94 91‐95 92‐96 93‐97 94‐98 95‐99 96‐00 97‐01 98‐02 99‐03 00‐04 01‐05 02‐06 03‐07 04‐08 05‐09 06‐10 07‐11 08‐12 09‐13 10‐14 11‐15 12‐16
Circuit M
iles
5 Year Outlook Actual Miles Added Over 5‐Year Period
Integration of New Generation; 3%
Integration of New Generation (Renewable/Variable); 24%
Economics / Congestion; 14%
Reliability; 52%Other/Unknown; 7%

Key Reliability Findings
NERC | 2012 Long‐Term Reliability Assessment | November 2012
Page 38 of 335
Table 31: Planned Transmission Additions by Assessment Area, 2012‐2022 (Circuit Miles 100kV and Above) Existing 2010‐2011 Current 2012‐2017 2018‐2022 2022 Total Projected
Assessment Area/Country
2010 Year‐End
2011 Year‐End
Line Additions
Under Construction Planned Conceptual Planned Conceptual E+UC+P E+UC+P+C
ERCOT 29,107 29,465 358 946 4,757 800 29 391 35,197 36,388 FRCC 11,973 12,031 58 46 249 0 200 97 12,526 12,623 MISO 50,144 44,500 ‐5,644 161 1,838 63 1,069 0 47,568 47,631 MRO‐MAPP 10,314 10,266 ‐49 230 716 107 0 0 11,211 11,318 NPCC‐New England 8,496 8,106 ‐390 182 458 218 8 18 8,753 8,989 NPCC‐New York 10,990 10,992 2 0 138 0 30 0 11,160 11,160 PJM 45,472 51,649 6,177 118 709 131 1,267 134 53,743 54,008 SERC‐E 21,995 22,180 185 33 276 87 189 189 22,678 22,954 SERC‐N 21,303 21,600 297 254 332 21 13 57 22,198 22,276 SERC‐SE 27,316 27,672 356 108 305 66 374 0 28,459 28,525 SERC‐W 13,604 14,295 691 72 414 26 79 92 14,860 14,978 SPP 32,857 32,881 24 638 1,613 47 180 103 35,311 35,460 WECC‐US 103,371 104,359 988 199 4,093 4,501 1,921 2,598 110,572 117,672
TOTAL‐US 386,942 389,995 3,053 2,988 15,895 6,066 5,358 3,678 414,236 423,981
MRO‐Manitoba 7,295 7,485 190 0 237 0 1,076 80 8,798 8,878 MRO‐SaskPower 4,997 5,083 86 0 323 222 0 0 5,406 5,628 NPCC‐Maritimes 5,056 5,082 26 0 13 203 0 283 5,095 5,581 NPCC‐Ontario 17,713 17,931 218 93 0 180 0 599 18,024 18,803 NPCC‐Québec 23,100 22,787 ‐313 412 68 546 129 599 23,395 24,539 WECC‐Canada 21,489 22,946 1,457 0 1,970 0 706 0 25,623 25,623
TOTAL‐CANADA 79,650 81,314 1,664 505 2,611 1,151 1,911 1,560 86,341 89,051
WECC‐MEXW 1,425 1,458 33 0 255 0 132 0 1,845 1,845
TOTAL‐MEXICO 1,425 1,458 33 0 255 0 132 0 1,845 1,845
TOTAL‐NERC 468,017 472,767 4,750 3,492 18,761 7,217 7,401 5,239 502,421 514,877
In the United States, the recent issuance of FERC Order 1000 reforms the Commission’s electric transmission planning and
cost allocation requirements for public utility transmission providers. While the rule provides a framework for cost
allocation and requires certain considerations that need to be addressed, the potential benefit the order brings is in its
inter‐regional transmission planning reform. While many Regions already perform inter‐regional planning, the order
facilitates the evaluation of large, interconnection‐wide issues.
Projected transmission circuit mile additions are an indicator of the relative strengthening of the existing bulk power
transmission system. Although the addition of transmission circuit miles is encouraging, the associated increased use of
transmission systems due to increased demand growth, generation additions (including geographically distant generation),
capacity deficiencies, and the increasingly competitive bulk power market must also be considered when evaluating overall
system reliability (Figure 32 and Figure 33).
Figure 32: NERC‐Wide Cumulative Transmission Additions by Project Status and Expected In‐Service Year
0
5,000
10,000
15,000
20,000
25,000
30,000
35,000
40,000
45,000
2012 2013 2014 2015 2016 2017 2018 2019 2020 2021 2022
Circuit M
iles
Under Construction + Planned Under Construction + Planned + Conceptual
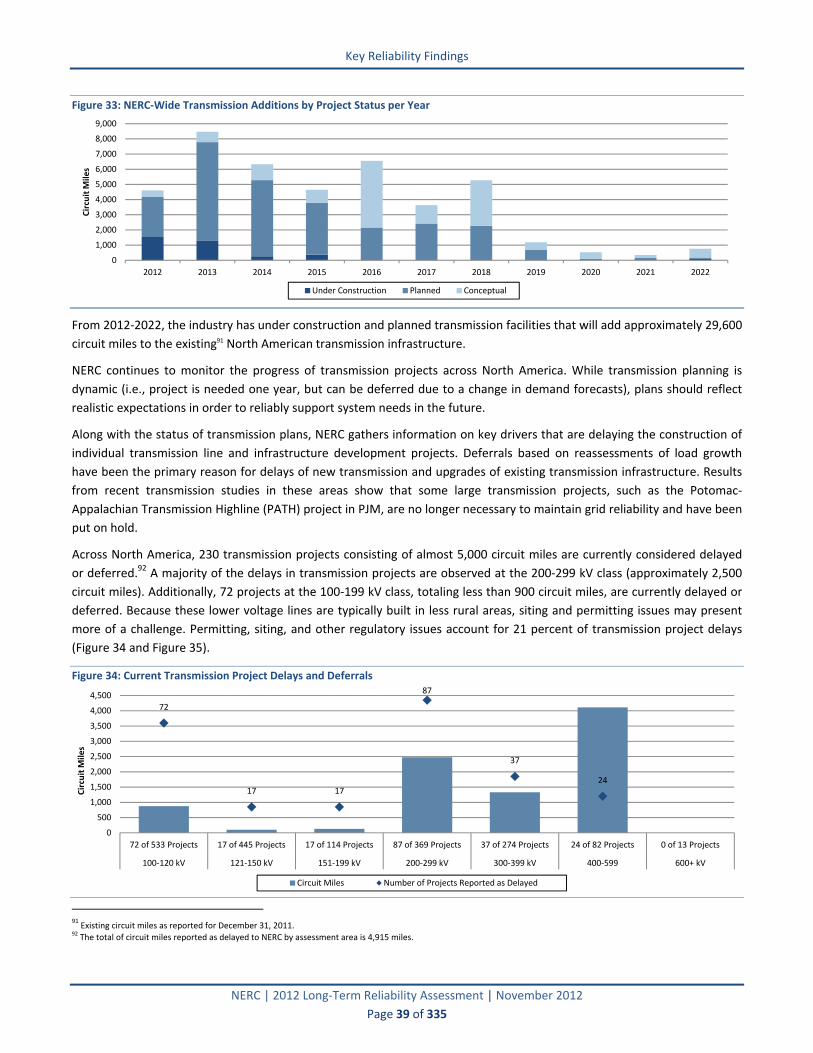
Key Reliability Findings
NERC | 2012 Long‐Term Reliability Assessment | November 2012
Page 39 of 335
Figure 33: NERC‐Wide Transmission Additions by Project Status per Year
From 2012‐2022, the industry has under construction and planned transmission facilities that will add approximately 29,600
circuit miles to the existing91 North American transmission infrastructure.
NERC continues to monitor the progress of transmission projects across North America. While transmission planning is
dynamic (i.e., project is needed one year, but can be deferred due to a change in demand forecasts), plans should reflect
realistic expectations in order to reliably support system needs in the future.
Along with the status of transmission plans, NERC gathers information on key drivers that are delaying the construction of
individual transmission line and infrastructure development projects. Deferrals based on reassessments of load growth
have been the primary reason for delays of new transmission and upgrades of existing transmission infrastructure. Results
from recent transmission studies in these areas show that some large transmission projects, such as the Potomac‐
Appalachian Transmission Highline (PATH) project in PJM, are no longer necessary to maintain grid reliability and have been
put on hold.
Across North America, 230 transmission projects consisting of almost 5,000 circuit miles are currently considered delayed
or deferred.92 A majority of the delays in transmission projects are observed at the 200‐299 kV class (approximately 2,500
circuit miles). Additionally, 72 projects at the 100‐199 kV class, totaling less than 900 circuit miles, are currently delayed or
deferred. Because these lower voltage lines are typically built in less rural areas, siting and permitting issues may present
more of a challenge. Permitting, siting, and other regulatory issues account for 21 percent of transmission project delays
(Figure 34 and Figure 35).
Figure 34: Current Transmission Project Delays and Deferrals
91 Existing circuit miles as reported for December 31, 2011.
92 The total of circuit miles reported as delayed to NERC by assessment area is 4,915 miles.
0
1,000
2,000
3,000
4,000
5,000
6,000
7,000
8,000
9,000
2012 2013 2014 2015 2016 2017 2018 2019 2020 2021 2022
Circuit M
iles
Under Construction Planned Conceptual
72
17 17
87
37
24
0
500
1,000
1,500
2,000
2,500
3,000
3,500
4,000
4,500
72 of 533 Projects 17 of 445 Projects 17 of 114 Projects 87 of 369 Projects 37 of 274 Projects 24 of 82 Projects 0 of 13 Projects
100‐120 kV 121‐150 kV 151‐199 kV 200‐299 kV 300‐399 kV 400‐599 600+ kV
Circuit M
iles
Circuit Miles Number of Projects Reported as Delayed

Key Reliability Findings
NERC | 2012 Long‐Term Reliability Assessment | November 2012
Page 40 of 335
Figure 35: Reasons for Transmission Project Delays and Deferrals
Transmission lines are the critical link between generation and bulk power system customers. As demand grows and
generation is built in areas remote from the demand, more capacity on the transmission system is needed to meet demand.
As more and more power is moved over transmission lines, congestion can have a significant impact on reliability. As these
lines reach their capacity, for example, it is more difficult for them to make up the difference when neighboring lines are
forced out of service. Under‐investment in transmission puts additional strain on existing resources, which raises the risk of
system disturbances, lengthens restoration time when outages do occur, and limits access to remote generation.
The benefits of more transmission are also far‐reaching. New transmission can reduce installed capacity and reserve
requirements, reduce losses, increase transfer capabilities, and provide diversification of renewable generation over a large
geographical region.
Risk Assessment Summary
Impacted Assessment Area(s) All Regions
Impact Type
Resource Adequacy ‐ A constrained and limited transmission system could potentially affect resource deliverability and cause generator de‐rates.
Operating Reliability ‐ Increased stress to transmission systems can cause a decrease in the performance of transmission facilities.
Magnitude of Impact 15,000 circuit miles Planned over next five years
26,000 circuit miles Planned over next ten years
Likelihood of Impact Increased delays could impede the industry’s transmission plans
Since less than 10 percent of all circuit miles are currently delayed or deferred, actual additions may not meet expectations.
Recommendations
NERC
NERC should expand its understanding of projected transmission resource acquisition strategies being employed throughout North America. Therefore, categorization of transmission additions should be considered to fully appreciate transmission resource requirements. NERC should identify transmission assessment metrics to determine if future projects are sufficient to meet projected resource plans.
NERC should continue to provide information and support to NERC stakeholders on the need for new transmission in North America.
Regulators Regulators need to continue their support for additional transmission resources. Further, they should revise their existing processes to expedite the licensing of transmission projects needed to maintain reliability.
Permitting / Siting or Environmental
Litigation/Opposition21%
Budget/Cost Issues3%
Construction / Equipment Related4%
Deferral Based on Reassessment of Load Growth
44%
Other28%

Key Reliability Findings
NERC | 2012 Long‐Term Reliability Assessment | November 2012
Page 41 of 335
Increases in Demand‐Side Management Help Offset Future Resource Needs All areas are projecting at least some increased availability of DSM over the next 10 years to reduce peak demands,
contributing either to the deferral of new generating capacity or improving operator flexibility in the day‐ahead or real‐time
time periods. NERC‐wide, DSM is projected to total roughly 80,000 MW by 2022 (or about 7 percent of the on‐peak
resource portfolio), offsetting approximately six years of peak demand growth (Figure 36).
Figure 36: Demand‐Side Management Offsets Six Years of Peak Demand Growth
However, DSM is not an unlimited resource and may provide limited demand reductions during pre‐specified time periods
(generally during peak or adverse system conditions). Some Regions—such as ERCOT, FRCC, NPCC, and WECC—have been
using DSM for many years, while others have less penetration. Historical performance data from these Regions may also
provide a way to analyze the benefits from these resources.93 The structure of DSM programs (e.g., performance
requirements, measurement and verification applicability, and resource criteria) may be indicative of how well these
programs perform when needed. The shared experiences and lessons learned from these high‐penetration areas should
benefit the North American BPS in providing more planning and operating flexibility.
In terms of DR (Dispatchable and Controllable), total expected capacity is anticipated to increase from approximately
46,000 MW to 59,000 MW by 2022. Year‐over‐year increases are projected to remain steady through the 10‐year period,
compared to previous years where projections would plateau after three or four years (Figure 37).
93 NERC Demand Response Availability Data System (DADS) is collecting Demand Response performance data on a semi‐annual basis. The goal of the DADS is to collect Demand
Response enrollment and event information to measure its actual performance including its contribution to improved reliability. Ultimately, this analysis can provide industry with a basis for projecting contributions of dispatchable and non‐dispatchable Demand Response supporting forecast adequacy and operational reliability. For more information, visit the DADS website at: http://www.nerc.com/page.php?cid=4|357.
850
875
900
925
950
975
1,000
1,025
1,050
2013 2014 2015 2016 2017 2018 2019 2020 2021 2022
Gigaw
atts (G
W)
DR (Load‐Modifying) DR (Resource) Energy Efficiency Net Internal Demand Total Internal Demand
DSM offsets 6 years of growth
Non‐Coincident Total Internal Demand to increase by
113 GW over 10 Years, as demand response will
increase from 45.7 GW to 57.6 GW. Energy Efficiency
will increase by 20GW.
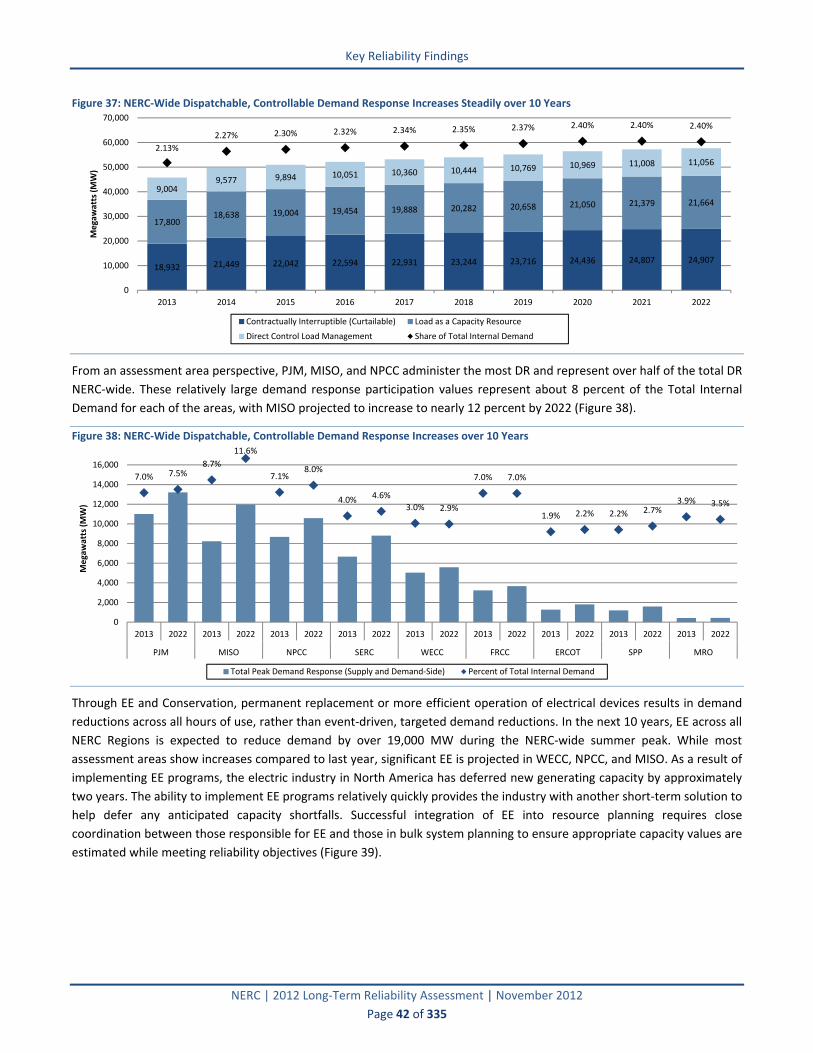
Key Reliability Findings
NERC | 2012 Long‐Term Reliability Assessment | November 2012
Page 42 of 335
Figure 37: NERC‐Wide Dispatchable, Controllable Demand Response Increases Steadily over 10 Years
From an assessment area perspective, PJM, MISO, and NPCC administer the most DR and represent over half of the total DR
NERC‐wide. These relatively large demand response participation values represent about 8 percent of the Total Internal
Demand for each of the areas, with MISO projected to increase to nearly 12 percent by 2022 (Figure 38).
Figure 38: NERC‐Wide Dispatchable, Controllable Demand Response Increases over 10 Years
Through EE and Conservation, permanent replacement or more efficient operation of electrical devices results in demand
reductions across all hours of use, rather than event‐driven, targeted demand reductions. In the next 10 years, EE across all
NERC Regions is expected to reduce demand by over 19,000 MW during the NERC‐wide summer peak. While most
assessment areas show increases compared to last year, significant EE is projected in WECC, NPCC, and MISO. As a result of
implementing EE programs, the electric industry in North America has deferred new generating capacity by approximately
two years. The ability to implement EE programs relatively quickly provides the industry with another short‐term solution to
help defer any anticipated capacity shortfalls. Successful integration of EE into resource planning requires close
coordination between those responsible for EE and those in bulk system planning to ensure appropriate capacity values are
estimated while meeting reliability objectives (Figure 39).
18,932 21,449 22,042 22,594 22,931 23,244 23,716 24,436 24,807 24,907
17,80018,638 19,004 19,454 19,888 20,282 20,658 21,050 21,379 21,664
9,0049,577 9,894 10,051 10,360 10,444 10,769 10,969 11,008 11,056
2.13%
2.27% 2.30% 2.32% 2.34% 2.35% 2.37% 2.40% 2.40% 2.40%
0
10,000
20,000
30,000
40,000
50,000
60,000
70,000
2013 2014 2015 2016 2017 2018 2019 2020 2021 2022
Megawatts (MW)
Contractually Interruptible (Curtailable) Load as a Capacity Resource
Direct Control Load Management Share of Total Internal Demand
7.0% 7.5%8.7%
11.6%
7.1%8.0%
4.0% 4.6%
3.0% 2.9%
7.0% 7.0%
1.9% 2.2% 2.2% 2.7%3.9% 3.5%
0
2,000
4,000
6,000
8,000
10,000
12,000
14,000
16,000
2013 2022 2013 2022 2013 2022 2013 2022 2013 2022 2013 2022 2013 2022 2013 2022 2013 2022
PJM MISO NPCC SERC WECC FRCC ERCOT SPP MRO
Megawatts (MW)
Total Peak Demand Response (Supply and Demand‐Side) Percent of Total Internal Demand

Key Reliability Findings
NERC | 2012 Long‐Term Reliability Assessment | November 2012
Page 43 of 335
Figure 39: Growth in Energy Efficiency Supports Deferral of Capacity Needs94
The type of EE programs (industrial, commercial, and residential) influence the total capacity (MW) reduction depending on
the time of day and desired reduction. Load forecasting is a critical component to understanding the overall peak reduction
observed or projected. Tracking and validating EE programs is vital to increasing the accuracy of forecasts. In some areas,
experience with these demand‐side resources has improved. For example, in ISO‐NE demand‐side resources can participate
just like traditional generation resources in the Forward Capacity Market.95 The ability to demonstrate effective
performance of these resources illustrates the confidence exhibited by system planners and operators in using demand‐side
resources to fulfill capacity obligations and maintain the same level of reliability.
Potential drivers for the continued expansion of EE programs in the future are Renewable Portfolio Standards (RPS), which
commonly include provisions for energy‐reducing actions to account for a portion of the renewable resource requirement
(generally no more than 5 percent of total energy use). Other policy drivers include the American Recovery and
Reinvestment Act of 2009,96 which includes provisions for significant investments in energy and climate‐related initiatives;
the American Clean Energy and Security Bill of 2009,97 which established credits for reduced carbon emissions; the Climate
Change Plan for Canada;98 and several regional, state, and provincial initiatives.99
Uncertainty exists not only in how much peak demand reduction will actually be realized at the particular time when DR is
needed and deployed, but also in the long‐term sustainability of these resources.100 Unlike traditional generating resources
with many decades of historic data for analysis, the long‐term projections of DR involve greater forecasting uncertainty.
Because participation in DR programs is highly dependent on a number of economic variables and incentives, it is
challenging to forecast how much DR will be available beyond three or four years.101
As DSM is increasingly deployed in response to climate change initiatives or mandates, it will become a larger portion of the
overall resource portfolio. During the next decade, DR will increase to approximately 4.8 percent of the total resource mix,
and EE will account for 2.2 percent. Climate change initiatives at the state/provincial level, along with consumer‐led efforts
to reduce energy consumption, will broaden the size and scope of DSM programs. Both EE and DR can make significant
94NPCC‐New England did not provide separate EE data.
95 http://www.iso‐ne.com/nwsiss/grid_mkts/how_mkts_wrk/cap_mkt/index.html 96 http://frwebgate.access.gpo.gov/cgi‐bin/getdoc.cgi?dbname=111_cong_bills&docid=f:h1enr.txt.pdf 97 http://frwebgate.access.gpo.gov/cgi‐bin/getdoc.cgi?dbname=111_cong_bills&docid=f:h2454pcs.txt.pdf 98 http://dsp‐psd.pwgsc.gc.ca/Collection/En56‐183‐2002E.pdf 99 Reliability Impacts of Climate Change Initiatives report: http://www.nerc.com/files/RICCI_2010.pdf 100 Refer to the 2010 Long‐Term Reliability Assessment, Emerging Reliability Issues: Uncertainty of Sustained Participation in Demand Response Programs section
http://www.nerc.com/files/2010_LTRA_v2‐.pdf 101 In most cases, actual forecasting of Demand Response is not performed, per se. Rather, projections are based on resource requirements and the amount of capacity
contracted during a given commitment period‐‐usually between one and three years.
0
4,000
8,000
12,000
16,000
20,000
24,000
28,000
2013 2014 2015 2016 2017 2018 2019 2020 2021 2022
Mwgawatts (MW)
ERCOT FRCC MISO Manitoba Hydro MAPP New York Ontario Québec PJM SERC‐E SERC‐N SPP WECC

Key Reliability Findings
NERC | 2012 Long‐Term Reliability Assessment | November 2012
Page 44 of 335
contributions to a reduction in greenhouse gases, with EE providing ongoing benefits and DR driving energy use to time
periods when lower or non‐carbon‐emitting resources are available. DR can also enable the integration of renewable
resources by supporting a variety of new operating characteristics associated with variable resources. Therefore, broader
industry experience is needed as the certainty, locality, and characteristics of DSM become increasingly important to
reliability of the BPS (Figure 40).
Figure 40: Growth in Energy Efficiency Supports Deferral of Resource Needs in 2013 (Left) and 2022 (Right)
While many similarities exist between DR and generating capacity, key differences in terms of availability, performance, and
sustainability may appear as a given system becomes more stressed. Less‐understood attributes of these resources, such as
response fatigue102 or economic‐based participation rates, must be carefully monitored to ensure they do not pose
reliability issues in the future. DR is increasingly being used to balance system load and to relieve resource adequacy and
transmission reliability issues. Decreased or insufficient participation could lead to operational challenges where peak
demand cannot be met by current generation or transmission resources. In 2013, just over 7,000 MW of DR NERC‐wide is
projected to support operational and emergency flexibility through the provision of ancillary services. There is virtually no
increase in these values through the 10‐year period (Figure 41).
Figure 41: Demand Response Used for Ancillary Services and Emergencies Increases Operator Flexibility103
102 Response fatigue is a characteristic of demand resources that initially participate in Demand‐Side Management programs because of the financial incentives. Once the electric
supply to their equipment has actually been interrupted a number of times, the inconvenience outweighs the cost savings and the resource may potentially withdraw from the programs.
103 Assessment areas not shown did not report any Demand Response used for Ancillary Services to be used during the peak.
Traditional Generation
78.6%
Renewables16.6%
DR4.1%
EE0.6%
Traditional Generation
74.6%
Renewables18.3%
DR4.8%
EE2.2%
0
200
400
600
800
1,000
1,200
1,400
1,600
1,800
2,000
2,200
Manitoba Hydro
MAPP New York SERC‐E SERC‐SE BASN CALN CALS NORW MEXW
Mwgawatts (MW)
Ancillary Services ‐ Spinning Reserves Ancillary Services ‐ Non‐Spinning Reserves Regulation Energy, Voluntary ‐ Emergency
Key Reliability Findings
NERC | 2012 Long‐Term Reliability Assessment | November 2012
Page 45 of 335
The Reliability Assessments Subcommittee identified the following assumptions while reviewing this concern for
consideration as an emerging reliability issue:
DR participation plateaus in the long term
Potential increase in frequency of use within the short term
Character differences in traditional generation resources versus DR resources
The increased penetration of DR raises operational challenges in numerous areas of day‐to‐day operation of the BPS.
Should DR be unable to deliver the required reduction in demand as committed, real‐time operations may be challenged to
ensure that adequate resources are available (contingency reserve) and that transmission facilities are operated within
their defined limits to maintain BPS reliability.
Any analysis of DR fatigue should also be in effort to determine whether measure type. Moreover, load reduction versus
customer‐owned generation or temperature‐sensitive load versus non‐temperature‐sensitive load (e.g., HVAC versus
lighting, etc.) plays a significant role in the issue of DR fatigue.
DR fatigue issues also concern baseline estimation. The difference between the baseline and the resource’s actual load is
commonly used to determine the performance of a DR resource. However, if a DR resource is both responding to high‐
energy prices and participating in a capacity market (jointly enrolled participation), the resource will not be available to
reduce load, should Emergency Operating Procedures (EOPs) be invoked at a time when the DR resource is actively
reducing load for the price‐responsive program. If the DR resource is already reducing load when EOPs are called, the
amount of load reduction available from those DR resources could actually be lower than their capacity market obligation.
This is especially an issue if the system operator is not aware that the load relief was unavailable. Additionally, if a DR
resource is responding often to price signals, it becomes unclear how the baseline should be estimated. Establishing a
baseline method for DR resources gives the system operator an accurate, real‐time picture of available DR.
In addition to baseline estimation issues, analysis should include data quality and meter accuracy issues that have been
encountered in estimating actual DR reductions. Telemeter data provides effective and reliable metering solutions that
provide near real‐time meter information in order to assess actual performance. Follow‐on action can then be taken by the
system operator once the initial dispatch signals were given. System operators must know how much DR actually
responded. Further, system operators may be able to track or identify actions by DR resources through feeder, substation,
or pricing node data.
These issues become even more important as system operators begin to use DR more to control transmission constraints,
provide ancillary services, and manage contingency reserves. Program‐specific details to the maximum interruption
frequency must be fully considered. For example, several DR programs limit the amount of times service can be interrupted
from the customer within a given time period (e.g., per day, month, or season). Where these limits exist, reductions in peak
demand may not be obtainable by the system operator if extreme weather conditions were to persist for a prolonged
period of time during the peak season. More experience and data analysis associated with DR performance will be required
to establish the long‐term availability, effectiveness, and customer acceptance of these programs.
The trend of increased use of DR programs to meet projected peak demands gives system planners the confidence that the
trend will continue in the future. If DR programs fail to deliver committed load shedding, additional generation resources
and transmission facilities may need to be planned and constructed to deal with an unplanned contingency response.
Additionally, expected transmission and generation resources may not be online due to scheduled or unscheduled
maintenance, further complicating the issue if DR programs are planned as fixed reductions in load.
These results and findings of any analysis on DR fatigue should assist system planners in developing guidelines for
treatment of DR resources within both short and long‐term planning studies. The assumptions regarding performance and
availability of DR need to be developed and incorporated into various types of traditional transmission planning studies
such as steady state, short circuit, thermal, and voltage analyses.

Key Reliability Findings
NERC | 2012 Long‐Term Reliability Assessment | November 2012
Page 46 of 335
Risk Assessment Summary
Impacted Assessment Area(s)
PJM
MISO
NPCC
SERC
WECC
Impact Type
Resource Adequacy ‐ Unavailability and non‐performance of expected DR during peak periods can contribute to a capacity shortage
Operating Reliability ‐ DR can have unforeseen impacts to system stability and voltage support if not sufficiently modeled
Magnitude of Impact 80 GW of DSM (DR and EE) are projected to be available by 2022
DR projected up to 12 percent of peak demand
Likelihood of Impact
The likelihood of an event that impacts reliability is greatly reduced if proper planning processes, operational procedures, and operator training have been implemented
Increasing operator experience with demand response characteristics and behaviors should enhance system operators’ ability to manage unpredicted events
Recommendations
NERC
NERC should continue to monitor the Demand Response Availability Data System (DADS) data to identify availability and performance trends that may indicate potential planning risks.
NERC should determine whether requirements or guidelines are needed to support demand response planning and operations—specifically, demand response that is relied on to meet reliability targets and provide ancillary services.

Key Reliability Findings
NERC | 2012 Long‐Term Reliability Assessment | November 2012
Page 47 of 335
Progress Since 2011 NERC identified six key findings in the 2011 Long‐Term Reliability Assessment104 that could affect long‐term reliability,
unless the electric industry took action to address and mitigate the impacts. The 2011 key findings were based on
observations and analyses of supply and demand projections submitted by the Regional Entities, a NERC staff independent
assessment, and other stakeholder input and comments.
The magnitude of these issues necessitates complex planning and effective strategies whose effects may not be realized for
several years. While significant progress has been made since last year, continued action is still needed on all of the issues
identified in last year’s report to ensure a reliable bulk power system for the future. NERC continues to monitor and assess
these issues based on industry progress through its annual reliability assessments, as well as through any special reliability
assessments that may be needed as determined by the NERC Planning Committee.
While significant progress has been made over the past year for many of these issues, others have not yet been resolved,
and continue to exacerbate power system planning and operations.
2011 Key Finding #1: A decrease in Future and Conceptual generation resources is projected reduce Planning Reserve
Margins in some areas—resource adequacy in ERCOT shows signs of concern; however, most areas appear to have
adequate resource plans to meet projected peak demands.
Developments in 2012:
Overall, most areas are projecting decreased Planning Reserve Margins compared to last year, but still at levels above
the NERC Reference Margin Levels.
Projected resource adequacy concerns in ERCOT have worsened, as targets are not projected to be met by next year.
Decreased Reserve Margin concerns in only some areas remain in 2012 and are a key finding in this report. This is due
to shorter lead times for bringing on‐line natural gas and renewable generation capacity, as well as the growth in
demand response. All of these drivers contribute to future uncertainty as system planners can defer large capacity
development projects for longer periods of time, which allows decisions to be made at a later time without an impact
to reliability.
In 2012, NERC issued a Pilot Probabilistic Assessment to determine if added value could be obtained from enhanced
resource adequacy metrics. In September, the Planning Committee approved the implementation of a continent‐wide
biannual assessment of probabilistic indices.
2011 Key Finding #2: Existing and proposed environmental regulations in the United States may significantly affect bulk
power system reliability, depending on the scope and timing of the rule implementation and the mechanisms in place to
preserve reliability.
Developments in 2012:
On December 21, 2011, the Environmental Protection Agency (EPA) released the Mercury and Air Toxics final rule
pursuant to its authority under Section 112 of the Clean Air Act. Enhanced flexibility for generator compliance was
included by allowing an additional year for modifications and provisions for extension requests. The proactive
engagement among system planners, EPA, DOE and FERC has significantly aided the implementation of solutions to
address the potential impacts associated with expected retirements and retrofits. Most importantly, should a
reliability concern arise, additional safeguards are in place to ensure the continued operation of a given generator
deemed critical to system reliability.105 However, significant concerns still remain in the industry’s efforts to coordinate
a large environmental retrofit effort, as well as constructing the necessary transmission upgrades as a result of
accommodating a shifting resource mix.
104
2011 Long‐Term Reliability Assessment: http://www.nerc.com/files/2011%20LTRA_Final.pdf 105
See Key Findings section for more information on tools in place to ensure reliability.

Key Reliability Findings
NERC | 2012 Long‐Term Reliability Assessment | November 2012
Page 48 of 335
On August 21, 2012, the D.C. Circuit Court vacated the Cross‐State Air Pollution Rule (CSAPR),106 which had originally
required 23 states to reduce annual SO2 and NOX emissions. Since then, the EPA has appealed for full court review.
On June 27, 2012, the EPA revised an agreement that now calls for the agency to take final action by June 27, 2013, to
implement cooling‐water rules for existing power plants under Section 316(b) of the Clean Water Act. The extension
will allow the federal agency time to review public comments received on controls required to protect aquatic life and
on a survey to help determine benefits of the rule.
2011 Key Finding #3: The growing dependence on natural gas as a primary fuel source of on‐peak capacity must be
considered in planning. Operational measures must be in place to minimize interdependency risks, particularly during
off‐peak periods as more gas‐fired generation is expected to provide base‐load functions.
Developments in 2012:
NERC continues to assess the reliability of the BPS through periodic and special reliability assessments. The NERC
Phase II effort on gas dependency targets dependency risks by determining the different vulnerabilities that can affect
BPS reliability, identifying ways that could minimize those vulnerabilities, and identifying approaches where
coordinated inter‐industry activities could provide enhanced system reliability.
In 2012, NERC issued a lesson learned document on gas and electric interdependencies as a result of key findings from
the Report on Outages and Curtailments during the Southwest Cold Weather Event of February 1‐5, 2011.
During August of 2012, FERC held a series of five regional conferences, which addressed local situations directly with
electric grid operators, utilities, power generators, natural gas pipeline operators, natural gas producers, and natural
gas distributors.
The NERC Phase II effort on gas dependency targets dependency issues by determining the different vulnerabilities
that can affect BPS reliability, identifying ways that could minimize those vulnerabilities, and identifying approaches
where coordinated inter‐industry activities could provide enhanced system reliability. The report is scheduled to be
released by the end of 2012.
2011 Key Finding #4: Significant growth in wind and solar generation continues to be projected and surpasses the
NERC‐wide on‐peak capacity forecasts of all other types of generations. Tools, training, and transmission remain key to
successful planning and operations.
Developments in 2012:
NERC will issue three special reliability assessments on accommodating high levels of variable generation, which
include reports and recommendations for interconnection requirements, system operator communications, and
probabilistic methods for resource adequacy.
NERC will also issue a joint report with the California Independent System Operator (CAISO), which focuses on
challenges and solutions aimed at the area’s growing resource mix of variable generation.
2011 Key Finding #5: Significant increases in Demand‐Side Management continue to offset future resource needs, while
dispatchable and controllable demand response can expand flexibility for operators.
Developments in 2012:
Compared to last year’s projections, planners anticipate significant growth in Demand‐Side Management.
Smart meter integration in the residential sector, increased retail and wholesale demand response programs, and
state‐sponsored initiatives have further enabled demand‐side resources from participating in economic and reliability‐
based programs.
106
The CSAPR was initially designed to replace EPA's 2005 Clean Air Interstate Rule (CAIR). A December 2008 court decision kept the requirements of CAIR in place temporarily
but directed EPA to issue a new rule to implement Clean Air Act requirements concerning the transport of air pollution across state boundaries. This action responds to the court's concerns. For additional information see the EPA website http://www.epa.gov/airtransport/.

Key Reliability Findings
NERC | 2012 Long‐Term Reliability Assessment | November 2012
Page 49 of 335
2011 Key Finding #6: Transmission growth as a result of increased plans for integrating and delivering new resources (i.e.,
renewables); constructed transmission is on pace with projections.
Developments in 2012:
Numerous transmission projects are planned and designed specifically for the integration of new renewable
generation.
In recent years, higher‐than‐average plans have been met with the construction of significant transmission.
Five years ago, transmission was constructed at a rate of about 1,000 circuit miles per year. In the last five years, more
than 2,300 circuit miles came into service each year, which more than doubled actual builds in the previous five years.
The current plans further increase that rate to 3,600 miles per year over the next five years.

Emerging Reliability Issues in Focus
NERC | 2012 Long‐Term Reliability Assessment | November 2012
Page 50 of 335
Emerging Reliability Issues in Focus The NERC Reliability Assessment and Performance Analysis (RAPA) program reviews, assesses, and reports on the overall
electric reliability of the interconnected bulk power system in North America. As part of this assessment, the program
identifies and analyzes the impact of key issues and trends that may affect reliability in the future, such as market practices,
industry developments, potential technical challenges, technology implications, and policy changes.
Each year, the NERC Long‐Term Reliability Assessment forms the basis for the NERC reference case. This reference case
incorporates known policy and regulation changes expected to take effect throughout the 10‐year timeframe, assuming a
variety of factors such as economic growth, weather patterns, and system equipment behavior. A set of scenarios can be
developed from risk assessment of emerging reliability issues. These scenarios can then be compared to the reference case
to measure and identify any significant changes to the BPS that may be required to maintain reliability.
For this reason, NERC investigated each of these emerging reliability issues through structured technical committees and
leveraged the expertise of the electric industry’s broad knowledge base. Over the next decade, the electric industry will
face a number of significant emerging reliability issues. The confluence of these issues will drive a transformational change
for the industry, potentially resulting in a dramatically different resource mix with significantly increased reliance on natural
gas and renewable generation, a need for enhanced and sophisticated modeling, a new risk and probabilistic framework
built to address reliability challenges, and growing critical infrastructure and protection concerns—both physical and cyber.
Many of these change elements are critically interdependent, and industry action must be closely coordinated to ensure
continued reliability. As a result, numerous NERC activities are currently ongoing, which exemplifies the industry’s
commitment to understand, resolve, and make recommendations that support enhancing future reliability (Figure 42).
Figure 42: NERC Actions and Activities to Address Emerging Reliability Issues
Since 2007, the Reliability Assessment Subcommittee (RAS) of the NERC Planning Committee (PC) has identified a number
of issues of strategic importance to the industry and surveyed industry participants to rank these issues based on their
probability of occurrence and their impact to the reliable operation on the BPS over both the one‐to‐five‐year and six‐to‐
ten‐year time frame. A number of recommendations based on emerging reliability issues identified in the LTRA were
developed to support long‐term reliability risks and challenges; however, not all have been fully addressed.
In August 2012, the NERC Board of Trustees approved the charter and start‐up of the Reliability Issues Steering Committee
(RISC), which is an advisory committee to the board that provides front‐end, high‐level leadership, prioritization, and
accountability for issues of strategic importance to BPS reliability. The RISC assists the Board, NERC standing committees,
NERC staff, regulators, Regional Entities, and industry stakeholders in establishing a common understanding of the scope,
priority, and goals for the development of solutions to address these issues. In some cases, that includes recommending
Generation Capacity Impacts of Environmental
Regulations
Increasing Dependency on
Natural Gas, Phase II Vulnerability Assessment
HILF Events: Geomagnetic Disturbances
Bulk Power System Risk Index and Assessment
Integration of Variable
Generation
Critical Infrastructure:
Physical and Cyber Security
Roadmaps
BPS Event Analysis and Lessons Learned
Reliability Considerations of
Smart Grid Systems and Devices

Emerging Reliability Issues in Focus
NERC | 2012 Long‐Term Reliability Assessment | November 2012
Page 51 of 335
reliability solutions other than the development of new or revised standards and offering high‐level stakeholder leadership
engagement and input on issues that enter the standards process. The recommendations will improve efficiency of
Reliability Standards development, engage high‐level stakeholder leadership, and promote reliability excellence.107
The issues surveyed by the RAS in 2012, as well as other identified reliability issues from the 2007‐2011 Long‐Term
Reliability Assessments will be submitted on behalf of NERC staff, the PC, and the industry for review, analysis, and
prioritization of action by the RISC.
2012 Emerging Reliability Issues For the 2012 Long‐Term Reliability Assessment, NERC gathered emerging issues previously identified in other assessments
as well as issues identified and assessed in a survey submitted to the technical committees and based on RAS identification.
For many reasons, it is difficult for NERC to evaluate every emerging issue that can potentially impact reliability in the
future—including unforeseen and unpredictable events. Each year the RAS identifies a set of issues that are of particular
concern. RAS identified eight issues for use in a risk assessment survey. A risk assessment was performed on these issues
and detailed with additional information provided in Appendix V. The voting members of the Planning Committee,
Operating Committee, and Members Representative Committee provided their input on risk, which was defined as
determining likelihood of occurrence and consequence. They categorized each issue as high‐impact, medium‐impact, or
low‐impact to reliability and identified other characteristics of the impact.
Across North America, several issues affecting BPS reliability are regional. Because some Regions are more vulnerable to
certain risks than others, the possibility of a risk impacting the power system can vary. Looking at regionally aggregated
overall likelihood can be misleading as the possibility of an impact for one given area can be very high, but for another it can
be very low. By aggregating these two areas, the overall likelihood can significantly mask impacts that may be regionally
focused.
Two fundamental and measurable characteristics of BPS reliability form the foundation of the concepts described in this
document—resource adequacy108 and operating reliability109 (or system security). Each issue has the potential to impact
these two characteristics differently; therefore, the impacts to system reliability can be different and must be well‐
understood. While not considered in the figure below, integrating the likelihood of occurrence for each impact can provide
a greater understanding of expected reliability consequences.
On the impact side, a greater understanding of expected reliability consequences can be easily assessed. For example,
signifiacnt generator retirements have a greater impact on resource adequacy compared to operating reliability.
Conversely, transmission facility‐related impacts, such as geomagnetic disturbances and misoperation of Special Protection
Systems (SPS), have a greater impact on operating reliability, as these issues have a direct impact to system stability and the
performance of the transmission system under stressed conditions.
The results in the figure below are the product of combined industry surveys on emerging reliability issues, key findings
from this report, engineering judgment, and prior independent assessments released by NERC (Figure 43).
107 RISC Website: http://www.nerc.com/page.php?cid=1|117|428. 108
Defined as the ability of the bulk power system to supply the aggregate electrical demand and energy requirements of the customers at all times, taking into account
scheduled and reasonably expected unscheduled outages of system elements. 109
Defined as the ability of the bulk power system to withstand sudden disturbances such as electric short circuits or unanticipated loss of system elements from credible
contingencies.
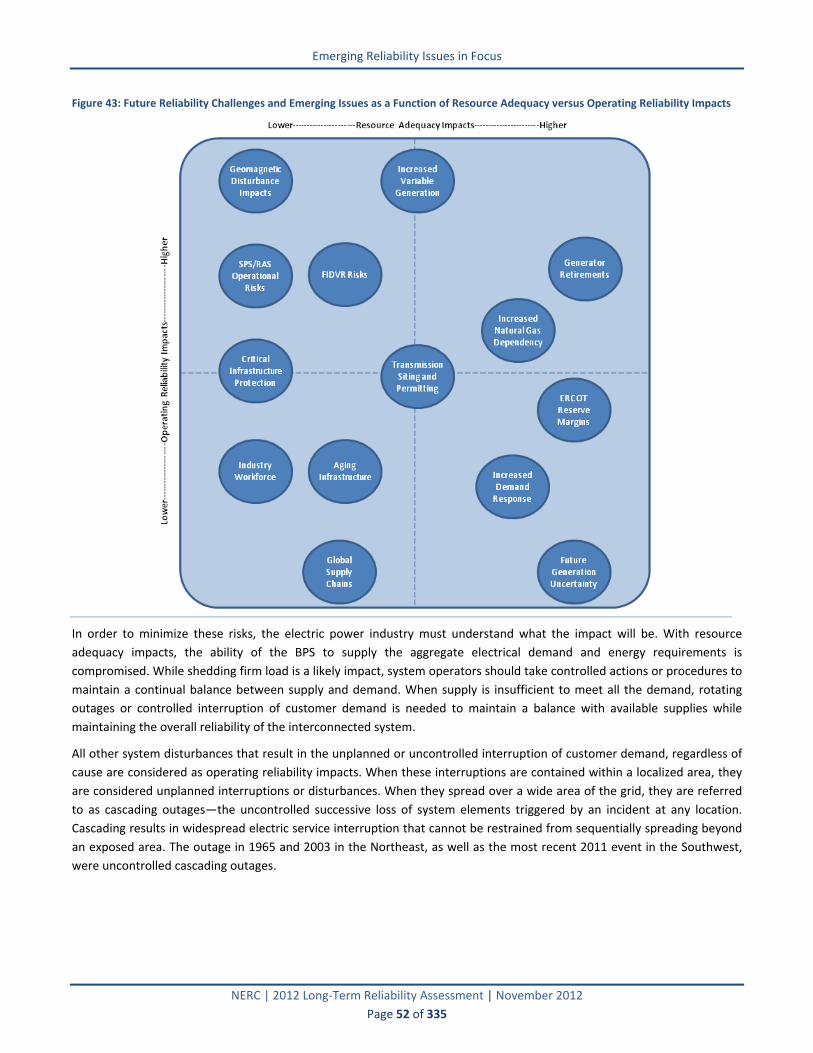
Emerging Reliability Issues in Focus
NERC | 2012 Long‐Term Reliability Assessment | November 2012
Page 52 of 335
Figure 43: Future Reliability Challenges and Emerging Issues as a Function of Resource Adequacy versus Operating Reliability Impacts
In order to minimize these risks, the electric power industry must understand what the impact will be. With resource
adequacy impacts, the ability of the BPS to supply the aggregate electrical demand and energy requirements is
compromised. While shedding firm load is a likely impact, system operators should take controlled actions or procedures to
maintain a continual balance between supply and demand. When supply is insufficient to meet all the demand, rotating
outages or controlled interruption of customer demand is needed to maintain a balance with available supplies while
maintaining the overall reliability of the interconnected system.
All other system disturbances that result in the unplanned or uncontrolled interruption of customer demand, regardless of
cause are considered as operating reliability impacts. When these interruptions are contained within a localized area, they
are considered unplanned interruptions or disturbances. When they spread over a wide area of the grid, they are referred
to as cascading outages—the uncontrolled successive loss of system elements triggered by an incident at any location.
Cascading results in widespread electric service interruption that cannot be restrained from sequentially spreading beyond
an exposed area. The outage in 1965 and 2003 in the Northeast, as well as the most recent 2011 event in the Southwest,
were uncontrolled cascading outages.

Emerging Reliability Issues in Focus
NERC | 2012 Long‐Term Reliability Assessment | November 2012
Page 53 of 335
Emerging Issues Risk Impact Scale
Extremely Low
Low
Medium
High
Extremely High
0%‐20%
21%‐40%
41%‐60%
61%‐80%
81%‐100%
Emerging Reliability Issues, Impact, and Risk Type
Reliability Issue Onset Time Impact Type Key Finding Associated Risks
Impact to Resource Adequacy
Impact to Real‐Time Operations
Impact to Long‐Term Planning
Significant Generator Retirements and Environmental Control Retrofit Outages
1‐4 years
Resource Adequacy 65 GW of Retirements
Projected
44 GW confirmed at the time of publication
Insufficient capacity to meet demand
Less flexibility to meet higher than forecasted demand
Real‐Time Operations
Long‐Term Planning
Accommodating Variable Resources in System Operations
Occurring and
Increasing
Real ‐Time Operations 21 GW of Planned
variable on‐peak capacity added by 2022
46 GW of Conceptual variable on‐peak capacity added by 2022
Unplanned system contingencies could develop
Insufficient capacity to meet demand
Real and reactive power system mismatches could develop
Long‐Term Planning
Increased Dependency on Natural Gas
Occurring and
Increasing
Resource Adequacy
Potential impacts to long‐term reliability, operational planning, and real‐time operations
Committed capacity unavailable for dispatch when needed
Insufficient planning of fuel contingencies and mitigation
Potential for wide‐spread common‐mode outages
Real‐Time Operations
Long‐Term Planning
Geomagnetic Disturbance Impacts to System Operations and Communications
Any
Real‐Time Operations Potential impacts to system operations and equipment
Unplanned system contingencies could develop
Solar Storm Forecast Warning
Frequency of coronal mass ejections
Long‐Term Planning Assessments underway to determine impact severity
Transmission Siting and Permitting
Occurring Long‐Term Planning
30,000 miles of transmission under construction + planned to be added from 2012‐2022
Capacity unable to reach demand
Unplanned system contingencies could develop without transmission reinforcements
Potential Operational Risks Associated with Interaction of Special Protection Schemes/Remedial Action Schemes
Occurring Real‐Time Operations Special Protection Schemes a leading cause of 2011 Pacific Southwest Outage
Unforeseen operational impacts with increased interaction of Special Protection System /Remedial Action Scheme
Global Supply Chains and Fuel Reliability
Any
Resource Adequacy Political Instability in countries supplying critical energy components
Loss of capacity due to loss of fuel
Potential for wide‐spread common‐mode outages
Real‐Time Operations
Assessment of Fault‐Induced Delayed Voltage Recovery (FIDVR) Simulation
Any Real‐Time Operations Planning Coordinators should study the impacts from FIDVR‐related events
System contingencies could develop that have not been fully analyzed and evaluated
Coordinated Cyber / Physical Attacks on Critical Infrastructure
Occurring Real‐Time Operations Potential impacts to system operations and equipment
Unplanned system contingencies could develop
Electricity Industry Workforce
Occurring Long‐Term Planning
Upcoming retirements of large numbers of veteran industry planners, operators, trades workers
Reduction in experienced industry resources and knowledge
Insufficient knowledge transfer efforts
Aging Infrastructure Occurring
Real‐Time Operations Infrastructure installed in the 1960s and 1970s (and in some cases earlier) is reaching the end of its projected lifecycle.
Infrastructure installed in the 1970s is reaching the end of its projected lifecycle.
Long‐Term Planning

Emerging Reliability Issues in Focus
NERC | 2012 Long‐Term Reliability Assessment | November 2012
Page 54 of 335
Emerging Reliability Issue Summaries Selected emerging reliability issues are summarized below. Additional detail is provided in Appendix V.
Significant Generator Retirements and Environmental Control Retrofit Outages
Largely due to the combination of low natural gas prices and environmental regulations, a significant amount of generation
is expected to retire over the next four years. Overall, generation retirements need to be evaluated and analyzed in an
integrated fashion. While the high degree of uncertainty surrounding retirement decisions continues to be exceedingly
difficult, power system planners must continue not only to study the effects of individual generator impacts, but also
recognize the cumulative impacts of multiple generator retirements.
In the United States, several regulations that directly affect the electric industry are either final or in the process of being
proposed by the U.S. Environmental Protection Agency (EPA). The most significant proposed EPA rules have been in
development for over 10 years and are currently undergoing court‐ordered revisions that must be implemented within
mandatory time frames. A significant retrofit effort is expected over the next 10 years in order to comply with federal and
state‐level environmental regulations. Environmental controls are expected to be put in place to meet newly finalized Clean
Air Act rules by the end of 2016. While federal water rules (i.e., Section 316 (b) of the Clean Water Act: Cooling Water
Intake Structures) may also affect retirements and outage scheduling, regulations have not yet been finalized.
Accommodating Variable Resources in System Operations
The expected significant increase in variable generation additions to the BPS will increase the amount of uncertainty that a
system operator must factor into operating decisions. To manage this increased uncertainty, the system operator must
have access to advanced variable generation forecasting techniques and have access to sufficient flexible resources to
mitigate the added variability and uncertainty associated with the large‐scale integration of variable generation. In this
respect, operating criteria, forecasting, commitment, scheduling, dispatch and balancing practices, procedures, and tools
must be enhanced to assist operators in maintaining BPS reliability. Improved operating practices, procedures and tools are
critical in order to integrate variable generation into the power system, as well as improve the control performance and
reliability characteristics of the power system. System resources supporting reliability, such as flexible generation and
responsive load, are finite. Operating practices, procedures, and tools that maximize the effective use of limited responsive
resources improve reliability and facilitate variable generation integration.
Increased Dependency on Natural Gas
The majority of new North American generating capacity projected for the next 10 years will rely on natural gas as its
primary fuel. With a shift to unconventional gas production in North America, the potential to increase availability of supply
makes gas‐fired generation a premier choice for new generating capacity in the future, overtaking and replacing coal‐fired
capacity. However, increased dependence on natural gas for generating capacity can amplify the BPS’s exposure to
interruptions in natural gas fuel supply and delivery. Mitigating strategies—such as storage, firm fuel contracting, alternate
pipelines, dual‐fuel capability, access to multiple natural gas basins, nearby plants using other fuels, or additional
transmission lines from other areas—can contribute to managing this risk.
In the future, the electric sector will be responsible for most of the growth in natural gas demand. The combination of this
growth in gas demand within the electric sector and its changing status among the gas‐consuming sectors has significantly
increased the interdependences of the two industries and increased the focus on the interface between them. A key
element of this interface focus is the need for increased coordination between the two industries, particularly at a regional
level.
Geomagnetic Disturbance Impacts to System Operations and Communications
In February 2012, NERC reported that the most likely result from a strong geomagnetic disturbance (GMD) is voltage
collapse. NERC also found that particularly large geomagnetically induced current (GIC) flows can result in transformer
damage and may ultimately result in the failure of some transformers. The risk of the introduction of GIC into the BPS may

Emerging Reliability Issues in Focus
NERC | 2012 Long‐Term Reliability Assessment | November 2012
Page 55 of 335
be at greater for Regions that are situated in the northern latitudes and have high ground conductivity. Depending on the
duration and severity of the occurrence, GIC can impact real‐time operations and equipment. Real‐time operations could be
impacted when reactive demands increase as transformers experience thermal heating from geomagnetically induced
currents. If reactive demands and geomagnetic currents are not properly monitored, situations could develop in which an
uncontrolled cascade of the BPS due to the introduction of geomagnetically induced currents ultimately results in voltage
collapse.
The industry is well‐equipped to face a small number of transformer failures; however, due to the concerns about an
extreme GMD event causing a larger‐than‐expected number of failures, it is imperative that the nature of the reliability risk
be quantified before a corrective action is developed. Therefore, the industry should consider vulnerability assessments,
equipment testing, operational procedure enhancements, and appropriate measures for grid and facility hardening to
address potential impacts.
Transmission Siting and Permitting
Siting difficulties have always been an issue for utilities. However, with increasing plans for new transmission, ensuring
transmission can sufficiently be built within a specified time period has increased the importance of this issue. Siting of new
bulk power transmission lines brings with it unique challenges due to the high visibility, their span through multiple states
and provinces, and, potentially, the amount of coordination required among multiple regulating agencies and authorities.
Lack of consistent and agreed‐upon cost allocation approaches (specific to transmission construction), coupled with public
opposition due to land use and property valuation concerns, have, at times, have resulted in long delays in transmission
construction. When construction is delayed, special operating procedures to maintain BPS reliability may be needed.
Potential Operational Risks Associated with Interaction of Special Protection System / Remedial Action Scheme
Special Protection Systems (SPS) and Remedial Action Schemes represent a planning and operation alternative to the
addition of new transmission facilities. Although an SPS is less costly and faster to install than building new facilities, it has
the risk of potentially failing to operate and adds planning and operational complexity. System operators need to be aware
of the potential impacts associated with an SPS or remedial action scheme. The possible lack of modeling requirements and
real‐time analysis capabilities of an SPS/RAS reduces the planners’ and operators’ capability to evaluate the reliability
impact that these tools bring into the system. These tools also had important implications during the Southwest outage in
September 2011.110 Accordingly, the objective of this emerging issue is to: (1) evaluate historical and future trends in SPS
identification and deployment; (2) identify limitations of SPS deployment and proliferation; (3) propose a framework for
assessing SPS risks; and (4) propose modeling and assessment improvements.
Global Supply Chains and Fuel Reliability
Reliance on global supply chains for fuel and other products used to generate electricity must be managed with a common
goal of reducing the risk of a prolonged disruption. The electric industry has a reputation for being risk averse; therefore,
discrete or short disruptions in the supply chain are less likely to cause great issue—operational and strategic plans are
often put in place to deal with a low‐occurrence event. However, large and prolonged supply chain impacts could disrupt
the ability for a given power plant, or group of power plants, to produce electricity and, therefore, cause significant
reliability concerns.
Of specific concern are global supply chains that are made up of weak chains (e.g., political uncertainty and instability, war‐
stricken states, weak ties to North American foreign affairs). Currently, there are two known potential supply chains of
specific concern to the electric power industry: scarcity of rare earth metals for nuclear generation and liquefied natural gas
imports from the Middle East.
110
NERC Southwest Blackout Event Reports: http://www.nerc.com/page.php?cid=5%7C407.

Emerging Reliability Issues in Focus
NERC | 2012 Long‐Term Reliability Assessment | November 2012
Page 56 of 335
Assessment of Fault‐Induced Delayed Voltage Recovery (FIDVR)
Fault‐Induced Delayed Voltage Recovery (FIDVR) events are characterized by a depressed voltage for 5 to 30 seconds
following a fault. These events are of concern because they show a temporary loss of voltage control in an area, and they
pose a risk of cascading to a larger area, especially if another unexpected event occurs while the voltage is depressed. These
events have been studied and are believed to be initiated by the stall of low inertia induction motors during the fault.
Motors at risk of stalling include compressor‐driven loads such as air conditioners. The subject of FIDVR events and their
causes and solutions is covered in a NERC report on this topic.111
Coordinated Cyber or Physical Attacks on Electricity Infrastructure
One of the principal types of High‐Impact, Low‐Frequency (HILF) events facing the BPS is a concerted, well‐planned cyber,
physical, or blended attack conducted by an active adversary against multiple points on the system. Such an attack,
although never experienced in North America, could damage or destroy key system components, significantly degrade
system operating conditions, and, in extreme cases, result in prolonged outages to large parts of the system. The rapid
convergence of the electric power system’s infrastructure with information and communications technologies, combined
with a new awareness of the sophistication of adversary capabilities, requires a fresh understanding of the risk and
subsequent well‐coordinated steps needed to improve the protection, resilience, and response capabilities of the BPS.
Electric Industry Workforce
The demand for industry workers to plan, maintain, and operate the BPS increases with the growing need for new
infrastructure investments in electric generation, delivery, and use technologies and the rising need for technology
innovation. The need for new infrastructure and technology innovations means a steady need for well‐trained engineers
and workers. The electric power industry is beginning to remedy the gap in qualified employees, but with the increased
need to plan, design, and operate the BPS to accommodate a variety of new technologies and processes, there is still
substantial interest in training and hiring workers to support industry needs and knowledge transfer.
Aging Infrastructure
Over the past decades, the majority of transmission investment was directed toward constructing new facilities to meet
customer load demands, and comparatively little capital investment was expended for refurbishing existing facilities. The
aging transmission system infrastructure has many challenges, such as the availability of spare parts, the obsolesce of older
equipment, the ability to maintain equipment due to outage scheduling restrictions, and the aging of the work force and
lost knowledge due to personnel retirements. Considering the diversity of equipment technologies and installation dates,
potential for increased failure rates should be evaluated. However, implementation of any replacement strategy and in‐
depth training programs require additional capital investment, engineering and design resources, and construction labor
resources, all of which are in relatively short supply.
111 http://www.nerc.com/docs/pc/tis/FIDV_R_Tech_Ref_V1‐1_PC_Approved.pdf.

Projected Demand, Resources, and Reserve Margins: 2013‐2022
NERC | 2012 Long‐Term Reliability Assessment | November 2012
Page 57 of 335
Projected Demand, Resources, and Reserve Margins (2013–22) The following section of the report represents the NERC‐wide reference case and 10‐year forecasts of Planning Reserve
Margins, capacity resources, seasonal peak demands, and transmission.
Planning Reserve Margins The electric industry has prepared plans to ensure the generation and delivery of reliable electricity throughout North
America. Based on NERC’s three different categories of Planning Reserve Margins (metrics used to measure the ability of a
system’s resources to meet customer demands based on current capacity plans and load forecasts), nearly all assessment
areas will remain above the NERC Reference Margin Level throughout the 5‐year (2017) assessment. The 10‐year (2022)
assessment shows a considerable decrease in Planning Reserve Margins, equating to more assessment areas being below
the NERC Reference Margin Level (Figure 44, Figure 45).
Figure 44: 2017 NERC‐Wide Peak Season Planning Reserve Margins
Figure 45: 2022 NERC‐Wide Peak Season Planning Reserve Margins
Significant challenges face the electric industry. These challenges may shift industry projections and cause the NERC
reference case to change, which would add considerable uncertainty—not only in the long term, but in the short‐term, as
well. Where markets exist, signals for new capacity must be effective for planning purposes and must reflect the lead times
necessary to construct new generation and any associated transmission. Regulations aimed at controlling environmental
‐5%0%5%10%15%20%25%30%35%40%45%50%55%60%65%
Anticipated Prospective Adjusted Potential NERC Reference Margin Level
‐5%0%5%10%15%20%25%30%35%40%45%50%55%60%65%
Anticipated Prospective Adjusted Potential NERC Reference Margin Level

Projected Demand, Resources, and Reserve Margins: 2013‐2022
NERC | 2012 Long‐Term Reliability Assessment | November 2012
Page 58 of 335
impacts caused by higher‐emission generating plants create additional concerns for industry planners, as regulatory
compliance deadlines could conflict with existing capacity plans and approval processes. Potential impacts could be both
local and regional and must be addressed accordingly.
The ERCOT Assessment Area will face resource adequacy challenges throughout the long‐term outlook due to the
uncertainty of plans for new capacity—demand continues to grow at a compound annual growth rate of 2.35 percent.
Although ERCOT and the Public Utility Commission of Texas (PUCT) have been proactive, new market rules and increased
demand response impacts have not been in place long enough to curb the continued decline of Planning Reserve
Margins.112 Planning Reserve Margins remain below the NERC Reference Margin Level of 13.75 percent throughout the
assessment period, turning negative in the latter years. Uncertainty surrounding plans for future capacity is the most
notable issue that may result in the need for emergency actions. Until new capacity projects come online, the use of
interruptible load, voltage reduction, or the implementation of other ERCOT‐specific Energy Emergency Alerts (EEA) plans
may become necessary. Impacts could be exacerbated by extreme weather conditions, such as drought and heat waves
that have become an ongoing concern in recent years. This would result in the highest recorded peak demand for the area
during the 2011 summer. Although improved 2012 spring rainfall has temporarily alleviated drought conditions, the
potential for extreme heat and corresponding increase in demand remains a monumental concern that will only be
mitigated by securing additional capacity or demand‐side management resources. Adequacy concerns in ERCOT could be
further exacerbated by the potential for more stringent emission requirements from the MATS rule, which could result in
additional project delays or cancellations of new capacity (Figure 46).
Figure 46: Assessment Areas with Anticipated Reserve Margins that fall below the NERC Reference Margin Level by 2022
As the Ontario Assessment Area phases out all remaining coal‐fired capacity by 2014, the province must manage a shifting
resource mix. Plans call for an increased dependence on nuclear resources. Several refurbished units are expected to return
to service after prolonged outages, with all of the coal units retired or converted to cleaner fuels. Retired units have been
replaced by new gas units, renewable generation, and restarted nuclear units. With these changing conditions, Planning
Reserve Margins remain adequate through 2017 but significantly decrease thereafter, becoming negative in the final years
of the outlook. Additional conceptual resources will be necessary, including scheduled refurbishments at both the Bruce
and Darlington nuclear plants, along with potential nuclear new‐build at the Darlington site.
112 The actions taken need evaluation time. While there have been no significant announcements of new generation yet, the work of the PUCT and ERCOT participants continues.
ERCOT
MISO
MRO‐Manitoba Hydro
MRO‐MAPP
MRO‐SaskPower
WECC‐BASN
WECC‐BC
WECC‐CALN
WECC‐MEXW
WECC‐NORW
WECC‐ROCK
Below NERC Reference Margin Level
2013 2014 2015 2016 2017 2018 2019 2020 2021 2022
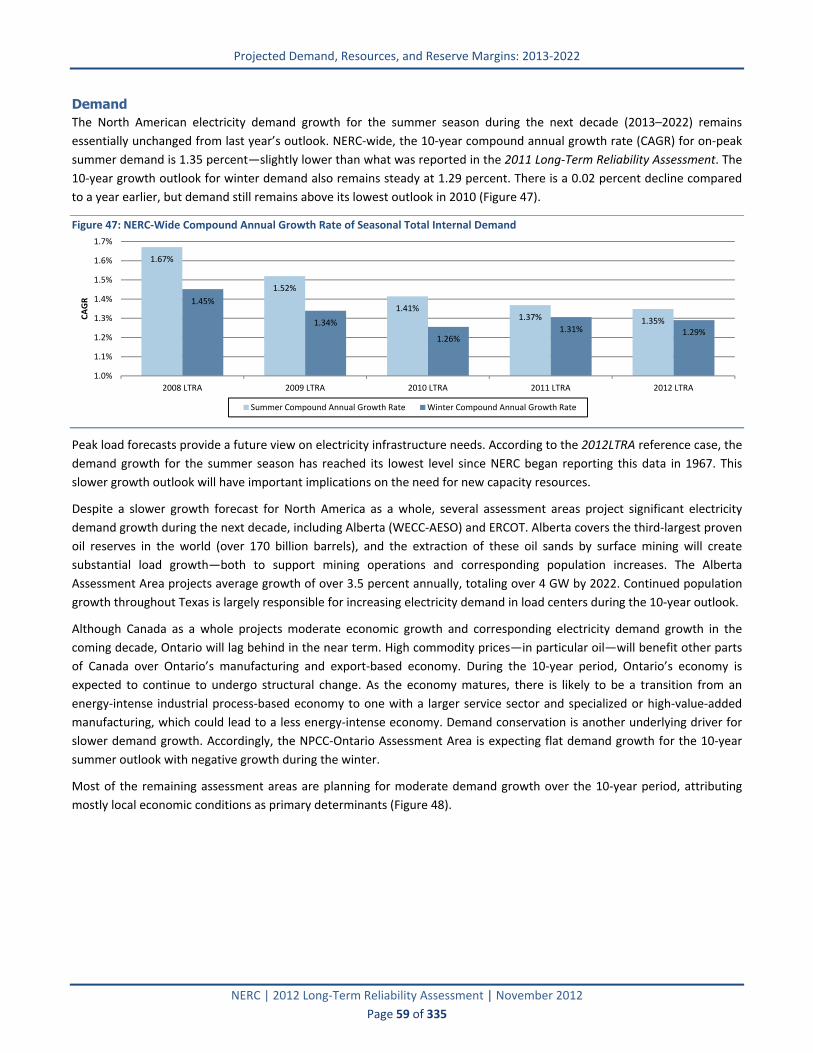
Projected Demand, Resources, and Reserve Margins: 2013‐2022
NERC | 2012 Long‐Term Reliability Assessment | November 2012
Page 59 of 335
Demand The North American electricity demand growth for the summer season during the next decade (2013–2022) remains
essentially unchanged from last year’s outlook. NERC‐wide, the 10‐year compound annual growth rate (CAGR) for on‐peak
summer demand is 1.35 percent—slightly lower than what was reported in the 2011 Long‐Term Reliability Assessment. The
10‐year growth outlook for winter demand also remains steady at 1.29 percent. There is a 0.02 percent decline compared
to a year earlier, but demand still remains above its lowest outlook in 2010 (Figure 47).
Figure 47: NERC‐Wide Compound Annual Growth Rate of Seasonal Total Internal Demand
Peak load forecasts provide a future view on electricity infrastructure needs. According to the 2012LTRA reference case, the
demand growth for the summer season has reached its lowest level since NERC began reporting this data in 1967. This
slower growth outlook will have important implications on the need for new capacity resources.
Despite a slower growth forecast for North America as a whole, several assessment areas project significant electricity
demand growth during the next decade, including Alberta (WECC‐AESO) and ERCOT. Alberta covers the third‐largest proven
oil reserves in the world (over 170 billion barrels), and the extraction of these oil sands by surface mining will create
substantial load growth—both to support mining operations and corresponding population increases. The Alberta
Assessment Area projects average growth of over 3.5 percent annually, totaling over 4 GW by 2022. Continued population
growth throughout Texas is largely responsible for increasing electricity demand in load centers during the 10‐year outlook.
Although Canada as a whole projects moderate economic growth and corresponding electricity demand growth in the
coming decade, Ontario will lag behind in the near term. High commodity prices—in particular oil—will benefit other parts
of Canada over Ontario’s manufacturing and export‐based economy. During the 10‐year period, Ontario’s economy is
expected to continue to undergo structural change. As the economy matures, there is likely to be a transition from an
energy‐intense industrial process‐based economy to one with a larger service sector and specialized or high‐value‐added
manufacturing, which could lead to a less energy‐intense economy. Demand conservation is another underlying driver for
slower demand growth. Accordingly, the NPCC‐Ontario Assessment Area is expecting flat demand growth for the 10‐year
summer outlook with negative growth during the winter.
Most of the remaining assessment areas are planning for moderate demand growth over the 10‐year period, attributing
mostly local economic conditions as primary determinants (Figure 48).
1.67%
1.52%
1.41%1.37% 1.35%
1.45%
1.34%
1.26%1.31% 1.29%
1.0%
1.1%
1.2%
1.3%
1.4%
1.5%
1.6%
1.7%
2008 LTRA 2009 LTRA 2010 LTRA 2011 LTRA 2012 LTRA
CAGR
Summer Compound Annual Growth Rate Winter Compound Annual Growth Rate

Projected Demand, Resources, and Reserve Margins: 2013‐2022
NERC | 2012 Long‐Term Reliability Assessment | November 2012
Page 60 of 335
Figure 48: Peak Demand Growth (MW) and Compound Annual Growth Rate (%) of Total Internal Demand by Assessment Area
Load Forecast Uncertainty
Forecasting electricity demand has become more complicated in recent years, and this issue was addressed thoroughly in
the 2011 Long‐Term Reliability Assessment.113 Conclusions highlighted the challenges of redefining methods based on
customer and utility behavior, the current state and outlook of the North American economy, and new developments in
long‐term weather projections. These challenges continue to make load forecasting more complex and are highlighted by
the year‐ahead outlook for NERC‐wide Net Energy for Load (NEL), a measurement of annual generation in megawatt‐hours
113
2011 Long‐Term Reliability Assessment. Load Forecasting Uncertainty. P. 107. http://www.nerc.com/files/2011%20LTRA_Final.pdf.
15,579 MW, 2.35%
6,313 MW, 1.43%
9,305 MW, 1.05%
264 MW, 0.88%
1,020 MW, 2.09%
663 MW, 2.07%
79 MW, 0.25%
3,818 MW, 1.44%
2,534 MW, 0.81%
142 MW, 0.07%
1,704 MW, 0.87%
20,166 MW, 1.36%
4,964 MW, 1.20%
6,288 MW, 1.44%
6,713 MW, 1.42%
2,809 MW, 1.15%
4,908 MW, 0.95%
4,190 MW, 3.67%
2,138 MW, 1.62%
1,221 MW, 1.51%
3,269 MW, 1.29%
4,296 MW, 1.44%
4,026 MW, 1.53%
2,478 MW, 1.08%
513, 2.35%
1,869 MW, 1.63%
11,602 MW, 2.27%
6,041 MW, 1.37%
11,322 MW, 1.62%
501 MW, 1.14%
1,047 MW, 2.19%
730 MW, 2.04%
131 MW, 0.27%
1,176 MW, 0.57%
979 MW, 0.43%
‐663 MW, ‐0.34%
2,766 MW, 0.79%
13,956 MW, 1.12%
4,813 MW, 1.17%
6,201 MW, 1.42%
6,360 MW, 1.43%
2,585 MW, 1.33%
4,012 MW, 1.03%
4,330 MW, 3.57%
1,303 MW, 1.24%
1,407 MW, 1.30%
1,834 MW, 1.05%
3,378 MW, 1.52%
2,941 MW, 1.69%
2,488 MW, 0.88%
347 MW, 2.35%
1,688 MW, 1.78%
ERCOT
FRCC
MISO
MRO‐Manitoba Hydro
MRO‐MAPP
MRO‐SaskPower
NPCC‐Maritimes
NPCC‐New England
NPCC‐New York
NPCC‐Ontario
NPCC‐Québec
PJM
SERC‐E
SERC‐N
SERC‐SE
SERC‐W
SPP
WECC‐AESO
WECC‐BASN
WECC‐BC
WECC‐CALN
WECC‐CALS
WECC‐DSW
WECC‐NORW
WECC‐MEXW
WECC‐ROCK
Summer Winter

Projected Demand, Resources, and Reserve Margins: 2013‐2022
NERC | 2012 Long‐Term Reliability Assessment | November 2012
Page 61 of 335
(MWh). Although year‐ahead projections were extremely accurate during the 1990s when economic growth was relatively
stable, the mild recession during the early 2000s largely contributed to the actual NEL falling below the forecast. Similarly,
the 2008 recession caused actual demand to drop significantly, which further supports the high correlation between
economic conditions and electricity use (Figure 49).
Figure 49: Net Energy for Load – Forecast vs. Actual
While unstable economic conditions have added complexity to load forecasting in recent years, utility integration of smart
grid‐related technologies has also had an influence. Electricity use with smart grid programs has encouraged consumers to
reduce or otherwise change their electricity usage during peak periods in response to time‐based rates or other forms of
financial incentives. Continued enrollment in large‐scale demand‐side management programs by industrial and commercial
customers will bear an even greater impact on load forecasts. As demand‐side management programs continue to evolve,
load forecasting methods will need to adapt accordingly to ensure demand projections remain a dependable source of
information for industry planners.
Demand-Side Management The use of demand‐side resources is expected to expand throughout North America, continuing the trend NERC has
observed since initially collecting this data in the 1980s. In recent years, as various new demand response and energy
efficiency programs have been introduced, NERC has strived to modify data collection and presentation as necessary to
keep up with an industry that continues to evolve. Additional information regarding how NERC collects and reports demand
response is included in Appendix V and VII in this assessment.
As increased demand‐side management in recent years has provided more flexibility for system operators, continued
penetration of these programs is forecast throughout the assessment period. However, it is important to consider how each
area forecasts the future availability of demand response during peak demand periods. Generally, most demand response
programs involve short‐term contracts between participants that provide increased certainty during the first three years. In
subsequent years, expected performance is based on area‐specific assumptions.
Demand Response as a percentage of Total Internal Demand is highest in the NPCC‐New England Assessment Area,
amounting to 10.1 percent in 2013. Projections are for a 5 percent increase during the next 10 years. By 2022, nearly 5 GW
of load‐modifying and resource‐side demand response is projected to be available during the summer peak. Similarly, MISO
is planning for over 3.7 GW in additional load‐modifying demand response during the assessment period (Figure 50).
3,250
3,500
3,750
4,000
4,250
4,500
4,750
5,000
5,250
‐6%
‐5%
‐4%
‐3%
‐2%
‐1%
0%
1%
2%
Gigaw
athourts (GWh)
Deviation from Forecast
Deviation Year‐Ahead Forecast Actual 2012 LTRA Forecast

Projected Demand, Resources, and Reserve Margins: 2013‐2022
NERC | 2012 Long‐Term Reliability Assessment | November 2012
Page 62 of 335
Figure 50: NERC‐Wide Demand Response: 10‐Year Outlook
In many cases, DR—especially load categorized as a resource—can offer more flexibility to operators and provide
redispatching options used to maintain reliability. Specifically, demand response programs in the industrial and commercial
sectors are even more impactful and usually involve contracts that require participants to respond when called upon by
system operators. Contract lengths rarely extend beyond three years with provisions, which limits the number of times a
participant will be called to respond in a given year. However, planners should consider the potential reliability
consequences of over‐dependence on these large‐scale demand response programs. Specifically, prolonged cases of
extreme demand could trigger the repeated use of demand response, ultimately causing customers to forego future
participation in these programs.
Generation Projections for future generation are based on several factors and can vary by NERC Region or Assessment Area. The
economic outlook, fuel prices, regulations, and load forecasts are all volatile and have important implications in regard to
decisions to build new capacity. According to the 2012LTRA reference case, a net of 51.3 GW of on‐peak generation is
expected to be added during the 10‐year NERC‐wide outlook (Figure 51).
3,271
3,271
241
241
7,285
7,321
272 495
1,279
1,813
3,229
3,660
4,9618,709
182200
1,388
3,267
11,000
13,200
6,675
8,800
933
1,104
5,041
5,583
ERCOT
FRCC
MISO
MRO‐Other
NPCC‐Total
PJM
SERC‐Total
SPP
WECC
2013 Resource‐Side 2013 Load‐Modifying
Resource‐SideLoad‐Modifying
2022 Resource Side 2022 Load‐Modifying

Projected Demand, Resources, and Reserve Margins: 2013‐2022
NERC | 2012 Long‐Term Reliability Assessment | November 2012
Page 63 of 335
Figure 51: NERC‐Wide Capacity: 10‐Year Outlook114
Current 2022 Planned 2022 Planned & Conceptual
Capacity Share Capacity Share Change Capacity Share Change
Coal 307,201 29.78% 290,915 26.86% ‐16,286 278,775 22.61% ‐28,426
Petroleum 52,498 5.09% 51,954 4.80% ‐544 51,377 4.17% ‐1,121
Gas 397,464 38.53% 429,462 39.65% 31,998 529,328 42.94% 131,863
Nuclear 113,821 11.03% 123,525 11.41% 9,704 136,361 11.06% 22,540
Other/Unknown 271 0.03% 5,840 0.54% 5,569 12,683 1.03% 12,412
Renewables 160,420 15.55% 181,311 16.74% 20,891 224,235 18.19% 63,815
TOTAL 1,031,676 100.00% 1,083,007 100.00% 51,332 1,232,759 100.00% 201,083
Coal
Projections for coal‐fired generation in the 2012LTRA Reference case point to a decline during the 10‐year outlook. In 2012,
coal’s total on‐peak contribution is approximately 30 percent—a slight decrease compared to 2011. Its share will continue
to decline, falling to under 27 percent in 2022, due to the projected retirements of over 16 GW throughout the next
decade. Conceptual plans for newer coal plants, some of which include carbon capture and storage (CCS) technologies,
could partially offset retirements by adding approximately 7 GW. Economic decisions caused by impacts—both direct and
indirect—of environmental regulations, coupled with presently inexpensive natural gas prices, are two key factors that
contribute to a shifting capacity mix. Coal retirements are widely projected throughout North America, with reliability
impacts dependent on each assessment area’s resource mix.
The reference case includes some consideration for federal and state regulations that are expected to impact coal‐fired
capacity in the United States. This includes regulation that supports the Clean Air Act115 but does not include the full extent
of these impacts. The age of a coal plant can impact retirement decisions spurred in part by environmental regulations with
impending costs to either retrofit applicable units with expensive environmental control equipment, or close the plant
permanently. Moreover, the potential investment in retrofit equipment generally becomes less economical if fewer years
remain on the life of a given plant. The potential investment in retrofit equipment generally becomes less economical if
fewer years remain on the life of a given plant. In NPCC, the New England Assessment Area includes over 6 GW of fossil‐
fueled generating units (primarily coal or oil) that are at least 40 years old, creating conditions more susceptible to unit
retirements than retrofits. The New York Assessment Area has also reported 1,200 MW of confirmed retirements.
On an assessment‐area basis, Ontario and PJM anticipate the most significant reduction in coal during the 10‐year outlook,
with unit retirement projections amounting to 3.4 GW and 12.7 GW, respectively. In Ontario, two coal‐fired units totaling
980 MW were closed in 2011, with the remaining 9 units in the province to be taken offline by the end of 2014. The PJM
114
Represents the “non‐coincident” NERC‐wide on‐peak capacity for each assessment area. 115 http://www.epa.gov/air/caa/; http://www.epa.gov/airtransport/; http://www.epa.gov/airquality/powerplanttoxics/index.html.
‐20
‐10
0
10
20
30
40
50
60
70
2013 2014 2015 2016 2017 2018 2019 2020 2021 2022
Gigaw
atts (G
W)

Projected Demand, Resources, and Reserve Margins: 2013‐2022
NERC | 2012 Long‐Term Reliability Assessment | November 2012
Page 64 of 335
projections indicate 14 units (1.3 GW) will shut down during 2012 with 60 additional units (9.8 GW) to close by 2015. Unit
retirements in the latter years of the 10‐year outlook are less certain, and reliability impacts are still being analyzed (Figure
52).
Figure 52: NERC‐Wide Coal‐ and Gas‐Fired Generation Outlook: 2008‐2012LTRA Reference Case Comparison
According to reference cases from the last four long‐term reliability asessments, NERC‐wide coal capacity on peak declined
by approximately 23.5 GW, from 330.6 GW in 2008 to 307.1 GW in 2012. Most of this decline in coal occurred during 2011,
as the finalization of several environmental regulations—specifically air‐related regulations—clearly impacted decisions of
plant owners and industry planners throughout the United States. Alternatives to coal have also become more prominent in
recent years. State and provincial renewable energy requirements and goals have created more localized policy incentives
to encourage more contribution of renewables in the capacity mix. For example, the Atikokan Generating Station, a coal
plant in the NPCC‐Ontario Assessment Area, is undergoing conversion to biomass that is expected to take place by 2014.
Additionally, the role of coal has been further diminished by the relatively new capability to run existing gas‐fired units as
baseload generation with a higher capacity factor (instead of only during peak periods).
Natural Gas
As coal’s contribution continues to decline, gas‐fired capacity is projected to outpace all other forms of generation in
growth, except for renewable, adding 32 GW by 2022 in the 2012LTRA Reference case. Conceptual projections amount to
an additional 68 GW, which is indicative of the industry’s high expectations for gas‐fired generation to account for a
majority of capacity introduced during the 10‐year outlook.
The conversion to—or development of—new gas‐fired units has become an attractive alternative to coal with the current
affordability of natural gas and the added benefit of relatively lower emissions. New gas‐fired units also have relatively low
capital costs, with a lead time of only two years compared to coal or nuclear plants, whose lead times range from 5 to 12
years. In many cases, existing coal‐fired plant sites are being converted to gas‐fired plants. In Ontario, plans are in place to
convert at least two units from coal to natural gas by 2014, with several other coal units currently under consideration.
Several coal plants in the WECC Assessment Area are also projecting unit conversions to natural gas as alternatives to
retrofitting or retiring coal units.
The extensive growth in gas‐fired capacity may not be caused entirely by the enduring decline in coal—the ease of
converting a coal‐fired plant to a gas‐fired plant may help alleviate reliability concerns that are inherent to large base‐load
retirements. The use of existing facilities (such as transmission, cooling towers, and other on‐site facilities) makes
2008 LTRA
2008 LTRA
2009 LTRA
2009 LTRA
2010 LTRA
2010 LTRA
2011 LTRA
2011 LTRA
2012 LTRA
2012 LTRA
280
290
300
310
320
330
340
350
360
370
380
390
400
410
420
430
440
2008 2009 2010 2011 2012 2013 2014 2015 2016 2017 2018 2019 2020 2021 2022
Megawatts (MW)
Gas‐Fired Generation Coal‐Fire Generation

Projected Demand, Resources, and Reserve Margins: 2013‐2022
NERC | 2012 Long‐Term Reliability Assessment | November 2012
Page 65 of 335
converting a plant especially economical and ensures the continued generation of reactive power used to serve nearby
loads.
From a reliability aspect, the increase in gas‐fired generation compliments the inherent variability of renewable resources
that are also experiencing continued growth. As wind and solar resources contribute more to service load at times of peak
demand, gas‐fired units can be ramped up or down as necessary, thus allowing operators more flexibility to offset
renewable variability.
Nuclear
NERC‐wide, nuclear additions are projected to add 10.4 GW of on‐peak capacity by 2022. Unit uprates account for a
significant portion of these additions and are partially offset by plans to take units offline for refurbishment in the later
years of the assessment. The contribution from nuclear power remains relatively stable throughout the 10‐year outlook.
This is partially due to the continued operation of plants built over 40 years ago. In the United States, the Nuclear
Regulatory Commission (NRC) has provided operating license renewals for 71 of the total fleet of 104 reactors, while an
additional 15 applications are currently under review. The Canadian Nuclear Safety Commission (CNSC) maintains similar
regulatory oversight of seven nuclear power plants at five sites in Canada.
For the first time in almost three decades, the NRC voted in February 2012 to grant a combined construction and operating
license to four units in the SERC Region. Units 3 and 4 at the Vogtle Nuclear Power Plant in the SERC‐SE Assessment Area
are expected to come online by the end of 2017, providing 2.2 GW of additional capacity. Units 2 and 3 of the VC Summer
Plant in SERC‐E are also expected to be operating as soon as 2016 and 2019, respectively, with each reactor providing 1.1
GW of capacity. Finally, the Bellefonte Unit 1 reactor is included in the Tennessee Valley Authority (TVA) Integrated
Resource Plan and for the purpose of this assessment is categorized as Future‐Planned, with an in‐service date of June
2020. License approval from the NRC is currently suspended.
In Canada, the Point Lepreau nuclear plant (totaling 660 MW) is projected to return to service by the end of 2012 after a
four‐year extended outage and will serve as the single largest unit and only nuclear facility in the Maritimes Assessment
Area.
In NPCC‐Ontario, nuclear generation will remain the largest contributor, providing over half the electricity in the area. Two
units at the Bruce A Nuclear Generating Station are currently undergoing refurbishments that will add 1,500 MW upon
completion. In the final years of the 10‐year outlook, plans call for the refurbishment of several units at the Bruce and
Darlington Nuclear Generating Stations. The Pickering Nuclear Generating Station (Units 5, 6, 7, and 8) is scheduled for
retirement by 2016 but is currently licensed through 2020, and extending the operating life of the four units is currently
under review, with a decision expected by the end of 2013.
In the NPCC‐Québec Assessment Area, the recently announced closure of the Gentilly‐2 generating station is scheduled for
December 2012 and is incorporated into the 2012LTRA Reference case.
Renewables
Contribution from renewable resources will continue to grow, as significant capacity additions are projected for both wind
and solar throughout North America. In 2012, renewable generation—including hydro as a share of total on‐peak
contribution—is 15.6 percent and expected to reach almost 17 percent by the end of 2022. Projections for new solar in
WECC—especially Southern California and Arizona, (WECC‐CALS and WECC‐DSW Assessment Areas)—account for most of
the 7 GW of NERC‐wide solar additions during the next 10 years. WECC also has aggressive plans for 13.4 GW of new wind
generation projected throughout the assessment period. In the NPCC Region, the Ontario and Québec Assessment Areas
will more than double current wind capacity during the next decade, adding approximately 5.2 GW. SPP planners expect the
addition of 11.6 GW of planned wind projects. PJM and ERCOT have project plans totaling 2,298 MW and 1,918 MW of
installed wind capacity, respectively. Non‐hydro renewable capacity additions are currently supported by federal tax credits

Projected Demand, Resources, and Reserve Margins: 2013‐2022
NERC | 2012 Long‐Term Reliability Assessment | November 2012
Page 66 of 335
and state Renewable Portfolio Standards (RPS); however, changes in the political landscape in the United States could put
the federal tax credits in jeopardy.
Additions of biomass capacity are most substantial in FRCC and most of the SERC Region. Biomass is projected to remain the
largest renewable resource in the FRCC Assessment Area, growing from 374 MW to 736 MW during the 10‐year outlook.
Planned additions for biomass capacity in the SERC‐E, SERC‐SE, and SERC‐W Assessment Areas amount to 216 MW. Similar
additions are also planned in the PJM, MRO‐SaskPower, and NPCC‐Maritimes Assessment Areas.
Uprates and additions in the NPCC‐Québec Assessment Area account for nearly half of the hydropower additions during the
10‐year outlook. Specifically, the commissioning of several new hydropower generating stations will add 2,160 MW to
Hydro‐Québec’s capacity mix, with an additional 500 MW of capacity uprates at existing plants.

NERC‐Wide Summary Tables (2013‐2022)
NERC | 2012 Long‐Term Reliability Assessment | November 2012
Page 67 of 335
NERC-Wide Summary Tables Table Notes All values are in megawatts, unless noted otherwise.
CAGR: Compound Annual Growth Rate
Net Internal Demand excludes all load‐modifying Demand Response; primary demand statistic for all NERC Planning Reserve
Margin calculations.
Reference: NERC Reference Margin Level as assigned by each NERC Region. If no Reference Margin Level is provided, NERC
applies a 15 percent and 10 percent level for thermal and hydro systems, respectively. The Reference Margin Level is subject to
change by season or year. For additional information, see respective assessment area section.

NERC‐Wide Summary Tables (2013‐2022)
NERC | 2012 Long‐Term Reliability Assessment | November 2012
Page 68 of 335
Demand, Resources, and Reserve Margins: 2013 Summer Demand (MW) Capacity Resources (MW) Planning Reserve Margins (%) NERC
Assessment Areas/Country Net Internal Total Internal Anticipated Prospective Adj. Potential Anticipated Prospective Adj. Potential Reference
ERCOT 65,649 66,928 74,448 74,448 74,656 13.40% 13.40% 13.72% 13.75%
FRCC 43,041 46,270 54,823 58,732 60,439 27.37% 36.46% 40.42% 15.00%
MISO 89,318 94,279 108,007 119,723 119,903 20.92% 34.04% 34.24% 16.30%
MRO‐MAPP 4,904 4,995 6,344 6,344 6,344 29.36% 29.36% 29.36% 15.00%
NPCC‐New England 26,629 27,765 35,265 35,265 35,329 32.43% 32.43% 32.67% 15.00%
NPCC‐New York 33,696 33,696 42,127 42,127 42,150 25.02% 25.02% 25.09% 16.00%
PJM 145,254 156,254 184,882 184,882 186,581 27.28% 27.28% 28.45% 15.40%
SERC‐E 41,805 43,733 52,271 52,271 52,285 25.03% 25.03% 25.07% 15.00%
SERC‐N 43,808 45,750 54,020 57,939 57,939 23.31% 32.26% 32.26% 15.00%
SERC‐SE 47,900 49,799 62,107 62,407 62,549 29.66% 30.29% 30.58% 15.00%
SERC‐W 25,015 25,921 34,335 38,854 38,864 37.26% 55.32% 55.36% 15.00%
SPP 54,247 55,180 65,335 70,419 70,524 20.44% 29.81% 30.01% 13.60%
WECC‐BASN 12,667 13,776 16,154 16,154 16,154 27.53% 27.53% 27.53% 12.60%
WECC‐CALN 25,841 26,645 29,757 29,757 29,757 15.16% 15.16% 15.16% 14.71%
WECC‐CALS 29,311 31,319 34,012 34,012 34,086 16.04% 16.04% 16.29% 15.14%
WECC‐DSW 27,034 27,576 39,623 39,623 39,804 46.57% 46.57% 47.24% 13.50%
WECC‐NORW 24,310 24,380 28,919 28,919 28,920 18.96% 18.96% 18.96% 17.90%
WECC‐ROCK 11,434 11,904 14,285 14,285 14,288 24.93% 24.93% 24.96% 14.65%
TOTAL‐UNITED STATES 751,862 786,170 936,713 966,160 970,572 24.59% 28.50% 29.09% 15.00%
MRO‐Manitoba Hydro 3,210 3,210 4,597 4,597 4,597 43.21% 43.21% 43.21% 12.00%
MRO‐SaskPower 3,184 3,275 3,628 3,628 3,628 13.93% 13.93% 13.93% 11.00%
NPCC‐Maritimes 3,104 3,435 6,597 6,597 6,597 112.52% 112.52% 112.52% 20.00%
NPCC‐Ontario 23,301 23,301 31,938 31,938 31,938 37.07% 37.07% 37.07% 19.70%
NPCC‐Québec 21,115 21,115 31,821 31,821 31,821 50.71% 50.71% 50.71% 9.60%
WECC‐AESO 10,903 10,941 12,994 12,994 12,994 19.18% 19.18% 19.18% 12.24%
WECC‐BC 8,449 8,449 11,975 11,975 11,975 41.74% 41.74% 41.74% 12.51%
TOTAL‐CANADA 73,266 73,726 103,550 103,550 103,550 41.34% 41.34% 41.34% 10.00%
WECC‐MEXW 2,203 2,203 2,641 2,641 2,641 19.89% 19.89% 19.89% 11.86%
TOTAL‐MÉXICO 2,203 2,203 2,641 2,641 2,641 19.89% 19.89% 19.89% 11.86%
TOTAL‐NERC 827,330 862,098 1,042,904 1,072,351 1,076,763 26.06% 29.62% 30.15% 15.00%
Demand, Resources, and Reserve Margins: 2013/2014 Winter Demand (MW) Capacity Resources (MW) Planning Reserve Margins (%) NERC
Assessment Areas/Country Net Internal Total Internal Anticipated Prospective Adj. Potential Anticipated Prospective Adj. Potential Reference
ERCOT 50,263 51,734 76,915 76,915 78,081 53.03% 53.03% 55.34% 13.75%
FRCC 43,049 46,367 58,229 61,616 62,777 35.26% 43.13% 45.83% 15.00%
MISO 69,663 72,572 109,462 121,135 121,156 57.13% 73.89% 73.92% 16.30%
MRO‐MAPP 4,858 4,858 6,673 6,673 6,673 37.37% 37.37% 37.37% 15.00%
NPCC‐New England 21,383 22,510 37,848 37,848 38,098 77.00% 77.00% 78.17% 15.00%
NPCC‐New York 24,929 24,929 42,883 42,883 43,216 72.02% 72.02% 73.36% 16.00%
PJM 121,160 132,160 184,925 184,925 186,623 52.63% 52.63% 54.03% 15.40%
SERC‐E 42,042 43,582 54,712 54,712 54,726 30.14% 30.14% 30.17% 15.00%
SERC‐N 43,734 45,713 68,909 72,900 72,900 57.56% 66.69% 66.69% 15.00%
SERC‐SE 44,652 46,534 64,449 64,749 64,806 44.34% 45.01% 45.14% 15.00%
SERC‐W 19,731 20,497 42,929 47,197 47,207 117.57% 139.20% 139.25% 15.00%
SPP 40,983 41,714 61,197 66,023 67,069 49.32% 61.10% 63.65% 13.60%
WECC‐BASN 10,842 11,134 13,760 13,760 13,760 26.91% 26.91% 26.91% 13.49%
WECC‐CALN 18,407 18,664 22,557 22,557 22,557 22.55% 22.55% 22.55% 11.86%
WECC‐CALS 22,360 23,229 34,561 34,561 34,635 54.57% 54.57% 54.90% 11.03%
WECC‐DSW 17,845 18,124 34,086 34,086 34,253 91.01% 91.01% 91.95% 13.96%
WECC‐NORW 30,217 30,270 36,285 36,285 36,285 20.08% 20.08% 20.08% 19.90%
WECC‐ROCK 9,565 9,833 14,023 14,023 14,259 46.61% 46.61% 49.08% 15.68%
TOTAL‐UNITED STATES 635,683 664,424 964,403 992,850 999,083 51.71% 56.19% 57.17% 15.00%
MRO‐Manitoba Hydro 4,661 4,661 5,996 5,996 5,996 28.63% 28.63% 28.63% 12.00%
MRO‐SaskPower 3,580 3,671 4,125 4,125 4,125 15.24% 15.24% 15.24% 11.00%
NPCC‐Maritimes 5,169 5,421 6,878 6,878 6,878 33.06% 33.06% 33.06% 20.00%
NPCC‐Ontario 22,192 22,192 32,060 32,060 32,074 44.47% 44.47% 44.53% 18.60%
NPCC‐Québec 37,810 37,810 42,483 42,483 42,483 12.36% 12.36% 12.36% 10.00%
WECC‐AESO 11,664 11,664 13,831 13,831 13,831 18.58% 18.58% 18.58% 11.71%
WECC‐BC 11,416 11,416 13,384 13,384 13,384 17.24% 17.24% 17.24% 16.16%
TOTAL‐CANADA 96,492 96,835 118,757 118,757 118,770 23.07% 23.07% 23.09% 10.00%
WECC‐MEXW 1,494 1,494 2,434 2,434 2,434 62.92% 62.92% 62.92% 10.71%
TOTAL‐MÉXICO 1,494 1,494 2,434 2,434 2,434 62.92% 62.92% 62.92% 10.71%
TOTAL‐NERC 733,669 762,753 1,085,594 1,114,040 1,120,287 47.97% 51.85% 52.70% 15.00%

NERC‐Wide Summary Tables (2013‐2022)
NERC | 2012 Long‐Term Reliability Assessment | November 2012
Page 69 of 335
Demand, Resources, and Reserve Margins: 2014 Summer Demand (MW) Capacity Resources (MW) Planning Reserve Margins (%) NERC
Assessment Areas/Country Net Internal Total Internal Anticipated Prospective Adj. Potential Anticipated Prospective Adj. Potential Reference
ERCOT 68,403 69,721 74,498 74,498 75,074 8.91% 8.91% 9.75% 13.75%
FRCC 43,618 46,857 55,343 60,273 63,001 26.88% 38.18% 44.44% 15.00%
MISO 90,707 96,129 108,139 119,855 120,036 19.22% 32.13% 32.33% 16.30%
MRO‐MAPP 5,024 5,117 6,370 6,370 6,370 26.79% 26.79% 26.79% 15.00%
NPCC‐New England 26,877 28,275 35,160 35,160 35,498 30.82% 30.82% 32.07% 15.00%
NPCC‐New York 33,914 33,914 42,077 42,077 42,129 24.07% 24.07% 24.22% 16.00%
PJM 146,642 159,842 185,879 185,879 188,912 26.76% 26.76% 28.83% 15.40%
SERC‐E 42,412 44,457 52,658 52,658 52,672 24.16% 24.16% 24.19% 15.00%
SERC‐N 44,387 46,542 55,142 59,061 59,061 24.23% 33.06% 33.06% 15.00%
SERC‐SE 48,738 50,838 62,901 63,201 63,443 29.06% 29.68% 30.17% 15.00%
SERC‐W 25,257 26,166 34,943 39,462 40,172 38.35% 56.24% 59.05% 15.00%
SPP 54,794 55,732 66,086 71,170 71,280 20.61% 29.89% 30.09% 13.60%
WECC‐BASN 13,025 14,144 15,909 15,909 16,355 22.14% 22.14% 25.57% 12.60%
WECC‐CALN 26,154 26,971 30,031 30,031 30,031 14.82% 14.82% 14.82% 14.71%
WECC‐CALS 29,901 31,896 36,162 36,162 36,236 20.94% 20.94% 21.19% 15.14%
WECC‐DSW 27,252 27,847 39,110 39,110 39,551 43.51% 43.51% 45.13% 13.50%
WECC‐NORW 24,609 24,694 29,042 29,042 29,043 18.02% 18.02% 18.02% 17.90%
WECC‐ROCK 11,619 12,107 14,164 14,164 14,167 21.91% 21.91% 21.93% 14.65%
TOTAL‐UNITED STATES 763,332 801,249 943,615 974,083 983,032 23.62% 27.61% 28.78% 15.00%
MRO‐Manitoba Hydro 3,238 3,238 4,607 4,607 4,607 42.26% 42.26% 42.26% 12.00%
MRO‐SaskPower 3,335 3,426 3,762 3,762 3,762 12.79% 12.79% 12.79% 11.00%
NPCC‐Maritimes 3,138 3,469 6,610 6,610 6,610 110.64% 110.64% 110.64% 20.00%
NPCC‐Ontario 23,080 23,080 30,023 30,023 30,035 30.08% 30.08% 30.14% 18.60%
NPCC‐Québec 21,550 21,550 31,755 31,755 31,755 47.36% 47.36% 47.36% 10.00%
WECC‐AESO 11,510 11,548 13,765 13,765 13,765 19.59% 19.59% 19.59% 12.24%
WECC‐BC 8,684 8,684 12,218 12,218 12,218 40.70% 40.70% 40.70% 12.51%
TOTAL‐CANADA 74,535 74,995 102,739 102,739 102,751 37.84% 37.84% 37.86% 10.00%
WECC‐MEXW 2,260 2,260 2,923 2,923 2,923 29.35% 29.35% 29.35% 11.86%
TOTAL‐MÉXICO 2,260 2,260 2,923 2,923 2,923 29.35% 29.35% 29.35% 11.86%
TOTAL‐NERC 840,127 878,504 1,049,277 1,079,745 1,088,707 24.90% 28.52% 29.59% 15.00%
Demand, Resources, and Reserve Margins: 2014/2015 Winter Demand (MW) Capacity Resources (MW) Planning Reserve Margins (%) NERC
Assessment Areas/Country Net Internal Total Internal Anticipated Prospective Adj. Potential Anticipated Prospective Adj. Potential Reference
ERCOT 50,533 52,063 76,976 76,976 79,552 52.33% 52.33% 57.43% 13.75%
FRCC 44,228 47,568 61,341 63,983 64,399 38.69% 44.67% 45.61% 15.00%
MISO 74,965 78,143 109,692 121,524 121,704 46.32% 62.11% 62.35% 16.30%
MRO‐MAPP 4,999 4,999 6,713 6,713 6,713 34.28% 34.28% 34.28% 15.00%
NPCC‐New England 21,285 22,670 37,197 37,197 37,570 74.75% 74.75% 76.51% 15.00%
NPCC‐New York 24,999 24,999 41,530 41,530 42,194 66.13% 66.13% 68.78% 16.00%
PJM 121,571 134,771 185,881 185,881 188,914 52.90% 52.90% 55.39% 15.40%
SERC‐E 42,408 43,977 55,191 55,191 55,205 30.14% 30.14% 30.18% 15.00%
SERC‐N 44,212 46,433 68,909 72,900 72,900 55.86% 64.89% 64.89% 15.00%
SERC‐SE 45,103 47,197 65,284 65,584 65,742 44.75% 45.41% 45.76% 15.00%
SERC‐W 20,042 20,835 43,537 47,805 48,515 117.23% 138.53% 142.07% 15.00%
SPP 41,345 42,010 61,824 66,651 67,756 49.53% 61.21% 63.88% 13.60%
WECC‐BASN 10,913 11,215 13,513 13,513 13,959 23.82% 23.82% 27.91% 13.49%
WECC‐CALN 18,707 18,977 24,470 24,470 24,470 30.81% 30.81% 30.81% 11.86%
WECC‐CALS 22,893 23,753 34,228 34,228 34,302 49.51% 49.51% 49.83% 11.03%
WECC‐DSW 18,095 18,380 34,397 34,397 34,569 90.09% 90.09% 91.04% 13.96%
WECC‐NORW 30,507 30,577 36,683 36,683 36,683 20.24% 20.24% 20.25% 19.90%
WECC‐ROCK 9,709 9,978 13,318 13,318 13,631 37.17% 37.17% 40.39% 15.68%
TOTAL‐UNITED STATES 646,514 678,545 970,684 998,544 1,008,779 50.14% 54.45% 56.03% 15.00%
MRO‐Manitoba Hydro 4,712 4,712 6,039 6,039 6,039 28.18% 28.18% 28.18% 12.00%
MRO‐SaskPower 3,738 3,829 4,161 4,161 4,161 11.33% 11.33% 11.33% 11.00%
NPCC‐Maritimes 5,166 5,420 6,893 6,893 6,893 33.45% 33.45% 33.45% 20.00%
NPCC‐Ontario 21,890 21,890 29,908 29,908 30,192 36.63% 36.63% 37.92% 19.80%
NPCC‐Québec 38,062 38,062 42,971 42,971 42,971 12.90% 12.90% 12.90% 10.50%
WECC‐AESO 12,162 12,162 15,685 15,685 15,685 28.97% 28.97% 28.97% 11.71%
WECC‐BC 11,738 11,738 13,869 13,869 13,869 18.15% 18.15% 18.15% 16.16%
TOTAL‐CANADA 97,467 97,812 119,526 119,526 119,811 22.63% 22.63% 22.92% 10.00%
WECC‐MEXW 1,532 1,532 2,617 2,617 2,617 70.84% 70.84% 70.84% 10.71%
TOTAL‐MÉXICO 1,532 1,532 2,617 2,617 2,617 70.84% 70.84% 70.84% 10.71%
TOTAL‐NERC 745,513 777,889 1,092,828 1,120,688 1,131,207 46.59% 50.32% 51.74% 15.00%

NERC‐Wide Summary Tables (2013‐2022)
NERC | 2012 Long‐Term Reliability Assessment | November 2012
Page 70 of 335
Demand, Resources, and Reserve Margins: 2015 Summer Demand (MW) Capacity Resources (MW) Planning Reserve Margins (%) NERC
Assessment Areas/Country Net Internal Total Internal Anticipated Prospective Adj. Potential Anticipated Prospective Adj. Potential Reference
ERCOT 71,692 73,054 76,006 76,006 76,751 6.02% 6.02% 7.06% 13.75%
FRCC 44,459 47,758 57,181 61,286 63,188 28.62% 37.85% 42.13% 15.00%
MISO 91,096 96,929 108,443 120,916 121,853 19.04% 32.73% 33.76% 16.30%
MRO‐MAPP 5,135 5,230 6,430 6,430 6,430 25.21% 25.21% 25.21% 15.00%
NPCC‐New England 27,193 28,840 34,997 34,997 35,510 28.70% 28.70% 30.59% 15.00%
NPCC‐New York 34,151 34,151 42,077 42,077 42,209 23.21% 23.21% 23.59% 16.00%
PJM 149,968 163,168 180,473 180,473 188,445 20.34% 20.34% 25.66% 15.40%
SERC‐E 42,750 44,903 52,658 52,658 52,672 23.18% 23.18% 23.21% 15.00%
SERC‐N 44,952 47,303 55,142 59,061 59,061 22.67% 31.39% 31.39% 15.00%
SERC‐SE 49,227 51,431 62,913 63,213 63,456 27.80% 28.41% 28.90% 15.00%
SERC‐W 25,623 26,563 34,970 39,489 41,173 36.48% 54.12% 60.69% 15.00%
SPP 54,788 55,766 66,237 71,321 71,440 20.90% 30.17% 30.39% 13.60%
WECC‐BASN 13,354 14,482 15,999 15,999 16,445 19.81% 19.81% 23.15% 12.60%
WECC‐CALN 26,471 27,298 31,313 31,313 31,313 18.29% 18.29% 18.29% 14.71%
WECC‐CALS 30,467 32,472 36,278 36,278 36,351 19.07% 19.07% 19.31% 15.14%
WECC‐DSW 27,551 28,179 40,140 40,140 40,708 45.69% 45.69% 47.75% 13.50%
WECC‐NORW 24,872 24,967 29,613 29,613 29,613 19.06% 19.06% 19.06% 17.90%
WECC‐ROCK 11,827 12,330 14,165 14,165 14,172 19.77% 19.77% 19.83% 14.65%
TOTAL‐UNITED STATES 775,577 814,823 945,034 975,433 990,788 21.85% 25.77% 27.75% 15.00%
MRO‐Manitoba Hydro 3,207 3,207 4,944 4,944 4,944 54.15% 54.15% 54.15% 12.00%
MRO‐SaskPower 3,444 3,535 3,840 3,840 3,840 11.51% 11.51% 11.51% 11.00%
NPCC‐Maritimes 3,117 3,448 6,538 6,538 6,538 109.76% 109.76% 109.76% 20.00%
NPCC‐Ontario 22,859 22,859 29,725 29,725 29,962 30.03% 30.03% 31.07% 19.80%
NPCC‐Québec 21,642 21,642 32,489 32,489 32,489 50.12% 50.12% 50.12% 10.50%
WECC‐AESO 12,039 12,077 14,613 14,613 14,613 21.38% 21.38% 21.38% 12.24%
WECC‐BC 8,834 8,834 11,957 11,957 11,957 35.36% 35.36% 35.36% 12.51%
TOTAL‐CANADA 75,142 75,602 104,107 104,107 104,344 38.55% 38.55% 38.86% 10.00%
WECC‐MEXW 2,317 2,317 2,923 2,923 2,923 26.17% 26.17% 26.17% 11.86%
TOTAL‐MÉXICO 2,317 2,317 2,923 2,923 2,923 26.17% 26.17% 26.17% 11.86%
TOTAL‐NERC 853,036 892,742 1,052,064 1,082,463 1,098,055 23.33% 26.90% 28.72% 15.00%
Demand, Resources, and Reserve Margins: 2015/2016 Winter Demand (MW) Capacity Resources (MW) Planning Reserve Margins (%) NERC
Assessment Areas/Country Net Internal Total Internal Anticipated Prospective Adj. Potential Anticipated Prospective Adj. Potential Reference
ERCOT 53,378 54,972 78,473 78,473 81,845 47.01% 47.01% 53.33% 13.75%
FRCC 44,790 48,172 60,166 62,831 63,270 34.33% 40.28% 41.26% 15.00%
MISO 75,354 78,773 109,996 122,623 123,597 45.97% 62.73% 64.02% 16.30%
MRO‐MAPP 5,074 5,074 6,840 6,840 6,840 34.82% 34.82% 34.82% 15.00%
NPCC‐New England 21,193 22,825 37,531 37,531 38,259 77.09% 77.09% 80.53% 15.00%
NPCC‐New York 25,053 25,053 41,480 41,480 43,325 65.57% 65.57% 72.93% 16.00%
PJM 123,711 136,911 180,744 180,744 188,715 46.10% 46.10% 52.55% 15.40%
SERC‐E 42,934 44,520 55,091 55,091 55,105 28.32% 28.32% 28.35% 15.00%
SERC‐N 44,685 47,166 68,909 72,900 72,900 54.21% 63.14% 63.14% 15.00%
SERC‐SE 45,615 47,814 65,303 65,603 65,760 43.16% 43.82% 44.16% 15.00%
SERC‐W 20,209 20,992 43,564 47,832 49,528 115.57% 136.69% 145.08% 15.00%
SPP 41,225 42,040 61,972 66,798 67,995 50.33% 62.04% 64.94% 13.60%
WECC‐BASN 11,167 11,472 13,711 13,711 14,190 22.78% 22.78% 27.07% 13.49%
WECC‐CALN 18,937 19,212 24,395 24,395 24,395 28.82% 28.82% 28.82% 11.86%
WECC‐CALS 23,235 24,106 34,020 34,020 34,094 46.42% 46.42% 46.74% 11.03%
WECC‐DSW 18,431 18,721 34,917 34,917 34,938 89.45% 89.45% 89.57% 13.96%
WECC‐NORW 30,763 30,843 37,163 37,163 37,163 20.80% 20.80% 20.80% 19.90%
WECC‐ROCK 9,918 10,189 13,244 13,244 13,637 33.54% 33.54% 37.50% 15.68%
TOTAL‐UNITED STATES 655,672 688,855 967,521 996,199 1,015,559 47.56% 51.94% 54.89% 15.00%
MRO‐Manitoba Hydro 4,723 4,723 6,106 6,106 6,106 29.28% 29.28% 29.28% 12.00%
MRO‐SaskPower 3,859 3,950 4,377 4,377 4,377 13.43% 13.43% 13.43% 11.00%
NPCC‐Maritimes 5,165 5,419 6,832 6,832 6,832 32.29% 32.29% 32.29% 20.00%
NPCC‐Ontario 21,500 21,500 31,038 31,038 31,821 44.36% 44.36% 48.01% 19.20%
NPCC‐Québec 38,527 38,527 43,197 43,197 43,197 12.12% 12.12% 12.12% 11.40%
WECC‐AESO 12,801 12,801 17,568 17,568 17,568 37.24% 37.24% 37.24% 11.71%
WECC‐BC 11,943 11,943 14,320 14,320 14,320 19.90% 19.90% 19.90% 16.16%
TOTAL‐CANADA 98,517 98,863 123,438 123,438 124,221 25.30% 25.30% 26.09% 10.00%
WECC‐MEXW 1,571 1,571 2,750 2,750 2,750 75.07% 75.07% 75.07% 10.71%
TOTAL‐MÉXICO 1,571 1,571 2,750 2,750 2,750 75.07% 75.07% 75.07% 10.71%
TOTAL‐NERC 755,760 789,289 1,093,709 1,122,387 1,142,531 44.72% 48.51% 51.18% 15.00%

NERC‐Wide Summary Tables (2013‐2022)
NERC | 2012 Long‐Term Reliability Assessment | November 2012
Page 71 of 335
Demand, Resources, and Reserve Margins: 2016 Summer Demand (MW) Capacity Resources (MW) Planning Reserve Margins (%) NERC
Assessment Areas/Country Net Internal Total Internal Anticipated Prospective Adj. Potential Anticipated Prospective Adj. Potential Reference
ERCOT 73,957 75,366 78,166 78,166 79,159 5.69% 5.69% 7.03% 13.75%
FRCC 45,242 48,594 56,591 60,718 62,643 25.08% 34.21% 38.46% 15.00%
MISO 91,556 97,811 108,564 121,037 121,974 18.58% 32.20% 33.22% 16.30%
MRO‐MAPP 5,406 5,503 6,512 6,512 6,512 20.46% 20.46% 20.46% 15.00%
NPCC‐New England 27,520 29,400 33,349 33,349 34,506 21.18% 21.18% 25.39% 15.00%
NPCC‐New York 34,345 34,345 42,077 42,077 42,725 22.51% 22.51% 24.40% 16.00%
PJM 152,491 165,691 180,821 180,821 190,190 18.58% 18.58% 24.72% 15.40%
SERC‐E 43,235 45,436 53,675 53,675 53,689 24.15% 24.15% 24.18% 15.00%
SERC‐N 45,537 47,974 55,142 59,061 60,706 21.09% 29.70% 33.31% 15.00%
SERC‐SE 49,823 52,045 65,326 65,626 65,868 31.12% 31.72% 32.20% 15.00%
SERC‐W 25,937 26,881 35,171 39,690 41,476 35.60% 53.03% 59.91% 15.00%
SPP 55,368 56,364 66,084 71,167 71,287 19.35% 28.53% 28.75% 13.60%
WECC‐BASN 13,607 14,765 16,067 16,067 16,834 18.08% 18.08% 23.72% 12.60%
WECC‐CALN 27,072 27,904 31,406 31,406 31,408 16.01% 16.01% 16.02% 14.71%
WECC‐CALS 30,796 32,821 36,535 36,535 36,713 18.63% 18.63% 19.21% 15.14%
WECC‐DSW 28,035 28,679 41,473 41,473 42,100 47.93% 47.93% 50.17% 13.50%
WECC‐NORW 25,155 25,270 30,917 30,917 30,918 22.91% 22.91% 22.91% 17.90%
WECC‐ROCK 12,048 12,563 14,222 14,222 14,225 18.04% 18.04% 18.07% 14.65%
TOTAL‐UNITED STATES 787,129 827,411 952,097 982,518 1,002,933 20.96% 24.82% 27.42% 15.00%
MRO‐Manitoba Hydro 3,244 3,244 4,949 4,949 4,949 52.56% 52.56% 52.56% 12.00%
MRO‐SaskPower 3,533 3,624 4,071 4,071 4,071 15.22% 15.22% 15.22% 11.00%
NPCC‐Maritimes 3,110 3,441 6,542 6,542 6,542 110.34% 110.34% 110.34% 20.00%
NPCC‐Ontario 22,638 22,638 28,801 28,801 29,455 27.22% 27.22% 30.11% 19.20%
NPCC‐Québec 21,883 21,883 33,505 33,505 33,505 53.11% 53.11% 53.11% 11.40%
WECC‐AESO 12,604 12,642 16,182 16,182 16,182 28.39% 28.39% 28.39% 12.24%
WECC‐BC 8,913 8,913 11,909 11,909 11,909 33.62% 33.62% 33.62% 12.51%
TOTAL‐CANADA 75,925 76,385 105,959 105,959 106,613 39.56% 39.56% 40.42% 10.00%
WECC‐MEXW 2,374 2,374 2,924 2,924 3,264 23.16% 23.16% 37.50% 11.86%
TOTAL‐MÉXICO 2,374 2,374 2,924 2,924 3,264 23.16% 23.16% 37.50% 11.86%
TOTAL‐NERC 865,428 906,170 1,060,979 1,091,401 1,112,810 22.60% 26.11% 28.58% 15.00%
Demand, Resources, and Reserve Margins: 2016/2017 Winter Demand (MW) Capacity Resources (MW) Planning Reserve Margins (%) NERC
Assessment Areas/Country Net Internal Total Internal Anticipated Prospective Adj. Potential Anticipated Prospective Adj. Potential Reference
ERCOT 54,363 56,028 80,633 80,633 85,247 48.32% 48.32% 56.81% 13.75%
FRCC 45,297 48,797 61,167 64,260 65,126 35.04% 41.86% 43.77% 15.00%
MISO 75,854 79,521 110,117 122,744 123,718 45.17% 61.82% 63.10% 16.30%
MRO‐MAPP 5,335 5,335 6,882 6,882 6,882 29.00% 29.00% 29.00% 15.00%
NPCC‐New England 21,097 22,960 35,869 35,869 37,076 70.02% 70.02% 75.74% 15.00%
NPCC‐New York 25,149 25,149 41,480 41,480 44,379 64.94% 64.94% 76.46% 16.00%
PJM 125,367 138,567 180,823 180,823 190,191 44.24% 44.24% 51.71% 15.40%
SERC‐E 43,395 44,993 56,253 56,253 56,267 29.63% 29.63% 29.66% 15.00%
SERC‐N 45,226 47,967 68,909 72,900 74,972 52.37% 61.19% 65.77% 15.00%
SERC‐SE 46,266 48,485 67,652 67,952 68,109 46.22% 46.87% 47.21% 15.00%
SERC‐W 20,694 21,493 43,765 48,033 49,831 111.49% 132.11% 140.80% 15.00%
SPP 41,812 42,644 61,891 66,717 67,895 48.02% 59.56% 62.38% 13.60%
WECC‐BASN 11,416 11,721 13,204 13,204 13,982 15.67% 15.67% 22.48% 13.49%
WECC‐CALN 19,220 19,498 23,350 23,350 23,351 21.49% 21.49% 21.50% 11.86%
WECC‐CALS 23,441 24,332 32,805 32,805 32,984 39.95% 39.95% 40.71% 11.03%
WECC‐DSW 18,827 19,117 35,197 35,197 35,613 86.95% 86.95% 89.16% 13.96%
WECC‐NORW 31,053 31,148 38,188 38,188 38,189 22.98% 22.98% 22.98% 19.90%
WECC‐ROCK 10,214 10,486 14,425 14,425 14,606 41.22% 41.22% 43.00% 15.68%
TOTAL‐UNITED STATES 664,025 698,239 972,612 1,001,717 1,028,420 46.47% 50.86% 54.88% 15.00%
MRO‐Manitoba Hydro 4,781 4,781 6,124 6,124 6,124 28.09% 28.09% 28.09% 12.00%
MRO‐SaskPower 3,959 4,050 4,421 4,421 4,421 11.68% 11.68% 11.68% 11.00%
NPCC‐Maritimes 5,185 5,444 6,838 6,838 6,838 31.88% 31.88% 31.88% 20.00%
NPCC‐Ontario 21,153 21,153 28,332 28,332 29,197 33.94% 33.94% 38.02% 20.00%
NPCC‐Québec 38,845 38,845 44,201 44,201 44,201 13.79% 13.79% 13.79% 12.20%
WECC‐AESO 13,382 13,382 18,043 18,043 18,043 34.83% 34.83% 34.83% 11.71%
WECC‐BC 12,050 12,050 14,466 14,466 14,466 20.05% 20.05% 20.05% 16.16%
TOTAL‐CANADA 99,355 99,706 122,426 122,426 123,291 23.22% 23.22% 24.09% 10.00%
WECC‐MEXW 1,610 1,610 2,902 2,902 3,243 80.27% 80.27% 101.41% 10.71%
TOTAL‐MÉXICO 1,610 1,610 2,902 2,902 3,243 80.27% 80.27% 101.41% 10.71%
TOTAL‐NERC 764,990 799,555 1,097,940 1,127,045 1,154,953 43.52% 47.33% 50.98% 15.00%

NERC‐Wide Summary Tables (2013‐2022)
NERC | 2012 Long‐Term Reliability Assessment | November 2012
Page 72 of 335
Demand, Resources, and Reserve Margins: 2017 Summer Demand (MW) Capacity Resources (MW) Planning Reserve Margins (%) NERC
Assessment Areas/Country Net Internal Total Internal Anticipated Prospective Adj. Potential Anticipated Prospective Adj. Potential Reference
ERCOT 75,360 76,821 78,166 78,166 79,159 3.72% 3.72% 5.04% 13.75%
FRCC 45,802 49,244 56,849 61,404 63,756 24.12% 34.06% 39.20% 15.00%
MISO 92,022 98,729 110,127 122,600 123,537 19.68% 33.23% 34.25% 16.30%
MRO‐MAPP 5,461 5,560 6,514 6,514 6,514 19.28% 19.28% 19.28% 15.00%
NPCC‐New England 27,797 29,895 33,324 33,324 34,531 19.88% 19.88% 24.23% 15.00%
NPCC‐New York 34,550 34,550 42,077 42,077 42,800 21.79% 21.79% 23.88% 16.00%
PJM 154,233 167,433 180,821 180,821 191,470 17.24% 17.24% 24.14% 15.40%
SERC‐E 43,707 45,939 53,720 53,720 53,734 22.91% 22.91% 22.94% 15.00%
SERC‐N 45,987 48,660 55,142 59,061 60,891 19.91% 28.43% 32.41% 15.00%
SERC‐SE 50,551 52,789 66,278 66,578 66,820 31.11% 31.70% 32.18% 15.00%
SERC‐W 26,252 27,199 35,171 39,690 41,579 33.98% 51.19% 58.38% 15.00%
SPP 55,927 57,055 66,889 71,973 72,091 19.60% 28.69% 28.90% 13.60%
WECC‐BASN 13,923 15,081 16,054 16,054 16,822 15.30% 15.30% 20.82% 12.60%
WECC‐CALN 27,376 28,211 31,403 31,403 31,405 14.71% 14.71% 14.72% 14.71%
WECC‐CALS 31,191 33,254 36,723 36,723 36,931 17.74% 17.74% 18.40% 15.14%
WECC‐DSW 28,510 29,157 41,917 41,917 42,778 47.03% 47.03% 50.05% 13.50%
WECC‐NORW 25,445 25,560 30,499 30,499 30,500 19.86% 19.86% 19.87% 17.90%
WECC‐ROCK 12,235 12,763 14,094 14,094 14,099 15.20% 15.20% 15.24% 14.65%
TOTAL‐UNITED STATES 796,328 837,899 955,768 986,617 1,009,416 20.02% 23.90% 26.76% 15.00%
MRO‐Manitoba Hydro 3,286 3,286 4,949 4,949 4,949 50.60% 50.60% 50.60% 12.00%
MRO‐SaskPower 3,630 3,721 4,285 4,285 4,285 18.02% 18.02% 18.02% 11.00%
NPCC‐Maritimes 3,116 3,447 6,547 6,547 6,547 110.09% 110.09% 110.09% 20.00%
NPCC‐Ontario 22,471 22,471 26,937 26,937 27,657 19.88% 19.88% 23.08% 20.00%
NPCC‐Québec 22,008 22,008 33,911 33,911 33,911 54.08% 54.08% 54.08% 12.20%
WECC‐AESO 13,108 13,146 15,962 15,962 15,962 21.77% 21.77% 21.77% 12.24%
WECC‐BC 9,043 9,043 11,920 11,920 11,920 31.81% 31.81% 31.81% 12.51%
TOTAL‐CANADA 76,663 77,123 104,510 104,510 105,230 36.32% 36.32% 37.26% 10.00%
WECC‐MEXW 2,431 2,431 2,924 2,924 3,264 20.27% 20.27% 34.27% 11.86%
TOTAL‐MÉXICO 2,431 2,431 2,924 2,924 3,264 20.27% 20.27% 34.27% 11.86%
TOTAL‐NERC 875,421 917,453 1,063,202 1,094,051 1,117,910 21.45% 24.97% 27.70% 15.00%
Demand, Resources, and Reserve Margins: 2017/2018 Winter Demand (MW) Capacity Resources (MW) Planning Reserve Margins (%) NERC
Assessment Areas/Country Net Internal Total Internal Anticipated Prospective Adj. Potential Anticipated Prospective Adj. Potential Reference
ERCOT 57,204 58,869 80,633 80,633 85,247 40.96% 40.96% 49.02% 13.75%
FRCC 45,752 49,298 61,238 64,346 65,227 33.85% 40.64% 42.57% 15.00%
MISO 76,172 80,104 111,680 124,307 125,281 46.61% 63.19% 64.47% 16.30%
MRO‐MAPP 5,412 5,412 6,884 6,884 6,884 27.20% 27.20% 27.20% 15.00%
NPCC‐New England 21,011 23,090 35,869 35,869 37,076 70.71% 70.71% 76.46% 15.00%
NPCC‐New York 25,153 25,153 41,480 41,480 44,379 64.91% 64.91% 76.44% 16.00%
PJM 126,462 139,662 180,831 180,831 191,479 42.99% 42.99% 51.41% 15.40%
SERC‐E 43,879 45,487 56,253 56,253 56,267 28.20% 28.20% 28.23% 15.00%
SERC‐N 45,723 48,659 68,909 72,900 74,972 50.71% 59.44% 63.97% 15.00%
SERC‐SE 46,743 48,978 68,641 68,941 69,098 46.85% 47.49% 47.83% 15.00%
SERC‐W 21,106 21,908 43,765 48,033 49,934 107.36% 127.58% 136.59% 15.00%
SPP 42,205 43,069 62,716 67,543 68,724 48.60% 60.04% 62.83% 13.60%
WECC‐BASN 11,640 11,945 13,362 13,362 14,140 14.79% 14.79% 21.47% 13.49%
WECC‐CALN 19,409 19,689 24,156 24,156 24,158 24.46% 24.46% 24.47% 11.86%
WECC‐CALS 23,770 24,697 32,984 32,984 33,192 38.76% 38.76% 39.64% 11.03%
WECC‐DSW 19,187 19,477 35,299 35,299 35,928 83.98% 83.98% 87.25% 13.96%
WECC‐NORW 31,355 31,450 37,735 37,735 37,735 20.35% 20.35% 20.35% 19.90%
WECC‐ROCK 10,398 10,672 14,882 14,882 15,160 43.12% 43.12% 45.80% 15.68%
TOTAL‐UNITED STATES 672,581 707,619 977,319 1,006,439 1,034,881 45.31% 49.64% 53.87% 15.00%
MRO‐Manitoba Hydro 4,845 4,845 6,124 6,124 6,124 26.39% 26.39% 26.39% 12.00%
MRO‐SaskPower 4,068 4,159 4,701 4,701 4,701 15.57% 15.57% 15.57% 11.00%
NPCC‐Maritimes 5,201 5,462 6,846 6,846 6,846 31.63% 31.63% 31.63% 20.00%
NPCC‐Ontario 20,719 20,719 28,121 28,121 29,886 35.73% 35.73% 44.25% 20.00%
NPCC‐Québec 39,189 39,189 44,817 44,817 44,817 14.36% 14.36% 14.36% 12.20%
WECC‐AESO 13,856 13,856 18,755 18,755 18,755 35.36% 35.36% 35.36% 11.71%
WECC‐BC 12,073 12,073 14,419 14,419 14,419 19.44% 19.44% 19.44% 16.16%
TOTAL‐CANADA 99,951 100,303 123,785 123,785 125,550 23.85% 23.85% 25.61% 10.00%
WECC‐MEXW 1,648 1,648 2,901 2,901 3,241 76.03% 76.03% 96.69% 10.71%
TOTAL‐MÉXICO 1,648 1,648 2,901 2,901 3,241 76.03% 76.03% 96.69% 10.71%
TOTAL‐NERC 774,180 809,570 1,104,004 1,133,124 1,163,672 42.60% 46.36% 50.31% 15.00%

NERC‐Wide Summary Tables (2013‐2022)
NERC | 2012 Long‐Term Reliability Assessment | November 2012
Page 73 of 335
Demand, Resources, and Reserve Margins: 2018 Summer Demand (MW) Capacity Resources (MW) Planning Reserve Margins (%) NERC
Assessment Areas/Country Net Internal Total Internal Anticipated Prospective Adj. Potential Anticipated Prospective Adj. Potential Reference
ERCOT 76,483 78,002 79,406 79,406 80,569 3.82% 3.82% 5.34% 13.75%
FRCC 46,152 49,643 56,921 61,491 63,858 23.33% 33.24% 38.36% 15.00%
MISO 92,447 99,611 110,152 122,624 123,561 19.15% 32.64% 33.66% 16.30%
MRO‐MAPP 5,543 5,643 6,516 6,516 6,516 17.57% 17.57% 17.57% 15.00%
NPCC‐New England 27,973 30,275 33,324 33,324 34,531 19.13% 19.13% 23.44% 15.00%
NPCC‐New York 34,868 34,868 42,077 42,077 42,800 20.68% 20.68% 22.75% 16.00%
PJM 155,832 169,032 180,829 180,829 192,121 16.04% 16.04% 23.29% 15.40%
SERC‐E 44,103 46,358 53,720 53,720 53,734 21.80% 21.80% 21.84% 15.00%
SERC‐N 46,504 49,288 55,142 59,061 61,671 18.57% 27.00% 32.61% 15.00%
SERC‐SE 51,023 53,256 66,269 66,569 66,812 29.88% 30.47% 30.94% 15.00%
SERC‐W 26,556 27,505 35,171 39,690 42,281 32.44% 49.46% 59.22% 15.00%
SPP 56,539 57,591 66,913 71,997 72,115 18.35% 27.34% 27.55% 13.60%
WECC‐BASN 14,148 15,306 16,037 16,037 16,805 13.35% 13.35% 18.78% 12.60%
WECC‐CALN 27,670 28,507 31,413 31,413 31,415 13.53% 13.53% 13.54% 14.71%
WECC‐CALS 31,577 33,666 36,382 36,382 36,691 15.22% 15.22% 16.19% 15.14%
WECC‐DSW 29,106 29,686 42,514 42,514 43,327 46.07% 46.07% 48.86% 13.50%
WECC‐NORW 25,675 25,797 30,331 30,331 30,333 18.14% 18.14% 18.14% 17.90%
WECC‐ROCK 12,431 12,970 14,094 14,094 14,108 13.38% 13.38% 13.49% 14.65%
TOTAL‐UNITED STATES 804,630 847,005 957,212 988,076 1,013,248 18.96% 22.80% 25.93% 15.00%
MRO‐Manitoba Hydro 3,221 3,221 4,949 4,949 4,949 53.66% 53.66% 53.66% 12.00%
MRO‐SaskPower 3,618 3,709 4,285 4,285 4,285 18.41% 18.41% 18.41% 11.00%
NPCC‐Maritimes 3,128 3,459 6,558 6,558 6,558 109.65% 109.65% 109.65% 20.00%
NPCC‐Ontario 22,583 22,583 25,858 25,858 28,368 14.50% 14.50% 25.62% 20.00%
NPCC‐Québec 22,125 22,125 34,764 34,764 34,764 57.13% 57.13% 57.13% 12.20%
WECC‐AESO 13,522 13,560 15,929 15,929 15,929 17.80% 17.80% 17.80% 12.24%
WECC‐BC 9,167 9,167 12,470 12,470 12,470 36.03% 36.03% 36.03% 12.51%
TOTAL‐CANADA 77,364 77,824 104,813 104,813 107,322 35.48% 35.48% 38.72% 10.00%
WECC‐MEXW 2,488 2,488 2,923 2,923 3,264 17.50% 17.50% 31.18% 11.86%
TOTAL‐MÉXICO 2,488 2,488 2,923 2,923 3,264 17.50% 17.50% 31.18% 11.86%
TOTAL‐NERC 884,482 927,317 1,064,948 1,095,812 1,123,834 20.40% 23.89% 27.06% 15.00%
Demand, Resources, and Reserve Margins: 2018/2019 Winter Demand (MW) Capacity Resources (MW) Planning Reserve Margins (%) NERC
Assessment Areas/Country Net Internal Total Internal Anticipated Prospective Adj. Potential Anticipated Prospective Adj. Potential Reference
ERCOT 57,459 59,202 81,873 81,873 87,337 42.49% 42.49% 52.00% 13.75%
FRCC 46,305 49,908 61,461 64,844 66,001 32.73% 40.04% 42.54% 15.00%
MISO 76,692 80,891 111,704 124,331 125,306 45.65% 62.12% 63.39% 16.30%
MRO‐MAPP 5,522 5,522 6,886 6,886 6,886 24.70% 24.70% 24.70% 15.00%
NPCC‐New England 20,929 23,210 35,869 35,869 37,076 71.38% 71.38% 77.15% 15.00%
NPCC‐New York 25,265 25,265 41,480 41,480 44,379 64.18% 64.18% 75.65% 16.00%
PJM 127,644 140,844 182,401 182,401 193,693 42.90% 42.90% 51.74% 15.40%
SERC‐E 44,382 46,003 56,343 56,343 56,357 26.95% 26.95% 26.98% 15.00%
SERC‐N 46,176 49,266 68,909 72,900 75,852 49.23% 57.88% 64.27% 15.00%
SERC‐SE 47,434 49,665 68,526 68,826 68,983 44.46% 45.10% 45.43% 15.00%
SERC‐W 21,410 22,215 43,765 48,033 51,156 104.42% 124.35% 138.94% 15.00%
SPP 42,726 43,590 62,960 67,787 69,138 47.36% 58.65% 61.82% 13.60%
WECC‐BASN 11,818 12,123 13,896 13,896 14,678 17.58% 17.58% 24.20% 13.49%
WECC‐CALN 19,618 19,898 24,309 24,309 24,505 23.91% 23.91% 24.91% 11.86%
WECC‐CALS 24,099 25,051 33,789 33,789 34,098 40.21% 40.21% 41.49% 11.03%
WECC‐DSW 19,540 19,830 35,713 35,713 36,341 82.77% 82.77% 85.98% 13.96%
WECC‐NORW 31,607 31,705 38,343 38,343 38,344 21.31% 21.31% 21.31% 19.90%
WECC‐ROCK 10,602 10,877 14,578 14,578 15,074 37.50% 37.50% 42.18% 15.68%
TOTAL‐UNITED STATES 679,228 715,065 982,805 1,012,200 1,045,206 44.69% 49.02% 53.88% 15.00%
MRO‐Manitoba Hydro 4,801 4,801 6,124 6,124 6,124 27.56% 27.56% 27.56% 12.00%
MRO‐SaskPower 4,054 4,145 4,701 4,701 4,701 15.97% 15.97% 15.97% 11.00%
NPCC‐Maritimes 5,226 5,489 6,861 6,861 6,861 31.28% 31.28% 31.28% 20.00%
NPCC‐Ontario 20,700 20,700 27,189 27,189 30,150 31.35% 31.35% 45.65% 20.00%
NPCC‐Québec 39,487 39,487 45,399 45,399 45,399 14.97% 14.97% 14.97% 12.20%
WECC‐AESO 14,351 14,351 18,081 18,081 18,081 25.99% 25.99% 25.99% 11.71%
WECC‐BC 12,223 12,223 14,409 14,409 14,409 17.88% 17.88% 17.88% 16.16%
TOTAL‐CANADA 100,842 101,196 122,764 122,764 125,725 21.74% 21.74% 24.68% 10.00%
WECC‐MEXW 1,687 1,687 2,649 2,649 2,989 57.02% 57.02% 77.20% 10.71%
TOTAL‐MÉXICO 1,687 1,687 2,649 2,649 2,989 57.02% 57.02% 77.20% 10.71%
TOTAL‐NERC 781,757 817,948 1,108,218 1,137,614 1,173,920 41.76% 45.52% 50.16% 15.00%

NERC‐Wide Summary Tables (2013‐2022)
NERC | 2012 Long‐Term Reliability Assessment | November 2012
Page 74 of 335
Demand, Resources, and Reserve Margins: 2019 Summer Demand (MW) Capacity Resources (MW) Planning Reserve Margins (%) NERC
Assessment Areas/Country Net Internal Total Internal Anticipated Prospective Adj. Potential Anticipated Prospective Adj. Potential Reference
ERCOT 76,769 78,351 78,556 78,556 79,719 2.33% 2.33% 3.84% 13.75%
FRCC 46,803 50,356 57,848 62,693 65,337 23.60% 33.95% 39.60% 15.00%
MISO 92,932 100,565 110,152 122,624 123,561 18.53% 31.95% 32.96% 16.30%
MRO‐MAPP 5,643 5,746 6,518 6,518 6,518 15.50% 15.50% 15.50% 15.00%
NPCC‐New England 28,111 30,605 33,324 33,324 34,531 18.54% 18.54% 22.84% 15.00%
NPCC‐New York 35,204 35,204 42,077 42,077 42,838 19.52% 19.52% 21.68% 16.00%
PJM 157,660 170,860 182,399 182,399 193,691 15.69% 15.69% 22.85% 15.40%
SERC‐E 44,636 46,908 55,103 55,103 55,117 23.45% 23.45% 23.48% 15.00%
SERC‐N 47,044 50,090 55,142 59,061 62,451 17.21% 25.54% 32.75% 15.00%
SERC‐SE 51,707 53,948 66,154 66,454 66,696 27.94% 28.52% 28.99% 15.00%
SERC‐W 26,910 27,863 35,171 39,690 43,580 30.70% 47.49% 61.95% 15.00%
SPP 57,338 58,378 66,970 72,054 72,189 16.80% 25.67% 25.90% 13.60%
WECC‐BASN 14,392 15,550 15,895 15,895 16,667 10.44% 10.44% 15.80% 12.60%
WECC‐CALN 27,998 28,834 30,534 30,534 30,536 9.06% 9.06% 9.07% 14.71%
WECC‐CALS 31,948 34,090 36,810 36,810 37,129 15.22% 15.22% 16.22% 15.14%
WECC‐DSW 29,622 30,204 41,934 41,934 43,162 41.56% 41.56% 45.71% 13.50%
WECC‐NORW 25,901 26,034 30,600 30,600 30,602 18.14% 18.14% 18.15% 17.90%
WECC‐ROCK 12,626 13,176 14,247 14,247 14,263 12.84% 12.84% 12.97% 14.65%
TOTAL‐UNITED STATES 813,244 856,761 959,432 990,572 1,018,587 17.98% 21.81% 25.25% 15.00%
MRO‐Manitoba Hydro 3,271 3,271 4,852 4,852 4,852 48.34% 48.34% 48.34% 12.00%
MRO‐SaskPower 3,665 3,756 4,285 4,285 4,285 16.89% 16.89% 16.89% 11.00%
NPCC‐Maritimes 3,140 3,471 6,558 6,558 6,558 108.84% 108.84% 108.84% 20.00%
NPCC‐Ontario 22,891 22,891 24,777 24,777 27,827 8.24% 8.24% 21.57% 20.00%
NPCC‐Québec 22,307 22,307 34,799 34,799 34,799 56.00% 56.00% 56.00% 12.20%
WECC‐AESO 13,936 13,974 15,669 15,669 15,669 12.43% 12.43% 12.43% 12.24%
WECC‐BC 9,289 9,289 12,369 12,369 12,369 33.16% 33.16% 33.16% 12.51%
TOTAL‐CANADA 78,498 78,958 103,308 103,308 106,359 31.61% 31.61% 35.49% 10.00%
WECC‐MEXW 2,545 2,545 2,923 2,923 3,535 14.86% 14.86% 38.90% 11.86%
TOTAL‐MÉXICO 2,545 2,545 2,923 2,923 3,535 14.86% 14.86% 38.90% 11.86%
TOTAL‐NERC 894,287 938,265 1,065,664 1,096,804 1,128,480 19.16% 22.65% 26.19% 15.00%
Demand, Resources, and Reserve Margins: 2019/2020 Winter Demand (MW) Capacity Resources (MW) Planning Reserve Margins (%) NERC
Assessment Areas/Country Net Internal Total Internal Anticipated Prospective Adj. Potential Anticipated Prospective Adj. Potential Reference
ERCOT 57,575 59,318 81,013 81,013 86,477 40.71% 40.71% 50.20% 13.75%
FRCC 46,910 50,570 62,340 65,725 66,884 32.89% 40.11% 42.58% 15.00%
MISO 77,174 81,649 111,704 124,331 125,306 44.74% 61.10% 62.37% 16.30%
MRO‐MAPP 5,623 5,623 6,866 6,866 6,866 22.11% 22.11% 22.11% 15.00%
NPCC‐New England 20,859 23,330 35,869 35,869 37,076 71.96% 71.96% 77.75% 15.00%
NPCC‐New York 25,422 25,422 41,480 41,480 44,757 63.17% 63.17% 76.06% 16.00%
PJM 128,818 142,018 182,401 182,401 193,693 41.60% 41.60% 50.36% 15.40%
SERC‐E 45,016 46,648 57,661 57,661 57,675 28.09% 28.09% 28.12% 15.00%
SERC‐N 46,697 49,932 68,909 72,900 76,732 47.57% 56.11% 64.32% 15.00%
SERC‐SE 48,097 50,338 68,506 68,806 68,964 42.43% 43.06% 43.38% 15.00%
SERC‐W 21,118 21,923 43,765 48,033 51,975 107.24% 127.45% 146.12% 15.00%
SPP 43,360 44,223 63,127 67,954 69,307 45.59% 56.72% 59.84% 13.60%
WECC‐BASN 11,940 12,245 13,935 13,935 14,919 16.71% 16.71% 24.94% 13.49%
WECC‐CALN 19,767 20,048 24,348 24,348 24,544 23.18% 23.18% 24.17% 11.86%
WECC‐CALS 24,438 25,440 32,161 32,161 32,470 31.60% 31.60% 32.87% 11.03%
WECC‐DSW 19,945 20,235 35,184 35,184 36,614 76.41% 76.41% 83.57% 13.96%
WECC‐NORW 31,862 31,971 37,851 37,851 37,852 18.80% 18.80% 18.80% 19.90%
WECC‐ROCK 10,796 11,072 14,612 14,612 15,140 35.35% 35.35% 40.23% 15.68%
TOTAL‐UNITED STATES 685,417 722,005 981,734 1,011,131 1,047,251 43.23% 47.52% 52.79% 15.00%
MRO‐Manitoba Hydro 4,878 4,878 6,027 6,027 6,027 23.55% 23.55% 23.55% 12.00%
MRO‐SaskPower 4,107 4,198 4,701 4,701 4,701 14.47% 14.47% 14.47% 11.00%
NPCC‐Maritimes 5,228 5,492 6,861 6,861 6,861 31.25% 31.25% 31.25% 20.00%
NPCC‐Ontario 21,063 21,063 25,160 25,160 28,528 19.45% 19.45% 35.44% 20.00%
NPCC‐Québec 39,812 39,812 45,505 45,505 45,505 14.30% 14.30% 14.30% 12.20%
WECC‐AESO 14,759 14,759 18,140 18,140 18,140 22.91% 22.91% 22.91% 11.71%
WECC‐BC 12,373 12,373 14,474 14,474 14,474 16.98% 16.98% 16.98% 16.16%
TOTAL‐CANADA 102,219 102,575 120,869 120,869 124,237 18.24% 18.24% 21.54% 10.00%
WECC‐MEXW 1,725 1,725 2,774 2,774 3,386 60.83% 60.83% 96.29% 10.71%
TOTAL‐MÉXICO 1,725 1,725 2,774 2,774 3,386 60.83% 60.83% 96.29% 10.71%
TOTAL‐NERC 789,361 826,305 1,105,377 1,134,775 1,174,874 40.03% 43.76% 48.84% 15.00%

NERC‐Wide Summary Tables (2013‐2022)
NERC | 2012 Long‐Term Reliability Assessment | November 2012
Page 75 of 335
Demand, Resources, and Reserve Margins: 2020 Summer Demand (MW) Capacity Resources (MW) Planning Reserve Margins (%) NERC
Assessment Areas/Country Net Internal Total Internal Anticipated Prospective Adj. Potential Anticipated Prospective Adj. Potential Reference
ERCOT 78,524 80,176 78,556 78,556 79,719 0.04% 0.04% 1.52% 13.75%
FRCC 47,581 51,191 57,847 62,695 65,339 21.58% 31.76% 37.32% 15.00%
MISO 93,419 101,530 110,152 122,624 123,561 17.91% 31.26% 32.27% 16.30%
MRO‐MAPP 5,735 5,840 6,518 6,518 6,518 13.65% 13.65% 13.65% 15.00%
NPCC‐New England 28,257 30,930 33,324 33,324 34,531 17.93% 17.93% 22.20% 15.00%
NPCC‐New York 35,526 35,526 42,077 42,077 42,838 18.44% 18.44% 20.58% 16.00%
PJM 159,593 172,793 182,399 182,399 193,691 14.29% 14.29% 21.37% 15.40%
SERC‐E 45,200 47,487 55,379 55,379 55,393 22.52% 22.52% 22.55% 15.00%
SERC‐N 47,653 50,868 56,402 60,321 63,711 18.36% 26.58% 33.70% 15.00%
SERC‐SE 52,396 54,645 66,135 66,435 66,865 26.22% 26.79% 27.61% 15.00%
SERC‐W 27,198 28,153 35,171 39,690 43,730 29.32% 45.93% 60.79% 15.00%
SPP 57,971 59,239 67,496 72,580 72,737 16.43% 25.20% 25.47% 13.60%
WECC‐BASN 14,628 15,786 15,719 15,719 16,685 7.46% 7.46% 14.07% 12.60%
WECC‐CALN 28,324 29,160 31,011 31,011 31,014 9.49% 9.49% 9.49% 14.71%
WECC‐CALS 32,472 34,666 37,485 37,485 37,909 15.44% 15.44% 16.74% 15.14%
WECC‐DSW 30,183 30,764 40,664 40,664 42,234 34.72% 34.72% 39.93% 13.50%
WECC‐NORW 26,151 26,295 30,895 30,895 30,895 18.14% 18.14% 18.14% 17.90%
WECC‐ROCK 12,840 13,404 14,837 14,837 14,842 15.56% 15.56% 15.59% 14.65%
TOTAL‐UNITED STATES 823,652 868,453 962,068 993,209 1,022,214 16.81% 20.59% 24.11% 15.00%
MRO‐Manitoba Hydro 3,348 3,348 4,602 4,602 5,232 37.45% 37.45% 56.26% 12.00%
MRO‐SaskPower 3,716 3,807 4,285 4,285 4,285 15.29% 15.29% 15.29% 11.00%
NPCC‐Maritimes 3,163 3,494 6,558 6,558 6,558 107.33% 107.33% 107.33% 20.00%
NPCC‐Ontario 23,010 23,010 23,867 23,867 28,509 3.72% 3.72% 23.90% 20.00%
NPCC‐Québec 22,503 22,503 34,905 34,905 34,905 55.11% 55.11% 55.11% 12.20%
WECC‐AESO 14,336 14,374 15,619 15,619 15,619 8.95% 8.95% 8.95% 12.24%
WECC‐BC 9,427 9,427 11,626 11,626 11,626 23.33% 23.33% 23.33% 12.51%
TOTAL‐CANADA 79,504 79,964 101,461 101,461 106,734 27.62% 27.62% 34.25% 10.00%
WECC‐MEXW 2,602 2,602 2,923 2,923 3,535 12.35% 12.35% 35.85% 11.86%
TOTAL‐MÉXICO 2,602 2,602 2,923 2,923 3,535 12.35% 12.35% 35.85% 11.86%
TOTAL‐NERC 905,758 951,019 1,066,452 1,097,594 1,132,482 17.74% 21.18% 25.03% 15.00%
Demand, Resources, and Reserve Margins: 2020/2021 Winter Demand (MW) Capacity Resources (MW) Planning Reserve Margins (%) NERC
Assessment Areas/Country Net Internal Total Internal Anticipated Prospective Adj. Potential Anticipated Prospective Adj. Potential Reference
ERCOT 58,210 60,039 81,330 81,330 86,794 39.72% 39.72% 49.10% 13.75%
FRCC 47,509 51,218 63,335 66,720 67,879 33.31% 40.44% 42.88% 15.00%
MISO 77,498 82,252 111,704 124,331 125,306 44.14% 60.43% 61.69% 16.30%
MRO‐MAPP 5,718 5,718 6,866 6,866 6,866 20.07% 20.07% 20.07% 15.00%
NPCC‐New England 20,797 23,445 35,863 35,863 37,070 72.44% 72.44% 78.25% 15.00%
NPCC‐New York 25,627 25,627 41,480 41,480 44,757 61.86% 61.86% 74.65% 16.00%
PJM 130,219 143,419 182,401 182,401 193,693 40.07% 40.07% 48.74% 15.40%
SERC‐E 45,557 47,201 57,942 57,942 57,956 27.19% 27.19% 27.22% 15.00%
SERC‐N 47,211 50,584 70,169 74,160 77,992 48.63% 57.08% 65.20% 15.00%
SERC‐SE 48,943 51,193 68,499 68,799 69,144 39.96% 40.57% 41.28% 15.00%
SERC‐W 21,726 22,539 43,765 48,033 52,125 101.44% 121.09% 139.92% 15.00%
SPP 43,930 44,794 63,774 68,600 70,175 45.17% 56.16% 59.74% 13.60%
WECC‐BASN 12,026 12,331 13,968 13,968 15,128 16.15% 16.15% 25.79% 13.49%
WECC‐CALN 19,919 20,198 23,971 23,971 24,165 20.34% 20.34% 21.32% 11.86%
WECC‐CALS 24,941 25,994 30,223 30,223 30,637 21.18% 21.18% 22.84% 11.03%
WECC‐DSW 20,263 20,553 36,364 36,364 38,149 79.46% 79.46% 88.27% 13.96%
WECC‐NORW 32,075 32,195 37,625 37,625 37,626 17.30% 17.30% 17.31% 19.90%
WECC‐ROCK 10,922 11,200 13,156 13,156 13,581 20.45% 20.45% 24.35% 15.68%
TOTAL‐UNITED STATES 693,092 730,501 982,436 1,011,834 1,049,044 41.75% 45.99% 51.36% 15.00%
MRO‐Manitoba Hydro 4,981 4,981 5,777 5,777 6,317 15.97% 15.97% 26.81% 12.00%
MRO‐SaskPower 4,164 4,255 4,701 4,701 4,701 12.91% 12.91% 12.91% 11.00%
NPCC‐Maritimes 5,247 5,513 6,861 6,861 6,861 30.75% 30.75% 30.75% 20.00%
NPCC‐Ontario 21,234 21,234 25,125 25,125 30,085 18.33% 18.33% 41.69% 20.00%
NPCC‐Québec 40,079 40,079 45,906 45,906 45,906 14.54% 14.54% 14.54% 12.20%
WECC‐AESO 15,162 15,162 18,746 18,746 18,746 23.64% 23.64% 23.64% 11.71%
WECC‐BC 12,523 12,523 14,330 14,330 14,330 14.43% 14.43% 14.43% 16.16%
TOTAL‐CANADA 103,391 103,747 121,446 121,446 126,946 17.46% 17.46% 22.78% 10.00%
WECC‐MEXW 1,764 1,764 2,770 2,770 3,382 57.05% 57.05% 91.72% 10.71%
TOTAL‐MÉXICO 1,764 1,764 2,770 2,770 3,382 57.05% 57.05% 91.72% 10.71%
TOTAL‐NERC 798,246 836,012 1,106,653 1,136,050 1,179,373 38.64% 42.32% 47.75% 15.00%

NERC‐Wide Summary Tables (2013‐2022)
NERC | 2012 Long‐Term Reliability Assessment | November 2012
Page 76 of 335
Demand, Resources, and Reserve Margins: 2021 Summer Demand (MW) Capacity Resources (MW) Planning Reserve Margins (%) NERC
Assessment Areas/Country Net Internal Total Internal Anticipated Prospective Adj. Potential Anticipated Prospective Adj. Potential Reference
ERCOT 79,682 81,410 78,873 78,873 80,036 ‐1.02% ‐1.02% 0.44% 13.75%
FRCC 48,273 51,933 59,941 65,247 68,351 24.17% 35.16% 41.59% 15.00%
MISO 93,957 102,559 110,152 122,624 123,561 17.24% 30.51% 31.51% 16.30%
MRO‐MAPP 5,821 5,928 6,518 6,518 6,518 11.97% 11.97% 11.97% 15.00%
NPCC‐New England 28,414 31,255 33,318 33,318 34,525 17.26% 17.26% 21.51% 15.00%
NPCC‐New York 35,913 35,913 42,077 42,077 42,838 17.16% 17.16% 19.28% 16.00%
PJM 161,438 174,638 182,399 182,399 193,691 12.98% 12.98% 19.98% 15.40%
SERC‐E 45,848 48,149 56,007 56,007 56,021 22.16% 22.16% 22.19% 15.00%
SERC‐N 48,167 51,345 56,402 60,321 64,491 17.10% 25.23% 33.89% 15.00%
SERC‐SE 53,343 55,600 65,848 66,148 66,579 23.44% 24.01% 24.81% 15.00%
SERC‐W 27,472 28,435 35,450 39,969 44,759 29.04% 45.49% 62.93% 15.00%
SPP 58,716 59,904 67,715 72,799 72,956 15.33% 23.98% 24.25% 13.60%
WECC‐BASN 14,836 15,994 15,814 15,814 16,779 6.59% 6.59% 13.10% 12.60%
WECC‐CALN 28,652 29,487 31,293 31,293 31,295 9.22% 9.22% 9.22% 14.71%
WECC‐CALS 32,997 35,243 38,010 38,010 38,434 15.19% 15.19% 16.48% 15.14%
WECC‐DSW 30,720 31,305 39,790 39,790 41,441 29.52% 29.52% 34.90% 13.50%
WECC‐NORW 26,414 26,561 31,204 31,204 31,206 18.13% 18.13% 18.14% 17.90%
WECC‐ROCK 13,093 13,615 14,656 14,656 14,660 11.94% 11.94% 11.97% 14.65%
TOTAL‐UNITED STATES 833,758 879,275 965,464 997,065 1,028,141 15.80% 19.59% 23.31% 15.00%
MRO‐Manitoba Hydro 3,428 3,428 4,377 4,377 5,007 27.69% 27.69% 46.06% 12.00%
MRO‐SaskPower 3,784 3,875 4,394 4,394 4,394 16.11% 16.11% 16.11% 11.00%
NPCC‐Maritimes 3,175 3,506 6,558 6,558 6,558 106.54% 106.54% 106.54% 20.00%
NPCC‐Ontario 23,390 23,390 22,787 22,787 28,820 ‐2.58% ‐2.58% 23.21% 20.00%
NPCC‐Québec 22,662 22,662 35,306 35,306 35,306 55.79% 55.79% 55.79% 12.20%
WECC‐AESO 14,727 14,765 15,621 15,621 15,621 6.07% 6.07% 6.07% 12.24%
WECC‐BC 9,553 9,553 10,983 10,983 10,983 14.97% 14.97% 14.97% 12.51%
TOTAL‐CANADA 80,719 81,179 100,027 100,027 106,689 23.92% 23.92% 32.17% 10.00%
WECC‐MEXW 2,659 2,659 2,923 2,923 3,535 9.94% 9.94% 32.94% 11.86%
TOTAL‐MÉXICO 2,659 2,659 2,923 2,923 3,535 9.94% 9.94% 32.94% 11.86%
TOTAL‐NERC 917,136 963,113 1,068,414 1,100,015 1,138,365 16.49% 19.94% 24.12% 15.00%
Demand, Resources, and Reserve Margins: 2021/2022 Winter Demand (MW) Capacity Resources (MW) Planning Reserve Margins (%) NERC
Assessment Areas/Country Net Internal Total Internal Anticipated Prospective Adj. Potential Anticipated Prospective Adj. Potential Reference
ERCOT 59,031 60,917 81,330 81,330 86,794 37.78% 37.78% 47.03% 13.75%
FRCC 48,169 51,921 64,893 68,824 70,529 34.72% 42.88% 46.42% 15.00%
MISO 78,022 83,064 111,704 124,331 125,306 43.17% 59.35% 60.60% 16.30%
MRO‐MAPP 5,814 5,814 6,866 6,866 6,866 18.10% 18.10% 18.10% 15.00%
NPCC‐New England 20,750 23,565 35,863 35,863 37,070 72.83% 72.83% 78.65% 15.00%
NPCC‐New York 25,794 25,794 42,833 42,833 46,110 66.06% 66.06% 78.76% 16.00%
PJM 131,636 144,836 182,401 182,401 193,693 38.56% 38.56% 47.14% 15.40%
SERC‐E 46,144 47,797 58,720 58,720 58,734 27.25% 27.25% 27.28% 15.00%
SERC‐N 47,891 51,397 70,169 74,160 78,872 46.52% 54.85% 64.69% 15.00%
SERC‐SE 49,770 52,029 68,113 68,413 68,758 36.86% 37.46% 38.15% 15.00%
SERC‐W 21,891 22,707 44,044 48,312 53,154 101.20% 120.69% 142.81% 15.00%
SPP 44,470 45,334 63,966 68,793 70,368 43.84% 54.69% 58.24% 13.60%
WECC‐BASN 12,158 12,463 13,565 13,565 14,792 11.57% 11.57% 21.67% 13.49%
WECC‐CALN 20,070 20,348 23,848 23,848 23,946 18.82% 18.82% 19.31% 11.86%
WECC‐CALS 25,300 26,403 32,182 32,182 32,596 27.20% 27.20% 28.84% 11.03%
WECC‐DSW 20,490 20,780 36,572 36,572 37,479 78.49% 78.49% 82.91% 13.96%
WECC‐NORW 32,391 32,512 37,468 37,468 37,470 15.67% 15.67% 15.68% 19.90%
WECC‐ROCK 11,165 11,401 14,162 14,162 14,586 26.85% 26.85% 30.64% 15.68%
TOTAL‐UNITED STATES 700,956 739,081 988,701 1,018,645 1,057,124 41.05% 45.32% 50.81% 15.00%
MRO‐Manitoba Hydro 5,089 5,089 5,552 5,552 6,182 9.10% 9.10% 21.48% 12.00%
MRO‐SaskPower 4,239 4,330 4,828 4,828 4,828 13.90% 13.90% 13.90% 11.00%
NPCC‐Maritimes 5,264 5,530 6,861 6,861 6,861 30.34% 30.34% 30.34% 20.00%
NPCC‐Ontario 21,441 21,441 26,014 26,014 32,364 21.33% 21.33% 50.95% 20.00%
NPCC‐Québec 40,317 40,317 45,906 45,906 45,906 13.86% 13.86% 13.86% 12.20%
WECC‐AESO 15,618 15,618 18,034 18,034 18,034 15.47% 15.47% 15.47% 11.71%
WECC‐BC 12,673 12,673 14,401 14,401 14,401 13.64% 13.64% 13.64% 16.16%
TOTAL‐CANADA 104,640 104,997 121,597 121,597 128,577 16.21% 16.21% 22.88% 10.00%
WECC‐MEXW 1,803 1,803 2,771 2,771 3,382 53.67% 53.67% 87.59% 10.71%
TOTAL‐MÉXICO 1,803 1,803 2,771 2,771 3,382 53.67% 53.67% 87.59% 10.71%
TOTAL‐NERC 807,399 845,882 1,113,069 1,143,013 1,189,083 37.86% 41.57% 47.27% 15.00%

NERC‐Wide Summary Tables (2013‐2022)
NERC | 2012 Long‐Term Reliability Assessment | November 2012
Page 77 of 335
Demand, Resources, and Reserve Margins: 2022 Summer Demand (MW) Capacity Resources (MW) Planning Reserve Margins (%) NERC
Assessment Areas/Country Net Internal Total Internal Anticipated Prospective Adj. Potential Anticipated Prospective Adj. Potential Reference
ERCOT 80,694 82,507 78,873 78,873 80,036 ‐2.26% ‐2.26% ‐0.82% 13.75%
FRCC 48,923 52,583 60,203 65,509 68,613 23.06% 33.90% 40.25% 15.00%
MISO 94,875 103,584 110,152 122,624 123,561 16.10% 29.25% 30.24% 16.30%
MRO‐MAPP 5,906 6,015 6,518 6,518 6,518 10.36% 10.36% 10.36% 15.00%
NPCC‐New England 28,583 31,583 33,318 33,318 34,525 16.56% 16.56% 20.79% 15.00%
NPCC‐New York 36,230 36,230 42,077 42,077 42,838 16.14% 16.14% 18.24% 16.00%
PJM 163,220 176,420 182,399 182,399 193,691 11.75% 11.75% 18.67% 15.40%
SERC‐E 46,386 48,697 56,889 56,889 56,903 22.64% 22.64% 22.67% 15.00%
SERC‐N 48,778 52,038 56,402 60,321 64,491 15.63% 23.66% 32.21% 15.00%
SERC‐SE 54,249 56,512 65,741 66,041 66,471 21.18% 21.74% 22.53% 15.00%
SERC‐W 27,764 28,730 35,450 39,969 44,822 27.68% 43.96% 61.44% 15.00%
SPP 58,985 60,088 67,740 72,823 72,981 14.84% 23.46% 23.73% 13.60%
WECC‐BASN 14,756 15,914 15,813 15,813 16,816 7.17% 7.17% 13.96% 12.60%
WECC‐CALN 29,077 29,912 31,375 31,375 31,378 7.90% 7.90% 7.91% 14.71%
WECC‐CALS 33,319 35,615 38,422 38,422 38,846 15.31% 15.31% 16.59% 15.14%
WECC‐DSW 31,013 31,602 40,035 40,035 41,683 29.09% 29.09% 34.40% 13.50%
WECC‐NORW 26,711 26,858 31,656 31,656 31,656 18.51% 18.51% 18.51% 17.90%
WECC‐ROCK 13,251 13,771 14,313 14,313 14,315 8.02% 8.02% 8.03% 14.65%
TOTAL‐UNITED STATES 842,721 888,660 967,375 998,976 1,030,143 14.79% 18.54% 22.24% 15.00%
MRO‐Manitoba Hydro 3,474 3,474 4,377 4,377 5,007 25.98% 25.98% 44.11% 12.00%
MRO‐SaskPower 3,847 3,938 4,505 4,505 4,505 17.10% 17.10% 17.10% 11.00%
NPCC‐Maritimes 3,183 3,514 6,558 6,558 6,558 106.02% 106.02% 106.02% 20.00%
NPCC‐Ontario 23,442 23,442 22,791 22,791 28,996 ‐2.78% ‐2.78% 23.69% 20.00%
NPCC‐Québec 22,818 22,818 35,306 35,306 35,306 54.73% 54.73% 54.73% 12.20%
WECC‐AESO 15,093 15,131 16,375 16,375 16,375 8.50% 8.50% 8.50% 12.24%
WECC‐BC 9,670 9,670 11,015 11,015 11,015 13.91% 13.91% 13.91% 12.51%
TOTAL‐CANADA 81,528 81,988 100,928 100,928 107,762 23.80% 23.80% 32.18% 10.00%
WECC‐MEXW 2,716 2,716 2,924 2,924 3,535 7.65% 7.65% 30.17% 11.86%
TOTAL‐MÉXICO 2,716 2,716 2,924 2,924 3,535 7.65% 7.65% 30.17% 11.86%
TOTAL‐NERC 926,965 973,364 1,071,227 1,102,827 1,141,441 15.56% 18.97% 23.14% 15.00%
Demand, Resources, and Reserve Margins: 2022/2023 Winter Demand (MW) Capacity Resources (MW) Planning Reserve Margins (%) NERC
Assessment Areas/Country Net Internal Total Internal Anticipated Prospective Adj. Potential Anticipated Prospective Adj. Potential Reference
ERCOT 61,450 63,336 81,330 81,330 86,794 32.35% 32.35% 41.24% 13.75%
FRCC 48,656 52,408 64,893 68,824 70,529 33.37% 41.45% 44.95% 15.00%
MISO 78,789 83,894 111,704 124,331 125,306 41.78% 57.80% 59.04% 16.30%
MRO‐MAPP 5,904 5,904 6,866 6,866 6,866 16.29% 16.29% 16.29% 15.00%
NPCC‐New England 20,711 23,686 35,863 35,863 37,070 73.16% 73.16% 78.99% 15.00%
NPCC‐New York 25,908 25,908 42,833 42,833 46,110 65.33% 65.33% 77.98% 16.00%
PJM 132,916 146,116 182,401 182,401 193,693 37.23% 37.23% 45.73% 15.40%
SERC‐E 46,730 48,395 59,595 59,595 59,609 27.53% 27.53% 27.56% 15.00%
SERC‐N 48,256 51,914 70,569 74,560 79,272 46.24% 54.51% 64.28% 15.00%
SERC‐SE 50,627 52,894 68,106 68,406 68,751 34.52% 35.12% 35.80% 15.00%
SERC‐W 22,262 23,082 44,044 48,312 53,217 97.85% 117.02% 139.05% 15.00%
SPP 44,862 45,726 64,137 68,963 70,538 42.96% 53.72% 57.23% 13.60%
WECC‐BASN 12,132 12,437 13,582 13,582 14,571 11.96% 11.96% 20.10% 13.49%
WECC‐CALN 20,220 20,498 23,330 23,330 23,502 15.38% 15.38% 16.23% 11.86%
WECC‐CALS 25,454 26,607 30,703 30,703 31,117 20.62% 20.62% 22.25% 11.03%
WECC‐DSW 20,775 21,065 36,929 36,929 38,169 77.75% 77.75% 83.72% 13.96%
WECC‐NORW 32,638 32,759 39,876 39,876 39,878 22.18% 22.18% 22.18% 19.90%
WECC‐ROCK 11,283 11,521 13,443 13,443 13,458 19.14% 19.14% 19.27% 15.68%
TOTAL‐UNITED STATES 709,572 748,149 990,204 1,020,148 1,058,450 39.55% 43.77% 49.17% 15.00%
MRO‐Manitoba Hydro 5,162 5,162 5,552 5,552 6,182 7.54% 7.54% 19.75% 12.00%
MRO‐SaskPower 4,310 4,401 4,953 4,953 4,953 14.93% 14.93% 14.93% 11.00%
NPCC‐Maritimes 5,285 5,552 6,861 6,861 6,861 29.82% 29.82% 29.82% 20.00%
NPCC‐Ontario 21,529 21,529 26,858 26,858 33,380 24.75% 24.75% 55.04% 20.00%
NPCC‐Québec 40,575 40,575 45,906 45,906 45,906 13.14% 13.14% 13.14% 12.20%
WECC‐AESO 15,994 15,994 18,124 18,124 18,124 13.32% 13.32% 13.32% 11.71%
WECC‐BC 12,823 12,823 14,467 14,467 14,467 12.82% 12.82% 12.82% 16.16%
TOTAL‐CANADA 105,679 106,037 122,721 122,721 129,873 16.13% 16.13% 22.89% 10.00%
WECC‐MEXW 1,841 1,841 2,772 2,772 3,384 50.59% 50.59% 83.81% 10.71%
TOTAL‐MÉXICO 1,841 1,841 2,772 2,772 3,384 50.59% 50.59% 83.81% 10.71%
TOTAL‐NERC 817,092 856,027 1,115,697 1,145,641 1,191,707 36.54% 40.21% 45.85% 15.00%
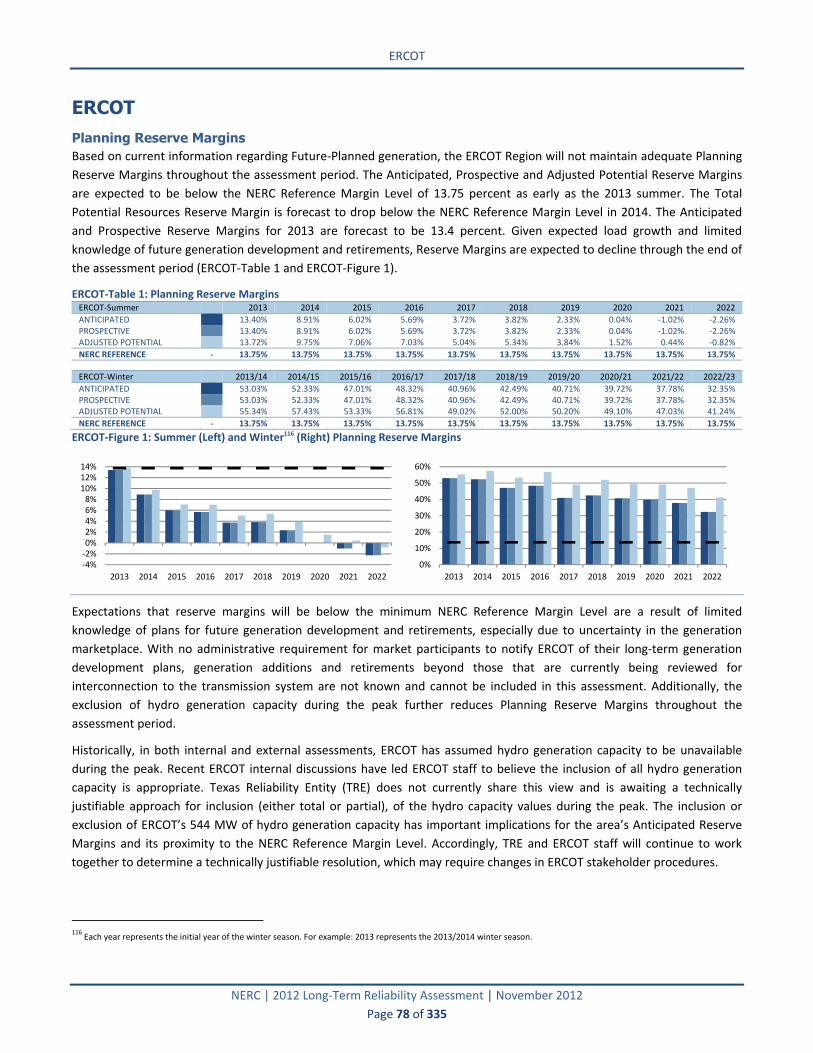
ERCOT
NERC | 2012 Long‐Term Reliability Assessment | November 2012
Page 78 of 335
ERCOT Planning Reserve Margins Based on current information regarding Future‐Planned generation, the ERCOT Region will not maintain adequate Planning
Reserve Margins throughout the assessment period. The Anticipated, Prospective and Adjusted Potential Reserve Margins
are expected to be below the NERC Reference Margin Level of 13.75 percent as early as the 2013 summer. The Total
Potential Resources Reserve Margin is forecast to drop below the NERC Reference Margin Level in 2014. The Anticipated
and Prospective Reserve Margins for 2013 are forecast to be 13.4 percent. Given expected load growth and limited
knowledge of future generation development and retirements, Reserve Margins are expected to decline through the end of
the assessment period (ERCOT‐Table 1 and ERCOT‐Figure 1).
ERCOT‐Table 1: Planning Reserve Margins ERCOT‐Summer 2013 2014 2015 2016 2017 2018 2019 2020 2021 2022
ANTICIPATED 13.40% 8.91% 6.02% 5.69% 3.72% 3.82% 2.33% 0.04% ‐1.02% ‐2.26% PROSPECTIVE 13.40% 8.91% 6.02% 5.69% 3.72% 3.82% 2.33% 0.04% ‐1.02% ‐2.26% ADJUSTED POTENTIAL 13.72% 9.75% 7.06% 7.03% 5.04% 5.34% 3.84% 1.52% 0.44% ‐0.82%
NERC REFERENCE ‐ 13.75% 13.75% 13.75% 13.75% 13.75% 13.75% 13.75% 13.75% 13.75% 13.75%
ERCOT‐Winter 2013/14 2014/15 2015/16 2016/17 2017/18 2018/19 2019/20 2020/21 2021/22 2022/23
ANTICIPATED 53.03% 52.33% 47.01% 48.32% 40.96% 42.49% 40.71% 39.72% 37.78% 32.35% PROSPECTIVE 53.03% 52.33% 47.01% 48.32% 40.96% 42.49% 40.71% 39.72% 37.78% 32.35% ADJUSTED POTENTIAL 55.34% 57.43% 53.33% 56.81% 49.02% 52.00% 50.20% 49.10% 47.03% 41.24%
NERC REFERENCE ‐ 13.75% 13.75% 13.75% 13.75% 13.75% 13.75% 13.75% 13.75% 13.75% 13.75%
ERCOT‐Figure 1: Summer (Left) and Winter116 (Right) Planning Reserve Margins
Expectations that reserve margins will be below the minimum NERC Reference Margin Level are a result of limited
knowledge of plans for future generation development and retirements, especially due to uncertainty in the generation
marketplace. With no administrative requirement for market participants to notify ERCOT of their long‐term generation
development plans, generation additions and retirements beyond those that are currently being reviewed for
interconnection to the transmission system are not known and cannot be included in this assessment. Additionally, the
exclusion of hydro generation capacity during the peak further reduces Planning Reserve Margins throughout the
assessment period.
Historically, in both internal and external assessments, ERCOT has assumed hydro generation capacity to be unavailable
during the peak. Recent ERCOT internal discussions have led ERCOT staff to believe the inclusion of all hydro generation
capacity is appropriate. Texas Reliability Entity (TRE) does not currently share this view and is awaiting a technically
justifiable approach for inclusion (either total or partial), of the hydro capacity values during the peak. The inclusion or
exclusion of ERCOT’s 544 MW of hydro generation capacity has important implications for the area’s Anticipated Reserve
Margins and its proximity to the NERC Reference Margin Level. Accordingly, TRE and ERCOT staff will continue to work
together to determine a technically justifiable resolution, which may require changes in ERCOT stakeholder procedures.
116
Each year represents the initial year of the winter season. For example: 2013 represents the 2013/2014 winter season.
‐4%‐2%0%2%4%6%8%10%12%14%
2013 2014 2015 2016 2017 2018 2019 2020 2021 2022
0%
10%
20%
30%
40%
50%
60%
2013 2014 2015 2016 2017 2018 2019 2020 2021 2022

ERCOT
NERC | 2012 Long‐Term Reliability Assessment | November 2012
Page 79 of 335
The Public Utility Commission of Texas (PUCT) is responsible for ensuring that the market design promotes an adequate
level of resources required to serve expected loads. There is no requirement for any entity to plan for – or ensure –
adequate levels of future resource additions. The ERCOT market design provides an opportunity for any interested
stakeholder to develop new generation and bid into the electricity market.
Given adequate time for development of new generation, regulatory or market changes resulting in idling or retirement of
generation facilities are not expected to have a significant impact on projected Reserve Margins. However, due to
environmental requirements and regulatory changes that result in significant accelerated reductions in overall resource
capacity or regulatory constraints that impede the development of new resources, reduced system reliability due to the
impact on Reserve Margins is expected. Regulatory uncertainty gives resource owners added reason to retire existing
resources without providing sufficient assurance on future market conditions to developers of new resources. This
increases the risk of reduced system reliability.
Demand Total Internal Demand is forecast to grow at a compounded annual rate of 2.32 percent for the 2013–2022 assessment
period (ERCOT‐Table 2). The reduction in load forecast growth projections compared to a year earlier, results from changes
in the long‐range economic forecast, which is obtained from Moody’s.117 The Moody’s base‐case economic forecast was
used to provide forecast, non‐farm employment values for 2013–2022. A normal weather year was determined based on
actual weather data from 1997 to 2011. Reported peak demands represent the coincident demand for ERCOT.
ERCOT‐Table 2: Demand Outlook ERCOT‐Summer 2013 2022 10‐Year Change CAGR
NET INTERNAL DEMAND 65,649 80,694 15,045 22.9% 2.32%
Load‐Modifying Demand Response 1,279 1,813 534 41.7% 3.95%
TOTAL INTERNAL DEMAND 66,928 82,507 15,579 23.3% 2.35%
ERCOT‐Winter 2013/14 2022/23 10‐Year Change CAGR
NET INTERNAL DEMAND 50,263 61,450 11,187 22.3% 2.26%
Load‐Modifying Demand Response 1,471 1,886 415 28.2% 2.80%
TOTAL INTERNAL DEMAND 51,734 63,336 11,602 22.4% 2.27%
There are no expected changes in the footprint of the ERCOT Interconnection. There have been no significant changes in
the forecasting process since the previous LTRA. The extreme hot weather conditions experienced over the entire ERCOT
Interconnection during the summer of 2011 impacted the calculation of average weather conditions,118 resulting in higher
expected peak loads in future years. In the near term, this change in average weather conditions will increase forecast peak
loads by approximately 1.2 percent.
Demand-Side Management Load Resources (LRs) providing Responsive Reserve Service (RRS)119 are projected to provide 886 MW of dispatchable,
contractually committed Demand Response during summer peak hours in 2013 and future years (ERCOT‐Table 3).120,121
117 http://www.moodys.com/. 118 http://www.ercot.com/content/meetings/rpg/keydocs/2012/0817/2011_Long‐Term_Load_Forecast_Model_Descript.pdf. 119 Categorized as Load as Capacity Resource Demand Response in this assessment. 120http://www.ercot.com/content/mktinfo/dam/kd/ERCOT Percent20Methodologies Percent20for Percent20Determining Percent20Ancillary Percent20ServicePercent
20Requir.zip 121 The 886 MW represent LR participation in RRS capacity during the peak month of August 2011 across the peak hours (3‐6 PM).

ERCOT
NERC | 2012 Long‐Term Reliability Assessment | November 2012
Page 80 of 335
ERCOT‐Table 3: Demand‐Side Management Short‐Term
2022 Share of Total Internal Demand
ERCOT‐Summer 2013 2014 2015 2022 10‐Year Change
Direct Control Load Management (DCLM) 0 0 0 0 0 0.00% Contractually Interruptible (Curtailable) 393 432 476 927 534 1.12% Critical Peak‐Pricing (CPP) with Control 0 0 0 0 0 0.00% Load as a Capacity Resource 886 886 886 886 0 1.07%
TOTAL LOAD‐MODIFYING DEMAND RESPONSE 1,279 1,318 1,362 1,813 534 2.20%
TOTAL ENERGY EFFICIENCY 240 366 498 1,506 1,266 1.83%
TOTAL DEMAND‐SIDE MANAGEMENT 1,519 1,684 1,860 3,319 1,800 4.02%
Emergency Response Service (ERS, formerly known as Emergency Interruptible Load Service or EILS)122 is designed to be
deployed in the late stages of a grid emergency prior to shedding involuntary Firm load and represents contractually
committed interruptible load.123 Based on the results of the latest bid selection process, ERCOT planned to procure
approximately 393 MW of ERS load for the 2013 summer peak. For the 10‐year outlook, this procurement is expected to
increase by 10 percent per year, reaching 927 MW by 2022. Measurement and verification procedures for the LRs and ERS
programs are defined in the Performance Monitoring section of the ERCOT Protocols.124
In addition to these two Demand Response programs (LRs and ERS), several Transmission Service Providers (TSP) have their
own contractual arrangements with loads that can respond to instructions to reduce their energy usage. The recent
implementation of the Demand Response Availability System (DADS) will provide ERCOT better understanding regarding
the expected magnitude of load MW in the TSP‐based Demand Response programs. ERCOT is working to better coordinate
activation of these loads included in the TSP Demand Response programs with ERCOT system operations.
Recent legislation requires utilities to provide Energy Efficiency programs sufficient to reduce their incremental peak
demand growth by at least 20 percent each year. These programs include Low Income Weatherization, Energy Star (New
Homes), Air Conditioning Efficiency Programs, Air Conditioning Installer Training, Retro‐Commissioning, Hard‐to‐Reach,
Load Management, Multifamily Water & Space Heating, Texas SCORE/City Smart, Trees for Efficiency, and Third Party. The
incremental effect of this level of reduction is included as New Conservation (Energy Efficiency) in this assessment. The
impact of current Energy Efficiency is reported to the PUCT on an annual basis. ERCOT does not verify or measure the
impact of Energy Efficiency programs.
Utility savings, as measured and verified by an independent contractor, have exceeded the goals set by the utilities.125 In a
recent assessment, utility programs implemented after electric utility industry restructuring in Texas had produced 301 MW
of peak demand reduction and 536 GWh of electricity savings for 2010.126 This demand reduction is accounted for within
the load forecast, and only the incremental portion, which is expected to increase from 240 MW in 2013 to 1,506 MW in
2022, is included as a demand adjustment for the summer seasons during the assessment period.
Generation Existing‐Certain generation capacity in ERCOT, as currently reported by the generation resource owners, is 73,018 MW
(ERCOT‐Table 4). The primary fuel sources for generation in ERCOT are natural gas and coal. Since the 2011 summer season,
1,597 MW of generation capacity has been added or will return to service. The generation capacity consists of 1,260 MW of
gas generation (which includes 553 MW of mothballed units returned to service), 275 MW of coal generation, 35 MW of
wind generation (with nameplate capacity of 402 MW), and 27 MW of solar generation. There are 2,962 MW of
“switchable” generation that can operate in the ERCOT system or in the adjacent (not synchronously interconnected)
Southwest Power Pool Region. ERCOT counts all of the switchable generation capacity as Existing‐Certain capacity, except
for 317 MW, which is obligated to serve load outside of ERCOT through the year 2020.
122 Categorized as Contractually Interruptible (curtailable) Demand Response in this assessment. 123 See Section 3.14.3 of the current ERCOT protocols:http://www.ercot.com/content/mktrules/nprotocols/current/03‐051012_Nodal.doc 124http://www.ercot.com/content/mktrules/nprotocols/current/08‐020111_Nodal.doc 125http://www.texasefficiency.com/images/documents/Publications/Reports/EnergyEfficiencyAccomplishments/eummotreport2010.pdf 126http://www.puc.state.tx.us/industry/projects/rules/38578/EUMMOT_EEIP_June_2_2011.pdf

ERCOT
NERC | 2012 Long‐Term Reliability Assessment | November 2012
Page 81 of 335
ERCOT‐Table 4: Capacity Outlook127 Current 2022 Planned 2022 Planned & Conceptual
ERCOT‐Summer Capacity Share Capacity Share Change Capacity Share Change
Coal 18,215 24.9% 18,290 23.3% 75 20,580 24.5% 2,365 Petroleum 138 0.2% 1,378 1.8% 1,240 1,378 1.6% 1,240 Gas 48,355 66.2% 52,012 66.4% 3,657 53,756 63.9% 5,401 Nuclear 5,150 7.1% 5,150 6.6% 0 5,150 6.1% 0 Other/Unknown 0 0.0% 0 0.0% 0 0 0.0% 0 Renewables 1,160 1.6% 1,525 1.9% 365 3,230 3.8% 2,070
TOTAL 73,018 100.0% 78,355 100.0% 5,337 84,095 100.0% 11,076
ERCOT‐Figure 2: Summer Net Capacity Change
Before a new power project is included in reserve margin calculations, a binding Interconnection Agreement (IA) must exist
between the resource owner and the Transmission Service Provider (TSP). Additionally, thermal units must have an air
permit issued from the appropriate state and federal agencies specifying the conditions for operation. Future‐Planned
Resources expected through the assessment period (2013–2022) include 3,657 MW of gas‐fired generation, 75 MW128 of
coal‐fired generation, 1,240 MW of petroleum coke‐fueled generation, 60 MW of solar generation, 105 MW of biomass
generation, and 200 MW of on‐peak wind generation (2,098 MW of wind derate on‐peak). There is 1,224 MW of on‐peak
wind generation (11,260 MW of wind derate on‐peak) considered as Conceptual capacity for the 2013‐2022 assessment
period (ERCOT‐Table 5, ERCOT‐Figure 2, ERCOT‐Table 6, ERCOT‐Figure 3, ERCOT‐Table 6).
127 “Current” represents Existing‐Certain and Future‐Planned projections for the 2012 summer (for summer‐peaking assessment areas) or 2012/2013 winter (for winter‐peaking
assessment areas). “Share” represents the share (percent) of total Existing‐Certain and Future‐Planned capacity projected for the peak season. 128 Future‐Planned coal unit retirements nearly offset Future‐Planned unit additions, resulting in only 75 MW of added coal capacity by 2022.
0
1,000
2,000
3,000
4,000
5,000
6,000
7,000
2013 2014 2015 2016 2017 2018 2019 2020 2021 2022
MW

ERCOT
NERC | 2012 Long‐Term Reliability Assessment | November 2012
Page 82 of 335
ERCOT‐Table 5: Renewable Capacity Outlook129 Current 2022 Planned 2022 Planned & Conceptual
ERCOT‐Summer Capacity Share Capacity Share Change Capacity Share Change
Hydro 0 0.0% 0 0.0% 0 0 0.0% 0 Pumped Storage 0 0.0% 0 0.0% 0 0 0.0% 0 Geothermal 0 0.0% 0 0.0% 0 0 0.0% 0 Wind 873 75.3% 1,073 70.4% 200 2,297 71.1% 1,424 Biomass 213 18.4% 318 20.9% 105 318 9.8% 105 Solar 74 6.4% 134 8.8% 60 615 19.0% 541
TOTAL 1,160 100.0% 1,525 100.0% 365 3,230 100.0% 2,070
ERCOT‐Figure 3: Summer Net Renewable Capacity Change
One 925 MW thermal generation project was expected to become available prior to the 2012 summer season. However,
this project has been delayed and is now expected to be available in March 2013. ERCOT has been notified that the Cobisa‐
Greenville gas‐fired plant (1,792 MW), tentatively scheduled to be on‐line by 2016, has been indefinitely delayed. In
addition, a gas plant that was expected to be on‐line prior to the summer of 2014 has been delayed and is now expected in
January 2015. ERCOT has not been notified of any other project deferments. However, the status of Future‐Planned gas‐
fired resources is being reviewed frequently; current market conditions caused by low natural gas prices are not conducive
to gas generation market investment.
ERCOT Table 6: Renewable Capacity Outlook: On‐Peak Vs. Installed Current 2022 Planned
ERCOT‐Summer Wind Solar Hydro Biomass Wind Solar Hydro Biomass
Installed Capacity 10,035 74 544 213 12,333 134 544 318 On‐Peak Derate 9,162 0 544 0 11,260 0 544 0
EXPECTED ON‐PEAK OUTPUT 873 74 0 213 1,073 134 0 318
In order to gain additional insight into any impediments to investment in generation resources in ERCOT, the Region
commissioned The Brattle Group to conduct a review of current market conditions and the impact on generation
development.130 The primary report high‐level recommendations are for the Public Utility Commission of Texas (PUCT) and
ERCOT to: (1) evaluate and define resource adequacy objectives for the BPS; and then (2) choose a policy path to meet
those objectives, based on the advantages and disadvantages of each option identified. ERCOT has not been formally
notified of any resource retirements, although one resource owner has publicly announced that they will retire the J.T.
Deely coal‐fired plant (845 MW) by the end of 2018. This expected retirement is included in this assessment.
Given the current market design, in which no party has a requirement to develop or maintain generation resources, ERCOT
will study the potential impact of any announced unit retirements and will work with resource owners to finalize reliability‐
must‐run contracts in the event that units are required to maintain system reliability. ERCOT will develop analyses of
129 “Current” represents Existing‐Certain and Future‐Planned projections for the 2012 summer (for summer‐peaking assessment areas) or 2012/2013 winter (for winter‐peaking
assessment areas). “Share” represents the share (percent) of total Existing‐Certain and Future‐Planned capacity projected for the peak season. 130Operations and System Planning document titles “The Brattle Group Report”: http://www.ercot.com/news/presentations/index#.
0
50
100
150
200
250
300
350
400
2013 2014 2015 2016 2017 2018 2019 2020 2021 2022
MW

ERCOT
NERC | 2012 Long‐Term Reliability Assessment | November 2012
Page 83 of 335
reliability and market impact of potential expected retirements as needed and make this information available to market
participants so that developers and investors can accurately assess future market opportunities.
There are no planned unit uprates or non‐traditional resources included in the Future‐Planned, Future‐Other, or Conceptual
resources. Several units with a total capacity of 553 MW that had been idled (or mothballed) by the respective owners have
returned to service since last summer. As ERCOT has not been notified that these units will return back to mothballed
status, the units are considered to be available throughout the assessment period. However, given that the units are older,
less efficient, and previously determined not to be cost‐effective by the owners, it is unlikely that these units will remain
completely available throughout the assessment period. Essentially, the summer season appears to provide an economic
viability opportunity for these units to return to service for the summer seasons but return to mothball status during off‐
peak periods.
Two storage facilities (76 MW of batteries considered as Conceptual resources) are currently being reviewed by ERCOT staff
for possible interconnection before 2013. The facilities have publicly announced plans but have not completed the ERCOT
process to be included in Planned or Existing‐Certain Capacity categories.
ERCOT has a number of resources categorized as behind‐the‐meter (or Private‐Use Network) generation. The capacity from
these resources provided to the grid is assessed on a regular basis; operational data from the summer of 2011 indicates
that these resources are able to provide 4,390 MW during peak hours. Previously ERCOT had surveyed behind‐the‐meter
generation owners to determine what capacity may be available to the ERCOT grid, but ERCOT staff recently determined
that using actual availability provided a more technically acceptable value. ERCOT will work with owners of behind‐the‐
meter generation to ensure that changes in the aggregate capability of these resources are appropriately quantified in
future resource assessments.
Of the Existing‐Certain generation capacity, 108 MW is biomass and 74 MW is solar. ERCOT counts these resources as
available on‐peak. There are 544 MW of hydro generation capacity in ERCOT; internally (i.e., within ERCOT internal
assessments) this capacity is expected on‐peak but for this NERC assessment hydro generation capacity has been derated to
zero (0) MW, as has been done historically. Of the 9,829 MW of existing wind generation capacity and 2,298 MW of Future‐
Planned wind generation capacity, 855 MW of Existing and 200 MW of Future‐Planned is included in the expected on‐peak
resources, respectively. The currently approved Effective Load Carrying Capability (ELCC) of wind resources in ERCOT is 8.7
percent. The ELCC of wind generation is determined as part of the ERCOT Region Target Reserve Margin evaluation using a
Loss of Load Probability Monte Carlo model.131
ERCOT has significant experience maintaining operational reliability with significant and increasing levels of interconnected
variable generation. Using a combination of state‐of‐the‐art wind generation forecasts and flexible levels of ancillary
services, ERCOT will effectively manage available wind and solar generation to support system reliability utilizing current
procedures. Continuing development of wind resources along the Texas coast, which exhibit generation patterns that are
more correlated with summer peak loads than wind sited in inland western portions of Texas, is also expected to increase
the overall reliability benefit from wind generation. An evaluation of possible differences in a locational‐based wind ELCC is
in progress.
With only 74 MW of registered solar resources in ERCOT (not including smaller solar resources that do not participate in the
wholesale energy market) and only 60 MW of solar resources included in the Future‐Planned Category, the variability of
these resources will not adversely affect the reliability of the grid. As future solar generation becomes more prevalent in
ERCOT, it will become necessary to develop an estimate of the ELCC of solar resources and to develop a process for
forecasting solar resources.
131 Item 14 documents located at http://www.ercot.com/calendar/2010/11/20101104‐TAC give more details.

ERCOT
NERC | 2012 Long‐Term Reliability Assessment | November 2012
Page 84 of 335
Less than 1 percent of the ERCOT generation capacity is hydro (544 MW). These facilities are typically operated as run‐of‐
river or planned release due to downstream needs and not operated specifically to produce electricity. However, these
resources may be available during peak conditions, either to provide energy or to provide ancillary services, ensuring units
are available to provide energy to serve Firm load.
Capacity Transactions ERCOT is a separate interconnection with only asynchronous ties to the Southwest Power Pool (SPP) and Mexico’s Comisión
Federal de Electricidad (CFE). ERCOT does not share reserves with other Regions. There are two asynchronous ties between
ERCOT and SPP, providing a sum of 820 MW of transfer capability and three asynchronous ties between ERCOT and Mexico,
with a total of 280 MW of transfer capability.
ERCOT does not rely on external resources to meet demand under normal operating conditions; however, under
emergency support agreements, it may request external resources for emergency services over the asynchronous ties or by
block transfer of discrete loads. Under peak conditions for the assessment period, ERCOT is expected to have 458 MW of
imports from SPP and 123 MW from CFE. Of the imports from SPP, 48 MW is tied to a long‐term contract for a purchase of
Firm power from specific generation. The remaining imports of 410 MW from SPP and 123 MW from CFE represent one‐half
of the asynchronous tie transfer capability, included to reflect emergency support arrangements. Total Firm imports
amount to 598 MW throughout the 2013–2022 outlook (ERCOT‐Table‐7).
ERCOT‐Table 7: Projected Capacity Transactions ERCOT‐Summer 2013 2014 2015 2016 2017 2018 2019 2020 2021 2022
Expected Imports 0 0 0 0 0 0 0 0 0 0 Firm Imports 598 598 598 598 598 598 598 598 598 598
TOTAL IMPORTS 598 598 598 598 598 598 598 598 598 598
Expected Exports 0 0 0 0 0 0 0 0 0 0 Firm Exports 317 317 317 317 317 317 317 317 0 0
TOTAL EXPORTS 317 317 317 317 317 317 317 317 0 0
TOTAL NET CAPACITY TRANSACTIONS 281 281 281 281 281 281 281 281 598 598
Additional asynchronous tie capacity between ERCOT and other Regions is being developed by independent market
participants. The Southern Cross132 and the Tres Amigas133 projects could add a combined 3,000–6,000 MW of import and
export capacity between ERCOT and other Regions (SERC, WECC and SPP). Both of these projects are in the market
subscription stage; if either project garners sufficient market subscriptions to become viable, a target project completion
date will be set, additional studies regarding the impact of the project will be conducted, and the additional tie capacity will
be included in future assessments.
Several SPP members own 317 MW of a power plant located in ERCOT, resulting in a Firm export of that amount from
ERCOT to SPP. This contract is currently expected to terminate before the peak season of 2020. There are no known non‐
firm contracts signed or pending, or any other contracts that are known to be under negotiation or study (outside of the
two projects described in the previous paragraph).
Transmission There are currently 4,974 circuit miles of 345 kV transmission additions planned in ERCOT during the 2013–2022
assessment period. This total includes the transmission improvements designed to connect five designated Competitive
Renewable Energy Zones (CREZ) in west Texas to major load centers in Texas.134 The CREZ project alone includes more than
2,300 circuit miles of 345 kV transmission right‐of‐way. Six of the new rights‐of‐way will include series compensation,
mostly located at intermediary substations. The CREZ project will include approximately 1,400 MVars of Static Var
Compensators (SVC), 4,000 MVars of shunt reactors, and 1,000 Mvars of shunt capacitors. This project also includes
upgrades of several circuits, many immediately west of Fort Worth and northwest of San Antonio, where the CREZ circuits
132 http://www.southerncrosstransmission.com/project_documents/southern_cross_fact_sheet.pdf 133 http://www.tresamigasllc.com/index.php 134 http://www.texascrezprojects.com/default.aspx

ERCOT
NERC | 2012 Long‐Term Reliability Assessment | November 2012
Page 85 of 335
connect with existing infrastructure. All of these improvements are scheduled to be completed by the end of 2013. It is
expected that these new and upgraded circuits will eliminate the existing West‐to‐North Dynamic Stability limit, which
limits power flows from the West Zone to the North Zone. ERCOT is reviewing the proposed configurations to see if new
interface limits may occur during and after the CREZ line construction.
Existing and projected transmission lines for the ERCOT Assessment Area are as follows (ERCOT‐Table 8):
ERCOT‐Table 8: Existing and Projected Transmission ERCOT AC(Circuit Miles) DC(Circuit Miles) Total(Circuit Miles)
EXISTING 29,465 0 29,465
Currently Under Construction 946 0 946 Planned ‐ Completed within First Five Years 4,757 0 4,757 Planned ‐ Completed within Second Five Years 29 0 29
2022 TOTAL (UNDER CONSTRUCTION & PLANNED) 35,197 0 35,197
Conceptual ‐ Completed within First Five Years 800 0 800 Conceptual ‐ Completed within Second Five Years 391 0 391
2022 TOTAL (UNDER CONSTRUCTION, PLANNED & CONCEPTUAL) 36,388 0 36,388
A new 345 kV transmission line with series compensation is planned to connect the Laredo Area with the Lower Rio Grande
Valley Area. The line will support the high load growth projected for the Lower Rio Grande Valley Area, as well as provide
longer‐term benefits for the Laredo Area. It is projected to be in service by the summer peak of 2016. This project will
increase the limit of power flows between the rest of ERCOT and the Lower Rio Grande Valley region.
Current transmission plans during the assessment period include the installation of thirty‐four 345/138 kV
autotransformers to support load growth and the reliability of the ERCOT Interconnection.
There is a transmission constraint commonly referred to as the North‐to‐Houston Voltage Stability Limit and considered an
Interconnection Reliability Operating Limit (IROL) that is managed daily. At this point, there has been no information
regarding the future mitigation of that IROL. ERCOT is reviewing the September 8, 2011 Southwest Blackout Event135
recommendations to determine whether any procedural changes may be necessary regarding IROL identification, as well as
other aspects of the report.136 ERCOT does not have any additional transmission constraints that are expected to
significantly impact reliability.
A major planned circuit connecting the Fayetteville and Zenith substations (west of Houston) has been cancelled. This
project was endorsed by ERCOT in 2010 based on aggregate reduction of market prices due to reduced congestion into the
Houston Area. This project was not required in order to maintain adequate system reliability. Following project
endorsement, the PUCT changed the economic planning criteria for transmission in ERCOT, eliminating the consideration of
market prices from the process. This change resulted in the cancellation of the Fayetteville to Zenith project. ERCOT
planning studies will continue to review the possible need for additional transmission projects in and around the major load
centers, including Houston.
No project delays or long‐term outages that are expected to affect system reliability are known at this time. Outage analysis
in the Operations Planning and Operations horizons ensure that system outages, transmission or generation, are only taken
if they do not compromise system reliability.
ERCOT ensures that adequate transmission is planned and constructed to support new generation and increasing loads
through a coordinated planning process, including long‐range studies, mid‐term transmission planning, and stability
analyses over a range of planning horizons and system conditions. The ERCOT Five‐Year Transmission Plan study137 and
135 http://www.ferc.gov/legal/staff‐reports/04‐27‐2012‐ferc‐nerc‐report.pdf. 136Recommendations in Appendix B starting on page 116 of the report located at http://www.nerc.com/files/AZOutage_Report_01MAY12.pdf 137 This study is not available to the public. A description of the process used to develop this study is included within the “ERCOT Regional Planning Group – Chapters and
Procedures.” http://www.ercot.com/content/committees/other/rpg/keydocs/2012/RPG_Charter_and_Procedure_20090716_Approved.pdf. Charter and Procedures

ERCOT
NERC | 2012 Long‐Term Reliability Assessment | November 2012
Page 86 of 335
additional voltage stability studies through the 2015 summer peak network conditions identify limiting elements under
contingency. Based on the results of these studies, ERCOT proposes projects as needed to mitigate any system deficiencies.
Reactive margins are analyzed in the planning horizon. In the operating horizon, reactive margins are maintained in the
major metropolitan areas through real‐time analysis. Areas of dynamic and static reactive power limitations are Corpus
Christi, Houston, Dallas/Fort Worth, and Lower Rio Grande Valley. Operating Procedure Manual for the Transmission and
Security Operating Procedure 6.1, Voltage Control, describes the procedure to monitor the system and to prevent voltage
collapse using an on‐line voltage stability analysis tool.138
ERCOT plans for a 5 percent voltage stability margin for NERC Category B contingencies and a 2.5 percent margin for NERC
Category C contingencies.139 ERCOT planning criteria are intended to maintain sufficient dynamic reactive capability to
maintain system voltages within the range for which generators are expected to remain on‐line. Potential problems are
reported to ERCOT System Planning and the affected Transmission Planners (TPs) to develop corresponding transmission
projects to resolve the lack of voltage stability margin and to Transmission Operators for their reassessment for the
operating horizon.
Significant substation equipment installed or planned for the ERCOT Region includes:
300 Mvar Static Var Compensator (SVC) at the Tesla 345kV Station (CREZ‐related)
2 x 300 Mvar SVC at the Brown 345kV Station (CREZ‐related)
300 Mvar SVC at the Parker 345kV Station (CREZ‐related)
200 Mvar SVC at Hamilton 138kV Station (CREZ‐related)
Vulnerability Assessment Given recent rainfall, drought conditions in ERCOT are significantly less severe than they were in 2011. There are no
immediate concerns regarding the impact of reduced water levels or increased water temperatures on generation
resources. However, ERCOT continues to work with resource owners to closely monitor the availability of water resources
at generating plants. ERCOT is also working with several national laboratories on an analysis of the potential impact of a
multi‐year sustained drought on system needs as part of the long‐term transmission planning process. The results of this
analysis will be included in the internal ERCOT Long‐Term System Assessment scheduled to be completed in December
2012.
Unit outages are reviewed and approved or denied in the outage scheduling process. In addition, as part of the analysis of
the impact of changing environmental regulations, ERCOT is working directly with resource owners to assess the potential
impact of extended outages to install additional emissions control technologies. At this time, there are no known extended
outages that are expected to have an impact on system reliability. This is primarily due to regulatory uncertainty and the
required analysis that will need to be completed to determine the affected unit economic viability.
The Renewable Portfolio Standard (RPS)140 for Texas (including areas of Texas that are outside of ERCOT) is 5,880 MW of
installed renewable capacity by 2015 and 10,880 MW of installed capacity by 2025. Each entity that serves load is required
to obtain sufficient renewable energy credits from renewable resource owners (one credit for each megawatt produced
from a renewable resource) to represent their market share of energy sales times the renewable capacity goal. The 2025
target has already been met. These targets may be changed by the state legislature, which convenes at the start of every
odd‐numbered year.
A wind integration study completed for ERCOT in 2008 indicated that the current nodal operating procedures, with
purchases of suitable amounts of ancillary services, would be appropriate for levels of integrated wind generation capacity
138
http://www.ercot.com/content/mktrules/guides/procedures/Transmission Percent20and Percent20Security Percent20Operating Percent20Procedure Percent20V1Rev16.doc 139
See Section 4.1.1 of the ERCOT Planning Guides: http://www.ercot.com/content/mktrules/guides/planning/current/04‐090111.doc 140
http://www.puc.state.tx.us/rules/statutes/Pura09.pdf; Section 39.904

ERCOT
NERC | 2012 Long‐Term Reliability Assessment | November 2012
Page 87 of 335
up to 15,000 MW. This level is greater than the current RPS targets, even for 2025, and greater than the amount of wind
capacity in the Existing‐Certain and Future‐Planned categories. ERCOT has implemented a wind power forecasting system
to allow ERCOT system operators to identify and take appropriate action when wind resource schedules may not track
expected changes in wind production. ERCOT has also implemented a wind ramp forecasting tool that provides a
probabilistic assessment of the magnitude and likelihood of a significant change in aggregate wind output over upcoming
operating periods. In addition, ERCOT evaluates the impact of increased installed wind generation on ancillary services
requirements on an ongoing basis.141
Levels of solar resources currently in the interconnection queue are unlikely to have an adverse impact on system reliability.
ERCOT works with market stakeholders to ensure that procedures and processes are sufficient to reliably integrate variable
resources through operating practices. The Emerging Technologies Working Group has been established to track issues142
and make recommendations regarding the integration of new technologies, particularly variable resources.
There are no anticipated reliability concerns resulting from unresponsive or unavailable Demand Response. There are
specific measurement and verification procedures for the coordinated Demand Response programs.143 Both LRs and ERS
products are subject to unannounced load‐shed testing, to be followed by an additional test if the first is unsuccessful. A
second consecutive unsuccessful test subjects the resource to suspension. In addition, these resources are monitored using
after‐the‐fact metering and are subject to payment reductions and suspension from the program for failing to meet
availability requirements.
These Demand Response programs (LRs and ERS) are utilized in the event of a sudden loss of generation (LRs) or in the
event of an imminent shortage of system‐wide generation (LRs and ERS). Response from these resources has been
satisfactory in previous events in which they were utilized.
Similarly, there are no expected reliability concerns related to high levels of Demand Response resources. ERCOT currently
limits the Demand Response participation of LRs at 50 percent of the hourly RRS procurement, for which the minimum
requirement is 2,800 MW. This participation limit is reviewed on a regular basis. LRs are deployed automatically via Under
Frequency Relays in response to frequency excursions below 59.7 Hz or through manual deployment during system
emergencies such as Energy Emergency Alerts.
There are no anticipated reliability concerns with distributed resource integration at this time.
ERCOT plans grid enhancements as needed on a continuous basis and does not plan for additional Under‐Voltage Load
Shedding (UVLS) schemes as a reliability tool. UVLS deployments are intended to provide a “safety net” in case other
operating actions are not sufficient to resolve under‐voltage problems. UVLS schemes generally are not relied upon to
maintain the overall system stability following NERC Category B and C events,144 and system reinforcements may be made
to limit the amount of load shed that may occur under certain NERC Category D events.
ERCOT works with transmission service providers to minimize the use of Special Protection Systems (SPS) and Remedial
Action Plans (RAP).145 When utilized, these measures will improve rather than adversely impact system reliability and
possibly reduce system costs. These measures are typically designed to be temporary—utilized only until a system
improvement eliminates the need for the SPS or RAP.146
141http://www.ercot.com/content/mktinfo/dam/kd/ERCOT Percent20Methodologies Percent20for Percent20Determining Percent20Ancillary Percent20Service
Percent20Requir.zip 142http://www.ercot.com/content/meetings/tac/keydocs/2010/1104/15._ETIP_draft_v10_102210.doc 143 As defined in the Performance Monitoring section of the ERCOT Protocols. (http://www.ercot.com/content/mktrules/nprotocols/current/08‐020111_Nodal.doc). 144 http://www.nerc.com/page.php?cid=2|20. 145 A RAP is a predetermined operator action to maintain reliability in a defined adverse operating condition. See Section 4.3.1 of the ERCOT Operating Guides for additional
information: http://www.ercot.com/content/mktrules/guides/noperating/current/04‐121411.doc 146 A list of current SPSs and RAPs in ERCOT is available on the ERCOT website: https://mis.ercot.com/pps/tibco/mis/Pages/Grid+Information/Long+Term+Planning
ERCOT
NERC | 2012 Long‐Term Reliability Assessment | November 2012
Page 88 of 335
ERCOT works with transmission service providers to develop options in the event of large emergencies. As an example,
areas where load transfers can be implemented are reviewed on an ad hoc basis, and in some cases additional transmission
equipment to allow such block‐load transfers has been installed. Additionally, transmission service providers supply ERCOT
with a list of NERC Category D contingencies, which are studied annually.
ERCOT is working with transmission service providers and university researchers to evaluate ways to utilize Phasor
Measurement Unit (PMU) data. Current initiatives seek to utilize PMU data to validate aspects of planning stability models
and to increase real‐time operational awareness.
There are currently over 4.4 million advanced meters being used for customer load settlement in the ERCOT Region. Retail
electric service providers are beginning to provide time‐of‐use rates, although at this point most of these offerings are
simply two or three different periods in a day. The potential exists for these load resources to grow into an aggregate size
that has an impact on market prices and system reliability. ERCOT will continue to coordinate with the PUCT, with
transmission service providers, and retail electric service providers to forecast the potential impact associated with the
advanced meter data use, and to quantify the participation of market‐driven customer Demand Response in real‐time
operations.
ERCOT has Operating Guides to address relay misoperations and the defined requirements for registered entities to follow
in the event of relay misoperations. Registered entities are required to follow TRE’s procedure for misoperations as well. In
addition, ERCOT has established the System Protection Working Group, made up of ERCOT market participants with
knowledge of relay operations, to investigate relay misoperations and disseminate lessons learned.
ERCOT continues to review the potential impact of changing environmental regulations on system reliability. ERCOT is
coordinating directly with resource owners to understand their individual compliance strategies and to aggregate these
activities to evaluate the system‐wide impact. It is unknown at this time if the recently finalized Mercury and Air Toxics
Standard (MATS) will result in retirement of existing coal‐fired capacity or if existing coal‐fired generation capacity will be
retrofitted with additional emissions control technologies. Because the Cross‐State Air Pollution Rule (CSAPR) was stayed
prior to implementation, and the EPA proposed rule revisions that may or may not be implemented depending on the ruling
of the D.C. Court of Appeals, it is not known if the CSAPR predecessor, the Clean Air Interstate Rule (CAIR), will have a near‐
term impact on available resources. However, the combined impact of sustained low natural gas prices, current economic
and market conditions, regulatory uncertainty, and other environmental regulations could result in decisions by resource
owners to retire units. If these decisions are made in a time frame that does not allow for market investment in new
generation resources, overall system reliability will be adversely affected.
Representatives of the Texas Commission on Environmental Quality (TCEQ)147 have informed ERCOT that the emissions
requirements in the MATS rule for Future‐Planned and Conceptual solid‐fuel units are more stringent than those included in
recently finalized air permits for several new plants. This discrepancy could force these new units to reapply for air permits
and could result in project delays or cancellations.
A review of the impact of proposed environmental regulations on the ERCOT system completed in June 2011 noted the
potential impact of upgrade requirements on old gas‐steam generation units.148 As these units are only utilized during peak
load conditions, they do not generate sufficient revenue to warrant even minor capital additions. As a result, any retrofit
requirement (such as potential entrainment/impingement limitations resulting from proposed Clean Water Act Section 316
(b) implementation) could lead to significant retirements of gas‐steam units. The report cited above noted as much as 9,800
MW of vulnerable generation capacity. Much of this generation is located in or near urban centers; retirement of these
units would result in a need for new generation and, potentially, new generation and transmission to increase import
147 http://www.tceq.state.tx.us/. 148 http://www.ercot.com/content/news/presentations/2011/ERCOT_Review_EPA_Planning_Final.pdf

ERCOT
NERC | 2012 Long‐Term Reliability Assessment | November 2012
Page 89 of 335
capability into these affected load centers. Redevelopment of existing brownfield generation facilities could reduce the
need for new transmission, but such redevelopment could be hindered by limited existing gas pipeline infrastructure and by
air quality permitting requirements.
ERCOT recently commissioned Black and Veatch to conduct a review of the potential impact of gas curtailment on the
ERCOT grid.149 The study indicates a significant amount of redundancy and robustness in gas supply to generation facilities.
While the greatest risk to generation loss was found to be the result of freezing weather, even in extreme weather the
regional pipeline capacity was found to be adequate to meet current generation demands.
Plans for Accommodating Generator Retirements and Environmental Control Retrofits
Each individual generator owner/operator has to evaluate the environmental regulations to determine their applicability
and the risk and impact to specific sites. If there is an impact noted a financial evaluation of the various options available to
the owner/operator (e.g. wet limestone scrubber, dry sorbent injection, selective non‐catalytic reduction, closed‐loop
cooling tower, baghouse, etc) would occur. Additional in‐depth review of near‐ and long‐term markets and the companies
individual strategies associated with those markets would need to occur to evaluate economic viability. At this point, no
resources owners have informed ERCOT of the need to retrofit or retire existing generation in order to comply with recently
finalized environmental regulations. ERCOT performed two assessments of the potential impacts of environmental
regulations on resources. Reports describing the methodologies and results of these studies are available on the ERCOT
web site150,151. The reports assess the potential impacts of environmental regulatory changes based on ERCOT reviews of
published nation‐wide impact studies of the proposed regulations. In addition, ERCOT met with environmental experts from
several of the generating entities in the ERCOT Region. Using information obtained from these reviews, ERCOT developed
scenarios based on likely compliance requirements and future market conditions and evaluated the economic value of
affected generating units. It should be noted that there is a great degree of uncertainty in the environmental regulation
implementation horizon that hinders efforts to develop firm plans for resource owners and ERCOT.
ERCOT has not recently formally received nor requested any updated specific plans from generator owner/operators to
achieve compliance with the environmental standards. Some owners have informally noted that compliance will be
achieved through low capital cost plant changes and fuel switching. As noted in an ERCOT assessment152, the compliance
requirements of the regulations and the compliance schedules will have a significant impact on system reliability.
ERCOT has not recently received nor requested any specific plans to achieve compliance with the environmental standards.
There is a general concern by Texas RE that lack of sufficient planning, largely due to uncertainty regarding the
environmental regulations, by and between the generator owners/operators and ERCOT, may result in a significant demand
on internal and external personnel resources and, possibly, equipment necessary to provide compliance.
The installation of environmental controls or other facility enhancements may require an extended outage for each
associated generating unit. If the compliance schedule to implement the solutions is overly restrictive, a significant number
of units may request to be unavailable at the same time, possibly resulting in ERCOT not being able to approve all the
outages necessary and still maintain system reliability. As was shown in December 2011, when Luminant announced the
idling of coal‐fired Monticello Units 1 and 2153 due to CSAPR, ERCOT study methodologies indicated that the units were not
required for transmission reliability but could cause ERCOT to drop below its Target Reserve Margin. ERCOT decisions
avoided subjecting Luminant to possible litigation as a result of probable EPA regulation violations by not finding the
Luminant units necessary to maintain reliability of the ERCOT Interconnection. The finding followed the current local rules
associated with determining “reliability must run” unit designation and there have been limited changes to those rules
149 http://www.ercot.com/content/news/presentations/2012/BV Percent20ERCOT Percent20Gas Percent20Study Percent20Report Percent20March Percent202012.pdf 150http://www.ercot.com/content/news/presentations/2011/ERCOT_Review_EPA_Planning_Final.pdf 151http://www.ercot.com/content/news/presentations/2011/ERCOT_CSAPR_Study.pdf 152http://www.ercot.com/content/news/presentations/2011/ERCOT_Review_EPA_Planning_Final.pdf 153http://www.luminant.com/news/spotlight/detail.aspx?FtID=23

ERCOT
NERC | 2012 Long‐Term Reliability Assessment | November 2012
Page 90 of 335
since December 2011. However, ERCOT rules were changed to allow ERCOT to recall “mothballed” units for imminent
emergencies. In August 2012 Luminant provided a suspension of operations notice to ERCOT indicating that the Monticello
Units 1 and 2 would be offline starting December 2012 for a minimum of six (6) months and no more than seven (7) months
due to low energy prices within the ERCOT market not environmental regulations. ERCOT subsequently removed the units
from the preliminary Seasonal Assessment of Resource Adequacy for the ERCOT 2012/2013 winter154.The spring and early
summer of 2013 will help ERCOT evaluate impact on the system of an unexpected extended outage above and beyond what
normally may occur.
Since there have been no retirement announcements transmission needs have not been identified at this time. However,
even at system reserve margin levels at or near the current Target Reserve Margin for ERCOT of 13.75 percent, it is possible
that unit retirements could result in significant local congestion. Generation within urban load centers can be operated
during peak load periods to limit the amount of power provided by distant generation. The retirement of intra‐urban
generation resources would result in the need to import more power to serve load, leading to potential overloads and
increased reactive power requirements. Given the locations of the potential generation retirements caused by the pending
regulations, the two areas of specific concern for transmission reliability are the Dallas/Fort Worth region and the Houston
region. A detailed study would be required in order to determine the most cost‐effective improvements to maintain
transmission system reliability in the ERCOT Region following a significant retirement of generation capacity.
At this point, with limited information available, it is not known whether any possible projects will be completed by 2016.
An evaluation of each unit retirement will need completion to determine if a project is needed and what project timeframe
will be required. One Transmission Operator in the ERCOT Region, ONCOR, has recently adjusted its planning criteria to
accommodate the possibility of no generation being available at an entire site regardless of the reason (market or
environmental reasons)155. Although not specifically related to the pending environmental regulations, the ONCOR idea
addresses the impact of generation loss in an area that results in transmission upgrades and is viewed as a positive
proactive planning step in the right direction to address possible issues with environmental regulation impacts. The ONCOR
plan to mitigate the congestion condition extends to 2018.
The Public Utility Commission of Texas is currently reviewing additional options to incentivize generation to be built within
the ERCOT Region.156,157 There have been some recent rules changes but more efforts are ongoing to reach the full potential
of options.
No announcements have been made by resource owners in the ERCOT region regarding plant retrofits or retirements of
resources due to recently finalized environmental regulations.
As noted above, ERCOT has completed two assessments of the potential system impacts due to environmental regulations.
Texas RE affirms that ERCOT needs to coordinate more aspects of the environmental impacts, such as outage coordination,
internal and external personnel constraints, and, possibly, equipment availability constraints with resource owners to fully
understand the developing compliance strategies, and to assess impacts of these compliance actions on grid operations and
resource adequacy. Texas RE will monitor ERCOTs progress as the regulatory uncertainty is further clarified and refined.
Standing and Emerging Reliability Issues Environmental Regulations
The impact of environmental regulations on the ERCOT system was delayed due to the court stay of the Cross‐State Air
Pollution Rule (CSAPR). Without that stay, the regulations likely would have affected system reliability in 2012. At this point
154 http://www.ercot.com/content/news/presentations/2012/SARA‐Winter2012‐13_Preliminary.pdf 155http://www.ercot.com/content/meetings/rpg/keydocs/2012/0817/OncorERCOTRPGOdessaNPresentation08172012.pdf 156http://www.ercot.com/content/news/presentations/2012/The%20Brattle%20Group%20Presentation%20for%20PUCT%20July%2027%202012%20Work.pdf 157http://interchange.puc.state.tx.us/WebApp/Interchange/application/dbapps/filings/pgControl.asp?TXT_UTILITY_TYPE=A&TXT_CNTRL_NO=40000&TXT_ITEM_MATCH=1&TXT
_ITEM_NO=&TXT_N_UTILITY=&TXT_N_FILE_PARTY=&TXT_DOC_TYPE=ALL&TXT_D_FROM=&TXT_D_TO=&TXT_NEW=true

ERCOT
NERC | 2012 Long‐Term Reliability Assessment | November 2012
Page 91 of 335
the CSAPR predecessor, CAIR, impacts have not been fully evaluated. The Mercury and Air Toxics Standard (MATS) required
compliance by 2015 (or within two years of that date with possible compliance extensions). Other regulations (Clean Water
Act (Section 316(b)), Coal Combustion Residuals Disposal (CCRD)) may take effect later in this decade.
The impact of proposed environmental regulation on resource adequacy is a standing reliability issue of national interest
that has been studied by NERC, ERCOT, and other concerned stakeholders. The EPA has proposed new regulations that, if
implemented, may degrade the economic viability of certain generation resources. Specifically, the Clean Water Act
(Section 316(b)), the MATS, , and the Coal Combustion Residuals Disposal, as well as the existing CAIR regulations may
require retrofits or upgrades or otherwise increase production costs to a point at which retirement of those units may be
more plausible than continued operation.
During the 10‐year horizon, Generator Owners whose cost of compliance is greater than or equal to the present value of
the future predicted stream of revenue associated with a certain generator may opt to retire that unit. Preliminary ERCOT
studies for the impact of EPA regulation, not including CSAPR, suggest that 9,800 MW of legacy gas units are at highest risk
of accelerated retirement. The combined impact of sustained low natural gas prices, the CAIR, MATS rule, and other
regulatory uncertainty may result in the retirement of solid‐fuel units as well.
Accelerated generation retirements without accelerated development of new generation resources will further decrease
the Reserve Margin within ERCOT. The Reserve Margin in ERCOT is forecast to fall below the required 13.75 percent level in
2013 even without these accelerated retirements.
Preliminary ERCOT studies, which were performed prior to the issuance and subsequent vacating of the CSAPR and
assumed implementation of the Clean Air Transport Rule, suggest that coal plants within the Region should continue to be
economically viable to operate, unless low natural gas prices and increased carbon emissions fees occur with the pending
regulations. Low natural gas prices are present now due to increased production or possible production of shale plays
within the continental United States. Gas plants in the ERCOT Region, facing the imposition of closed‐loop cooling tower
requirements as a part of Section 316(b) of the Clean Water Act, are likely to see less‐than‐favorable economics for
continued operation. ERCOT studies suggest that over 9,800 MW of gas‐fired generation near or around the Dallas and
Houston Areas may be affected by EPA regulations including Section 316(b) of the Clean Water Act. In addition, ERCOT
completed an assessment of the proposed inclusion of Texas in the CSAPR. The assessment found that, if the rule were
implemented as scheduled on January 1, 2012, the generators’ compliance plans indicated that 1,200 to 1,400 MW of
generation would be unavailable year round and an additional 1,800 to 4,800 MW would be unavailable during the off‐peak
months. If potential retirements occur as projected in various ERCOT studies, reactive support and/or new import paths will
be required in the Dallas/Fort Worth and Houston metropolitan areas.
As potential retirements occur as forecast in ERCOT studies, and market conditions do not attract incremental or
replacement generation, then Reserve Margins within the ERCOT Region will not be satisfactory during the 10‐year horizon.
The PUCT has held a number of workshops and regulatory discussions regarding resource adequacy. Redevelopment of
existing generation sites would be likely to minimize the need for additional transmission investment. However, many
legacy gas plants are located within EPA air quality non‐attainment zones. In addition, pipeline requirements of new
generation may exceed the capability of pipeline infrastructure at legacy gas plant locations.
If potential retirements occur as forecast in ERCOT studies and incremental or replacement generation is not constructed,
then ERCOT will face lower Reserve Margins, decreased ramping capability, and increased transmission congestion. The
unavailability of generation due to MATS would increase capacity insufficiency and the need for emergency actions,
including rotating outages, not only during the peak months but also during the off‐peak months until retrofits or
alternative resources are implemented.
It is not clear when resource owners will finalize their compliance strategies due to the uncertainties in the implementation
of environmental regulations and the need to verify the effectiveness of available environmental control technologies to

ERCOT
NERC | 2012 Long‐Term Reliability Assessment | November 2012
Page 92 of 335
the final approved regulations; until these compliance strategies are evaluated in aggregate, the impact to system reliability
cannot be fully quantified. If additional time is required for resource owners to complete their strategies to comply with the
MATS rule, they will need to inform the EPA and ERCOT well in advance of the regulatory deadline in order to qualify for the
4th‐ or 5th‐year extensions. It is unknown how changing market dynamics will affect compliance strategies.
The proposed EPA regulations (Clean Water Act Section 316 (b), MATS, and CCRD) have the potential to expedite
retirement of legacy generation units and exacerbate resource adequacy issues in ERCOT over the next 10 years.
These regulations may reduce the economic viability of coal facilities with higher emissions rates and over 9,800 MW of
legacy gas generation. From a transmission perspective, these potential generation retirements would require new import
paths and significant reactive support in the Dallas/Fort Worth and Houston metropolitan areas. From an operational
perspective, accelerated retirements, as modeled, would further impact the Planning Reserve Margin shortfall in the ERCOT
Region over the assessment period (currently projected to fall below the required 13.75 percent in 2013 without any
additional retirements).
Operating Variable Resources
Following the designation of Competitive Renewable Energy Zones (CREZ) and completion of the transmission
improvements to serve these areas, the trend of rapid development of renewable energy resources within ERCOT is likely
to continue over the next 10 years. Operating the system with increasing amounts of renewable energy presents reliability
challenges in longer‐term horizons.
Reliable system operation with increasing amounts of renewable energy is a standing issue. This issue has become a core
issue in ERCOT. The Emerging Technologies Working Group has developed a process that tracks issues and their solutions
associated with renewable integration on an ongoing basis.158 This issue was also addressed in a study performed by
General Electric: ERCOT Wind Impact/Integration Analysis.159
The resource mix in the LTRA will change with increasing amounts of renewable energy resources. These variable resources
present a range of issues that can affect reliability, including changes to load‐serving requirements for dispatchable
generation (net load patterns may be different from historical load patterns); the impact on system forecasting capabilities;
and system stability impact. Variable generation can be highly locational, often resulting in the need to move power a
significant distance from generator to load.
Within the 10‐year horizon, ERCOT may have to modify its ancillary services procurement practices and its reliability unit
commitment procedures. New ancillary services may need to be developed. Generation resources that may not be needed
for a significant amount of energy across the year may need reliability‐must‐run arrangements to support system reliability.
However, these process changes will not be required to integrate renewable resources. Based on the study completed in
2008, at least 3,000 MW of additional wind generation beyond Existing Certain and Future‐Planned projections would be
required in order for these changes to be necessary or cost‐effective.
Increasing amounts of renewable energy may require additional regulating capacity including, but not limited to, increased
system ramping capability, additional resources, or both to maintain system frequency in real time.
Studies are required to determine if additional thermal resources will need to be committed, or if alternative transmission
improvements are necessary to ensure reliable integration of increasing amounts of renewable energy resources. The
studies will be completed by ERCOT staff and ERCOT stakeholders as more renewable resources are projected to be added
to the system.
158http://www.ercot.com/gridinfo/etts/. 159http://www.ercot.com/content/news/presentations/2008/Wind_Generation_Impact_on_Ancillary_Services_‐_GE_Study.zip.
ERCOT
NERC | 2012 Long‐Term Reliability Assessment | November 2012
Page 93 of 335
Currently, localized congestion and Special Protection Systems within generation “pockets” of renewable energy can cause
the curtailment of otherwise economic renewable energy. The CREZ process resulted in plans for a 345 kV transmission
infrastructure to support the delivery of over 18,000 MW of energy. These transmission circuits are scheduled to be
completed by the end of 2013.
Variable generation is typically highly locational. Specifically designed transmission improvements are usually required to
move renewable energy from resources to load. The CREZ transmission plan includes over 2,300 new miles of 345 kV right‐
of‐way, 1,400 Mvars of SVCs, 4,000 Mvars of shunt reactors, and approximately 1,000 Mvars of shunt capacitors. This
transmission infrastructure is designed to support the delivery of over 18,000 MW of renewable wind energy.
Real‐time energy balance and frequency maintenance with an increasing proportion of wind energy and other intermittent
resources on the ERCOT system will require updated or revised ancillary service requirements. The GE study indicates that
current operations processes and practices are adequate for wind levels up to approximately 15,000 MW. The report
conclusions state that beyond that amount, a thorough review of operations practices will likely be required to minimize
system costs while maintaining adequate system reliability. The impact of increased solar integration has not been
assessed.
The diversity benefits from integration of wind resources in the Texas Panhandle (the northernmost CREZ) are unknown. It
is unknown if solar resources will be more prevalent in the urban centers, near the load, or in extreme western and
southwestern Texas, where solar insolation can be as much as 30 percent greater.
The ERCOT Region, with almost 10,000 MW of wind generation installed and an additional 2,000 MW currently planned
(based on current interconnection agreements) over the next 10 years, must continue to refine its planning and operational
procedures to ensure reliable integration of renewable resources. The CREZ, currently under construction, was designed to
have adequate transmission capacity for 18,000 MW of renewable energy. As CREZ reaches its designed capacity for
renewable resources, ERCOT will continue to monitor the adequacy of its balancing and ancillary service procurement
process under increasing proportions of renewable energy to load. ERCOT currently has less than 100 MW of large‐scale
solar generation. Further study of the expected impact of solar development is required.

FRCC
NERC | 2012 Long‐Term Reliability Assessment | November 2012
Page 94 of 335
FRCC Planning Reserve Margins FRCC is projecting adequate Planning Reserve Margins throughout the assessment period (2013–2022). The NERC
Reference Margin Level of 15 percent (FRCC‐Table 1 and FRCC‐Figure 1)160 was established by FRCC for the entire Region for
the entire assessment period. Based on the expected load and generation capacity, the calculated reserve margin is above
the NERC Reference Margin Level percent for all summer seasons when demand response (load management and
interruptible loads) are treated as load‐modifying.
FRCC‐Table 1: Planning Reserve Margins FRCC‐Summer 2013 2014 2015 2016 2017 2018 2019 2020 2021 2022
ANTICIPATED 27.37% 26.88% 28.62% 25.08% 24.12% 23.33% 23.60% 21.58% 24.17% 23.06% PROSPECTIVE 36.46% 38.18% 37.85% 34.21% 34.06% 33.24% 33.95% 31.76% 35.16% 33.90% ADJUSTED POTENTIAL 40.42% 44.44% 42.13% 38.46% 39.20% 38.36% 39.60% 37.32% 41.59% 40.25%
NERC REFERENCE ‐ 15.00% 15.00% 15.00% 15.00% 15.00% 15.00% 15.00% 15.00% 15.00% 15.00%
FRCC‐Winter 2013/14 2014/15 2015/16 2016/17 2017/18 2018/19 2019/20 2020/21 2021/22 2022/23
ANTICIPATED 35.26% 38.69% 34.33% 35.04% 33.85% 32.73% 32.89% 33.31% 34.72% 33.37% PROSPECTIVE 43.13% 44.67% 40.28% 41.86% 40.64% 40.04% 40.11% 40.44% 42.88% 41.45% ADJUSTED POTENTIAL 45.83% 45.61% 41.26% 43.77% 42.57% 42.54% 42.58% 42.88% 46.42% 44.95%
NERC REFERENCE ‐ 15.00% 15.00% 15.00% 15.00% 15.00% 15.00% 15.00% 15.00% 15.00% 15.00%
ERCOT‐Figure 1: Summer (Left) and Winter161 (Right) Planning Reserve Margins
A rebound in the economy could potentially increase the demand, energy, and load projections that would realign them
with previously reported projections. There is also potential for the passage of pending environmental or regulatory
regulations that lead to timing challenges in the retrofitting or building of replacement generation. Unit retirements caused
by challenges in complying with environmental rules or other reasons, could result in unscheduled generation outages and
corresponding reductions in Planning Reserve Margins.
Demand The 10‐year demand forecast for FRCC is projected to have a CAGR of 1.43 percent (FRCC‐Table 2). This outlook is similar to
the 2011 forecast, with projected population growth essentially negated by ongoing impacts from the recent economic
recession and increased federal and state Energy Efficiency standards.
160
The FRCC target is 20 percent for Investor‐Owned Utilities. 161
Each year represents the initial year of the winter season. For example: 2013 represents the 2013/2014 winter season.
0%
10%
20%
30%
40%
50%
2013 2014 2015 2016 2017 2018 2019 2020 2021 2022
0%
10%
20%
30%
40%
50%
2013 2014 2015 2016 2017 2018 2019 2020 2021 2022

FRCC
NERC | 2012 Long‐Term Reliability Assessment | November 2012
Page 95 of 335
FRCC‐Table 2: Demand Outlook FRCC‐Summer 2013 2022 10‐Year Change CAGR
NET INTERNAL DEMAND 43,041 48,923 5,882 13.7% 1.43%
Load‐Modifying Demand Response 3,229 3,660 431 13.3% 1.40%
TOTAL INTERNAL DEMAND 46,270 52,583 6,313 13.6% 1.43%
FRCC‐Winter 2013/14 2022/23 10‐Year Change CAGR
NET INTERNAL DEMAND 43,049 48,656 5,607 13.0% 1.37%
Load‐Modifying Demand Response 3,318 3,752 434 13.1% 1.38%
TOTAL INTERNAL DEMAND 46,367 52,408 6,041 13.0% 1.37%
Overall projections of load growth for most entities remain at levels below earlier forecasts. The 2012 Annual Energy
Outlook from the U.S. Department of Energy’s Energy Information Agency (EIA) indicated that recovery from the recent
recession will exhibit the weakest growth of any since 1960.162 As such, near‐term increases in demand are not expected to
realign with the more robust projections that were anticipated in projections made prior to the 2008 economic recession.
Load growth across individual Load Serving Entities (LSEs) in the Region is proportional with the level of load growth seen
across the FRCC Assessment Area.
Demand-Side Management The 2013 summer Net Internal Demand (NID) forecast includes the effects of 3,229 MW of potential demand reductions
from the use of load management (2,616 MW) and interruptible demand (613 MW).
The 2022 summer NID forecast includes the effects of 3,660 MW of potential demand reductions from the use of load
management (3,028 MW) and interruptible demand (632 MW). Load management is projected to increase at a steady rate
of 50 MW per year over the forecast horizon, while interruptible demand is projected to essentially remain constant (FRCC‐
Table 3).
FRCC‐Table 3: Demand‐Side Management163 Short‐Term
2022 Share of Total Internal Demand
FRCC‐Summer 2013 2014 2015 2022 10‐Year Change
Direct Control Load Management (DCLM) 2,616 2,669 2,720 3,028 412 5.76% Contractually Interruptible (Curtailable) 613 570 579 632 19 1.20% Critical Peak‐Pricing (CPP) with Control 0 0 0 0 0 0.00% Load as a Capacity Resource 0 0 0 0 0 0.00%
TOTAL LOAD‐MODIFYING DEMAND RESPONSE 3,229 3,239 3,299 3,660 431 6.96%
TOTAL ENERGY EFFICIENCY 303 461 617 1,443 1,140 2.74%
TOTAL DEMAND‐SIDE MANAGEMENT 3,532 3,700 3,916 5,103 1,571 9.70%
All Load Serving Entities (LSE) within FRCC treat Demand Response as load‐modifying and not as a capacity resource.
Demand reduction is used primarily to shave the peak demand.
There is currently no Renewable Portfolio Standard (RPS) in Florida. A draft rule was submitted by the Florida Public Service
Commission staff to the Florida Legislature for consideration;164 however, the Florida Legislature has not established
Renewable Portfolio Standards in Florida.
There are a variety of Energy Efficiency programs implemented by entities throughout FRCC. These programs can include
commercial and residential audits (surveys) with incentives for duct testing and repair, high‐efficiency appliances (air
conditioning, water heater, heat pumps, refrigeration, etc.) rebates and high‐efficiency lighting rebates. Total Energy
Efficiency programs in FRCC are incorporated into the load forecast, increasing from 303 MW to 1,143 MW over the 10‐year
period.
162 The U.S. Energy Information Administration's (EIA's) Annual Energy Outlook 2012 (AEO2012): http://www.eia.gov/forecasts/aeo/pdf/0383(2012).pdf. 163 “Current” represents Existing‐Certain and Future‐Planned projections for the 2012 summer (for summer‐peaking assessment areas) or 2012/2013 winter (for winter‐peaking
assessment areas). “Share” represents the share (percent) of total Existing‐Certain and Future‐Planned capacity projected for the peak season. 164 http://www.psc.state.fl.us/utilities/electricgas/RenewableEnergy/2009_FPSC_Draft_RPS_Rule.pdf.

FRCC
NERC | 2012 Long‐Term Reliability Assessment | November 2012
Page 96 of 335
Generation FRCC supply‐side resources considered for the summer assessment are categorized as Existing‐Certain, Existing‐Other, and
Existing‐Inoperable. FRCC counts on 51,170 MW of Existing‐Certain resources, of which 44 MW are hydro and 374 MW are
Biomass. Current solar capacity is projected at 8 MW; however, most of this capacity is derated with approximately 5.8 MW
considered as a Firm resource available during peak demand and the remainder being utilized as an energy‐only resource.
Derated hydro capacity is 44 MW. Approximately 183 MW of Existing‐Other merchant plant capability is potentially
available as future resources of FRCC members and others, with another 2,019 MW of Existing‐Other resources placed into
Inactive Reserves or Operational Standby for future operations by FRCC members. Of Existing‐Certain capacity, generation
fueled by natural gas is the primary source of fuel, supplying nearly 60 percent of capacity, while coal and oil will each
account for nearly 16.2 percent. Nuclear generation will contribute about 4.8 percent (FRCC‐Table 4, FRCC‐Figure 2).
FRCC‐Table 4: Capacity Outlook165 Current 2022 Planned 2022 Planned & Conceptual
FRCC‐Summer Capacity Share Capacity Share Change Capacity Share Change
Coal 8,430 16.2% 8,428 14.1% ‐2 8,428 14.1% ‐2 Petroleum 8,458 16.2% 8,906 14.9% 448 8,906 14.9% 448 Gas 32,325 62.0% 36,741 61.3% 4,416 36,741 61.3% 4,416 Nuclear 2,529 4.8% 5,046 8.4% 2,517 5,046 8.4% 2,517 Other/Unknown 3 0.0% 8 0.0% 5 8 0.0% 5 Renewables 426 0.8% 796 1.3% 371 796 1.3% 371
TOTAL 52,170 100.0% 59,925 100.0% 7,754 59,925 100.0% 7,754
FRCC‐Figure 2: Summer Net Capacity Change
The majority of growth in Future‐Planned resources is projected to come from plants fueled either by natural gas or
nuclear. The construction of new natural gas facilities from 2013‐2022 is projected to add over 7,754 MW over the coming
decade. Similarly, increases in nuclear capacity over the same time period will come mostly from the uprate of existing
units; however, approximately 2,517 MW of new nuclear capacity is scheduled for operation by 2022.
No significant unit retirements, deferments, or derates have been scheduled over the long‐term planning horizon.
However, there is approximately 850 MW of capacity not included in the forecast due to an extended unit outage. This
capacity outage has been replaced with power contracts to meet any obligation‐to‐serve requirements, as mandated by the
Florida Public Service Commission. The capacity outages discussed here is scheduled to return to service in 2014 with no
reliability impacts.
There are several plants in FRCC that are either undergoing capacity uprates or have plans to for them in the near‐term.
Most of these uprates involve modernization of plant equipment. The potential impacts resulting from the temporary
unavailability of generation has been mitigated by the short‐term activation of off‐line capacity that was staged in inactive
reserves. Ongoing and future coordination will help to maintain adequate Planning Reserve Margins.
165 “Current” represents Existing‐Certain and Future‐Planned projections for the 2012 summer (for summer‐peaking assessment areas) or 2012/2013 winter (for winter‐peaking
assessment areas). “Share” represents the share (percent) of total Existing‐Certain and Future‐Planned capacity projected for the peak season.
‐1,000
0
1,000
2,000
3,000
4,000
5,000
6,000
7,000
8,000
2013 2014 2015 2016 2017 2018 2019 2020 2021 2022
MW

FRCC
NERC | 2012 Long‐Term Reliability Assessment | November 2012
Page 97 of 335
Variable Generation Outlook
Firm capacity from biomass currently supplies about 374 MW during seasonal peak demands, while variable resources such
as hydro and solar will contribute about 44 MW and 8 MW, respectively. Approximately 11 MW of hydro is derated and not
available during system peak, while the derated capacity from solar amounts to 48 MW (FRCC‐Table 5 and FRCC‐Figure 2).
Even though such derated capacity cannot be used in the calculation of reserve margins, this non‐Firm portion of capacity
can be utilized as an energy‐only resource.
FRCC‐Table 5: Renewable Capacity Outlook166 Current 2022 Planned 2022 Planned & Conceptual
FRCC‐Summer Capacity Share Capacity Share Change Capacity Share Change
Hydro 44 10.2% 44 5.5% 0 44 5.5% 0 Pumped Storage 0 0.0% 0 0.0% 0 0 0.0% 0 Geothermal 0 0.0% 0 0.0% 0 0 0.0% 0 Wind 0 0.0% 0 0.0% 0 0 0.0% 0 Biomass 374 88.0% 736 92.4% 361 736 92.4% 361 Solar 8 1.8% 17 2.2% 9 17 2.2% 9
TOTAL 426 100.0% 796 100.0% 371 796 100.0% 371
FRCC‐Figure 2: Summer Net Renewable Capacity Change
Only the minimum firm capacity from intermittent or energy‐limited resources is included in the calculation of seasonal
reserve margins. Accordingly, the inherent uncertainty caused by this variability is applied such that the potential
unavailability of these resources will not impact reliability (FRCC‐Table 6). Currently, no further operational changes are
needed or planned to accommodate the integration of variable resources during the long‐term planning horizon.
FRCC‐Table 6: Variable Generation Outlook Current 2022 Planned
FRCC‐Summer Wind Solar Hydro Biomass Wind Solar Hydro Biomass
Installed Capacity 0 55 55 374 0 82 55 736 On‐Peak Derate 0 47 11 0 0 65 11 0
EXPECTED ON‐PEAK OUTPUT 0 8 44 374 0 17 44 736
Capacity Transactions There are 1,340 MW of generation under Firm contract available to be imported from SERC‐SE Assessment Area through
the end of 2014, with the Firm imports decreasing to 200 MW in subsequent years. Additional capacity transactions include
approximately 870 MW from member‐owned generation that will be dynamically dispatched from the SERC‐SE Assessment
Area. These purchases have Firm transmission service to ensure deliverability to FRCC. Total expected Firm imports amount
to 2,206 MW until 2016 and drop to 866 MW before increasing to 1,066 MW through the final years of the assessment
period (FRCC‐Table 7).
166 “Current” represents Existing‐Certain and Future‐Planned projections for the 2012 summer (for summer‐peaking assessment areas) or 2012/2013 winter (for winter‐peaking
assessment areas). “Share” represents the share (percent) of total Existing‐Certain and Future‐Planned capacity projected for the peak season.
0
50
100
150
200
250
300
350
400
2013 2014 2015 2016 2017 2018 2019 2020 2021 2022
MW

FRCC
NERC | 2012 Long‐Term Reliability Assessment | November 2012
Page 98 of 335
FRCC has 143 MW of generation under Firm contract to be exported only during the summer season into the SERC‐SE
Assessment Area throughout 2020. These sales have Firm transmission service to ensure deliverability into the SERC‐SE
Assessment Area.
FRCC‐Table 7: Projected Capacity Transactions FRCC‐Summer 2013 2014 2015 2016 2017 2018 2019 2020 2021 2022
Expected Imports 0 0 0 0 0 0 0 0 0 0 Firm Imports 2,206 2,206 2,206 866 966 1,066 1,066 1,066 1,066 1,066
TOTAL IMPORTS 2,206 2,206 2,206 866 966 1,066 1,066 1,066 1,066 1,066
Expected Exports 0 0 0 0 0 0 0 0 0 0 Firm Exports 143 143 143 143 143 143 143 143 143 143
TOTAL EXPORTS 143 143 143 143 143 143 143 143 143 143
TOTAL NET CAPACITY TRANSACTIONS 2,063 2,063 2,063 723 823 923 923 923 923 923
Neither non‐Firm resources nor expected transactions are included in the assessment for the calculation of reserve
margins.
FRCC does not rely on external resources for emergency imports and reserve sharing. However, there are emergency power
contracts in place between SERC members and FRCC entities.
Transmission Transmission constraints in central Florida may require remedial actions, depending on system conditions creating
increased west‐to‐east flow across the central Florida metropolitan load areas until the permanent solutions are
constructed. No interconnection‐related issues have been identified or are anticipated through the assessment period
within FRCC. The FRCC planning process identified the following four transmission projects in central Florida as necessary
for providing enhanced reliability during the assessment period:
Intercession City to Gifford 230 kV (new 12‐mile line)
Holopaw to Poinsett 230 kV transmission line (rebuild)
Tenoroc to Interstate to FiberTek to West 230 kV transmission line (reconductor)
McIntosh to Lake Agnes 230 kV transmission line (rebuild)
There are no foreseen project delays in meeting the in‐service date of any planned transmission facilities that have an
impact on the long‐term reliability during this assessment period. Any temporary service outages required for construction
will be performed during off‐peak seasonal conditions and studied in the operations horizon. No significant substation
equipment (i.e., SVC, FACTS controllers, HVdc, etc.) additions are expected through 2022.
A list of existing and projected transmission additions is provided below (FRCC‐Table 8):
FRCC‐Table 8: Existing and Projected Transmission FRCC AC (Circuit Miles) DC (Circuit Miles) Total (Circuit Miles)
EXISTING 12,031 0 12,031
Under Construction 46 0 46 Planned ‐ Completed within First Five Years 249 0 249 Planned ‐ Completed within Second Five Years 200 0 200
2022 TOTAL (UNDER CONSTRUCTION & PLANNED) 12,526 0 12,526
Conceptual ‐ Completed within First Five Years 0 0 0 Conceptual ‐ Completed within Second Five Years 97 0 97
2022 TOTAL (UNDER CONSTRUCTION, PLANNED & CONCEPTUAL) 12,623 0 12,623
All Future‐Planned generation within the FRCC Region is thoroughly studied by the interconnecting Transmission Service
Provider (TSP). The TSP will then submit the results of their study to FRCC’s Transmission Working Group (TWG) for
additional third‐party screening in accordance with the applicable TPL series of NERC Reliability Standards. This additional
screening assures that all Future‐Planned generation is deliverable (if requested), reliable, and does not adversely impact
the BPS within FRCC.

FRCC
NERC | 2012 Long‐Term Reliability Assessment | November 2012
Page 99 of 335
The FRCC Long Range Study 2012‐2021167 did not identify any reactive power‐limited areas that would impact the BPS
through 2021. FRCC has not identified the need to develop specific criteria to establish a voltage stability margin.
The FRCC expects the BPS to perform adequately over various system operating conditions with the ability to deliver the
resources to meet the load requirements at the time of both the summer and winter peak demand. The results of the
annual Long‐Range Study, which evaluated the steady‐state summer, winter peak and select off‐peak load conditions under
different operating scenarios, indicates that any concerns with thermal overloads or voltage conditions can be managed
successfully by operator intervention or by planned system expansion to serve the forecast demand. The scenarios analyzed
included the unavailability of major generating units within the FRCC. Therefore, various dispatch scenarios were evaluated
to ensure generating resources within the FRCC are deliverable by meeting NERC Reliability Standards under these dispatch
scenarios. No localized pockets of reactive power‐limited areas were identified on the BPS within FRCC in the current long‐
range study.
Vulnerability Assessment One 800 MW class unit is scheduled to be unavailable during a defined period within the study horizon. Based on the FRCC
Long‐Range Study, the unavailability of this unit is not anticipated to cause any reliability concerns. In addition, FRCC does
not foresee any issues associated with long‐term/extended drought conditions, the unavailability of demand resources, or
an increase in variable or distributed generation.
There are currently no plans for additional Under‐Voltage Load Shed (UVLS) within FRCC. There is currently about 940 MW
of UVLS armed within FRCC. These UVLS relays are designed to respond to local low‐voltage conditions that could be caused
by a Category C or D multiple contingency events. Two new permanent Special Protection Systems were installed within
FRCC. The Special Protection Systems are designed to protect BES facilities under certain generation dispatch scenarios and
specific multiple contingency events.
Based on past operating experience with the impact of hurricanes on the fuel supply infrastructure within the Region, the
FRCC developed a Generating Capacity Shortage Plan.168 This plan can distinguish between generating capacity shortages
caused by abnormally high system loads and unavailable generating facilities from those caused by short‐term, generating
fuel or availability constraints. Since a significant portion of electric generation within Florida uses remotely supplied
natural gas, the plan specifically distinguishes generating capacity shortages by primary causes (e.g., hurricanes and
abnormally high loads) in order to provide a more effective regional coordination. The FRCC Operating Committee (OC) has
also developed FRCC Communications Protocols – Reliability Coordinator, Generator Operators and Natural Gas
Transportation Service Providers to enhance the existing coordination between the FRCC Reliability Coordinator and the
natural gas pipeline operators in response to FERC Order 698. In addition, the FRCC Operating Reliability Subcommittee
(ORS), through its Fuel Reliability Working Group, periodically reviews and assesses the current fuel supply infrastructure in
terms of reliability for generating capacity.
FRCC entities continue to evaluate new technologies such as FACTS devices and high‐temperature conductors to address
specific transmission conditions or issues. Presently, there are several transmission lines constructed with high‐temperature
conductors within FRCC. However, at this time there are no FACTS devices installed within the Region. FRCC Transmission
Owners (TOs) consider enhancements to existing transmission planning tools (e.g., enhancements to existing software, new
software, etc.) to address the expected planning needs of the future.
Entities within FRCC are taking many steps to reduce protection system misoperations. Some major steps are:
167 This study is not available to the public due to the inclusion of CEII information. 168 https://www.frcc.com/handbook/Shared%20Documents/EOP%20‐
%20Emergency%20Preparedness%20and%20Operations/FINAL%20FRCC%20Generating%20Capacity%20Shortage%20Plan.pdf.

FRCC
NERC | 2012 Long‐Term Reliability Assessment | November 2012
Page 100 of 335
Improving documentation and actively communicating throughout the Region, by reviewing test procedures and
commissioning procedures to ensure there are no “gaps,” then sharing these methods with all entities within the
Region;
Improving the relay setting preparation process by sharing data through the FRCC working groups and using field‐
measured line impedances where practical;
Reviewing corrective action plans for effectiveness;
Reviewing NERC and FRCC lessons learned and discussing practical examples;
Reviewing and implementing vendor service bulletins, including Firmware upgrades, and discussing misoperations
with peers.
Procedures have been put in place to reduce human error affecting misoperations, by implementing settings with written,
vetted procedures and considering field implementation as a last line of defense to abate human error.
Many entities within FRCC have implemented a capital improvement process, replacing legacy relays with microprocessor
relays as each entity’s capital budget allows. Entities are refining maintenance by adjusting maintenance practices and
maintenance cycles as necessary and applying full‐functional testing by direct current injection whenever practical.
FRCC entities thoroughly investigate misoperations to determine the root cause, monitor Protection Systems (alarm
contacts, relay voltages, etc.) and review all normal protective system operations for agreement with expected operation‐
per‐settings calculations.
The Florida Coordinating Group’s (FCG) Environmental Committee was actively involved in petitioning for judicial review of
EPA’s final Cross‐State Air Pollution Rule (CSAPR), which was to take effect on January 1, 2012. The DC Circuit Court of
Appeals placed a stay on CSAPR in late 2011, and ultimately vacated in August 2012.
The EPA’s Mercury and Air Toxics Standard (MATS) became effective on April 16, 2012, and requires compliance within
three years, with the possibility of a one or two year extension under specific circumstances. Numerous entities around the
country have challenged MATS in the D.C. Circuit; it will likely be more than a year before these challenges are resolved.
Accordingly, it is still unknown the full impact that MATS or CSAPR, or replacement rules, will have on the long range
reliability of the BPS in the FRCC region.
Standing and Emerging Reliability Issues FRCC has identified one new emerging issue dealing with generation capacity with the potential for serious impact affecting
the short‐term time frame. Generation capacity could be severely impacted by EPA regulations requiring potential early
retirement of existing units and/or unit output derates. The regulations could potentially impact the BPS by requiring new
transmission facilities to be constructed to accommodate replacement generation to serve the forecast load with
insufficient construction lead time. In the referenced case, resource capacity will decrease to account for potential unit
retirement and/or derates. Additional issues that potentially could arise from EPA regulations are the uncertainties of
sufficient time frame to replace generation capacity, materials required to retrofit units, and operational issues resulting
from alternative dispatch patterns.

MISO
NERC | 2012 Long‐Term Reliability Assessment | November 2012
Page 101 of 335
MISO Planning Reserve Margins MISO has adequate Planning Reserve Margins throughout the assessment period to meet MISO’s Planning Reserve Margin
Requirement (PRMR) of 16.3 percent, also applied as the NERC Reference Margin Level (MISO‐Table 1 and MISO‐Figure 1).
MISO‐Table 1: Planning Reserve Margins MISO‐Summer 2013 2014 2015 2016 2017 2018 2019 2020 2021 2022
ANTICIPATED 20.92% 19.22% 19.04% 18.58% 19.68% 19.15% 18.53% 17.91% 17.24% 16.10% PROSPECTIVE 34.04% 32.13% 32.73% 32.20% 33.23% 32.64% 31.95% 31.26% 30.51% 29.25% ADJUSTED POTENTIAL 34.24% 32.33% 33.76% 33.22% 34.25% 33.66% 32.96% 32.27% 31.51% 30.24%
NERC REFERENCE ‐ 16.30% 16.30% 16.30% 16.30% 16.30% 16.30% 16.30% 16.30% 16.30% 16.30%
MISO‐Winter 2013/14 2014/15 2015/16 2016/17 2017/18 2018/19 2019/20 2020/21 2021/22 2022/23
ANTICIPATED 57.13% 46.32% 45.97% 45.17% 46.61% 45.65% 44.74% 44.14% 43.17% 41.78% PROSPECTIVE 73.89% 62.11% 62.73% 61.82% 63.19% 62.12% 61.10% 60.43% 59.35% 57.80% ADJUSTED POTENTIAL 73.92% 62.35% 64.02% 63.10% 64.47% 63.39% 62.37% 61.69% 60.60% 59.04%
NERC REFERENCE ‐ 16.30% 16.30% 16.30% 16.30% 16.30% 16.30% 16.30% 16.30% 16.30% 16.30%
MISO‐Figure 1: Summer (Left) and Winter169 (Right) Planning Reserve Margins
The Planning Reserve Margin does not fall below the NERC Reference Margin Level during the assessment period.
Anticipated Resources may also increase as Existing‐Other and Future‐Other resources are reclassified to Existing‐Certain
through MISO’s Module E process. This will occur as needed to keep up with load growth while maintaining the PRMR in
the final years of the assessment period.
MISO continues to evaluate potential challenges that may exist due to Environmental Protection Agency (EPA) regulations
and the gas infrastructure system, which are not included in the Planning Reserve Margins above. EPA regulations may
deteriorate projected reserve levels as early as 2015 due to increased retirements to MISO’s coal fleet. In addition, as these
retired coal units are replaced by other fuel sources, like gas, MISO must evaluate the possible strain on the gas
infrastructure system to meet this increased demand. This impact is not included in the Planning Reserve Margins provided
below. For more detailed information on the potential impact on reliability due to these and other issues, please read the
Emerging Issues section.
Demand The Total Internal Demand for MISO points to a 10‐year CAGR of 1.05 percent, slightly higher than projected one year
ago.170 A diversity factor of 4.61 percent was estimated for 2012. Applying this diversity factor for the period 2013-2022,
MISO is able to estimate a Total Internal Demand171 of 94,279 MW and 103,584 MW for the 2013 and 2022 summers,
respectively (MISO‐Table 2).172
169
Each year represents the initial year of the winter season. For example: 2013 represents the 2013/2014 winter season. 170 The 2011 LTRA projections shown in Figure 3‐1 do not include Duke Energy Ohio or Duke Energy Kentucky load due to their exits from MISO effective January 1, 2012. 171 This forecast doesn’t include the Entergy and its six utility operating companies which will be integrated into MISO footprint by December 2013. The 2011 LTRA forecast was
for the period 2011‐2021. 172 MISO projects a high load scenario (90/10) Total Internal Demand of 99,620 MW 109,452 MW for the 2013 and 2022 summers, based on the load forecast uncertainty
analysis.
0%
5%
10%
15%
20%
25%
30%
35%
2013 2014 2015 2016 2017 2018 2019 2020 2021 2022
0%
10%
20%
30%
40%
50%
60%
70%
80%
2013 2014 2015 2016 2017 2018 2019 2020 2021 2022

MISO
NERC | 2012 Long‐Term Reliability Assessment | November 2012
Page 102 of 335
MISO‐Table 2: Demand Outlook MISO‐Summer 2013 2022 10‐Year Change CAGR
NET INTERNAL DEMAND 89,318 94,875 5,557 6.2% 0.67%
Load‐Modifying Demand Response 4,962 8,709 3,747 0.0% 0.00%
TOTAL INTERNAL DEMAND 94,279 103,584 9,305 9.9% 1.05%
MISO‐Winter 2013/14 2022/23 10‐Year Change CAGR
NET INTERNAL DEMAND 69,663 78,789 9,126 13.1% 1.38%
Load‐Modifying Demand Response 2,909 5,105 2,197 0.0% 0.00%
TOTAL INTERNAL DEMAND 72,572 83,894 11,322 15.6% 1.62%
Approximately 6,000 MW of unrestricted non‐coincident peak load was removed from MISO due to the exit of the Duke
companies.
The Entergy operating companies Entergy Arkansas, Inc.; Entergy Gulf States Louisiana, LLC; Entergy Louisiana, LLC; Entergy
Mississippi, Inc.; Entergy New Orleans, Inc.; and Entergy Texas, Inc. intend to join MISO in December 2013. Total Internal
Demand and Net Energy Load for Entergy are not included in the above sections as the current Module E Capacity
Tracking173 tool does not capture the information. MISO is not including Entergy in the 2012LTRA analysis.
Demand-Side Management MISO currently separates Load‐Modifying Demand Response resources into two separate categories: Interruptible Load (IL)
and Direct Control Load Management (DCLM). IL is the magnitude of customer demand (usually industrial) that, in
accordance with contractual arrangements, can be interrupted at the time of peak by direct control of the system operator
(remote tripping) or by action of the customer at the direct request of the system operator. MISO projects IL resources to
be 3,883 MW and 6,816 MW for 2013 and 2022, respectively.
DCLM is the magnitude of customer service (usually residential) that can be interrupted at the time of peak by direct
control of the applicable system operator. DCLM is typically used for “peak shaving.” During the first year MISO projects
DCLM of 1,078 MW, and for the final year of the assessment, MISO projects DCLM of 1,893 MW. Total Demand Response
projections for MISO resulted in a CAGR of 6.45 percent from 2013 to 2022 (MISO‐Table 3).
MISO‐Table 3: Demand‐Side Management Short‐Term
2022 Share of Total Internal
Demand
MISO‐Summer 2013 2014 2015 2022 10‐Year Change
Direct Control Load Management (DCLM) 0 0 0 0 0 0.00%
Contractually Interruptible (Curtailable) 0 0 0 0 0 0.00%
Critical Peak‐Pricing (CPP) with Control 0 0 0 0 0 0.00%
Load as a Capacity Resource 3,271 3,271 3,271 3,271 0 3.16%
TOTAL RESOURCE‐SIDE DEMAND RESPONSE 3,271 3,271 3,271 3,271 0 3.16%
Direct Control Load Management (DCLM) 1,078 1,178 1,268 1,893 814 1.83%
Contractually Interruptible (Curtailable) 3,883 4,244 4,565 6,816 2,933 6.58%
Critical Peak‐Pricing (CPP) with Control 0 0 0 0 0 0.00%
Load as a Capacity Resource 0 0 0 0 0 0.00%
TOTAL LOAD‐MODIFYING DEMAND RESPONSE 4,962 5,422 5,833 8,709 3,747 8.41%
TOTAL ENERGY EFFICIENCY 131 382 720 3,922 3,790 3.79%
TOTAL DEMAND‐SIDE MANAGEMENT 8,364 9,075 9,824 15,902 7,538 15.35%
Per MISO’s Emergency Operating Procedures (RTO‐EOP‐002), MISO must declare a Maximum Generation Emergency Event
Step 2b174 to gain access to IL and DCLM resources, whereby MISO instructs local Balancing Authorities to reduce load via
load‐modifying resources as defined in Module E of MISO’s tariff.175
173 MISO market participants use the Module E Capacity Tracking (MECT) tool to submit its forecasted Demand and Resources at each Commercial Pricing Node for the upcoming
planning years. 174Emergency Operating Procedures: https://www.misoenergy.org/MarketsOperations/ReliabilityOperatingProcedures/Pages/ReliabilityOperating Procedures.aspx. 175 Model E of MISO Tariff (https://www.misoenergy.org/Library/Tariff/Pages/Tariff.aspx) and Resource Adequacy BPM 011
(https://www.misoenergy.org/Library/BusinessPracticesManuals/Pages/BusinessPracticesManuals.aspx).

MISO
NERC | 2012 Long‐Term Reliability Assessment | November 2012
Page 103 of 335
Generation MISO has Existing‐Certain resources totaling 101,060 MW for expected summer rated on‐peak capacity within its market
footprint. Additionally, there is 11,536 MW and 1,588 MW of Existing‐Other and Existing‐Inoperable capacity, respectively.
Since the 2011 summer season, 79 MW of Existing‐Certain resources have come into service. This includes 70 MW of wind
and 9 MW of gas expected summer rated capacity. The predominant source of fuel in MISO is coal at approximately 55
percent of total existing resources, followed by gas‐fired and nuclear generation, totaling 28 and 8 percent, respectively.
Throughout the assessment time frame, MISO anticipates a net total summer rated capacity of 2,197 MW of Future‐
Planned resources, which includes 202 MW of planned retirements before the 2013 summer season, 71 MW of new wind,
1,069 MW of new natural gas, and 1,563 MW of new nuclear(MISO‐Table 4 and MISO‐Figure 2).
MISO‐Table 4: Capacity Outlook176 Current 2022 Planned 2022 Planned & Conceptual
MISO Capacity Share Capacity Share Change Capacity Share Change
Coal 55,824 55.2% 55,411 53.6% ‐414 55,411 53.6% ‐414 Petroleum 4,853 4.8% 4,761 4.6% ‐92 4,761 4.6% ‐92 Gas 28,298 28.0% 29,367 28.4% 1,069 29,367 28.4% 1,069 Nuclear 8,013 7.9% 9,576 9.3% 1,563 9,576 9.3% 1,563 Other/Unknown 0 0.0% 0 0.0% 0 0 0.0% 0 Renewables 4,134 4.1% 4,204 4.1% 71 4,204 4.1% 71
TOTAL 101,122 100.0% 103,319 100.0% 2,197 103,319 100.0% 2,197
MISO‐Figure 2: Summer Net Capacity Change
Included in total Future‐Planned resources are a facility upgrade of an Existing‐Certain natural gas combined‐cycle plant of
51 MW, a facility replacement of an Existing‐Certain coal facility to natural gas with an increase in capacity of 253 MW, and
a facility replacement of an Existing‐Certain coal and natural gas facility to a natural gas combined‐cycle facility with an
increase in capacity of 116 MW
Since the 2011 summer season, MISO’s existing capacity was negatively impacted by 4,726 MW of summer rated capacity
due to the departure of Duke Energy Ohio and Duke Energy Kentucky from the MISO market on January 1, 2012. The
predominant source of fuel from the Duke exit is coal at 78 percent of total Duke Energy Ohio and Duke Energy Kentucky
resources. Next is gas at 15 percent and oil at 8 percent. MISO also experienced unit retirements totaling 556 MW in 2011
and 750 MW in 2012 of summer rated capacity since the last reporting year, which was 49 percent coal, 30 percent gas, and
21 percent oil. In addition to membership changes and unit retirements, 160 MW of wind, 10 MW of hydro, and 8 MW of
oil resources were pseudo‐tied out of MISO since the prior year (MISO‐Table 5 and MISO‐Figure 2).
176 “Current” represents Existing‐Certain and Future‐Planned projections for the 2012 summer (for summer‐peaking assessment areas) or 2012/2013 winter (for winter‐peaking
assessment areas). “Share” represents the share (percent) of total Existing‐Certain and Future‐Planned capacity projected for the peak season.
‐1,000
‐500
0
500
1,000
1,500
2,000
2,500
3,000
2013 2014 2015 2016 2017 2018 2019 2020 2021 2022
MW

MISO
NERC | 2012 Long‐Term Reliability Assessment | November 2012
Page 104 of 335
MISO‐Table 5: Renewable Capacity Outlook177 Current 2022 Planned 2022 Planned & Conceptual
MISO‐Summer Capacity Share Capacity Share Change Capacity Share Change
Hydro 790 19.1% 790 18.8% 0 790 18.8% 0 Pumped Storage 2,288 55.4% 2,288 54.4% 0 2,288 54.4% 0 Geothermal 0 0.0% 0 0.0% 0 0 0.0% 0 Wind 563 13.6% 634 15.1% 71 634 15.1% 71 Biomass 492 11.9% 492 11.7% 0 492 11.7% 0 Solar 0 0.0% 0 0.0% 0 0 0.0% 0
TOTAL 4,134 100.0% 4,204 100.0% 71 4,204 100.0% 71
MISO‐Figure 2: Summer Net Renewable Capacity Outlook
MISO expects 148 MW of Existing‐Certain and 20 MW of Existing‐Other resources to retire before the 2013 summer season,
of which the impact on reliability is negligible. This includes 106 MW of coal, 47 MW of gas, and 14 MW of oil resources. In
addition, throughout the assessment period, MISO expects 1,099 MW of Existing‐Inoperable resources to be removed from
suspended or mothballed status and be in service by 2015, which has a positive impact on the Prospective Capacity
Resources Reserve Margin of 1 percentage point, keeping the Prospective Reserve Margin above 30 percent in 2015.
Behind‐the‐meter generation is held flat at the current summer expectation of 3,271 MW throughout the assessment
period. Without behind‐the‐meter generation, MISO’s 2022 Anticipated and Prospective Reserve Margins would decrease
by 4 percentage points and 3 percentage points, respectively.
The majority of MISO’s non‐intermittent resources have an Expected Summer on‐peak capacity (summer rating) equal to
their 2012 Generator Verification Test Capacity (GVTC). More information on the GVTC may be found in the Resource
Adequacy Business Practice Manual (BPM) on MISO’s website. When a test is not available, the non‐intermittent units’
Maximum Output from MISO’s Commercial Model is utilized.
MISO’s wind resources expected on‐peak capacity is arrived at by applying a 14.7 percent wind capacity credit to the
resources nameplate capacity, and other intermittent resources are given its UCAP rating per the Module E process. The
variable capacity outlook for MISO is listed below (MISO‐Table 6).
MISO‐Table 6: Renewable Capacity Outlook: On‐Peak Vs. Installed Current 2022 Planned
MISO‐Summer Wind Solar Hydro Biomass Wind Solar Hydro Biomass
Installed Capacity 10,791 0 875 599 11,273 0 875 599 On‐Peak Derate 10,228 0 85 106 10,873 0 85 106
EXPECTED ON‐PEAK CAPACITY 563 0 790 492 634 0 790 492
177 “Current” represents Existing‐Certain and Future‐Planned projections for the 2012 summer (for summer‐peaking assessment areas) or 2012/2013 winter (for winter‐peaking
assessment areas). “Share” represents the share (percent) of total Existing‐Certain and Future‐Planned capacity projected for the peak season.
0
15
30
45
60
75
2013 2014 2015 2016 2017 2018 2019 2020 2021 2022
MW

MISO
NERC | 2012 Long‐Term Reliability Assessment | November 2012
Page 105 of 335
Capacity Transactions MISO only reports Firm power imports that are in the MISO market. The forecast imports are held flat at 3,557 MW
throughout the assessment time frame (MISO‐Table 7). All these imports are Firm and fully backed by Firm transmission
and Firm generation. No imports are based on partial path reservations.
MISO‐Table 7: Projected Capacity Transactions MISO‐Summer 2013 2014 2015 2016 2017 2018 2019 2020 2021 2022
Expected Imports 0 0 0 0 0 0 0 0 0 0 Firm Imports 3,557 3,557 3,557 3,557 3,557 3,557 3,557 3,557 3,557 3,557
TOTAL IMPORTS 3,557 3,557 3,557 3,557 3,557 3,557 3,557 3,557 3,557 3,557
Expected Exports 0 0 0 0 0 0 0 0 0 0 Firm Exports 0 0 0 0 0 0 0 0 0 0
TOTAL EXPORTS 0 0 0 0 0 0 0 0 0 0
TOTAL NET CAPACITY TRANSACTIONS 3,557 3,557 3,557 3,557 3,557 3,557 3,557 3,557 3,557 3,557
Transmission MISO has 273 miles of greater‐than‐100‐kV transmission line under construction, over 90 percent of which is for reliability.
MISO expects 1,316 miles of greater‐than‐100‐kV planned transmission line to be in service within five years, of which 530
miles are for the integration of variable/renewable resources, while the remainder is for reliability. As well, 1,571 miles of
greater‐than‐100‐kV planned transmission line are expected to be in service within 10 years, of which 866 miles are for the
integration of variable/renewable resources, while the remainder is for reliability. All of these projects total 1,844 miles of
under‐construction or planned transmission expected within the study time frame (MISO‐Table 8).
MISO‐Table 8: Existing and Projected Transmission MISO AC (Circuit Miles) DC (Circuit Miles) Total (Circuit Miles)
EXISTING 43,291 1,209 44,500
Currently Under Construction 161 0 161 Planned ‐ Completed within First Five Years 1,838 0 1,838 Planned ‐ Completed within Second Five Years 1,069 0 1,069
2022 TOTAL (UNDER CONSTRUCTION & PLANNED) 46,359 1,209 47,568
Conceptual ‐ Completed within First Five Years 63 0 63 Conceptual ‐ Completed within Second Five Years 0 0 0
2022 TOTAL (UNDER CONSTRUCTION, PLANNED & CONCEPTUAL) 46,422 1,209 47,631
Currently, MISO does not anticipate delays in meeting target in‐service dates. These projects are anticipated to come into
service during the 2012‐2022 period to enable reliable and efficient transmission service for MISO. There is no potential
reliability impact in not meeting target in‐service dates of transmission identified. MISO does not anticipate any existing,
significant transmission lines or transformers being out of service through the assessment period. MISO does not have any
transmission constraints that could significantly impact reliability.
Vulnerability Assessment MISO is involved in a variety of smart grid initiatives that will provide increased grid intelligence, use energy in smarter
ways, and provide the Region with even greater reliability, efficiency, and sustainability.
MISO uses industry‐leading, wide‐area uses visualization tools to give system operators a clearer look at system conditions.
One of these tools, synchrophasors, provides more precise grid measurements by using data collected from monitors called
Phasor Measurement Units (PMUs). PMU measurements are taken at a very high speed (typically 30 observations per
second, compared to once every 4 seconds using current technology). PMU measurements are time stamped to time‐align
(or synchronize) data from widely dispersed locations in the power system network.
In order to plan for 2013 installations, MISO has begun reaching out to Transmission and Generation Owners to identify and
confirm additional sites. The placement strategy for 2013 sites will be slightly different from the original placement
approach. The new strategy will focus on generator model validation, Transient Stability Analysis, Voltage Stability Analysis,
and monitoring of system interfaces.

MISO
NERC | 2012 Long‐Term Reliability Assessment | November 2012
Page 106 of 335
Plans for Accommodating Generator Retirements and Environmental Control Retrofits
MISO conducts quarterly surveys of asset owners’ EPA compliance strategies. From the second quarter 2012 survey, 67 out
of 103 units totaling 21,893 MW of summer rated capacity will be retrofitting using the dry sorbent injection (DSI) and/or
activated carbon injection (ACI) options (MISO‐Table 9). Units using these options should have ample time to meet the
deadline. Of the remaining units, 8,009 MW will install a combination of FGD, baghouse/fabric filter (FF), and potentially
SCR. Most of these units are in the design, permit and constructions phases and should have time to meet the compliance
deadline. However, there are a few that have not begun some phases of the retrofit. This could require extensions of the
compliance deadline for these units. Additionally, 3,564 MW of capacity has not been committed to a particular technology.
The majority of the undecided units are testing for DSI viability. If proven not viable, options become limited and the units
will likely require extensions.
MISO‐Table 9: Environmental Retrofits by Technology, Resource Type, and Supply Category
Resource Type Technology Number of Units
Summer Rating (MW) Winter Rating (MW)
EC EO EC EO
Coal
DSI and/or ACI 64 20,218 1,456 20,403 1,462
FGD 18 7,936 74 7,961 74
FF 1 52 ‐ 44 ‐
TBD 17 3,557 7 3,587 7
Gas
DSI and/or ACI 2 174 45 177 45
FGD 2 151 ‐ 193 ‐
FF ‐ ‐ ‐ ‐ ‐
TBD ‐ ‐ ‐ ‐ ‐
Biomass
DSI and/or ACI 1 18 1 18 1
FGD ‐ ‐ ‐ ‐ ‐
FF ‐ ‐ ‐ ‐ ‐
TBD ‐ ‐ ‐ ‐ ‐
TOTAL 105 32,106 1,583 32,383 1,589
A larger number of units will have “no action required” to comply with the Mercury Air Toxics Standard (MATS) then initially
anticipated in the 2011 EPA study effort. In that study, approximately 9,500 MW of capacity was categorized with no action
required. However, in the second‐quarter survey, asset owners responded “no action required” to meet the MATS
amounted to 19,864 MW of capacity. The exact reason for the increase in the no action required category is not known.
However, the majority of the increase takes place at units with an electrostatic precipitator (ESP). This technology should be
sufficient to meet the particulate matter removal required for MATS, which uses the emission limit for filterable particulate
matter instead of total particulate matter.
The remaining units have retired, will be retired, or are in consideration for retirement. From the survey, asset owners have
retired 1,706 MW and indicate the intent to retire an additional 2,400 MW of summer rated capacity with another 7,028
MW of capacity on the bubble (MISO‐Table 10). If units that did not respond to the survey are included, the retirement
figure could reach 12,223 MW. MISO will continue to survey asset owners quarterly.

MISO
NERC | 2012 Long‐Term Reliability Assessment | November 2012
Page 107 of 335
MISO‐Table 10: Retirement Decisions by Resource Type and Supply Category
Resource Type Retirement Decision Number of Units
Summer Rating (MW) Winter Rating (MW)
Other EC EO FP FO Other EC EO FP FO
Coal
Already Retired 27 1,706 ‐ ‐ ‐ ‐ 1,706 ‐ ‐ ‐ ‐ Retire 19 ‐ 1,022 564 106 394 ‐ 1,040 564 106 394 TBD for Retire 49 ‐ 6,502 176 ‐ ‐ ‐ 6,520 176 ‐ ‐ No Action Required 42 ‐ 14,719 3,351 ‐ ‐ ‐ 14,900 3,371 ‐ ‐ No Response to Survey 15 ‐ 482 37 ‐ ‐ ‐ 485 37 ‐ ‐
Gas
Already Retired ‐ ‐ ‐ ‐ ‐ ‐ ‐ ‐ ‐ ‐ ‐
Retire 1 ‐ 158 156 ‐ ‐ ‐ 158 156 ‐ ‐
TBD for Retire 4 ‐ 295 ‐ ‐ ‐ ‐ 373 ‐ ‐ ‐
No Action Required 4 ‐ 372 4 ‐ ‐ ‐ 374 4 ‐ ‐
No Response to Survey ‐ ‐ ‐ ‐ ‐ ‐ ‐ ‐ ‐ ‐ ‐
Oil
Already Retired ‐ ‐ ‐ ‐ ‐ ‐ ‐ ‐ ‐ ‐ ‐
Retire ‐ ‐ ‐ ‐ ‐ ‐ ‐ ‐ ‐ ‐ ‐
TBD for Retire 4 ‐ 55 ‐ ‐ ‐ ‐ 66 ‐ ‐ ‐
No Action Required ‐ ‐ ‐ ‐ ‐ ‐ ‐ ‐ ‐ ‐ ‐
No Response to Survey 1 ‐ ‐ 24 ‐ ‐ ‐ ‐ 24 ‐ ‐
Behind‐the‐meter‐Generation
Already Retired ‐ ‐ ‐ ‐ ‐ ‐ ‐ ‐ ‐ ‐ ‐
Retire ‐ ‐ ‐ ‐ ‐ ‐ ‐ ‐ ‐ ‐ ‐
TBD for Retire ‐ ‐ ‐ ‐ ‐ ‐ ‐ ‐ ‐ ‐ ‐
No Action Required 4 417 ‐ ‐ ‐ ‐ 417 ‐ ‐ ‐ ‐
No Response to Survey 17 625 ‐ ‐ ‐ ‐ 625 ‐ ‐ ‐ ‐
Firm Capacity Transactions
Already Retired ‐ ‐ ‐ ‐ ‐ ‐ ‐ ‐ ‐ ‐ ‐
Retire ‐ ‐ ‐ ‐ ‐ ‐ ‐ ‐ ‐ ‐ ‐
TBD for Retire ‐ ‐ ‐ ‐ ‐ ‐ ‐ ‐ ‐ ‐ ‐
No Action Required 1 1,002 ‐ ‐ ‐ ‐ 1,002 ‐ ‐ ‐ ‐
No Response to Survey ‐ ‐ ‐ ‐ ‐ ‐ ‐ ‐ ‐ ‐ ‐
MISO performed EPA analysis using the Electric Generation Expansion Analysis System (EGEAS) software to determine
whether retirement or retrofitting would be the most economic option for each generator impacted by the regulations.178
The timelines for retrofits vary by technology. Some retrofit technologies ‐ flue gas desulfurization (FGD) and selective
catalyst reduction (SCR) ‐ are riskier than others because of the length of time it takes to complete the work and the
deadlines for compliance (Figure 3a). It may be possible to receive an additional one‐year extension beyond the first year
extension, extending the compliance deadline into 2017. This second year extension will likely be limited to unique cases
(MISO‐Table 11).
178A full summary of the analysis is documented in section 4.2 of MISO’s MTEP 11 report: https://www.misoenergy.org/Library/Repository/Study/MTEP/MTEP11/MTEP11%
20Report.pdf.
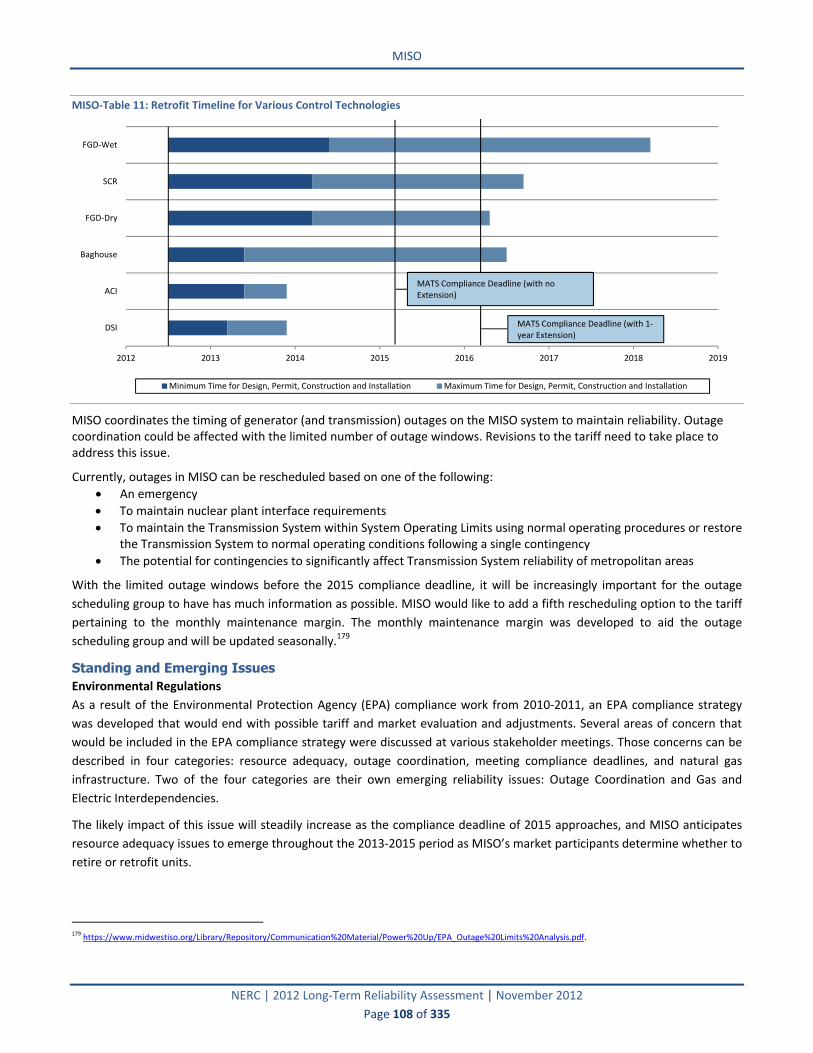
MISO
NERC | 2012 Long‐Term Reliability Assessment | November 2012
Page 108 of 335
MISO‐Table 11: Retrofit Timeline for Various Control Technologies
MISO coordinates the timing of generator (and transmission) outages on the MISO system to maintain reliability. Outage coordination could be affected with the limited number of outage windows. Revisions to the tariff need to take place to address this issue.
Currently, outages in MISO can be rescheduled based on one of the following:
An emergency
To maintain nuclear plant interface requirements
To maintain the Transmission System within System Operating Limits using normal operating procedures or restore the Transmission System to normal operating conditions following a single contingency
The potential for contingencies to significantly affect Transmission System reliability of metropolitan areas
With the limited outage windows before the 2015 compliance deadline, it will be increasingly important for the outage
scheduling group to have has much information as possible. MISO would like to add a fifth rescheduling option to the tariff
pertaining to the monthly maintenance margin. The monthly maintenance margin was developed to aid the outage
scheduling group and will be updated seasonally.179
Standing and Emerging Issues Environmental Regulations
As a result of the Environmental Protection Agency (EPA) compliance work from 2010‐2011, an EPA compliance strategy
was developed that would end with possible tariff and market evaluation and adjustments. Several areas of concern that
would be included in the EPA compliance strategy were discussed at various stakeholder meetings. Those concerns can be
described in four categories: resource adequacy, outage coordination, meeting compliance deadlines, and natural gas
infrastructure. Two of the four categories are their own emerging reliability issues: Outage Coordination and Gas and
Electric Interdependencies.
The likely impact of this issue will steadily increase as the compliance deadline of 2015 approaches, and MISO anticipates
resource adequacy issues to emerge throughout the 2013‐2015 period as MISO’s market participants determine whether to
retire or retrofit units.
179 https://www.midwestiso.org/Library/Repository/Communication%20Material/Power%20Up/EPA_Outage%20Limits%20Analysis.pdf.
2012 2013 2014 2015 2016 2017 2018 2019
DSI
ACI
Baghouse
FGD‐Dry
SCR
FGD‐Wet
Minimum Time for Design, Permit, Construction and Installation Maximum Time for Design, Permit, Construction and Installation
MATS Compliance Deadline (with no Extension)
MATS Compliance Deadline (with 1‐year Extension)

MISO
NERC | 2012 Long‐Term Reliability Assessment | November 2012
Page 109 of 335
The EPA has proposed four regulations that would have potentially profound effects on the power industry’s ability to
deliver electricity reliably. This compliance may require billions of dollars of investment in new or upgraded facilities to
ensure safe and reliable electric service for consumers in the MISO footprint. As a result, MISO may face a capacity shortage
if the proposed EPA regulations go into effect.
In the initial evaluation of the impact of the EPA rules on the MISO system, studies were conducted with the Electric
Generation Expansion Analysis System (EGEAS) software package developed by the Electric Power Research Institute (EPRI)
commonly used by utility generation planners. MISO performed more than 400 sensitivity screens using the EGEAS capacity
expansion model to identify the units most at risk for retirement. The sensitivities consisted of variation in costs for natural
gas, cost uncertainty risk and retrofit compliance. The results of the EGEAS analysis produced two scenarios, which were 2.9
GW of coal fleet capacity at risk for retirement and 12.6 GW at risk for retirement.
Since the initial evaluation, the four rules have been revised. In response to the revisions, MISO sent out second‐quarter
surveys to its market participants in 2012 to determine the resource adequacy impact of the EPA regulations. Surveys will
continue go out every quarter. From the survey, 4.3 GW of coal capacity responded with the intent to retire, while another
6.3 GW of coal capacity is still in the decision‐making stages. If the number of units that did not respond to the survey is
included, there is a possibility of 11.9 GW of coal capacity retiring.
If the 4 GW of retirements is experienced, MISO will be able to meet its Planning Reserve Margin Requirements (PRMR)
throughout the assessment period. Of the 4 GW of retirements from the survey, 1,706 MW have already retired or have
exited the MISO market for reasons unknown to MISO. This leaves 2,400 MW of capacity with the intent to retire during the
assessment period. Of this 2,400 MW, 106 MW are Future‐Planned retirements, which leaves 2,294 MW. That 2,294 MW is
categorized as 1,180 MW of Existing‐Certain resources, 720 MW of Existing‐Other resources, and 394 MW of Future‐Other
resources. If these resources retire, MISO has adequate resources to meet its PRMR (target reserve level).
If the 12 GW of retirements is experienced, MISO will be able to meet its Planning Reserve Margin Requirements
throughout the assessment period; however, this will be done by relying heavily on Existing‐Other resources, which may be
subject to fuel availability issues, leading to higher average forced outage rates, transmission limitations, etc. More
investigation into resource utilization type is required to understand the true reliability impact. Of the 12 GW of potential
retirements, 10,956 MW is included in the LTRA data. Of this 10,596 MW, 106 MW are Future‐Planned retirements, which
leaves 10,490 MW. That 10,490 MW is categorized as 8,514 MW of Existing‐Certain resources, 957 MW of Existing‐Other
resources, 394 MW of Future‐Other resources, and 625 MW of behind‐the‐meter generation. If these resources retire, the
Anticipated Reserve Margins for 2015 and 2022 will be 9.7 percent and 7.1 percent, respectively, and the Prospective
Reserve Margin will be 21.9 percent and 18.9 percent, respectively. At this level of retirement, MISO may not have
adequate resources to reliably serve load.
For additional information on the impact of EPA retirements on Loss of Load expectation within MISO, see the MTEP 12
report posted on MISO’s website.180
From the initial EPA study work, it was shown that most of the impact on transmission reliability cost would be relatively
small ($30 / kW) and could be implemented within the 2015 period if upgrades are committed early. The upgrades include
capacitor bank installations, short lower voltage transmission line additions, modest reconductoring jobs or transformer
upgrades at existing stations. However, for some unique situations transmission upgrades would be more involved and
would require the need for an extension.
180 MTEP 12: https://www.misoenergy.org/Planning/TransmissionExpansionPlanning/Pages/MTEP12.aspx.

MISO
NERC | 2012 Long‐Term Reliability Assessment | November 2012
Page 110 of 335
MISO is developing a methodology for tracking and projecting emissions. The tool is expected to be complete by the time
the CSAPR rule is implemented. Tracking emissions will help MISO staff anticipate potential issues that may arise from the
management of the allowances by generating‐owning members.
Gas and Electric Interdependencies
New and proposed regulatory compliance obligations will potentially cause the retirement of an estimated 12.6 GW of coal‐
fired capacity in MISO, causing a shift in the Region’s fuel mix. Natural gas‐fired plants are expected to replace much of the
retired capacity. To prepare for this eventuality, MISO studied gas supply, storage, and pipeline infrastructure to assess how
the shift in the electric fuel mix may impact the gas and electric industries over the next 20 years (MISO‐Figure 4).
MISO‐Figure 4: Overview of MISO Region Major Pipelines
This study181 demonstrates sufficient gas supply but inadequate mainline capacity to serve the 12.6 GW retirement
scenario. Over 65 percent of the pipelines have insufficient capacity to fully meet the needs of the existing units operating
at expected capacity factors under the 12.6 GW retirement scenarios. Pipelines sourcing gas supply from the Gulf Coast
have significantly higher levels of insufficient capacity compared to southwest and mid‐continent pipeline sources.
Additionally, shale gas supplies in proximity to MISO will need pipeline flow changes and infrastructure build‐out. This
analysis is a first step for both the natural gas and electric power industries to better communicate the potential future
pipeline capacity availability for gas‐fired power generation needs. A collaborative effort among the two industries and
regulators is needed to refine pragmatic and practical capacity solutions to meet the future capacity requirements of gas‐
fired power generation.
181 https://www.midwestiso.org/Library/Repository/Communication Percent20Material/Key Percent20Presentations Percent20and Percent20Whitepapers/Natural
Percent20Gas‐ Electric Percent20Infrastructure Percent20Interdependency Percent20Analysis_022212_Final Percent20Public.pdf.

MISO
NERC | 2012 Long‐Term Reliability Assessment | November 2012
Page 111 of 335
MISO performed historical outage analysis for gas‐fired units with lack‐of‐fuel cause codes in the Generation Availability
Data System (GADS). The first cause code is for lack of fuel where the operator is not in control of contracts, supply lines, or
delivery of fuels and the second cause code is for lack of fuel with interruptible supply of the fuel part of the fuel contract.
Since capacity factors for gas‐fired units have historically been low, MISO was able to dispatch base generation units—
specifically coal units. However, with increased coal retirements due to EPA regulations, MISO expects to see higher outage
rates for gas‐fired units.
MISO also performed additional analysis to determine the resulting capacity factors on the gas Combustion Turbines (CTs)
and Combined Cycles (CCs) over the 20‐year time horizon using the Electric Generation Expansion Analysis System (EGEAS)
model, based on a 2011 starting gas price of $2.50/MMBtu and 12.6 GW retirement scenario. For more study analysis on
this issue, please refer to the MTEP 12 report posted on MISO’s website.182
EPA Regulations and Supply Chain
MISO evaluated the risks associated with equipment and labor procurement (supply chain) for various Environmental
Protection Agency (EPA) Mercury and Air Toxics Standards (MATS) rule compliance strategies. MISO’s supply chain
analysis,183 conducted by The Brattle Group, concluded that the March 2015 timeline requires more construction than the
industry has seen in the past, and the greatest unknown risk is the amount of skilled labor available to perform the retrofits.
In addition, the type of technology necessary to bring a unit into compliance may require lengthy unit outages that may run
past the compliance deadline.
Outage Management Under New EPA Regulations
As part of MISO’s efforts to best manage an expected influx of outage requests associated with recent environmental
regulations, MISO conducted an outage limit analysis to determine acceptable monthly outage levels that can be allowed to
maintain reliable transmission operations.184
182 https://www.midwestiso.org/Pages/Home.aspx. 183 https://www.midwestiso.org/Library/Repository/Communication Percent20Material/Key Percent20Presentations Percent20and Percent20Whitepapers/Supply
Percent20Chain Percent20and Percent20Outage Percent20Analysis Percent20of Percent20MISO Percent20Coal Percent20Retrofits Percent20for Percent20MATS.pdf 184 https://www.midwestiso.org/Library/Repository/Communication%20Material/Power%20Up/EPA_Outage%20Limits%20Analysis.pdf.

MRO‐Manitoba Hydro
NERC | 2012 Long‐Term Reliability Assessment | November 2012
Page 112 of 335
MRO-Manitoba Hydro Planning Reserve Margins Manitoba is projecting adequate Planning Reserve Margins for the entire assessment period. As a predominately hydro
region, Manitoba has both an energy criterion and a capacity Reserve Margin criterion. The capacity Reserve Margin
criterion requires a minimum 12 percent reserve above the forecast peak demand. This same criterion is also applied as the
NERC Reference Margin Level. Manitoba Hydro uses a series of probabilistic adequacy analysis, with an objective LOLE of
0.1 days per year over a 10‐year planning horizon, to review the suitability of the NERC Reference Margin Level above the
forecast peak demand.
Manitoba Hydro uses an integrated resource planning process with a 35‐year planning horizon to plan to meet the long‐
term needs of the Province of Manitoba. The Anticipated and Prospective Reserve Margins for the winter peak are
projected to be below the Reference Margin Level during the 2021‐2022 winter seasons. There are expected export sales
that are contingent upon Conceptual resources being built. The Anticipated and Prospective Reserve Margins include these
expected export sales in their calculations; however, they do not include the expected Conceptual resources. Without the
Conceptual resources being built, expected exports would not be realized, and the Anticipated and Prospective Reserve
Margins will remain above the NERC Reference Margin level during the winter seasons for the final two years of the
assessment period. Should the Conceptual resources be built and the sales realized, Adjusted Potential Reserve Margins are
projected to remain well above the NERC Reference Margin Level (MRO‐Manitoba Hydro‐Table 1 and MRO‐Manitoba
Hydro‐Figure 1).
MRO‐Manitoba Hydro‐Table 1: Planning Reserve Margins Manitoba Hydro‐Summer 2013 2014 2015 2016 2017 2018 2019 2020 2021 2022
ANTICIPATED 43.21% 42.26% 54.15% 52.56% 50.60% 53.66% 48.34% 37.45% 27.69% 25.98% PROSPECTIVE 43.21% 42.26% 54.15% 52.56% 50.60% 53.66% 48.34% 37.45% 27.69% 25.98% ADJUSTED POTENTIAL 43.21% 42.26% 54.15% 52.56% 50.60% 53.66% 48.34% 56.26% 46.06% 44.11%
NERC REFERENCE ‐ 12.00% 12.00% 12.00% 12.00% 12.00% 12.00% 12.00% 12.00% 12.00% 12.00%
Manitoba Hydro‐Winter 2013/14 2014/15 2015/16 2016/17 2017/18 2018/19 2019/20 2020/21 2021/22 2022/23
ANTICIPATED 28.63% 28.18% 29.28% 28.09% 26.39% 27.56% 23.55% 15.97% 9.10% 7.54% PROSPECTIVE 28.63% 28.18% 29.28% 28.09% 26.39% 27.56% 23.55% 15.97% 9.10% 7.54% ADJUSTED POTENTIAL 28.63% 28.18% 29.28% 28.09% 26.39% 27.56% 23.55% 26.81% 21.48% 19.75%
NERC REFERENCE ‐ 12.00% 12.00% 12.00% 12.00% 12.00% 12.00% 12.00% 12.00% 12.00% 12.00%
MRO‐Manitoba Hydro‐Figure 1: Summer (Left) and Winter185 (Right) Planning Reserve Margins
Assessment projections show ample resources over the next five years, assuming the nearly completed Wuskwatim
Generating Station is placed into service by the end of 2012. Beyond the next five years, new resources are likely required,
and assessment projections depend on those resources coming into service as planned.
Demand The compound annual growth rate (CAGR) for Total Internal Demand forecast is 1.14 percent for the winter season and
0.88 percent for the summer season during the 10‐year outlook. The slight increase compared to last year’s forecast is
185
Each year represents the initial year of the winter season. For example: 2013 represents the 2013/2014 winter season.
0%
10%
20%
30%
40%
50%
60%
2013 2014 2015 2016 2017 2018 2019 2020 2021 2022
0%
5%
10%
15%
20%
25%
30%
2013 2014 2015 2016 2017 2018 2019 2020 2021 2022

MRO‐Manitoba Hydro
NERC | 2012 Long‐Term Reliability Assessment | November 2012
Page 113 of 335
attributed to higher growth in the residential and commercial sectors, namely from a projected increase in population
(MRO‐Manitoba‐Table 2).
MRO‐Manitoba Hydro‐Table 2: Demand Outlook MRO‐Manitoba Hydro‐Summer 2013 2022 10‐Year Change CAGR
NET INTERNAL DEMAND 3,210 3,474 264 8.2% 0.88%
Load‐Modifying Demand Response 0 0 0 0.0% 0.00%
TOTAL INTERNAL DEMAND 3,210 3,474 264 8.2% 0.88%
MRO‐Manitoba Hydro‐Winter 2013/14 2022/23 10‐Year Change CAGR
NET INTERNAL DEMAND 4,661 5,162 501 10.8% 1.14%
Load‐Modifying Demand Response 0 0 0 0.0% 0.00%
TOTAL INTERNAL DEMAND 4,661 5,162 501 10.8% 1.14%
Manitoba Hydro does not expect any significant long‐term demand forecast change during the assessment period due to
entity acquisitions or exits. Based on the 2011 Economic and Energy Price Outlook, no significant long‐term demand change
is forecast.
The peak load forecast model has been improved since the 2011 LTRA with the inclusion hourly data by sector. While the
previous model included hourly data at the total system level to determine the load shape for the entire system, the
modified approach considers individual load shape all six sectors (Residential All‐Electric, Residential Standard, General
Service Mass Market, Top Consumers, Distribution Losses, and Transmission Losses). Load growth for each sector is
incorporated in the model to determine future load shape and projected peak for the entire system.
Manitoba has a very stable population and a diversified economy with slow but steady growth across the assessment area.
The largest customers are in the smelting, chemicals, and pipeline industries and have been operating for decades. Future
load growth could be driven by new industries in the area, but are not anticipated at this time.
Demand-Side Management During the first year of the assessment, the Demand Response used for Ancillary Services–Non Spinning Reserves is 50 MW
in 2013. Energy Efficiency and Conservation programs will account for 42 MW for 2013.
During the final year of the assessment, the Demand Response used for Ancillary Services–Non Spinning Reserves remains
unchanged at 50 MW. Contractually Interruptible demand response remains unchanged at 225 MW throughout the
assessment period. Energy efficiency and conservation programs are projected to increase from 42 MW in 2013 to 419 MW
in 2022 (MRO‐Manitoba Hydro‐Table 3).
MRO‐Manitoba Hydro‐Table 3: Demand‐Side Management Short‐Term
2022/23 Share of Total Internal Demand
MRO‐Manitoba Hydro‐Winter 2013/14 2014/15 2015/16 2022/23 10‐Year Change
Direct Control Load Management (DCLM) 0 0 0 0 0 0.00% Contractually Interruptible (Curtailable) 225 225 225 225 0 6.48% Critical Peak‐Pricing (CPP) with Control 0 0 0 0 0 0.00% Load as a Capacity Resource 0 0 0 0 0 0.00%
TOTAL RESOURCE‐SIDE DEMAND RESPONSE 225 225 225 225 0 6.48%
Direct Control Load Management (DCLM) 0 0 0 0 0 0.00% Contractually Interruptible (Curtailable) 0 0 0 0 0 0.00% Critical Peak‐Pricing (CPP) with Control 0 0 0 0 0 0.00% Load as a Capacity Resource 0 0 0 0 0 0.00%
TOTAL LOAD‐MODIFYING DEMAND RESPONSE 0 0 0 0 0 0.00%
TOTAL ENERGY EFFICIENCY 42 66 88 194 152 5.58%
TOTAL DEMAND‐SIDE MANAGEMENT 267 291 313 419 152 12.06%
The Energy Efficiency or conservation growth pattern for Demand Response is expected to be minimal. Current Demand
Response implementations are limited to interruptible customer load and are not expected to expand at this time. Demand
Response programs are only being used during system contingencies or emergencies. The interruptible customer load may
only be used to reduce peak demand if planning and/or contingency reserve obligations are in jeopardy of not being met.

MRO‐Manitoba Hydro
NERC | 2012 Long‐Term Reliability Assessment | November 2012
Page 114 of 335
Manitoba Hydro’s current Power Smart portfolio includes customer service, cost‐recovery, incentive‐based and rate‐based
initiatives, and programs customized to meet the specific energy needs of the residential, commercial, and industrial
markets. This portfolio, consisting of Energy Efficiency, conservation, load management, and customer self‐generation
programs, is designed to help customers conserve energy, reduce energy bills and protect the environment. No specific
state or regulatory drivers affect Demand‐Side Management (DSM) in Manitoba.
The driver behind all current Dispatchable and Controllable Demand Response programs in place at Manitoba Hydro is to
provide operational flexibility for the system operator under emergency conditions. These Demand Response programs are
all interruptible customer load for which the industrial customers receive reduced electricity rates in exchange for these
services. No significant developments, policy changes, or enhanced implementations to the current programs are expected.
The Demand Response program used for Ancillary Services (Non‐Spinning Reserves) in place at Manitoba Hydro is the
Curtailable Customer Load Option R. Manitoba Hydro has an agreement with a large industrial customer to carry 50 MW of
Non‐Spinning Reserves in the form of a curtailable customer load.
Generation Current resources in Manitoba total 5,524 MW, with hydro as the primary fuel source in the assessment area. Since last
year’s assessment, 11 MW of nameplate capacity (hydro) from Kelsey upgrades have been added to Existing‐Certain
resources (MRO‐Manitoba Hydro‐Table 4 and MRO‐Manitoba Hydro‐Figure 2).
MRO‐Manitoba Hydro‐Table 4: Capacity Outlook186 Current 2022/23 Planned 2022/23 Planned & Conceptual
Manitoba Hydro‐Winter Capacity Share Capacity Share Change Capacity Share Change
Coal 97 1.8% 0 0.0% ‐97 0 0.0% ‐97 Petroleum 0 0.0% 0 0.0% 0 0 0.0% 0 Gas 395 7.2% 395 7.0% 0 395 6.3% 0 Nuclear 0 0.0% 0 0.0% 0 0 0.0% 0 Other/Unknown 0 0.0% 0 0.0% 0 0 0.0% 0 Renewables 5,032 91.1% 5,262 93.0% 230 5,892 93.7% 860
TOTAL 5,524 100.0% 5,657 100.0% 133 6,287 100.0% 763
MRO‐Manitoba Hydro‐Figure 2: Winter Net Capacity Change187
Future‐Planned hydro generation includes an addition of 22 MW from Kelsey upgrades and 208 MW from the construction
of the Wuskwatim Generating Station (both 2012). Also in 2012, an additional 16.5 MW from the St. Leon wind farm is
included. Manitoba Hydro’s assessment includes 630 MW of conceptual capacity from the Keeyask Generating Station from
2019 to 2020. It is expected that in 2019, the coal unit at the Brandon Generating Station will be retired (approximately 95
MW). Manitoba Hydro uses an integrated resource planning process with a 35‐year planning horizon to plan to meet the
long‐term needs of the Province of Manitoba. Units that are taken out of service during the summer and winter peaks
186 “Current” represents Existing‐Certain and Future‐Planned projections for the 2012 summer (for summer‐peaking assessment areas) or 2012/2013 winter (for winter‐peaking
assessment areas). “Share” represents the share (percent) of total Existing‐Certain and Future‐Planned capacity projected for the peak season. 187
Each year represents the initial year of the winter season. For example: 2013 represents the 2013/2014 winter season.
‐150
‐100
‐50
0
50
100
150
200
250
2013 2014 2015 2016 2017 2018 2019 2020 2021 2022
MW

MRO‐Manitoba Hydro
NERC | 2012 Long‐Term Reliability Assessment | November 2012
Page 115 of 335
range between 5 MW and 147 MW over the assessment period. Approximately 8 MW of behind‐the‐meter generation per
year is included in the assessment period.
For the 2011 resource adequacy study, wind generation was modeled as a simple load modifier with zero capacity value in
the winter (December, January, and February), and an 8 percent capacity credit (19 MW) in the other months. The hydro
capacity expected in the on‐peak ranges from 4,929 MW to 5,008 MW, depending on the month, as median head
conditions vary through the year. The maximum is 5,089 MW, based on nameplate capacity net of station service (MRO‐
Manitoba Hydro‐Table 4 and MRO‐Manitoba Hydro‐Figure 3). The expected on‐peak wind capacity for the summer is 8
percent of the nameplate capacity, and 0 percent for winter on‐peak capacity. The expected hydro on‐peak values are
determined using testing and data processing procedures in accordance with the Midwest Reliability Organization (MRO)
Generator Testing Guidelines188 approved on March 29, 2007.
MRO‐Manitoba Hydro‐Table 4: Renewable Capacity Outlook189 Current 2022/23 Planned 2022/23 Planned & Conceptual
Manitoba Hydro‐Winter Capacity Share Capacity Share Change Capacity Share Change
Hydro 5,032 100.0% 5,262 100.0% 230 5,892 100.0% 860 Pumped Storage 0 0.0% 0 0.0% 0 0 0.0% 0 Geothermal 0 0.0% 0 0.0% 0 0 0.0% 0 Wind 0 0.0% 0 0.0% 0 0 0.0% 0 Biomass 0 0.0% 0 0.0% 0 0 0.0% 0 Solar 0 0.0% 0 0.0% 0 0 0.0% 0
TOTAL 5,032 100.0% 5,262 100.0% 230 5,892 100.0% 860
MRO‐Manitoba Hydro‐Figure 3: Winter Net Renewable Capacity Change190
The expected on‐peak capacity that a unit can sustain is computed using the test results. These values are adjusted for
ambient conditions and do not include any capacity utilized for station service. For reservoir hydro units, the values are
corrected to the five‐year median head for each month, while for run‐of‐river hydro units, the calculation is the average net
integrated hourly capability for all hours of historical operation for each month (MRO‐Manitoba Hydro‐Table 5).
MRO‐Manitoba Hydro‐Table 5: Renewable Capacity Outlook: On‐Peak Vs. Installed Current 2022/23 Planned
MRO‐Manitoba Hydro‐Winter Wind Solar Hydro Biomass Wind Solar Hydro Biomass
Installed Capacity 259 0 5,170 0 275 0 5,400 0 On‐Peak Derate 257 0 0 0 272 0 0 0
EXPECTED ON‐PEAK OUTPUT 1 0 5,170 0 3 0 5,400 0
Operational procedures will be adjusted gradually as the wind penetration level is increased in the Manitoba Hydro
footprint. The potential operational impact of increased wind includes reserve increases and automatic generation control
(AGC) sensitivity. Wind forecasting methodologies have been studied for increasing levels of wind penetration, and various
188 http://www.midwestreliability.org/03_reliability/06_gtrtf/Documents/MRO_Generator_Testing_Guidelines.pdf 189 “Current” represents Existing‐Certain and Future‐Planned projections for the 2012 summer (for summer‐peaking assessment areas) or 2012/2013 winter (for winter‐peaking
assessment areas). “Share” represents the share (percent) of total Existing‐Certain and Future‐Planned capacity projected for the peak season. 190
Each year represents the initial year of the winter season. For example: 2013 represents the 2013/2014 winter season.
0
50
100
150
200
250
2013 2014 2015 2016 2017 2018 2019 2020 2021 2022
MW

MRO‐Manitoba Hydro
NERC | 2012 Long‐Term Reliability Assessment | November 2012
Page 116 of 335
recommendations have been made for improvements, depending on the level of penetration studied. Recommendations
for improvement include a probabilistic‐based forecast approach, as well as decreasing the forecast time step to sub‐hourly
intervals.
Capacity Transactions All of Manitoba Hydro’s dependable exports and imports are backed by contracts. Manitoba Hydro has between 325 and
550 MW of Firm on‐peak capacity exports and between 350 and 500 MW of Firm on‐peak capacity imports in the winter
and between 725 and 1080 MW of on‐peak capacity exports in the summer and associated Firm transmission reservations
during the assessment period (MRO‐Manitoba Hydro‐Table 6). Manitoba Hydro does not have any capacity imports during
the summer. These contractual agreements have Firm transmission reservations associated with them with agreements
that have staggered terms. Manitoba Hydro does not project any capacity transactions beyond the contract terms;
however, in some cases contracts are expected to be rolled over with similar terms. Some future capacity export
transactions are contingent upon additional resources being built.
MRO‐Manitoba Hydro‐Table 6: Projected Capacity Transactions MRO‐Manitoba Hydro‐Winter 2013/14 2014/15 2015/16 2016/17 2017/18 2018/19 2019/20 2020/21 2021/22 2022/23
Expected Imports 200 200 200 200 200 200 200 200 200 200 Firm Imports 500 500 350 350 350 350 350 350 350 350
TOTAL IMPORTS 700 700 550 550 550 550 550 550 550 550
Expected Exports 0 0 0 0 0 0 0 250 475 475 Firm Exports 550 550 325 325 325 325 325 325 325 325
TOTAL EXPORTS 550 550 325 325 325 325 325 575 800 800
TOTAL NET CAPACITY TRANSACTIONS 150 150 225 225 225 225 225 ‐25 ‐250 ‐250
The Manitoba Hydro system is interconnected to three external systems: the MISO system to the south in the United
States, and two other Canadian electric power systems, Saskatchewan Power Corporation and Ontario Independent
Electricity System Operator. In a resource adequacy assessment, Manitoba Hydro considers non‐Firm import as reserve
sharing only from the United States (Western MISO Region), but not from other neighboring Canadian utilities. The reserve
sharing with the United States is assumed to be possible only if the Western MISO Region system has adequate resource,
meaning that the LOLE of Western MISO Region system is not worse than 0.1 days per year.
Transmission Transmission projects expected to be completed in the Manitoba Assessment Area during the long‐term outlook for this
assessment are listed in Appendix II. Additionally, a summary of existing and projected transmission additions is provided
below (MRO‐Manitoba Hydro‐Table 7).
MRO‐Manitoba Hydro‐Table 8: Existing and Projected Transmission MRO‐Manitoba Hydro AC (Circuit Miles) DC (Circuit Miles) Total (Circuit Miles)
EXISTING 6,340 1,145 7,485
Currently Under Construction 0 0 0 Planned ‐ Completed within First Five Years 237 0 237 Planned ‐ Completed within Second Five Years 243 833 1,076
2022 TOTAL (UNDER CONSTRUCTION & PLANNED) 6,820 1,978 8,798
Conceptual ‐ Completed within First Five Years 0 0 0 Conceptual ‐ Completed within Second Five Years 80 0 80
2022 TOTAL (UNDER CONSTRUCTION, PLANNED & CONCEPTUAL) 6,900 1,978 8,878
A fourth transformer addition at Cornwallis Station is required and planned to provide Firm capacity to the Brandon Area
due to restricted operation of the Brandon Unit 5 coal‐fired generator. New provincial legislation aimed at greenhouse gas
reduction only allows operation of the coal unit under emergency or drought conditions. There are plans to extend
Cornwallis Station to accommodate a fourth 230‐115 kV transformer and a new 230 kV breaker. Also planned are upgrades
and re‐routing of 115 kV transmission lines BE3 (Brandon–Brandon Victoria), CB3 (Cornwallis–Brandon), MR11 (Raven Lake–
Brandon Victoria), and CB4 (Cornwallis–Brandon). Installation of the fourth transformer and associated transmission line
upgrades are estimated to be in service by May 2013. A new 500/230 kV Riel Station consists of establishing a new station,
which will involve:
Installing a 230 kV to 500 kV transformer bank

MRO‐Manitoba Hydro
NERC | 2012 Long‐Term Reliability Assessment | November 2012
Page 117 of 335
Sectionalizing the existing Dorsey–Forbes 500 kV line
Sectionalizing two existing 230 kV lines (Ridgeway–St. Vital lines R32V and R33V and Ridgeway–Richer Line R49R)
Winnipeg Area Transmission Refurbishments consist of an estimated 113 miles of 230 kV transmission lines that will be
upgraded to carry higher loading. Several new 230/115 kV and 66 kV transformers are being added to the system. The sites
include Rockwood, Transcona, Stanley, and Neepawa stations. The Rosser–Parkdale–Selkirk 115 kV Transmission System
project consists of development of the new 230/115 kV Rockwood Station supplied from the sectionalized Ashern–Rosser
230 kV transmission line A3R (Ashern–Rosser). A 230/115 kV transformer and associated structural and electrical apparatus
will be needed to connect this new station to the existing 115 kV system.
The Scotland (now called Stafford) Station rebuild is required in order to provide additional capacity to the core Winnipeg
Area and to facilitate the replacement of aging equipment at Scotland Station. The Scotland 138 kV and 115‐66 kV Terminal
Station is going to be rebuilt. This will involve reusing four 138‐66 kV transformers, two 115‐66 kV transformers, installing
two new 125 MVA 115‐66 kV transformers, and new 66 kV and 115 kV ring buses. In addition, the 138 kV transmission
systems between Pointe Du Bois, Slave Falls, and Scotland will be converted to 115 kV so that the former Winnipeg Hydro
transmission can be integrated into the Manitoba Hydro 115 kV system. Pointe Du Bois 138‐66 kV Bank 7 will be replaced
by a new 115‐66 kV 60 MVA bank to accommodate the voltage conversion. Finally, the termination of lines YH33
(Laverendrye–Harrow) and VS27 (St. Vital–Scotland) will be relocated from Harrow to the new Stafford Station. The
scheduled in‐service date is estimated to be 2014.
Pointe du Bois transmission line replacement consists of retiring four 66 kV Pointe du Bois–Rover transmission lines on two
parallel sets of steel towers that cover 77 miles. The lines were first installed in 1910 and have reached the end of their life.
They will be replaced with a new 115 kV line that will run from Pointe du Bois to Whiteshell Station. Several other system
modifications are required to accommodate this, including:
Advance construction of a new 115 kV switchyard at Pointe du Bois.
Installing a new 66 kV Line from Ridgeway to Rover, including terminations at both stations
Salvaging two 115‐66 kV banks at Transcona Station.
Increasing the rating of 115 kV Slave Falls transmission lines designated S1 & S2 (Slave Falls–Scotland).
Manitoba Hydro is planning to establish a new 230‐66 kV station at Neepawa and tap the existing line D54C (Dorsey–
Cornwallis). This project has been delayed for two years due to budget constraints.
The deferral of the Neepawa 230‐66 kV Station combined with the proposed new pipeline load in the area increases the risk
of under‐voltage conditions for outages of either line MR11 (Ravern Lake–Brandon Victoria) or BN5 (Brandon–Neepawa).
Operating guides will be put in place as required. Brandon Generating Station Unit 5 was modified in December 2010 to
permit synchronous condenser operation, which provides additional local area voltage support.
The Bipole III transmission line from Keewatinoow Converter Station in the north to the Riel Converter Station near
Winnipeg will have sufficient capacity to support the Future‐Planned Keeyask 630 MW generation plant. The Bipole III
routing project on the west side of the province includes:
±500 kV HVdc transmission line, about 833 miles long, from Keewatinoow Converter Station to Riel Converter Station
2,000 MW converter station at Keewatinoow near the future Conawapa Generating Station
five ac transmission lines each approximately 19 miles in length to connect the Keewatinoow Converter Station to the
existing northern ac collector system
2,000 MW converter station at Riel, including 4 x 250 Mvar synchronous compensators
Other significant substation equipment to be added within the Manitoba Assessment Area includes:
Brandon Generating Station 54 Mvar 115 kV capacitor (4th) (October 2012)
Riel 230 kV 3 X 73.4 Mvar capacitors (May 2014)

MRO‐Manitoba Hydro
NERC | 2012 Long‐Term Reliability Assessment | November 2012
Page 118 of 335
Keewatinoow and Riel—2000 MW converters at each station (October 2017)
Riel synchronous condensers (4 X 250 Mvar) (October 2017)
Dorsey 150 Mvar line reactor—new (May 2018)
Dorsey bank 51, second stage 73.4 Mvar tertiary capacitors (May 2018)
Riel 2nd 230/500 kV transformer bank with 2 x 73.4 Mvar tertiary capacitors (May 2019)
Vulnerability Assessment Several factors could potentially impact the performance adequacy of the Manitoba Hydro system. The primary concerns
include extended drought conditions, increased generating unit forced outage rates, and load forecast uncertainty in load
forecast beyond that anticipated.
Manitoba Hydro considers extended drought conditions in planning resources and evaluating system resource adequacy.
Manitoba Hydro uses an energy criterion for extended drought conditions. The criterion requires adequate energy
resources to supply Firm energy demand in the event that the lowest recorded coincident river flow conditions on the
available historic hydraulic flow record are repeated. In addition, hydro units are modeled as energy limited resources in
the probabilistic resource adequacy study with the energy limits for the applicable cases based on drought or extreme
drought conditions.
Generating unit forced outages are considered in the probabilistic resource adequacy studies. Sensitivity analysis on the
hydro units forced outage rates of the hydro units that predominate in Manitoba Hydro’s system indicates low impact on
Planning Reserve Margin Requirements.
Generally, a higher reserve capacity is required in order to maintain a specified level of reliability for an uncertain load than
for a known load. Uncertainties in the economy, weather, and temperature would impact the accuracy of forecast load.
Probabilistic resource adequacy studies on the Manitoba Hydro system indicate that the load forecast uncertainty
negatively impacts Manitoba Hydro’s system resource adequacy.
Manitoba does not have a Renewable Portfolio Standard (RPS). Considering that Manitoba’s typical energy production is
already 98 percent renewable, the potential for a provincial RPS is very low.
Manitoba Hydro currently has approximately 200 MW of Demand Response under Options A, C, E and R of its Curtailable
Rates Program. Due to modeling complexities combined with uncertainty as to the customer’s long‐term commitments to
the Curtailable Rates program, these Demand Response resources were not considered in the pending 2012 resource
adequacy study. While this assumption is conservative for now, its appropriateness will be reviewed for future LOLE
studies. There are no resource adequacy concerns for unavailable/unresponsive Demand Response programs in Manitoba
Hydro. The most significant operational concern for this scenario is the need to carry contingency reserves elsewhere when
the non‐spinning reserves normally available as Demand Response are unresponsive. In addition, when interruptible
customer load is unavailable, system operators will have to rely more heavily on emergency energy purchases prior to
shedding Firm load under severe system contingencies.
The most likely increase in variable generation in the foreseeable future is wind‐related. The addition of new resources
would help with resource adequacy issues, and the addition of plausible amounts of wind generation does not raise any
significant operational concerns, given the significant operating flexibility of the existing hydro resources.
Currently Manitoba Hydro does not have any Under‐Voltage Load Shedding (UVLS) relays installed and has no plans to
install any in the 10‐year planning horizon.
A new SPS is planned to be installed at Grand Rapids Generating Station. When north‐to‐south transfers are high in
Manitoba, there is potential to thermally overload one or more of the Grand Rapids Generating Station outlet lines when
one of the four generator outlet line trips. The SPS will convert one of the Generating Station units to a synchronous

MRO‐Manitoba Hydro
NERC | 2012 Long‐Term Reliability Assessment | November 2012
Page 119 of 335
condenser within two minutes of an outlet line tripping, thus preventing line overload while maintaining dynamic var
reserves. This will be a permanent solution.
A new SPS is also planned to be installed at Raven Lake Station on 115 kV line MR11 (Raven Lake–Brandon Victoria). When
north‐to‐south transfers in Manitoba are high, there is potential to thermally overload this line for loss of the 230 kV line
C28R (Cornwallis–Reston). Over‐current tripping of line MR11 will be initiated to alleviate the thermal overload issue. This
will be a permanent solution.
Manitoba Hydro has conducted an assessment of vulnerabilities considering low probability extreme weather events and
other hazards, such as fires. These low probability events could result in catastrophic outages. Manitoba Hydro has
evaluated the risks of these extreme disturbances and associated consequences and has determined that the consequences
are too great to be ignored. To mitigate these low‐probability and high‐impact events and improve system reliability, an
additional transmission line located on a separate corridor and associated facilities is planned to provide an alternative
north‐to‐south transmission route and power injection point in the south of Manitoba. Reliability enhancement against fire
risks is also in progress.
Manitoba Hydro has already deployed Static Var Compensators (SVCs) at several stations to improve system reliability. A
number of Phasor Measurement Units (PMUs) have also been deployed at various points on Manitoba Hydro system, and a
data analysis tool is being used to process the collected data to improve system simulation models and fine tune controls.
Future plans include the use of PMU data for real‐time visualization and decision support tools for system operators. Short‐
term plans to increase reliability through the use of technology include dynamic security assessment, dynamic equipment
ratings, advanced equipment monitoring, and fault current mitigation.
There are no significant smart grid programs currently planned at the distribution level that would impact reliability of the
transmission in the bulk power system.
Manitoba Hydro’s generation portfolio is dominated by over 95 percent hydro‐powered generation. Future plans for new
hydro generation to satisfy reliability concerns do not experience the same environmental limitations as the fossil fuel‐
based alternatives. No significant future environmental regulations will have an impact on reliability.
Operation of the coal‐fired Brandon Generating Station is restricted to use for emergency preparedness only, for reliability
and staff training purposes. There is sufficient time to perform required retrofits on the coal‐fired Brandon Generating
Station when the greenhouse gas regulations are introduced and clarified, since it is anticipated that enough lead time will
be given to allow for appropriate mitigation.
Plans for Accommodating Generator Retirements and Environmental Control Retrofits
Operation of the coal‐fired Brandon Generating Station is restricted to use for emergency preparedness only, for reliability
and staff training purposes. There is sufficient time to perform required retrofits on the coal‐fired Brandon Generating
Station when the greenhouse gas regulations are introduced and clarified, since it is anticipated that enough lead time will
be given to allow for appropriate mitigation.
The Climate Change and Emissions Reductions Act was enacted by the Province of Manitoba. Since January 1, 2010,
provisions under the act have restricted the use of coal generation electricity except in support of emergency operations
and drought. In addition to meeting any emergencies, the one remaining coal unit, Brandon Unit #5, may be also be
operated to provide for staff training and unit testing to ensure that the unit is maintained in a ready state.
The Government of Canada has a national Greenhouse Gas Emissions Reporting Program (GHGRP). This program applies to
the industrial greenhouse gas emitters in Canada. Starting in 2009, all facilities that emit the equivalent of 50,000 tonnes or
more of greenhouse gases in carbon dioxide equivalent units per year are required to report their emissions.
Manitoba Hydro has a comprehensive greenhouse gas management strategy to reduce emissions. Actions taken to date
include retiring four coal units, converting and additional two coal units to gas‐fired operation, developing new hydropower

MRO‐Manitoba Hydro
NERC | 2012 Long‐Term Reliability Assessment | November 2012
Page 120 of 335
and wind, and increasing the efficiency of our generation and transmission system. Another key component of this strategy
is Manitoba Hydro’s long‐term commitment to demand‐side efficiency improvements through its PowerSmart programs.
Current plans count on the one remaining coal‐fired unit, Brandon Unit #5, until 2019. However, depending on various
considerations, the unit may continue to provide emergency services beyond this time frame.
There are no anticipated reliability impacts associated with the US environmental regulatory requirements for Manitoba
Hydro.
Standing and Emerging Reliability Issues Each of the three reliability issues identified above is further assessed below.
1. Critical Infrastructure Protection – Extreme Weather Event
This was reported in the 2011 LTRA; NERC’s Technical Committees set up several task forces to investigate high‐impact,
low‐probability events (Spare Equipment data TF and Severe Impact Restoration TF).
The 2012LTRA Reference case incorporates plans to address the reliability issue. A severe event, such as a naturally
occurring hazard (tornado, ice storm), could severely limit the north‐to‐south transfer capability in Manitoba, which could
result in long‐duration rotating blackouts in Manitoba.
Significant loss of transmission due to a corridor loss or station loss can restrict the ability of large amounts of generation to
serve load.
This issue directly affects transmission adequacy. Generation‐to‐load transfer capability would be severely diminished for a
duration that depends on the underlying cause.
This type of event includes loss of an entire substation and/or loss of a transmission corridor. These events could be caused
by extreme weather (fire, tornado, ice storms) or sabotage. These events could cripple operation of the Bulk Electric System
(BES) in Manitoba. Manitoba Hydro has operated to protect against a severe disturbance when the likelihood of an extreme
weather event has increased to a certain threshold. For example, Manitoba Hydro has developed a “Hydro Proximity
Report” application that monitors storm events and their proximity to key infrastructure. If the “Hydro Proximity Report”
indicates that a tornado or other strong wind event is threatening key infrastructure, Manitoba Hydro will reduce transfers
to ensure that the severe event will not cause Manitoba Hydro to lose its interconnection ties.
Additional Information – Preparedness for Extreme Weather Events
Severe events, such as loss of an entire substation or transmission corridor, are low in probability but can have major
consequences, such as long‐duration rotating blackouts. An assessment of the vulnerability of Manitoba’s facilities to
extreme weather and other disturbances was conducted, and it was determined the risk was too great to be ignored. To
date, Manitoba Hydro has not experienced any reliability issues associated with high‐impact, low‐probability events. To
mitigate these potential reliability concerns, plans are in place to construct an additional north‐to‐south transmission line
on a separate corridor by 2017. Until these facilities are in place, severe weather is monitored in the operating horizon.
Power transfers on the north‐to‐south flow facilities are reduced if the severe weather is threatening key infrastructure.
Loss of these facilities at reduced loading will prevent cascade tripping.
2. Geomagnetic Disturbances
This was reported in the 2011LTRA. The NERC Planning Committees set up a task force to investigate the impact of
geomagnetic disturbances on the grid.
The 2012LTRA Reference case does not include any specific plans to address the issue. A severe geomagnetic disturbance is
forecast to occur roughly coincidental with the peak of sunspot activity that occurs every 12 to 13 years. The last peak in
sunspot activity occurred between 2000 and 2003. The next peak is forecast between 2013 and 2016. The geomagnetic
disturbance causes dc current to flow in neutral grounded transformers, which can saturate the banks and lead to

MRO‐Manitoba Hydro
NERC | 2012 Long‐Term Reliability Assessment | November 2012
Page 121 of 335
shortages of reactive power. Manitoba Hydro analysis conducted to date has indicated that geomagnetic disturbance could
impact parts of Manitoba Hydro’s 230 kV northern network. The potential impact has not been quantified.
The DC current caused by geomagnetic disturbances can cause transformer equipment damage or misoperation of Static
Var Compensators. Manitoba Hydro has developed special equipment specifications and test procedures to minimize this
possibility. Monitoring equipment is placed strategically to quantify the magnitude of DC current and notify system
operators. Research is underway to develop better analysis tools for determining whether further mitigation is warranted
or new operating procedures are required.
Manitoba Hydro has developed operating procedures to minimize the impact of a geomagnetic disturbance. These
procedures are implemented once the Reliability Coordinator notifies Manitoba Hydro that an upcoming event has met or
exceeded thresholds (per Geomagnetic Disturbance Procedure RTO‐OP‐053‐r4). The Reliability Coordinator receives indices
from Boulder, Colorado that indicate the intensity of the geomagnetic disturbance.
3. Integration of Variable Generation
Integration of Variable Generation is a standing issue. This was reported in the 2011 LTRA. The NERC Planning Committee
has set up the Integration of Variable Generation Task Force.
The reference case does not include any specific plans to address the issue.
Interconnection of additional variable generation in neighboring Regions to Manitoba changes during the 10‐year horizon.
Long‐term planning studies indicate potentially significant loop flow in Manitoba due to U.S.‐connected wind generation.
The loop flow could cause thermal overloads or reduced reactive power reserves in southern Manitoba. In addition, area
control error could increase due to the lack of fast‐acting regulating reserves in neighboring Regions.
In most studies, transmission is being added only to address Firm capacity levels of variable generation (e.g., 10 to 40
percent of nameplate), which means a significant proportion of the output is non‐Firm. Re‐dispatch may not be available in
the planning horizon to address transmission adequacy issues.
The proliferation of variable resources like wind has introduced complexity into the operating environment. Many wind
plants do not build facilities to allow Firm transmission of their wind energy. Loop flow and congestion caused by wind
resources outside Manitoba Hydro’s service area are the operational issues that arise from integration of these resources.
As such, operating guides that curtail wind resources and other resources are used as a mitigating strategy to ensure
reliable operations when transmission capacity is exceeded.

MRO‐MAPP
NERC | 2012 Long‐Term Reliability Assessment | November 2012
Page 122 of 335
MRO-MAPP Planning Reserve Margins MAPP is projecting adequate Planning Reserve Margins during the 2013–2022 assessment period. All Planning Reserve
Margin categories (Anticipated, Prospective, and Adjusted Potential) exceed the NERC Reference Margin Level of 15
percent due to the area’s strong generation portfolio and Demand‐Side Management programs through 2019 (MRO‐MAPP‐
Table 1 and MRO‐MAPP‐Figure 1).
MRO‐MAPP‐Table 1: Planning Reserve Margins MAPP‐Summer 2013 2014 2015 2016 2017 2018 2019 2020 2021 2022
ANTICIPATED 29.36% 26.79% 25.21% 20.46% 19.28% 17.57% 15.50% 13.65% 11.97% 10.36% PROSPECTIVE 29.36% 26.79% 25.21% 20.46% 19.28% 17.57% 15.50% 13.65% 11.97% 10.36% ADJUSTED POTENTIAL 29.36% 26.79% 25.21% 20.46% 19.28% 17.57% 15.50% 13.65% 11.97% 10.36%
NERC REFERENCE ‐ 15.00% 15.00% 15.00% 15.00% 15.00% 15.00% 15.00% 15.00% 15.00% 15.00%
MAPP‐Winter 2013/14 2014/15 2015/16 2016/17 2017/18 2018/19 2019/20 2020/21 2021/22 2022/23
ANTICIPATED 37.37% 34.28% 34.82% 29.00% 27.20% 24.70% 22.11% 20.07% 18.10% 16.29% PROSPECTIVE 37.37% 34.28% 34.82% 29.00% 27.20% 24.70% 22.11% 20.07% 18.10% 16.29% ADJUSTED POTENTIAL 37.37% 34.28% 34.82% 29.00% 27.20% 24.70% 22.11% 20.07% 18.10% 16.29%
NERC REFERENCE ‐ 15.00% 15.00% 15.00% 15.00% 15.00% 15.00% 15.00% 15.00% 15.00% 15.00%
MRO‐MAPP‐Figure 1: Summer (Left) and Winter191 (Right) Planning Reserve Margins
The Anticipated Reserve Margin falls below the NERC Reference Margin Level in 2020 and reaches 10.36 percent in 2022.
This is a common situation in MAPP, which has traditionally planned to meet the NERC Reference Margin Level at least five
to six years in advance, without considerations for additional Firm contracts or new peaking capacity units that have less
certainty in the final years of the 10‐year assessment. MAPP will provide more accurate plans for 2020–2022 in future long‐
term assessments, as load projections become more accurate, long‐term contracts are executed, and new generation
resources are planned. MAPP does not anticipate any scenarios that would lead to a significant detraction from these
projections for this assessment period.
Demand The forecasted 10‐year compound annual growth rate for Total Internal Demand remains flat at 2.09 percent for the
summer and 2.19 percent for the winter, increasing from 4,995 MW in 2013 to 6,015 MW in 2022 for the peak season
(MRO‐MAPP‐Table 2). This amounts to a 2.09 percent CAGR for the summer demand.
MRO‐MAPP‐Table 2: Demand Outlook MRO‐MAPP‐Summer 2013 2022 10‐Year Change CAGR
NET INTERNAL DEMAND 4,904 5,906 1,002 20.4% 2.09%
Load‐Modifying Demand Response 91 109 18 19.3% 1.98%
TOTAL INTERNAL DEMAND 4,995 6,015 1,020 20.4% 2.09%
MRO‐MAPP‐Winter 2013/14 2022/23 10‐Year Change CAGR
NET INTERNAL DEMAND 4,858 5,904 1,047 21.5% 2.19%
Load‐Modifying Demand Response 0 0 0 0.0% 0.00%
TOTAL INTERNAL DEMAND 4,858 5,904 1,047 21.5% 2.19%
191
Each year represents the initial year of the winter season. For example: 2013 represents the 2013/2014 winter season.
0%
5%
10%
15%
20%
25%
30%
2013 2014 2015 2016 2017 2018 2019 2020 2021 2022
0%
10%
20%
30%
40%
2013 2014 2015 2016 2017 2018 2019 2020 2021 2022

MRO‐MAPP
NERC | 2012 Long‐Term Reliability Assessment | November 2012
Page 123 of 335
Certain load‐centers (e.g., large cities) are no longer included in the MRO‐MAPP Assessment Area. These changes to the
assessment area did not have much of an impact on demand growth, which remained essentially unchanged since the
2011LTRA. There were no changes or enhancements this year to the forecasting methods used by MAPP last year. Most of
the MAPP utilities report annual demand growth near the composite MAPP annual growth demand. One localized area of
greater load growth is Rochester Public Utilities, which serves the greater Rochester, Minnesota Area and has a forecast 10‐
year annual growth rate of 6.9 percent for Total Internal Demand. This growth rate is primarily due to the downtown area
development of City of Rochester and the expansion of the Mayo Clinic. MAPP continues to monitor the potential impact to
demand that may be attributed to the increasing development in the oil and gas production in the Bakken Formation in
western North Dakota and eastern Montana. In April 2008, the U.S. Geological Survey (USGS) estimated that the Bakken
Formation is larger than all other current USGS oil assessments of the lower 48 states and is the largest “continuous” oil
accumulation ever assessed by the USGS.
Demand-Side Management The total on‐peak amount of Demand Response and Energy Efficiency/Conservation projected to be available for 2013 is
129 MW. The total on‐peak amount of Demand Response and Energy Efficiency/Conservation projected to be available
during the tenth year of the assessment (2022) is 190 MW. The growth pattern for Demand Response is a flat 1 percent
throughout the assessment period. The growth pattern for Energy Efficiency / Conservation has more than triple during this
assessment period, growing from approximately 22 MW in 2013 to 66 MW in 2022 (MRO‐MAPP‐Table 3).
MRO‐MAPP‐Table 3: Demand‐Side Management Short‐Term
2022 Share of Total Internal Demand
MRO‐MAPP‐Summer 2013 2014 2015 2022 10‐Year Change
Direct Control Load Management (DCLM) 5 5 5 5 0 0.09% Contractually Interruptible (Curtailable) 10 10 10 10 0 0.17% Critical Peak‐Pricing (CPP) with Control 0 0 0 0 0 0.00% Load as a Capacity Resource 0 0 0 0 0 0.00%
TOTAL RESOURCE‐SIDE DEMAND RESPONSE 16 16 16 16 0 0.26%
Direct Control Load Management (DCLM) 86 88 90 104 18 1.73% Contractually Interruptible (Curtailable) 5 5 5 5 0 0.08% Critical Peak‐Pricing (CPP) with Control 0 0 0 0 0 0.00% Load as a Capacity Resource 0 0 0 0 0 0.00%
TOTAL LOAD‐MODIFYING DEMAND RESPONSE 91 93 95 109 18 1.81%
TOTAL ENERGY EFFICIENCY 22 26 31 66 44 1.10%
TOTAL DEMAND‐SIDE MANAGEMENT 129 135 142 190 61 3.16%
There have not been any significant changes regarding dispatchable and controllable Demand Response, or Demand
Response used for ancillary services in MAPP. The amount of DSM in these areas remains flat.
Generation Current capacity amounts to 7,319 MW. There is currently no capacity categorized as Existing‐Other or Existing‐Inoperable.
The primary fuel sources in MAPP are coal, hydro, natural gas, followed by oil and wind. Added capacity since the 2011LTRA
amounts to only about 50 MW.
There are 584 MW of Future‐Planned and Conceptual resources projected to come on‐line throughout the assessment time
frame (MRO‐MAPP Table 4 and MRO‐MAPP Figure 2).

MRO‐MAPP
NERC | 2012 Long‐Term Reliability Assessment | November 2012
Page 124 of 335
MRO‐MAPP‐Table 4: Capacity Outlook192 Current 2022 Planned 2022 Planned & Conceptual
MRO‐MAPP‐Summer Capacity Share Capacity Share Change Capacity Share Change
Coal 3,174 43.4% 3,322 42.0% 148 3,322 42.0% 148 Petroleum 597 8.2% 597 7.6% 0 597 7.6% 0 Gas 999 13.7% 1,435 18.2% 436 1,435 18.2% 436 Nuclear 60 0.8% 60 0.8% 0 60 0.8% 0 Other/Unknown 41 0.6% 41 0.5% 0 41 0.5% 0 Renewables 2,448 33.4% 2,448 31.0% 0 2,448 31.0% 0
TOTAL 7,319 100.0% 7,903 100.0% 584 7,903 100.0% 584
MRO‐MAPP‐Figure 2: Summer Net Capacity Change
There have been no significant unit retirements, deferments, derates, or other negative impact to Existing‐Certain capacity
in the prior year.
MAPP is not projecting any significant new generation, generator uprates, units taken out of service, units brought back in
service, or long‐term outages over the assessment period. There has been no change in behind‐the‐meter generation, or
changes in other “non‐traditional” resources in the previous year.
Of the total existing capacity, 251 MW of wind generation is expected on‐peak, with a nameplate rating of 1,100 MW. To
determine wind expected peak, MAPP utilizes a methodology that is based on a median of actual wind output. The same
four peak hours per day for each day of the month are used. The four peak hours may change from month to month. This
data set consists of 10 years of data or the life of the wind farm. Additionally, there are 2,193 MW of hydro and 3 MW of
biomass Existing‐Certain Capacity Resources in MAPP (MRO‐MAPP‐Table 5).
MRO‐MAPP‐Table 5: Renewable Capacity Outlook193 Current 2022 Planned 2022 Planned & Conceptual
MRO‐MAAP‐Summer Capacity Share Capacity Share Change Capacity Share Change
Hydro 2,193 89.6% 2,193 89.6% 0 2,193 89.6% 0 Pumped Storage 0 0.0% 0 0.0% 0 0 0.0% 0 Geothermal 0 0.0% 0 0.0% 0 0 0.0% 0 Wind 251 10.3% 251 10.3% 0 251 10.3% 0 Biomass 3 0.1% 3 0.1% 0 3 0.1% 0 Solar 0 0.0% 0 0.0% 0 0 0.0% 0
TOTAL 2,448 100.0% 2,448 100.0% 0 2,448 100.0% 0
No abnormal operating conditions or restrictions due to the integration of variable resources are expected to impact
reliability during the assessment period. Hydro conditions are expected to be normal, with reservoir levels back to a normal
level after several seasons of low water (MRO‐MAPP‐Table 6).
MRO‐MAPP‐Table 6: Renewable Capacity Outlook Current 2022 Planned
192 “Current” represents Existing‐Certain and Future‐Planned projections for the 2012 summer (for summer‐peaking assessment areas) or 2012/2013 winter (for winter‐peaking
assessment areas). “Share” represents the share (percent) of total Existing‐Certain and Future‐Planned capacity projected for the peak season. 193 Ibid.
0
100
200
300
400
500
600
2013 2014 2015 2016 2017 2018 2019 2020 2021 2022
MW

MRO‐MAPP
NERC | 2012 Long‐Term Reliability Assessment | November 2012
Page 125 of 335
MRO‐MAPP‐Summer Wind Solar Hydro Biomass Wind Solar Hydro Biomass
Installed Capacity 1,104 0 2,357 3 1,104 0 2,357 3 On‐Peak Derate 853 0 164 0 853 0 164 0
EXPECTED ON‐PEAK OUTPUT 251 0 2,193 3 251 0 2,193 3
Capacity Transactions MAPP is projecting total Firm imports of 307 MW in 2013, increasing to 318 MW by 2022. Additionally, MAPP is projecting
total Firm exports of 1,517 MW in 2013, decreasing to 1,424 by 2022. Net capacity transactions remain negative throughout
the assessment period (MRO‐MAPP‐Table 7).
MRO‐MAPP‐Table 7: Projected Capacity Transactions MRO‐MAPP‐Summer 2013 2014 2015 2016 2017 2018 2019 2020 2021 2022
Expected Imports 0 0 0 0 0 0 0 0 0 0 Firm Imports 307 313 319 312 314 316 318 318 318 318
TOTAL IMPORTS 307 313 319 312 314 316 318 318 318 318
Expected Exports 0 0 0 0 0 0 0 0 0 0 Firm Exports 1,517 1,522 1,493 1,424 1,424 1,424 1,424 1,424 1,424 1,424
TOTAL EXPORTS 1,517 1,522 1,493 1,424 1,424 1,424 1,424 1,424 1,424 1,424
TOTAL NET CAPACITY TRANSACTIONS ‐1,210 ‐1,209 ‐1,174 ‐1,112 ‐1,110 ‐1,108 ‐1,106 ‐1,106 ‐1,106 ‐1,106
No emergency MW imports are required to meet the reserve margin target in MAPP.
Transmission MAPP has 230 miles of greater‐than‐100 kV transmission line under construction and 716 miles of planned transmission
projects above 100 kV that are expected to be in service within five years (MRO‐MAPP‐Table 8). These projects are
anticipated to come into service during the 2013–2022 study period to enable reliable and efficient transmission service for
the MAPP Assessment Area. There is no potential reliability impact in not meeting target in‐service dates of transmission
identified. MAPP does not anticipate any existing, significant transmission lines or transformers being out of service through
the assessment period. MAPP does not have any transmission constraints that could significantly impact reliability. One
transmission project was noted to have permitting delays, but the delays are not expected to impact reliability. Sufficient
transmission is being built to support its Future‐Planned generation. During the assessment period, several significant
transformers are also planned to be upgraded.
MRO‐MAPP‐Table 8: Existing and Projected Transmission MRO‐MAPP AC (Circuit Miles) DC (Circuit Miles) Total (Circuit Miles)
EXISTING 10,266 0 10,266
Currently Under Construction 230 0 230 Planned ‐ Completed within First Five Years 716 0 716 Planned ‐ Completed within Second Five Years 0 0 0
2022 TOTAL (UNDER CONSTRUCTION & PLANNED) 11,211 0 11,211
Conceptual ‐ Completed within First Five Years 107 0 107 Conceptual ‐ Completed within Second Five Years 0 0 0
2022 TOTAL (UNDER CONSTRUCTION, PLANNED & CONCEPTUAL) 11,318 0 11,318
Vulnerability Assessment With MAPP’s current generation capacity margin and average to high water levels, there are no resource adequacy or
operational concerns. Renewable Portfolio Standards (RPS) are not projected to impact reliability in the assessment period.
There are no expectations to install additional Under‐Voltage Load Shedding (UVLS) schemes in MAPP. MAPP does not have
a regional UVLS requirement. Although Special Protection Systems or Remedial Action Schemes are sometimes utilized in
MAPP, none are projected to be installed in lieu of planned bulk power transmission facilities.
MAPP relies on the Balancing Authorities to plan for catastrophic/hi‐impact, low‐frequency (HILF) events. Currently, there is
no regional plan in place.
MAPP and MAPP members continue to research new technologies and tools to improve BPS reliability (e.g., smart grids or
FACTS). There is no timeline on deploying new technologies or smart grid programs during the assessment period.

MRO‐MAPP
NERC | 2012 Long‐Term Reliability Assessment | November 2012
Page 126 of 335
MAPP and MAPP Members continue to work with the MRO and its Subject Matter Expert (SME) teams and their application
guides for protection and control to reduce the amount of relay protection misoperations.
The pending future environmental regulations may have an impact on reliability in the MAPP Assessment Area. However,
the extent of the reliability impact on the MAPP Assessment Area is unknown until all impacted Generator Owners have
announced their plans for compliance with the EPA regulation. MAPP continues both internally and in collaboration with
stakeholders to maximize preparedness for the impact of this and other regulations.
Plans for Accommodating Generator Retirements and Environmental Control Retrofits
MAPP generators report that they are in compliance with current EPA regulations and Existing Units will be in compliance
by the required dates for newly finalized EPA regulations. A few smaller IC units have been retired due to the new
regulations, since it would have been cost prohibitive to retrofit the units to meet the regulations.
Generally, MAPP generators are already in compliance or plan to be so by the effective date of EPA regulations. One
member reports, emission control technologies have been recently installed and mercury control technology will be
optimized 4th quarter 2012 to determine if additional controls will be needed.
One MAPP member has reported it already made the required preparations for integrating its future generation additions.
All physical onsite preps have been completed and the permitting and licensing requirements are in process.
MPC reports, the completion of a new 345 kV transmission line at the end of 2013 will allow additional energy from a
compliant unit to be brought into Minnkota’s service area.
As stated, HUC has retired old generation and new generation is being installed currently.
Heartland has sufficient resource to meet all of its demand and planning margin requirements for the foreseeable future.
No new resources, supply or demand side, are planned at this time.
WAPA reports there are plans to uprate the Fort Randall units, which would result in a 28% increase in capacity/unit.
However at this time it is unfunded.
Minnkota reports its units are in compliance (earlier than the required date), and is not aware of the need for the
assessment.
HUC has done its own internal assessment as to the reliability impact of the new environmental regulations and the current
generation plan is the result of that assessment. HUC will perform its own assessments if necessary. Any/all plans are
discussed through coordinated meetings with HUC’s balancing authority (GRE) prior to implementation.
Standing and Emerging Reliability Issues Integration of Variable Resources – Planning Perspective
One of the emerging issues within MAPP is the integration of variable resources, such as wind turbines. Many states in
MAPP have a renewable energy mandate or goal. It is expected that the primary source of new renewable energy will come
from intermittent resources, including wind. The integration of intermittent resources presents new challenges in the
Region. The integration does not cause undo reliability issues on its own, but it does change the nature of how the BPS is
operated.
As the amount of wind resources increases, its contribution to resource adequacy will also increase. This may introduce
additional uncertainty in maintaining system reliability. New wind resources will have an impact on the transmission system
and may increase the potential for congestion on the system. Intermittent resources also have an impact on the operation
of the system generation fleet as resources will need to be dedicated into meeting the potential ramp and minimum
generation issues that could occur.
MRO‐MAPP
NERC | 2012 Long‐Term Reliability Assessment | November 2012
Page 127 of 335
Currently, wind development is focused around meeting the existing state renewable energy mandates. However, resource
adequacy may become a concern if additional regulations or rules (clean energy standards, carbon reduction) are
implemented. Additionally, economic factors may increase the amount of intermittent resources found on the system, such
as higher gas prices or lower construction costs for the intermittent resources.
Transmission In‐Service Dates
Another emerging issue that impacts MAPP as well as other Assessment Areas is the complex process for getting
transmission projects built. Transmission projects that do not get built, or get delayed, may impact reliability through
congestion on the existing BES. This could impact the amount of transmission loading relief (TLR) used. Currently, this issue
is not impacting resource adequacy as reported through the LTRA. A Loss of Load Expectation (LOLE) study may reveal
constrained interfaces within MAPP. Siting and permitting issues could be barriers to transmission in‐service dates, which
may constrain the existing BES and affect real‐time operations.

MRO‐SaskPower
NERC | 2012 Long‐Term Reliability Assessment | November 2012
Page 128 of 335
MRO-SaskPower Planning Reserve Margins Saskatchewan is projecting adequate Planning Reserve Margins based on Expected Unserved Energy (EUE) analysis.
Saskatchewan’s criteria for adding new generation resources are also based on EUE. Saskatchewan performs an annual
probabilistic analysis to determine the requirement for adding new generation resources. The probabilistic EUE value
equates to an approximate 11 to 18 percent reserve margin based on the deterministic calculation (MRO‐SaskPower‐Table
1 and MRO‐SaskPower‐Figure 1). When evaluating system requirements for new generation, SaskPower utilizes a most
likely load forecast accounting for load risk to project demand requirements. This is not based on a 50/50 probability. For
the purpose of this study, utilization of a less conservative 50/50 load forecast probability would result in higher reserve
margins ranging from approximately 16 to 23 percent. Furthermore, for the purpose of this assessment, the NERC
Reference Margin Level is 11 percent (lower end of probabilistic EUE range) throughout the assessment period.
Saskatchewan has planned for adequate resources to meet anticipated load throughout the assessment period.
MRO‐SaskPower‐Table 1: Planning Reserve Margins SaskPower‐Summer 2013 2014 2015 2016 2017 2018 2019 2020 2021 2022
ANTICIPATED 13.93% 12.79% 11.51% 15.22% 18.02% 18.41% 16.89% 15.29% 16.11% 17.10% PROSPECTIVE 13.93% 12.79% 11.51% 15.22% 18.02% 18.41% 16.89% 15.29% 16.11% 17.10% ADJUSTED POTENTIAL 13.93% 12.79% 11.51% 15.22% 18.02% 18.41% 16.89% 15.29% 16.11% 17.10%
NERC REFERENCE ‐ 11.00% 11.00% 11.00% 11.00% 11.00% 11.00% 11.00% 11.00% 11.00% 11.00%
SaskPower‐Winter 2013/14 2014/15 2015/16 2016/17 2017/18 2018/19 2019/20 2020/21 2021/22 2022/23
ANTICIPATED 15.24% 11.33% 13.43% 11.68% 15.57% 15.97% 14.47% 12.91% 13.90% 14.93% PROSPECTIVE 15.24% 11.33% 13.43% 11.68% 15.57% 15.97% 14.47% 12.91% 13.90% 14.93% ADJUSTED POTENTIAL 15.24% 11.33% 13.43% 11.68% 15.57% 15.97% 14.47% 12.91% 13.90% 14.93%
NERC REFERENCE ‐ 11.00% 11.00% 11.00% 11.00% 11.00% 11.00% 11.00% 11.00% 11.00% 11.00%
MRO‐SaskPower‐Figure 1: Summer (Left) and Winter194 (Right) Planning Reserve Margins
Saskatchewan does not anticipate any challenges that would lead to significant detractions of its Planning Reserve Margin
projections. Greenhouse gas regulations are expected to become an issue as specific federal and provincial regulations are
introduced and clarified. The consequence of such regulations is expected to have a low impact on reliability, because it is
anticipated that enough lead time will be given to allow for appropriate mitigation.
Demand The forecasted compound annual growth rates (CAGR) Total Internal Demand is 2.12 percent for the summer and 2.04
percent for the winter during the 10‐year outlook (MRO‐SaskPower‐Table 2).
194
Each year represents the initial year of the winter season. For example: 2013 represents the 2013/2014 winter season.
0%
5%
10%
15%
20%
2013 2014 2015 2016 2017 2018 2019 2020 2021 2022
0%
5%
10%
15%
20%
2013 2014 2015 2016 2017 2018 2019 2020 2021 2022

MRO‐SaskPower
NERC | 2012 Long‐Term Reliability Assessment | November 2012
Page 129 of 335
MRO‐SaskPower‐Table 2: Demand Outlook MRO‐SaskPower‐Summer 2013 2022 10‐Year Change CAGR
NET INTERNAL DEMAND 3,184 3,847 663 20.8% 2.12%
Load‐Modifying Demand Response 91 91 0 0.0% 0.00%
TOTAL INTERNAL DEMAND 3,275 3,938 663 20.2% 2.07%
MRO‐SaskPower‐Winter 2013/14 2022/23 10‐Year Change CAGR
NET INTERNAL DEMAND 3,580 4,310 730 20.4% 2.08%
Load‐Modifying Demand Response 91 91 0 0.0% 0.00%
TOTAL INTERNAL DEMAND 3,671 4,401 730 19.9% 2.04%
Saskatchewan does not anticipate any significant forecast changes. An upswing in the economy could lead to an increase in
electricity usage and cause a spike to the overall demand. Saskatchewan has plans in place to meet resource reliability
requirements should a sudden economic change cause a need for new capacity. There were no changes or enhancements
made to the forecasting methods used by SaskPower. Load growth is due primarily to economic growth in the industrial
sector.
Demand-Side Management It is expected that 150 MW of Demand Response and Energy Efficiency/Conservation will be available during the first year
of the assessment. It is expected that 253 MW of Demand Response and Energy Efficiency/Conservation will be available
during the tenth year of the assessment. Approximately 10 MW of additional Energy Efficiency/Conservation is expected to
be available each year throughout the assessment period (MRO‐SaskPower‐Table 3).
MRO‐SaskPower‐Table 3: Demand‐Side Management Short‐Term
2022/23 Share of Total Internal Demand
MRO‐SaskPower‐Winter 2013/14 2014/15 2015/16 2022/23 10‐Year Change
Direct Control Load Management (DCLM) 0 0 0 0 0 0.00% Contractually Interruptible (Curtailable) 91 91 91 91 0 2.07% Critical Peak‐Pricing (CPP) with Control 0 0 0 0 0 0.00% Load as a Capacity Resource 0 0 0 0 0 0.00%
TOTAL LOAD‐MODIFYING DEMAND RESPONSE 91 91 91 91 0 2.07%
TOTAL ENERGY EFFICIENCY 0 0 0 0 0 0.00%
TOTAL DEMAND‐SIDE MANAGEMENT 91 91 91 91 0 2.07%
Saskatchewan considers Demand Response to be a capacity resource used for peak shaving. The primary driver for DSM
programs in Saskatchewan is the economic incentive (difference in cost between providing the DSM program and the cost
of serving the load). Increases in DSM will come from growth of existing programs.
There are no new Demand Response programs or Ancillary Services being incorporated for the assessment period.
Generation The primary sources of fuel in Saskatchewan are coal, hydro, and natural gas. Since 2011, 89 MW of natural gas generation
has been added in Saskatchewan. Throughout the assessment period, a total nameplate capacity of 1,742 MW of Future‐
Planned resources are projected to come on‐line (365 MW of refurbished coal, 1,034 MW of gas, 230 MW (nameplate)
wind, 106 MW of biomass resources), and about 7 MW of additional hydro resources. Saskatchewan manages unit
retirements within its resource planning process so that there are no reliability issues related to unit retirements during the
assessment period. Unit retirements (coal) during the assessment period include 62 MW in 2013 and 61 MW in 2015 (MRO‐
SaskPower‐Table 3 and MRO‐SaskPower‐Figure 2).

MRO‐SaskPower
NERC | 2012 Long‐Term Reliability Assessment | November 2012
Page 130 of 335
MRO‐SaskPower‐Table 4: Capacity Outlook195 Current 2022/23 Planned 2022/23 Planned & Conceptual
MRO‐SaskPower‐Winter Capacity Share Capacity Share Change Capacity Share Change
Coal 1,671 42.4% 1,496 30.2% ‐175 1,496 30.2% ‐175 Petroleum 0 0.0% 0 0.0% 0 0 0.0% 0 Gas 1,361 34.6% 2,395 48.3% 1,034 2,395 48.3% 1,034 Nuclear 0 0.0% 0 0.0% 0 0 0.0% 0 Other/Unknown 0 0.0% 0 0.0% 0 0 0.0% 0 Renewables 907 23.0% 1,066 21.5% 159 1,066 21.5% 159
TOTAL 3,939 100.0% 4,957 100.0% 1,018 4,957 100.0% 1,018
MRO‐SaskPower‐Figure 2: Winter Net Capacity Change196
By the final year of the assessment period, about 86 MW (out of 428 MW nameplate capacity) of wind is expected to be
available to meet the winter peak, which is over twice the 2013 amount. During the next ten years, 106 MW of biomass is
also expected to be added.
MRO‐SaskPower‐Table 5: Renewable Capacity Outlook197 Current 2022/23 Planned 2022/23 Planned & Conceptual
MRO‐SaskPower‐Winter Capacity Share Capacity Share Change Capacity Share Change
Hydro 857 94.5% 864 81.1% 7 864 81.1% 7 Pumped Storage 0 0.0% 0 0.0% 0 0 0.0% 0 Geothermal 0 0.0% 0 0.0% 0 0 0.0% 0 Wind 40 4.4% 86 8.0% 46 86 8.0% 46 Biomass 10 1.1% 116 10.9% 106 116 10.9% 106 Solar 0 0.0% 0 0.0% 0 0 0.0% 0
TOTAL 907 100.0% 1,066 100.0% 159 1,066 100.0% 159
MRO‐SaskPower‐Figure3: Winter Net Renewable Capacity Change198
195 “Current” represents Existing‐Certain and Future‐Planned projections for the 2012 summer (for summer‐peaking assessment areas) or 2012/2013 winter (for winter‐peaking
assessment areas). “Share” represents the share (percent) of total Existing‐Certain and Future‐Planned capacity projected for the peak season. 196
Each year represents the initial year of the winter season. For example: 2013 represents the 2013/2014 winter season. 197 Ibid. 198
Ibid.
‐400
‐200
0
200
400
600
800
1,000
1,200
2013 2014 2015 2016 2017 2018 2019 2020 2021 2022
MW
0
25
50
75
100
125
150
175
2013 2014 2015 2016 2017 2018 2019 2020 2021 2022
MW

MRO‐SaskPower
NERC | 2012 Long‐Term Reliability Assessment | November 2012
Page 131 of 335
For the assessment period, Saskatchewan plans for 10 percent of wind nameplate capacity to be available to meet summer
peak demand and 20 percent of wind nameplate capacity to be available to meet winter peak demand. The wind available
to meet peak requirements is based on the historical actual wind generation over a four‐hour period during the peak for
each day. On‐peak expected values for hydro assume nameplate net generation less expected seasonal derates due to
water conditions. Saskatchewan plans for 100 percent of biomass nameplate capacity to be available to meet demand
based on a base‐load contract. Operational procedures for the assessment period will not be impacted because of
integrating variable resources (MRO‐SaskPower‐Table 6).
MRO‐SaskPower‐Table 6: Variable Generation Current 2022/23 Planned
MRO‐SaskPower‐Winter Wind Solar Hydro Biomass Wind Solar Hydro Biomass
Installed Capacity 198 0 860 10 428 0 867 186 On‐Peak Derate 158 0 2 0 342 0 2 70
EXPECTED ON‐PEAK OUTPUT 40 0 857 10 86 0 864 116
Capacity Transactions Saskatchewan does not anticipate any Firm imports or exports for the assessment period. Saskatchewan does not rely on
emergency imports to meet its demand.
Transmission Major projects expected to be completed in the MRO‐SaskPower Assessment Area during the long‐term outlook for this
assessment are listed in Appendix II and summarized below (MRO‐SaskPower‐Table7). Additional details and descriptions of
particular projects needed to meet transmission adequacy and load growth in the area are included below.
MRO‐SaskPower‐Table 7: Existing and Projected Transmission NPCC‐Maritimes AC (Circuit Miles) DC (Circuit Miles) Total (Circuit Miles)
EXISTING 5,082 0 5,082
Currently Under Construction 0 0 0 Planned ‐ Completed within First Five Years 13 0 13 Planned ‐ Completed within Second Five Years 0 0 0
2022 TOTAL (UNDER CONSTRUCTION & PLANNED) 5,095 0 5,095
Conceptual ‐ Completed within First Five Years 203 0 203 Conceptual ‐ Completed within Second Five Years 50 0 50
2022 TOTAL (UNDER CONSTRUCTION, PLANNED & CONCEPTUAL) 5,348 0 5,348
Autotransformer Additions
Planned addition of two 230‐138 kV autotransformers in the Tantallon Area (eastern Saskatchewan) in late 2012 and
2013.
The existing 230‐138 kV autotransformer in the Tantallon Area will be moved to the Peebles area (eastern
Saskatchewan).
Planned addition of two 230‐138 kV autotransformers in the Fleet Street Area (southeastern Saskatchewan) in late
2012 and 2013.
The existing 230‐138 kV autotransformer in the Fleet Street Area will be moved to the Kennedy Area (eastern
Saskatchewan).
Planned addition of two 230‐138 kV autotransformers in the Boundary Dam Area (southeastern Saskatchewan) in late
2013 and 2014.
The existing 230‐138 kV autotransformer in the Boundary Dam Area will be utilized as a system spare or moved to
another location in Saskatchewan.
Conceptual addition of 230‐138 kV autotransformers in the Condie, Regina, Moose Jaw, North Battleford, Wolverine,
and Lloydminster Areas (dispersed in Saskatchewan) in late 2016.
Transmission Line Additions
Planned addition of a 40 km 230 kV transmission line in the Saskatoon‐Martinsville Area (central Saskatchewan) in late
2013.

MRO‐SaskPower
NERC | 2012 Long‐Term Reliability Assessment | November 2012
Page 132 of 335
Planned addition of a 110 km 230 kV transmission line in the Saskatoon‐Wolverine Area (central Saskatchewan) in late
2013.
Planned addition of 50 km of 138 kV transmission line and salvage of 65 km of 138 kV line in the Elstow‐Wolverine
Area (central Saskatchewan) in late 2013.
Planned addition of a 225 km 230 kV transmission line in the Moose Jaw‐Swift Current Area (central Saskatchewan) in
late 2016.
Planned addition of 225 km of 138 kV transmission line and salvage of 200 km of 138 kV line in the Moose Jaw‐Swift
Current Area (central Saskatchewan) in late 2016.
Planned addition of a 135 km 230 kV transmission line in the Peebles‐Tantallon Area (eastern Saskatchewan) in late
2013.
Conceptual addition of a 160 km 230 kV transmission line in the Beatty‐Wolverine Area (north‐central Saskatchewan)
in late 2016.
Conceptual addition of a 70 km 230 kV transmission line in Condie‐Pasqua Area (south‐central Saskatchewan) in late
2016.
Conceptual addition of a 130 km 230 kV transmission line in North Battleford‐Saskatoon Area (south‐central
Saskatchewan) in late 2016.
At this time, there are no confirmed delays for targeted in‐service dates for planned projects, and there are no major
concerns with temporary service outages for any existing line or transformer facilities. For planned and emergency outages,
further detailed study work is performed and temporary operating guides are issued as required.
Sufficient transmission lines are being constructed to support the Future‐Planned resources that are projected to come on‐
line during the assessment period. Saskatchewan is planning for the addition of a Static Var System (SVS) in the Swift
Current Area (southwestern Saskatchewan) in late 2013.
Vulnerability Assessment Saskatchewan has no resource adequacy or operational concerns during the assessment period. Currently there are plans
to install one UVLS scheme in the Tantallon Area in late 2012. This scheme is being installed to mitigate potential low
voltages under certain generation dispatch scenarios caused by an N‐1 outage (until planned transmission reinforcement in
2015 is in place) and a few N‐2 outages. These outages are in the southeastern portion of the province. The planned UVLS
scheme targets approximately 40 MVA of load to be shed. This equates to approximately 1 percent of the projected total
Saskatchewan 2013 winter peak load. The planned UVLS scheme does not influence this reliability assessment as it is being
implemented to mitigate potential local area post‐contingency voltage concerns. A new 230 kV transmission line is planned
in the Tantallon Area that will reinforce the Tantallon Area voltage. This line has a projected in‐service date of mid‐2015.
The UVLS scheme may then be used to mitigate potential low voltages for N‐1‐1 and N‐2 outages under certain generation
dispatch scenarios.
Special Protection Systems in Saskatchewan are typically implemented on a temporary basis until transmission facilities can
be added. The following Special Protection Systems are planned in Saskatchewan to address N‐2 outages of 230 kV double
circuits:
230 kV double circuit between the Boundary Dam and Regina Areas.
Planned in‐service date of 2014
This scheme is intended to be temporary until 2015, when planned generation unit retirements and projected
industrial load growth in the southeastern portion of the province materializes.
230 kV double circuits in the Nipawin Area.
Planned in‐service date of 2014.
Permanent for the assessment period.

MRO‐SaskPower
NERC | 2012 Long‐Term Reliability Assessment | November 2012
Page 133 of 335
230 kV double circuit between the Saskatoon and Beatty Areas.
Planned in‐service date of 2015.
This scheme is intended to be temporary until 2016, when the Conceptual Beatty to Wolverine 230 kV line is in
service.
Saskatchewan has emergency preparedness plans as mandated by provincial and federal requirements to address
catastrophic events in general. Saskatchewan does not specifically plan its system for high‐impact, low‐frequency events,
but assessments may be done on as‐needed basis, taking into account the reliability benefit versus cost. In general, the
Saskatchewan BES is designed to be fail‐safe for most types of contingencies and to be restored as soon as possible.
However, operation of the Saskatchewan system would be performed on a best‐efforts basis under the types of
catastrophic emergency conditions provided as examples. Resources would be offset by planning reserves and external
markets as much as possible. If necessary, operational measures would include interruptible load contracts, public appeals,
and rotating outages.
Earthquakes and hurricanes are historically not a concern for Saskatchewan. Fuel disruptions are minimized as much as
possible by historical system design practices, and Saskatchewan has a diverse energy mix of resources. Coal resources have
Firm contracts and are adjacent to generating facilities, and stockpiles are maintained at each facility in the event that mine
operations are unable to meet the required demand of the generating facility. Natural gas resources have Firm
transportation contracts with large natural gas storage facilities located within the province backing those contracts up.
Coordination meetings between the electric system and the natural gas transportation system are held to discuss
operational and planning issues. These meetings enable both systems to be informed of any issues relating to security of
supply for natural gas transportation. Hydro facilities/reservoirs are fully controlled by Saskatchewan, and long‐term
hydrological conditions are monitored. Geomagnetic induced currents have historically not been a problem for
Saskatchewan. Loss of a major import path has not historically been a concern for Saskatchewan, as it typically does not
rely on imports to serve load.
Saskatchewan evaluates new technologies as they become available and uses them if economical. Saskatchewan does not
have any significant smart grid programs that affect the BES. Current efforts are primarily focused on the distribution
system. Protection systems are maintained and tested on an on‐going basis, and misoperations are evaluated for lessons
learned.
No environmental or regulatory restrictions have been identified at this time that could potentially impact reliability in
Saskatchewan for the assessment period. Greenhouse gas regulations are expected to become an issue as specific
regulations are introduced and clarified. The consequence of such regulations is expected to have a low impact on
reliability, because it is anticipated that enough lead time will be given to allow for appropriate mitigation.
Plans for Accommodating Generator Retirements and Environmental Control Retrofits
Currently there are no greenhouse gas emission programs or criteria for Saskatchewan. For the assessment period,
Saskatchewan has plans to retire five coal‐fired generating units. Up to three of the units will be replaced by clean coal
generating units. Studies have been performed based on possible greenhouse gas regulations. Analysis to support decision‐
making will conducted once the regulations are known. Ultimately, no potential reliability impacts or improvements that
would arise on the Saskatchewan system have been identified due to the recent US environmental regulatory
requirements.
Standing and Emerging Reliability Issues Greenhouse gas regulation is expected to become an issue in the short‐term (one‐ to five‐year period) as specific
regulations are introduced and clarified. The consequence of such regulations is expected to have a low impact on
reliability, because it is anticipated that enough lead time will be given to allow for appropriate mitigation. Saskatchewan
currently relies, in part, on greenhouse gas emitting generation sources such as coal and natural gas. The potential impact

MRO‐SaskPower
NERC | 2012 Long‐Term Reliability Assessment | November 2012
Page 134 of 335
of greenhouse gas regulations would be to reduce Saskatchewan’s ability to rely on carbon‐emitting fuel sources for future
generation requirements. Saskatchewan has developed future scenario plans to deal with anticipated greenhouse gas
emissions regulations. Saskatchewan has not yet experienced any reliability issues related to greenhouse gas regulations
and is expected to effectively mitigate any future reliability issues related to greenhouse gas regulations. Mitigation will
either be reducing greenhouse emissions or replacement of generation.

NPCC‐Maritimes
NERC | 2012 Long‐Term Reliability Assessment | November 2012
Page 135 of 335
NPCC-Maritimes Planning Reserve Margins The NERC Reference Margin Level for the Maritimes Assessment Area is 20 percent throughout the assessment period
(NPCC‐Maritimes‐Table 1 and MRO‐Maritimes Figure 1).
NPCC‐Maritimes‐Table 1: Planning Reserve Margins – NPCC‐Maritimes NPCC‐Maritimes‐Summer 2013 2014 2015 2016 2017 2018 2019 2020 2021 2022
ANTICIPATED 112.5% 110.6% 109.8% 110.3% 110.1% 109.6% 108.8% 107.3% 106.5% 106.0% PROSPECTIVE 112.5% 110.6% 109.8% 110.3% 110.1% 109.6% 108.8% 107.3% 106.5% 106.0% ADJUSTED POTENTIAL 112.5% 110.6% 109.8% 110.3% 110.1% 109.6% 108.8% 107.3% 106.5% 106.0%
NERC REFERENCE ‐ 20.00% 20.00% 20.00% 20.00% 20.00% 20.00% 20.00% 20.00% 20.00% 20.00%
NPCC‐Maritimes‐Winter 2013/14 2014/15 2015/16 2016/17 2017/18 2018/19 2019/20 2020/21 2021/22 2022/23
ANTICIPATED 33.1% 33.4% 32.3% 31.9% 31.6% 31.3% 31.2% 30.8% 30.3% 29.8% PROSPECTIVE 33.1% 33.4% 32.3% 31.9% 31.6% 31.3% 31.2% 30.8% 30.3% 29.8% ADJUSTED POTENTIAL 33.1% 33.4% 32.3% 31.9% 31.6% 31.3% 31.2% 30.8% 30.3% 29.8%
NERC REFERENCE ‐ 20.00% 20.00% 20.00% 20.00% 20.00% 20.00% 20.00% 20.00% 20.00% 20.00%
NPCC‐Maritimes‐Figure 1: Summer (Left) and Winter199 (Right) Planning Reserve Margins
Renewable portfolio standards in the area led to the construction of the existing generation mix. Peak demands in the area
have declined from historic highs and combined with the addition of generation resources associated with renewable
portfolio standards. All Planning Reserve Margins exceed the NERC Reference Margin Level for the duration of the
assessment period.
Demand The forecast CAGR for peak demand is 0.25 and 0.27 percent for the summer and winter seasons, respectively (NPCC‐
Maritimes‐Table 2). This indicates that aggregated growth will be effectively offset by the sum of any DSM projections or
load losses included in the sub‐area forecasts.
NPCC‐Maritimes‐Table 2: Demand Outlook NPCC‐Maritimes‐Summer 2013 2022 10‐Year Change CAGR
NET INTERNAL DEMAND 3,104 3,183 79 2.5% 0.28%
Load‐Modifying Demand Response 331 331 0 0.0% 0.00%
TOTAL INTERNAL DEMAND 3,435 3,514 79 2.3% 0.25%
NPCC‐Maritimes‐Winter 2013/14 2022/23 10‐Year Change CAGR
NET INTERNAL DEMAND 5,169 5,285 116 2.2% 0.25%
Load‐Modifying Demand Response 252 267 15 6.0% 0.64%
TOTAL INTERNAL DEMAND 5,421 5,552 131 2.4% 0.27%
Load growth in the southeastern corner of New Brunswick, though not specifically identified in the load projections, has
outpaced the rest of the assessment area.
Demand-Side Management Current and projected Energy Efficiency effects are incorporated directly into the load forecast, while Demand Response is
counted as a load modifier. Moreover, Demand Response is not used for peak shaving. It is used to reduce demand during
199
Each year represents the initial year of the winter season. For example: 2013 represents the 2013/2014 winter season.
0%
20%
40%
60%
80%
100%
120%
2013 2014 2015 2016 2017 2018 2019 2020 2021 2022
0%
10%
20%
30%
40%
2013 2014 2015 2016 2017 2018 2019 2020 2021 2022

NPCC‐Maritimes
NERC | 2012 Long‐Term Reliability Assessment | November 2012
Page 136 of 335
emergencies and is not backed by capacity reserves. Contractually interruptible (curtailable) Demand Response is projected
to account for 252 MW in 2013, increasing to 267 MW in 2022 (NPCC‐Maritimes‐Table 3).
NPCC‐Maritimes‐Table 3: Demand‐Side Management Short‐Term
2022/23 Share of Total Internal Demand
NPCC‐Maritimes‐Winter 2013/14 2014/15 2015/16 2022/23 10‐Year Change
Direct Control Load Management (DCLM) 0 0 0 0 0 0.00% Contractually Interruptible (Curtailable) 252 254 254 267 15 7.60% Critical Peak‐Pricing (CPP) with Control 0 0 0 0 0 0.00% Load as a Capacity Resource 0 0 0 0 0 0.00%
TOTAL LOAD‐MODIFYING DEMAND RESPONSE 252 254 254 267 15 7.60%
TOTAL ENERGY EFFICIENCY 0 0 0 0 0 0.00%
TOTAL DEMAND‐SIDE MANAGEMENT 252 254 254 267 15 7.60%
Jurisdictions within the Maritimes Area have established Energy Efficiency corporations or government agencies whose
mandate is to provide sustainable Energy Efficiency and conservation solutions to customers. Policy drivers include
maintaining affordable electricity prices for customers and lessening the impact of energy use on the environment.
Additionally, a pilot program called PowerShift Atlantic is developing the capability to utilize load control for Ancillary
Services. Launched in 2010 as part of the Clean Energy Fund, PowerShift Atlantic is a collaborative research project led in
partnership by New Brunswick Power, Saint John Energy, Maritime Electric, Nova Scotia Power, New Brunswick System
Operator, the University of New Brunswick, Natural Resources Canada, the Government of New Brunswick and the
Government of Prince Edward Island. This four‐year, innovative program will run until 2014, piloting technology that shifts
energy supply to specific appliances in homes and commercial buildings in order to optimize wind generation with minimal
or no disruption to participating electric utility customers.
Generation The primary sources of fuel in the Maritimes Assessment Area are oil and coal, followed by hydro, natural gas, and nuclear.
Other capacity sources include wind and biomass (NPCC‐Maritimes‐Table 4 and NPCC‐Maritimes‐Figure 2).
NPCC‐Maritimes‐Table 4: Capacity Outlook200 Current 2022/23 Planned 2022/23 Planned & Conceptual
NPCC‐Maritimes‐Winter Capacity Share Capacity Share Change Capacity Share Change
Coal 1,714 25.0% 1,408 21.0% ‐306 1,408 21.0% ‐306 Petroleum 1,857 27.1% 1,892 28.2% 35 1,892 28.2% 35 Gas 829 12.1% 829 12.4% 0 829 12.4% 0 Nuclear 660 9.6% 660 9.8% 0 660 9.8% 0 Other/Unknown 0 0.0% 0 0.0% 0 0 0.0% 0 Renewables 1,796 26.2% 1,917 28.6% 121 1,917 28.6% 121
TOTAL 6,856 100.0% 6,706 100.0% ‐149 6,706 100.0% ‐149
NPCC‐Maritimes‐Table 4: Winter Net Capacity Change201
200 “Current” represents Existing‐Certain and Future‐Planned projections for the 2012 summer (for summer‐peaking assessment areas) or 2012/2013 winter (for winter‐peaking
assessment areas). “Share” represents the share (percent) of total Existing‐Certain and Future‐Planned capacity projected for the peak season. 201
Each year represents the initial year of the winter season. For example: 2013 represents the 2013/2014 winter season.
‐400
‐200
0
200
400
600
800
1,000
2013 2014 2015 2016 2017 2018 2019 2020 2021 2022
MW

NPCC‐Maritimes
NERC | 2012 Long‐Term Reliability Assessment | November 2012
Page 137 of 335
Since 2011, 49 MW of Existing‐Certain capacity fueled by existing natural gas units in combined‐cycle mode was added at
Nova Scotia’s Tufts Cove plant. Another 40 MW of wind generation capacity derated to 14 MW of Existing‐Certain capacity
was installed at two sites.
The return to service of the 660 MW Point Lepreau Nuclear Generating Station was a major Future‐Planned capacity
addition during 2012. There are no Conceptual projects planned during this assessment period. The retirement of the 299
MW oil‐fired Dalhousie Plant in New Brunswick is scheduled for May 31, 2012. This retirement justifies the addition of a 345
kV breaker at the Belledune 345 kV terminal and reconfiguration of the Eel River 230 kV terminal. From a resource
adequacy perspective, the reliability impact of this capacity reduction is more than offset by the return to service of the 660
MW Point Lepreau Nuclear Generating Station, expected to occur by October 1, 2012.
The refurbishment of the Point Lepreau Nuclear Generating Station will result in a 25 MW uprate of the plant’s net capacity.
This small uprate has no significant long‐term reliability impact.
The return to service of the 660 MW Point Lepreau plant will more than offset the capacity loss associated with the
retirement of the Dalhousie Plant. The impact of the retirement of Nova Scotia’s Lingan generators in 2015 and 2018 is
expected to be offset by installation of wind and biomass units and an expected purchase from Nalcor, a Newfoundland and
Labrador utility.
There are no significant increases in distributed generation identified in the Maritimes Area except in Nova Scotia. Existing
distributed resources are netted against load and not counted as capacity.
The Maritimes Assessment Area has no non‐traditional (e.g., storage, flywheels, batteries) resources. Wind projects
included with capacities modeled in resource adequacy calculations for New Brunswick and northern Maine (40 percent of
nominal capacity during the winter peak period) are based on results from the September 2005 NBSO report “Maritimes
Wind Integration Study.”202 This report showed that the effective capacity from wind projects and their contribution to Loss
of Load Expectation (LOLE) was equal to or better than their seasonal capacity factors. The NPCC Maritimes Area “2010
Comprehensive Review of Resource Adequacy”203 indicated that the area can achieve less than the target maximum of 0.1
days per year of LOLE, even with zero wind installed, while still exceeding its 20 percent NERC Reference Reserve Margin.
Renewable capacity for the Maritimes Assessment Area is shown below (NPCC‐Maritimes‐Table 5 and NPCC‐Maritimes‐
Figure 2)
202 http://www.nbso.ca/Public/_private/2005 Percent20Maritime Percent20Wind Percent20Integration Percent20Study Percent20_Final_.pdf. 203 https://www.npcc.org/Library/Resource Percent20Adequacy/Forms/Public Percent20List.aspx.

NPCC‐Maritimes
NERC | 2012 Long‐Term Reliability Assessment | November 2012
Page 138 of 335
NPCC‐Maritimes‐Table 5: Renewable Capacity Outlook204 Current 2022 Planned 2022 Planned & Conceptual
NPCC‐Maritimes‐Winter Capacity Share Capacity Share Change Capacity Share Change
Hydro 1,337 74.4% 1,341 69.9% 4 1,341 69.9% 4 Pumped Storage 0 0.0% 0 0.0% 0 0 0.0% 0 Geothermal 0 0.0% 0 0.0% 0 0 0.0% 0 Wind 318 17.7% 372 19.4% 54 372 19.4% 54 Biomass 141 7.9% 204 10.7% 63 204 10.7% 63 Solar 0 0.0% 0 0.0% 0 0 0.0% 0
TOTAL 1,796 100.0% 1,917 100.0% 121 1,917 100.0% 121
NPCC‐Maritimes‐Figure 2: Winter Net Renewable Capacity Change205
The Maritimes Assessment Area projects no solar power installations. With very few small exceptions, hydro and biomass
generators are not derated during peak periods.
Currently, wind generators are accredited with on‐peak capacity, based on observed or expected seasonally adjusted
capacity factors. Hydro and biomass units are expected to be fully available during peak periods, and on‐peak capacity is
equal to their demonstrated unit capability (NPCC‐Maritimes‐Table 6). The Maritimes Area is currently reviewing and
assessing previously used methods for attributing on‐peak wind capacity.
NPCC‐Maritimes‐Table 6: Renewable Capacity Outlook: On‐Peak Vs. Installed Current 2022/23 Planned
NPCC‐Maritimes‐Winter Wind Solar Hydro Biomass Wind Solar Hydro Biomass
Installed Capacity 816 0 1,339 148 964 0 1,343 211 On‐Peak Derate 498 0 2 7 592 0 2 7
EXPECTED ON‐PEAK OUTPUT 318 0 1,337 141 372 0 1,341 204
Plans are underway for the individual jurisdictions within the Maritimes Assessment Area to coordinate the sharing of wind
data and possibly wind forecasting information and services. With the integration of more variable resources, it may
become necessary to curtail these generation levels at light load periods to ensure adequate levels of spinning reserves and
inertia for frequency control. The grid codes in the area require the ability to curtail to be designed into the control systems
for large‐scale variable resources and available for system operators to dispatch accordingly.
Capacity Transactions The Maritimes Assessment Area has included Firm imports, which are projected to begin in 2018, from the Newfoundland
utility Nalcor (NPCC‐Maritimes‐Table 7). In 2018, development of the Muskrat Falls Generation Project in the Canadian
province of Newfoundland and Labrador includes the installation of a High Voltage Direct Current (HVdc) undersea cable
link (Maritime Link).
204 “Current” represents Existing‐Certain and Future‐Planned projections for the 2012 summer (for summer‐peaking assessment areas) or 2012/2013 winter (for winter‐peaking
assessment areas). “Share” represents the share (percent) of total Existing‐Certain and Future‐Planned capacity projected for the peak season. 205
Years represent initial year for each winter season. For example: 2013 represents the 2013/2014 winter season.
0
25
50
75
100
125
2013 2014 2015 2016 2017 2018 2019 2020 2021 2022
MW
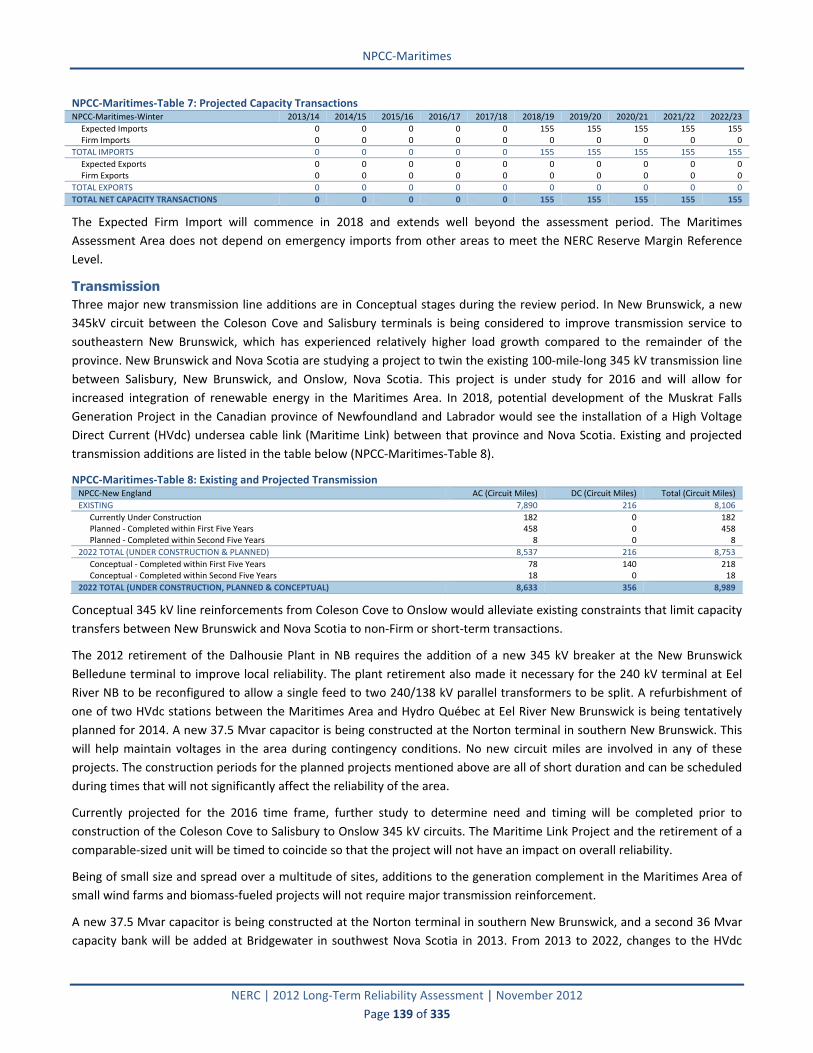
NPCC‐Maritimes
NERC | 2012 Long‐Term Reliability Assessment | November 2012
Page 139 of 335
NPCC‐Maritimes‐Table 7: Projected Capacity Transactions NPCC‐Maritimes‐Winter 2013/14 2014/15 2015/16 2016/17 2017/18 2018/19 2019/20 2020/21 2021/22 2022/23
Expected Imports 0 0 0 0 0 155 155 155 155 155 Firm Imports 0 0 0 0 0 0 0 0 0 0
TOTAL IMPORTS 0 0 0 0 0 155 155 155 155 155
Expected Exports 0 0 0 0 0 0 0 0 0 0 Firm Exports 0 0 0 0 0 0 0 0 0 0
TOTAL EXPORTS 0 0 0 0 0 0 0 0 0 0
TOTAL NET CAPACITY TRANSACTIONS 0 0 0 0 0 155 155 155 155 155
The Expected Firm Import will commence in 2018 and extends well beyond the assessment period. The Maritimes
Assessment Area does not depend on emergency imports from other areas to meet the NERC Reserve Margin Reference
Level.
Transmission Three major new transmission line additions are in Conceptual stages during the review period. In New Brunswick, a new
345kV circuit between the Coleson Cove and Salisbury terminals is being considered to improve transmission service to
southeastern New Brunswick, which has experienced relatively higher load growth compared to the remainder of the
province. New Brunswick and Nova Scotia are studying a project to twin the existing 100‐mile‐long 345 kV transmission line
between Salisbury, New Brunswick, and Onslow, Nova Scotia. This project is under study for 2016 and will allow for
increased integration of renewable energy in the Maritimes Area. In 2018, potential development of the Muskrat Falls
Generation Project in the Canadian province of Newfoundland and Labrador would see the installation of a High Voltage
Direct Current (HVdc) undersea cable link (Maritime Link) between that province and Nova Scotia. Existing and projected
transmission additions are listed in the table below (NPCC‐Maritimes‐Table 8).
NPCC‐Maritimes‐Table 8: Existing and Projected Transmission NPCC‐New England AC (Circuit Miles) DC (Circuit Miles) Total (Circuit Miles)
EXISTING 7,890 216 8,106
Currently Under Construction 182 0 182 Planned ‐ Completed within First Five Years 458 0 458 Planned ‐ Completed within Second Five Years 8 0 8
2022 TOTAL (UNDER CONSTRUCTION & PLANNED) 8,537 216 8,753
Conceptual ‐ Completed within First Five Years 78 140 218 Conceptual ‐ Completed within Second Five Years 18 0 18
2022 TOTAL (UNDER CONSTRUCTION, PLANNED & CONCEPTUAL) 8,633 356 8,989
Conceptual 345 kV line reinforcements from Coleson Cove to Onslow would alleviate existing constraints that limit capacity
transfers between New Brunswick and Nova Scotia to non‐Firm or short‐term transactions.
The 2012 retirement of the Dalhousie Plant in NB requires the addition of a new 345 kV breaker at the New Brunswick
Belledune terminal to improve local reliability. The plant retirement also made it necessary for the 240 kV terminal at Eel
River NB to be reconfigured to allow a single feed to two 240/138 kV parallel transformers to be split. A refurbishment of
one of two HVdc stations between the Maritimes Area and Hydro Québec at Eel River New Brunswick is being tentatively
planned for 2014. A new 37.5 Mvar capacitor is being constructed at the Norton terminal in southern New Brunswick. This
will help maintain voltages in the area during contingency conditions. No new circuit miles are involved in any of these
projects. The construction periods for the planned projects mentioned above are all of short duration and can be scheduled
during times that will not significantly affect the reliability of the area.
Currently projected for the 2016 time frame, further study to determine need and timing will be completed prior to
construction of the Coleson Cove to Salisbury to Onslow 345 kV circuits. The Maritime Link Project and the retirement of a
comparable‐sized unit will be timed to coincide so that the project will not have an impact on overall reliability.
Being of small size and spread over a multitude of sites, additions to the generation complement in the Maritimes Area of
small wind farms and biomass‐fueled projects will not require major transmission reinforcement.
A new 37.5 Mvar capacitor is being constructed at the Norton terminal in southern New Brunswick, and a second 36 Mvar
capacity bank will be added at Bridgewater in southwest Nova Scotia in 2013. From 2013 to 2022, changes to the HVdc

NPCC‐Maritimes
NERC | 2012 Long‐Term Reliability Assessment | November 2012
Page 140 of 335
system in the Maritimes will include the proposed 2014 refurbishment of the 350 MVA Eel River HVdc Station on the New
Brunswick tie to Québec and the proposed 2018 addition of an HVdc tie between Nova Scotia and the province of
Newfoundland and Labrador (Maritime Link).
Vulnerability Assessment Because of the relative size of the Maritimes Area’s largest generating units compared to its aggregated load, the area
carries substantial reserve capacity. Generators use a diverse mix of fuel types with the result that the Maritimes Area is not
overly reliant on any particular fuel to meet its load. The area is strongly interconnected with neighboring areas via high
capacity transmission lines but is not dependant on these areas to supply area load. As a result, LOLE analysis suggests that
even with reasonable foreseeable contingencies including load forecast uncertainty, fuel disruptions, and generator and
transmission interruptions, the Maritimes Area load will be reliably supplied for the 10 years covered in this report.
The approximately 1,330 MW hydro‐electric power supply system in the Maritimes Area is predominantly run off the river
as opposed to storage‐based and is not able to be held in reserve to stave off drought conditions. If such conditions were to
exist in the Maritimes Area, operation of the system would be relatively unchanged. The hydro system would still be used
to follow load in the area and respond to sudden short‐term capacity requirements. Thermal units would be used to keep
the small storage capability of the hydro systems usable for load following and peak supply.
Because of the relative size of the area’s largest generating units compared to its aggregated load, the area carries
substantial reserve capacity. Long‐term outages to individual units do not cause undue stress from a technical perspective.
Because the area peaks in winter as opposed to neighboring jurisdictions that peak in summer, it is expected that any
capacity or energy shortfalls due to long‐term unit outages could be offset by purchases from New England during their off‐
peak season, or Québec.
Renewable Portfolio Standards (RPSs) have lead to the development of substantially more wind generation capacity than
any other renewable generation type. Reduced frequency response is associated with wind generation and may, with
increasing levels in the future, require displacement with conventional generation during light load periods. If required by
system operators, wind farms in the Maritimes Area must provide controls that will enable curtailment. In New Brunswick,
while increasing RPS requirements to 40 percent of New Brunswick energy by 2020, the government has recently
announced that there is enough large‐scale wind capacity on the system and that it will shift the focus of the standard to
concentrate on less‐intermittent hydro (including sources outside the Maritimes Area), wood‐based biomass, and small‐
scale wind developments, but new projects have been identified to date. In Nova Scotia, wind generation capacity is
expected to increase with the addition of a government‐mandated Community Feed‐in Tariff. The Renewable Electricity
Standard target is 40 percent by 2020 and is expected to be achieved largely with hydro energy imports through the
Maritimes Link Project. Nova Scotia Power has commissioned a renewables integration study with General Electric, the
results of which should provide insight into the resource adequacy and operational issues related to increased renewables.
Demand Response in the Maritimes Area consists primarily of interruptible customer load equivalent to 5 percent of peak
load for the 2012/2013 winter season. Performance of these customers is metered in real time to ensure compliance with
operator instructions. In addition to interruptible load, Nova Scotia implements a 5 percent voltage reduction at selected
substations and reduces their demand by approximately 1 MW to 5 MW.
There are no significant increases in distributed generation identified in the Maritimes Area except in Nova Scotia. Existing
distributed resources are netted against load and not counted as capacity. In Nova Scotia, increased amounts of renewable
generation will be connected to the distribution system through the Community Feed‐in‐Tariff as outlined in the Province’s
Renewable Electricity Plan in April 2010. Further study is required to fully understand the cost and technical implications
related to possible transmission upgrades and new operational demands on existing infrastructure.
In the New Brunswick sub‐area, the government has acknowledged the need to develop less‐intermittent sources of
renewable energy. With the significant amount of large‐scale wind energy currently being balanced on their system, the
NPCC‐Maritimes
NERC | 2012 Long‐Term Reliability Assessment | November 2012
Page 141 of 335
next phase of renewable energy development will focus on smaller‐scale projects with a particular emphasis on non‐
intermittent forms of generation, such as wood‐based biomass. Wind energy will continue to be integrated in the New
Brunswick balancing area, but in measured and manageable stages.
At this time, there are no plans to install more Under‐Voltage Load Shedding (UVLS) in the Maritimes Area.
Collectively, UVLS in New Brunswick can shed up to 25 percent of load. UFLS in the Maritimes Area will conform to NPCC
Directory 12 requirements calling for 30 percent of area load available to be shed by 2012.
Neither UVLS nor UFLS are used in resource adequacy analysis in the Maritimes Assessment Area. Additional SPS schemes
could be implemented in addition to proposed bulk power transmission facilities. At this time, no specific applications are
planned for the Maritimes Area during the assessment period.
Scenarios of high load growth, significant resource outages, and zero wind availability (loss of source) are studied for NPCC
Comprehensive Reviews of Resource Adequacy. The Comprehensive Area Transmission Reviews require that system
performance be studied under stressful conditions such as N‐1‐1 conditions, extreme contingencies (complete loss of entire
generating stations, HVdc ties, etc.), and extreme conditions (weather or loss of fuel) to test the “strength” of the system.
Regional cooperation to mitigate the effects of increases in variable generation has led to a regional research initiative
known as PowerShift Atlantic. This initiative will attempt to ease variable generation balancing issues using smart grid
technology. Automatic direct control of individual loads will offset changing output from variable resources.
All relay protection misoperations are investigated, and if the relay is found to be faulty, it is replaced. If the settings are
found to be in error, they are corrected. If human error was the cause (accidental trips, etc.), the staff involved is trained to
avoid the problem in the future. If the relay is misapplied, a new relay scheme is installed to the correct the problem. All of
these approaches are taken to reduce the potential for future misoperation.
Renewable Portfolio Standards have mandated increased levels of variable generation in the area, and these have been
included in resource adequacy reviews. Within the Nova Scotia sub‐area, increasingly stringent air‐emissions hard caps have
been accounted for in the assessment.
To reduce emissions associated with energy production, governments in the Maritimes Area have introduced Renewable
Portfolio Standards, leading to a large‐scale development of wind energy resources in the area. The Maritimes Area
examines cases in which a complete absence of wind in the area occurs due to weather conditions. The conclusion is that
the area is not overly reliant on wind generation to meet its 20 percent reserve criterion (the level at which it has been
shown that the area meets the NPCC resource adequacy reliability criterion). Current emissions limits in the Maritimes Area
are specified as annual system volumes rather than generator‐specific volumes, providing flexibility in the operation of the
fleet. Future regulations limiting greenhouse gas emissions are expected and could limit the future utilization of fossil‐
fueled generation. System Operators in the Maritimes Area are tracking such developing standards and are conducting
analyses regarding their impact on future resource adequacy.
No resource deficiencies are forecast and there is no over‐reliance on wind to meet area Reserve Margin targets. To avoid
an over‐abundance of variable generation in the province, the Government of New Brunswick is now concentrating on
development of non‐intermittent renewable resources. Nova Scotia Power has augmented the supply of renewables with
dispatchable biomass. Additionally, the Nova Scotia government has added provisions to the proposed 2020 RES targets
that would allow imported renewable hydro energy from the Newfoundland and Labrador utility Nalcor. Nova Scotia Power
has commissioned a renewables integration study with General Electric, and the results of the study should provide insight
into the resource adequacy and operational issues related to increased renewables.
The 660 MW Point Lepreau nuclear generator is the single largest unit in the area, and upon its return in October 2012, it
will have been out of service for four and a half years. During that period, the area met its reserve requirements in part by
contracting winter replacement capacity from neighboring areas. During off‐peak periods, capacity contracts were

NPCC‐Maritimes
NERC | 2012 Long‐Term Reliability Assessment | November 2012
Page 142 of 335
unnecessary. Sufficient capacity exists for the Maritimes Area to meet its target Reserve Margin, should the return to
service of Point Lepreau be further delayed. Therefore, long‐term maintenance outages in the Maritimes Area are not
expected to cause any reliability issues during the assessment period.
With the completion of the Point Lepreau refurbishment in 2012, no other major retrofits are currently scheduled in the
Maritimes Area during the assessment period.
Standing and Emerging Reliability Issues Currently, there are two emerging reliability issues being examined in the Maritimes Area: increasing load in southeastern
New Brunswick and additional renewable resources throughout the area.
Increasing Southeastern New Brunswick Load
The issue may require transmission reinforcements within the midterm time frame, which is between four and eight years.
Load growth in the southeastern area of New Brunswick has been more rapid than other areas in the province. Voltages
and thermal loading on lines are approaching unacceptable levels during 345 kV contingencies for various operating
scenarios.
The effect on resource adequacy is minimal. Generation is unaffected, and the higher loads are included in forecasts used
for resource adequacy studies. The impact on LOLE is captured by modeling a reduction in tie transfer capabilities between
sub‐areas. The 2011 NPCC Interim Review of Resource Adequacy showed that LOLE values do not exceed the NPCC limit of
0.1 days per year of resource adequacy.
The issue could affect BPS reliability by threatening voltage instability and potentially overloading circuits during
contingencies in the Assessment Area.
The low voltages and overloads of parallel circuits during contingencies would be moderate but localized and not likely to
create problems in neighboring Regions. To address this issue, construction of a new 103‐mile‐long 345 kV transmission line
twinning existing circuits between the Coleson Cove NB and Salisbury NB terminals is being considered. The new line would
increase the transmission capacity in the area, alleviating contingency‐related overloads and improving area voltages.
The 2012LTRA reference case will not be affected by this issue, and although the load growth and potential voltage issues
are localized to southeastern New Brunswick for 345kV outages feeding that area, the circuit overloads occur on parallel
138 kV circuits leading from sources in southwestern New Brunswick to the high load areas in the southeast.
The interconnection of new resources in the area is not considered an issue and would likely help mitigate this emerging
issue, as a lack of generating resources situated in this area contributes to the problem. Ultimately, the issue seems to
become problematic for 345 KV contingencies when New Brunswick loads are at near‐peak levels and there are high
southern or northern New Brunswick generation dispatches during periods of high exports from New Brunswick to Prince
Edward Island or Nova Scotia.
Addition of Renewable Resources in the Area
Addition of renewable resources, particularly in Nova Scotia, is classified as an emerging issue that may require bulk power
enhancements within the midterm time frame of four and eight years. Nova Scotia’s Renewable Electricity Standard (RES)
seeks to displace significant amounts of fossil‐fueled generation with renewable resources. By 2015, 25 percent of the
province’s electricity sales will be supplied by renewable energy sources, and by 2020 the target is 40 percent. The issue
actually enhances resource adequacy, provided existing traditional resources are not prematurely retired as a result of the
new capacity.
The addition of renewable resources could affect BPS reliability if increasing amounts of variable or low‐mass slow‐speed
units are added without considering the reduction of frequency response during certain system contingencies or without

NPCC‐Maritimes
NERC | 2012 Long‐Term Reliability Assessment | November 2012
Page 143 of 335
sufficient transmission enhancements to prevent voltage or thermal performance issues. The emergence of any of these
issues could limit operation of, or the amount of, new renewable generation added to the system.
The issue has not currently affected transmission adequacy, but depending on the location and amount of generation
added, it could in the future, since “surplus” transmission capacity is used up to interconnect the new facilities or, on the
contrary, congestion is relieved. The process of completing System Impact Studies prior to interconnecting new generation
should identify whether transmission adequacy is an issue on a case‐by‐case basis. The lack of transmission enhancement
could delay the development of new renewable resources.
The LTRA case is affected by this issue as Reserve Margins increase due to increasing capacity versus load. Although much
of the new renewable capacity is derated to “expected” on‐peak values, the actual capacity contribution will be verified
through experience with actual operation and further study. In addition, many of the new resources being considered have
short timelines, which makes long‐term projections less reliable as project plans are introduced, cancelled, or modified in
response to changing government incentive policies.
Many of the sites chosen for new renewable generation facilities are located near the energy sources or are sited near
existing transmission infrastructure. There is potential for such additions across the entire Maritimes Area.
The variable intermittent nature and low inertia of some renewable resources (in particular wind, by far the most prevalent
type) combined with a possible lack of transmission resources in the area of a project site may limit development of these
resources.
The intermittent nature of many renewable resources is a major consideration for generation dispatchers on a daily basis.
The low inertia effects on system frequency response will be felt mostly during off‐peak, light‐load periods when high‐mass
units have been displaced by low‐mass, new renewable resources.

NPCC‐New England
NERC | 2012 Long‐Term Reliability Assessment | November 2012
Page 144 of 335
NPCC-New England Planning Reserve Margins ISO New England expects to have adequate Planning Reserve Margins throughout the assessment period (2013–2022). The
amount of Anticipated and Prospective Resources in the 2013 summer is 35,265 MW, which results in an Anticipated
Reserve Margin of 32.4 percent of the reference demand forecast of 26,629 MW during the summer season.
Planning Reserve Margin considerations for this assessment newly reflect Seasonal Claimed Capability (which could be
higher than the Capacity Supply Obligation (CSO)) of all ISO‐NE generators, as well as demand resources and imports that
have assumed CSOs under the ISO‐NE’s Forward Capacity Market (FCM). Consideration for generator Seasonal Claimed
Capabilities has not been included in determining the capacity projections in long‐term assessments since 2008, when ISO‐
NE started to use CSOs in the LTRA to reflect the capacity purchased under the FCM. Prior to the 2008 assessment, all
generator capabilities in the LTRA were based on the Seasonal Claimed Capability. The reason for reflecting the generator
Seasonal Claimed Capabilities in this and future LTRAs is that when the energy prices are lucrative (which is always the case
during annual peak demand conditions), generating resources offer the energy market up to, and sometimes more than,
their Seasonal Claimed Capability. The LTRA would undercount New England capacity if ISO‐NE only reflected the CSOs in
the LTRA.
This Reserve Margin during the annual peak reflects the Seasonal Claimed Capability of all ISO‐NE generators, as well as
demand resources and imports that have Capacity Supply Obligations (CSOs) as a result of ISO‐NE’s Forward Capacity
Market (FCM) auctions. The Adjusted Potential Capacity Resources are slightly higher at 35,329 MW, resulting in a Reserve
Margin of 32.67 percent. The Reserve Margins decrease steadily through the assessment period. By 2022, the Anticipated
and Prospective Reserve Margins reach a low of 16.56 percent and the Adjusted Potential Reserve Margin decreases to
20.79 percent (NPCC‐New England‐Table 1 and NPCC‐New England‐Figure 1).
NPCC‐New England‐Table 1: Planning Reserve Margins – NPCC‐New England NPCC‐New England‐Summer 2013 2014 2015 2016 2017 2018 2019 2020 2021 2022
ANTICIPATED 32.43% 30.82% 28.70% 21.18% 19.88% 19.13% 18.54% 17.93% 17.26% 16.56% PROSPECTIVE 32.43% 30.82% 28.70% 21.18% 19.88% 19.13% 18.54% 17.93% 17.26% 16.56% ADJUSTED POTENTIAL 32.67% 32.07% 30.59% 25.39% 24.23% 23.44% 22.84% 22.20% 21.51% 20.79%
NERC REFERENCE ‐ 15.00% 15.00% 15.00% 15.00% 15.00% 15.00% 15.00% 15.00% 15.00% 15.00%
NPCC‐New England‐Winter 2013 2014 2015 2016 2017 2018 2019 2020 2021 2022
ANTICIPATED 77.00% 74.75% 77.09% 70.02% 70.71% 71.38% 71.96% 72.44% 72.83% 73.16% PROSPECTIVE 77.00% 74.75% 77.09% 70.02% 70.71% 71.38% 71.96% 72.44% 72.83% 73.16% ADJUSTED POTENTIAL 78.17% 76.51% 80.53% 75.74% 76.46% 77.15% 77.75% 78.25% 78.65% 78.99%
NERC REFERENCE ‐ 15.00% 15.00% 15.00% 15.00% 15.00% 15.00% 15.00% 15.00% 15.00% 15.00%
NPCC‐New England‐Figure 1: Summer (Left) and Winter206 (Right) Planning Reserve Margins
New England did not provide a specific Planning Reserve Margin target level and as a thermal system—a NERC Reference
Margin Level of 15 percent is applied. ISO New England projects its capacity needs to meet the NPCC once‐in‐10‐year Loss
206
Each year represents the initial year of the winter season. For example: 2013 represents the 2013/2014 winter season.
0%
5%
10%
15%
20%
25%
30%
35%
2013 2014 2015 2016 2017 2018 2019 2020 2021 2022
0%
10%
20%
30%
40%
50%
60%
70%
80%
2013 2014 2015 2016 2017 2018 2019 2020 2021 2022

NPCC‐New England
NERC | 2012 Long‐Term Reliability Assessment | November 2012
Page 145 of 335
of Load Expectation (LOLE) resource planning reliability criterion. The amount of capacity needs can and do vary from year
to year depending on expected system conditions.
There is a potential for lower‐than‐anticipated reserve margins if significant retirements due to environmental regulations
result in lost capacity that cannot be replaced quickly enough by new resources.
Demand The 2013 summer peak demand forecast is 27,765 MW, and the Net Internal Demand, which takes into account 1,136 MW
of passive demand resources (Energy Efficiency), is 26,629 MW.
This year’s forecast of the 10‐year summer Total Internal Demand compound annual growth rate (CAGR) based on Total
Internal Demand is 1.44 percent, which is slightly higher than the 2011 projection of 1.30 percent. The reason for this
increase is changes in the economic forecast.
The forecast 10‐year winter Total Internal Demand CAGR is 0.57 percent, which is approximately the same as last year’s
growth rate (NPCC‐New England‐Table 2). The winter peak is less weather‐sensitive than the summer peak; is closely linked
to residential demand and is less impacted by the recession.207
NPCC‐New England‐Table 2: Demand Outlook NPCC‐New England‐Summer 2013/14 2022/23 10‐Year Change CAGR
NET INTERNAL DEMAND 26,629 28,583 1,954 7.3% 0.79%
Load‐Modifying Demand Response 1,136 3,000 1,864 164.1% 11.39%
TOTAL INTERNAL DEMAND 27,765 31,583 3,818 13.8% 1.44%
NPCC‐New England‐Winter 2013 2022 10‐Year Change CAGR
NET INTERNAL DEMAND 21,383 20,711 ‐672 ‐3.1% ‐0.35%
Load‐Modifying Demand Response 1,127 2,975 1,848 164.0% 11.39%
TOTAL INTERNAL DEMAND 22,510 23,686 1,176 5.2% 0.57%
This year’s forecast of the 10‐year net annual energy CAGR is 0.98 percent, which is the same as last year’s forecast.
Demand-Side Management DSM in ISO‐NE’s BPS consists of active demand resources and passive demand resources. Active demand resources consist
of real‐time Demand Response and real‐time emergency generation, which can be activated with the implementation of
ISO‐NE Operating Procedure No. 4 – Action During a Capacity Deficiency (OP‐4).208 Some assets in the real‐time Demand
Response programs are under direct load control by the load response providers (LRP). The LRP implements direct load
control of these assets upon dispatch instructions from ISO‐NE—for example, interruption of central air conditioning
systems in residential and commercial facilities. Passive demand resources (i.e., Energy Efficiency and conservation) include
installed measures (e.g., products, equipment, systems, services, practices, and strategies) on end‐use customer facilities
that result in additional and verifiable reductions in the total amount of electrical energy used during on‐peak hours.
The amount of summer active Demand Resources209 in 2013 is projected to be 1,681 MW and the amount of passive
Demand Resources210 is 1,136 MW. In the winter, the amount of active and passive DR is 1,536 MW and 1,127 MW,
respectively (NPCC‐New England‐Table 3).
207 The winter peak is also somewhat dependent on electric heating demand, while the summer peak is directly dependent on air conditioning demand. A much larger number of
homes in New England have air conditioning versus electric heat. 208 OP‐4 (located at http://www.iso‐ne.com/rules_proceds/operating/isone/op4/index.html) is used by ISO‐NE operators when resources are insufficient to meet the anticipated load plus Operating Reserve Requirement. 209 Active Demand Resources in New England are considered Demand Response that is treated as a resource for this assessment. 210 Passive Demand Resources in New England are treated as load‐modifying Demand Response for this assessment.

NPCC‐New England
NERC | 2012 Long‐Term Reliability Assessment | November 2012
Page 146 of 335
NPCC‐New England‐Table 3: Demand‐Side Management Short‐Term
2022 Share of Total Internal Demand
NPCC‐New England‐Summer 2013 2014 2015 2022 10‐Year Change
Direct Control Load Management (DCLM) 0 0 0 0 0 0.00% Contractually Interruptible (Curtailable) 0 0 0 0 0 0.00% Critical Peak‐Pricing (CPP) with Control 0 0 0 0 0 0.00% Load as a Capacity Resource 1,681 1,999 1,919 1,919 238 6.08%
TOTAL RESOURCE‐SIDE DEMAND RESPONSE 1,681 1,999 1,919 1,919 238 6.08%
Direct Control Load Management (DCLM) 0 0 0 0 0 0.00% Contractually Interruptible (Curtailable) 0 0 0 0 0 0.00% Critical Peak‐Pricing (CPP) with Control 0 0 0 0 0 0.00% Load as a Capacity Resource 1,136 1,398 1,647 3,000 1,864 9.50%
TOTAL LOAD‐MODIFYING DEMAND RESPONSE 1,136 1,398 1,647 3,000 1,864 9.50%
TOTAL ENERGY EFFICIENCY 0 0 0 0 0 0.00%
TOTAL DEMAND‐SIDE MANAGEMENT 2,817 3,397 3,566 4,919 2,102 15.57%
In 2022, the amount of summer active DR is projected to be 1,919 MW and the passive DR is 3,000 MW. In the winter, the
projected active and passive amounts are 1,795 MW and 2,975 MW, respectively.
The active DR is based on the Capacity Supply Obligations (CSO) obtained through ISO‐NE’s Forward Capacity Market (FCM)
three years in advance. The CSOs increase from 1,681 MW in 2013 to 1,999 WM in 2014 and then decrease slightly to 1,919
MW in 2015. At that point, since there are no further auction results, the CSOs are assumed to remain the same through
the end of the reporting period.
Energy Efficiency is also secured by means of FCM CSOs. However, this year ISO‐New England developed a new Energy
Efficiency forecasting methodology that takes into account the potential impact of growing Energy Efficiency
(EE)/conservation initiatives in the Region to project the amount of EE beyond the years when the FCM CSOs have already
been procured. EE has been increasing and is projected to continue growing throughout the study period, but at a
continually decreasing rate. The amount of EE in 2013 is 1,136 MW, increasing by 23 percent to 1,398 MW in 2014 and by
18 percent to 1,647 MW in 2015. By 2022, the growth rate of EE is projected to be around 6 percent per year, and about
3,000 MW of EE is expected to be available.
Both passive and active demand resources are treated as capacity in New England’s FCM. The active demand resources can
be triggered by ISO‐NE in real time under OP‐4 to help mitigate an actual or Anticipated Capacity Deficiency by reducing the
peak demand. For example, on July 22, the 2011 peak demand day, a total of 642 MW of active DR was dispatched and 644
MW responded. On another OP‐4 occurrence on the morning of December 19, 2011, active DR reduced the load by 380
MW (out of 504 MW dispatched).
Generation ISO‐NE’s Existing Certain capacity in summer 2012 is 31,969 MW. Natural gas‐fired generation represents the largest
component of ISO New England’s total installed capacity, followed oil‐fired generation, nuclear generation, and coal.
A total of 196 MW of new generation has been installed since the 2011 summer. Most of that capacity consists of a 130
MW gas‐fired combustion turbine. In addition, a wind facility with a 62 MW summer rating (217 MW nameplate) went
commercial. As explained later in this section, the on‐peak capacity of intermittent generators such as wind, hydro, and
solar units is based on actual generation during the summer or winter reliability hours. Therefore, the capacity as a
percentage of nameplate varies from resource to resource.
ISO‐NE has a total of 184 MW of capacity in the Future‐Planned Category, all of which is expected to be in service by
summer 2013 and consists primarily of biomass (84 MW), wind (42 MW, with a nameplate capability of 228 MW), landfill
gas (28 MW), and fuel cell (18 MW) projects. Conceptual capacity211 amounts to a total of 6,037.212 A 20 percent confidence
factor is applied to that value to reflect the percentage of queue projects that have historically gone into commercial
211 All of the capacity in ISO‐NE’s generator interconnection queue that is not included in the Future‐Planned Category. 212 Includes all Conceptual additions with in‐service dates from summer 2012 to summer 2017. Does not include conceptual retirements.

NPCC‐New England
NERC | 2012 Long‐Term Reliability Assessment | November 2012
Page 147 of 335
operation. The queue projects include primarily natural gas (3,734 MW), wind (1,991 MW nameplate), and biomass
facilities (159 MW). Hydro‐electric uprates, oil‐fired peaking units, and solar projects make up the remaining 153 MW
(NPCC‐New England‐Table 4 and NPCC‐New England Figure 2)
AES Thames, a 181 MW coal plant located in southeastern Connecticut, ceased operation in early 2011. In addition, Salem
Harbor units 1 and 2 (158 MW) were shut down as of December 31, 2011, and Salem Harbor Units 3 and 4 (587 MW) are
scheduled to retire by June 1, 2014.
NPCC‐New England‐Table 4: Capacity Outlook213 Current 2022 Planned 2022 Planned & Conceptual
NPCC‐New England‐Summer Capacity Share Capacity Share Change Capacity Share Change
Coal 2,484 7.8% 2,176 6.9% ‐307 2,176 5.8% ‐307 Petroleum 6,895 21.6% 6,463 20.6% ‐432 6,505 17.4% ‐390 Gas 13,772 43.1% 13,790 43.9% 18 17,525 46.8% 3,753 Nuclear 4,628 14.5% 4,628 14.7% 0 4,628 12.4% 0 Other/Unknown 0 0.0% 0 0.0% 0 0 0.0% 0 Renewables 4,191 13.1% 4,352 13.9% 161 6,613 17.7% 2,422
TOTAL 31,969 100.0% 31,410 100.0% ‐560 37,447 100.0% 5,478
NPCC‐New England‐Figure 2: Summer Net Renewable Capacity Change
The retirements of both AES Thames and Salem Harbor have been included in the Planning Reserve Margin calculations,
and the Reserve Margin remains above the 15 percent Reference Reserve Margin throughout the long‐term assessment
period. ISO‐NE ensures that it has adequate capacity up to three years in advance with its Forward Capacity Auctions and
Annual Reconfiguration Auctions. With respect to local loads, there is adequate capacity and transmission within the
Connecticut sub‐area where AES Thames is located. Since the Salem Harbor plant is located in the Boston sub‐area, ISO‐NE
performed a reliability review to determine the impact of the retirement of the full plant. It was found that under certain
second contingency scenarios with a 345 kV line‐out as the initial outage, thermal overloads could exist in the local area. To
address these thermal overloads, ISO‐NE and the affected Transmission Owners have developed plans to perform 115 kV
transmission line reconductoring projects on portions of five lines prior to the plant retirement. These upgrades are
expected to be completed in May 2014.
ISO‐NE has small amounts (less than 5 MW total) of non‐traditional resources providing regulation service through a pilot
program. These include battery storage, flywheels, electric thermal storage heating, and aggregated load control. After the
pilot program concludes, these resource types will remain eligible to provide regulation service. There is no current
expectation that these resources will or will not participate in the energy and capacity markets in the future. However,
technologies with multi‐hour storage capability may become economically viable participants in the energy market
depending on fuel prices, penetration of renewable resources, and localized transmission congestion.
213 “Current” represents Existing‐Certain and Future‐Planned projections for the 2012 summer (for summer‐peaking assessment areas) or 2012/2013 winter (for winter‐peaking
assessment areas). “Share” represents the share (percent) of total Existing‐Certain and Future‐Planned capacity projected for the peak season.
‐800
‐600
‐400
‐200
0
200
2013 2014 2015 2016 2017 2018 2019 2020 2021 2022
MW

NPCC‐New England
NERC | 2012 Long‐Term Reliability Assessment | November 2012
Page 148 of 335
As of summer 2012, ISO‐NE has 97 MW of on‐peak wind capacity, with a total nameplate capability of 566 MW. The
amount of on‐peak solar capacity is 5 MW, with a nameplate capability of 18 MW. For 2013, on‐peak hydro‐electric
capacity is 1,483 MW, derated from a maximum capacity of 2,043 MW, and biomass capacity is 907 MW (NPCC‐New
England‐Table 5, NPCC‐New England‐Figure 3, and NPCC‐New England‐Table 6).
NPCC‐New England‐Table 5: Renewable Capacity Outlook214 Current 2022 Planned 2022 Planned & Conceptual
NPCC‐New England‐Summer Capacity Share Capacity Share Change Capacity Share Change
Hydro 1,483 35.4% 1,492 34.3% 8 1,512 22.9% 29 Pumped Storage 1,698 40.5% 1,698 39.0% 0 1,773 26.8% 75 Geothermal 0 0.0% 0 0.0% 0 0 0.0% 0 Wind 97 2.3% 139 3.2% 42 2,129 32.2% 2,032 Biomass 907 21.6% 1,019 23.4% 112 1,177 17.8% 270 Solar 5 0.1% 5 0.1% 0 21 0.3% 16
TOTAL 4,191 100.0% 4,352 100.0% 161 6,613 100.0% 2,422
NPCC‐New England‐Figure 3: Summer Net Renewable Capacity Change
NPCC‐New England‐Table 6: Renewable Capacity Outlook: On‐Peak Vs. Installed Current 2022 Planned
NPCC‐New England‐Summer Wind Solar Hydro Biomass Wind Solar Hydro Biomass
Installed Capacity 566 18 2,043 907 794 18 2,051 1,019 On‐Peak Derate 469 13 560 0 656 13 560 0
EXPECTED ON‐PEAK OUTPUT 97 5 1,483 907 139 5 1,492 1,019
ISO‐NE continues to integrate new power supply sources—including new variable resources—into the network. All new
resources are studied in detail by ISO‐NE Operations Engineering prior to commercial operation. These are all integrated
through the use of operating guides/interface limits and through our Energy Management System (EMS). To facilitate
system operation with potentially large amounts of wind power, ISO‐NE Operating Procedure No. 14215 was developed and
implemented. OP‐14F is chiefly concerned with requirements for real‐time and static‐type data that will facilitate accurate
wind power forecasting over the intra‐day, day‐ahead, and week‐ahead timescales, as well as data for use in situational
awareness functions for ISO system operators.
Capacity Transactions Firm summer capacity imports increase from 1,746 MW in 2013 to 1,768 MW in 2015 before eventually falling to 89 MW
for the final years of the assessment. The capacity imports for those years reflect the results of the appropriate FCAs. Since
the FCA imports are based on one‐year contracts, beginning in 2016 the imports reflect only known, long‐term ICAP
contracts. If the imports beyond the 2015 summer do not clear in future FCM commitment periods, the lost capacity will be
replaced by other supply or Demand‐Side resources (NPCC‐New England‐Table 7).
214 “Current” represents Existing‐Certain and Future‐Planned projections for the 2012 summer (for summer‐peaking assessment areas) or 2012/2013 winter (for winter‐peaking
assessment areas). “Share” represents the share (percent) of total Existing‐Certain and Future‐Planned capacity projected for the peak season. 215 Appendix F – Wind Plant Operators Guide (OP‐14F): http://www.iso‐ne.com/rules_proceds/operating/isone/op14/.
0
25
50
75
100
125
150
175
2013 2014 2015 2016 2017 2018 2019 2020 2021 2022
MW

NPCC‐New England
NERC | 2012 Long‐Term Reliability Assessment | November 2012
Page 149 of 335
NPCC‐New England‐Table 7: Projected Capacity Transactions NPCC‐New England‐Summer 2013 2014 2015 2016 2017 2018 2019 2020 2021 2022
Expected Imports 0 0 0 0 0 0 0 0 0 0 Firm Imports 1,746 1,851 1,768 120 95 95 95 95 89 89
TOTAL IMPORTS 1,746 1,851 1,768 120 95 95 95 95 89 89
Expected Exports 0 0 0 0 0 0 0 0 0 0 Firm Exports 100 100 100 100 100 100 100 100 100 100
TOTAL EXPORTS 100 100 100 100 100 100 100 100 100 100
TOTAL NET CAPACITY TRANSACTIONS 1,646 1,751 1,668 20 ‐5 ‐5 ‐5 ‐5 ‐11 ‐11
For the 2012 summer, there is a Firm capacity sale to New York (Long Island) of 100 MW anticipated to be delivered via the
Cross‐Sound Cable (CSC). This Firm capacity sale is held constant through the assessment period.
Transmission There are several transmission projects that are projected to come on‐line during the assessment period that are important
to the continuation of, or enhancement to, system or sub‐area reliability. These projects are the results of progress made
by the ISO and regional stakeholders in analyzing the transmission system in New England, developing back‐stop solutions
to address existing and projected transmission system needs, and implementing these solutions. The major projects under
development in New England include the Maine Power Reliability Program (MPRP), the New England East‐West Solution
(NEEWS), and the Long‐Term Lower SEMA project. The new paths that are part of MPRP, many components of which are
under construction, will provide basic infrastructure necessary to increase the ability to move power into Maine from New
Hampshire and improve the ability of the transmission system within Maine to move power into the local load pockets as
necessary. NEEWS consists of a series of projects that have been identified to improve system reliability, including in
Springfield and Rhode Island, and increases total transfer capability across the New England east‐to‐west and west‐to‐east
interfaces. The Long‐Term Lower SEMA project eliminates the criteria violations in the lower southeastern Massachusetts
Area, which includes Cape Cod. Individual 345kV projects, most of which are components of the major projects described
above, are listed in the following table, which also includes line upgrades (NPCC‐New England‐Table 8).
NPCC‐New England‐Table 8: Planned and Under Construction Transmission Projects
Status Terminal Origin Location
Terminal End Location
Length (Circuit Miles)
Operating Voltage (kV)
Capacity Rating (MW)
Expected In‐Service
Under Construction Larrabee Road S/S Surowiec S/S 17 300 ‐ 399 2,151 2014 Under Construction Kent County West Farnum S/S 21.4 300 ‐ 399 1,353 2013 Under Construction Manchester Meekville Jct. 2 300 ‐ 399 2,420 2013 Under Construction North Bloomfield S/S Conn/Mass Border 11.9 300 ‐ 399 2,420 2013 Under Construction Agawam S/S Ludlow S/S 16.8 300 ‐ 399 2,420 2013 Under Construction Orrington S/S Albion Road S/S 59 300 ‐ 399 2,151 2014 Under Construction Surowiec S/S Raven Farm S/S 12.4 300 ‐ 399 2,151 2013 Under Construction Maguire Road S/S South Gorham S/S 21 300 ‐ 399 2,151 2013 Under Construction Maguire Road S/S Three Rivers Switchyard 19.2 300 ‐ 399 2,151 2013 Under Construction Albion Road S/S Coopers Mills S/S 21 300 ‐ 399 2,151 2014 Under Construction Larrabee Road S/S Coopers Mills S/S 34.3 300 ‐ 399 2,151 2014 Planned Carver Bourne 17.9 300 ‐ 399 2,169 2013 Planned ANP Blackstone NEA Bellingham Tap 1.2 300 ‐ 399 1,882 2013 Planned Card S/S Lake Road S/S 29.3 300 ‐ 399 2,420 2015 Planned Lake Road S/S Con/RI Border 7.6 300 ‐ 399 2,420 2015 Planned West Farnum S/S Con/RI Border 17.7 300 ‐ 399 2,172 2015 Planned Millbury S/S West Farnum S/S 20.7 300 ‐ 399 2,172 2015 Planned Frost Bridge S/S North Bloomfield S/S 35.4 300 ‐ 399 2,420 2017
Currently, there are no transmission constraints preventing the system from being operated in a manner that ensures the
reliability of the New England‐wide system. The proposed projects with the target in‐service dates are expected to enhance
the long‐term reliability of the New England bulk power supply system. There are no major interconnection‐related projects
or issues at this time. Existing and projected transmission additions are included in the table below (NPCC‐New England‐
Table 9).

NPCC‐New England
NERC | 2012 Long‐Term Reliability Assessment | November 2012
Page 150 of 335
NPCC‐New England‐Table 9: Existing and Projected Transmission NPCC‐New England AC (Circuit Miles) DC (Circuit Miles) Total (Circuit Miles)
EXISTING 7,890 216 8,106
Currently Under Construction 182 0 182 Planned ‐ Completed within First Five Years 458 0 458 Planned ‐ Completed within Second Five Years 8 0 8
2022 TOTAL (UNDER CONSTRUCTION & PLANNED) 8,537 216 8,753
Conceptual ‐ Completed within First Five Years 78 140 218 Conceptual ‐ Completed within Second Five Years 18 0 18
2022 TOTAL (UNDER CONSTRUCTION, PLANNED & CONCEPTUAL) 8,633 356 8,989
Presently there are no significant concerns over meeting the target in‐service dates of any of the transmission projects.
However, if the implementation of these projects is delayed, interim measures will be taken, such as issuing gap requests
for proposals (RFPs) to install temporary generation in a specific area of the system.
No additional significant substation equipment such as SVC, FACTS controllers, or HVdc is currently planned to be added to
the system.
Vulnerability Assessment The New England Area is currently not experiencing a drought. However, in the event that the assessment area was to
experience an extended drought, some traditional hydro‐electric stations could be temporarily capacity or energy‐
constrained. Other fossil stations could also be temporarily capacity limited due to lack of cooling water or other (heat‐
related) environmental issues.
Due to the relatively small contribution to overall capacity from hydro‐electric facilities (1,483 MW, or 4.6 percent), any
potential reduction in hydro‐electric energy production due to regional drought conditions could be readily supplemented
by increased levels of other types of fossil‐based generation.
There are no existing or potential significant long‐term generator outages that are anticipated to impact reliability during
the assessment period.
The New England states’ Renewable Portfolio Standards (RPS) include technology classes for new and existing resources,
and Load Serving Entities (LSEs) must provide their customers with a specified percentage of electric energy generated by
each class each year. Renewables designated as “new” resources (typically Class I RPS resources) are state‐specific but
typically include wind, solar, hydro‐electric, biomass, landfill gas, and ocean thermal. Although the required percentage for
new renewable resources varies by state, it increases each year and accounts for most of the growth of RPS targets in New
England. The RPS percentage targets for new resources in 2021 for the five New England states with RPSs range from 10
percent for Maine to 20 percent for Connecticut, with New Hampshire, Rhode Island and Massachusetts at 12, 14 and 16
percent, respectively. It is assumed that these targets will be met by generators in the ISO‐NE generator interconnection
queue, which had 2,577 MW of renewable projects as of April 1, 2012. Wind makes up approximately 85 percent of that
potential renewable capacity.
Concerns exist over the resultant impact from compliance with state RPS and the potential build‐out of these new
renewable resources. Because of concerns over the increasing amount of wind capacity, ISO‐NE completed a major wind
integration study to identify the detailed operational issues of integrating large amounts of wind resources into the New
England power grid. ISO‐NE is currently implementing the recommendations of this study, including the development of a
centralized wind power forecasting system.
Although the amount of ISO‐NE’s solar capacity is still small (18 MW nameplate), the number of solar projects has increased
significantly in recent years and is likely to continue growing due to incentives that all the New England states have in place.
Currently, it is estimated that New England actually has about 125 MW of nameplate solar capacity. However, only about
15 percent of that is registered in ISO‐NE’s energy and capacity markets, with the rest remaining behind the meter.
NPCC‐New England
NERC | 2012 Long‐Term Reliability Assessment | November 2012
Page 151 of 335
The implementation of the FCM has enhanced the integration of demand resources into system operations. ISO New
England has two real‐time demand resource programs that can be used to manage load and reserves as part of
implementation of ISO‐NE OP‐4. The first program is focused on load response and is utilized in the early stages of OP‐4.
The second is emergency generation (RTEG), which is accessed in a later action of OP‐4. All of these resources are audited
annually in both the summer and winter for their ability to perform. Based on DR audits in summer 2011 and the response
of active DR during the July 22, 2011 OP‐4 event, ISO‐NE expects that approximately 95 percent of DR capacity will perform
when triggered. In addition, each demand resource submits the hourly status of their capability to the ISO, and the system
operators are able to view that capability in real time. Finally, the operators are provided with telemetry from each
resource to monitor the real‐time performance of the resources in relation to their capacity supply obligations.
Due to the fact that distributed generation (DG) must be integrated into the local electric company’s distribution systems, it
must comply with the interconnection standards applicable to such systems. This distributed generation is traditionally not
a major concern for BPS operation, although relatively large DG projects can be studied by ISO‐NE. ISO‐NE does not
anticipate any operational problems or reliability concerns resulting from the levels of distributed generation enrolled
within its Demand Response programs.216 The FCM qualification process requires additional information for projects that
include the use of DG to ensure that they comply with the definition of DG within FCM.
In December 2010, ISO‐NE completed the New England Wind Integration Study (NEWIS), a major study of integrating wind
resources into the New England electric system. The study found that the large‐scale integration of wind resources is
feasible, but the Region will need to continue addressing a number of issues. Those issues include the need to: 1) ensure
revenues for other types of generation to maintain system reliability; 2) increase system flexibility and improve market
design to provide incentives for dispatchable resources; 3) provide increased operating reserve and regulation; 4) evaluate
the accuracy of methods for calculating wind capacity; 5) develop transmission to interconnect wind resources and bring
the energy to load centers in New England; 6) develop an accurate means of forecasting wind generation output; and 7)
update interconnection requirements for wind generation.
The results of NEWIS will serve as the basis for regional policies and practices by ISO‐NE, wind project owners, and
interconnecting transmission owners, and may result in changes to the ISO‐NE tariff, operating procedures, and manuals.
ISO‐NE will continue to work with stakeholders through the usual stakeholder processes to implement the study’s findings,
which may require modifying market and reliability rules necessary to facilitate the large‐scale integration of future wind
resources.
The majority of actions to be implemented in the near term were derived from the NEWIS‐identified technical requirements
for interconnection.217 The balance of the integration efforts will be prioritized and completed through ISO‐NE’s stakeholder
process.
The Wind Power Forecast Integration Project (WPFIP) is the first phase in the progression of steps necessary to fully
integrate wind power into the ISO‐NE system. Currently in New England, variable energy resources (VERs) perform their
own forecast of generation for each hour of the next operating day, which they submit to ISO‐NE as a self‐schedule
(forecast) on the day preceding the operating day. Phase 1 of the WPFIP will replace this self‐scheduled forecast with a
centralized forecasting system, as described above. Phase 2 of the WPFIP will make it possible to dispatch wind plants in a
manner similar to that of other ISOs that have integrated wind power into their dispatch process. Integration into real‐time
dispatch means that wind plants will submit economic offers and be able to set prices at their local bus, and transmission
congestion will be managed in a transparent and automated process (versus the typically manual process that is currently
216 Within New England, the capacity and load relief benefits from triggering distributed generation, Real‐Time Emergency Generation (RTEG), is only attainable through the
invocation of ISO‐NE Operating Procedure No. 4 – Action during a Capacity Deficiency (OP‐4) – Action 6 of 11. 217GE Energy Application and Systems Engineering, et al., Technical Requirements for Wind Generation Interconnection and Integration (November 3, 2009), http://www.iso‐ne.com/committees/comm_wkgrps/prtcpnts_comm/pac/reports/2009/newis_report.pdf.

NPCC‐New England
NERC | 2012 Long‐Term Reliability Assessment | November 2012
Page 152 of 335
used for real‐time self‐scheduled resources). Phase 2 of the WPFIP will also include closer coupling with the short‐term
outage scheduling process and will include publishing of the aggregate week‐ahead wind power forecast (similar to the
manner in which a week‐ahead load forecast is published) in order for the market participants to be able to incorporate this
information into their decision‐making processes and market strategies.
At this time, there are no plans to install more Under‐Voltage Load Shedding (UVLS) in New England. Currently, northern
New England has the potential to arm approximately 600 MW of load shedding as part of UVLS. However, it is important to
recognize that a significant portion of this load shedding is normally not armed and is only armed under severe loading
conditions with a facility already out of service. Presently, two significant projects have the attribute of either completely
eliminating the need for the UVLS or significantly reducing the likelihood of depending on such schemes. These projects are
the Vermont Southern Loop Project and the Maine Power Reliability Program (MPRP). The Vermont Southern Loop Project
was completed in late 2010 and the MPRP project is scheduled to be completed in 2014.
There are no Special Protection Systems that are proposed to be installed in lieu of proposed regulated transmission
facilities to address system reliability needs in New England in the assessment time frame. However, two new, temporary
Special Protection Systems are to be installed in Maine as part of the MPRP. The first SPS is needed to ensure reliable
system operation due to configuration changes at South Gorham while the MPRP is under construction. The second SPS is
needed to ensure reliable system operation due to configuration changes in the Rumford Area while the MPRP is under
construction. Once construction of the necessary portions of the MPRP is complete (anticipated in 2014), these two
temporary Special Protection Systems will be removed.
New smart grid technologies are being used in New England to improve the electric power system’s performance and
operating flexibility. Smart grid technologies such as flexible alternating‐current transmission systems (FACTS) and high‐
voltage direct current (HVdc) will facilitate the integration of variable resources in the Region and reliably improve the
economical operation of the power system. Because much of the potential for wind development is remote from load
centers, additional transmission development will be required. Some of these transmission improvements will likely use
HVdc technology, which is economical over long distances, and FACTS, which makes better use of limited transmission
facilities. Both HVdc and FACTS are regularly considered as part of transmission planning studies when their application
economically meets system or generator interconnection needs.
On July 1, 2010, ISO‐NE received a U.S. DOE Smart Grid Investment Grant Award and subsequently began a three‐year
Synchrophasor Installation and Data Utilization (SIDU) project. The goal of the project is to provide ISO‐NE and associated
Transmission Owners a significantly expanded base of Phasor Measurement Units (PMUs), Phasor Data Concentrators, and
greatly enhanced phasor data analytical tools. The SIDU project will supplement the five existing PMUs in the Region with at
least 30 new PMUs at various substations around New England. The project is focused on the deployment of synchrophasor
technology as a foundation for the next generation of power grid situational awareness, and it will serve as the smart grid
technology platform upon which advanced analysis and visualization tools can be deployed. The SIDU project will yield
efficiencies in the way the grid is operated and will improve reliability, serving as a backbone for regional smart grid efforts.
In addition, several investor‐owned and municipal utilities are conducting smart grid pilot programs or projects in New
England ranging from smart meter deployments to full‐scale direct load control and distribution automation projects. ISO‐
NE anticipates that these projects may lead to more significant smart grid assets becoming available for potential utilization
during the Long‐Term Reliability Assessment period.
New England relies upon the facility owners to investigate relay protection misoperations with cooperation and technical
support from ISO‐NE. The facility owners will then determine the cause of the misoperation and implement corrective
actions for that facility and other facilities that have the same concern. New England has a number of forums that allow the
equipment owners to share information they feel may be useful to other equipment owners in preventing similar events.

NPCC‐New England
NERC | 2012 Long‐Term Reliability Assessment | November 2012
Page 153 of 335
ISO‐NE routinely reviews the existing, pending, and promulgating environmental regulation for their potential impact on
existing or future capacity. Under the workloads associated with its Strategic Planning Initiative, ISO‐NE has identified
several regional power stations that may be retired due to the economics of compliance with pending state and federal air
and water regulations.
Emerging environmental regulations will very likely require large capital investments that may be uneconomic for many
older fossil‐fueled resources. While the exact form and timing of the regulations remain uncertain, it is highly likely that
substantial compliance investments will be required by owners of existing New England resources to continue operations.
This could lead to a significant quantity of older generation choosing to retire rather than comply.
Approximately 7.9 GW of coal‐ and oil‐fired capacity located in New England is subject to the final Mercury and Air Toxics
Standards (MATS). Many coal‐fired units have or are planning needed retrofit controls to comply with existing state
regulations, and most oil‐fired units are expected to utilize a safe harbor exemption to continue operation beyond the April
2015 compliance deadline. Overall, less than 1 GW of affected capacity in New England is expected to retire due to non‐
compliance with the MATS.
A total of 12.1 GW of thermal station generating capacity using once‐through cooling in the Region is subject to the
proposed Clean Water Act Section 316(b) cooling water rule and will likely be required to modify existing cooling water
intake structures by 2020 to minimize loss of fish and other aquatic life. A smaller subset of this affected capacity with
water withdrawals greater than 125 million gallons per day (estimated at 5.6 GW) will likely need to convert to closed‐cycle
cooling in the same time frame. ISO‐NE estimates that between 1 and 3 GW of affected capacity in New England may retire
by 2020 due to non‐compliance with CWA Section 316(b).
Currently, the procedures that are in place to maintain system reliability include reliability agreements and out‐of‐merit
unit commitment. However, ISO‐NE is studying longer‐term solutions to the problem, such as appropriate enhancements to
wholesale market design and system planning procedures. Losing a significant quantity of coal, oil, and nuclear capacity
could further increase the assessment area’s dependence on natural gas‐fired resources. If all of New England’s older oil
units were to seek retirement, new capacity would be required to satisfy the Installed Capacity Requirement.
ISO‐NE has initiated and is aggressively promoting a regional dialogue focused on solutions that can avert undesirable
outcomes. ISO‐NE has initiated a study to better quantify the implications of this issue. This analysis will complement the
2010 economic planning studies. For more information, reference the Standing and Emerging Reliability Issues section.
At this time there are no planned outages for generator environmental retrofits that would impact reliability. Many
environmental retrofits needed for MATS have already been placed into service or are planned well ahead of the April 2015
compliance deadline. Remaining retrofits are expected to be completed during traditional outage periods.
Plans for Accommodating Generator Retirements and Environmental Control Retrofits
ISO‐NE has received notification of the retirement of Salem Harbor units 3 & 4, with a combined capability of 587 MW. The
retirement is to take effect on June 1, 2014.
Between 2012 and 2021, environmental regulations could require generators to incur significant capital costs for retrofits.
The added pollution control equipment could restrict operation and the cost of compliance could render some of these
generators non‐price competitive, resulting in the retirement of additional generation. The compliance retrofits could
include adding post‐combustion control devices, modifying cooling water intakes, switching to closed‐cycle cooling systems,
or switching fuels. ISO‐NE estimates that, in total, these regulations would affect over 12.1 GW of installed capacity across
New England.
Because new environmental requirements are in flux and are being phased in over the next decade, assessing the potential
impacts that the resulting regulations could have on generators and the power system poses some challenges. First, the
capital investments some generation owners will need to make are uncertain for complying with the Mercury and Air Toxics

NPCC‐New England
NERC | 2012 Long‐Term Reliability Assessment | November 2012
Page 154 of 335
Standards (MATS) of the US EPA Clean Air Act (CAA) and the Cooling Water Intake 316(b) Rule of the Clean Water Act
(CWA). Other unknowns include the timing, magnitude, and location of unit retirements that could result from generators
opting not to comply with these regulations.
As part of the Strategic Planning Initiative, ISO‐NE is collecting and analyzing data to identify the units expected to face
significant capital investments because of upcoming regulatory requirements and to assess the potential resulting impacts
on transmission system operations. The ISO has also initiated a study to better quantify the implications of the likely
retirement of several generating units and their potential replacements. The ISO is identifying generators that already have
environmental remediation measures in place or may require relatively minor upgrades and those at risk for retirement.
The actual compliance timelines will depend on the timing and substance of the final regulations and site‐specific
circumstances of the electric generating facilities. Most of the at‐risk capacity would face compliance or retirement
decisions—and Forward Capacity Market positioning decisions—starting late in this decade, extending into the early part of
the next decade.
A total of 12.1 GW of fossil and nuclear capacity are subject to the proposed Cooling Water Intake Rule, which is expected
to be finalized in June 2013. This rule directly affects a total of 5.6 GW of fossil‐fueled and nuclear facilities with 125 MGD
or higher once‐through cooling water systems, which likely will be obligated to convert to closed‐cycle cooling systems
between 2018 and 2024. The ISO estimates that approximately 1 GW to 3 GW of the 5.6 GW subject to the additional
requirements of EPA’s preferred option218 may retire between 2018 and 2020, rather than retrofit to closed‐cycle cooling
systems.
The MATS rule affects coal‐ and oil‐fired steam units over 25 MW. The final MATS rule will have a relatively modest impact
on New England generators. Although 7.9 GW will be affected, less than 1 GW of environmental retirements are anticipated
by 2015. Most oil‐fired generators are expected to continue operating after 2015, and limited additional pollution control
retrofits are required for the remaining coal‐fired generators, which have mostly completed or are implementing retrofits.
Compliance with environmental requirements will require the coordination of construction schedules and maintenance
outages at affected generators to avoid diminishing system reliability. ISO‐NE schedules planned outages up to
approximately two years in advance. At this time, three outages related to environmental retrofits, totaling approximately
1,100 MW, have been scheduled during the assessment period.
Since the Salem Harbor plant is located in the Boston subarea, ISO‐NE performed a reliability review to determine the
impact of the retirement of the full plant. It was found that under certain second contingency scenarios with a 345 kV line‐
out as the initial outage, thermal overloads could exist in the local area. To address these thermal overloads, ISO‐NE and
the affected Transmission Owners have developed plans to perform 115 kV transmission line reconductoring projects on
portions of five lines in the North Shore area prior to the plant retirement. These upgrades are expected to be completed in
May 2014.
There are no major interconnection‐related projects at this time.
To ensure resource adequacy for the system, the amount of capacity the system requires in a given year is determined
through the Installed Capacity Requirement (ICR) calculation, which accounts for uncertainties, contingencies, and resource
performance under a wide range of existing and future system conditions. The ICR is the amount of capacity that must be
obtained through supply‐side and demand‐side resources in the Forward Capacity Market. Through the FCM, which consists
of a series of auctions and bilateral trading periods, specific resources are procured and committed for meeting the ICR, and
218 EPA’s preferred entrainment‐mitigation option requires electric power generating facilities with 125 MGD or higher once‐through cooling water systems to prepare and
submit an entrainment‐characterization study for determining whether they would need to retrofit to closed‐cycle cooling systems. These facilities would need to follow an expedited schedule for submitting CWIS performance data to regulators.

NPCC‐New England
NERC | 2012 Long‐Term Reliability Assessment | November 2012
Page 155 of 335
other key values are identified. Purchased capacity resources must be available in the specified timeframe to ensure the
region has adequate resources.
The FCM’s Forward Capacity Auctions are designed to procure capacity roughly three years (40 months) in advance of the
commitment period. This lead time allows capacity suppliers to develop new capacity resources and enables the ISO to plan
for these new resources.
The results of the most recent Forward Capacity Auction show that New England will have adequate resources through
2015/2016, assuming that resources meet their capacity supply obligations. Most recent increases in capacity have come
from both demand resources and imports from neighboring regions, and approximately 6,600 MW of proposed generation
are in the ISO Generator Interconnection Queue. The ISO remains optimistic that adequate demand and supply resources
will be procured and installed in time to meet the physical capacity needs that will be established by the ICRs for future
years.
Because additional retirements may occur, ISO‐NE is working with stakeholders to identify issues and find the means of
meeting future capacity needs. The ISO is studying the potential retirement of aging units as part of its Strategic Planning
Initiative. The capacity mix in New England currently operates with about 6 GW of fossil‐fueled generating units (primarily
coal or oil) that are older than 40 years. That amount increases to 8.5 GW by 2020. Existing and pending environmental
initiatives that require reduced air emissions and controlled water withdrawals and discharges are placing increased
economic pressure on aging coal‐and oil‐fired units to add environmental controls or to reduce run times. Given their age
and lack of operating revenues and the new capital investment that may be required, many of these coal and oil units are
likely to retire in the latter half of the decade and be replaced with efficient and relatively clean‐burning natural‐gas‐fired
units. The ISO is conducting studies to assess the economic and reliability effects of retiring aging, environmentally
challenged generating units and their likely replacement with natural‐gas‐fired generation, variable renewable resources,
and imports from the neighboring Canadian regions.
ISO‐NE is performing a Strategic Transmission Analysis, which is assessing potential transmission issues associated with
generator retirements and examining “broad” transmission system requirements to integrate renewable resources for the
2020 study year. Some portions of the study will be complete in 2012, which include interim reports, and the remainder of
the study is scheduled for 2013.
The initial study system conditions include the integration of demand resources and the retirement of oil and coal
generating units more than 50 years old. The study also assumes the repowering of existing old coal‐ and oil‐fired
generators with natural gas, which would not require a major expansion of the transmission system. Therefore, the
Strategic Transmission Analysis focuses on the ability of wind, other supplemental capacity, or a combination of all
resources to address the reliability needs resulting from the potential removal of generators, both simultaneously and in
smaller clusters.
Standing and Emerging Reliability Issues Since early 2011, ISO‐NE, the New England states and market participants have engaged in a Strategic Planning Initiative
(SPI) focused on the future of the wholesale electricity sector in New England. ISO‐NE launched the SPI to highlight key risks
to the efficient operation of the wholesale electric markets and reliability of the BPS. As part of the SPI, ISO‐NE sought
feedback from the Region’s stakeholders on the nature and urgency of the risks. Following these discussions, a broad
consensus was reached regarding the risks facing the Region. ISO‐NE has suggested a path forward to both mitigate these
risks and lay the groundwork for an electricity system driven by public policy goals, economic factors, and new
technologies.

NPCC‐New England
NERC | 2012 Long‐Term Reliability Assessment | November 2012
Page 156 of 335
As part of its SPI, ISO‐NE has identified five key risks to the efficient operation of the wholesale electric markets and
reliability of the BPS.219 These five risks, which are both standing and emerging, are:
Resource Performance and Flexibility – related to the uncertain performance and/or constrained operational
accessibility of demand resources and aging supply resources, and the need to increase system flexibility.
Increased Reliance on Natural Gas‐Fired Capacity – related to the reliance on natural‐gas‐only resources, as sufficient
gas may not be available to meet power system needs during periods of very high seasonal demand, under other
stressed system conditions, or when facing contingencies associated with natural gas supply/transportation system
infrastructure.
Retirement of Generators – related to the economic and policy factors that will result in the potential exit of a
substantial portion of existing, older fossil‐fuel capacity.
Integration of a Greater Level of Variable Resources – related to the need for a steady increase in system flexibility as
more variable resources, primarily renewable energy resources are added to the system over the next several years.
Alignment of Markets with Planning – related to the need to better align— from timing and analytic perspectives—
wholesale market procurements with transmission planning processes to allow reliability needs to be met through
either market resources or backstop transmission solutions.
The following discussion will relate to the first three issues listed above: 1) Resource Performance and Flexibility, 2)
Increased Reliance on Natural Gas‐Fired Capacity, and 3) Retirement of Generators. The other two issues are equally
important, but ISO‐NE determined that the first three issues are the highest priority risks that may impact system reliability
in the near term, while the other two issues are longer term in nature.
1: Resource Performance and Flexibility
Recent experience has indicated that the current fleet of resources in New England could be better matched to existing and
likely future system operational needs. Current contingencies assumed in operations and planning are large relative to the
size of the New England system. In practice, since there are limited readily‐available, off‐line reserve resources, the
commitment of additional resources for on‐line reserves is required at times. Moreover, the system has limited flexibility
given the current market incentives and unit performance characteristics. The current circumstances include the slow
response and decreased reliability of older thermal units; the relatively narrow operational band of more responsive, newer
combined‐cycle units; the frequent participation in energy markets of capacity that is responsive but energy‐limited,
rendering it unavailable to serve as reserves or provide ramping functions; and the constrained operational accessibility to
certain classes of demand resources that can only be dispatched in emergency conditions.
Although this issue does not directly impact resource adequacy from a supply/demand balance perspective, it leads to
conditions that increase the complexity of reliable system operations and will likely decrease the efficiency of the wholesale
markets. Reliability will be impacted due to increased commitment and out‐of‐merit dispatch, the potential rejection of
“economic delist bids” due to local reliability concerns, and sanctionable violations of NERC Reliability Criteria. ISO‐NE
expects that the operational challenges related to unit performance and flexibility will increase in severity and frequency
with the retirement of uneconomic generating capacity.
The resulting impact on the transmission system is likely to be negligible. However, the LTRA Reserve Margins may be
impacted depending on remedial measures, such as the derating of units to reflect lower availability, which may result in a
reduction in capacity. The extent of the potential impact is unknown at this time.
The results of studies regarding this issue and implementation of mitigation measures may impact the specific technology
types and operating characteristics of new resource development and procurement.
219 The risks and the path toward mitigation can be found in more detail on the ISO‐NE web site under the Strategic Planning Initiative directory located at: http://www.iso‐
ne.com/committees/comm_wkgrps/strategic_planning_discussion/index.html.

NPCC‐New England
NERC | 2012 Long‐Term Reliability Assessment | November 2012
Page 157 of 335
Contingencies that are larger and more frequent than those currently assumed in ISO‐NE operations and planning could
increase the vulnerability of New England’s electric grid. Increased ramping requirements for both the morning and evening
load pick‐ups (and drop‐offs) could also exacerbate this issue.
2: Increased Reliance on Natural Gas‐Fired Capacity
On several occasions over the past 10 years, New England has faced challenging operating conditions related to the
availability of the Region’s gas‐fired generating capacity (e.g., 2004 Cold Snap, 2009 Sable Island Outage, January 2011 cold
weather, and April/May 2011 liquefied natural gas shortages). These operating conditions were linked to disruptions in
natural gas supply or transportation infrastructure, regional and global natural gas market conditions, and natural gas
availability for power generation under peak “cold snap” natural gas demand conditions. These natural gas‐related
operational and economic risks are already in evidence.
As discussed within the next issue, it is expected that the upcoming unit/station retirements will heighten this gas
dependence risk. The Region will lose (coal and oil‐fired) capacity that currently provides fuel diversity under constrained
gas availability conditions, and the residual and replacement capacity may be primarily natural gas‐fired, or may be of a
resource type that does not provide operational certainty under constrained gas availability conditions.
In support of ISO‐NE’s SPI concerning natural gas, a high‐level, deterministic assessment was performed in 2011 to assess
the ability of the regional gas supply and delivery systems to serve seasonal electric power sector demands based on the
economic dispatch of all generation. The study assessed the gas supply available for New England’s gas‐fired power
generation through 2020 on peak winter and peak summer days. The analysis considered the gas demands of existing
generators as well as a scenario assuming that a portion of the non‐gas‐fired capacity in the assessment area retires and is
replaced with new natural gas‐fired capacity.
The 2011 Natural Gas Study220 concluded that the natural gas pipeline capacity is insufficient during winter for satisfying the
economical gas needs for New England’s power plants during the next decade.
With existing natural gas‐fired capacity in place, the existing natural gas infrastructure is insufficient to meet electric power
system demand (for natural gas) for all study years (i.e., the winter of 2011/12 through the winter of 2019/20) for all
electric system demand scenarios. In the later years of the study, deficiencies reach approximately 625,000 dekatherms per
day (Dth/day) in some years in the reference case, to as much as 1,375,000 Dth/day in the maximum electric demand
scenario. A gas deficit of 240,000 Dth/day is estimated to be equivalent to a shortage of 1,000 MW/day, with an assumed
full‐load heat rate of 10,000 Btu/kWh. No shortages are expected under reference system conditions during the summer
peak because gas local distribution company demand in the summer is minimal, opening up substantial capacity on the
natural gas system in quantities that generally exceed increased summertime power generation demand.
The study also considered natural gas system contingencies for the same assumptions of natural gas and power system
demand. These results and findings are considered Critical Energy Infrastructure Information (CEII).
While the study shows gas‐fired electric generators would have shortfalls in fuel supply and thus seasonal unit availability,
replacement or supplemental (coal‐ and oil‐fired) capacity may soon not be available to the ISO for mitigation purposes.
However, power system reliability can be preserved in a number of ways. Alternate sources of electric energy could be used
when gas supply shortage events are projected, including dual‐fuel generating units using fuels other than natural gas, and
imports from neighboring systems, such as Canada. In addition, the Region is showing growth in Energy Efficiency, and
increased renewable sources of energy will likely develop in the Region. Firm contracting for gas supply and transportation
may also help in mitigation, but “Firm” is still “not‐Firm” under force majeure scenarios.
220 http://www.iso‐ne.com/committees/comm_wkgrps/prtcpnts_comm/pac/reports/2012/gas_study_public.pdf.

NPCC‐New England
NERC | 2012 Long‐Term Reliability Assessment | November 2012
Page 158 of 335
The procurement of non‐Firm natural gas supply and transportation within the electric sector may result in the loss of
single‐fuel gas‐fired stations, thus changing the topology of the integrated electric generation and transmission grid. It is
unknown at this time whether the end result would be an increase or decrease in existing transmission interface
constraints, or the development of new constraints. In addition, the potential unit reductions and unavailability could
directly decrease seasonal Reserve Margins over the study period.
As noted earlier, because the Region is so dependent upon natural gas‐fired generation, any contingency on the regional
gas grid or upstream of New England’s gas grid may temporarily impact fuel deliveries into and throughout the Region.
These contingencies could be in the form of “force majeure” on regional gas infrastructure or originate as a result of
planned or unplanned maintenance.
3: Retirement of Generators
One of the near‐term risks is the potential for substantial unit retirements before the planned long‐term changes can
influence resource development decisions. From a market perspective, the retirement of existing uneconomic capacity is an
efficient outcome and was contemplated in the design of Forward Capacity Market (FCM). The concern, then, is not with
retirements per se; rather, ISO‐NE has identified unit retirements as a strategic risk due to their potential magnitude in a
relatively short time frame, and the interaction between unit retirements and existing challenges associated with the
performance, flexibility, and high gas dependence of the existing fleet.
The capacity mix in New England—a system with summer peak requirements of roughly 30 gigawatts (GW)—includes over
6 GW of fossil‐fueled generating units (primarily coal or oil) that exceed 40 years in age, which run at heat rates exceeding
10,000 Btu/kWh. Oil‐fired generation, representing 22 percent of existing capacity in the Region, operates at an average
capacity factor of less than 1 percent, but during system peaks provides almost 20 percent of the Region’s energy. Under
current fuel prices and other market conditions, this group of resources faces economic challenges. These units may
effectively need to recover all variable and fixed costs, including any new capital investments, from energy markets whose
prices are dictated in many hours by currently low natural gas prices from highly efficient, new generating facilities. In other
words, even without new capital investment requirements, a significant portion of the Region’s generating fleet is at risk of
retirement.
Studies are currently being conducted to assess the resultant reliability impact from both resource adequacy and
transmission security perspectives. While the studies are still unfinished due to the ever‐changing regulatory environment,
the most likely outcomes are shortfalls in summer capacity margins, loss of mitigation measure during winter peak
operations, and possible, various impact on transmission as a result of critical unit/station retirements. The studies are
targeted for approval and publication by the end of 2012.
The direct result of the unit retirements would be a decrease in seasonal Reserve Margins over the study period, barring a
quick influx of replacement capacity. The results of new capacity integration studies and implementation of other
mitigation measures to remediate other SPI risk factors may dictate or impact the specific technology types and operating
characteristics of new resources.
New capital investment requirements associated with emerging U.S. Environmental Protection Agency (EPA) rules related
to mercury/air toxics and cooling water standards could precipitate unit retirements in the latter half of the decade. Any
changes to the proposed regulatory compliance dates moving forward may become problematic. As the long‐term changes
will not be in place in time to influence new resource development, the Region must either consider near‐term
enhancements to the current structures or allow the existing processes to manage the transition.

NPCC‐New York
NERC | 2012 Long‐Term Reliability Assessment | November 2012
Page 159 of 335
NPCC-New York Planning Reserve Margins The New York Balancing Authority (NYBA) is projecting adequate Planning Reserve Margins from 2013–2022, based upon
the current NYBA Installed Reserve Margin (included in this assessment as the NERC Reference Margin Level) (NPCC‐New
York‐Table 1 and NPCC‐New York‐Figure 1).
The current Installed Reserve Margin (IRM) requirement for the NYBA Area that covers the period from May 2012 to April
2013 (2012 Capability Year) is 16 percent. This requirement is based upon an annual study conducted by the New York State
Reliability Council (NYSRC) Installed Capacity Subcommittee (ICS).
NPCC‐New York‐Table 1: Planning Reserve Margins NPCC‐New York‐Summer 2013 2014 2015 2016 2017 2018 2019 2020 2021 2022
ANTICIPATED 25.02% 24.07% 23.21% 22.51% 21.79% 20.68% 19.52% 18.44% 17.16% 16.14% PROSPECTIVE 25.02% 24.07% 23.21% 22.51% 21.79% 20.68% 19.52% 18.44% 17.16% 16.14% ADJUSTED POTENTIAL 25.09% 24.22% 23.59% 24.40% 23.88% 22.75% 21.68% 20.58% 19.28% 18.24%
NERC REFERENCE ‐ 16.00% 16.00% 16.00% 16.00% 16.00% 16.00% 16.00% 16.00% 16.00% 16.00%
NPCC‐New York‐Winter 2013/14 2014/15 2015/16 2016/17 2017/18 2018/19 2019/20 2020/21 2021/22 2022/23
ANTICIPATED 72.02% 66.13% 65.57% 64.94% 64.91% 64.18% 63.17% 61.86% 66.06% 65.33% PROSPECTIVE 72.02% 66.13% 65.57% 64.94% 64.91% 64.18% 63.17% 61.86% 66.06% 65.33% ADJUSTED POTENTIAL 73.36% 68.78% 72.93% 76.46% 76.44% 75.65% 76.06% 74.65% 78.76% 77.98%
NERC REFERENCE ‐ 16.00% 16.00% 16.00% 16.00% 16.00% 16.00% 16.00% 16.00% 16.00% 16.00%
NPCC‐New York‐Figure 1: Summer (Left) and Winter221 (Right) Planning Reserve Margins
Demand The 2011 LTRA forecast compound average growth rate (CAGR) was 0.66 percent from 2012 to 2021, compared to 0.81
percent for this assessment period (2013‐2022).
NPCC‐New York‐Table 2: Demand Outlook NPCC‐New York‐Summer 2013 2022 10‐Year Change CAGR
NET INTERNAL DEMAND 33,696 36,230 2,534 7.5% 0.81%
Load‐Modifying Demand Response 0 0 0 0.0% 0.00%
TOTAL INTERNAL DEMAND 33,696 36,230 2,534 7.5% 0.81%
NPCC‐New York‐Winter 2013/14 2022/23 10‐Year Change CAGR
NET INTERNAL DEMAND 24,929 25,908 979 3.9% 0.43%
Load‐Modifying Demand Response 0 0 0 0.0% 0.00%
TOTAL INTERNAL DEMAND 24,929 25,908 979 3.9% 0.43%
The primary differences between the forecasts are the recovery from the recession in the short term as well as a reduction
in the estimate of peak demand associated with Energy Efficiency programs.
Demand-Side Management Demand Response resources expected to be available on‐peak for the first year of the assessment include 2,165 MW
(summer 2013) of Special Case Resources and 257 MW (summer 2013) of Emergency Demand Response Program (EDRP)
221
Each year represents the initial year of the winter season. For example: 2013 represents the 2013/2014 winter season.
0%
5%
10%
15%
20%
25%
30%
2013 2014 2015 2016 2017 2018 2019 2020 2021 2022
0%
20%
40%
60%
80%
2013 2014 2015 2016 2017 2018 2019 2020 2021 2022

NPCC‐New York
NERC | 2012 Long‐Term Reliability Assessment | November 2012
Page 160 of 335
resources. These numbers are reported in the “2012 Load and Capacity Data Report.”222 The 2013 forecast of peak demand
impact of Energy Efficiency programs is 343 MW (NPCC‐New York‐Table 3).
The Demand Response resources are held constant over the 10‐year assessment period of the NERC LTRA. The cumulative
forecast Energy Efficiency impact on peak demand is 1,674 MW by 2017 and 2,324 MW by 2022. The growth of peak
demand impact is 650 MW during the second five years of the forecast.
NPCC‐New York‐Table 3‐Demand‐Side Management Short‐Term
2022 Share of Total Internal Demand
NPCC‐New York‐Summer 2013 2014 2015 2022 10‐Year Change
Direct Control Load Management (DCLM) 0 0 0 0 0 0.00% Contractually Interruptible (Curtailable) 0 0 0 0 0 0.00% Critical Peak‐Pricing (CPP) with Control 0 0 0 0 0 0.00% Load as a Capacity Resource 2,165 2,165 2,165 2,165 0 5.98%
TOTAL RESOURCE‐SIDE DEMAND RESPONSE 2,165 2,165 2,165 2,165 0 5.98%
TOTAL ENERGY EFFICIENCY 624 932 1,210 2,324 1,700 6.41%
TOTAL DEMAND‐SIDE MANAGEMENT 2,789 3,097 3,375 4,489 1,700 12.39%
The projected levels of Demand Response resources are held constant beyond 2012. The inclusion of Special Case
Resources in this manner is an appropriate assumption for planning purposes as these resources can be added or removed
with short lead times and are driven by market conditions.
No significant developments or policy implementations are known at this time.
The NYBA’s market rules allow for aggregations of demand side resources to provide operating reserves and regulation
service.
Generation The NYBA Area currently enjoys a diverse fuel supply (NPCC‐New York‐Table 4 and NPCC‐New York‐Figure 2). Since the last
reporting year, new resources totaling 633 MW have come on‐line. These include 549 MW of natural gas, 52 MW of wind,
and 32 MW of solar. Additionally, there are 182 MW of unit uprates scheduled for 2012. The most significant generator
uprate is the 168 MW uprate of a nuclear facility. The NYBA expects the reliance on natural gas as the fuel for new
generation to increase over time, and that fuel diversity will decrease as a result.
No current Future‐Planned resources are confirmed to come on‐line during the assessment period at this time. There are a
total of 2,537 MW of Conceptual resources in the NYISO interconnection queue that are at various stages of study that may
come on‐line over the assessment period. These include 2,198 MW of natural gas, 312 MW of nameplate wind capacity, 21
MW of biomass, and 6 MW of hydro‐electric resources.
There are a significant number of generators retiring/mothballing that are impacting the NYBA Area this year. Since last
year, 1,804 MW of generator retirement/mothball notices have been received. 88 MW of generation retired in 2011. The
remaining 1,716 MW are scheduled to retire/mothball during 2012.
222 http://www.nyiso.com/public/markets_operations/services/planning/documents/index.jsp.

NPCC‐New York
NERC | 2012 Long‐Term Reliability Assessment | November 2012
Page 161 of 335
NPCC‐New York‐Table 4‐Capacity Outlook223 Current 2022 Planned 2022 Planned & Conceptual
NPCC‐New York‐Summer Capacity Share Capacity Share Change Capacity Share Change
Coal 2,370 6.4% 1,850 5.2% ‐520 1,850 4.9% ‐520 Petroleum 9,152 24.8% 8,470 24.0% ‐682 8,470 22.4% ‐682 Gas 14,133 38.3% 13,620 38.6% ‐513 15,817 41.8% 1,684 Nuclear 5,431 14.7% 5,599 15.9% 168 5,599 14.8% 168 Other/Unknown 0 0.0% 0 0.0% 0 0 0.0% 0 Renewables 5,771 15.7% 5,786 16.4% 14 6,125 16.2% 353
TOTAL 36,858 100.0% 35,325 100.0% ‐1,533 37,861 100.0% 1,003
NPCC‐New York‐Figure 2‐Summer Net Capacity Change
When the NYISO receives a generator retirement/mothball notice, the NYISO conducts an impact study to determine if
reliability issues will arise when the unit shuts down. If no need is determined, then the unit may retire/mothball as
planned. However, if a need is determined to exist, follow‐up studies are required. If the need is on the local transmission
system, the local transmission owner is required to resolve the reliability need. The solution may be that the unit remains
on‐line as a must‐run unit for reliability. If the local transmission owner provides a solution to maintain reliability, the unit
may then retire/mothball as planned, providing that the solution is in place prior to the retirement/mothballing date. If the
solution will not be in place per the unit’s shutdown schedule, the unit may be required to remain in service until the
transmission owner’s solution is fully implemented. The NYISO would determine the course of action in consultation with
the NYS PSC and NYISO stakeholders. Following implementation of the solution, the unit may then enter the
retired/mothballed status.
If the Reliability Need is determined to be on the BPS, the NYISO’s Comprehensive System Planning Process (CSPP) will
study the need in detail as part of the development of NYISO’s Comprehensive Reliability Plan (CRP). If the Reliability Needs
Assessment (RNA) identifies any violation of Reliability Criteria for bulk power transmission facilities, the NYISO will report a
Reliability Need, quantified by an amount of compensatory megawatts or Mvars, and designate one or more Responsible
Transmission Owners to develop a regulated backstop solution to address each identified need. In addition, after approval
of the RNA, the NYISO will request market‐based and alternative regulated proposals from interested parties to address the
identified Reliability Need.
Proposed solutions that are submitted in response to an indentified Reliability Need are evaluated in the CRP process and
must satisfy Reliability Criteria, including resource adequacy and system security. However, the solutions submitted to the
NYISO for evaluation in the CRP do not have to be in the same amounts of compensatory MW/Mvar or the locations
reported in the RNA. There are various combinations of resources and transmission upgrades that could meet the needs
identified in the RNA. The reconfiguration of transmission facilities and/or modifications to operating protocols identified in
the solution phase could result in changes and/or modifications of the needs identified in the RNA.
223 “Current” represents Existing‐Certain and Future‐Planned projections for the 2012 summer (for summer‐peaking assessment areas) or 2012/2013 winter (for winter‐peaking
assessment areas). “Share” represents the share (percent) of total Existing‐Certain and Future‐Planned capacity projected for the peak season.
‐1,800
‐1,500
‐1,200
‐900
‐600
‐300
0
300
2013 2014 2015 2016 2017 2018 2019 2020 2021 2022
MW

NPCC‐New York
NERC | 2012 Long‐Term Reliability Assessment | November 2012
Page 162 of 335
There is only one significant generator uprate occurring over the assessment period. The Nine‐Mile nuclear facility will
uprate by 168 MW. This will generally have a positive impact on system reliability as nuclear units typically have a very low
forced outage rate and scheduled refueling outages are outside peak demand times. The impact will be more noticeable on
the operational side as the rated summer capability after the uprate will be 1,309 MW. This exceeds the current 1,200 MW
single contingency loss that has been in place for operating reasons and has required that the system carry 1,800 MW of
reserves (600 MW 10‐minute sync, 600 MW 10‐minute non‐sync, and 600 MW 30‐minute). Operating procedures have
been updated to increase the amount of reserves the NYBA carries when the uprate goes into service.
The NYBA neither plans for nor relies on behind‐the‐meter generation for reliability purposes except for those resources
that opt to participate in one of the NYBA’s Demand Response Programs.
There are only two “non‐traditional” resources in the NYBA’s markets. A 20 MW flywheel and an 8 MW storage battery are
listed in the 2012 Gold Book. There is no impact over the assessment period.
The assumed capacity on‐peak for variable resources such as wind, solar, and run‐of‐river hydro included in this assessment
is determined using an expected capability for each resource class based upon unit historic operating data and engineering
judgment. On‐peak land‐based wind resources are rated at 131 MW (nameplate capacity of 1,314 MW). On‐peak solar
resources are expected at 3 MW (nameplate capacity of 32 MW). On‐peak run‐of‐river hydro resources are expected at
3,827 MW. Biomass landfill gas resources are expected on‐peak with a rated capacity of 403 MW (NPCC‐New York‐Table 5,
NPCC‐New York‐Figure 3, and NPCC‐New York‐Table 6).
NPCC‐New York‐Table 5: Renewable Capacity Outlook224 Current 2022 Planned 2022 Planned & Conceptual
NPCC‐New York‐Summer Capacity Share Capacity Share Change Capacity Share Change
Hydro 3,827 66.3% 3,829 66.2% 2 3,835 62.6% 8 Pumped Storage 1,407 24.4% 1,407 24.3% 0 1,407 23.0% 0 Geothermal 0 0.0% 0 0.0% 0 0 0.0% 0 Wind 131 2.3% 132 2.3% 1 444 7.3% 313 Biomass 403 7.0% 415 7.2% 12 435 7.1% 33 Solar 3 0.1% 3 0.1% 0 3 0.1% 0
TOTAL 5,771 100.0% 5,786 100.0% 14 6,125 100.0% 353
NPCC‐New York‐Figure 3: Summer Net Renewable Capacity Change
224 “Current” represents Existing‐Certain and Future‐Planned projections for the 2012 summer (for summer‐peaking assessment areas) or 2012/2013 winter (for winter‐peaking
assessment areas). “Share” represents the share (percent) of total Existing‐Certain and Future‐Planned capacity projected for the peak season.
0
2
4
6
8
10
12
14
16
2013 2014 2015 2016 2017 2018 2019 2020 2021 2022
MW

NPCC‐New York
NERC | 2012 Long‐Term Reliability Assessment | November 2012
Page 163 of 335
NPCC‐New York‐Table 6: Renewable Capacity Outlook: On‐Peak Vs. Installed Current 2022 Planned
NPCC‐New York‐Summer Wind Solar Hydro Biomass Wind Solar Hydro Biomass
Installed Capacity 1,311 32 4,282 403 1,317 32 4,285 415 On‐Peak Derate 1,180 28 454 0 1,186 28 456 0
EXPECTED ON‐PEAK OUTPUT 131 3 3,827 403 132 3 3,829 415
Hourly unit output data is collected for the summer peak hours (2–5 PM) over the June 1 through August 31 period. A
derating factor is then calculated for each resource. The unit‐specific capacity factors calculated are used in the NYISO’s
capacity markets and energy markets. However, for reliability studies and planning assessments a more conservative
approach is used. Wind resources are assumed to operate at approximately a 10 percent capacity factor and solar resources
are expected to operate at a 65 percent capacity factor. Run‐of‐river hydro resources are given an assumed derate factor of
45 percent to account for the uncertainty in the amount of water available at peak. Biomass and landfill gas resources are
modeled with the unit’s rated capability and an associated forced outage rate.
Capacity Transactions Unforced Capacity Deliverability Rights (UDRs) are rights associated with new incremental controllable transmission
projects that provide a transmission interface to a NYCA locality where a minimum amount of Installed Capacity must be
maintained. Three such projects are currently in service with a total transmission capability of 1,290 MW. A fourth project
(660 MW transmission capability with 320 MW Firm capacity rights) is scheduled to be in service for May 2013. Capacity
transactions associated with a UDR are considered confidential market data. Only net capacity import/export totals can be
provided to maintain market confidentiality.
External capacity (ICAP) purchases and sales are administered by the NYISO. An annual study is performed to determine the
maximum level of capacity imports from neighboring control areas allowed without violating the LOLE criteria. Firm imports
decline slightly from 2,270 MW in 2013 to 2,220 MW in 2022 while expected imports remain unchanged at 1,353 MMW
throughout the assessment period (NPCC‐New York‐Table 7). Except for grandfathered contracts, these Import Rights are
allocated on a first‐come, first‐serve basis with a monthly obligation. While capacity purchases are not required to have
accompanying Firm transmission, adequate external transmission rights must be available to assure delivery to the NYBA
border when scheduled. All external ICAP suppliers must also meet the eligibility requirements as specified in the Installed
Capacity Manual.
NPCC‐New York‐Table 7: Projected Capacity Transactions NPCC‐New York‐Summer 2013 2014 2015 2016 2017 2018 2019 2020 2021 2022
Expected Imports 1,353 1,353 1,353 1,353 1,353 1,353 1,353 1,353 1,353 1,353 Firm Imports 2,270 2,220 2,220 2,220 2,220 2,220 2,220 2,220 2,220 2,220
TOTAL IMPORTS 3,623 3,573 3,573 3,573 3,573 3,573 3,573 3,573 3,573 3,573
Expected Exports 0 0 0 0 0 0 0 0 0 0 Firm Exports 0 0 0 0 0 0 0 0 0 0
TOTAL EXPORTS 0 0 0 0 0 0 0 0 0 0
TOTAL NET CAPACITY TRANSACTIONS 3,623 3,573 3,573 3,573 3,573 3,573 3,573 3,573 3,573 3,573
Only Firm contracts longer than one year are considered in planning studies and reliability assessments. These are reviewed
annually in the preparation of the annual Gold Book publication.
Only the known duration of any Firm contracts of at least one year are considered in planning studies and reliability
assessments.
The NYBA does not rely on emergency imports to maintain reliability. However, transfer capability is reserved on the ties
with our neighbors in our planning studies to allow for emergency imports as one potential emergency operating procedure
step in the event of a system emergency. These imports would be external to the NYBA.
Transmission The Hudson Transmission Project (HTP) is a new tie‐line between PJM and NYISO from PSE&G’s Bergen 230 kV substation to
ConEdison’s W. 49th Street 345 kV Station. The project consists of a back‐to‐back HVdc converter in New Jersey with a

NPCC‐New York
NERC | 2012 Long‐Term Reliability Assessment | November 2012
Page 164 of 335
submarine 345 kV ac cable from the converter station to New York City. The project will be capable of transferring 660 MW
but has Firm capacity withdrawal rights from PJM of 320 MW. The project is currently under construction with a planned in‐
service date of May 2013. Additional local transmission owner plans include sub‐transmission system reinforcements
throughout the state. Existing and projected transmission additions are summarized below (NPCC‐New York‐Table 8).
NPCC‐New York‐Table 8: NPCC‐New York‐Table 8: Existing and Projected Transmission NPCC‐New York AC (Circuit Miles) DC (Circuit Miles) Total (Circuit Miles)
EXISTING 10,926 66 10,992
Currently Under Construction 0 0 0 Planned ‐ Completed within First Five Years 138 0 138 Planned ‐ Completed within Second Five Years 30 0 30
2022 TOTAL (UNDER CONSTRUCTION & PLANNED) 11,094 66 11,160
Conceptual ‐ Completed within First Five Years 0 0 0 Conceptual ‐ Completed within Second Five Years 0 0 0
2022 TOTAL (UNDER CONSTRUCTION, PLANNED & CONCEPTUAL) 11,094 66 11,160
Historically the most congested transmission paths in New York are Central East, Leeds–Pleasant Valley, and Dunwoodie–
Shore Road. Central East and Leeds–Pleasant Valley constraints are driven by demands in the Lower Hudson Valley resulting
in high transfers of power from Upstate New York to New York City. The Dunwoodie–Shore Road constraint is driven by
Long Island demand. These constraints could be mitigated through additional transmission, generation, or demand
reduction.
There are no project delays or temporary service outages for any transmission facilities that will impact long‐term reliability
during the assessment period.
The NYISO Minimum Interconnection Standard provides that sufficient transmission is constructed to provide reliable
access by any given proposed generation project to the New York State Transmission System. In addition, any generation
developer seeking to qualify as an Installed Capacity Supplier must meet the NYISO Deliverability Interconnection Standard,
which may require the construction of transmission.
The NYISO’s role in the interconnection process is that of process administrator, project and system evaluator, and arbiter
to ensure that the Project Developer and Transmission Owner collaborate in good faith to keep the project moving forward
in a non‐discriminatory manner. The process includes the identification and cost allocation of system upgrades necessary
for the safe and reliable interconnection to the BPS. This process includes:
Interconnection Request submission, review, validation and approval;
Scoping of project, including NYISO receipt of necessary technical data for each;
Scoping of Feasibility Study(ies), including execution of study agreement and NYISO receipt of necessary technical
data;
Conducting Feasibility Study(ies) with final report meeting with Developer and Transmission Owner;
Scoping of System Reliability Impact Study(ies), including execution of study agreement and NYISO receipt of
necessary technical data;
Conducting System Reliability Impact Study(ies) with final report meeting with Developer and Transmission Owner;
Scoping of Facilities Study(ies), including execution of study agreement and NYISO receipt of necessary technical data;
Conducting Class Year Facilities Study(ies) with system facilities upgrades and capacity deliverability cost allocation,
with final report meeting with Developer and Transmission Owner;
Submission and approval of Class Year Facilities Study(ies) to NYISO Market Participant governance working groups,
sub‐committees and Operating Committee;
Decisions of Project Developers to accept or not accept their Project Cost Allocations for system upgrades; and
Interconnection Agreements provided to Developer, including proof of continued site control and the achievement of
development milestones, to be filed with FERC.

NPCC‐New York
NERC | 2012 Long‐Term Reliability Assessment | November 2012
Page 165 of 335
As part of the DOE Smart Grid Investment Grant, 888 Mvar of smart grid‐enabled capacitor banks will be installed at various
sub‐transmission voltage levels throughout the state by the end of 2012, and 39 phasor measurement units (PMUs) will be
installed at bulk power stations throughout New York by June 2013.
Vulnerability Assessment The NYBA Area has a significant amount of hydro resources. Many of these resources are located on rivers throughout the
state. The output of these run‐of‐river resources are subject to water levels that may vary greatly on a month‐to‐month
basis based upon weather conditions—snowfall amounts, temperature, and rainfall amounts, etc. For reliability purposes
these units are modeled with a 45 percent derate factor. This derate factor represents a severe scenario case for drought or
low water level.
There are no expected long‐term generator outages over the assessment period. Demand Response resources are modeled
conservatively in planning studies to account for the possibility of these resources being unavailable or non‐responsive. The
NYBA does not rely on distributed generation for reliability.
As the amount of variable resources, such as wind, has been added to the resource mix, procedures have been modified
and updated. For example, the NYBA has implemented a centralized wind forecasting program to better estimate the
amount of energy to be produced by wind resources over various time frames. There are no planned installations of
additional UVLS schemes or Special Protection Systems (SPS) in the NPCC‐New York Assessment Area.
The NYISO evaluates extreme contingencies as required by the New York State Reliability Council, such as the loss of all
transmission circuits on a common right‐of‐way, or the sudden loss of a fuel delivery system (i.e., gas pipeline
contingencies). The NYISO also evaluates extreme system conditions such as extreme weather or loss of gas supply (i.e.,
shortage).
Should natural gas supply shortages arise in New York State in the winter, natural gas‐fired units could be forced to burn
other fuels or curtail operations. Many of the dual‐fuel units are the larger and older steam units located in load pockets
and would impact reliability needs in multiple ways if they were to retire and if replacement capacity with dual‐fuel
capability was not available. The real challenge on a going‐forward basis will be to maintain the benefits that fuel diversity,
in particular dual fuel capability, provides today. This will be especially critical in New York City and Long Island, which are
entirely dependent on oil‐ and gas‐fired units, many of which have interruptible gas transportation contracts. In terms of
operational strategy, the NYSRC has adopted the following local reliability rule where a single gas facility refers to a pipeline
or storage facility:
I‐R3. Loss of Generator Gas Supply (New York City & Long Island)
“The NYS BPS shall be operated so that the loss of a single gas facility does not result in the loss of electric load within the
New York City and Long Island zones.” The NYISO categorizes generation capacity fuel types into three supply risks: Low,
Moderate, and High.
The greatest risk to fuel supply interruption occurs during the winter months when both natural gas and heating fuel oils
are competing to serve electrical and heating loads. Fortunately in New York, peak electrical loads occur during the summer
months when demand is approximately 9,000 MW greater than the winter peak. As such, New York can meet the winter
peak of roughly 25,000–26,000 MW with sufficient generation without exposure to significant fuel risks. Even with a forced
outage rate of 10 percent, there is sufficient generation in the low to moderate fuel risk categories to meet the winter
electrical peak.
On June 25, 2007, FERC Order 698 incorporated by reference NAESB (North American Energy Standards Board) standards to
“establish communication protocols between interstate pipelines and power plant operators and transmission owners and
operators.” The NYISO has met this requirement with the establishment of communication systems to receive notices of
system events, including Operational Flow Orders from interstate pipelines serving generators in New York, and by

NPCC‐New York
NERC | 2012 Long‐Term Reliability Assessment | November 2012
Page 166 of 335
establishing communication systems to send Energy Emergency Alerts to the Interstate Pipelines. The NYISO will also notify
Local Distribution Companies in the event of a system alert. These communication protocols are documented in
Attachment BB of the NYISO Open Access Transmission Tariff.
New York has a long history in the active development of environmental policies and regulations that govern the
permitting, construction and operation of power generation and transmission facilities. Currently New York’s standards for
permitting new generating facilities are among the most stringent in the nation. The combination of tighter environmental
standards coupled with competitive markets administered by the NYISO since 1999 has resulted in the retirement of older
plants equaling approximately 4,000 MW of capacity and the addition of over 9,300 MW of new efficient generating
capacity. In turn, these changes have led to a marked reduction of power plant emissions and a significant improvement in
the efficiency of the generation fleet.
Notwithstanding the progress toward achieving New York’s clean energy and environmental goals, various environmental
initiatives are either in place or pending that will affect the operation of the existing fleet. Environmental initiatives that
may affect generation resources may be driven by either or both the state and federal programs. Since the prior LTRA, the
USEPA has promulgated several regulations that could affect most of the thermal fleet of generators in NYCA. Similarly, the
New York State Department of Environmental Conservation (NYSDEC) has undertaken the development of several
regulations that will apply to most of the thermal fleet in the state.
The NYISO performs analysis to gain insight into the population of resources that are likely to be faced with major capital
investment decisions in order to achieve compliance with several evolving environmental program initiatives. The premise
of this analysis is that the risk of unplanned retirements is related to two factors: first, the capital investment decisions
resource owners need to make in order to achieve compliance with the new regulatory program requirements, and
secondly, the recent change in the relative attractiveness of gas versus coal has challenged the viability of some base‐load
units. The goal of this scenario analysis is to identify when and where these risks occur on the New York Power System.
Five environmental initiatives are sufficiently broad in application and have requirements that potentially may require
retrofitting environmental control technologies. Therefore Generator Owners will likely need to address the retirement
versus retrofit question. These environmental initiatives are NYSDEC’s Reasonably Available Control Technology for Oxides
of Nitrogen (NOx RACT), Best Available Retrofit Technology (BART), Best Technology Available (BTA) for cooling water intake
structures, the USEPA’s Mercury and Air Toxics Standards (MATS), and the Cross State Air Pollution Rule (CSAPR), which is
currently under review in court.
NOx RACT
The NYS DEC finalized new regulations for the control of emissions of nitrogen oxides (NOx) from fossil‐fueled power plants
(Part 227‐2). The regulations establish presumptive emissions limits for each type of fossil‐fueled generator and each fuel
used as an electric generator in New York that has a capacity greater than 25 MW. Compliance options include averaging
emissions with lower emitting units, fuel switching, and installing emissions reduction equipment such as low NOx burners
or combustors, selective catalytic reduction units, or retirement. Generators were required to file permit applications and a
RACT analysis with NYSDEC by January 1, 2012. Compliance with approved plans is required by July 1, 2014. The plans have
been reviewed. Several generators have requested that their submittals be considered Competitive Business Information;
however, NYSDEC has denied these requests.
Reviewing the plans that are public, the rule applies to approximately 28,000 MW of capacity, of which approximately 4,000
MW is involved in emissions reduction projects. Some of these projects are underway, and the NYISO is informed that the
balance should be able to be accomplished prior to the July 2014 compliance date.
BART
The NYSDEC recently promulgated a new regulation: Part 249, Requirements for the Applicability, Analysis, and Installation
of Best Available Retrofit Technology (BART) Controls. The regulation applies to fossil‐fueled electric generating units with

NPCC‐New York
NERC | 2012 Long‐Term Reliability Assessment | November 2012
Page 167 of 335
approximately 8,200 MW of capacity built between August 7, 1962 and August 7, 1977, and is necessary for New York State
to comply with provisions of the federal Clean Air Act that are designed to improve visibility in National Parks. The
regulation requires an analysis to determine the impact of an affected unit’s emissions on visibility in national parks. If the
impact is greater than a prescribed minimum, then emissions reductions must be made at the affected unit. The
compliance deadline is January 1, 2014. Emissions control of sulfur dioxide (SO2), nitrogen oxides (NOx) and particulate
matter (PM) may be necessary. Compliance plans were filed with NYSDEC in October 2011. In April, USEPA announced that
it had accepted some plans, was awaiting further administrative actions on other plans and had declared specific lower
emissions limits for other plans. Several small units have chosen to retire, representing a capacity loss of less than 50 MW.
Other plants will achieve the required emissions reductions through the use of cleaner fuels, while others are undertaking
retrofit projects. Approximately 500 MW of capacity may be needed to undertake a major emissions reduction project or
switch to cleaner fuels, or shut down.
BTA
The NYS DEC has finalized its policy document “Best Technology Available (BTA) for Cooling Water Intake Structures.” The
policy applies to plants that use once‐through cooling with design intake capacity greater than 20 million gallons/day. The
policy prescribes reductions in fish mortality and establishes performance goals for new and existing cooling water intake
structures. The performance goals call for the use of wet, closed‐cycle cooling systems at existing generating facilities. The
policy does provide some limited relief for plants with historical capacity factors less than 15 percent. The policy is applied
at the time that the generating facility’s State Pollution Discharge Elimination System (SPDES) Permit is renewed, which is
theoretically a five‐year period.
Generators with approximately 18,000 MW of capacity are subject to this policy. Of that total, generators with 4,000‐7,000
MW may need to retrofit their cooling water intake technology. If cooling tower retrofits are required, compliance
deadlines will be project‐specific.
Mercury and Air Toxics Standards
The USEPA announced the final rule in December 2011. The final rule replaced what had been known as the Maximum
Achievable Control Technology, or MACT Rule. The rule establishes limits for Hazardous Air Pollutants (HAPs)—for acid
gases, Hydrogen Chloride (HCl), Hydrogen Fluoride (HF), Mercury (Hg), and Particulate Matter. Alternative limits were also
established. These limits apply to coal‐ and oil‐fired generators. The compliance date is March 2015. The NYS DEC may
provide an additional year to comply if necessary. Further, reliability critical units can qualify for another year to achieve
compliance if retrofitting emissions control technology is required or if the reliability improvement project will take an
additional year to comply. 11,331 MW of capacity in New York will be affected by this regulation. The USEPA established a
subcategory for limited use oil‐fired generators. Units that maintain a capacity factor on oil that is less than 8 percent will
be more lightly regulated. No oil‐fired EGUs exceeded the 8 percent Capacity Factor when firing oil in 2009 and 2010. While
these units will remain subject to MATS, it is not expected that significant emissions control retrofit projects will be
required at these units.
A review of emissions records was done to determine the best level of emissions reductions that has been shown to be
sustainable. These emissions levels were compared to those necessary to comply with MATS for coal‐fired units. This review
shows that most of the coal‐fired units in New York are already capable or nearly capable of complying with MATS. In
addition, NYS DEC has promulgated Part 246: Mercury Reduction Program for Coal‐Fired Electric Utility Steam Generating
Units, which establishes emissions limitations that are currently in effect in New York to reduce mercury emissions. Phase II
of this regulation requires additional reductions from coal‐fired boilers in 2015. The Phase II emissions limitations are more
stringent than the USEPA MATS limits.
CSAPR
The USEPA finalized the Cross State Air Pollution Rule (CSAPR) in December 2011. The rule is designed to reduce interstate
transport of emissions of SO2, Annual NOx and Ozone Season NOx from fossil‐fueled power plants in 28 central and eastern

NPCC‐New York
NERC | 2012 Long‐Term Reliability Assessment | November 2012
Page 168 of 335
states. The regulation is implemented through the use of emissions allowances and limited trading programs. The
regulation establishes emissions budgets for each affected state. The emissions budget is then divided on a pro‐rata basis
determined by historic heat input for existing facilities. There are set‐asides to provide allowances to new fossil generators.
The use of emissions allowances will be expected to increase offering prices for generation from affected facilities. The final
rule was placed under a stay by the United States District Court. However, for the stay, the rule would be in effect currently
with another reduction in the SO2 cap scheduled for 2014. While this rule is currently the subject of an appeal, the NYISO
has included the impact from the rule in its analysis because the Clean Air Act requires the USEPA to address interstate
pollution transport in some form. CSAPR is the USEPA’s revision of the Clean Air Interstate Rule (CAIR), which was vacated
by the U.S. Supreme Court. In doing so, the Court ordered that CAIR remain in effect until such time as a replacement rule is
implemented. In December when the District Court stayed the CSAPR rule, it ordered that CAIR be reinstated. CAIR as
promulgated has a significant reduction in allowable emissions scheduled for 2015. It is reasonable to assume that a
national program will be in effect for limiting emissions of SO2 and NOx via a cap‐and‐trade program in the early part of the
planning horizon. The CSAPR rule will be used to evaluate the potential impact of that program.
The CSAPR rule applies to most of the fossil‐fueled fleet with nameplate capacity greater than 25 MW. The rule will require
the use of allowances in numbers equivalent to actual emissions tonnages for three categories: SO2, Annual NOx, and for
Ozone Season NOx. The annual budget for each of the states in the program has been established by USEPA through the
use of long‐range transport models to identify sources and sinks for impact of emissions on areas in other states. The
budget of allowances for each of the three categories is distributed based upon each affected unit’s pro‐rata share of
historic heat input. A small set‐aside is established for new units, and recently retired units continue to receive allowances
for a limited time period. The rule calls for a two‐phase reduction of SO2, while the limits for Annual NOx and Ozone Season
NOx are fixed. The program limits the amount of allowances that can be obtained through trading with Generator Owners
in other states. The total of the budget plus allowed traded allowances is known at the “Assurance Level.” Should a state’s
emissions exceed the Assurance Level, two additional allowances would need to be surrendered for each ton of excess
emissions. This penalty would be pro‐rated across all emitters who exceeded their direct allocation plus the allowed trading
percentages.
Historic emissions and inventories of installed emissions control equipment have been reviewed to estimate the level of
additional emissions reductions required. As detailed in the figure below, with optimum operation of existing
environmental control equipment and fuel switching, New York State should be able operate within the Assurance Level.
The NYISO has conducted the analysis described above to identify generating units that are subject to key environmental
initiatives. The analysis also estimated the amounts of capacity that would be potential candidates for retrofits and thus
require recapitalization. These units could become unplanned retirements. The analysis then was extended to identify the
amounts of capacity that are subject to multiple environmental requirements. The bi‐annual Reliability Needs Assessment
conducts scenario evaluations. In particular, the results of an analysis of the NYISO “zones at risk” are compared to the
amount of capacity that could be considered at risk for unplanned retirement due to the need for capital expenditures to
retrofit environmental control technology.
GE conducted a study of the amount of time necessary for NOx emissions control retrofits. The study concluded that
required retrofit installations could be covered within the time frame of major turbine/generator overhaul. It is reasonable
to expect that other outages necessary for emissions control technology retrofits would require similar time periods for
equipment tie‐in. Given the time horizon for outage scheduling and the capacity balance in NYBA Area, it is reasonable to
conclude that bulk system reliability will not be negatively affected.
Plans for Accommodating Generator Retirements and Environmental Control Retrofits
The NYISO has reviewed compliance plans that have been filed by generators for NYSDEC’s NOx RACT and BART programs,
as well as, USEPA notices on acceptance or modifications to those plans. The plans were obtained from NYSDEC through a
Freedom of Information Law request.

NPCC‐New York
NERC | 2012 Long‐Term Reliability Assessment | November 2012
Page 169 of 335
The generators are not required to file compliance plans with NYSDEC for MATS compliance. They are however, required to
notify the NYISO by March of 2013 if they intend to seek additional time to comply with MATS. To date, no such
notifications have been received.
The USEPA recently announced that it will take another year to finalized regulations for cooling water systems that use
public waters. In the interim, NYSDEC will continue to administer its Best Technology Available Policy on a case by case basis
as permits are renewed. The NYISO meets periodically with NYSDEC to review the status of permit renewals.
A three‐judge panel of the United States Court of Appeals for the District of Columbia Circuit vacated CSAPR and the
Transport Rule Federal Implementation Plans, in an order issued August 21, 2012. The Court remanded the proceeding to
the EPA and ordered it to continue to administer CAIR pending a valid replacement. Consequently, generators have not
announced any compliance plans relative to this program. The table below has been updated to reflect increases in New
York’s CSAPR Allowance Budget that have been announced by USEPA, as well as, to take into account recently announced
retirements (NPCC‐New York‐Table 9).
NPCC‐New York‐Table 9: NY State Emission Allocation under CSAPR 2012 SO2 2014 SO2 Annual NOX Ozone Season NOX
A. Allocation for Units Proposed to be In‐Service 26,060 19598 16,334 7,898
B. Retired Units [2] + Non‐EGU Allocations [3] + Miscellaneous [4] 9,510 7407 4,954 2,264
C. New Unit Set‐Aside 726 551 434 207
D. Total Allocation (A+B+C) 36,296 27,556 21,722 10,369
E. Trading Variability for 2014 (18% Annual, 21% Ozone Season) N/A 4960 3,910 2,177
F. 2014 Assurance Level (D+E) N/A 32,516 25,632 12,546
Historic Emissions
G. 2011 Emissions from Units Proposed to be In‐Service 24,020 17,153 8,533
H. Estimated 2011 In‐Service Unit Emissions ‐ Best Demonstrated Performance 14,972 13,076 6,765
(2011 Actual Heat Input Lowest Annual Emissions Rate from 2006‐2011)
I. 2011 "New Unit" Emissions 11 134 58 [1] Linked Cogeneration Facility is not included.
[2] Retired Units Include: Poletti, Projec Orange, Greenidge, Westober, Ogdensburg Cogen, Astoria Generating ST2 and 4, Glenwood ST 4 and 5, Far Rockaway ST4, Dunkirk 1‐4, and AES Cayuga. [3] Three (3) Consolidated Edison Steam System Boilers were given allocations. [4] EPA calculation and rounding error.
The NYISO’s Draft 2012 Reliability Needs Assessment225 considers a scenario where all coal fired units are retired. The study
can be found on the NYISO website.226 The study found that the retirement of all coal units would accelerate the year of
need to 2019 from 2020. The table below identifies the programs, their current status, compliance dates, quantities of
capacity affected and announced and estimated quantities of capacity that is expected to undergo retrofits of
environmental control equipment (NPCC‐New York‐Table 10).
NPCC‐New York‐Table 10: Other Environmental Regulation Status, Compliance Deadlines, and Potential Impacts in New York Rule/Legislation Status Compliance Deadline Approximate Capacity Affected Potential Retrofits
Nox RACT In Effect Jun‐14 26,700 6,000 MW
238 Units 23 Units
BART In Effect Jan‐14 8,600 MW 1,800 MW
19 Units 5 Units
MATS In Effect Mar‐15 10,300 MW 400 MW
28 Units 2 Units
BTA In Effect Upon Permit Renewal 16,900 MW 4,400 MW ‐7,300 MW
39 Units ‐
CSAPR Stayed While in Litigation January 2012 and January 2014 25,000 MW 2,400 MW
156 Units 11
RGGI In Effect In Effect 25,000 MW ‐
158 Units ‐
Generator Owners and Operators have not informed the NYISO that they will be unable to meet the compliance deadlines
established in these programs. The NYISO has procedures in place to approve outages and will use these procedures to
maintain reliability of the system during the periods of retrofit installations.
225 The draft RNA will not be final until the Board approves the report in September. 226 http://www.nyiso.com/public/markets_operations/committees/meeting_materials/index.jsp?com=mc.

NPCC‐New York
NERC | 2012 Long‐Term Reliability Assessment | November 2012
Page 170 of 335
The Astoria 345/138 kV transformer and phase angle regulator were installed in 2012 between Astoria Annex 345 kV and
Astoria East 138 kV to maintain reliability on the non‐bulk system in response to the mothballing of generation units Astoria
2 and Astoria 4. Non‐bulk transmission needs have been identified in Western New York in association with the mothballing
of the Dunkirk coal plant. Transmission solutions have not yet been finalized. Transmission needs relating to the integration
of new generation are addressed on a class year basis in accordance with the NYISO Open Access Transmission Tariff.
Following the completion of the NYISO 2012 Reliability Needs Assessment, the NYISO will request market solutions
(including transmission, generation, or demand response) to address any reliability needs.
Standing and Emerging Reliability Issues The NYBA identified two issues in the 2011 NERC LTRA narrative that could continue to impact reliability over the long‐term
assessment period. They were a) the impact of federal and state environmental regulations, and b) project lead times. For
this report, the two issues remain as standing reliability issues.
The potential impact to system reliability due to state and federal environmental regulations is a standing reliability issue as
discussed in last year’s NERC LTRA. There are five major environmental initiatives that have requirements that may
potentially require retrofitting environmental control technologies.
The timing of reliability impacts will vary with the compliance date of various environmental initiatives. Generator units
affected by BART must comply by January 1, 2014. BTA policy rules will be applied at the time the State Pollution Discharge
Elimination System Permit is renewed, which is theoretically over a five‐year period. Compliance deadlines will be project‐
specific. Units that must comply with the Mercury and Air Toxic Standards have until March 2015. Units subject to the NOx
RACT regulations have until July 1, 2014 to comply. Units subject to CSAPR regulations must comply in 2015.
The primary drivers are to reduce the amount of power plant emissions into the environment and to increase the efficiency
of the generation fleet by encouraging the building and utilization of more efficient, more environmentally friendly
resources.
Environmental regulations may lead some generation resources to retire, as the cost to meet the new regulations may not
be economical for some units. Depending upon the regulation, as low as 500 MW to as much as 28,000 MW may be
affected. The impact will depend upon the amount and location of the retiring generation.
BPS reliability could be affected if critical units that support the BPS are retired. However, as the NYBA, the NYISO has the
authority to designate the Responsible TO or Responsible TOs to proceed with a regulated backstop solution in order to
maintain system reliability in the event that market‐based solutions do not materialize to meet a reliability need in a timely
manner. The impact on BPS reliability due to generator retirements is for the most part localized, where following the
retirement the transmission in the affected area is relied upon more heavily to serve load in that area. Certain generator
retirements or combinations of retirements may result in the need for significant transmission upgrades absent other
generator or Demand Response solutions.
The bulk power transmission facilities could be affected if critical units that support the BPTF are retired. However, the
NYBA has the authority to designate the Responsible TO or Responsible TOs to proceed with a regulated backstop solution
in order to maintain system reliability in the event that market‐based solutions do not materialize to meet a reliability need
in a timely manner. The impact would be dependent upon the criticality of the need being resolved.
If generation units ultimately retire as a result of environmental issues, the Planning Reference Margin would be adjusted
accordingly. This would also affect the total MW of generation capacity and the fuel mix of the resources reported.
Generation retirements would affect the total MW of generation capacity and the fuel mix of the resources reported and
would also have the potential to impact the entire Assessment Area.
When reliability needs are identified, solutions (generation, transmission, or Demand‐Side measures) are solicited through
the NYISO’s Comprehensive System Planning Process. Competitive market‐based solutions are given first priority because of

NPCC‐New York
NERC | 2012 Long‐Term Reliability Assessment | November 2012
Page 171 of 335
their reduced risk to rate‐paying consumers. Given the potentially short notice period coupled with the potentially
significant impact, gap solutions or regulated backstop solutions may be necessary in some situations if market solutions do
not respond in time.
If generation units shut down in response to the regulations, the vulnerability of the system may increase due to the
decrease in resources. The NYISO would respond by invoking regulatory backstop solutions or gap solutions as required by
the circumstances.
The project lead time issue was identified in the 2012 Long‐Term Reliability Assessment. Long project lead times may affect
reliability over the assessment period depending upon the impact of the environmental initiatives on the NYBA Area’s fleet.
Considerable lead time is required for power infrastructure project execution, given the time frames needed to finance,
permit, and construct major energy projects. The planning horizons of policy makers and regulators should encompass the
time required for the electric industry to address new laws and changes in regulatory requirements.
Resource adequacy is a function of the amount of generation resources available to meet the system load. If resources are
not added in a timely manner to meet projected demand, reliability may be negatively impacted. The impact would vary
depending upon the timing and scope of the need.
This issue may affect the BPS reliability if projects critical to maintaining reliability are delayed because of the process.
This issue may affect the bulk power transmission facilities if projects critical to maintaining reliability are delayed because
of the process. The impact would depend upon the timing and scope of the need.
The estimated in‐service dates for Conceptual resources may be pushed back further due to time considerations (assuming
the project moves forward to construction). This would affect the Adjusted Potential Reference Margin Level with minimal
impact on the overall assessment.
When reliability needs are identified, solutions (generation, transmission, or Demand‐Side measures) are solicited through
the NYISO’s Comprehensive System Planning Process. Competitive market‐based solutions are given first priority because of
their reduced risk to rate‐paying consumers. Ultimately, if generation units are not built in a timely manner to meet system
demand, the impact to BPS reliability may increase.
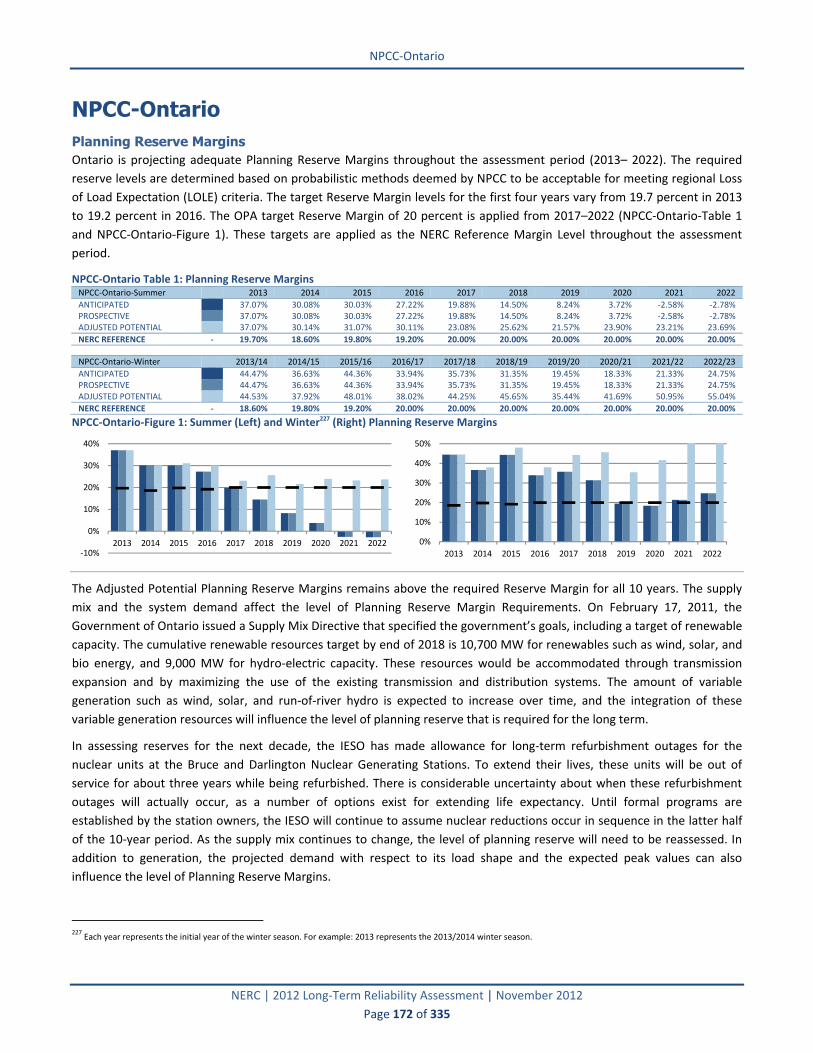
NPCC‐Ontario
NERC | 2012 Long‐Term Reliability Assessment | November 2012
Page 172 of 335
NPCC-Ontario Planning Reserve Margins Ontario is projecting adequate Planning Reserve Margins throughout the assessment period (2013– 2022). The required
reserve levels are determined based on probabilistic methods deemed by NPCC to be acceptable for meeting regional Loss
of Load Expectation (LOLE) criteria. The target Reserve Margin levels for the first four years vary from 19.7 percent in 2013
to 19.2 percent in 2016. The OPA target Reserve Margin of 20 percent is applied from 2017–2022 (NPCC‐Ontario‐Table 1
and NPCC‐Ontario‐Figure 1). These targets are applied as the NERC Reference Margin Level throughout the assessment
period.
NPCC‐Ontario Table 1: Planning Reserve Margins NPCC‐Ontario‐Summer 2013 2014 2015 2016 2017 2018 2019 2020 2021 2022
ANTICIPATED 37.07% 30.08% 30.03% 27.22% 19.88% 14.50% 8.24% 3.72% ‐2.58% ‐2.78% PROSPECTIVE 37.07% 30.08% 30.03% 27.22% 19.88% 14.50% 8.24% 3.72% ‐2.58% ‐2.78% ADJUSTED POTENTIAL 37.07% 30.14% 31.07% 30.11% 23.08% 25.62% 21.57% 23.90% 23.21% 23.69%
NERC REFERENCE ‐ 19.70% 18.60% 19.80% 19.20% 20.00% 20.00% 20.00% 20.00% 20.00% 20.00%
NPCC‐Ontario‐Winter 2013/14 2014/15 2015/16 2016/17 2017/18 2018/19 2019/20 2020/21 2021/22 2022/23
ANTICIPATED 44.47% 36.63% 44.36% 33.94% 35.73% 31.35% 19.45% 18.33% 21.33% 24.75% PROSPECTIVE 44.47% 36.63% 44.36% 33.94% 35.73% 31.35% 19.45% 18.33% 21.33% 24.75% ADJUSTED POTENTIAL 44.53% 37.92% 48.01% 38.02% 44.25% 45.65% 35.44% 41.69% 50.95% 55.04%
NERC REFERENCE ‐ 18.60% 19.80% 19.20% 20.00% 20.00% 20.00% 20.00% 20.00% 20.00% 20.00%
NPCC‐Ontario‐Figure 1: Summer (Left) and Winter227 (Right) Planning Reserve Margins
The Adjusted Potential Planning Reserve Margins remains above the required Reserve Margin for all 10 years. The supply
mix and the system demand affect the level of Planning Reserve Margin Requirements. On February 17, 2011, the
Government of Ontario issued a Supply Mix Directive that specified the government’s goals, including a target of renewable
capacity. The cumulative renewable resources target by end of 2018 is 10,700 MW for renewables such as wind, solar, and
bio energy, and 9,000 MW for hydro‐electric capacity. These resources would be accommodated through transmission
expansion and by maximizing the use of the existing transmission and distribution systems. The amount of variable
generation such as wind, solar, and run‐of‐river hydro is expected to increase over time, and the integration of these
variable generation resources will influence the level of planning reserve that is required for the long term.
In assessing reserves for the next decade, the IESO has made allowance for long‐term refurbishment outages for the
nuclear units at the Bruce and Darlington Nuclear Generating Stations. To extend their lives, these units will be out of
service for about three years while being refurbished. There is considerable uncertainty about when these refurbishment
outages will actually occur, as a number of options exist for extending life expectancy. Until formal programs are
established by the station owners, the IESO will continue to assume nuclear reductions occur in sequence in the latter half
of the 10‐year period. As the supply mix continues to change, the level of planning reserve will need to be reassessed. In
addition to generation, the projected demand with respect to its load shape and the expected peak values can also
influence the level of Planning Reserve Margins.
227
Each year represents the initial year of the winter season. For example: 2013 represents the 2013/2014 winter season.
‐10%
0%
10%
20%
30%
40%
2013 2014 2015 2016 2017 2018 2019 2020 2021 2022 0%
10%
20%
30%
40%
50%
2013 2014 2015 2016 2017 2018 2019 2020 2021 2022

NPCC‐Ontario
NERC | 2012 Long‐Term Reliability Assessment | November 2012
Page 173 of 335
Anticipated and Prospective Planning Reserve Margins are projected to be below the NERC Reference Margin Level in 2017.
However, the Total Potential and Adjusted Potential Reserve Margins are expected to stay above the target margin for the
entire period. Some of the Bruce and Darlington units will be out of service for refurbishment in this time frame.
Ontario’s planning process considers expected and potential unit refurbishments or retirements and proposes ways to meet
resulting resource requirements. Specific considerations include the procurement of conservation programs, renewable
resources, new gas‐fired units, and refurbished nuclear resources. In addition, the process considers the transmission
expansion that would be required to integrate all of the above‐mentioned resources. Other options include developing
greater coordination and flexibility related to nuclear refurbishment outages and converting existing coal stations to
alternate fuels. Mitigation of reliability concerns is to be supported through ongoing monitoring, assessment,
measurement, and verification.
The IESO and the OPA recognize the potential for certain adverse conditions (such as extended forced outages, drought
conditions, and particular fuel interruptions) to result in higher than expected resource unavailability, and therefore
establish planning reserves sufficient to handle many of these conditions. To the extent resource procurement exceeds the
planning reserve requirements, resource adequacy can be maintained for higher than normal contingencies. However,
there are always conditions that can exceed those planning assumptions. In such adverse situations, the IESO’s operations
would rely on interconnection support and available control actions to maintain system reliability. Through retention and
further development of a diverse resource mix, the potential consequence of these events is reduced.
Demand This year’s electricity Net Energy for Load forecast net of conservation has an average annual growth rate of ‐0.3 percent
over the period 2012‐2022 compared to last year’s average growth of ‐0.1 percent for the years 2011‐2021. The rate of
growth for overall consumption is lower than the peak growth rates. Initially conservation was aimed at reducing peaks, but
as those peak reduction opportunities are realized, conservation and embedded generation will start impacting overall
energy demand. Peak demand for the summer season grows by only 0.7 percent between 2013 and 2022 (NPCC‐Ontario‐
Table 2).
NPCC‐Ontario‐Table 2: Demand Outlook NPCC‐Ontario‐Summer 2013 2022 10‐Year Change CAGR
NET INTERNAL DEMAND 23,301 23,442 142 0.6% 0.07%
Load‐Modifying Demand Response 0 0 0 0.0% 0.00%
TOTAL INTERNAL DEMAND 23,301 23,442 142 0.6% 0.07%
NPCC‐Ontario‐Winter 2013/14 2022/23 10‐Year Change CAGR
NET INTERNAL DEMAND 22,192 21,529 ‐663 ‐3.0% ‐0.34%
Load‐Modifying Demand Response 0 0 0 0.0% 0.00%
TOTAL INTERNAL DEMAND 22,192 21,529 ‐663 ‐3.0% ‐0.34%
With the underlying drivers being very similar to last year, the forecasts’ growth rates remain similar as well. Although
Canada is expected to post respectable growth over the forecast, Ontario will lag the nation’s growth in the near term. High
commodity prices—in particular oil—will benefit other parts of Canada over Ontario’s manufacturing and export‐based
economy. In fact, Canada’s oil wealth puts upward pressure on the dollar, which is more detrimental to central Canada.
Over the forecast horizon Ontario’s economy will continue to undergo structural change. As the economy matures, there is
a transition from an energy‐intense industrial process based economy to one with a larger service sector and specialized or
high‐value‐added manufacturing. This will lead to a less energy‐intense economy.
The forecasting methodology has not changed since last year’s forecast. The models have been updated and re‐estimated
to incorporate the latest information regarding the relationship between electricity demand and the economy,
demographics, and weather.
Load growth has been relatively flat in recent years, and this trend is expected to continue as Ontario demand is subject to
two opposing forces. Pushing higher peak and energy demands are population growth and economic expansion. Acting to

NPCC‐Ontario
NERC | 2012 Long‐Term Reliability Assessment | November 2012
Page 174 of 335
restrain that underlying growth are increased conservation initiatives, increased embedded generation capacity and, for
peaks in particular, time‐of‐use rates.
Within Ontario there has been some localized variation in demand. The Toronto and southwest part of the province make
up the vast majority of the provincial demand and in essence drive the provincial numbers. Changes in the industrial
composition in the north have had a significant impact on demand patterns and will continue throughout the forecast. The
northwest part of the province has been in decline due to reductions in the forestry and pulp and paper sectors. The
northeast has more mines and has benefited from strong commodity prices and raw material demands from emerging
nations. These underlying trends are expected to continue. There is significant potential for mineral extraction in the Ring of
Fire Area of northern Ontario, which could be a source of significant load growth. At present this potential impact is
speculative and has not been factored into the forecast.
Demand-Side Management The IESO treats Demand Response as a resource and conservation as a decrement to demand. In 2013 there is just over
1,500 MW of effective Demand Response Capacity available during peak periods. At the time of the 2013 peak,
conservation impact is estimated to be roughly 500 MW higher when compared to 2012.
In the final year of the forecast, effective Demand Response Capacity is expected to be 1,687 MW. Also at the final year,
total incremental peak conservation savings (or Energy Efficiency) are projected to be 3,710 MW (NPCC‐Ontario‐Table 3).
NPCC‐Ontario‐Table 3: Projected Demand‐Side Management Short‐Term
2022 Share of Total Internal Demand
NPCC‐Ontario‐Summer 2013 2014 2015 2022 10‐Year Change
Direct Control Load Management (DCLM) 0 0 0 0 0 0.00% Contractually Interruptible (Curtailable) 0 0 0 0 0 0.00% Critical Peak‐Pricing (CPP) with Control 0 0 0 0 0 0.00% Load as a Capacity Resource 1,529 1,665 1,668 1,687 158 7.20%
TOTAL RESOURCE‐SIDE DEMAND RESPONSE 1,529 1,665 1,668 1,687 158 7.20%
TOTAL ENERGY EFFICIENCY 793 1,285 1,734 3,710 2,917 15.82%
TOTAL DEMAND‐SIDE MANAGEMENT 2,322 2,950 3,402 5,397 3,075 23.02%
The growth in Demand Response Capacity is relatively small over the forecast but plateaus in 2015–16.
Demand Response programs in Ontario are treated as a supply resource with discounted capacities associated with the
unique characteristics of each program (e.g., voluntary/Firm contracts). The OPA manages contracts for the majority of the
Demand Response programs scheduled to be activated over the forecast time frame. Programs with Firm contracts to
reduce demand during periods of high demand/tight supply are expected to provide a reliable and verifiable supply
resource. Most Demand Response programs are market‐based and are triggered by market prices or supply cushion
conditions.
Energy Efficiency and conservation are decremented from demand. These programs are run and delivered by distributors
and the OPA. As well, changing efficiency standards and building codes also contribute to conservation savings. The savings
are projected to grow throughout the forecast.
The capacity of Demand Response programs is relatively static throughout the forecast, with only some small incremental
growth.
The IESO does not have ancillary service Demand Response programs.
Generation At the time of this assessment in 2012, the total Existing‐Certain Capacity Resources connected to the IESO‐controlled grid
is 29,500 MW. The Existing‐Other and Existing‐Inoperable capacity amounts to 4,800 MW and 28 MW, respectively.
The primary sources of fuel in Ontario are nuclear, gas or oil, water, and coal. More than 50 percent of the electrical energy
is generated with nuclear. Coal‐fired generation will cease operation by the end of 2014. More than 5,600 MW of gas‐fired

NPCC‐Ontario
NERC | 2012 Long‐Term Reliability Assessment | November 2012
Page 175 of 335
generation has been added over the last 10 years. About 1,500 MW of grid‐connected wind is in operation, with another
200 MW in final stages of commissioning. Future‐Planned projections indicate an increase in renewable capacity, to 7,011
MW by 2022 (NPCC‐Ontario‐Table 4 and NPCC‐Ontario‐Figure 2).
NPCC‐Ontario‐Table 4: Capacity Outlook228 Current 2022 Planned 2022 Planned & Conceptual
NPCC‐Ontario‐Summer Capacity Share Capacity Share Change Capacity Share Change
Coal 3,377 11.2% 0 0.0% ‐3,377 0 0.0% ‐3,377 Petroleum 2,148 7.1% 2,134 7.7% ‐14 2,134 7.5% ‐14 Gas 6,439 21.4% 6,439 23.3% 0 10,274 36.1% 3,834 Nuclear 12,011 39.9% 12,011 43.5% 0 7,290 25.6% ‐4,721 Other/Unknown 0 0.0% 0 0.0% 0 0 0.0% 0 Renewables 6,156 20.4% 7,011 25.4% 855 8,782 30.8% 2,627
TOTAL 30,131 100.0% 27,595 100.0% ‐2,536 28,480 100.0% ‐1,651
NPCC‐Ontario‐Figure 2: Summer Net Capacity Change
Since last year, 227 MW of wind and 438 MW of gas generation have come into service. There are 8,782 MW of Future‐
Planned and Conceptual renewables resources that are expected to come on‐line throughout the assessment time frame.
Of this, about 200 MW are expected to come from the coal to biomass conversion at the Atikokan Generating Station,
which is expected to take place by 2014. The remaining new capacity is mostly comprised of generation from the Feed‐In
Tariff (FIT) and microFIT programs, and from the Green Energy Investment Agreement. The Future‐Planned and Conceptual
renewable resources will meet the Government of Ontario’s target of 10,700 MW of renewables other than hydro‐electric
and 9,000 MW of hydro‐electric capacity by 2018. Two units at Bruce A Nuclear Generating Station are being refurbished
and are expected to add 1,500 MW. In the latter half of the 10‐year period, a number of nuclear units at Bruce and
Darlington Nuclear Generating Stations will be expected to undergo refurbishment.
Two more coal units at Nanticoke Generating Station with a total capacity of 980 MW were shut down in December 2011.
The remaining nine coal‐fired units across four facilities in the province will be phased out by 2014. Pickering Nuclear
Generating Station is scheduled for retirement by 2016, but the technical feasibility of extending the operating life of the
Pickering generating units is being studied with a decision expected within next year. If feasible, it would provide the option
to continue to operate the units at Pickering Nuclear Generating Station through to 2020. In September 2011, a 280 MW
gas plant under construction in Mississauga was cancelled. This project had been scheduled to be in service by the third
quarter of 2014. There is work currently underway to determine relocation options for this plant. No other major
generation or transmission projects have been cancelled or significantly deferred that affect reliability.
By 2014, all coal‐fired energy in the province will be phased out. Plans are moving forward for the conversion to biomass of
the 205 MW Atikokan Generation Station in northwestern Ontario. In addition, two units at the Thunder Bay Generating
Station in northwestern Ontario are candidates for conversion to natural gas over the period leading up to 2014.
228 “Current” represents Existing‐Certain and Future‐Planned projections for the 2012 summer (for summer‐peaking assessment areas) or 2012/2013 winter (for winter‐peaking
assessment areas). “Share” represents the share (percent) of total Existing‐Certain and Future‐Planned capacity projected for the peak season.
‐10,500
‐9,000
‐7,500
‐6,000
‐4,500
‐3,000
‐1,500
0
1,500
3,000
2013 2014 2015 2016 2017 2018 2019 2020 2021 2022
MW

NPCC‐Ontario
NERC | 2012 Long‐Term Reliability Assessment | November 2012
Page 176 of 335
Conversion of some or all of the remaining coal‐fired units at Lambton and Nanticoke to natural gas will be assessed, in
conjunction with other options, under a range of different scenarios.
Ontario Power Generation’s Lower Mattagami expansion project, which is currently under construction, will add 438 MW of
hydro‐electric capacity to Ontario’s electricity system. In addition, by 2013 the new Niagara Tunnel will allow OPG to
generate a further 1.6 billion kilowatt‐hours of electricity annually.
About 1,500 MW of nuclear capacity is expected to be brought back into service from the re‐start of units 1 and 2 at Bruce
A Nuclear Generating Station in the short term. In the years following the 2014 coal phase‐out, the province’s next
reliability challenge will be to carefully manage the renewal of its nuclear fleet. The technical feasibility of extending the
operating life of the units at Pickering Nuclear Generating Station is being studied, and an update is expected within next
year. If feasible, it would provide the option to continue to operate the units at Pickering Nuclear Generating System
through to 2020. Units at Bruce B and Darlington Nuclear Generating Station are expected to reach the end of their service
lives over the next decade. To extend their lives, these units will be taken out of service for refurbishment. Supply options
for maintaining resource adequacy over this time period are under review and include, among others, new gas generation
or conversion of some or all of the Lambton and Nanticoke coal‐fired units to natural gas.
Over the assessment time frame, the level of renewables penetration will be expected to increase significantly through the
FIT and microFIT programs. This in turn will increase the level of behind‐the‐meter generation. Much of this generation
could be variable in nature, which adds more volatility as on‐grid demand is impacted both by underlying demand and by
variable generation within the distribution system. The majority of distribution‐connected generation is expected to be
solar, with lesser amounts of wind.
While a vast number of storage technologies are available for development, five are particularly promising and are being
developed by companies within Ontario. These include batteries, pumped hydro, compressed air energy storage (CAES),
flywheels and hydrogen storage. While most of these technologies are only recently seeing major development for grid
applications, some technologies have a long history in the province, such as hydro‐electric pumped storage at the Sir Adam
Beck Pump Generating Station in Niagara Falls.
While all these technologies offer energy storage, each provides its own specific utility to the grid. Short‐term storage
systems that can supply power for less than two minutes are generally used for frequency regulation and to maintain grid
power quality. Technologies such as batteries and larger flywheels can supply medium‐term storage providing frequency
regulation and ramping capabilities and can help improve system reliability. Long‐term supply can be provided from
technologies such as pumped hydro, CAES, hydrogen and some battery technologies that are capable of lasting more than
one hour. These solutions among others can be used to increase grid capacity, offering Firm output. Energy storage can also
defer transmission and distribution system upgrades if installed in the right location.
As renewables make up an increasingly large portion of the supply, energy storage systems can address some of the
problems caused by the intermittent nature of some renewable energy sources, such as wind and solar.
Fourteen percent of the installed wind capacity is assumed to be available at the time of summer peak, and 32 percent is
assumed to be available at the time of winter peak. Monthly Wind Capacity Contribution (WCC) values are used to forecast
the contribution from wind generators. WCC values (percent of installed capacity) are determined by picking the lower
value between the actual historic median wind generator contribution and the simulated 10‐year wind historic median
contribution at the top five contiguous demand hours of the day for each winter and summer season, or shoulder period
month. The process of picking the lower value between actual historic wind data and the simulated 10‐year historic wind
data will continue until 10 years of actual wind data is accumulated, at which point the simulated wind data will be phased
out of the WCC calculation. The WCC values are updated annually.

NPCC‐Ontario
NERC | 2012 Long‐Term Reliability Assessment | November 2012
Page 177 of 335
Ontario’s solar capacity value is forecast to be 30 percent of installed for the summer peak and 4 percent contribution for
the winter peak. The difference is due to the fact that the summer peak occurs in the afternoon, whereas the winter peak
occurs in the evening around dinner time. The values are based on historical modeled photovoltaic output data at the time
of summer and winter peaks. The renewable capacity outlook is included in below (NPCC‐Ontario‐Table 5, NPCC‐Ontario‐
Figure 3, and NPCC‐Ontario‐Table 6).
NPCC‐Ontario‐Table 5: Renewable Capacity Outlook229 Current 2022 Planned 2022 Planned & Conceptual
NPCC‐Ontario‐Summer Capacity Share Capacity Share Change Capacity Share Change
Hydro 5,794 94.1% 6,157 87.8% 363 6,500 74.0% 706 Pumped Storage 91 1.5% 91 1.3% 0 91 1.0% 0 Geothermal 0 0.0% 0 0.0% 0 0 0.0% 0 Wind 227 3.7% 637 9.1% 410 1,429 16.3% 1,202 Biomass 43 0.7% 47 0.7% 4 204 2.3% 161 Solar 0 0.0% 78 1.1% 78 558 6.4% 558
TOTAL 6,156 100.0% 7,011 100.0% 855 8,782 100.0% 2,627
NPCC‐Ontario‐Figure3: Renewable Capacity Outlook
On average, the assumed capacity contribution for biomass generation ranges from 64 to 98 percent of installed capacity.
Hydro‐electric generation output forecast is based on median historical values of hydro‐electric production and
contribution to operating reserve during weekday peak demand hours. Through this method, routine maintenance and
actual forced outages of the generating units are implicitly accounted for in the historical data. Market data starting from
May 2002 is used, with new values calculated annually as additional years of market experience are acquired. The assumed
capacity contributions for hydroelectric is 71 percent in the summer and 75 percent for the winter.
The hydro‐electric forecast may be adjusted to account for the impact of project‐related long‐duration outages that occur
less frequently than regular maintenance. The hydro‐electric performance is monitored on a monthly basis, and
adjustments may also be made to the forecast values when water conditions drive expectations of higher or lower output
that deviates from median values by approximately 500 MW for two consecutive months. The project‐related long‐duration
outages may include hydro facility expansions and major equipment replacements and/or repairs.
NPCC‐Ontario‐Table 6: Renewable Capacity Outlook: On‐Peak Vs. Installed230 Current 2022 Planned
NPCC‐Ontario‐Summer Wind Solar Hydro Biomass Wind Solar Hydro Biomass
Installed Capacity 1,725 0 7,832 47 4,651 260 8,347 49 On‐Peak Derate 1,498 0 2,038 4 4,014 182 2,190 2
EXPECTED ON‐PEAK OUTPUT 227 0 5,794 43 637 78 6,157 47
229 “Current” represents Existing‐Certain and Future‐Planned projections for the 2012 summer (for summer‐peaking assessment areas) or 2012/2013 winter (for winter‐peaking
assessment areas). “Share” represents the share (percent) of total Existing‐Certain and Future‐Planned capacity projected for the peak season. 230 Note: The table above shows only the expected grid‐connected renewable generation resources in Ontario. A substantial amount of renewable generation is embedded and
is included in the demand forecast. About 9 percent of wind, 28 percent of biomass and 81 percent of solar are expected to be embedded in the distribution networks.
0
200
400
600
800
1,000
2013 2014 2015 2016 2017 2018 2019 2020 2021 2022
MW

NPCC‐Ontario
NERC | 2012 Long‐Term Reliability Assessment | November 2012
Page 178 of 335
Centralized forecasting for variable resources such as solar and wind is an initiative designed to allow for better forecasting
of energy production to ensure a more accurate unit commitment occurs. A centralized forecast is being developed for all
grid‐connected variable resources with a full implementation set to be complete by the first quarter of 2013. Forecasting
for embedded variable resources will be developed in 2013. Additionally, the IESO’s Renewable Integration Initiative (RII)
will facilitate the dispatching of renewable energy, with implementation expected in the fourth quarter of 2013. Variable
generation dispatch will allow for greater flexibility and help alleviate occurrences of surplus base‐load generation.
Capacity Transactions No Firm imports into Ontario, exports to other Regions or emergency generation are considered in this 2012LTRA Reference
case. However, for use during daily operation, operating agreements between the IESO and neighboring jurisdictions in
NPCC, RFC, and MRO include contractual provisions for emergency imports directly by the IESO. IESO also participates in a
shared activation of reserve group, which includes PJM, NYISO, ISO‐NE, and New Brunswick.
Transmission A new 110 mile 500 kV double‐circuit line from the Bruce Power complex to Milton Switching Station (SS) was officially
declared in service in June 2012. This new line was built to accommodate the output of all eight generating units at the
Bruce complex together with approximately 500 MW of existing wind generating capacity, as well as a further 1,200 MW of
new renewable generating capacity that is forecast for development within the area. With the new generating facilities, the
combined generation in the Bruce Area is projected to exceed 8,100 MW. New dynamic voltage control facilities at
Nanticoke and Detweiler will improve the transfer capability from the Bruce Area. A summary of existing and projected
transmission is included below (NPCC‐Ontario‐Table 7).
NPCC‐Ontario‐Table 7: Existing and Projected Transmission NPCC‐Ontario AC (Circuit Miles) DC (Circuit Miles) Total (Circuit Miles)
EXISTING 17,931 0 17,931
Currently Under Construction 93 0 93 Planned ‐ Completed within First Five Years 0 0 0 Planned ‐ Completed within Second Five Years 0 0 0
2022 TOTAL (UNDER CONSTRUCTION & PLANNED) 18,024 0 18,024
Conceptual ‐ Completed within First Five Years 180 0 180 Conceptual ‐ Completed within Second Five Years 283 0 283
2022 TOTAL (UNDER CONSTRUCTION, PLANNED & CONCEPTUAL) 18,487 0 18,487
The existing Bruce SPS will be enhanced not only to accommodate the two new 500 kV circuits between the Bruce complex
and Milton SS, but also to address other contingency conditions not previously covered by the SPS. The intent of the
expanded coverage is to limit the extent of restrictions imposed on the output from the Bruce units during transmission
element outage conditions while also assisting with the re‐preparation of the system following a permanent fault when
subsequent contingency conditions may become more critical. This SPS will be a permanent feature to deal with planned
outages and is not intended for normal operations or to avoid or delay the construction of bulk transmission facilities. The
enhanced system was approved by NPCC in spring of 2012 and was placed in service in the second quarter.
To coincide with the completion of the new Bruce to Milton 500 kV line, a 350 Mvar SVC was installed at Nanticoke SS,
connected to the 500 kV busbar, and another 350 Mvar SVC was installed at Detweiler TS, connected to the 230 kV busbar.
These SVCs were required to provide dynamic reactive support following a critical double‐circuit contingency involving
either of the 500 kV lines between the Bruce complex and Milton SS.
Four phase angle regulators (PARs) are now operational and regulating flow over the Ontario‐Michigan interconnections.
The operation of these PARs helps control inter‐jurisdictional loop flows and assists in the management of system
congestion.
The transmission lines east of Mississagi TS and the north‐south corridor have experienced increased congestion due to the
continuing addition of new renewable resources and reduced demand. It is expected that congestion will further increase
with projects in the area, both proposed and under construction becoming operational. To help incorporate the future

NPCC‐Ontario
NERC | 2012 Long‐Term Reliability Assessment | November 2012
Page 179 of 335
Lower Mattagami expansion projects and other renewable generation resources and to reduce likelihood of congestion,
Hydro One installed series compensation on the 500 kV north‐south lines at Nobel SS and dynamic reactive compensation
facilities at Porcupine TS. To further improve the north‐south transfer capability, Hydro One will install static reactive
compensation facilities at Porcupine TS, Pinard TS, and Hanmer TS and dynamic reactive compensation facilities at Kirkland
Lake TS. All the static and dynamic compensation facilities are going in service gradually, with the last one scheduled for
2013.
The Government of Ontario’s Long‐Term Energy Plan (LTEP) specifies five priority transmission projects to accommodate
renewable generation to serve new load and support reliability. Furthermore, in a Supply Mix Directive on February 17,
2011, the OPA was required to include the five priority projects as part of long‐term planning:
Devices to enhance transfer capability, such as series or static var compensation, or other similar devices, in
southwestern Ontario
Enhance the East‐West Tie along the east shore of Lake Superior through a new line
Upgrade existing lines west of London
A new line west of London
New line to Pickle Lake
Northwestern Ontario (northwest) is connected to the rest of the province by the double circuit 230 kV East‐West Tie. The
Region has significant amounts of hydro‐electric generation as well as other resources such as coal, gas, and biomass. As
part of the coal shutdown, Atikokan and Thunder Bay (totaling 500 MW of generation capacity) will cease coal‐fired
operation by 2014. To maintain supply security in this area under the wide range of possible system and water conditions,
additional resources located in the northwest or increased westbound transfer capability into this Region through the East‐
West Tie are required. The conversion of Atikokan to biomass and Thunder Bay to gas operation, as indicated in the LTEP, is
part of the solution. The expansion of the East‐West Tie is to provide a long‐term reliable and cost‐effective supply to the
northwest. The line is anticipated to be in service no sooner than 2017.
A new supply line to Pickle Lake is currently being planned as part of a potential suite of options that may be required to
serve growing load and maintain reliability in the system north of Dryden. Load in and north of this area is forecast to grow
substantially over the next 10 to 15 years, and it is expected that new supply to the area will be required around 2015.
Various options, both 230 kV and 115 kV are being studied, with lengths up to 300 km. These options will have some
capability to support growth in the Red Lake Area to provide operational flexibility to enable refurbishment of end‐of‐life
equipment, and to serve new load for mining operations in the area known as the Ring of Fire. The Ring of Fire Area is
approximately 350 km northeast of Pickle Lake. If the new supply line to Pickle Lake is delayed, load that is being planned
for connection after 2015 will not be able to connect until the new line is available. Studies have identified the need for
incremental reactive capability throughout the region north of Dryden to support load growth, and there may also be the
need for reactive devices at strategic locations in the bulk system at and west of Mackenzie TS.
The LTEP includes three transmission projects to accommodate additional renewable generation in southwestern Ontario:
two upgrade projects and one new transmission line project. The two upgrade projects consist of a reactive compensation
project and a line re‐conductoring project. For the reactive compensation project, the OPA has recommended installation of
an SVC with a capacitive capacity of 350 Mvar and connecting to the 500kV voltage level at the Milton Station. An in‐service
date of spring 2015 has been established for this project. The planned line re‐conductoring project will consist of re‐
conductoring approximately 70 km of 230 kV transmission line between Lambton TS and Longwood TS. The two upgrade
projects are intended to maximize the capability of the existing system and increase capability to incorporate additional
renewable resources in a shorter time frame than a new transmission line can be built. A new transmission line west of
London is targeted to be completed in 2017.

NPCC‐Ontario
NERC | 2012 Long‐Term Reliability Assessment | November 2012
Page 180 of 335
Ontario will monitor the progress of the continued operation of nuclear units at Pickering Nuclear Generating System.
Pickering Nuclear Generating System units connect directly to the 230 kV system at Cherrywood TS, east of the Greater
Toronto Area. The retirement of Pickering Nuclear Generating Station would require an additional 230 kV supply source for
the Pickering and Oshawa Areas. Plans are currently being developed for construction of the Clarington 500/230 kV
Transformer Station by as early as 2015.
As demand increases in the western part of the Greater Toronto Area, the loading on the 500/230 kV transformers at
Claireville TS and Trafalgar TS will exceed their capacity by about the middle of this decade. An additional 500 to 230 kV
supply source would be required to relieve the loading on the existing autotransformers. Installation of 500/230 kV
transformers later in this decade at the 500 kV Milton Switching Station is one of the options under consideration.
The transmission projects that are under various stages of construction and the planned projects will address the
transmission constraints identified. The transmitters in Ontario together with the OPA proactively plan the transmission
network in order to ensure timely system adjustments, upgrades, and expansions. Delays to the in‐service dates of bulk
transmission projects resulting from delays in obtaining required approvals or delays in construction may result in increased
congestion or Special Protection Systems (post‐contingency generation rejection) in the interim.
System reinforcements are also being considered in a number of regional areas throughout the province, such as Kitchener‐
Waterloo‐Cambridge‐Guelph, York Region, and Ottawa, in order to maintain a reliable local supply of electricity. The OPA’s
regional planning approach addresses project delays. Regional planning develops options for each need, in a coordinated
manner, guided by principles that maintain a long‐term view that anticipates uncertainties and maintains flexibility.
Conservation, supply, and transmission plans are coordinated to deliver the solutions that are required for each locale.
Vulnerability Assessment As described in section 5, hydro‐electric generation capacity contributions are based on median historical values of hydro‐
electric production plus operating reserve provided during weekday peak demand hours. Hydro‐electric production is
monitored on a monthly basis, and due allowance is made for deviations from the median historical conditions.
Units at Bruce B and Darlington Nuclear Generating Stations are expected to reach the end of their service lives in the latter
half of the 10‐year period. To extend the life of these units, they will have to be taken out of service sequentially for about
three years for refurbishment. A number of options are being considered, and the timing of the refurbishment plan is not
yet finalized.
The Government of Ontario in its Long‐Term Energy Plan (LTEP) specified the target for large‐scale development of
renewable energy projects and implementation of conservation. The renewable resources target for wind, solar, and
bioenergy is 10,700 MW by 2018, accommodated through transmission expansion and maximizing the use of the existing
system. Ontario will grow its clean energy portfolio through the continuation of programs like the Feed‐in Tariff (FIT) and
microFIT.
Ontario will continue to grow its hydro‐electric capacity, with a target of 9,000 MW by 2018. This will be achieved through
the development of new facilities and through significant investments to maximize the use of Ontario’s existing facilities.
The IESO includes a quantity of Demand Response termed the “Reliably Available Capacity” in its reliability analysis. This
does not represent the total registered capacity of Demand Response programs. For market‐based programs, the IESO
utilizes historical information to ascertain the amount of Demand Response capacity that is typically bid into the market at
the time of the weekly peak demand. For programs that have contracts, the IESO uses both historical information and
contract information in order to determine the quantity of Reliably Available Capacity.
Over the assessment time frame, the level of renewables penetration is expected to increase through the FIT and microFIT
programs. As a result, there will be significant increases in generation connected to the distribution systems, as well as

NPCC‐Ontario
NERC | 2012 Long‐Term Reliability Assessment | November 2012
Page 181 of 335
additions to the IESO‐controlled grid. Most of this generation will be variable in nature, which adds more volatility as on‐
grid demand is impacted both by underlying demand and by variable generation within the distribution system.
As a result of the increase in the level of penetration of variable generation combined with the return of two units at Bruce
Nuclear Generating Station, occurrences of surplus base‐load generation will continue until the middle of the decade. An
increasing number of mitigation options to reduce surplus will need to be utilized. Surplus base‐load conditions are
expected to significantly reduce when the nuclear refurbishment programs begin.
There are a number of initiatives (such as centralized forecasting and dispatch of renewable generation) being
implemented, as described in section 5, to mitigate the challenges posed by variable generation and distributed generation.
There are no wide‐area UVLS programs in Ontario, and there are no plans to install any UVLS schemes in the future.
The majority of the Special Protection Systems that are in use within Ontario are intended to address the effects of
contingencies under outage conditions and are not intended to avoid or delay the construction of bulk transmission
facilities. The principal exception is the northeast load and generation rejection SPS that mitigates the effects of
contingencies involving the single‐circuit 500 kV lines that service this area. This SPS is designed to achieve a post‐
contingency match between the load and available generation in the area to prevent possible separation and islanding of a
portion of the north‐east system.
Following the 1998 ice storm and prior to the 2002 opening of Ontario’s competitive markets for electricity, Ontario’s
Emergency Planning Task Force (EPTF) was created. It is chaired by the IESO and comprises the major electricity sector
players including the provincial government’s Ministry of Energy. The EPTF oversees an emergency management team
called the Crisis Management Support Team (CMST) to manage any crisis and mitigate the impact on public health and
safety due to an extended electricity system emergency. Ontario runs an annual program of Reliability and Emergency
Management workshops, including tabletop drills. Additionally, major integrated exercises are staged in which both the
operational response and emergency management processes are activated. The CMST also performs regular test
activations.
During the nine‐day capacity and energy emergency that followed the August 2003 blackout, the CMST managed the
emergency via 31 conference calls and was instrumental in producing media messages, facilitating the government’s appeal
and direction for reduced demand, and obtaining the necessary environmental variances to secure additional supply.
The IESO has advanced the development of an on‐line limit derivation tool to maximize transmission capability in the
operating time frame. Currently, this tool is used to calculate a limited set of operating security limits in southern Ontario,
in the northeast and the east. There are plans to extend the use of this tool to the entire province by the end of 2013. The
limits calculated by the tool are used to plan and schedule outages and to re‐prepare the power system following a forced
outage.
A web‐based online outage requests tool was introduced last fall for market participants to submit their outages directly
into the Integrated Outage Management System. The new tool replaces a manual process and is a marked improvement in
efficiency, with validation and alerts for short notice requests built into the online tool.
As of March 2012, 4.7 million smart meters have been installed across the province, and 70 local distribution companies
and 4.36 million meters were enrolled with the Meter Data Management and Repository (MDM/R). The MDM/R system
actively processes smart meter data and produces time of use (TOU) billing quantities for customer invoices. The smart
meter customers are charged TOU rates, where the price of electricity depends on when it is used relative to peak demand
periods.
The IESO reviews all relay protection misoperations and works with Transmission Operators to ensure that timely
assessments and repairs are completed for reliable operation of the IESO‐controlled grid.

NPCC‐Ontario
NERC | 2012 Long‐Term Reliability Assessment | November 2012
Page 182 of 335
Over the last two years, about 3,000 MW of coal‐fired generation from six coal units at two generating stations has been
shutdown. The current installed capacity of coal‐fired generation in Ontario amounts to about 3,500 MW. The phase‐out of
the remaining coal‐fired generation by the end of 2014 is underway. In the intervening period, the Ontario government has
implemented greenhouse gas emissions targets for coal‐powered generation to ensure that between 2012 and 2014,
annual emissions are two‐thirds lower than 2003 levels.
Ontario Power Generation, the owner of the coal units, is making significant reductions in CO2 emissions from coal in a
manner consistent with government direction. OPG’s strategy will achieve the required reductions in emissions while
making sure the coal units are available to meet peak electricity demand.
As described in section 5, a number of nuclear units at Darlington and Bruce B Nuclear Generating Stations will be on
refurbishment outage at different times over the assessment period. At this stage, these outages are not expected to have
any reliability issues as plans are in place—these plans are reviewed on an ongoing basis with changes in assumptions.
Retrofits are required for conversion from coal to other fuels such as gas or biomass. The plans allow sufficient time for
conversions.
Standing and Emerging Reliability Issues Demand Forecasting Models
Maintaining accuracy of demand forecasting models is an emerging issue. Demand forecasting continues to evolve and is
becoming more complex due to a number of driving factors. Conservation has had a significant impact on demand and
continues to make it difficult for system planners and operators to capture or estimate the impact of conservation
programs and initiatives. Similarly, embedded generation is starting to require more attention from load forecasters as the
amount of embedded generation capacity is expected to show a dramatic increase. The fact that much of the embedded
generation will be variable in nature adds a new degree of volatility as on‐grid demand is impacted both by underlying
demand and by variable generation within the distribution system. The correlation of end‐use consumption uncertainty
with distributed generation uncertainty is not a trivial modeling exercise. Lastly, the evolution of the smart grid and smart
grid technologies will unlock greater Demand Response and increase the complexity of operating the electricity grid.
The issue requires industry attention over the next 10 years. The consequence of variance in demand forecasting will be
moderated as the industry develops the means and processes to track and evaluate the individual programs’ performance.
Improved data collection and new models and tools will enable the industry to more accurately identify and assess the
impact of these initiatives on the power system.
Asset Renewal ‐ A Systematic Approach for Continuous Modernization of Aging Energy Infrastructure
Asset renewal is a standing issue. Much of the current power system infrastructure, whether generation, transmission, or
distribution equipment, is aging and needs to be refurbished, replaced, or upgraded to comply with new standards and to
meet demand. A long‐term plan is required to coordinate the renewal of infrastructure to manage reliability,
environmental, and cost impact.
In the latter half of the 10‐year period, a number of nuclear units at Bruce and Darlington Nuclear Generating Stations will
be expected to undergo refurbishment. The Pickering Nuclear Generating Station is scheduled for retirement within the
next decade. Coal units will cease burning coal by 2014, with conversion to other fuels being considered as just one of
several mitigating options. Some transmission and distribution components are over 80 years old and require upgrading.
Although many companies have sustainment programs in place for asset renewal, the overall scope of the problem is what
presents the challenge. Moreover, challenges can be expected in the coordination between parties and the competition for
resources from other major non‐electrical infrastructure developments.
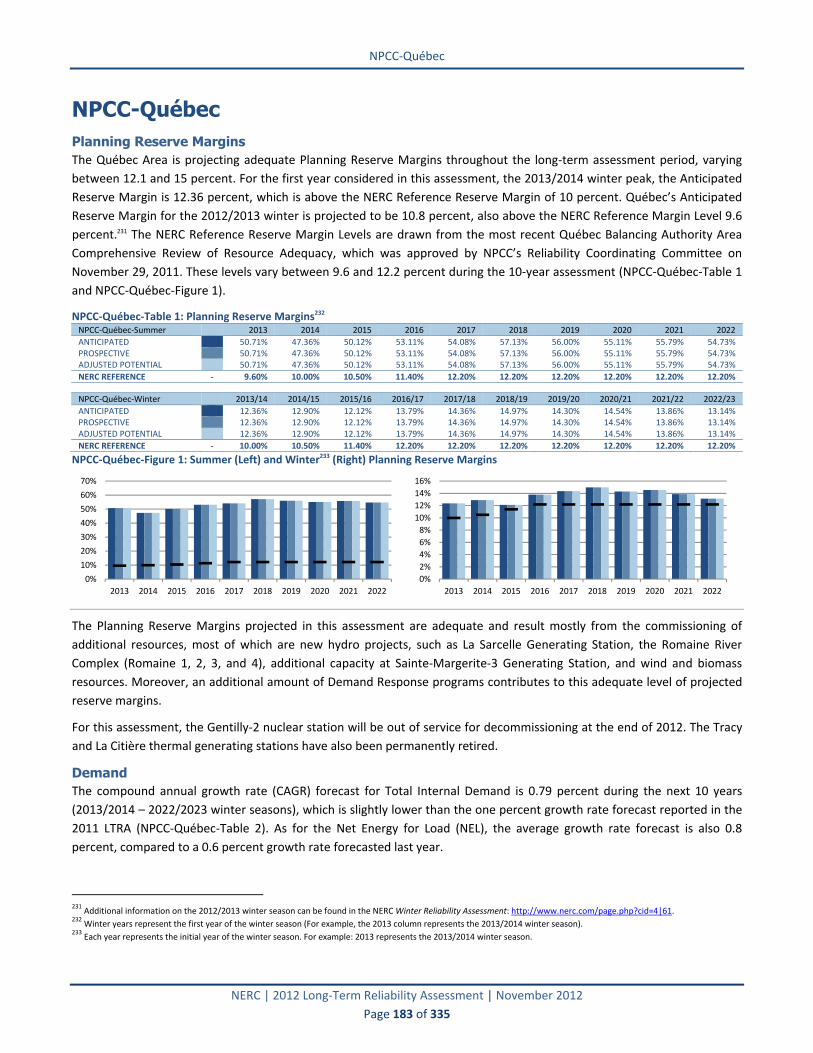
NPCC‐Québec
NERC | 2012 Long‐Term Reliability Assessment | November 2012
Page 183 of 335
NPCC-Québec Planning Reserve Margins The Québec Area is projecting adequate Planning Reserve Margins throughout the long‐term assessment period, varying
between 12.1 and 15 percent. For the first year considered in this assessment, the 2013/2014 winter peak, the Anticipated
Reserve Margin is 12.36 percent, which is above the NERC Reference Reserve Margin of 10 percent. Québec’s Anticipated
Reserve Margin for the 2012/2013 winter is projected to be 10.8 percent, also above the NERC Reference Margin Level 9.6
percent.231 The NERC Reference Reserve Margin Levels are drawn from the most recent Québec Balancing Authority Area
Comprehensive Review of Resource Adequacy, which was approved by NPCC’s Reliability Coordinating Committee on
November 29, 2011. These levels vary between 9.6 and 12.2 percent during the 10‐year assessment (NPCC‐Québec‐Table 1
and NPCC‐Québec‐Figure 1).
NPCC‐Québec‐Table 1: Planning Reserve Margins232 NPCC‐Québec‐Summer 2013 2014 2015 2016 2017 2018 2019 2020 2021 2022
ANTICIPATED 50.71% 47.36% 50.12% 53.11% 54.08% 57.13% 56.00% 55.11% 55.79% 54.73% PROSPECTIVE 50.71% 47.36% 50.12% 53.11% 54.08% 57.13% 56.00% 55.11% 55.79% 54.73% ADJUSTED POTENTIAL 50.71% 47.36% 50.12% 53.11% 54.08% 57.13% 56.00% 55.11% 55.79% 54.73%
NERC REFERENCE ‐ 9.60% 10.00% 10.50% 11.40% 12.20% 12.20% 12.20% 12.20% 12.20% 12.20%
NPCC‐Québec‐Winter 2013/14 2014/15 2015/16 2016/17 2017/18 2018/19 2019/20 2020/21 2021/22 2022/23
ANTICIPATED 12.36% 12.90% 12.12% 13.79% 14.36% 14.97% 14.30% 14.54% 13.86% 13.14% PROSPECTIVE 12.36% 12.90% 12.12% 13.79% 14.36% 14.97% 14.30% 14.54% 13.86% 13.14% ADJUSTED POTENTIAL 12.36% 12.90% 12.12% 13.79% 14.36% 14.97% 14.30% 14.54% 13.86% 13.14%
NERC REFERENCE ‐ 10.00% 10.50% 11.40% 12.20% 12.20% 12.20% 12.20% 12.20% 12.20% 12.20%
NPCC‐Québec‐Figure 1: Summer (Left) and Winter233 (Right) Planning Reserve Margins
The Planning Reserve Margins projected in this assessment are adequate and result mostly from the commissioning of
additional resources, most of which are new hydro projects, such as La Sarcelle Generating Station, the Romaine River
Complex (Romaine 1, 2, 3, and 4), additional capacity at Sainte‐Margerite‐3 Generating Station, and wind and biomass
resources. Moreover, an additional amount of Demand Response programs contributes to this adequate level of projected
reserve margins.
For this assessment, the Gentilly‐2 nuclear station will be out of service for decommissioning at the end of 2012. The Tracy
and La Citière thermal generating stations have also been permanently retired.
Demand The compound annual growth rate (CAGR) forecast for Total Internal Demand is 0.79 percent during the next 10 years
(2013/2014 – 2022/2023 winter seasons), which is slightly lower than the one percent growth rate forecast reported in the
2011 LTRA (NPCC‐Québec‐Table 2). As for the Net Energy for Load (NEL), the average growth rate forecast is also 0.8
percent, compared to a 0.6 percent growth rate forecasted last year.
231
Additional information on the 2012/2013 winter season can be found in the NERC Winter Reliability Assessment: http://www.nerc.com/page.php?cid=4|61. 232
Winter years represent the first year of the winter season (For example, the 2013 column represents the 2013/2014 winter season). 233
Each year represents the initial year of the winter season. For example: 2013 represents the 2013/2014 winter season.
0%
10%
20%
30%
40%
50%
60%
70%
2013 2014 2015 2016 2017 2018 2019 2020 2021 2022
0%
2%
4%
6%
8%
10%
12%
14%
16%
2013 2014 2015 2016 2017 2018 2019 2020 2021 2022

NPCC‐Québec
NERC | 2012 Long‐Term Reliability Assessment | November 2012
Page 184 of 335
NPCC‐Québec‐Table 2: Demand Outlook NPCC‐Québec‐Summer 2013 2022 10‐Year Change CAGR
NET INTERNAL DEMAND 21,115 22,818 1,704 8.1% 0.87%
Load‐Modifying Demand Response 0 0 0 0.0% 0.00%
TOTAL INTERNAL DEMAND 21,115 22,818 1,704 8.1% 0.87%
NPCC‐Québec‐Winter 2013/14 2022/23 10‐Year Change CAGR
NET INTERNAL DEMAND 37,810 40,575 2,766 7.3% 0.79%
Load‐Modifying Demand Response 0 0 0 0.0% 0.00%
TOTAL INTERNAL DEMAND 37,810 40,575 2,766 7.3% 0.79%
The Net Internal Demand for the 2013/2014 winter peak peak is projected to be 37,810 MW, which is 267 MW higher than
the forecasted 2012/2013 winter peak demand. The demand forecast methods used in this assessment have not changed
from previous years. Additionally, there have been no footprint changes and no entity acquisitions or exits.
Demand-Side Management The only Demand Response programs in the Québec Area specifically designed for peak‐load reduction during winter
operating periods are interruptible demand programs (for large industrial customers) totaling 1,660 MW for the 2013/2014
winter period, decreasing to 1,300 MW by the final year of the assessment (NPCC‐Québec‐Table 3). It is usually used in
situations when load is expected to reach high levels or when resources are not expected to be sufficient to meet load at
peak periods. Demand Response is relatively stable over the assessment period, with a maximum reached for the
2013/2014 winter peak period.
NPCC‐Québec‐Table 3: Projected Demand‐Side Management Short‐Term
2022/23 Share of Total Internal Demand
NPCC‐Québec‐Winter 2013/14 2014/15 2015/16 2022/23 10‐Year Change
Direct Control Load Management (DCLM) 250 250 250 250 0 0.62% Contractually Interruptible (Curtailable) 1,660 1,439 1,439 1,300 ‐360 3.20% Critical Peak‐Pricing (CPP) with Control 0 0 0 0 0 0.00% Load as a Capacity Resource 0 0 0 0 0 0.00%
TOTAL RESOURCE‐SIDE DEMAND RESPONSE 1,910 1,689 1,689 1,550 ‐360 3.82%
TOTAL ENERGY EFFICIENCY 1,980 2,150 2,300 3,190 1,210 7.86%
TOTAL DEMAND‐SIDE MANAGEMENT 3,890 3,839 3,989 4,740 850 11.68%
Total Energy Efficiency/Conservation is included in the forecast load and accounts for 1,980 MW at the 2013/2014 winter
peak period. Energy Efficiency is growing throughout the entire period of the assessment. The total on‐peak Demand
Response and Energy Efficiency/Conservation for the 2022/2023 winter period is projected to be approximately 4,740 MW.
On a yearly basis, Hydro‐Québec Distribution presents its Energy Efficiency Plan Update, “Plan global en efficacité
énergétique,” to the Québec Energy Board (regulatory body in Québec) for the next and upcoming years. This plan focuses
on energy conservation measures and includes programs tailored to residential customers, commercial and institutional
markets, small and medium industrial customers, and large‐power customers. Examples of programs and tools for
promoting energy savings for the residential customers include old refrigerator recycling, electronic thermostats, low‐
energy lighting, etc. The provincial government, through its Ministry of Natural Resources, also implements Energy
Efficiency/Conservation programs, mainly in the area of building standards and housing insulation.
Generation At the time of this assessment, available resources for the next winter in the Québec Area are evaluated at 39,502 MW,
most of which are hydropower generation (97 percent). Wind and biomass resources, which are owned and operated by
Independent Power Producers (IPPs) and under long‐term power purchase agreements with Hydro‐Québec Distribution and
Hydro‐Québec Production, account for two percent of the available capacity. Hydro‐Québec Production also operates one
fuel oil generating station (for peaking purposes), which represents about one percent of the total available capacity (NPCC‐
Québec‐Table 4 and NPCC‐Québec‐Figure 2).

NPCC‐Québec
NERC | 2012 Long‐Term Reliability Assessment | November 2012
Page 185 of 335
NPCC‐Québec‐Table 4: Capacity Outlook234 Current 2022/23 Planned 2022/23 Planned & Conceptual
NPCC‐Québec‐Winter Capacity Share Capacity Share Change Capacity Share Change
Coal 0 0.0% 0 0.0% 0 0 0.0% 0 Petroleum 436 1.1% 436 1.0% 0 436 1.0% 0 Gas 0 0.0% 547 1.3% 547 547 1.3% 547 Nuclear 0 0.0% 0 0.0% 0 0 0.0% 0 Other/Unknown 0 0.0% 0 0.0% 0 0 0.0% 0 Renewables 39,066 98.9% 42,418 97.7% 3,353 42,418 97.7% 3,353
TOTAL 39,502 100.0% 43,401 100.0% 3,900 43,401 100.0% 3,900
NPCC‐Québec‐Figure 2: Winter Net Capacity Change235
The Existing‐Certain capacity increased by an amount of 1,240 MW since the previous assessment, of which 720 MW are
from hydropower generation and 520 MW from wind and biomass.
TransCanada Energy’s 547MW natural gas combined‐cycle generating station in Bécancour is mothballed and accounts for
the total Existing‐Inoperable resources. Each summer, Hydro‐Québec Distribution must decide whether to mothball the
Bécancour power plant for an additional year or to re‐start it for the coming year. Although this plant is expected to be
mothballed until December 2017, it could be re‐started sooner if needed.
As mentioned above, the Gentilly 2 nuclear station (675 MW) will be out of service for decommissioning at the end of 2012.
Two thermal generating stations have also been permanently retired since the last assessment—Tracy (450 MW) and La
Citière (280 MW). In the previous assessment, the Tracy power plant was mothballed over the entire assessment period.
The temporary unit shutdown and retirements described above are offset by the commissioning of new resources. The last
two units of La Sarcelle Hydro Generating Station (50 MW each) are to be commissioned during the 2012/2013 winter
period. The Romaine‐2 (622 MW) and Romaine‐1 (260 MW) Hydro Generating Station are under construction and are
expected to be commissioned for the 2014/2015 and 2016/2017 winter peak periods respectively. The added capacity at
Sainte‐Margerite‐3 is expected to be commissioned for the 2017/2018 winter peak period, adding 440 MW of capacity. Two
other generating stations at the Romaine Complex (Romaine‐3 and Romaine‐4) are expected to be commissioned later
during the assessment period (2017/2018 and 2020/2021), adding 668 MW of capacity to the system. Finally, existing
power plant retrofitting will add close to 500 MW of new capacity by the 2020/2021 winter peak period.
In recent years, Hydro‐Québec Distribution has launched several calls for tenders and electricity purchase programs for new
renewable supplies, which will also be commissioned in the next years:
2,290 MW of wind power to be commissioned between 2012 and 2015.
234 “Current” represents Existing‐Certain and Future‐Planned projections for the 2012 summer (for summer‐peaking assessment areas) or 2012/2013 winter (for winter‐peaking
assessment areas). “Share” represents the share (percent) of total Existing‐Certain and Future‐Planned capacity projected for the peak season. 235
Years represent initial year for each winter season. For example: 2013 represents the 2013/2014 winter season.
0
1,000
2,000
3,000
4,000
5,000
2013 2014 2015 2016 2017 2018 2019 2020 2021 2022
MW

NPCC‐Québec
NERC | 2012 Long‐Term Reliability Assessment | November 2012
Page 186 of 335
125 MW generated by small hydro plants (50 MW and less) developed in partnership with local and First Nations
communities, will be commissioned between 2012 and 2014.
300 MW generated from biomass to be commissioned between 2012 and 2016.
As for behind‐the‐meter generation, it is negligible and is included in the load forecast. For hydro resources, maximum
capacity is set equal to the power that each plant can generate at its maximum rating during two full hours, while expected
on‐peak capacity is set equal to maximum capacity minus scheduled maintenance outages and restrictions.
Biomass and wind resources are owned by Independent Power Producers (IPPs). These IPPs have signed contractual
agreements with Hydro‐Québec. Therefore, for biomass resources, maximum capacity and expected on‐peak capacity are
equal to contractual capacity, representing almost 100 percent of nameplate capacity. For wind resources, capacity
contribution at peak is estimated at 30 percent of contractual capacity, which represents 490 MW and 973 MW respectively
for the 2012/2013 (current) and 2022/2023 winter periods. The maximum wind capacity is equal to contractual capacity,
which generally equals to its nameplate capacity. For summer peak periods, the expected on‐peak wind capacity is set to
zero as wind resources are completely derated (NPCC‐Québec‐Table 5 and NPCC‐Québec‐Figure 3).
NPCC‐Québec‐Table 5: Renewable Capacity Outlook236 Current 2022/23 Planned 2022/23 Planned & Conceptual
NPCC‐Québec‐Winter Capacity Share Capacity Share Change Capacity Share Change
Hydro 38,315 98.1% 40,971 96.6% 2,656 40,971 96.6% 2,656 Pumped Storage 0 0.0% 0 0.0% 0 0 0.0% 0 Geothermal 0 0.0% 0 0.0% 0 0 0.0% 0 Wind 490 1.3% 973 2.3% 483 973 2.3% 483 Biomass 261 0.7% 474 1.1% 213 474 1.1% 213 Solar 0 0.0% 0 0.0% 0 0 0.0% 0
TOTAL 39,066 100.0% 42,418 100.0% 3,353 42,418 100.0% 3,353
NPCC‐Québec‐Figure 3: Winter Net Renewable Capacity Change237
Wind generation integration has not significantly impacted day‐to‐day operation of the system, and the actual level of wind
generation does not require particular operating procedures. However, with the increasing amount of wind in the system,
the foreseeable impact on system management may show up, and the following are under study:
Wind generation variability on system load and interconnection ramping.
Frequency and voltage regulation problems.
Increase of start‐ups/shutdowns of hydroelectric units due to load following coupled with wind variability;
efficiency losses in generating units also expected.
Reduction of low‐load operation flexibility due to low inertial response of wind generation coupled to must‐run
hydroelectric generation.
236 “Current” represents Existing‐Certain and Future‐Planned projections for the 2012 summer (for summer‐peaking assessment areas) or 2012/2013 winter (for winter‐peaking
assessment areas). “Share” represents the share (percent) of total Existing‐Certain and Future‐Planned capacity projected for the peak season. 237
Years represent initial year for each winter season. For example: 2013 represents the 2013/2014 winter season.
0
500
1,000
1,500
2,000
2,500
3,000
3,500
4,000
2013 2014 2015 2016 2017 2018 2019 2020 2021 2022
MW

NPCC‐Québec
NERC | 2012 Long‐Term Reliability Assessment | November 2012
Page 187 of 335
Capacity Transactions Expected capacity purchases are planned by Hydro‐Québec Distribution as needed for the Québec internal demand. These
purchases are set at 1,100 MW throughout the assessment period and may be supplied by resources located in Québec or
in neighboring markets. In this regard, Hydro‐Québec Distribution has designated the Massena–Châteauguay (1,000 MW)
and Dennison–Langlois (100 MW) interconnections’ transfer capacity to meet its resource requirements during winter peak
periods. These purchases are not backed by firm long‐term contracts. However, on a yearly basis, Hydro‐Québec
Distribution proceeds with short‐term capacity purchases (UCAP) in order to meet its capacity requirements if needed.
The Québec Area will support firm capacity sales totaling 398 MW to New England and Ontario (Cornwall) during the
2013/2014 winter peak, backed by Firm contracts for both generation and transmission, but which will decline to 145 MW
in 2020 (NPCC‐Québec‐Table 7). Moreover, 228 MW of Firm exports for the 2014/2015 winter period and 500 MW for the
2015/2016 winter peak are committed for neighboring area’s needs.
NPCC‐Québec‐Table 7: Projected Capacity Transactions NPCC‐Québec‐Winter 2013/14 2014/15 2015/16 2016/17 2017/18 2018/19 2019/20 2020/21 2021/22 2022/23
Expected Imports 1,100 1,100 1,100 1,100 1,100 1,100 1,100 1,100 1,100 1,100 Firm Imports 0 0 0 0 0 0 0 0 0 0
TOTAL IMPORTS 1,100 1,100 1,100 1,100 1,100 1,100 1,100 1,100 1,100 1,100
Expected Exports 0 0 0 0 0 0 0 0 0 0 Firm Exports 398 626 676 151 151 151 151 145 145 145
TOTAL EXPORTS 398 626 676 151 151 151 151 145 145 145
TOTAL NET CAPACITY TRANSACTIONS 702 474 424 949 949 949 949 955 955 955
The Québec Area does not rely on any emergency capacity imports to meet its Reserve Margin Reference Level.
Transmission This section briefly describes the BPS transmission additions anticipated to be in service during the assessment period. A
summary of existing and projected additions is included below (NPCC‐Québec‐Table 8). Descriptions for each project of
particular importance are also included below.
NPCC‐Québec‐Table 8: Existing and Projected Transmission NPCC‐Québec AC (Circuit Miles) DC (Circuit Miles) Total (Circuit Miles)
EXISTING 21,273 1,514 22,787
Currently Under Construction 412 0 412 Planned ‐ Completed within First Five Years 68 0 68 Planned ‐ Completed within Second Five Years 129 0 129
2022 TOTAL (UNDER CONSTRUCTION & PLANNED) 21,881 1,514 23,395
Conceptual ‐ Completed within First Five Years 452 93 546 Conceptual ‐ Completed within Second Five Years 599 0 599
2022 TOTAL (UNDER CONSTRUCTION, PLANNED & CONCEPTUAL) 22,932 1,607 24,539
The Romaine River Hydro Complex Integration
Construction of the first phase of transmission infrastructures for the Romaine River Hydro Complex project has now begun.
The generating stations will be integrated on a 735 kV infrastructure initially operated at 315 kV. Romaine‐2 and Romaine‐1
will be integrated in 2014/2016 at Arnaud 735/315 kV substation. Romaine‐3 and Romaine‐4 will be integrated in
2017/2020 at Montagnais 735/315 kV substation.
Main system upgrades for this project require construction for 2014 of a new 735 kV switching station to be named “Aux
Outardes,” located between the existing Micoua and Manicouagan Transformer Stations. Two 735 kV lines will be
redirected into the new station and one new 735 kV line (3 miles) will be built between Aux Outardes and Micoua.
The Bout‐de‐l’Île 735‐kV Section
Hydro‐Québec TransÉnergie is adding a new 735 kV section at Bout‐de‐l’Île (east end of Montréal Island) substation. This
was originally a 315/120 kV station. The Boucherville–Duvernay 735 kV line (line 7009), which passes by Bout‐de‐l’Île, will
be looped into the new station. A new ‐300/+300 Mvar Static Var Compensator will be integrated into the 735‐kV section in
2013.

NPCC‐Québec
NERC | 2012 Long‐Term Reliability Assessment | November 2012
Page 188 of 335
The project also includes the addition of two 735/315 kV, 1,650 MVA transformers in 2014. This new 735 kV source will
allow redistribution of load around the Greater Montréal Area and will absorb load growth in the eastern part of Montréal.
This project will enable future major modifications to the Montréal Area regional subsystem. Many of the present 120 kV
distribution stations will be rebuilt into 315 kV stations, and the Montréal regional network will be converted to 315 kV.
The Northern Pass Project
This project to increase interconnection transfer capability between Québec and New England by 1,200 MW is now being
studied. The project involves construction of a ±300 kV dc transmission line about 46 miles long from Des Cantons 735/230
kV substation to the Canadian‐U.S. border. This line will be extended into the United States to a substation built in Franklin,
New Hampshire.
The project in Québec also includes the construction of two 600 MW converters at Des Cantons and a 300 kV dc switchyard.
Permitting for this project is presently ongoing but the initial commissioning date of 2015 may be delayed.
Wind Generation Integration Projects
A number of wind transmission projects with voltages ranging from 120 kV to 315 kV are either under construction or in
planning stages in order to integrate wind generation planned to come on‐line in the next few years. These wind generation
projects are distributed in many areas of the Province of Québec, but most are near the shores of the Gaspésie Peninsula,
along the Gulf of St. Lawrence down to the New Brunswick border.
Projects on the main system include 735 kV series compensation additions, and the addition of a second SVC at Bout‐de‐
l’Île substation after the addition of the previously mentioned 735 kV section, and an SVC at Jacques‐Cartier substation.
Nominal current upgrades will also be done on some existing series compensation, and a thermal capacity upgrade will be
done on two 735 kV lines. However, the future construction of the Chamouchouane–Bout‐de‐l’Île 735 kV line (see below)
will replace a number of the above‐mentioned projects.
Chamouchouane – Bout‐de‐l’Île 735 kV Line
The large generation additions and transmission services coming up over the next years require, as shown above, a number
of system additions to maintain reliability. Moreover, planning studies have shown that to optimize the different solutions
and to significantly reduce marginal losses on the system due to this new generation, a new 735 kV line from
Chamouchouane substation on the eastern James Bay subsystem to Bout‐de‐l’Île substation in Montréal (about 230 miles)
is required. Planning, permitting and construction delays are such that the line is scheduled for the 2017/2018 winter peak
period. This optimization will result in replacing some of the above‐mentioned projects, and in other cases will result in
reducing additional equipment that was previously planned. The new line will also reduce transfers on other parallel lines
on the Manicouagan–Québec 735 kV interface, thus optimizing operation flexibility and reducing losses.
Public information meetings have begun on this project. Final line route has not been determined yet and government
authorization processes are ongoing.
Other 735 kV Conceptual Projects
A new 735/315 kV transformer station near the existing Arnaud 735 kV station is being projected for 2018. This station,
tentatively named Arnaud‐2, will be about 9.3 miles from Arnaud. It will be integrated into the Churchill Falls–Manicouagan
subsystem using two existing lines and one new 15‐km (9.3 mi.) 735 kV line from Arnaud Station. Two 735/315 kV, 1650
MVA transformers and six 315 kV line feeders will complete the station. Two double‐circuit 315 kV lines will eventually feed
the Alouette Aluminum Smelter Complex, replacing the 161 kV feeders now in service.
A new 735/315 kV transformer station is being projected near the existing Lebel 315/120 kV station in the Abitibi region of
the system. This will consolidate the Abitibi subsystem, which presently has a 120 kV infrastructure with a 315 kV feed at
Lebel and Figuery substations. A new 142 km (88 miles) 735 kV line is projected from Abitibi 735 kV Station on the James

NPCC‐Québec
NERC | 2012 Long‐Term Reliability Assessment | November 2012
Page 189 of 335
Bay system to feed this new station. Two 735/315 kV, 1650 MVA transformers and four 315 kV line feeders will complete
the station. It is projected to be in service in fall 2018.
Regional Projects Under Construction
There are a number of regional projects now underway. The three most important are listed here:
Limoilou 230/25 kV substation in Québec City; in service fall 2012
St‐Bruno 315/25 kV substation south of Montréal; in service fall 2013
Bécancour 230 and 120 kV system reinforcement; Bécancour Industrial Park, in service fall 2012
Upcoming Regional Projects
Other regional substation and/or line projects are now in the planning/permitting stages. There are about a dozen regional
transmission projects in the Montréal and Québec City Areas and another dozen in other areas within service dates from
2012 to 2018.
Planning studies leading to system enhancement projects such as those mentioned above ensure that there will be no long‐
term transmission constraints in the Assessment Area. Generation on the system is integrated on a 100 percent Firm basis.
Moreover, there are no project delays or temporary service outages for any transmission facilities (lines or transformers)
that will impact long‐term reliability during the assessment period.
The Hydro‐Québec system has sufficient transmission being constructed to support all Future‐Planned generation forecast
to come on‐line during the assessment period.
Vulnerability Assessment Given the importance of hydro‐electric resources within the Québec Area, an energy criterion has been developed to assess
its energy reliability. The criterion states that sufficient resources should be available to go through sequences of two or
four consecutive years of low water inflows totaling 64 TWh and 98 TWh respectively with a 2 percent probability of
occurrence. These assessments are presented three times a year to the Québec Energy Board. Normal hydro conditions are
projected over the assessment period, and reservoir levels are expected to be sufficient to meet both peak demands and
daily energy demand.
A total of 1,500 MW is targeted by Under‐Voltage Load Shedding (UVLS) in the Québec Area. It has been designed to
operate following contingencies involving the loss of two or more 735 kV lines. These contingencies do not require more
than 1,500 MW of load shedding, although UVLS operates on a pre‐defined pool of 2,500 MW located in the Montréal Area.
The NPCC Comprehensive Review Assessment of the Québec Transmission System for 2012 (the last Comprehensive Review
to date) conducted by Hydro‐Québec TransÉnergie (acting as Transmission Planner) shows that UVLS is adequate to
preserve system stability after the contingencies for which it is designed.
Contingencies range from the loss of two parallel 735 kV lines to the loss of a 735 kV line with series compensation bypass
on parallel lines. The number of automatic actions needed to stabilize the system increases with the severity of the
contingencies, but the whole analysis indicates a stable and well‐damped system response for all contingencies. This
assessment indicates that no voltage or reactive power problems having an adverse impact on the BPS are anticipated
under complementary contingency requirements. No additional load is expected to be assigned to UVLS during the next 10
years.
Hydro‐Québec maintains a permanent emergency plan in case of catastrophic events. This stems from a number of federal
and provincial legislation, rules, procedures and municipal by‐laws. At the corporate level, Order #24 “Service Continuity
and Emergency Measures” and Corporate Policy “Our Security” form the basis on which the plan is built. The Corporate
Plan is prepared by the Industrial Security Group at Hydro‐Québec. It includes the plan’s objectives, risks covered by the
plan, the organization around the plan (Steering Committee and Coordinating Committee), communications, and updating.
Risks cover a large array of situations, for example, rupturing of a dam or dike, a nuclear incident, extensive damage to

NPCC‐Québec
NERC | 2012 Long‐Term Reliability Assessment | November 2012
Page 190 of 335
transmission lines and stations, forest fires, unavailability of computer systems or telecommunications systems, biological
risks, cyber criminality, terrorism, etc. The plan also provides links with the Québec Civil Security Organization and other
civil, military, or medical organizations. This Corporate Plan directs Hydro‐Québec’s divisions to elaborate and maintain
their own sectorial plan according to their field of activities.
Hydro‐Québec TransÉnergie’s Plan is based on eight different types of risk that the system has a probability of experiencing.
These risk types are associated with criteria determining their impact on the system. Studies have determined the
probability of occurrence and an impact level on a scale from 1 to 9 is associated with the risk type.
For each risk type, a file has been developed defining the risk, possible source events, potential impact, risk evaluation
(probability of occurrence), mitigation procedures, post‐mortem and follow‐up requirements.
The planning process for catastrophic events completes system planning as required by NPCC’s Regional Reliability
Reference Directory #1–Design and Operation of the BPS and by NERC’s Transmission Planning Standards. These standards
define a number of system events that must be assessed under specified conditions. For NPCC, this includes an Extreme
Contingency Assessment with, for example, loss of the entire capability of a generating station, loss of all transmission
circuits in a common right‐of‐way, the sudden dropping of a large load or major load center, or the sudden loss of fuel
delivery systems to multiple plants. Not all of these events apply to TransÉnergie. For example, only one natural gas‐fired
plant exists in the Québec Area, generating 547 MW, so that a pipeline failure is of little consequence to the system in this
case. However, since bulk transmission is 735 kV, TransÉnergie physically limits the number of 735 kV lines in a common
right‐of‐way to a maximum of two lines, because the loss of a right‐of‐way has a definite impact. Sudden dropping of large
load centers, loss of generation stations, and loss of a 735 kV switching station are extreme events covered by Special
Protection Systems, which limit the event’s impact on the system.
In the case of an extreme contingency leading to a system blackout, there is an automatic device called SPSR (French
acronym for “System Separation Solution”) that acts locally at a number of 735 kV stations to close in sacrificial Zinc Oxide
surge arrestors before the system dismantles. System collapse is accompanied by over voltages that would damage
equipment if not dampened by the surge arrestors. This makes it possible to restore the system in minimum time with
maximum equipment availability after a blackout. The surge arrestors themselves must be replaced after such an event.
Hydro‐Québec intends to deploy a number of new technologies, systems, and tools to improve BPS reliability in the future.
Smart grid incentives are among them. Government policies and targets for renewable energy integration, Energy
Efficiency, electric or rechargeable hybrid vehicles, and greenhouse gas emissions reductions are among the major drivers
for the development of smart grid programs.
TransÉnergie’s system consists of an extensive 735 kV network underlain with 315 kV, 230 kV, and 120 kV subsystems
totaling close to 22,800 circuit miles. The system uses telecommunications and advanced protection and control
applications to ensure its reliability and improve its performance. This will continue into the future. The system is planned
according to NPCC and NERC planning standards but with additional criteria that consider system topology and substation
characteristics particular to TransÉnergie’s system (Complementary contingencies) and address voltage sensitivity to load
variation and interconnection ramping. Special Protection Systems to provide additional reliability (for extreme events) are
presently in use and will continue to be used. These include Remote Generation Rejection and Load Shedding, Under‐
Voltage Remote Load Shedding, and Under‐Frequency Load Shedding. It is not planned that Special Protection Systems or
Remedial Action Schemes will be installed in lieu of planned bulk power transmission facilities in the Québec Area.
Other technologies such as synchronous condensers, Static Var Compensators (SVCs), 735 kV series compensation, multi‐
band power system stabilizers (MBPSS), HVdc systems, and a variable frequency transformer (VFT) are in use. Such systems
are planned for future system upgrades or for generation integration as needed.

NPCC‐Québec
NERC | 2012 Long‐Term Reliability Assessment | November 2012
Page 191 of 335
For more than two decades now, TransÉnergie has been operating an angular displacement measuring system to accurately
monitor and register system frequency and angular displacement between major generating stations and load centers. This
is used for on‐line reporting and provides priceless post‐mortem data for all system events involving frequency variations
and angular displacements. The system also measures voltage and current distortion and is quite valuable for monitoring
harmonic content during solar magnetic disturbances (SMDs).
Simulation tools are constantly being developed by TransÉnergie for planning purposes. These load forecasting tools,
including local weather forecasts provided by TransÉnergie staff. These efforts contribute to the TransÉnergie Operation
Planning Department that receives assistance from Hydro‐Québec’s Research Institute (IREQ) as well as the Université de
Liège in Belgium, working to develop a number of system simulation software packages for in‐house use. These include on‐
line dynamic security assessments (DSA), voltage sensitivity due to load and generation variations, massive stability
simulations, voltage stability, real‐time load modeling, and research on motor load modeling. DSA applications have been
the object of joint (TransÉnergie and IREQ) IEEE papers.
Another project looks at regulation systems and SPS improvement in order to upgrade transfer capability and improve
system reliability. This includes installation of MBPSSs in a great number of generating stations, new regulation circuits for
the dynamic shunt compensation equipment, new relaying for Special Protection Systems, new control strategies for HVdc
converters, development of severity indices for angular and voltage stability, etc. The project is also studying the possibility
of introducing a type of global regulation for dynamic shunt equipment (as opposed to regulation based on local
parameters) implying Measurement Units, a Data Concentrator, and Control Units, all linked by synchronized digital
communications.
During the past year, no new smart grid programs were fully implemented at Hydro‐Québec. The IMAGINE project is
ongoing. IMAGINE involves automated maintenance and enhanced processing of monitoring data. Altogether, 94
substations are now connected to two remote maintenance centres, one in Montréal and one in Québec City. This project,
which focuses first and foremost on power transformers, will enable TransÉnergie to optimize target maintenance efforts to
prevent equipment failures and improve system reliability. Fault location data will be shared with Hydro‐Québec
Distribution, which will reduce recovery time. This project will also help Hydro‐Québec meet NERC CIP requirements
pertaining to cyber assets by providing an automated inventory of protection and control device passwords. The IMAGINE
investment is over‐budget for initiatives that are also accomplished through IREQ, Hydro‐Québec’s research center, with
the help of industrial partners.
TransÉnergie is also working with IREQ to prepare the smart transmission grid of the future. In 2010, the main outlines of an
adaptive power grid were sketched out. The grid would be equipped with controllers, sensors, analysis systems and other
devices necessary to monitor equipment continuously and manage the system and its components in real time. Related
projects include the ACOR grid response improvement program, which is designed to increase system capacity, reliability,
and security by means of advanced protections and controls.
All relay operations are submitted to systematic and thorough analysis by TransÉnergie’s “Analyses et comportement du
réseau principal et des réseaux régionaux” (Bulk and Regional System Behavior and Analysis) unit, where primary causes of
relay operations are studied and determined. When misoperations do occur, corrective actions and recommendations are
issued and transposed to other installations when required. This is done through Maintenance Notices issued to
Maintenance Units. Recommendation follow‐up is certified through the SADA system (SPS and Protection Analysis System).
Concerning protection equipment durability, a TransÉnergie working group makes sure that data pertaining to control
systems and protection systems are up‐to‐date at all times. A log sheet containing replacement priorities (on a scale of 1 to
9) and timelines for protection equipment is also kept up‐to‐date. A yearly follow‐up is done to re‐evaluate priorities and
account for the work done and remaining. Evaluations of problematic systems are kept on file for ongoing referencing.

NPCC‐Québec
NERC | 2012 Long‐Term Reliability Assessment | November 2012
Page 192 of 335
Finally, as a member of the Western Climate Initiative238, the province of Québec implemented a cap‐and‐trade system in
2012, with the first compliance period planned to start January 1, 2013. Given the proportion of renewable generation in
the Québec Area, this new regulation will not impact the Québec Area’s reliability.
Standing and Emerging Reliability Issues This section briefly discusses some important issues that may impact system reliability during the assessment period. There
is no doubt that developments during recent years have contributed to a more reliable system. However, sustainable
system reliability may be challenged by several issues. Two of them are considered as standing reliability issues and are
described and analyzed below.
Wind Plant Integration to Grid
As a separate NERC Interconnection, the Québec subregion is responsible for its own frequency regulation. System inertia is
quite low compared to the Eastern Interconnection, for example. Large post‐contingency frequency excursions—up to ±1.5
Hz—can occur after normal contingencies, and it is required to set operating limits related to post‐contingency frequency
behavior.
Through 2015, Hydro‐Québec will have integrated around 3,350 MW of nameplate wind capacity. This kind of large‐scale
integration of wind capacity on the system has triggered a need for frequency support by wind plants. In order to maintain
actual system performance, TransÉnergie (the System Planner) has requested from manufacturers an inertia emulation
function that would cover lack of inertia and spinning reserve from modern variable speed wind turbine generators.
TransÉnergie is presently in the process of quantifying its inertia emulation needs. This is an ongoing interactive process
with manufacturers. TransÉnergie is now in the process of procuring and validating manufacturers’ inertia emulation model
functions for wind plants. Inertia emulation is required for Hydro‐Québec Distribution’s wind generation resulting from the
second and third calls for tenders, totaling 2,290 MW of capacity. Further studies will have to be made if wind capacity
integration is extended in the mid‐term.
Equipment Aging and Sustainability
Equipment aging and sustainability have been standing issues at TransÉnergie for more than 15 years (line and station
equipment). However, during the years 2000–2010, it became obvious that a global strategic investment policy was needed
to tackle the issue. The strategy is based on the risk (sustainability) of losing equipment due to a major failure when the
equipment is approaching the end of its life cycle. This risk assessment considers the probability of a major failure and its
impact on the transmission system and on TransÉnergie as an asset owner. The strategy put forward in 2007 was presented
to the Québec Energy Board and authorized by the Board with an accompanying annual budget.
Issues that could impact reliability in the context of equipment aging are the following:
Significant investment cuts
Personnel and equipment availability for maintenance outages as well as new projects
System availability for outages
At this time, there is no major concern regarding these issues that could have an impact on the BPS.
238
The Western Climate Initiative is a collaboration of independent jurisdictions working together to identify, evaluate, and implement emissions trading policies to tackle
climate change at a regional level. http://www.mddep.gouv.qc.ca/changements/plan_action/index‐en.htm

PJM
NERC | 2012 Long‐Term Reliability Assessment | November 2012
Page 193 of 335
PJM Planning Reserve Margins The PJM RTO will have adequate Planning Reserve Margins for all three categories throughout the 2019 summer season. It
is expected that some Conceptual queued units will eventually become planned and placed in service to make up the
amount below the NERC Reference Margin Level, beginning in 2020. The current PJM RTO Reserve Requirement is 15.6
percent through May 31, 2013. For the remainder of the assessment period, the PJM Reserve Requirement is 15.4 percent,
applied as the NERC Reference Margin Level throughout this long‐term assessment (PJM‐Table 1 and PJM‐Figure 1).239
PJM‐Table 1: Planning Reserve Margins PJM‐Summer 2013 2014 2015 2016 2017 2018 2019 2020 2021 2022
ANTICIPATED 27.28% 26.76% 20.34% 18.58% 17.24% 16.04% 15.69% 14.29% 12.98% 11.75% PROSPECTIVE 27.28% 26.76% 20.34% 18.58% 17.24% 16.04% 15.69% 14.29% 12.98% 11.75% ADJUSTED POTENTIAL 28.45% 28.83% 25.66% 24.72% 24.14% 23.29% 22.85% 21.37% 19.98% 18.67%
NERC REFERENCE ‐ 15.40% 15.40% 15.40% 15.40% 15.40% 15.40% 15.40% 15.40% 15.40% 15.40%
PJM‐Winter 2013/14 2014/15 2015/16 2016/17 2017/18 2018/19 2019/20 2020/21 2021/22 2022/23
ANTICIPATED 52.63% 52.90% 46.10% 44.24% 42.99% 42.90% 41.60% 40.07% 38.56% 37.23% PROSPECTIVE 52.63% 52.90% 46.10% 44.24% 42.99% 42.90% 41.60% 40.07% 38.56% 37.23% ADJUSTED POTENTIAL 54.03% 55.39% 52.55% 51.71% 51.41% 51.74% 50.36% 48.74% 47.14% 45.73%
NERC REFERENCE ‐ 15.40% 15.40% 15.40% 15.40% 15.40% 15.40% 15.40% 15.40% 15.40% 15.40%
PJM‐Figure 1: Summer (Left) and Winter240 (Right) Planning Reserve Margins
The PJM Reliability Pricing Model (RPM) or Forward Capacity Market provides:
procurement of capacity three years before it is needed through a competitive auction;
locational pricing for capacity that reflects limitations on the transmission system’s ability to deliver electricity into an
area and to account for the differing need for capacity in various areas of PJM;
a variable resource requirement to help set the price for capacity;
a backstop mechanism to ensure that sufficient resources will be available to preserve system reliability.
The Anticipated Capacity Reserve Margin falls below the PJM required reserve margin in 2020. The adjusted potential
resources Reserve Margin is above the PJM requirement through the assessment period. The major contributing factor to
the shortfall is significant retirements. It is expected that generator developers will make up the shortfall in those future
years. Continued use of the PJM RPM will ensure that the Planning Reserve Margin is met at least three years into the
future. A potential issue that could lead to incorrect projections is significant load growth well beyond what is expected.
Also, planned units not coming on‐line would affect the PJM reserve margin in the long‐term future, but the RPM is
anticipated to provide adequate resources in the three‐year near term when that time horizon is experienced.
239 For more information, see the 2011 PJM Reserve Requirement Study: http://www.pjm.com/planning/resource‐adequacy‐planning/~/media/planning/res‐adeq/2011‐rrs‐
study.ashx. 240
Each year represents the initial year of the winter season. For example: 2013 represents the 2013/2014 winter season.
0%
5%
10%
15%
20%
25%
30%
35%
2013 2014 2015 2016 2017 2018 2019 2020 2021 2022
0%
10%
20%
30%
40%
50%
60%
70%
2013 2014 2015 2016 2017 2018 2019 2020 2021 2022

PJM
NERC | 2012 Long‐Term Reliability Assessment | November 2012
Page 194 of 335
Demand Summer peak load growth for the PJM RTO is projected to average 1.36 percent per year over the next 10 years. The PJM
RTO summer peak is forecast to be 176,420 MW in 2022, a 10‐year increase of 20,166 MW (PJM‐Table 2). Annualized 10‐
year growth rates for individual PJM transmission zones range from 0.9 percent to 1.9 percent.
PJM‐Table 2: Demand Outlook PJM‐Summer 2013 2022 10‐Year Change CAGR
NET INTERNAL DEMAND 145,254 163,220 17,966 12.4% 1.30%
Load‐Modifying Demand Response 11,000 13,200 2,200 20.0% 2.05%
TOTAL INTERNAL DEMAND 156,254 176,420 20,166 12.9% 1.36%
PJM‐Winter 2013/14 2022/23 10‐Year Change CAGR
NET INTERNAL DEMAND 121,160 132,916 11,756 9.7% 1.03%
Load‐Modifying Demand Response 11,000 13,200 2,200 20.0% 2.05%
TOTAL INTERNAL DEMAND 132,160 146,116 13,956 10.6% 1.12%
A downward revision to the near‐term economic outlook for both the United States and PJM Area resulted in lower peak
and energy forecasts in the 2012 load forecast compared to the 2011 load forecast. This is tied to revised assumptions
regarding the timing of the recovery of the U.S. economy. While growth in later years accelerates, the historic growth rate
will not be restored until past the assessment period.
This year’s forecast reflects PJM’s adoption of an independent consultant’s recommendation to replace the load model’s
previous economic driver (Gross Metropolitan Product) with a variable that incorporates six economic measures (Gross
Domestic Product, Gross Metropolitan Product, Real Personal Income, Population, Households, and Non‐Manufacturing
Employment). A summary report of economic assumptions used in the 2012 load forecast provided by Moody’s Analytics
states that:
Mid‐Atlantic and Virginia Areas are expected to be among the fastest growing in the PJM service territory.
Long‐term growth in these metro areas will be driven by highly educated labor forces, favorable
demographics, productivity growth, and for some Virginia metro areas, plentiful and affordable housing,
and relatively low costs. Metro areas in Ohio and Pennsylvania are expected to grow more slowly.
Expansion in those states will be more restrained as regions transition away from manufacturing toward
more services‐oriented economies.
No footprint changes are included in these calculations. East Kentucky Power Cooperative (EKPC) has announced its
intention to join PJM on June 1, 2013. EKPC is a not‐for‐profit, member‐owned cooperative providing wholesale electricity
to 16 owner‐member distribution cooperatives that serve 520,000 homes, farms, and businesses across 87 of the 120
counties in Kentucky. EKPC owns and operates four major power plants with a total generating capacity of about 3,000
megawatts, as well as approximately 2,800 miles of high‐voltage transmission line. Peak load was 2,889 MW. No other
entity acquisitions or exits are anticipated. A map of the current PJM footprint is provided on the next page (PJM‐Figure 2).

PJM
NERC | 2012 Long‐Term Reliability Assessment | November 2012
Page 195 of 335
PJM‐Figure 2: PJM Footprint
PJM‐Table 3: PJM Entities AEC ‐ Atlantic City Electric Dayton ‐ Dayton Power and Light ME ‐ Metropolitan Edison AEP ‐ American Electric Power Service Corporation DEOK ‐ Duke Ohio and Kentucky PECO ‐ PECO Energy Company APS ‐ Allegheny Power DL ‐ Duquesne Light Company PENELEC ‐ Pennsylvania Electric ATSI ‐ American Transmission Systems Incorporated Dominion – Virginia Electric Power Company PEPCO ‐ Potomac Electric Power Company BGE ‐ Baltimore Gas and Electric DPL ‐ Delmarva Power and Light PPL ‐ PPL Electric Utilities ComEd ‐ Commonwealth Edison Company JCPL ‐ Jersey Central Power and Light PSEG ‐ Public Service Electric and Gas
Demand-Side Management Last year PJM had 11,600 MW of Demand‐Side resources available during the summer peak period. PJM expects similar
amounts for this year’s summer peak period. Because PJM has a shorter history with accepting Demand Response and
Energy Efficiency, the forecasts are conservative. Accordingly, Demand Response will remain slightly below was available
during the 2011 peak. The Energy Efficiency will increase from 728 MW in 2013 to 804 MW in 2022 (PJM‐Table 3).
PJM‐Table 4: Projected Demand‐Side Management Short‐Term
2022 Share of Total Internal Demand
PJM‐Summer 2013 2014 2015 2022 10‐Year Change
Direct Control Load Management (DCLM) 1,000 1,000 1,000 1,000 0 0.57% Contractually Interruptible (Curtailable) 5,000 7,200 7,200 7,200 2,200 4.08% Critical Peak‐Pricing (CPP) with Control 0 0 0 0 0 0.00% Load as a Capacity Resource 5,000 5,000 5,000 5,000 0 2.83%
TOTAL LOAD‐MODIFYING DEMAND RESPONSE 11,000 13,200 13,200 13,200 2,200 7.48%
TOTAL ENERGY EFFICIENCY 728 804 804 804 76 0.46%
TOTAL DEMAND‐SIDE MANAGEMENT 11,728 14,004 14,004 14,004 2,276 7.94%

PJM
NERC | 2012 Long‐Term Reliability Assessment | November 2012
Page 196 of 335
Demand‐Side resources accepted through the Forward Capacity Market are DSM that is dispatched like generator resources
and is treated as such. The more typical type of Demand‐Side resource is the kind that is retained for use by the PJM
operators during capacity emergencies, and it reduces load.
Energy Efficiency programs are included in the 2013–2022 load forecasts with approval for use in the PJM Reliability Pricing
Model (RPM). Energy Efficiency is included as a capacity resource in the RPM Market but is limited to a maximum of four
years. The Energy Efficiency then becomes part of the load forecast. Measurement and verification of Energy Efficiency
programs are governed by rules specified in PJM Manual 18B.241 To demonstrate the value of an Energy Efficiency resource,
resource providers must comply with the measurement and verification standards defined in this manual by establishing
Measurement and Verification (M&V) plans, providing post‐installation M&V reports, and undergoing an M&V audit.
There are some minor concerns related to the amount of information available to PJM, which can be used to determine the
amount of DR to dispatch during emergency conditions. PJM has filed tariff changes with FERC that will require more robust
reporting of the DR operational capability in real time for Curtailment Service Providers. PJM does not have a reliability
concern, but the additional information will help avoid the dispatch of DR that may not be necessary to meet the need of
the emergency conditions. PJM has addressed the issue of availability by creating three different DR products: Limited DR
(10 days for six hours per day), Extended Summer DR (unlimited days during summers for 10 hours per day) and Annual DR
(unlimited days for 10 hours per day), and requiring the necessary amount of annual capacity (DR or generation) to fulfill
the PJM reliability requirements. DSM used for reserves is limited by the RFC standard BAL‐002‐RFC‐02 to 25 percent of the
Operating Reserve requirement. This type of DSM is typically fully subscribed and can range up to approximately 2,500 MW
during a peak summer day.
Generation The predominant source of fuel in PJM is coal at approximately 42 percent. Next is natural gas at 26 percent and nuclear at
18 percent. Since the 2011 assessment, along with the DOEK generation, PJM added 1,608 MW of natural gas generation,
117 MW of existing nuclear generation uprates are included, and 280 MW of nameplate wind generation with 42 MW
counted as Existing‐Certain. In addition, 70 MW of nameplate solar generation with 27 MW counted as Existing‐Certain
(PJM‐Table 6, PJM‐Figure 3, and PJM‐Table 7). No capacity resource changes are expected though the summer of 2012. All
capacity changes in PJM occur only on June 1 of each year (PJM‐Table 5 and PJM‐Figure 4).
241 http://www.pjm.com/~/media/documents/manuals/m18b.ashx.

PJM
NERC | 2012 Long‐Term Reliability Assessment | November 2012
Page 197 of 335
PJM‐Table 5: Capacity Outlook242 Current 2022 Planned 2022 Planned & Conceptual
PJM‐Summer Capacity Share Capacity Share Change Capacity Share Change
Coal 78,105 42.1% 65,455 35.9% ‐12,650 67,310 28.9% ‐10,795 Petroleum 11,739 6.3% 10,683 5.9% ‐1,056 10,688 4.6% ‐1,051 Gas 52,395 28.3% 54,763 30.1% 2,368 92,554 39.8% 40,160 Nuclear 33,666 18.2% 35,566 19.5% 1,900 38,427 16.5% 4,761 Other/Unknown 0 0.0% 5,542 3.0% 5,542 5,916 2.5% 5,916 Renewables 9,519 5.1% 10,173 5.6% 654 17,857 7.7% 8,338
TOTAL 185,424 100.0% 182,182 100.0% ‐3,242 232,752 100.0% 47,329
PJM‐Figure 3: Summer Net Capacity Change
PJM‐Table 6: Renewable Capacity Outlook243 Current 2022 Planned 2022 Planned & Conceptual
PJM‐Summer Capacity Share Capacity Share Change Capacity Share Change
Hydro 2,677 28.1% 2,789 27.4% 112 2,989 16.7% 312 Pumped Storage 5,145 54.0% 5,145 50.6% 0 5,145 28.8% 0 Geothermal 0 0.0% 0 0.0% 0 0 0.0% 0 Wind 711 7.5% 1,078 10.6% 366 6,936 38.8% 6,225 Biomass 943 9.9% 1,090 10.7% 147 1,438 8.1% 494 Solar 42 0.4% 71 0.7% 28 1,349 7.6% 1,306
TOTAL 9,519 100.0% 10,173 100.0% 654 17,857 100.0% 8,338
PJM‐Figure 4: Summer Net Renewable Capacity Change
242 “Current” represents Existing‐Certain and Future‐Planned projections for the 2012 summer (for summer‐peaking assessment areas) or 2012/2013 winter (for winter‐peaking
assessment areas). “Share” represents the share (percent) of total Existing‐Certain and Future‐Planned capacity projected for the peak season. 243 Ibid.
‐15,000
‐12,000
‐9,000
‐6,000
‐3,000
0
3,000
6,000
9,000
12,000
2013 2014 2015 2016 2017 2018 2019 2020 2021 2022
MW
0
100
200
300
400
500
600
700
2013 2014 2015 2016 2017 2018 2019 2020 2021 2022
MW

PJM
NERC | 2012 Long‐Term Reliability Assessment | November 2012
Page 198 of 335
PJM‐Table 7: Renewable Capacity Outlook: On‐Peak Vs. Installed Current 2022 Planned
PJM‐Summer Wind Solar Hydro Biomass Wind Solar Hydro Biomass
Installed Capacity 5,472 106 2,677 943 7,391 175 2,789 1,090 On‐Peak Derate 4,761 64 0 0 6,313 104 0 0
EXPECTED ON‐PEAK OUTPUT 711 42 2,677 943 1,078 71 2,789 1,090
PJM had a total increase of 5,007 MW since last summer almost completely due to the addition of DEOK generation.
Generation additions and retirements in the rest of PJM almost netted out. A new natural gas combined‐cycle unit at
Dresden was added at 545 MW. Kearny natural gas units 13 and 14 were added for 267 MW. A new natural gas combined‐
cycle unit named Virginia City was added in AEP for 585 MW.
Martins Creek 4 oil unit was uprated 70 MW in PPL. Susquehanna nuclear units 1 and 2 in PPL were uprated 45 MW each. A
net of 568 MW of uprates and derates also occurred.
Benning 15 and 16, totaling 548 MW of oil generation, were retired in the Baltimore Gas and Electric (BGE) footprint.
Gorsuch units 1–4, totaling 189 MW of coal generation, were retired in AEP. The Buzzard Point East and West oil CTs
totaling 210 MW were retired in Pepco. The Hudson 1 natural gas unit at 322 MW was retired in PSE&G. Also in PSE&G the
Kearny 10 and 11 natural gas units were retired for a loss of 250 MW. The State Line 3 and 4 units were retired from
ComEd, totaling 515 MW.
No units were brought back into service since the last assessment. PJM has no on‐going long‐term outages of generation.
There are no significant project deferrals or cancellations; occasional delays are expected but should not cause any
reliability problems. Behind‐the‐meter generation is not considered as capacity in PJM. It offsets load that is also behind the
meter.
The Laurel Mountain Energy Storage Facility consists of eight Smart Grid Stabilization System Lithium Ion battery modules
for a total output of 27.4 MW on the same site as the Laurel Mountain Wind Farm located at Laurel Mountain, West
Virginia. A two MW (300 kilowatt hours of storage) battery for frequency regulation has been installed on the same
property as the Paradise Solar project in Deptford, New Jersey.
PJM uses the maximum generator capability expected capacity on‐peak (Existing‐Certain). This capability may only be
available for a limited period of time, but PJM requires that units be able to produce this amount over the peak hours. PJM
requires annual verification of this capability. Variable resources are only counted partially for PJM resource adequacy
studies. Both wind and solar initially utilize class average capacity factors, which are 13 percent for wind and 38 percent for
solar. Performance over the peak period is tracked, and the class average capacity factor is supplanted with historic
information. After three years of operation only historic performance over the peak period is used to determine the
individual unit’s capacity factor. No enhancements have been made as to how expected on‐peak capacity values are
calculated for each resource in PJM. PJM does not anticipate any reliability concerns resulting from minimum demand and
over generation. Intermittent resources can be required to disconnect. Established procedures address reliability concerns
caused by over‐generation.
Capacity Transactions All transactions are Firm for both specific generation and transmission (PJM‐Table 8). Firm contacts are mostly long‐term,
but some are shorter in the one‐ to three‐year time frames. All transactions are assumed to continue through the entire
assessment period unless a termination date has been specified. While it is possible that the termination dates could be
extended, experience shows that the transaction usually ends on the date contracted. PJM has no reliance on outside
assistance for emergency imports. There is no emergency generation needed to be available to meet PJM Reserve Margin
Requirement.

PJM
NERC | 2012 Long‐Term Reliability Assessment | November 2012
Page 199 of 335
PJM‐Table 8: Projected Capacity Transactions PJM‐Summer 2013 2014 2015 2016 2017 2018 2019 2020 2021 2022
Expected Imports 0 0 0 0 0 0 0 0 0 0 Firm Imports 1,453 1,453 1,453 1,453 1,453 1,453 1,453 1,453 1,453 1,453
TOTAL IMPORTS 1,453 1,453 1,453 1,453 1,453 1,453 1,453 1,453 1,453 1,453
Expected Exports 0 0 0 0 0 0 0 0 0 0 Firm Exports 1,236 1,236 1,236 1,236 1,236 1,236 1,236 1,236 1,236 1,236
TOTAL EXPORTS 1,236 1,236 1,236 1,236 1,236 1,236 1,236 1,236 1,236 1,236
TOTAL NET CAPACITY TRANSACTIONS 217 217 217 217 217 217 217 217 217 217
Transmission Today, as part of its ongoing RTO responsibilities, PJM’s Regional Transmission Expansion Plan (RTEP) protocol comprises a
process that considers the aggregate effects of many system trends: long‐term growth in electricity use, generating plant
retirements, broader generation development patterns—including the evolution of renewable resources—as well as
Demand‐Side response (DSR) programs and Energy Efficiency (EE) programs. A summary of expected and existing
transmission additions is included below (PJM‐Table 9).
PJM‐Table 9: Existing and Projected Transmission PJM AC (Circuit Miles) DC (Circuit Miles) Total (Circuit Miles)
EXISTING 51,583 66 51,649
Currently Under Construction 118 0 118 Planned ‐ Completed within First Five Years 709 0 709 Planned ‐ Completed within Second Five Years 1,267 0 1,267
2022 TOTAL (UNDER CONSTRUCTION & PLANNED) 53,677 66 53,743
Conceptual ‐ Completed within First Five Years 131 0 131 Conceptual ‐ Completed within Second Five Years 134 0 134
2022 TOTAL (UNDER CONSTRUCTION, PLANNED & CONCEPTUAL) 53,942 66 54,008
This process culminates in one recommended plan (one RTEP) for the entire PJM footprint that is submitted to PJM’s
independent Board of Managers (PJM Board) for consideration and approval. Under contractual agreement, the PJM
Board’s approval then obligates transmission‐owning utilities in PJM to build the facilities specified in the RTEP. This
includes construction of new transmission lines and other facilities as well as upgrades to existing transmission assets.
The RTO Perspective
PJM operates and plans the transmission system region‐wide, as a whole, ignoring corporate and state boundaries when
taking operational action or making planning decisions. By planning for future reliability needs on a region‐wide rather than
a utility‐by‐utility or state‐by‐state basis, PJM’s RTEP process helps focus on transmission upgrades that meet Reliability
Criteria and increase economic efficiency more effectively. PJM’s existing RTEP Protocol244 has been applied by PJM so as to
evaluate reliability and market efficiency driving transmission expansion plans today using bright line triggers.
Baseline Reliability Upgrades
PJM’s baseline reliability assessments identify areas where the electric power system, forecast over a specific time, would
not be in compliance with NERC Reliability Standards. These baseline assessments lead to recommendations for
enhancement plans, referred to as baseline transmission network upgrades, to ensure compliance with those standards.
Fundamentally, the construction of baseline transmission upgrades is required to ensure that the PJM system remains in
compliance with NERC Reliability Standards. This baseline then serves as the basis for the analysis of subsequent requests
for transmission service and interconnection.
Scope of Upgrades Discussed
In 2011 alone, the PJM Board approved approximately 400 individual Bulk Electric System (BES) upgrades. However, to put
reasonable parameters around the scope and length of this report, the upgrades discussed here are generally those whose
244 As codified in Schedule 6 of PJM’s Operating Agreement (http://www.pjm.com/documents/~/media/documents/agreements/oa.ashx) and described in detail in the PJM
manuals (http://www.pjm.com/documents/manuals.aspx).

PJM
NERC | 2012 Long‐Term Reliability Assessment | November 2012
Page 200 of 335
costs exceed $5 million. A complete list of all approved RTEP upgrades, a brief description of facility and driver, and current
status can be found on PJM’s website.245 The map on the next page presents major transmission infrastructure in the PJM
Assessment Area footprint (PJM‐Figure 5).
PJM‐Figure56: Existing Backbone Transmission
TrAIL
The 500 kV Trans Allegheny Interstate Line (TrAIL) was placed in service on May 23, 2011, improving reliability into such
congested areas as Washington, D.C., Baltimore, and northern Virginia. The TrAIL line was built in three segments,
connecting substations in southwestern Pennsylvania, northern West Virginia and northern Virginia as shown on Map 1.3.
Built by and jointly owned by Allegheny Energy (now FirstEnergy) and Dominion, the 220‐mile TrAIL line was the first high‐
voltage backbone transmission line approved by the PJM Board through PJM’s planning process to enter commercial
operation.
MAPP Abeyance
The Mid‐Atlantic Power Pathway (MAPP), shown on Map 1.3, was placed in abeyance by the PJM Board on August 18, 2011.
PJM 2011 RTEP generator sensitivity analysis indicated that the need for the line has moved out several years, beyond
245 http://www.pjm.com/planning/ rtep‐upgrades‐status/construct‐status.aspx.

PJM
NERC | 2012 Long‐Term Reliability Assessment | November 2012
Page 201 of 335
2015, but as early as 2019. The PJM Board has also directed PJM to perform additional sensitivity analyses as part of the
2012 RTEP cycle of analysis—including the impact of May 2012 RPM auction results—to assess the need to further address
MAPP abeyance.
Susquehanna–Roseland
In 2007 the PJM Board approved the Susquehanna–Roseland 500 kV line, shown on Map 1.3, to resolve numerous
overloads on critical 230 kV circuits across eastern Pennsylvania and northern New Jersey beginning in 2012. PJM’s 2008
RTEP Retool validated the required June 1, 2012 in‐service date in light of 23 single contingency Reliability Criteria thermal
violations and NERC Category C double‐circuit tower line contingency thermal violations. PJM’s 2009 RTEP Retool analysis
for 2012 also included an assessment of the continued need for the Susquehanna–Roseland 500 kV line. Based on the
identification of 13 single contingency thermal overloads and 10 double‐circuit tower line outage overloads, PJM re‐
validated the line’s June 1, 2012 in‐service date.
PJM conducted additional analysis in 2011 to assess the impact of delays to the construction. Originally required to be in
service by June 1 2012, regulatory delays have pushed the expected in‐service date to June 1, 2015. Updated analysis using
the 2011 load forecast confirmed double‐circuit tower line (DCTL) violations beginning in summer 2012. The near‐term
solution is to operate to the DCTL violations in real‐time operation and adjust generation and implement Demand‐Side
Response (DSR) as required to maintain grid reliability. Updated studies also show that Hudson Unit 1, previously
designated as a reliability‐must‐run unit, is not required to maintain reliability and will be released.
PATH Abeyance
Analysis performed during the 2010 RTEP cycle required an in‐service date of June 1, 2015 for the PATH Line as shown on
Map 1.3. The PJM Board issued a statement on February 28, 2011, suspending the PATH line.
PJM staff performed an updated analysis based on the 2011 RTEP assumptions that included generation deliverability and
load. Additional analysis performed on a 2017 study year case with 2011 RTEP assumptions examined the impact on the
PATH abeyance from Warren Generation, Global Insights load forecast, RPS, at‐risk generation and state DSR/EE goals. The
2011 RTEP analysis suggests that the need for the PATH line has moved several years beyond 2015. Based on these analyses
the PJM Board decided to continue to hold the project in abeyance and requested that the Transmission Owners suspend
development activities. Furthermore, the PJM Board has directed staff to perform additional analysis using the 2012 RTEP
assumptions and incorporating May RPM base residual auction results.
The map on the next page presents transmission upgrades that were underway in early 2012 (PJM‐Figure 6).

PJM
NERC | 2012 Long‐Term Reliability Assessment | November 2012
Page 202 of 335
PJM‐Figure 6: Significant Transmission Upgrades
PJM evaluates transmission congestion continuously. When congestion costs become uneconomical related to the cost of
transmission construction, transmission enhancement is considered. The PJM Board has the final say on whether a project
is developed to mitigate congestion charges. PJM has a number of projects to tap lines for generation interconnection or for
load serving. See the map of PJM above to see where significant transmission is being added. There are no interconnection‐
related projects or issues in PJM. There are no project delays or temporary service outages for transmission facilities (lines
or transformers) that will impact reliability during the assessment period. The potential reliability impact of not meeting
target in‐service dates for projects is under constant review to identify alternate plans or mitigating operational actions that
should be taken in the event of project delays. Available mitigating measures include re‐dispatch of generation, operating
procedures, and temporary Special Protection Schemes.
In PJM, generation‐seeking capacity revenue must expand the transmission system so as to enable their deliverability to the
PJM system. Therefore, sufficient transmission will exist for any new capacity project in PJM.
Static Var Compensators (SVC) to be Installed:
Frost Bridge 138 kV; FirstEnergy (AP); 70 Mvar; 6/1/12
Meadowbrook 500 kV; Primary Power; 600 Mvar; 6/1/14
Mt. Storm 500 kV; Primary Power; 250 Mvar; 6/1/14
Hunterstown 500 kV; FirstEnergy (ME); 500 Mvar; 6/1/14

PJM
NERC | 2012 Long‐Term Reliability Assessment | November 2012
Page 203 of 335
Altoona 230 kV; FirstEnergy (ME); 250 Mvar; 6/1/14
Fast Switching Capacitors
Mansfield 345 kV; FirstEnergy (PN); 100 Mvar; 6/1/14
Jack’s Mountain 500 kV; FirstEnergy (PN); 100 Mvar; 6/1/17
Jack’s Mountain 500 kV; FirstEnergy (PN); 500 Mvar; 6/1/17
HVdc
Bergen 230 kV (PSE&G‐NJ)–49th Street 345 kV (ConEd–NY) 670 MW; 6/1/13
Vulnerability Assessment PJM has very little hydro generation, and reservoir levels are adequate. PJM expects no problems with warm cooling water.
Any one specific generator outage, even if it is long‐term, can be replaced with other resources available within PJM.
Significant development of wind, solar, and biomass has already occurred in PJM. Much of this development is in response
to existing Renewable Portfolio Standards (RPS). The challenges of integrating this variable generation will grow as more
and more generation of this type is added. Demand‐Side resources are not of significant size to be of great concern for
unresponsiveness. Penalties exist to make unresponsiveness financially unattractive. Distributed generation has been
increasing in PJM, especially solar installations, which are mostly connected to lower voltage lines. No special operating
procedures are required. PJM has developed a Wind Power Forecast tool and visualization to assist operations.
No additional Under‐Voltage Load Shedding (UVLS) schemes are planned. No new Special Protection Systems are planned.
PJM does not include planning for catastrophic/high‐impact, low‐frequency (HILF) events.
Significant smart grid programs include:
Synchrophasor data may be integrated into operational, planning, and study tools by 2022, and it is anticipated the
data will be used in real‐time operational decision making.
PJM’s transmission system will include FACTS devices, SVCs, Statcoms, and other technologies that will enable
inverter‐based generation to reliably connect to the system.
Dynamic line ratings.
In addition to renewable integration, PJM anticipates seeing more energy storage deployed across the grid in the form
of batteries, thermal storage, flywheels, and perhaps even compressed air. It is possible some of these technologies
will also be treated as transmission assets to help defer line upgrades.
Automated Voltage Control (AVC) that will optimize the voltage schedule across the PJM footprint.
Some form of automated/optimized restoration tool.
On‐line transient stability analysis tool that also recommends preventative control actions to operators.
Smart grid devices that may enhance reliability include synchrophasor implementation, which can help with better
modeling and better real‐time awareness of what’s happening in the system and how the health of the system is trending.
In addition, PJM’s advanced technology pilot programs give PJM the opportunity to better understand the upcoming
technologies, such as aggregated Demand Response and electric vehicle charging, along with their benefits and their
challenges. PJM will have better insight into ways to optimize all the assets on the system.
Smart grid applications that may have a reliability concern include:
It will take time to be comfortable with synchrophasor data and what it means. Great care and testing and analysis
need to be taken while operators are still getting familiar with what the synchrophasor data means.
The paradigm switch of load following generation and the need for load shaping, where possible (e.g., smart
charging), and shifting, also better load forecasting and modeling.

PJM
NERC | 2012 Long‐Term Reliability Assessment | November 2012
Page 204 of 335
PJM developed an analysis of coal generation at risk of retiring based on an assessment of required environmental retrofit
costs vs. the cost of constructing a new natural gas‐fired turbine. This at‐risk generation analysis concluded that there is no
overall resource adequacy concern for the PJM footprint; however, there may be localized reliability concerns that will need
to be addressed either with replacement generation capacity or transmission upgrades if the impacted units are retired or
need lengthy environmental retrofit outages. PJM continues to coordinate closely with PJM Generation Owners, PJM
Transmission Owners and neighboring systems through the PJM committee structure and consistent with the PJM tariff and
manuals. In order to maintain system reliability, PJM will designate units as reliability‐must‐run if their retirement date is
targeted to be in advance of required system reinforcements.
PJM requested that all impacted generation owners provide the most accurate information regarding unit retirements,
environmental retrofits, unit derates and potential regulatory issues related to the environmental regulations. Combined
with the publically announced unit retirements and the deactivation analysis results, PJM is utilizing this information to
address the short‐term impact and long‐term projections through 2018. PJM is communicating with interconnected
Transmission Owners, as required, to address local reliability issues, and is also communicating with MISO to compare
reliability analyses and coordinate outages. At this point PJM has added the environmental retrofit outages—to the extent
provided by the generation owners—to projections for maintenance outages from 2012–2018, and are continuing to assess
the impact to off‐peak reliability. PJM will continue to coordinate closely to analyze the impact of retiring generation,
planned outage to perform retrofits, normal generation, and transmission maintenance outages, as well as transmission
outages required to reliably take retiring units out of service. Generation Owners have indicated that while there appears to
be sufficient time to complete environmental retrofits, if there are delays in scheduling retrofit outages due to system
constraint issues or capital budget limitations, then there may be significant challenges in completing the retrofit outages in
the required time to comply with environmental regulations.
Standing and Emerging Reliability Issues Retirement of capacity because of the environmental regulations and diminishing amounts of blackstart resources.
Retirement of Generation
The concern about generator retirements due to stricter environmental regulations is a standing issue that has previously
been investigated by the NERC Reliability Assessment Subcommittee.
Because of the way that PJM plans their resources for the three‐year‐in‐advance period, it is not likely to be an issue in the
near term but may become an issue if interconnection of new resources does not match the retirement of existing
resources. Drivers are the new, stricter environmental regulations. While some Generator Owners wait to see how quickly
and strictly these new rules will be enforced, others are more transparent, announcing the future retirements far in
advance. PJM RPM requires that units be removed at least three years in advance to avoid severe penalties. Loss of large
generating resources can affect PJM’s resource adequacy in obvious ways. At this time, loss of resources in the three‐year
time frame has amounted to approximately 10,000 MW. It is difficult to tell how much will be lost past that time frame.
While it isn’t thought that PJM would violate its reserve margin requirement, PJM may be operating closer to it.
Replacement resources could be in different locations from the locations of retiring units, which could load up the
transmission system more.
No changes to the reference case would be needed to model this issue because changes to resources as a result of this
issue would happen in the future. Loss of resources would affect the entire PJM system. The method for retiring units in
PJM allows for PJM to delay unit retirements if reliability issues exist.246 See Manual 14d Section 9 – Generator
Deactivations. Strict requirements for adherence to the new environmental regulations may cause reserve margins to get
close to the required values. Some flexibility to allow for cost‐effective replacement of resources is needed. Movement
246 http://www.pjm.com/~/media/documents/manuals/m14d.ashx.

PJM
NERC | 2012 Long‐Term Reliability Assessment | November 2012
Page 205 of 335
away from the existing coal fuel supply infrastructure will burden other fuel supplies and supply chains, like the
transportation and storage of natural gas.
Loss of Blackstart Resources
The concern about blackstart resource retirements is an emerging issue that has been discussed but not analyzed. The time
frame for this issue is today since PJM is already seeing fewer blackstart resources available. PJM establishes a minimum
blackstart unit threshold of three units for each restoration zone. Drivers for the blackstart resources going away are
maintenance and retrofit costs associated with keeping some of the older blackstart resources running. Other cost
increases include retrofitting to comply with the new environmental regulations and, though significantly diminished, the
cost associated with CIP compliance. Many blackstart unit owners also complain that the reimbursed costs received from
PJM are not adequate.
Loss of blackstart resources will not affect reserve margins significantly. Blackstart resources are usually small units that
contribute little to installed capacity. While not directly affecting reliability in PJM, loss of blackstart resources would
lengthen a blackout. Transmission adequacy would not be affected by the loss of blackstart resources. Different cranking
paths may need to be used, but the amounts of power transferred are small.
No changes to the reference case would be needed to model this issue. Since location of blackstart resources is considered
Critical Energy Infrastructure information (CEII), location information will not be disclosed.
A blackstart generator replacement process exists but has proved to be ineffective. See Manual 14d Section 10 “Blackstart
Replacement Process.”247 Since some of the blackstart resource retirements are related to the enforcement of stricter
environmental regulations, strict adherence to those regulations and their time frames can exacerbate the blackstart
availability issue.
247 http://www.pjm.com/~/media/documents/manuals/m14d.ashx.

SERC‐E
NERC | 2012 Long‐Term Reliability Assessment | November 2012
Page 206 of 335
SERC-E Planning Reserve Margins Reserves will provide adequate and reliable power supply throughout this assessment period. All Planning Reserve Margins
are projected to remain above the NERC Reference Margin Level from 2013–2022 (SERC‐E‐Table 1 and SERC‐E‐Figure 1).
SERC‐E‐Table 1: Planning Reserve Margins SERC‐E‐Summer 2013 2014 2015 2016 2017 2018 2019 2020 2021 2022
ANTICIPATED 25.03% 24.16% 23.18% 24.15% 22.91% 21.80% 23.45% 22.52% 22.16% 22.64% PROSPECTIVE 25.03% 24.16% 23.18% 24.15% 22.91% 21.80% 23.45% 22.52% 22.16% 22.64% ADJUSTED POTENTIAL 25.07% 24.19% 23.21% 24.18% 22.94% 21.84% 23.48% 22.55% 22.19% 22.67%
NERC REFERENCE ‐ 15.00% 15.00% 15.00% 15.00% 15.00% 15.00% 15.00% 15.00% 15.00% 15.00%
SERC‐E‐Winter 2013/14 2014/15 2015/16 2016/17 2017/18 2018/19 2019/20 2020/21 2021/22 2022/23
ANTICIPATED 30.14% 30.14% 28.32% 29.63% 28.20% 26.95% 28.09% 27.19% 27.25% 27.53% PROSPECTIVE 30.14% 30.14% 28.32% 29.63% 28.20% 26.95% 28.09% 27.19% 27.25% 27.53% ADJUSTED POTENTIAL 30.17% 30.18% 28.35% 29.66% 28.23% 26.98% 28.12% 27.22% 27.28% 27.56%
NERC REFERENCE ‐ 15.00% 15.00% 15.00% 15.00% 15.00% 15.00% 15.00% 15.00% 15.00% 15.00%
SERC‐E‐Figure 1: Summer (Left) and Winter248 (Right) Planning Reserve Margins
SERC does not require specific Reserve Margin criteria or “targets” for SERC‐E. Therefore, NERC applies the 15 percent
Reference Margin Level throughout the assessment period. SERC utilities in North Carolina include renewables in their
portfolios to meet the requirements of the Renewable Energy and Energy Efficiency Portfolio Standard (REPS). Under this
standard, investor‐owned utilities in North Carolina will be required to meet up to 12.5 percent of their energy needs
through renewable energy resources or Energy Efficiency measures by 2021. Rural electric cooperatives and municipal
electric suppliers are subject to a 10 percent REPS requirement.249 Variable resources are assessed for their availability to
meet the needs of customers reliably and economically, based on the requirements of the standard and maintaining
flexibility in making long‐term resource decisions. Reporting results show that utilities are planning for reserves in the range
of 12 to 15 percent for the upcoming period.
No operational problems are anticipated that would detract from these projections. For the forecast and any extreme
peaks, Reserve Margins are such that loss of multiple units can be accommodated without threatening reliability. The
VACAR reserve sharing agreement250 is also available to support recovery from such extreme events. Beyond these
measures, transmission Reserve Margins can also be utilized to secure market purchases to maintain reliability. As stated in
annual integrated resource plan filings with the North Carolina Utilities Commission (NCUC), various entities are evaluating
a wide range of factors in order to ensure reliable and cost‐effective service to customers. Over the next 10 years, entities
will be evaluating numerous factors, such as new environmental requirements, renewable energy, new generation
technologies and rising commodity costs.
248
Each year represents the initial year of the winter season. For example: 2013 represents the 2013/2014 winter season. 249 http://www.ncuc.commerce.state.nc.us/reps/reps.htm 250 The VACAR‐South Reliability Coordinator area includes portions of two southeastern states (North Carolina and South Carolina). There are five Balancing Authorities in SERC‐
E; Alcoa Power Generating, Inc. – Yadkin Division, Duke Energy Carolinas, Progress Energy Carolinas, South Carolina Electric & Gas Company, and South Carolina Public Service Authority.
0%
5%
10%
15%
20%
25%
30%
2013 2014 2015 2016 2017 2018 2019 2020 2021 2022
0%
5%
10%
15%
20%
25%
30%
35%
2013 2014 2015 2016 2017 2018 2019 2020 2021 2022

SERC‐E
NERC | 2012 Long‐Term Reliability Assessment | November 2012
Page 207 of 335
Demand Entities are projecting reductions in demand growth rates when compared to forecasts a year earlier. The compound
annual growth rate (CAGR) for Total Internal Demand is projected to be 1.2 percent, slightly lower than last year’s 10‐year
forecast (SERC‐E‐Table 2). Most entities are not expecting significant change in growth. However, differences are accounted
for through lower load projections. Entities in the area have experienced a shift in load‐serving responsibilities among
entities in the area due to contractual agreements scheduled between 2013 and 2019.
SERC‐E‐Table 2: Demand Outlook SERC‐E‐Summer 2013 2022 10‐Year Change CAGR
NET INTERNAL DEMAND 41,805 46,386 4,581 11.0% 1.16%
Load‐Modifying Demand Response 1,928 2,311 383 19.9% 2.03%
TOTAL INTERNAL DEMAND 43,733 48,697 4,964 11.4% 1.20%
SERC‐E‐Winter 2013/14 2022/23 10‐Year Change CAGR
NET INTERNAL DEMAND 42,042 46,730 4,688 11.2% 1.18%
Load‐Modifying Demand Response 1,540 1,665 125 8.1% 0.87%
TOTAL INTERNAL DEMAND 43,582 48,395 4,813 11.0% 1.17%
Some entities in the reporting area are currently assessing their forecasting models for the most recent regional and local
economic projections. This information will come from vendors such as Economy.com and IHS Global Insight. Weather
projections were taken from various sources, such as the National Oceanic and Atmospheric Administration (NOAA), or
individual company databases. Projections in this reporting area are expected to be normal. However, energy sales
projections, which serve as a primary driver of the load forecast for some entities, are lower based on revised economic
growth assumptions. No other significant changes or enhancements were reported for this year’s forecasting methods.
Demand-Side Management Demand Response and Energy Efficiency is projected to be 1,928 MW and 581 MW respectively for the 2013 reporting
period.
Approximately 2,310 MW of Demand Response and 299 MW of Energy Efficiency are projected to be available on‐peak by
2022. These programs are used to reduce the effects of period peaks and are considered part of the utilities’ resource
planning. Demand Response is projected to account for 4.40 and 4.75 percent of Total Internal Demand in 2013 and 2022,
respectively. Demand Response is projected to increase to 1,928 MW in 2013. Additionally, Energy Efficiency is projected to
account for 0.70 and 2.97 percent of Total Internal Demand for 2013 and 2022, respectively (SERC‐E‐Table 3). Projections
are intended to reduce peak demand on entity systems within the reporting area.
SERC‐E‐Table 3: Projected Demand‐Side Management Short‐Term
2022 Share of Total Internal Demand
SERC‐E‐Summer 2013 2014 2015 2022 10‐Year Change
Direct Control Load Management (DCLM) 858 969 1,064 1,201 343 2.47% Contractually Interruptible (Curtailable) 967 968 981 1,002 35 2.06% Critical Peak‐Pricing (CPP) with Control 14 19 19 19 5 0.04% Load as a Capacity Resource 89 89 89 89 0 0.18%
TOTAL LOAD‐MODIFYING DEMAND RESPONSE 1,928 2,045 2,153 2,311 383 4.75%
TOTAL ENERGY EFFICIENCY 299 375 549 1,444 1,146 2.97%
TOTAL DEMAND‐SIDE MANAGEMENT 2,227 2,420 2,702 3,755 1,529 7.71%
Entities continue to assess the effects of newly approved Energy Efficiency programs installed on the system since 2010.
However, a variety of existing programs that support Energy Efficiency and Demand Response are also offered to customers
in this reporting area. Some of the programs that include current Energy Efficiency and DSM programs are interruptible
capacity programs, load control curtailing programs, residential air conditioning direct loads programs, energy products
loan programs, standby generator controls programs, residential time‐of‐use programs, Demand Response programs
(interruptible and related rate structures), Power Manager Power Share conservation programs, residential Energy Star
rates programs, the Good Cents new home program, the commercial Good Cents program, the thermal storage cooling
program, the H20 Advantage water heater program, general service and industrial time‐of‐use programs, and hourly pricing
for incremental load interruptible programs. They are also used to reduce the effects of period peaks and are considered

SERC‐E
NERC | 2012 Long‐Term Reliability Assessment | November 2012
Page 208 of 335
part of the utilities’ resource planning. The commitments to these programs are part of a long‐term, balanced energy
strategy to meet future energy needs. Load response will be measured by trending real‐time load data from telemetry and
statistical models that identify the difference between the actual consumption and the projected consumption absent the
curtailment event. As stated above, entities include renewables in their portfolios to meet the requirements of the REPS of
North Carolina.
Generation Companies within the SERC‐E reporting area expect to have 48,218 MW of Existing‐Certain, 0 MW of Existing‐Other, 0 MW
of Existing‐Inoperable, 3,167 MW of Future‐Planned, and 14 MW of Conceptual resources on‐peak for 2013. Additionally,
7,888 MW of Future‐Planned resources and 14 MW of Conceptual resources are expected to be added in 2013. This
capacity is projected to help meet demand during this time period. Coal is the primary source of fuel within this area.
Entities have added the 20 MW of Biomass and 5 MW of Solar Existing‐Certain resources since the previous long‐term
reporting period (SERC‐E Table 5 and SERC‐E Figure 3). However, entities have reported 656 MW of unit retirements since
the previous long‐term reporting period. Additionally, 1,191 MW of unit retirements have been reported to occur during
the 2013 to 2022 period (SERC‐E‐Table 4 and SERC‐E‐Figure 2). Internal company discussions of these retirements have
included mitigation measures that must be explored and considered as part of any decision to retire existing generating
units. This capacity will be offset in part by the addition of 4,251 MW of combined‐cycle units by 2022 and 2,234 MW of
nuclear generation (1,117 MW in 2016 and 2019).
SERC‐E‐Table 4: Capacity Outlook251 Current 2022 Planned 2022 Planned & Conceptual
SERC‐E‐Summer Capacity Share Capacity Share Change Capacity Share Change
Coal 16,775 34.8% 17,600 31.4% 825 17,600 31.3% 825 Petroleum 1,967 4.1% 1,967 3.5% 0 1,967 3.5% 0 Gas 11,682 24.2% 15,934 28.4% 4,252 15,934 28.4% 4,252 Nuclear 11,456 23.7% 14,242 25.4% 2,786 14,242 25.4% 2,786 Other/Unknown 107 0.2% 107 0.2% 0 107 0.2% 0 Renewables 6,256 13.0% 6,281 11.2% 25 6,295 11.2% 39
TOTAL 48,243 100.0% 56,131 100.0% 7,888 56,145 100.0% 7,902
SERC‐E‐Figure 2: Summer Net Capacity Change
There are no new generator uprates in service, and no generation taken out of service for maintenance during the period.
SERC methods of data collection do not identify specific uprates or derates throughout the year. Rather, entities reporting
to SERC make changes to unit generation continuously throughout the year. Additionally, there is no behind‐the‐meter
generation reported for the period. However, 387 MW of Other/Unknown resources and 200 MW of capacity from standby
generator programs and interruptible services are anticipated during this time.252
251 “Current” represents Existing‐Certain and Future‐Planned projections for the 2012 summer (for summer‐peaking assessment areas) or 2012/2013 winter (for winter‐peaking
assessment areas). “Share” represents the share (percent) of total Existing‐Certain and Future‐Planned capacity projected for the peak season. 252 Includes resources categorized as Existing‐Other, which are not included in the above table.
0
1,000
2,000
3,000
4,000
5,000
6,000
7,000
8,000
2013 2014 2015 2016 2017 2018 2019 2020 2021 2022
MW

SERC‐E
NERC | 2012 Long‐Term Reliability Assessment | November 2012
Page 209 of 335
SERC‐Table 5: Renewable Capacity Outlook253 Current 2022 Planned 2022 Planned & Conceptual
SERC‐E‐Summer Capacity Share Capacity Share Change Capacity Share Change
Hydro 3,087 49.3% 3,087 49.1% 0 3,087 49.0% 0 Pumped Storage 3,044 48.7% 3,044 48.5% 0 3,044 48.4% 0 Geothermal 0 0.0% 0 0.0% 0 0 0.0% 0 Wind 0 0.0% 0 0.0% 0 0 0.0% 0 Biomass 97 1.5% 117 1.9% 20 127 2.0% 30 Solar 28 0.5% 33 0.5% 5 37 0.6% 9
TOTAL 6,256 100.0% 6,281 100.0% 25 6,295 100.0% 39
SERC‐Figure 3: Net Renewable Capacity Change
Variable resources are limited within this area and are not commonly planned in peak maximum capacity calculations.
However, they are assessed for their availability to meet the needs of customers reliably and economically, based on the
requirements of the regulatory standards and their ability to maintain flexibility for long‐term resource decisions. These
resources may be given a reduced capacity contribution for Reserve Margin based on an estimated hourly energy profile
(SERC‐Table 6). As required, entities will continue to evaluate these and other renewable resources as part of its integrated
resource planning process. In addition, no immediate changes in entity planning procedures are needed. This is due to
adding small increments of variable resources yearly to meet the REPS 12.5 percent target by 2021.
SERC‐Table 6: Renewable Capacity Outlook: On‐Peak Vs. Installed Current 2022 Planned
SERC‐E‐Summer Wind Solar Hydro Biomass Wind Solar Hydro Biomass
Installed Capacity 0 28 3,087 97 0 33 3,087 117 On‐Peak Derate 0 0 0 0 0 0 0 0
EXPECTED ON‐PEAK OUTPUT 0 28 3,087 97 0 33 3,087 117
Capacity Transactions Utilities within the SERC‐E reporting area expect the capacity imports and exports listed in the table below (SERC‐E‐Table 7).
These transactions have been accounted for in the Reserve Margin calculations for the reporting area. Most of the
contracts in the area are agreements for a 10‐year period for the winter and summer peaking seasons. These transactions
are external and internal to the Region and the reporting area. All purchases are backed by Firm contracts for both
generation and transmission and are not considered to be based on partial path reservations. Of the imports/exports
shown below, very few are associated with Liquidated Damages Contracts (LDCs), in which the contracts are considered 100
percent “make‐whole.”
253 “Current” represents Existing‐Certain and Future‐Planned projections for the 2012 summer (for summer‐peaking assessment areas) or 2012/2013 winter (for winter‐peaking
assessment areas). “Share” represents the share (percent) of total Existing‐Certain and Future‐Planned capacity projected for the peak season.
0
5
10
15
20
25
30
2013 2014 2015 2016 2017 2018 2019 2020 2021 2022
MW

SERC‐E
NERC | 2012 Long‐Term Reliability Assessment | November 2012
Page 210 of 335
SERC‐E‐Table 7: Projected Capacity Transactions SERC‐E 2013 2014 2015 2016 2017 2018 2019 2020 2021 2022
Expected Imports 0 0 0 0 0 0 0 0 0 0 Firm Imports 1,003 815 815 715 760 760 850 850 850 850
TOTAL IMPORTS 1,003 815 815 715 760 760 850 850 850 850
Expected Exports 0 0 0 0 0 0 0 0 0 0 Firm Exports 117 167 167 167 167 167 167 167 167 67
TOTAL EXPORTS 117 167 167 167 167 167 167 167 167 67
TOTAL NET CAPACITY TRANSACTIONS 886 648 648 548 593 593 683 683 683 783
To meet Reserve Margins during the period, entities within the SERC‐E reporting area do not rely on resources outside the
Region for emergency imports, reserve sharing, or outside assistance/external resources. Most entities within this area
participate in reserve sharing agreements (RSAs) with other VACAR utilities. Collectively, members of the VACAR RSA, under
their current agreement, hold 1.5 times the largest single contingency (1,135 MW) in the VACAR RSA Area to meet Reserve
Margin targets. The Reserve Sharing Group is expected to have adequate reserves throughout the operating period. Total
emergency MW from these imports was not reported but are available as needed.
Transmission In‐service dates for existing transmission projects are not at risk during the reporting period. If delays occur that would
result in reliability concerns, mitigating actions would be developed accordingly. Mitigating measures include re‐dispatch of
generation, operating procedures, and Special Protection Systems. On an ongoing basis, companies review/confirm
completion dates and monitor the construction status of all projects. Transmission projects planned to address a potential
System Operating Limit (SOL) or Interconnection Reliability Operating Limit (IROL) problem commonly receive the highest
priority for resources. A summary of existing and projected transmission additions is included below (SERC‐E‐Table 8)
SERC‐E‐Table 8: Existing and Projected Transmission SERC‐E AC (Circuit Miles) DC (Circuit Miles) Total (Circuit Miles)
EXISTING 22,180 0 22,180
Currently Under Construction 33 0 33 Planned ‐ Completed within First Five Years 276 0 276 Planned ‐ Completed within Second Five Years 189 0 189
2022 TOTAL (UNDER CONSTRUCTION & PLANNED) 22,678 0 22,678
Conceptual ‐ Completed within First Five Years 87 0 87 Conceptual ‐ Completed within Second Five Years 189 0 189
2022 TOTAL (UNDER CONSTRUCTION, PLANNED & CONCEPTUAL) 774 0 774
New construction efforts are focused on completing facilities ahead of seasonal peak periods. Close coordination between
construction management and operations planning ensures schedule requirements and completion requirements are well‐
understood. Several large‐scale construction projects are planned and will be implemented in phases around seasonal peak
load periods to mitigate reliability concerns associated with line clearances and non‐routine operating arrangements during
higher seasonal load periods. Additionally, no significant transmission facility outages are anticipated to be out of service
during the period.
Regional studies are also performed on a routine basis both internally and externally. Coordinated single transfer capability
studies with external utilities are performed quarterly by the SERC Near‐Term Study Group (NTSG). Projected seasonal
import and export capabilities are consistent with those identified in these assessments. Constraints that are external to the
SERC subregion are evaluated as part of the SERC East‐RFC Seasonal Study Group efforts. No transmission constraints have
been identified that are anticipated to significantly impact reliability.
To address the need to maintain and enhance reliability, Progress Energy Corporation (PEC) is currently implementing a
special transmission project in response to NERC’s recommendation to utilities entitled “Consideration of Actual Field
Conditions in Determination of Facility Ratings.” The entity is using Light Detection and Ranging, (LiDAR) technology to
analyze these conditions. Results from the project are currently being assessed, and the project is scheduled to be
completed by the end of 2014. Any concerns that are identified will be mitigated through an immediate remediation
strategy.

SERC‐E
NERC | 2012 Long‐Term Reliability Assessment | November 2012
Page 211 of 335
Other Transmission Operators in the SERC‐E reporting area are also subject to the NERC recommendation. None report any
negative transmission reliability or adequacy concerns.
Shifts from the use of coal to natural gas as a generation fuel source due to decreasing costs of natural gas have led to non‐
typical transmission line power loadings. However, none of the Transmission Operators in the SERC‐E reporting area report
any negative impact on transmission adequacy. Entities will continue to consider new Demand‐Side Management tools, SVC
technology, and potential applications of smart grid technology.
Vulnerability Assessment Resource adequacy studies help determine entity Reserve Margins in the reporting area. The study recognizes, among
other factors (such as load forecast uncertainty due to economics and weather), generator unavailability, deliverability of
resources to load, and the benefit of interconnection with neighboring systems. Uncertainties may also be addressed
through capacity margin objectives and practices in other resource assessments at the operational level. These studies may
be performed annually using input provided from Generator Operators. As conditions warrant, entities may see the need to
perform additional assessments to mitigate challenging conditions on the system. Entities report that historical studies have
determined that a minimum Planning Reserve Margin of 12 percent is adequate for reliability. The latest studies have
identified that future generation is needed to achieve planning adequate reserves. Entities will account for this in their
long‐term generation plans. Plans will also account for new environmental requirements, renewable energy, new
generation technologies, and rising commodity costs. No other concerns are known at this time, and operational problems
are not anticipated for the period.
Additionally, a study was done on the eastern North Carolina coastal area (Jacksonville, Havelock, and Morehead City) that
resulted in a long‐term project to install a large Static Var Compensator at the Jacksonville 230 kV substation. Similarly,
another dynamic study was recently performed in the western area of North Carolina that validated the existing procedure
to operate a minimum complement of generators at various load/import levels to ensure adequate dynamic reactive
resources are available for this area.
In order to address reliability issues in the future, utilities have considered using Under‐Voltage Load Shedding (UVLS)
schemes on their system. However, none of these programs are expected to be installed on the system during the time of
this assessment. Additionally, there are no Special Protection Systems or Remedial Action Schemes within SERC‐E and none
planned for the assessment period.
Utilities have addressed planning processes for catastrophic events in many ways. Some companies have procedures in
place for system restoration, as well as capacity and emergency action plans. Other companies follow the practice of
maintaining several days’ worth of fuel oil at facilities in the event of natural gas disruptions. Resource portfolios are also
used to address the issue. Portfolios are diversified with multiple resources mitigating the impact of a major import path
disruption. Sophisticated internal real‐time systems have been developed by the utilities within the reporting area to track
and analyze gas pipeline issues. These systems can monitor the impact of disruptions to major pipelines or the loss of a
major import path as part of a contingency analysis process. Depending on the advance notice, either operating plans can
be adjusted or emergency procedures can be implemented. For the projected summer peaks, Reserve Margins are such
that the loss of multiple units can be accommodated without threatening reliability. Purchased power sources utilize Firm
transmission and are sufficiently limited in quantity compared to total resources. The VACAR reserve‐sharing agreement is
also available to support recovery from such extreme events. Beyond these measures, transmission Reserve Margin can
also be utilized to secure market purchases to maintain reliability.
The utilities within SERC‐E have procedures in place to identify and review misoperations caused by protection systems.
When a misoperation occurs on the transmission system, corrective action is implemented to prevent recurrence. If
needed, other locations are also reviewed for problems of a similar nature. Misoperations caused by protection systems are
reviewed on an annual basis for possible trends.

SERC‐E
NERC | 2012 Long‐Term Reliability Assessment | November 2012
Page 212 of 335
Currently, utilities in the area are not aware of any environmental or regulatory restrictions that could impact reliability
during the reporting period. They will continue to assess system studies and develop generation mitigation plans as needed
to account for new environmental requirements.
Standing and Emerging Reliability Issues To minimize reliability concerns on the system, entities regularly study and review annual and seasonal assessments. These
assessments serve to develop a seasonal strategy for maintaining adequate system operating performance. Entities are also
active participants within the SERC NTSG, which regularly performs annual reliability studies for summer and winter peak
conditions, as well as quarterly OASIS studies for summer, fall, winter, and spring conditions. Transmission maintenance
schedules are carefully reviewed and evaluated to address reliability concerns, and to permit as much prioritized
maintenance as can be accommodated prior to seasonal peak periods. Likewise, new construction efforts are focused on
completing facilities ahead of seasonal peak periods. Annual planning activities continue to address both near‐ and
long‐term facility needs.
Overall, there are no known or projected significant conditions or generator outages that would reduce capacity in the area.
Entities in the SERC‐E reporting area are not aware of any near‐term environmental or regulatory restrictions that could
impact reliability and continue to assess the potential reliability effects of pending future environmental regulations.
The utilities in the SERC‐E Area have identified an emerging issue in regard to Fault Induced Delayed Voltage Recovery
(FIDVR), which is the phenomenon whereby system voltage remains at significantly reduced levels for several seconds after
a transmission, sub‐transmission, or distribution fault has been cleared. Significant load loss due to motor protective device
action can result, as can significant loss of generation, with a potential secondary effect of high system voltage due to load
loss. If the BES voltage does not recover to 90 percent of the pre‐contingency system voltage in a few seconds, the FIDVR
can initiate further tripping of load and generation. Longer periods of depressed voltage below such levels can cause
damage to customer and electric system equipment.
Planning studies have not been able to foresee FIDVR events very accurately due to an inaccurate modeling of loads.
Uncorrected, this modeling deficiency has a two‐fold detrimental effect. First, it can result in studies that do not adequately
identify potential FIDVR events. Second, it can give false confidence in mitigation plans designed to prevent FIDVR events.
Several groups of experts are actively developing better dynamic load models for aggregate induction motor load using
results of extensive single‐phase air conditioning performance tests and detailing analyses of actual FIDVR events. Although
SERC‐E has not experienced a significant reliability impact associated with FIDVR, some utilities in SERC‐E have already
installed SVCs (or plan to) as a mitigating measure for potential FIDVR issues.

SERC‐N
NERC | 2012 Long‐Term Reliability Assessment | November 2012
Page 213 of 335
SERC-N Planning Reserve Margins As a result of lower loads in the first few years, coupled with additional capacity, the SERC‐N Assessment Area is projecting
adequate Anticipated Planning Reserve Margins ranging between 15.63 and 24.23 percent during the assessment period
(SERC‐N‐Table 1 and SERC‐N‐Figure 1).
SERC‐N‐Table 1: Planning Reserve Margins SERC‐N‐Summer 2013 2014 2015 2016 2017 2018 2019 2020 2021 2022
ANTICIPATED 23.31% 24.23% 22.67% 21.09% 19.91% 18.57% 17.21% 18.36% 17.10% 15.63% PROSPECTIVE 32.26% 33.06% 31.39% 29.70% 28.43% 27.00% 25.54% 26.58% 25.23% 23.66% ADJUSTED POTENTIAL 32.26% 33.06% 31.39% 33.31% 32.41% 32.61% 32.75% 33.70% 33.89% 32.21%
NERC REFERENCE ‐ 15.00% 15.00% 15.00% 15.00% 15.00% 15.00% 15.00% 15.00% 15.00% 15.00%
SERC‐N‐Winter 2013/14 2014/15 2015/16 2016/17 2017/18 2018/19 2019/20 2020/21 2021/22 2022/23
ANTICIPATED 57.56% 55.86% 54.21% 52.37% 50.71% 49.23% 47.57% 48.63% 46.52% 46.24% PROSPECTIVE 66.69% 64.89% 63.14% 61.19% 59.44% 57.88% 56.11% 57.08% 54.85% 54.51% ADJUSTED POTENTIAL 66.69% 64.89% 63.14% 65.77% 63.97% 64.27% 64.32% 65.20% 64.69% 64.28%
NERC REFERENCE ‐ 15.00% 15.00% 15.00% 15.00% 15.00% 15.00% 15.00% 15.00% 15.00% 15.00%
SERC‐N‐Figure 1: Summer (Left) and Winter254 (Right) Planning Reserve Margins
SERC does not require specific Reserve Margin criteria or “targets” for SERC‐N. Therefore, NERC applies the 15 percent
Reference Margin Level throughout the assessment period. Additionally, some individual entity criteria are established
based on state public service commissions or their Balancing Authority’s criteria, such as most severe single contingency,
cost of unserved energy, unit availability, import availability/capability, load forecast, and loss of load probability studies
(such as 0.1 day per year). Other utilities report that Planning Reserve Margins are established with the objective of
minimizing overall cost of reliability to the customer, while not exposing customers to significant risk. To achieve this goal,
planning reserves are calculated on a probabilistic assessment of reliability, which includes uncertainty related to weather,
economic growth, unit availability, and transmission capability to determine expected costs at various levels of reliability.
Using this analysis, a target level of planning reserves is selected such that the cost of additional reserves plus the cost of
reliability events to the customer is minimized. This target (optimal) Reserve Margin is then adjusted to reduce risks and
enhance reliability to produce the final level of planning reserves. Entities internally report planning reserves in the range of
12 to 15 percent during the assessment period.
Assessment projections are anticipated to be adequate, assuming typical weather and operating conditions. Given these
circumstances, no significant detractions from this forecast are anticipated.
Demand The Total Internal Demand in SERC‐N is projected to grow by approximately 1.44 percent during the 10‐year assessment.
This growth is slightly higher compared to the 2011 forecast (SERC‐N‐Table 2).
254
Each year represents the initial year of the winter season. For example: 2013 represents the 2013/2014 winter season.
0%
5%
10%
15%
20%
25%
30%
35%
2013 2014 2015 2016 2017 2018 2019 2020 2021 2022
0%
10%
20%
30%
40%
50%
60%
70%
2013 2014 2015 2016 2017 2018 2019 2020 2021 2022

SERC‐N
NERC | 2012 Long‐Term Reliability Assessment | November 2012
Page 214 of 335
SERC‐N‐Table 2: Demand Outlook SERC‐N‐Summer 2013 2022 10‐Year Change CAGR
NET INTERNAL DEMAND 43,808 48,778 4,970 11.3% 1.20%
Load‐Modifying Demand Response 1,942 3,260 1,318 67.9% 5.92%
TOTAL INTERNAL DEMAND 45,750 52,038 6,288 13.7% 1.44%
SERC‐N‐Winter 2013/14 2022/23 10‐Year Change CAGR
NET INTERNAL DEMAND 43,734 48,256 4,522 10.3% 1.10%
Load‐Modifying Demand Response 1,979 3,658 1,679 84.8% 7.06%
TOTAL INTERNAL DEMAND 45,713 51,914 6,201 13.6% 1.42%
Increases are believed to be primarily due to a perception of improved economic outlook. However, continuing low
economic forecasts and growing levels of Demand Response and Energy Efficiency programs are expected to limit demand
growth in the coming years. Assumptions have been adjusted for normal weather and current economic conditions for both
the United States and regional economies. Since the start of the economic recession, some entities have significantly
adjusted their long‐term models and revised their near‐term hourly forecast models.
Demand-Side Management Demand Response and Energy Efficiency are projected to be 1,942 MW and 149 MW, respectively, available on‐peak for the
2013 reporting period, increasing to approximately 3,260 MW of Demand Response and 516 MW of Energy Efficiency by
2022 (SERC‐N‐Table 3). The Demand Response and Energy Efficiency average annual growth rates for the 2013–2022
reporting period are 7.5 percent and 27.4 percent respectively. Demand Response programs allow entities within the
reporting area to reduce demand and control voltage as needed for reliability purposes, mainly during summer peaks.
Demand Response is projected to account for 4.2 percent of Total Internal Demand in 2013, a substantial increase from 0.3
percent in 2011. Presently the primary source of Demand Response in the area is the direct load control (DLC) program and
the interruptible product portfolio. DLC includes a program with interruptible load contracted to a third party and verified
by the utility. Program participants have contractually agreed to reduce their loads within minutes of a request. Estimates
used in operational planning take into account the amount of load available and not the sum of total load under contract.
Other Demand Response products utilize control devices on air conditioning units and water heaters in residences. Entities
are planning for increased demand reductions from the following in the upcoming years: interruptible demand and load
control capabilities, distributor‐operated voltage regulation programs, Demand Response pricing products, and two‐way
direct load control.
SERC‐N‐Table 3: Projected Demand‐Side Management Short‐Term
2022 Share of Total Internal Demand
SERC‐N‐Summer 2013 2014 2015 2022 10‐Year Change
Direct Control Load Management (DCLM) 194 204 221 137 ‐57 0.26% Contractually Interruptible (Curtailable) 992 1,000 1,003 1,003 11 1.93% Critical Peak‐Pricing (CPP) with Control 0 0 0 0 0 0.00% Load as a Capacity Resource 756 951 1,127 2,120 1,364 4.07%
TOTAL LOAD‐MODIFYING DEMAND RESPONSE 1,942 2,155 2,351 3,260 1,318 6.26%
TOTAL ENERGY EFFICIENCY 149 199 243 516 367 0.99%
TOTAL DEMAND‐SIDE MANAGEMENT 2,091 2,354 2,594 3,776 1,685 7.26%
New Energy Efficiency is projected to be 0.3 percent of Total Internal Demand during 2013 and increase to 1.0 percent by
2022. Programs such as customer cost‐saving energy surveys and audit evaluations, customer education, responsive pricing,
residential/commercial conservation, electric thermal storage incentives, new construction (heat pump and geothermal),
energy efficient homes, air‐source heat‐pumps (replacing older resistance heat), low‐income weatherization, low‐income
assistance, HVAC system improvements, industrial compressed‐air systems, and various advanced lighting and third‐party
verification/measurement groups are currently in operation within the area for residential and commercial customers.
Commercial/industrial/direct‐served industry consumers have programs for efficiency improvements in HVAC, lighting,
motors and controls, and other electrical‐intensive equipment. Entities in the area are predicting an additional 1,400 MW of
controllable Demand Response reductions by the end of 2012.

SERC‐N
NERC | 2012 Long‐Term Reliability Assessment | November 2012
Page 215 of 335
Generation Companies within SERC‐N expect to have 53,084 MW of Existing‐Certain, 3,919 MW of Existing‐Other, 0 MW of Existing‐
Inoperable, 878 MW of net Future‐Planned resources including retirements, and 0 MW of Conceptual resources on‐peak for
2013. Net Future‐Planned resources of 3,260 MW and Conceptual resources of 4,170 MW are expected to be added by
2022. Coal is the primary source of fuel within this area. There are no new Existing‐Certain Resource additions since the
prior season. For 2012, 71 MW is planned to be on inactive reserve, 412 MW is scheduled to be on 8 weeks of planned
maintenance beginning the first week of September, 167 MW is scheduled to be on planned maintenance for the last week
of September, and 352 MW will be retired. A total of 3,021 MW of retirements have been announced for the 2013–2022
reporting period. In accordance with an EPA settlement, four units (approximately 480 MW) are scheduled to idle in the
spring of 2012255 and retire by the end of 2015; six units (111 MW each) will be out of service by August 1, 2015; 2,078 MW
will be retired in 2016, and 938 MW will be retired in 2019 (SERC‐N‐Table 4, SERC‐N‐Figure 2, and SERC‐N‐Table 5). The
ability for utilities to reliably meet demand is not expected to be impacted by these planned retirements. Scenario planning
studies are routinely done to assess the impact on system reliability and adequacy for possible unit retirements during the
planning window. The results of those studies are used in the annual planning process and as input to the ongoing
development of generating fleet strategic plans. Planning actions in response to the retirements include consideration of
additional resource needs in Integrated Resource Plans, reinforcement of the transmission system including uprating a
number of lines, and evaluation of needs for static and dynamic var support, such as for major cities with high
concentrations of air conditioning load.
SERC‐N‐Table 4: Capacity Outlook256 Current 2022 Planned 2022 Planned & Conceptual
SERC‐N‐Summer Capacity Share Capacity Share Change Capacity Share Change
Coal 21,657 40.1% 21,657 37.8% 0 21,657 35.3% 0 Petroleum 111 0.2% 111 0.2% 0 111 0.2% 0 Gas 18,060 33.5% 18,938 33.1% 878 23,108 37.6% 5,048 Nuclear 7,113 13.2% 9,495 16.6% 2,382 9,495 15.5% 2,382 Other/Unknown 0 0.0% 0 0.0% 0 0 0.0% 0 Renewables 7,022 13.0% 7,022 12.3% 0 7,022 11.4% 0
TOTAL 53,962 100.0% 57,222 100.0% 3,260 61,392 100.0% 7,430
SERC‐N‐Figure 2: Summer Net Capacity Change
There are 2 MW of new generator uprates scheduled to be in service. However, 20 MW are scheduled to be taken out of
service for planned maintenance during the peak demand months of 2012, and 6 MW will be brought back in service yearly
for the peak‐demand summer months of 2013–2015. As an average over the period, behind‐the‐meter generation is
reported to be 13 MW of Other/Unknown resources.
255 http://www.epa.gov/compliance/resources/cases/civil/caa/tvacoal‐fired.html 256 “Current” represents Existing‐Certain and Future‐Planned projections for the 2012 summer (for summer‐peaking assessment areas) or 2012/2013 winter (for winter‐peaking
assessment areas). “Share” represents the share (percent) of total Existing‐Certain and Future‐Planned capacity projected for the peak season.
0
500
1,000
1,500
2,000
2,500
3,000
3,500
2013 2014 2015 2016 2017 2018 2019 2020 2021 2022
MW
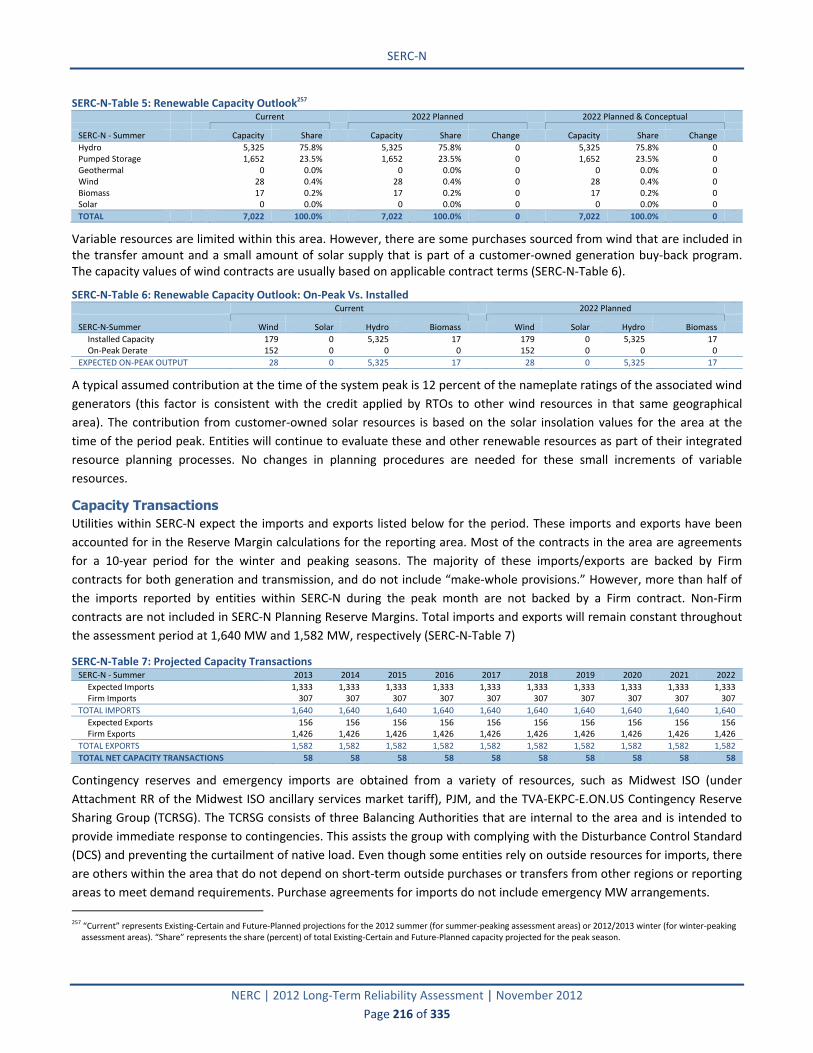
SERC‐N
NERC | 2012 Long‐Term Reliability Assessment | November 2012
Page 216 of 335
SERC‐N‐Table 5: Renewable Capacity Outlook257 Current 2022 Planned 2022 Planned & Conceptual
SERC‐N ‐ Summer Capacity Share Capacity Share Change Capacity Share Change
Hydro 5,325 75.8% 5,325 75.8% 0 5,325 75.8% 0 Pumped Storage 1,652 23.5% 1,652 23.5% 0 1,652 23.5% 0 Geothermal 0 0.0% 0 0.0% 0 0 0.0% 0 Wind 28 0.4% 28 0.4% 0 28 0.4% 0 Biomass 17 0.2% 17 0.2% 0 17 0.2% 0 Solar 0 0.0% 0 0.0% 0 0 0.0% 0
TOTAL 7,022 100.0% 7,022 100.0% 0 7,022 100.0% 0
Variable resources are limited within this area. However, there are some purchases sourced from wind that are included in the transfer amount and a small amount of solar supply that is part of a customer‐owned generation buy‐back program. The capacity values of wind contracts are usually based on applicable contract terms (SERC‐N‐Table 6).
SERC‐N‐Table 6: Renewable Capacity Outlook: On‐Peak Vs. Installed Current 2022 Planned
SERC‐N‐Summer Wind Solar Hydro Biomass Wind Solar Hydro Biomass
Installed Capacity 179 0 5,325 17 179 0 5,325 17 On‐Peak Derate 152 0 0 0 152 0 0 0
EXPECTED ON‐PEAK OUTPUT 28 0 5,325 17 28 0 5,325 17
A typical assumed contribution at the time of the system peak is 12 percent of the nameplate ratings of the associated wind
generators (this factor is consistent with the credit applied by RTOs to other wind resources in that same geographical
area). The contribution from customer‐owned solar resources is based on the solar insolation values for the area at the
time of the period peak. Entities will continue to evaluate these and other renewable resources as part of their integrated
resource planning processes. No changes in planning procedures are needed for these small increments of variable
resources.
Capacity Transactions Utilities within SERC‐N expect the imports and exports listed below for the period. These imports and exports have been
accounted for in the Reserve Margin calculations for the reporting area. Most of the contracts in the area are agreements
for a 10‐year period for the winter and peaking seasons. The majority of these imports/exports are backed by Firm
contracts for both generation and transmission, and do not include “make‐whole provisions.” However, more than half of
the imports reported by entities within SERC‐N during the peak month are not backed by a Firm contract. Non‐Firm
contracts are not included in SERC‐N Planning Reserve Margins. Total imports and exports will remain constant throughout
the assessment period at 1,640 MW and 1,582 MW, respectively (SERC‐N‐Table 7)
SERC‐N‐Table 7: Projected Capacity Transactions SERC‐N ‐ Summer 2013 2014 2015 2016 2017 2018 2019 2020 2021 2022
Expected Imports 1,333 1,333 1,333 1,333 1,333 1,333 1,333 1,333 1,333 1,333 Firm Imports 307 307 307 307 307 307 307 307 307 307
TOTAL IMPORTS 1,640 1,640 1,640 1,640 1,640 1,640 1,640 1,640 1,640 1,640
Expected Exports 156 156 156 156 156 156 156 156 156 156 Firm Exports 1,426 1,426 1,426 1,426 1,426 1,426 1,426 1,426 1,426 1,426
TOTAL EXPORTS 1,582 1,582 1,582 1,582 1,582 1,582 1,582 1,582 1,582 1,582
TOTAL NET CAPACITY TRANSACTIONS 58 58 58 58 58 58 58 58 58 58
Contingency reserves and emergency imports are obtained from a variety of resources, such as Midwest ISO (under
Attachment RR of the Midwest ISO ancillary services market tariff), PJM, and the TVA‐EKPC‐E.ON.US Contingency Reserve
Sharing Group (TCRSG). The TCRSG consists of three Balancing Authorities that are internal to the area and is intended to
provide immediate response to contingencies. This assists the group with complying with the Disturbance Control Standard
(DCS) and preventing the curtailment of native load. Even though some entities rely on outside resources for imports, there
are others within the area that do not depend on short‐term outside purchases or transfers from other regions or reporting
areas to meet demand requirements. Purchase agreements for imports do not include emergency MW arrangements.
257 “Current” represents Existing‐Certain and Future‐Planned projections for the 2012 summer (for summer‐peaking assessment areas) or 2012/2013 winter (for winter‐peaking
assessment areas). “Share” represents the share (percent) of total Existing‐Certain and Future‐Planned capacity projected for the peak season.

SERC‐N
NERC | 2012 Long‐Term Reliability Assessment | November 2012
Page 217 of 335
Transmission Two significant transmission projects in the SERC‐N Area are Blackberry–Sportsman Acres (in service in 2013) and Franks–
Barnett (in service in 2016). Currently, there are no major concerns with meeting in‐service dates for transmission
improvements or specific projects needed to maintain reliability. Additionally, there is adequate transmission to support
the reported Future‐Planned generation. If necessary, local area generation may be re‐dispatched or transmission elements
reconfigured to alleviate next contingency overloads. Entities also have the option to invoke NERC Transmission Limited
Resource (TLR) procedures in scenarios that are not easily remedied by a local area solution. A summary of existing and
projected transmission additions is included below (SERC‐N‐Table 8).
SERC‐N‐Table 8: Existing and Projected Transmission SERC‐N AC (Circuit Miles) DC (Circuit Miles) Total (Circuit Miles)
EXISTING 21,600 0 21,600
Currently Under Construction 254 0 254 Planned ‐ Completed within First Five Years 332 0 332 Planned ‐ Completed within Second Five Years 13 0 13
2022 TOTAL (UNDER CONSTRUCTION & PLANNED) 22,198 0 22,198
Conceptual ‐ Completed within First Five Years 21 0 21 Conceptual ‐ Completed within Second Five Years 57 0 57
2022 TOTAL (UNDER CONSTRUCTION, PLANNED & CONCEPTUAL) 676 0 676
Entities in the area continue to evaluate and consider new technologies that can be utilized to improve BPS reliability. An
example of this is TVA’s Clay, Mississippi, a fourth‐generation GIS 500/161 kV substation, which is scheduled to be placed in
service prior to the 2012 summer peak. This project will provide enhanced reliability for load in the vicinity.
Vulnerability Assessment Resource adequacy assessments covering the next 36 months are performed monthly to assist in identifying limitations or
constraints that may impact seasonal adequacy. Long‐term adequacy assessments based on 20‐year capacity plans are also
performed to make decisions relative to resource acquisitions, renewable portfolio standard legislations, and project
development timelines to ensure system reliability. No system reliability concerns for the period have been identified in the
latest resource adequacy studies. Resource availability, fuel availability, and hydro and reservoir conditions are expected to
be normal during the period. In addition, there are no issues due to the distribution of generation or the unavailability of
Demand Response. The contributions of Demand Response programs are included in long‐range capacity planning studies.
Programs are based on the particular program impact, historical trends of effectiveness in the region, dependability, and
system cost‐effectiveness, for use in summer peak adequacy assessments. Entities are monitoring adjustments and results
to these studies as a consequence of new and potential environmental regulations.
No additional UVLS schemes are planned for installation during the assessment period, but TVA is considering an additional
scheme in addition to two existing UVLS protection schemes already in place to limit potential wider area under‐voltage
events. The non‐coincident peak demand served from the substations equipped with UVLS totals approximately 450 MW.
No Special Protection Systems or Remedial Action Schemes are planned for the time period.
Entities regularly participate in emergency system drills to ensure that operators are trained and properly prepared for
catastrophic events. The transmission planning processes prepare for the loss of up to all units at any given generating
station as part of assessments. Planners disseminate that information to system operations. Entities also rely on reserve
sharing, Purchasing and Selling Entities (PSEs), and coordination with Balancing Authorities, through capacity and energy
emergency plans. Planned unit maintenance outages or derates may be delayed or canceled in the event of a significant
loss in capacity, and voluntary load shedding and energy emergency criteria will be enacted if necessary.
Some entities use risk analysis processes to identify the contingencies that have the greatest impact on their resource
adequacy over the long term. Specific outage events are not modeled in that analysis but may be considered during
sensitivity studies as part of the annual capacity planning effort. If resource inadequacies (such as catastrophic events)
cause the Reserve Margin to be reduced, the entity then may anticipate the use of purchases from the short‐term markets
as a necessary addition to appropriate operational actions to ensure system reliability.

SERC‐N
NERC | 2012 Long‐Term Reliability Assessment | November 2012
Page 218 of 335
For the operational planning horizon, in the event of a catastrophic event such as a hurricane causing pipeline outages,
supply/transportation could be re‐routed to other pipeline legs (routes), thereby bypassing the restriction or outage.
Entities also have backhaul transportation contracts in place that could be utilized to source and deliver supply. If a storage
facility allows, supply could be wheeled (an interruptible service) across the storage facility to other pipeline interconnects.
Most smart grid efforts to date have been on the scale of demonstration projects. A summary of TVA’s current research and
programs can be found on TVA’s web site.258 LG&E and KU Energy plans to invest approximately $14 million in smart grid
enabling technologies by 2014. These investments provide for a variety of enhanced capabilities for system monitoring and
operation. No reliability improvements or issues have been identified as a direct result of these investments.
Entities have established proactive programs to minimize the likelihood of relay protection misoperations. Recent
evaluations have revealed problems with increases in ‘unknown’ causes, carrier failure, calculations and settings, and relay
applications. Remedial measures include maintenance programs to periodically calibrate and test relays, investigations of
every relay misoperation, goals to remedy misoperations within two years, relay replacement programs to replace obsolete
relays, improved implementation processes, and improved identification of mutual coupling effects.
Utilities in the area are aware of the potential for environmental/regulatory restrictions to impact generating resource
operations. These can include emissions restrictions as well as cooling water source temperature regulation, which can lead
to plant derates. Routine internal communications practices will alert operational planners at the onset to any potential
environmental/regulatory impact to plant operations. Such limitations are factored into operational planning analysis.
There are currently no anticipated unit retirements that significantly impact system reliability, nor any indication that there
will be insufficient time to perform any required retrofits. Entities will continue to conduct scenario planning studies to
assess the impact on system reliability and adequacy for possible unit retirements during the period. The results of those
studies are used in annual planning and provide input to ongoing development of generation fleet strategic plans. The
effects of possible future long‐term maintenance outages on off‐peak reliability are uncertain. Ongoing mitigation plans are
developed to reduce system reliability risks. Mitigations may include purchases, new generation, or reliance on reserves.
However, for every new regulation that is promulgated, entities will continue to adapt their operations as needed (e.g.,
install controls, etc.) such that they comply with new regulatory requirements and do not affect reliability.
Standing and Emerging Reliability Issues As stated in the previous section, utilities are aware of the risks associated with the current and pending environmental
regulations/limitations and have established operational procedures to avoid or mitigate system reliability impact. Long‐
term adequacy assessments based on 20‐year capacity plans are performed to make decisions relative to resource
acquisitions and project development timelines to ensure system reliability. Resource adequacy assessments covering the
next 36 months are performed monthly to assist in identifying limitations or constraints that may impact seasonal
adequacy. Entities monitor adjustments and results to the studies as a consequence of environmental regulations.
Ongoing mitigation plans are developed to reduce system reliability risks. Mitigations may include purchases, new
generation, or reliance on reserves. However, as for every regulation, entities will continue to adapt their operations as
needed (e.g., install controls, etc.) such that they comply with new regulatory requirements and do not affect reliability.
There are currently no anticipated unit retirements that significantly impact system reliability, nor any indication that there
will be insufficient time to perform any required retrofits. Entities will continue to conduct scenario planning studies to
assess the impact on system reliability and adequacy for various assumptions of possible unit retirements during the period.
The results of those studies are used in annual planning and provide input to ongoing development of generation fleet
258 http://www.tva.gov/environment/technology/epri.htm.

SERC‐N
NERC | 2012 Long‐Term Reliability Assessment | November 2012
Page 219 of 335
strategic plans. The effects of possible future, long‐term maintenance outages on off‐peak reliability are believed to be
negligible.
Utilities within the SERC‐N Area have experienced two reliability issues: severe weather‐related damage such as that caused
by the very severe tornadic activity in April 2011; and the effects of substantial reconstruction efforts required after a
significant event occurs. While severe weather‐related damage is a standing issue for the SERC‐N Area, the reconstruction
efforts are an emerging issue. No long‐term reliability impact is expected due to the storm damage from the spring storms.
The assessment impact is generally the same for both reliability issues.
Severe weather events are generally unpredictable, and two or more such events could lead to uncertainty in the ability to
maintain adequate reserves. The unprecedented April 2011 storm events in SERC‐N removed from service and damaged
approximately 90 TVA transmission lines. Such widespread damage can challenge reserves of restoration materials.
In recent years, utilities within the reporting area have experienced pressure in maintaining margin reserves due to
restoration activities, maintenance schedules, high‐water threats from the Mississippi River, and hot weather.

SERC‐SE
NERC | 2012 Long‐Term Reliability Assessment | November 2012
Page 220 of 335
SERC-SE Planning Reserve Margins During the assessment period, the SERC‐SE Assessment Area is projecting adequate Anticipated Capacity Resource Reserve
Margins falls as low as 21.18 percent in the final year of the assessment period, above the NERC Reference Margin Level
(SERC‐SE‐Table 1).
SERC‐SE‐Table 1: Planning Reserve Margins SERC‐SE‐Summer 2013 2014 2015 2016 2017 2018 2019 2020 2021 2022
ANTICIPATED 29.66% 29.06% 27.80% 31.12% 31.11% 29.88% 27.94% 26.22% 23.44% 21.18% PROSPECTIVE 30.29% 29.68% 28.41% 31.72% 31.70% 30.47% 28.52% 26.79% 24.01% 21.74% ADJUSTED POTENTIAL 30.58% 30.17% 28.90% 32.20% 32.18% 30.94% 28.99% 27.61% 24.81% 22.53%
NERC REFERENCE ‐ 15.00% 15.00% 15.00% 15.00% 15.00% 15.00% 15.00% 15.00% 15.00% 15.00%
SERC‐SE‐Winter 2013/14 2014/15 2015/16 2016/17 2017/18 2018/19 2019/20 2020/21 2021/22 2022/23
ANTICIPATED 44.34% 44.75% 43.16% 46.22% 46.85% 44.46% 42.43% 39.96% 36.86% 34.52% PROSPECTIVE 45.01% 45.41% 43.82% 46.87% 47.49% 45.10% 43.06% 40.57% 37.46% 35.12% ADJUSTED POTENTIAL 45.14% 45.76% 44.16% 47.21% 47.83% 45.43% 43.38% 41.28% 38.15% 35.80%
NERC REFERENCE ‐ 15.00% 15.00% 15.00% 15.00% 15.00% 15.00% 15.00% 15.00% 15.00% 15.00%
SERC‐SE‐Figure 1: Summer (Left) and Winter259 (Right) Planning Reserve Margins
Long‐term demand is expected to grow even though the levels of economic activity and production are lower than pervious
assessments. Additional contributing factors to adequate margins are the addition of resources and the expiration or
acquisition of Firm purchase contracts. Utilities do not adhere to any targets or Reserve Margin criteria. However, the state
of Georgia requires maintaining at least 13.5 percent near‐term (fewer than three years) and 15 percent long‐term (three
years or more) Reserve Margin levels for investor‐owned utilities. All entities indicate that projected Reserve Margins
remain above 15 percent, the NERC Reference Margin Level.
Reserves for the period are anticipated to be adequate due to reductions in load forecast resulting from the recent
recession and economic downturn, assuming typical weather and operating conditions.
Demand Entities within the SERC‐SE Assessment Area are projecting a 1.42 percent growth rate, a slight decrease compared to the
2011 LTRA (SERC‐SE‐Table 2).
SERC‐SE‐Table 2: Demand Outlook SERC‐SE‐Summer 2013 2022 10‐Year Change CAGR
NET INTERNAL DEMAND 47,900 54,249 6,349 13.3% 1.39%
Load‐Modifying Demand Response 1,899 2,263 364 19.2% 1.97%
TOTAL INTERNAL DEMAND 49,799 56,512 6,713 13.5% 1.42%
SERC‐SE‐Winter 2013/14 2022/23 10‐Year Change CAGR
NET INTERNAL DEMAND 44,652 50,627 5,975 13.4% 1.41%
Load‐Modifying Demand Response 1,882 2,267 385 20.5% 2.09%
TOTAL INTERNAL DEMAND 46,534 52,894 6,360 13.7% 1.43%
259
Each year represents the initial year of the winter season. For example: 2013 represents the 2013/2014 winter season.
0%
5%
10%
15%
20%
25%
30%
35%
2013 2014 2015 2016 2017 2018 2019 2020 2021 2022
0%
10%
20%
30%
40%
50%
2013 2014 2015 2016 2017 2018 2019 2020 2021 2022

SERC‐SE
NERC | 2012 Long‐Term Reliability Assessment | November 2012
Page 221 of 335
The change is mostly driven by the slower‐than‐expected recovery from the recession as compared to last year. The
assumptions in SERC‐SE’s economic forecast indicate that it is in the recovery phase, even though recovery has been slow.
The economic fundamentals of the Region are still strong. Forecasters are anticipating that when the job market recovers,
the housing market will follow and this will lead to a period of self‐sustaining load growth. Normal weather assumptions are
used to forecast the load shapes for various classes. Economic assumptions are captured from analytical vendors for the
area. The recession affected short‐term growth for energy and peak demand forecast. Adjustments were needed to reflect
lower energy sales, milder temperatures, and the slow economic recovery, as well as to capture a more attainable
consumer forecast.
Demand-Side Management The Demand Response available on‐peak is projected to be 1,899 MW for 2013 and 2,263 MW by 2022 (SERC‐SE‐Table 3).
Entities currently reflect Energy Efficiencies in the load forecasts. These programs allow entities within the reporting area to
have better ability to control various amounts of load and capacity when needed for reliability purposes. Extreme real‐time
pricing response is considered as a capacity resource. Distribution efficiency programs consist of adding capacitors on
distribution circuits to reduce line losses and to smooth out voltage drop across the circuit. In addition, Conservation
Voltage Reduction activation reduces the voltage on the distribution circuit at the voltage regulator or load tap transformer,
reducing the customer’s demand. Additional objectives of some of the programs are as follows:
Help reduce the need to build or purchase capacity.
Respond to volatile wholesale energy markets.
Improve the efficiency (load factor) as well as the utilization of generation, transmission, and distribution systems.
Provide low‐cost energy to member cooperatives.
Increase off‐peak kWh sales.
SERC‐SE‐Table 3: Projected Demand‐Side Management Short‐Term
2022 Share of Total Internal Demand
SERC‐SE 2013 2014 2015 2022 10‐Year Change
Direct Control Load Management (DCLM) 626 825 848 912 286 1.61%
Contractually Interruptible (Curtailable) 1,188 1,188 1,267 1,252 64 2.22%
Critical Peak‐Pricing (CPP) with Control 0 0 0 0 0 0.00%
Load as a Capacity Resource 85 87 89 99 14 0.18%
TOTAL LOAD‐MODIFYING DEMAND RESPONSE 1,899 2,100 2,204 2,263 364 4.00%
TOTAL ENERGY EFFICIENCY 0 0 0 0 0 0.00%
TOTAL DEMAND‐SIDE MANAGEMENT 1,899 2,100 2,204 2,263 364 4.00%
There is no significant change in the amount of Demand Response since last year’s reporting period. Demand Response is
projected to account for 3.8 to 4 percent of Total Internal Demand from 2013 to 2022. Additionally, Demand Response is
projected to increase by 12.5 percent in 2013 from the 2011 long‐term assessment period. Currently, entities include
Energy Efficiencies in load forecasts and it is not reported separately in this assessment. Additional Energy Efficiency
programs are being considered for residential, commercial and industrial customers in the area. Over 500 programs are
being reviewed for consideration for future implementation, but not all programs will be implemented. After a program is
approved by the Public Service Commission for implementation and after the implementation begins, a general evaluation
plan is developed into a more detailed evaluation plan through a bid process with consultants who have the expertise to
develop and perform thorough program evaluations.
Demand Response programs within the area consist of programs ranging from customer stand‐by generation, real‐time
pricing/critical‐peak pricing (reduce energy use based on price signaling), and interruptible demand programs (requests
customers to reduce energy use), to direct load control programs (energy provider reduces customer energy use). Various
utilities have residential Energy Efficiency programs that may include educational presentations, home energy audits, home
inspector programs, compact fluorescent light bulbs, electric water heater incentives, heat pump incentives, Energy
Efficient new home programs, Energy Star‐rated appliance promotions, appliance recycling programs, loans or financing

SERC‐SE
NERC | 2012 Long‐Term Reliability Assessment | November 2012
Page 222 of 335
options/incentives, weatherization, programmable thermostats, and ceiling insulation. Commercial programs may include
energy audits, lighting programs, and plan review services.
Other programs, such as business assistance/audits, weatherization assistance for low‐income customers, residential
energy audits, and comfort advantage Energy Efficient home programs promote reduced energy use and supply
information and develop Energy Efficiency presentations for various customers and organizations. Some entities are
beginning to work with states’ energy divisions on Energy Efficiency planning efforts. Training seminars addressing Energy
Efficiency, HVAC sizing, and energy‐related end‐use technologies are also offered to educate customers.
Generation Companies within the SERC‐SE Area expect to have 62,312 MW of Existing‐Certain, 300 MW of Existing‐Other, 0 MW of
Existing‐Inoperable, 1,807 MW of Future‐Planned, and 142 MW of Conceptual resources on‐peak respectively for 2013.
Additionally, 4,688 MW of Future‐Planned resources and 430 MW of Conceptual resources are expected to be added in
2022. The major additions to the area include Plant Ratcliffe IGCC and Plant Vogtle Units 3 and 4. The Vogtle units represent
the first new nuclear units constructed in over 30 years in the United States and will begin operation in 2016 and 2017,
respectively. This capacity is projected to help meet demand during this time period. Gas is the primary source of fuel
within this area. An additional 841 MW of Existing‐Certain resources have been added since the prior season. Gas‐fired
Future‐Planned resources are projected to increase by 130 MW during the summer of 2012. Entities have reported 107 MW
of unit retirements during 2012 and 1,032 MW of unit retirement throughout the period. There may be a reliability concern
involving the uncertainty in generating resource availability in 2015 and beyond introduced by the recent implementation
of EPA MATS rules and other pending environmental rules. Entities in the area are working to assess resource availability
and potential unit retirements. Additional transmission enhancements have been identified and will be re‐assessed during
the spring planning cycle for possible inclusion in the 10‐year expansion plans (SERC‐SE‐Table 4 and SERC‐SE Figure 2).
SERC‐SE‐Table 4: Capacity Outlook260 Current 2022 Planned 2022 Planned & Conceptual
SERC‐SE‐Summer Capacity Share Capacity Share Change Capacity Share Change
Coal 24,604 38.9% 25,189 37.1% 585 25,189 36.8% 585 Petroleum 1,017 1.6% 1,017 1.5% 0 1,017 1.5% 0 Gas 26,763 42.3% 28,520 42.0% 1,757 28,738 42.0% 1,975 Nuclear 5,818 9.2% 8,018 11.8% 2,200 8,018 11.7% 2,200 Other/Unknown 13 0.0% 13 0.0% 0 19 0.0% 6 Renewables 5,063 8.0% 5,209 7.7% 146 5,416 7.9% 352
TOTAL 63,278 100.0% 67,966 100.0% 4,688 68,396 100.0% 5,118
SERC‐SE‐Figure 2: Summer Net Capacity Change
New generator uprates are not reported to be in service during the period. In addition, no generation is expected to be
brought back into service. Entities are currently working through solutions in order to address potential unit unavailability
260 “Current” represents Existing‐Certain and Future‐Planned projections for the 2012 summer (for summer‐peaking assessment areas) or 2012/2013 winter (for winter‐peaking
assessment areas). “Share” represents the share (percent) of total Existing‐Certain and Future‐Planned capacity projected for the peak season.
0
500
1,000
1,500
2,000
2,500
3,000
3,500
4,000
4,500
5,000
2013 2014 2015 2016 2017 2018 2019 2020 2021 2022
MW

SERC‐SE
NERC | 2012 Long‐Term Reliability Assessment | November 2012
Page 223 of 335
that may occur in the future. Behind‐the‐meter generation and Other/Unknown resources are also not anticipated during
the period.
Only Firm Capacity Resources are counted toward the Planning Reserve Margins at peak in calculations. However, Future‐
Planned biomass generation is included in the Integrated Resource Plans at less than the nameplate capacity for converted
boilers, and at nameplate capacity for units receiving new boilers. Landfill gas facilities are included at their nameplate
ratings. Contracts with external parties for these resources usually require proof of capacity and allow for capacity payment
penalties for excessive unavailability and derating events (SERC‐Table 5 and SERC‐Figure 3).
SERC‐SE‐Table 5: Renewable Capacity Outlook261 Current 2022 Planned 2022 Planned & Conceptual
SERC‐SE‐Summer Capacity Share Capacity Share Change Capacity Share Change
Hydro 3,360 66.4% 3,360 64.5% 0 3,360 62.0% 0 Pumped Storage 1,632 32.2% 1,632 31.3% 0 1,632 30.1% 0 Geothermal 0 0.0% 0 0.0% 0 0 0.0% 0 Wind 0 0.0% 0 0.0% 0 0 0.0% 0 Biomass 67 1.3% 213 4.1% 146 419 7.7% 352 Solar 4 0.1% 4 0.1% 0 4 0.1% 0
TOTAL 5,063 100.0% 5,209 100.0% 146 5,416 100.0% 352
SERC‐SE‐Figure 3: Summer Net Renewable Capacity Change
Currently, entities are enhancing their methods for incorporating variable resources into their planning processes. Variable
resources are currently evaluated by analyzing their historical or projected output profiles (SERC‐Table 6). The result will be
a determination of the comparative capacity value to that of a typical combustion turbine on the system.
SERC‐SE‐Table 6: Renewable Capacity Outlook: On‐Peak Vs. Installed Current 2022 Planned
SERC‐SE‐Summer Wind Solar Hydro Biomass Wind Solar Hydro Biomass
Installed Capacity 0 4 3,360 67 0 4 3,360 213 On‐Peak Derate 0 0 0 0 0 0 0 0
EXPECTED ON‐PEAK OUTPUT 0 4 3,360 67 0 4 3,360 213
SHARE OF ON‐PEAK CAPACITY 0.00% 0.01% 5.31% 0.11% 0.00% 0.01% 5.02% 0.32%
Capacity Transactions Utilities within SERC‐SE expect the following imports and exports listed below for the period. These imports and exports
have been accounted for in the Reserve Margin calculations for the reporting area. The majority of the contracts in the area
are yearly Firm agreements typically lasting five or more years. All imports and exports were reported to be backed by Firm
contracts for both generation and transmission, but none are associated with LDCs or are considered “make whole.” Once
the contract ends, the unit’s capacity is changed from Existing‐Certain to Existing‐Other. Firm imports amount to 850 MW in
2013 and ultimately drop to 446 MW in 2022. Exports fall from 2,862 MW in 2013 to 1,705 MW in 2022 (SERC‐SE‐Table 7).
261 “Current” represents Existing‐Certain and Future‐Planned projections for the 2012 summer (for summer‐peaking assessment areas) or 2012/2013 winter (for winter‐peaking
assessment areas). “Share” represents the share (percent) of total Existing‐Certain and Future‐Planned capacity projected for the peak season.
0
25
50
75
100
125
150
175
2013 2014 2015 2016 2017 2018 2019 2020 2021 2022
MW

SERC‐SE
NERC | 2012 Long‐Term Reliability Assessment | November 2012
Page 224 of 335
Projected Capacity Transactions SERC‐SE‐Summer 2013 2014 2015 2016 2017 2018 2019 2020 2021 2022
Expected Imports 0 0 0 0 0 0 0 0 0 0 Firm Imports 850 900 900 825 825 825 825 825 546 446
TOTAL IMPORTS 850 900 900 825 825 825 825 825 546 446
Expected Exports 0 0 0 0 0 0 0 0 0 0 Firm Exports 2,862 2,703 2,690 1,399 1,547 1,555 1,671 1,690 1,697 1,705
TOTAL EXPORTS 2,862 2,703 2,690 1,399 1,547 1,555 1,671 1,690 1,697 1,705
TOTAL NET CAPACITY TRANSACTIONS ‐2,012 ‐1,803 ‐1,790 ‐574 ‐722 ‐730 ‐846 ‐865 ‐1,151 ‐1,259
Reporting entities maintain emergency reserve sharing agreements with organizations internal to the area and other
contract agreements with neighboring utilities provide capacity for outages of specific generation. Total emergency MW
from these imports were not reported, but are available as needed. Overall, entities are not dependent on outside imports
or transfers to meet the demands of its load.
Transmission Currently, there are no concerns with meeting in‐service dates for transmission improvements or specific projects needed
to maintain reliability. Significant projects in SERC‐SE that have been finalized are:
Dresden–Heard County 500 kV Transmission Line
Thomson Primary–Vogtle 500 kV Transmission Line
Greene County–Bassett Creek 230 kV Transmission Line
Pinckard–Holmes Creek–Highland City 230 kV Transmission Line
A summary of existing and projected transmission additions is included in the table below (SERC‐SE‐Table 8).
SERC‐SE‐Table 8: Existing and Projected Transmission SERC‐SE AC (Circuit Miles) DC (Circuit Miles) Total (Circuit Miles)
EXISTING 27,672 0 27,672
Currently Under Construction 108 0 108 Planned ‐ Completed within First Five Years 305 0 305 Planned ‐ Completed within Second Five Years 374 0 374
2022 TOTAL (UNDER CONSTRUCTION & PLANNED) 28,459 0 28,459
Conceptual ‐ Completed within First Five Years 66 0 66 Conceptual ‐ Completed within Second Five Years 0 0 0
2022 TOTAL (UNDER CONSTRUCTION, PLANNED & CONCEPTUAL) 853 0 853
Entities consistently evaluate the transmission system through operating studies and a model construction process. These
evaluations address any potential delays in construction and are used to determine switching procedures, operating
procedures, or near‐term improvements that may be necessary should an in‐service date of a bulk facility be adjusted. The
Reliability Coordinator and Transmission Operators also work with impacted entities to coordinate construction and outage
schedules to maintain reliable operations.
To address reliability concerns for the 10‐year planning horizon, entities are conducting comprehensive reliability
assessments consistent with NERC planning criteria and developing transmission expansion plans to address identified
constraints in advance of reliability needs. Transmission projects identified in the expansion plans will be constructed to
coincide with the integration of new and retirement of existing generation resources, load growth, and other Firm service
requirements. Potential additional transmission enhancements have been identified due to EPA regulations and will be
reassessed during the spring planning cycle for possible inclusion in the 10‐year expansion plans. Significant outage
coordination is underway to ensure that all projects can be completed by the required in‐service dates without affecting
system reliability. These spring planning assessments may also lead to requests associated with MATS rule implementation
requirements to operating units beyond 2015 as needed to maintain reliability. A related reliability concern involves the
extensive generation and transmission construction work that must be completed prior to the 2015 implementation of
MATS. At this time, entities in the area do not have plans to add new technologies or significant substation equipment.
Companies will continue to assess potential applications for these technologies in assessing reliability needs during annual
expansion planning processes and are prepared to deploy these technologies in suitable applications.

SERC‐SE
NERC | 2012 Long‐Term Reliability Assessment | November 2012
Page 225 of 335
Vulnerability Assessment Resource adequacy is determined by extensive analysis of costs associated with expected unserved energy, market
purchases, and new capacity. These costs are balanced to identify a minimum cost point that is the optimum Reserve
Margin level. No system reliability concerns for the period have been identified in the latest resource adequacy studies.
Fuel availability and hydro and reservoir conditions are expected to be normal throughout the reporting period.
Assessments are currently in progress to assess the effects of the EPA regulations on generation availability in 2015 and
beyond. Additionally, the variable resources that have been procured as energy resources are not presently relied upon to
meet resource adequacy requirements. However, some entities are in the process of enhancing their methods to
incorporate variable resources. Currently, variable resources are evaluated by analyzing their historical or projected output
profiles. The result will be a determination of the comparative capacity value to that of a typical combustion turbine on the
system. Demand Response is not a factor, and Renewable Portfolio Standard requirements do not currently exist in the
service territory.
A 2,250 MW UVLS scheme currently exists in northern Georgia. The scheme was installed to help meet three‐phase faults
with breaker failure contingencies. There are no future plans to install more schemes.
Utilities within the reporting area use various tactics to prepare for catastrophic events. Company‐specific processes and
guidelines for coal, natural gas, and transmission usage are areas that companies consider to be most critical. To address
the coal concerns, several resource adequacy studies were conducted to evaluate the ability to meet peak demand while
considering the historic and probabilistic limitations of import interfaces. Transmission studies are regularly performed.
Loss‐of‐pipeline, extreme events (TPL‐003 and TPL‐004), and infrastructure security are taken into consideration. The
purpose is to assess vulnerability for catastrophic events and develop appropriate mitigation plans. The general conclusion
is that the system is capable of weathering many potential catastrophic events with minimal impact on neighboring
systems.
There are three existing Special Protection Systems in the SERC‐SE Area. They are located at Plant Daniel (230kV), Plant Crist
(115kV) and Plant Wilson (230kV). Plant Wilson’s SPS will be retired by 2015 when the breaker replacement project is
complete. SERC reviews each SPS every five years as well as any SPS retirement.
Currently in SERC‐SE, entities are proceeding with various smart grid projects to help enhance the reliability of the
transmission system. These projects include replacing older electromechanical relays with microprocessor relays, installing
transformer equipment monitors, automating transmission line switches, installing digital fault recorders (DFRs) and
installing human machine interfaces (HMI’s) in substations.
The utilities in SERC‐SE have procedures in place to identify and review misoperations caused by protection systems. When
a misoperation occurs on the transmission system, corrective action is implemented to prevent recurrence. If needed, other
locations are also reviewed for similar problems. Misoperations caused by protection systems are reviewed on an annual
basis for possible trends.
As stated in the above sections, a reliability concern involves uncertainty in generating resource availability in 2015 and
beyond, introduced by the recent implementation of EPA MATS rules and other pending environmental rules. All entities in
the area are fully engaged in assessing resource availability and potential unit retirements. Resource adequacy, expansion
plans and models will be updated if the decisions for the retirement of various units become available. Potential
transmission enhancements have been identified from recent assessments and will be re‐assessed in future expansion
plans. These assessments may also lead to requests associated with MATS implementation requirements to operating units
beyond 2015 as needed to maintain reliability. Plans also include the Reliability Coordinator and Transmission Operators
coordination efforts to decide construction and outage schedules to maintain reliable operations.

SERC‐SE
NERC | 2012 Long‐Term Reliability Assessment | November 2012
Page 226 of 335
Standing and Emerging Reliability Issues A significant reliability concern involves the uncertainty of generating resource availability in 2015 and beyond, introduced
by the recent implementation of EPA MATS rules and other pending environmental rules being promulgated. The SBA
Planning Authority is working with Load Serving Entities and Generator Operators to assess resource availability and
potential unit retirements. Potential additional transmission enhancements have been identified and will be re‐assessed
during future expansion plans. These assessments may also lead to requests associated with MATS implementation
requirements to operating units beyond 2015 as needed to maintain reliability.
A related reliability concern involves the extensive generation and transmission construction work that must be completed
prior to the 2015 implementation of MATS. The Reliability Coordinator and Transmission Operators are working with
impacted entities to coordinate construction and outage schedules to maintain reliable operations.

SERC‐W
NERC | 2012 Long‐Term Reliability Assessment | November 2012
Page 227 of 335
SERC-W Planning Reserve Margins The reporting area is projecting adequate Anticipated Capacity Resource Reserve Margins from 2013 to 2022, ranging
between 26.1 and 35.5 percent. None of the Planning Reserve Margins are projected to fall below the NERC Reference
Margin Level of 15 percent (SERC‐W‐Table 1 and SERC‐W‐Figure 1).
SERC‐W‐Table 1: Planning Reserve Margins SERC‐W‐Summer 2013 2014 2015 2016 2017 2018 2019 2020 2021 2022
ANTICIPATED 37.26% 38.35% 36.48% 35.60% 33.98% 32.44% 30.70% 29.32% 29.04% 27.68% PROSPECTIVE 55.32% 56.24% 54.12% 53.03% 51.19% 49.46% 47.49% 45.93% 45.49% 43.96% ADJUSTED POTENTIAL 55.36% 59.05% 60.69% 59.91% 58.38% 59.22% 61.95% 60.79% 62.93% 61.44%
NERC REFERENCE ‐ 15.00% 15.00% 15.00% 15.00% 15.00% 15.00% 15.00% 15.00% 15.00% 15.00%
SERC‐W‐Winter 2013/14 2014/15 2015/16 2016/17 2017/18 2018/19 2019/20 2020/21 2021/22 2022/23
ANTICIPATED 117.6% 117.2% 115.6% 111.5% 107.4% 104.4% 107.2% 101.4% 101.2% 97.8% PROSPECTIVE 139.2% 138.5% 136.7% 132.1% 127.6% 124.3% 127.5% 121.1% 120.7% 117.0% ADJUSTED POTENTIAL 139.3% 142.1% 145.1% 140.8% 136.6% 138.9% 146.1% 139.9% 142.8% 139.0%
NERC REFERENCE ‐ 15.00% 15.00% 15.00% 15.00% 15.00% 15.00% 15.00% 15.00% 15.00% 15.00%
SERC‐W‐Figure 1: Summer (Left) and Winter262 (Right) Planning Reserve Margins
Contributing factors to adequate margins exist and owned resources, limited and long‐term purchase contracts, as well as
potential deactivations and anticipated unit outages to plan and procure resources needed to meet the target Reserve
Margin when developing plans for the season. Individual entity criteria also help establish resource adequacy by allocations
assigned as a member of the SPP Reserve Sharing Group, Balancing Authority’s most severe single contingency, load
forecasts, reserve requirements using historical allocations, and Loss of Load Expectation studies (0.1 day per year). There
are no other anticipated reliability concerns for the period.
Demand Entities in the SERC‐W Assessment Area project decreases in growth rates when comparing the 2013 long‐term forecast
(1.15 percent) to the 2011 forecast (1.30 percent) (SERC‐W‐Table 2).
SERC‐W‐Table 2: Demand Outlook SERC‐W‐Summer 2013 2022 10‐Year Change CAGR
NET INTERNAL DEMAND 25,015 27,764 2,749 11.0% 1.17%
Load‐Modifying Demand Response 906 966 60 6.6% 0.72%
TOTAL INTERNAL DEMAND 25,921 28,730 2,809 10.8% 1.15%
SERC‐W‐Winter 2013/14 2022/23 10‐Year Change CAGR
NET INTERNAL DEMAND 19,731 22,262 2,531 12.8% 1.35%
Load‐Modifying Demand Response 766 820 54 7.0% 0.76%
TOTAL INTERNAL DEMAND 20,497 23,082 2,585 12.6% 1.33%
The modest decrease in growth is due to lower economic projections received from vendors as they adjusted forecasts to
reflect a longer recovery from the recession. Decreases also reflect a reduction in the long‐term outlook for retail electric
sales due to this forecast. Typical weather conditions are used to forecast the load shapes for the residential, commercial,
262
Each year represents the initial year of the winter season. For example: 2013 represents the 2013/2014 winter season.
0%
10%
20%
30%
40%
50%
60%
70%
2013 2014 2015 2016 2017 2018 2019 2020 2021 2022
0%
30%
60%
90%
120%
150%
2013 2014 2015 2016 2017 2018 2019 2020 2021 2022
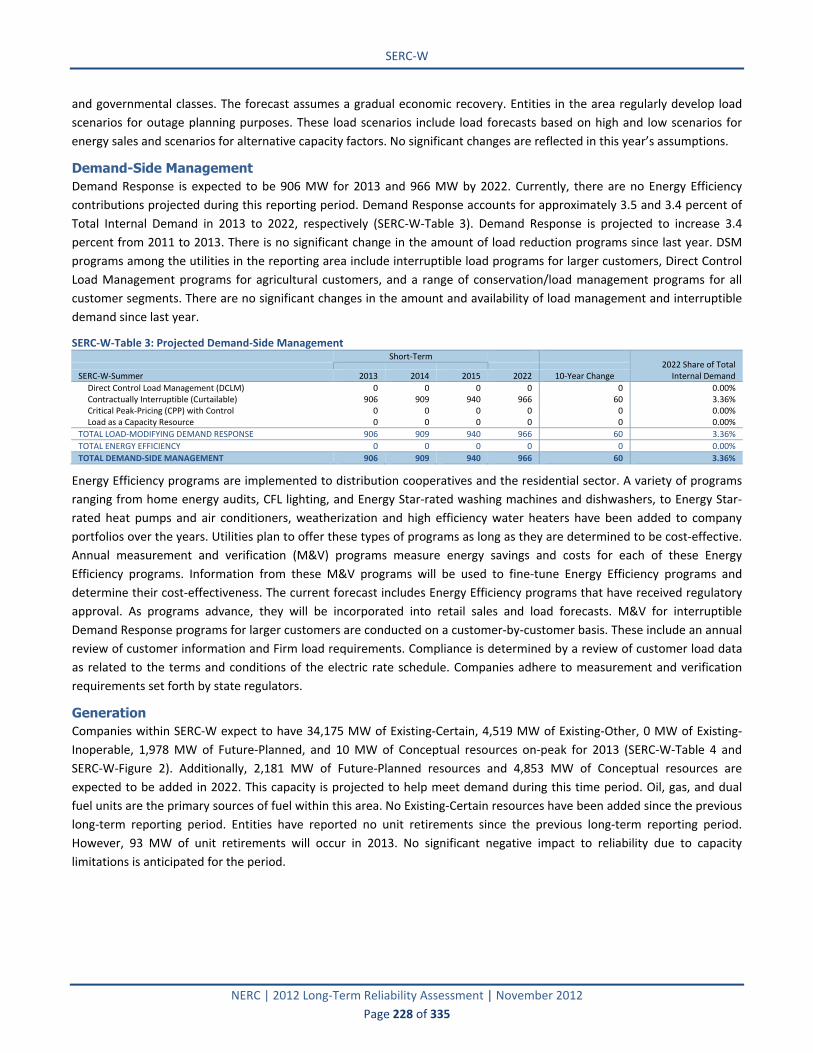
SERC‐W
NERC | 2012 Long‐Term Reliability Assessment | November 2012
Page 228 of 335
and governmental classes. The forecast assumes a gradual economic recovery. Entities in the area regularly develop load
scenarios for outage planning purposes. These load scenarios include load forecasts based on high and low scenarios for
energy sales and scenarios for alternative capacity factors. No significant changes are reflected in this year’s assumptions.
Demand-Side Management Demand Response is expected to be 906 MW for 2013 and 966 MW by 2022. Currently, there are no Energy Efficiency
contributions projected during this reporting period. Demand Response accounts for approximately 3.5 and 3.4 percent of
Total Internal Demand in 2013 to 2022, respectively (SERC‐W‐Table 3). Demand Response is projected to increase 3.4
percent from 2011 to 2013. There is no significant change in the amount of load reduction programs since last year. DSM
programs among the utilities in the reporting area include interruptible load programs for larger customers, Direct Control
Load Management programs for agricultural customers, and a range of conservation/load management programs for all
customer segments. There are no significant changes in the amount and availability of load management and interruptible
demand since last year.
SERC‐W‐Table 3: Projected Demand‐Side Management Short‐Term
2022 Share of Total Internal Demand
SERC‐W‐Summer 2013 2014 2015 2022 10‐Year Change
Direct Control Load Management (DCLM) 0 0 0 0 0 0.00% Contractually Interruptible (Curtailable) 906 909 940 966 60 3.36% Critical Peak‐Pricing (CPP) with Control 0 0 0 0 0 0.00% Load as a Capacity Resource 0 0 0 0 0 0.00%
TOTAL LOAD‐MODIFYING DEMAND RESPONSE 906 909 940 966 60 3.36%
TOTAL ENERGY EFFICIENCY 0 0 0 0 0 0.00%
TOTAL DEMAND‐SIDE MANAGEMENT 906 909 940 966 60 3.36%
Energy Efficiency programs are implemented to distribution cooperatives and the residential sector. A variety of programs
ranging from home energy audits, CFL lighting, and Energy Star‐rated washing machines and dishwashers, to Energy Star‐
rated heat pumps and air conditioners, weatherization and high efficiency water heaters have been added to company
portfolios over the years. Utilities plan to offer these types of programs as long as they are determined to be cost‐effective.
Annual measurement and verification (M&V) programs measure energy savings and costs for each of these Energy
Efficiency programs. Information from these M&V programs will be used to fine‐tune Energy Efficiency programs and
determine their cost‐effectiveness. The current forecast includes Energy Efficiency programs that have received regulatory
approval. As programs advance, they will be incorporated into retail sales and load forecasts. M&V for interruptible
Demand Response programs for larger customers are conducted on a customer‐by‐customer basis. These include an annual
review of customer information and Firm load requirements. Compliance is determined by a review of customer load data
as related to the terms and conditions of the electric rate schedule. Companies adhere to measurement and verification
requirements set forth by state regulators.
Generation Companies within SERC‐W expect to have 34,175 MW of Existing‐Certain, 4,519 MW of Existing‐Other, 0 MW of Existing‐
Inoperable, 1,978 MW of Future‐Planned, and 10 MW of Conceptual resources on‐peak for 2013 (SERC‐W‐Table 4 and
SERC‐W‐Figure 2). Additionally, 2,181 MW of Future‐Planned resources and 4,853 MW of Conceptual resources are
expected to be added in 2022. This capacity is projected to help meet demand during this time period. Oil, gas, and dual
fuel units are the primary sources of fuel within this area. No Existing‐Certain resources have been added since the previous
long‐term reporting period. Entities have reported no unit retirements since the previous long‐term reporting period.
However, 93 MW of unit retirements will occur in 2013. No significant negative impact to reliability due to capacity
limitations is anticipated for the period.
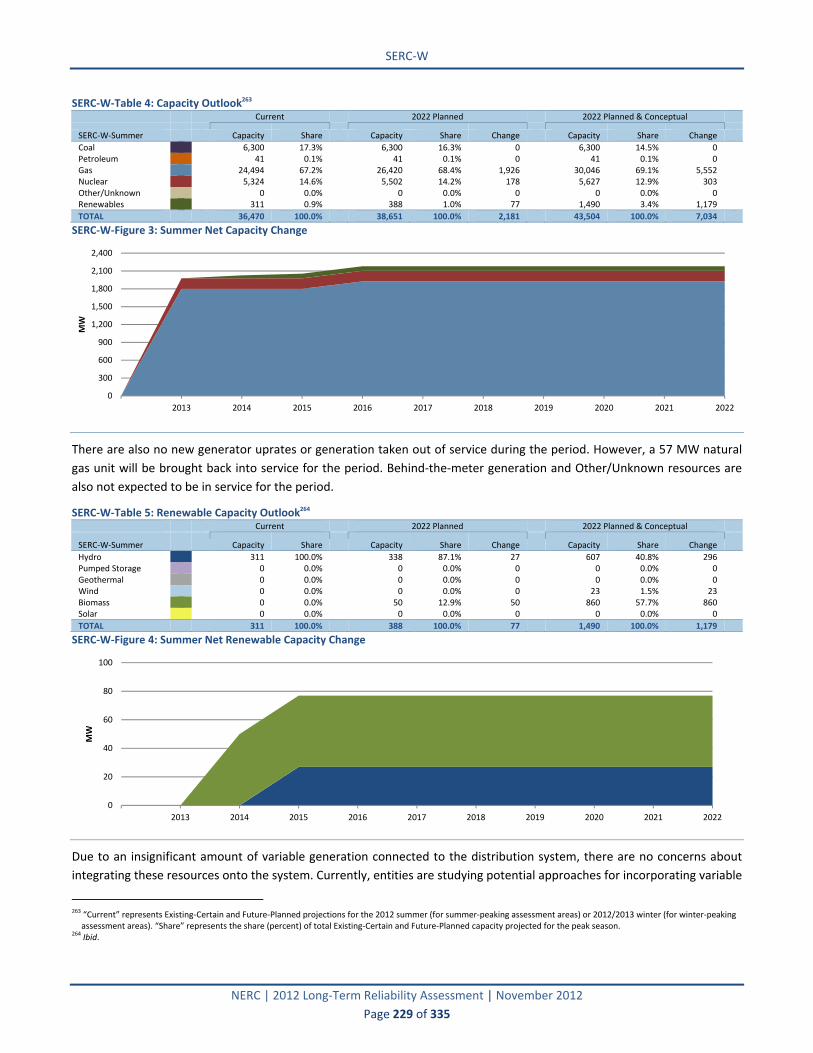
SERC‐W
NERC | 2012 Long‐Term Reliability Assessment | November 2012
Page 229 of 335
SERC‐W‐Table 4: Capacity Outlook263 Current 2022 Planned 2022 Planned & Conceptual
SERC‐W‐Summer Capacity Share Capacity Share Change Capacity Share Change
Coal 6,300 17.3% 6,300 16.3% 0 6,300 14.5% 0 Petroleum 41 0.1% 41 0.1% 0 41 0.1% 0 Gas 24,494 67.2% 26,420 68.4% 1,926 30,046 69.1% 5,552 Nuclear 5,324 14.6% 5,502 14.2% 178 5,627 12.9% 303 Other/Unknown 0 0.0% 0 0.0% 0 0 0.0% 0 Renewables 311 0.9% 388 1.0% 77 1,490 3.4% 1,179
TOTAL 36,470 100.0% 38,651 100.0% 2,181 43,504 100.0% 7,034
SERC‐W‐Figure 3: Summer Net Capacity Change
There are also no new generator uprates or generation taken out of service during the period. However, a 57 MW natural
gas unit will be brought back into service for the period. Behind‐the‐meter generation and Other/Unknown resources are
also not expected to be in service for the period.
SERC‐W‐Table 5: Renewable Capacity Outlook264 Current 2022 Planned 2022 Planned & Conceptual
SERC‐W‐Summer Capacity Share Capacity Share Change Capacity Share Change
Hydro 311 100.0% 338 87.1% 27 607 40.8% 296 Pumped Storage 0 0.0% 0 0.0% 0 0 0.0% 0 Geothermal 0 0.0% 0 0.0% 0 0 0.0% 0 Wind 0 0.0% 0 0.0% 0 23 1.5% 23 Biomass 0 0.0% 50 12.9% 50 860 57.7% 860 Solar 0 0.0% 0 0.0% 0 0 0.0% 0
TOTAL 311 100.0% 388 100.0% 77 1,490 100.0% 1,179
SERC‐W‐Figure 4: Summer Net Renewable Capacity Change
Due to an insignificant amount of variable generation connected to the distribution system, there are no concerns about
integrating these resources onto the system. Currently, entities are studying potential approaches for incorporating variable
263 “Current” represents Existing‐Certain and Future‐Planned projections for the 2012 summer (for summer‐peaking assessment areas) or 2012/2013 winter (for winter‐peaking
assessment areas). “Share” represents the share (percent) of total Existing‐Certain and Future‐Planned capacity projected for the peak season. 264 Ibid.
0
300
600
900
1,200
1,500
1,800
2,100
2,400
2013 2014 2015 2016 2017 2018 2019 2020 2021 2022
MW
0
20
40
60
80
100
2013 2014 2015 2016 2017 2018 2019 2020 2021 2022
MW

SERC‐W
NERC | 2012 Long‐Term Reliability Assessment | November 2012
Page 230 of 335
resources into their planning processes. Wind agreements are used as a tool to allow operators to enhance reliability and
can be used in situations such as curtailing for TLR and managing minimum generation problems. An energy forecasting
package is used to predict wind farm output given meteorological data collected at the wind farms. No issues are
anticipated for the period.
SERC‐W‐Table 6: Renewable Capacity Outlook: On‐Peak Vs. Installed Current 2022 Planned
SERC‐W‐Summer Wind Solar Hydro Biomass Wind Solar Hydro Biomass
Installed Capacity 0 0 311 0 0 0 338 50 On‐Peak Derate 0 0 0 0 0 0 0 0
EXPECTED ON‐PEAK OUTPUT 0 0 311 0 0 0 338 50
Capacity Transactions Utilities within SERC‐W expect the following imports and exports listed below for the period. These imports and exports
have been accounted for in the Reserve Margin calculations for the reporting area. Most of the contracts in the area are
agreements for a 10‐year period for the winter and summer peaking seasons. Once the contract ends, the unit’s capacity is
changed from Existing‐Certain to Existing‐Other.
SERC‐W‐Table 7: Projected Capacity Transactions SERC‐W‐Summer 2013 2014 2015 2016 2017 2018 2019 2020 2021 2022
Expected Imports 0 0 0 0 0 0 0 0 0 0 Firm Imports 50 50 50 50 50 50 50 50 50 50
TOTAL IMPORTS 50 50 50 50 50 50 50 50 50 50
Expected Exports 0 0 0 0 0 0 0 0 0 0 Firm Exports 2,304 1,746 1,746 1,671 1,671 1,671 1,671 1,671 1,392 1,392
TOTAL EXPORTS 2,304 1,746 1,746 1,671 1,671 1,671 1,671 1,671 1,392 1,392
TOTAL NET CAPACITY TRANSACTIONS ‐2,254 ‐1,696 ‐1,696 ‐1,621 ‐1,621 ‐1,621 ‐1,621 ‐1,621 ‐1,342 ‐1,342
Reporting entities in the area are dependent on certain imports, transfers, or contracts to meet the load demands. Most
entities are members of the Southwest Power Pool (SPP) Reserve Sharing Group. Group participants within SPP generally
transfer reserves into the area to either replace (largest contingency) or supply generation to the area. These reserves are
not relied on in the resource adequacy assessment, or for capacity or Reserve Margins. System operators generally
coordinate the scheduling and transmitting of the reserves. Total emergency MW from these imports was not reported.
Transmission Entities within the reporting area are not expecting any delays in meeting in‐service dates for projects scheduled for the
summer assessment period. Some of the significant projects that are planned or have been recently completed in SERC‐W
are:
Acadiana Load Pocket Project Phases 1 and 2: Completed in June, 2012. Project creates a new 230 kV overlay in the
Acadiana Area of south Louisiana.
Ouachita Transmission Projects: Completed in June, 2012. Projects included increasing 500‐115 kV transformer
capacity in northern Louisiana, upgrades of various 115 kV lines around the Sterlington Area, and the addition of a 2nd
500‐115 kV transformer at the Baxter Wilson substation in Mississippi.
Grenada/Winona/Greenwood Area Improvement Project: Completed in June, 2012. Project included the construction
of a new Tillatoba–South Grenada 230 kV line and a 230‐115 kV transformer at South Grenada.
Holland Bottoms Project: Completed in May 2012. Project included the addition of 500‐161 and 500‐115 kV
transformers in the northeast Little Rock Area of Arkansas and the construction of a new 161 kV transmission line
from Holland Bottoms to the Hamlet substation north of the Little Rock Area.
Nelson to Moss Bluff 230 kV line: Completed in May, 2012. Project included the construction of a new 230 kV line in
the Lake Charles Area of southern Louisiana.
Northeast Louisiana Improvement Project Phases 1 and 2: Projected in service by summer 2013 and summer 2014,
respectively. Project includes construction of new 230 kV line (to operate at 115 kV initially) from the Monroe Area of
northern Louisiana to the Delhi Area in order to increase transmission capacity in the Area.

SERC‐W
NERC | 2012 Long‐Term Reliability Assessment | November 2012
Page 231 of 335
Getwell to Church Road 230 kV line: Projected in‐service date by summer 2013. Project includes the construction of a
new 230 kV line between Church Road and Getwell substations in north Mississippi and create a 230 kV loop in the
Area.
SERC‐W‐Table 8: Existing and Projected Transmission SERC‐W AC (Circuit Miles) DC (Circuit Miles) Total (Circuit Miles)
EXISTING 14,295 0 14,295
Currently Under Construction 72 0 72 Planned ‐ Completed within First Five Years 414 0 414 Planned ‐ Completed within Second Five Years 79 0 79
2022 TOTAL (UNDER CONSTRUCTION & PLANNED) 14,860 0 14,860
Conceptual ‐ Completed within First Five Years 26 0 26 Conceptual ‐ Completed within Second Five Years 92 0 92
2022 TOTAL (UNDER CONSTRUCTION, PLANNED & CONCEPTUAL) 683 0 683
Additionally, there are no significant transmission facility outages or significant projects that are expected to impact BES
reliability. Utilities in SERC‐W continue to identify and develop plans to construct or upgrade transmission facilities to meet
reliability needs and incorporate new generation resources in the area for both the near‐term and long‐term planning
horizons. Transmission projects are planned to be constructed to support the Future‐Planned generation in the SERC‐W
Area. Prior to approval of any proposed maintenance outages, studies are completed to identify any impact on reliability. In
addition, 2012 near‐term summer preliminary results indicate that with operating guides in place, imports into the Area
exceed 2,000 MW for all paths studied. To enhance the system, entities continue to research new technologies such as
dynamic voltage devices (SVC/Statcom) to provide voltage support to the Area. However, no additional SVC/Statcom or
other specialized devices are expected to be added during the long‐term period. Some utilities in SERC‐W are involved in
adding PMUs as part of an ongoing DOE project. The project will allow a greater visualization of the transmission system for
transmission system operators. Twelve PMUs were installed in 2011, with an additional 23 PMUs planned to be installed
throughout the transmission system in 2012.
Vulnerability Assessment Existing and owned resources, limited and long‐term purchase contracts, potential deactivations, and anticipated unit
outages are considered when developing the one‐year and 10‐year resource plan. The latest resource adequacy studies do
not show concerns for reliability of the system. Resource availability, fuel availability, and hydro conditions are expected to
be normal during the summer, except for possible hydro limitations in Texas. Energy production in Texas may be limited
due to existing drought conditions, unless above‐normal rainfall is experienced during winter and spring months. Studies in
these areas account for these conditions. Loss‐of‐load studies are performed annually for the current year based on
updated load forecasts and unit availability data. The long‐term test of resource adequacy is met by achieving a 16.85
percent Planning Reserve Margin.
Demand Response, distributed generation, variable renewable resources and Renewable Portfolio Standards (RPS) are not
currently explicitly considered in the resource adequacy assessment. However, an RFP was recently conducted for Louisiana
to identify and select renewable energy resources that meet the requirements of the Louisiana Public Service Commission’s
Pilot Program and approved Implementation Plan. These plans are consistent with the objectives of Entergy’s Systems
Strategic Resource Plan. Selections have been made, and ESI will be entering into discussions for the execution of definitive
agreements associated with the proposals on the primary selection list.
Studies are being conducted for 2012 and 2018 summer time periods to identify additional static and dynamic reactive
support requirements in the Nine Mile Area. Based on the study results, recommendations may be to install SVCs or
capacitor banks, change transformer tap settings, or add new transmission facilities to ensure adequate reactive
requirements are met. UVLS programs are also used to maintain voltage stability and protect against BES cascading events.
An existing 250 MW UVLS scheme is used in the western area of Texas. No additional UVLS schemes are planned for the
reporting area. In addition, no Special Protection Schemes are expected to be installed for the SERC‐W Area in lieu of
planned bulk power transmission facilities.

SERC‐W
NERC | 2012 Long‐Term Reliability Assessment | November 2012
Page 232 of 335
Resource and transmission planning activities consider contingency events to help entities prepare for catastrophic events.
Close relationships with neighboring utilities and regular emergency operating drills are important practices of utilities.
Entities within this reporting area are routinely exposed to hurricanes, and detailed emergency response plans have been
developed for dealing with the consequences of hurricane damage to area electrical systems. One way that catastrophic
events are mitigated is that gas‐fired power plants do not rely on a single pipeline for transportation of natural gas.
Likewise, most entities do not heavily rely on imports outside the reporting areas due to the loss of a major import that
could negatively affect reliability.
Utilities within SERC‐W have procedures in place to identify and review misoperations associated with transmission
protection systems. In the event of a misoperation on the transmission system, investigations, including root cause analysis,
are performed to determine corrective actions and implementation plans. Corrective action plans may cause an entity to
evaluate other facilities for similar causes of misoperation.
There are no environmental or regulatory restrictions projected within the reporting area that will affect reliability for the
period. The CSAPR rules, which have been stayed by federal courts, were not expected to result in any new reliability‐must‐
run (RMR) units in SERC‐W. In the event that there were insufficient allowances to operate existing RMR units at historical
levels, it was possible to run these units at reduced production levels while ensuring grid reliability. Additional flexibility was
expected with the October 2011 proposed revision. The increased flexibility allowed by this revision created additional
possibilities for compliance, including interstate allowance purchases. Prior to the proposed October limits, some utilities in
SERC‐W had identified potential transmission upgrades in which acceleration of existing transmission projects was being
considered. These are existing BES projects in various stages of planning, design, and construction. However, with the
proposed October 2011 limits, no BES projects were identified in which acceleration prior to 2012 was required. Off‐peak
maintenance outages are not expected to affect reliability in the SERC‐W Area.
Beyond the impact of CSAPR itself, utilities in the SERC‐W Area do not anticipate a significant, immediate impact to system
reliability due to the combined effects of CSAPR and other emerging environmental regulations. While the short
implementation period allowed for CSAPR created concerns, other emerging rules are expected to have varying
implementation dates that will provide adequate time for planning and execution of control projects. In addition, coal
plants, which will be most affected by emerging regulations, are positioned relatively well in regard to their capacity and
age, such that most projected environmental projects are currently estimated to be economically viable and are not
expected to drive early retirements.
Utilities within SERC‐W report that the deadlines created by the final EGU MACT rule could be problematic for the
installation deadlines of major pollution control equipment for individual plants. This problem could also be compounded
by the uncertainty over regional haze state implementation plan requirements. When plans are approved by the EPA,
another layer of technology installments would be required. Utilities in the SERC‐W Area believe that for coal plants, these
are issues of timing, permitting, state public service commission approval, and rational project management, not
retirement. The most immediate threat to reliability is likely to be in the 2020 time frame when units will be required to
implement 316(b) controls and address any reductions driven by lower National Ambient Air Quality Standards (NAAQS).
However, utilities in the SERC‐W Area do not anticipate the suite of EPA regulations to result in significant facility
retirements or generation reductions.
Standing and Emerging Reliability Issues The CSAPR rules, which have been stayed, were not expected to result in any new reliability‐must‐run (RMR) units in SERC‐
W. In the event that there were insufficient allowances to operate existing RMR units at historical levels, it was still possible
to run these units at reduced production levels while still ensuring grid reliability. Additional flexibility was expected with
the October 2011 proposed revision. The increased flexibility allowed by this revision created addition possibilities for
compliance, including interstate allowance purchases. Prior to the proposed October limits, some utilities in SERC‐W had
identified potential transmission upgrades in which acceleration of existing transmission projects was being considered.

SERC‐W
NERC | 2012 Long‐Term Reliability Assessment | November 2012
Page 233 of 335
These are current BES projects in various stages of planning, design, and construction. However, with the proposed October
limits, no BES projects were identified in which acceleration prior to 2012 was required.
Beyond the impact of CSAPR itself, utilities in the SERC‐W Area do not anticipate a significant, immediate impact to system
reliability due to the combined effects of CSAPR and other emerging environmental regulations. While the short
implementation period allowed for CSAPR created concerns, other emerging rules are expected to have varying
implementation dates that will provide adequate time for planning and execution of control projects. In addition, coal
plants, which will be most affected by emerging regulations, are positioned relatively well in regard to their capacity and
age, such that most projected environmental projects are currently estimated to be economically viable and are not
expected to drive early retirements.
Utilities note that depending on the deadlines created by the final EGU MACT rule, applicable deadlines for the installation
of major pollution control equipment could be problematic for individual plants. This potential problem is compounded by
the uncertainty over regional haze state implementation plan requirements, which when eventually approved by EPA, could
require another layer of technology to be installed. Utilities believe that for coal plants, these are issues of timing,
permitting, state public service commission approval, and rational project management, not retirement. The most
immediate threat to reliability is likely to be in the 2020 time frame, when units will be required to implement 316(b)
controls and will need to address any reductions driven by lower National Ambient Air Quality Standards (NAAQS).
However, utilities do not anticipate the suite of EPA regulations to result in significant facility retirements or generation
reductions.
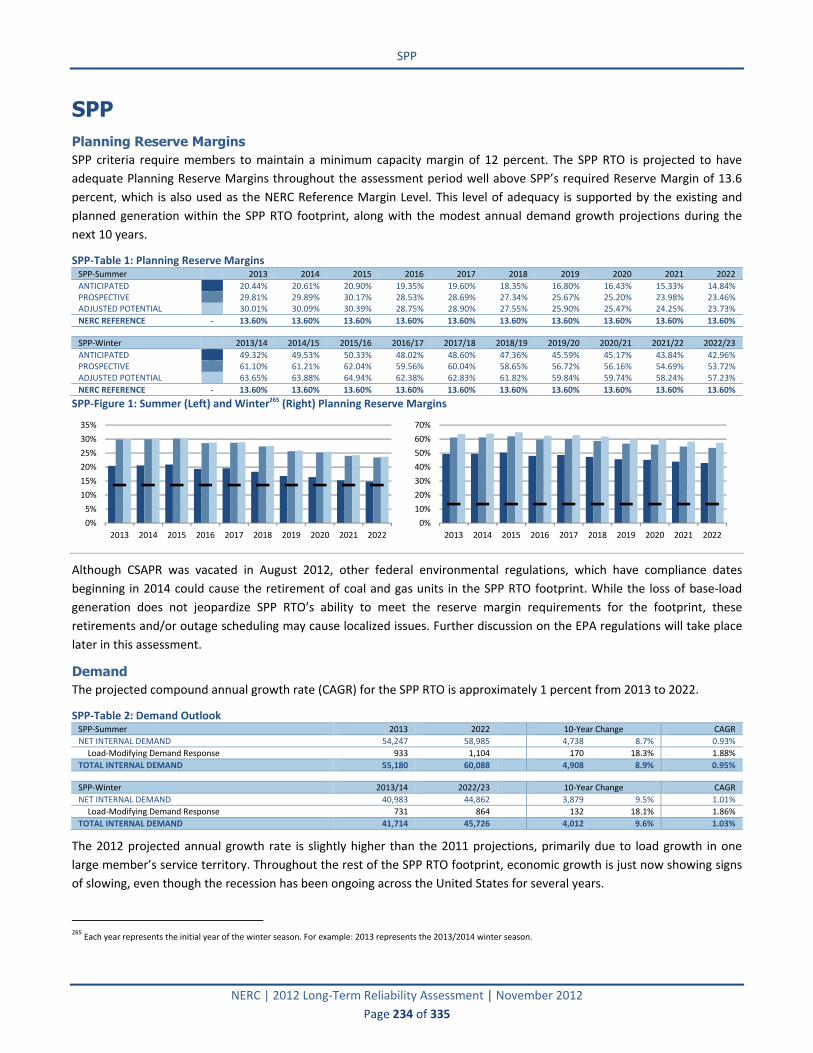
SPP
NERC | 2012 Long‐Term Reliability Assessment | November 2012
Page 234 of 335
SPP Planning Reserve Margins SPP criteria require members to maintain a minimum capacity margin of 12 percent. The SPP RTO is projected to have
adequate Planning Reserve Margins throughout the assessment period well above SPP’s required Reserve Margin of 13.6
percent, which is also used as the NERC Reference Margin Level. This level of adequacy is supported by the existing and
planned generation within the SPP RTO footprint, along with the modest annual demand growth projections during the
next 10 years.
SPP‐Table 1: Planning Reserve Margins SPP‐Summer 2013 2014 2015 2016 2017 2018 2019 2020 2021 2022
ANTICIPATED 20.44% 20.61% 20.90% 19.35% 19.60% 18.35% 16.80% 16.43% 15.33% 14.84% PROSPECTIVE 29.81% 29.89% 30.17% 28.53% 28.69% 27.34% 25.67% 25.20% 23.98% 23.46% ADJUSTED POTENTIAL 30.01% 30.09% 30.39% 28.75% 28.90% 27.55% 25.90% 25.47% 24.25% 23.73%
NERC REFERENCE ‐ 13.60% 13.60% 13.60% 13.60% 13.60% 13.60% 13.60% 13.60% 13.60% 13.60%
SPP‐Winter 2013/14 2014/15 2015/16 2016/17 2017/18 2018/19 2019/20 2020/21 2021/22 2022/23
ANTICIPATED 49.32% 49.53% 50.33% 48.02% 48.60% 47.36% 45.59% 45.17% 43.84% 42.96% PROSPECTIVE 61.10% 61.21% 62.04% 59.56% 60.04% 58.65% 56.72% 56.16% 54.69% 53.72% ADJUSTED POTENTIAL 63.65% 63.88% 64.94% 62.38% 62.83% 61.82% 59.84% 59.74% 58.24% 57.23%
NERC REFERENCE ‐ 13.60% 13.60% 13.60% 13.60% 13.60% 13.60% 13.60% 13.60% 13.60% 13.60%
SPP‐Figure 1: Summer (Left) and Winter265 (Right) Planning Reserve Margins
Although CSAPR was vacated in August 2012, other federal environmental regulations, which have compliance dates
beginning in 2014 could cause the retirement of coal and gas units in the SPP RTO footprint. While the loss of base‐load
generation does not jeopardize SPP RTO’s ability to meet the reserve margin requirements for the footprint, these
retirements and/or outage scheduling may cause localized issues. Further discussion on the EPA regulations will take place
later in this assessment.
Demand The projected compound annual growth rate (CAGR) for the SPP RTO is approximately 1 percent from 2013 to 2022.
SPP‐Table 2: Demand Outlook SPP‐Summer 2013 2022 10‐Year Change CAGR
NET INTERNAL DEMAND 54,247 58,985 4,738 8.7% 0.93%
Load‐Modifying Demand Response 933 1,104 170 18.3% 1.88%
TOTAL INTERNAL DEMAND 55,180 60,088 4,908 8.9% 0.95%
SPP‐Winter 2013/14 2022/23 10‐Year Change CAGR
NET INTERNAL DEMAND 40,983 44,862 3,879 9.5% 1.01%
Load‐Modifying Demand Response 731 864 132 18.1% 1.86%
TOTAL INTERNAL DEMAND 41,714 45,726 4,012 9.6% 1.03%
The 2012 projected annual growth rate is slightly higher than the 2011 projections, primarily due to load growth in one
large member’s service territory. Throughout the rest of the SPP RTO footprint, economic growth is just now showing signs
of slowing, even though the recession has been ongoing across the United States for several years.
265
Each year represents the initial year of the winter season. For example: 2013 represents the 2013/2014 winter season.
0%
5%
10%
15%
20%
25%
30%
35%
2013 2014 2015 2016 2017 2018 2019 2020 2021 2022
0%
10%
20%
30%
40%
50%
60%
70%
2013 2014 2015 2016 2017 2018 2019 2020 2021 2022

SPP
NERC | 2012 Long‐Term Reliability Assessment | November 2012
Page 235 of 335
Demand-Side Management For 2013, SPP RTO projects 910 MW of Contractually Interruptible DR, 85 MW of Direct Control Load Management (DCLM)
counted as a resources, 182 MW of load‐modifying DCLM, and 28 MW of Load as a Capacity Resource. An additional 307
MW of new conservation (Energy Efficiency) is also projected. Total Demand Response is projected to increase from 1,513
MW in 2013 to 2,408 MW in 2022.
SPP‐Table 3: Projected Demand‐Side Management Short‐Term
2022 Share of Total Internal Demand
SPP‐Summer 2013 2014 2015 2022 10‐Year Change
Direct Control Load Management (DCLM) 85 94 104 175 89 0.29% Contractually Interruptible (Curtailable) 187 271 286 320 133 0.53% Critical Peak‐Pricing (CPP) with Control 0 0 0 0 0 0.00% Load as a Capacity Resource 0 0 0 0 0 0.00%
TOTAL RESOURCE‐SIDE DEMAND RESPONSE 272 365 390 495 223 0.82%
Direct Control Load Management (DCLM) 182 191 200 208 26 0.35% Contractually Interruptible (Curtailable) 723 719 750 868 145 1.44% Critical Peak‐Pricing (CPP) with Control 0 0 0 0 0 0.00% Load as a Capacity Resource 28 28 28 28 0 0.05%
TOTAL LOAD‐MODIFYING DEMAND RESPONSE 933 938 977 1,104 170 1.84%
TOTAL ENERGY EFFICIENCY 307 369 423 809 502 1.35%
TOTAL DEMAND‐SIDE MANAGEMENT 1,513 1,672 1,791 2,408 895 4.01%
For 2022, SPP RTO projects 1,188 MW of Contractually Interruptible DR, 208 MW of Demand‐Side DCLM, 175 MW of Supply
Side DCLM, 28 MW of Load as a Capacity Resource, and 809 MW of new conservation (Energy Efficiency). SPP RTO projects
a yearly increase in Demand Response programs until the year 2018 when the projections become more variable due to the
discontinuation of certain programs.
Westar Energy launched its voluntary Demand Response program, Watt Saver, in September 2009. Watt Saver is open to
single‐ and multi‐family residential customers as well as small and medium commercial customers who receive a free
Honeywell Utility Pro programmable thermostat and access to an online energy management system. From June through
September, Watt Saver participants agree to allow Westar to cycle their central air conditioners or heat pumps (on and off
in 15‐minute intervals) in a coordinated effort to reduce energy demand during peak times. These cycling events normally
last between four and six hours and run between noon and 8:00 p.m. Cycling events occur infrequently and only on
standard work days. In 2011, Westar implemented the program six times. Currently, more than 32,000 Westar customers
are enrolled in the program, which provides an estimated 27 MW of load reduction capability. Westar anticipates
enrollment of 90,000 participants with a potential load reduction capability of 90 MW by the end of 2016.
SPP RTO member Oklahoma Gas and Electric (OG&E) installed approximately 40,000 smart meters on customer homes in
Norman, Oklahoma in 2010, 2011, and 2012. The information delivery infrastructure was also installed to carry information
to and from the customers and OG&E. This program will provide OG&E with 84 MW of Demand Response during peak
hours.
In January 2012, Kansas City Board of Public Utilities (KCBPU) started a voluntary program in which they will install a free
Honeywell UtilityPro thermostat in customers’ homes. Participating customers agree to allow KCBPU to raise the
temperature in their home or business by up to two degrees. This will allow KCBPU to reduce summer electricity demand
during periods of peak use and extreme heat. These peak events typically last no more than four hours and begin on a
weekday afternoon and end in early evening. KCBPU expects to enroll 6,000 customers by the end of 2013, which will
provide a demand reduction of approximately 10 MW.
Generation For the current year 2012, SPP RTO forecasts 63,896 MW of Existing‐Certain and 5,083 MW of Existing‐ Other. The primary
fuel sources in the SPP RTO footprint are gas (46 percent) and coal (43 percent). Several new generation units have been
added to the SPP RTO fleet since the 2011 long‐term reliability assessment, including 308 MW of wind, 552 MW of gas, and
168 MW of coal.

SPP
NERC | 2012 Long‐Term Reliability Assessment | November 2012
Page 236 of 335
SPP‐Table 4: Capacity Outlook266 Current 2022 Planned 2022 Planned & Conceptual
SPP‐Summer Capacity Share Capacity Share Change Capacity Share Change
Coal 27,334 42.5% 27,380 40.7% 46 27,380 39.7% 46 Petroleum 1,919 3.0% 1,927 2.9% 9 1,927 2.8% 9 Gas 29,395 45.7% 30,990 46.0% 1,595 31,200 45.3% 1,805 Nuclear 2,409 3.7% 2,480 3.7% 71 2,626 3.8% 217 Other/Unknown 40 0.1% 50 0.1% 10 50 0.1% 10 Renewables 3,291 5.1% 4,511 6.7% 1,220 5,730 8.3% 2,439
TOTAL 64,388 100.0% 67,338 100.0% 2,951 68,913 100.0% 4,525
Future‐Planned Expected on‐peak capacity from renewable plants increases from 350 MW in 2013 to 1,220 MW in 2022.
These reported renewable resource additions in the SPP RTO do not reflect merchant wind farm development in process,
incremental needs that may result from Renewable Energy Standard mandates or goals within the SPP RTO region, or public
announcements for additional renewable expansion by SPP RTO members. The SPP RTO has requests to interconnect
approximately 14,109 MW of Future‐Planned generation (mostly wind) to the SPP RTO grid via the generation
interconnection queue.
Variable generation of 13,900 MW nameplate capacity comprises the majority of the Conceptual resources. SPP Criteria
Section 12.0267 discusses capacity values and how they are calculated for the Region based on a wind farm’s historical
performance. The SPP RTO applies a 10 percent confidence factor to all Conceptual capacity unless otherwise reported by
SPP RTO members. Therefore, Conceptual Capacity Resources are forecast to be 1,045 MW in 2013, increasing to 1,575
MW in 2022.
For the reporting of Future and Conceptual Capacity Resources, the SPP RTO uses the Generation Interconnection and
Transmission Service Request study processes as defined in the SPP OATT. According to the OATT, when the
interconnection request is submitted, the interconnection customer must request either energy resource interconnection
service or Network Resource interconnection service. Any interconnection customer requesting Network Resource
interconnection service may also request that it be concurrently studied for energy resource interconnection service. This
remains an option up to the point when an interconnection facility study agreement is executed. Interconnection
customers may then elect to proceed with Network Resource interconnection service or to proceed under a lower level of
interconnection service to the extent that only certain upgrades will be completed. In the NERC LTRA, the SPP RTO includes
active requests that are currently in the generation queue to be studied, in addition to the member‐reported Future,
Planned, and Conceptual resources.
SPP RTO projects 929 MW of generation retirements over the 2013–2022 assessment time frame, not including retirements
or derates that may occur in response to developing EPA regulations. The retirement of units is scheduled as follows: 130
266 “Current” represents Existing‐Certain and Future‐Planned projections for the 2012 summer (for summer‐peaking assessment areas) or 2012/2013 winter (for winter‐peaking
assessment areas). “Share” represents the share (percent) of total Existing‐Certain and Future‐Planned capacity projected for the peak season. 267 SPP Criteria: http://www.spp.org/publications/CRITERIA%20and%20Appendices%2001‐25‐2011Current.pdf.
‐500
0
500
1,000
1,500
2,000
2,500
3,000
2013 2014 2015 2016 2017 2018 2019 2020 2021 2022
MW

SPP
NERC | 2012 Long‐Term Reliability Assessment | November 2012
Page 237 of 335
MW in 2013, 18 MW in 2015, 250 MW in 2016, and 531 MW in 2022. SPP RTO does not expect to have any reliability issues
because of the projected retirements. With the new generation projected there are no operational or planning concerns at
this time. There have been no project cancellations, and while some derates were reported from the previous year’s
assessment, they were not material.
The planned and conceptual renewable resources for the year 2022 are as follows: 2,505 MW of expected on‐peak wind
capacity with a maximum nameplate capacity of 28,069 MW, 13 MW of expected on‐peak solar capacity with a maximum
nameplate capacity of 90 MW, 2,673 MW of expected on‐peak hydro capacity with a maximum nameplate capacity of
2,785 MW, and 221 MW of expected on‐peak biomass capacity. The expected on‐peak capacity values for this variable
generation are determined by guidelines established in the SPP Criteria Section 12.0.
SPP‐Table 5: Renewable Capacity Outlook268 Current 2022 Planned 2022 Planned & Conceptual
SPP‐Summer Capacity Share Capacity Share Change Capacity Share Change
Hydro 2,676 81.3% 2,673 59.2% ‐3 2,673 46.6% ‐3 Pumped Storage 319 9.7% 319 7.1% 0 319 5.6% 0 Geothermal 0 0.0% 0 0.0% 0 0 0.0% 0 Wind 273 8.3% 1,289 28.6% 1,016 2,505 43.7% 2,232 Biomass 19 0.6% 221 4.9% 202 221 3.9% 202 Solar 5 0.2% 10 0.2% 5 13 0.2% 8
TOTAL 3,291 100.0% 4,511 100.0% 1,220 5,730 100.0% 2,439
SPP‐Figure 3: Summer Net Renewable Capacity Change
SPP‐Table 6: Renewable Capacity Outlook: On‐Peak Vs. Installed Current 2022 Planned
SPP‐Summer Wind Solar Hydro Biomass Wind Solar Hydro Biomass
Installed Capacity 5,537 50 2,827 19 17,194 100 2,824 231 On‐Peak Derate 5,264 45 152 0 15,905 90 152 10
EXPECTED ON‐PEAK OUTPUT 273 5 2,676 19 1,289 10 2,673 221
SPP RTO evaluates operational procedures on an ongoing basis to determine if there are available improvements in
efficiencies and reliability. Because of the level of wind resources in the footprint, SPP RTO is investigating the addition of
wind into its automatic security constrained dispatch calculations. This would allow SPP RTO to better manage local
congestion issues where wind is the primary impacting resource. It is anticipated that SPP RTO would then be able to
manage system reliability by quicker and more effective control actions.
Capacity Transactions SPP RTO members reported the following imports and exports for 2013–2022 (SPP‐Table 7). These are Firm contracts that
are backed by Firm transmission and generation.
268 “Current” represents Existing‐Certain and Future‐Planned projections for the 2012 summer (for summer‐peaking assessment areas) or 2012/2013 winter (for winter‐peaking
assessment areas). “Share” represents the share (percent) of total Existing‐Certain and Future‐Planned capacity projected for the peak season.
‐100
100
300
500
700
900
1,100
1,300
2013 2014 2015 2016 2017 2018 2019 2020 2021 2022
MW

SPP
NERC | 2012 Long‐Term Reliability Assessment | November 2012
Page 238 of 335
SPP‐Table 7: Projected Capacity Transactions SPP‐Summer 2013 2014 2015 2016 2017 2018 2019 2020 2021 2022
Expected Imports 0 0 0 0 0 0 0 0 0 0 Firm Imports 2,247 2,408 2,408 2,408 2,458 2,458 2,488 2,488 2,488 2,488
TOTAL IMPORTS 2,247 2,408 2,408 2,408 2,458 2,458 2,488 2,488 2,488 2,488
Expected Exports 50 50 50 50 50 50 50 50 50 50 Firm Exports 2,338 2,307 1,997 1,997 2,067 2,034 2,034 2,034 2,034 2,043
TOTAL EXPORTS 2,388 2,357 2,047 2,047 2,117 2,084 2,084 2,084 2,084 2,093
TOTAL NET CAPACITY TRANSACTIONS ‐141 50 361 361 341 374 404 404 404 395
SPP RTO members and some members of SERC have formed a Reserve Sharing Group. Group members receive contingency
reserve assistance from each other; however, due to the high Reserve Margin in the SPP RTO footprint, group participants
within SPP generally transfer reserves into SERC. Therefore, the group does not require support from generation resources
located outside the SPP RTO region. The SPP RTO’s Operating Reliability Working Group sets the Reserve Sharing Group’s
Minimum Daily Contingency Reserve Requirement. The Reserve Sharing Group maintains a minimum first contingency
reserve equal to the generating capacity of the largest unit scheduled to be on‐line, plus one‐half of the capacity of the
next‐largest generating unit scheduled to be on‐line.
Transmission Appendix II lists the BPS transmission projects SPP RTO has defined as Under Construction, Planned, or Conceptual that are
projected to be in service during the assessment time frame. Existing and projected transmission projects are summarized
below (SPP‐Table 8).
SPP‐Table 8: Existing and Projected Transmission SPP AC (Circuit Miles) DC (Circuit Miles) Total (Circuit Miles)
EXISTING 32,881 0 32,881
Currently Under Construction 638 0 638 Planned ‐ Completed within First Five Years 1,613 0 1,613 Planned ‐ Completed within Second Five Years 180 0 180
2022 TOTAL (UNDER CONSTRUCTION & PLANNED) 35,311 0 35,311
Conceptual ‐ Completed within First Five Years 47 0 47 Conceptual ‐ Completed within Second Five Years 103 0 103
2022 TOTAL (UNDER CONSTRUCTION, PLANNED & CONCEPTUAL) 35,460 0 35,460
There are several significant transmission projects involving upgrades to existing transmission lines for reliability purposes.
In north‐central Oklahoma, 45 miles of 69 kV line will be converted to 138 kV from Cottonwood to Crescent and from
Cashion to Dover. In western Oklahoma, 44 miles of 69 kV from Anadarko to Franklin will be converted to 138 kV. In
southwestern Oklahoma, the 33‐mile Lindsay Flood Tap to Cornville 69 kV line will be converted to138 kV.
In Kansas, there will be a 48‐mile rebuild of a 115 kV line from St John to Medicine Lodge and 32 miles of 138 kV line
from Medicine Lodge to Harper in south‐central Kansas in the first five years of the assessment period. Additionally, in
the last five years of the assessment period, the Kansas entities plan to rebuild the 33‐mile Harper to Clearwater 138
kV line in this same Area. In the north‐central Kansas Area, the 35‐mile Clifton to Knob Hill 115 kV line will also be
rebuilt. Kansas entities plan to rebuild 41 miles of 115 kV from Chapman–Abilene Energy Center to North Street in
north‐central Kansas.
In the Texas panhandle, the 45‐mile 69 kV Potter to Channing line will be converted to 115 kV during the first five
years of the assessment. During the next five years of the assessment period, this line and an additional 35‐mile line to
Dallam is planned for conversion to 230 kV. In east Texas, 33 miles of 69 kV will be converted to 138 kV from
Martinsville to Tempson.
In Missouri, the 34‐mile 161 kV line from Idalia to Poplar Bluff will be rebuilt.
The following projects are considered interregional interconnection‐related projects:
Stegall Project: Add a second 345/230 kV transformer at Stegall. The installation of this transformer requires a 3.3‐
mile tie line between the Stegall 230 kV and 345 kV substation. This project is to address low voltage at Victory Hill in
southwest Nebraska for the loss of the first Stegall 345/230 kV.

SPP
NERC | 2012 Long‐Term Reliability Assessment | November 2012
Page 239 of 335
Gentleman–Cherry County–Holt: This project is a 345 kV multiline project through a large portion of central Nebraska.
The Cherry County–Holt 345 kV line segment is proposed to interconnect with a WAPA 345 kV line. The construction
of this project is driven by reliability needs, economic needs, and the need to meet renewable policies both in
Nebraska and other areas in the SPP footprint.
The SPP RTO has sufficient transmission being constructed to meet the needs of the reported Future‐Planned generation.
Appendix III contains a list of transformers projected to be in service during the assessment period.
Vulnerability Assessment The impact of a long‐term drought in the SPP RTO footprint would result in some loss of generation due to the
unavailability of hydro generation and the loss of generation cooling water supplies. However, it is not anticipated that a
long‐term drought would impact reliability during the assessment period because SPP’s geography is diverse and large
portions of generation are not dependent upon single watersheds.
With the D.C. Circuit Court’s decision to vacate CSAPR in August 2012, that regulation will no longer impact the SPP RTO
footprint. However, the EPA’s MATS regulation could result in generator retirements in the SPP footprint during the
assessment period, and more detailed studies of the localized reliability impact will be conducted in response to official
notifications of these retirements. In addition, there is a need to undertake coordination of outage scheduling around the
compliance dates for new EPA standards, which may result in the need for limited compliance extensions. At this time and
based on information provided to SPP RTO from members in March 2012, there are currently no scheduled long‐term
generator outages that could result in reliability concerns in the SPP RTO footprint.
EPA regulations may reduce the overall capacity margin within the SPP RTO, but some portion of that capacity is expected
to be replaced due to an increase in renewable resources because of Renewable Portfolio Standards and state mandates.
However, the replacement of that capacity with variable renewable technologies then raises reliability concerns of
maintaining adequate frequency response, balancing control, and other reserve requirements. SPP RTO is participating in
various standard development and research projects to determine any new requirements that may be necessary.
The projected level of Demand Response is not expected to have a significant impact on reliability during the next 10 years.
SPP RTO is evaluating the need for further requirements or standards that may be necessary to preserve reliability with
increased levels of distributed, renewable generation such as rooftop solar and wind. The frequency response, balancing
controls, and reserve requirement implications are the concern with these technologies.
SPP RTO is investigating the impact of requiring new variable generation installations to possess dispatch ability controls in
order to allow the variable generation to respond to automatic security constrained dispatch instructions.
The SPP RTO only has one Under‐Voltage Load Shedding program in western Arkansas within the AEP‐West footprint. This
program targets about 186 MW of load shed during peak summer conditions to protect the BPS from under‐voltage events.
The SPP RTO has seven Special Protection Systems that are approved to be in place from 18 months to five years, based on
the reliability need. All SPS requests are reviewed and approved by SPP’s System Protection and Control Working Group,
the Operating Reliability Working Group, and the Transmission Working Group.
SPP RTO has one SPS that was implemented in fall 2011 that is expected to be in service for three years. An automatic
control system (ACS) was implemented to curtail a wind farm output to limit the flow on the MKEC Station–Cudahay line to
90 percent of the line rating under normal conditions. The SPS system would alleviate any overloads in the event of a
system contingency or the failure of the ACS system. This temporary solution will be replaced with a permanent solution
with the construction of a second 115 kV North Judson Large to Spearville line, which would eliminate the single
contingency exposure to overloading the MKEC Station–Cudahay line. No SPS in SPP RTO was installed in place of planned
bulk power transmission facilities.

SPP
NERC | 2012 Long‐Term Reliability Assessment | November 2012
Page 240 of 335
While SPP RTO does not have a planning process in place at this time for catastrophic events, it does assess and study
selected events as required by TPL‐003 and TPL‐004.
SPP RTO expects to implement its Day 2 market for its RTO footprint on March 1, 2014. This market, otherwise known as
the Integrated Marketplace, will centralize unit commitment across 16 Balancing Authority (BA) Areas and consolidate
operations to a single BA, known as the SPP RTO Consolidated Balancing Authority. SPP RTO will provide a five‐minute
security‐constrained economic dispatch in order to provide real‐time balancing activities while also providing centralized
commitment of resources through the end of the operating horizon. It is expected that this structure will better allow SPP
RTO to manage the variability of load and resources and provide additional flexibility in dealing with short‐term reliability
issues.
SPP RTO is also investigating centralizing the data gathering from several Phasor Measurement Units (PMU) systems within
the footprint in order to enhance reliability analysis and situational awareness.
At this time, SPP RTO is in the early stages of investigating appropriate smart grid programs.
On a quarterly basis, SPP RTO reviews several years of SPP RTO Protection System misoperations data looking for trends
that could be used to help reduce the number of misoperations in the future.
In December 2011, the U.S. Court of Appeals issued a stay of CSAPR that allowed SPP RTO staff to conduct a reliability
impact assessment of the EPA MATS and CSAPR regulations (EPA Assessment) in early 2012. That assessment was based on
members’ preliminary expectations of how they currently plan to comply with both the CSAPR and the MATS. The EPA
assessment indicated that for the years 2013 and 2015, outages associated with retrofits, deratings, revised dispatch, and
retirements as a result of members’ current expectations to comply with these regulations does have the potential for
localized reliability violations but should not present footprint‐wide negative reliability implications resulting from the
assumptions used in the EPA’s model.269 Further, SPP analyzed the resource adequacy of the Region based on member EPA
rules compliance expectations and, assuming no other negative circumstances in the SPP RTO footprint, resource adequacy
appears to be sufficient. These conclusions could change if individual entities’ underlying compliance planning changes.
Standing and Emerging Issues Even with the decision to vacate CSAPR, the standing reliability issue that SPP RTO is most concerned about for the 10‐year
assessment period is the impact of the EPA MATS regulation as well as other developing environmental regulations on
reserve margins and localized grid stability. On‐going discussions with SPP RTO and EPA have recognized that ways of
managing retrofits continues to be explored and these are being proactively managed. The SPP Operational Reliability
Working Group has been tasked with oversight of a long‐term outage coordination study to determine the impact of long‐
term outages to facilitate new environmental capture technologies and the expected retirements due to regulations. It is
expected that the impact of these retirements and retrofits will begin to be experienced by 2015. The compressed
compliance time frame provided for MATS will constrain the availability and increase the costs of qualified labor, materials
and heavy equipment. These constraints, as well as the need to coordinate outage scheduling and complete localized
transmission reinforcement projects, will likely demand that the compliance deadlines for certain units be extended. SPP
RTO is maintaining regular contact with individual entities to ensure that any specialized assessments can be completed in
time to identify and address circumstances in which additional time may be warranted. SPP RTO expects to complete an
initial analysis of this issue by the end of 2012.
Capacity margins would be expected to decline throughout the SPP footprint, with at least some replacement capacity
coming in the form of additional wind installations. However, wind as replacement capacity is subject to variability, inertia,
269 The impacts identified in the study for 2013 will no longer be applicable with the CSAPR decision, but SPP RTO believes the MATS regulation will have similar impacts
beginning in 2015 due to the four year compliance timeframe from the December 2011 finalization date of MATS.

SPP
NERC | 2012 Long‐Term Reliability Assessment | November 2012
Page 241 of 335
and dispatch ability concerns. Lower capacity margins increase the exposure of the area to regional events such as those
caused by extreme cold weather, droughts, widespread flooding, etc.
SPP RTO is also concerned about the dispatch ability of wind‐powered resources. SPP RTO has been identified as an area
rich with the hub height winds (the appropriate wind profile needed for the production of wind generation). While
additional wind resources provide positive growth to the SPP RTO capacity margin, they also bring the issues associated
with having a variable fuel supply. Also, without adequate requirements in place, new wind resources will not be equipped
with the necessary primary frequency response, dispatch ability, or adequate voltage regulation controls. SPP RTO is
participating in various forums to understand the implications and necessary actions to provide the appropriate
requirements not just for wind resources, but all new generation technologies. There could be anywhere from 10,000 to
24,000 MW of nameplate wind resources forecast to be built within the SPP Region over the next 10 years. This includes
wind that SPP RTO concludes to be Future‐Planned and Conceptual. SPP’s Integrated Transmission Planning process is
taking into account the additional transmission needs of new wind resources.
Finally, SPP RTO and other affected parties are reviewing studies performed by Clean Line Energy for HVdc lines proposed
to traverse across SPP from west to east. The first project, the Plain and Eastern line, is a 3,500 MW capacity, 700‐mile HVdc
facility that is planned to begin in western Oklahoma and end in western Tennessee.270 The second Clean Line Energy
project, the Grain Belt Express Line, is a 3,500 MW, 700‐mile HVdc facility planned between Kansas and Missouri
SPP and other affected parties are also reviewing studies performed by Tres Amigas for its proposed construction of an
HVdc transmission facility that will link America’s three primary electric transmission grids: the Eastern Interconnect (SPP,
MRO, etc.), the Western Interconnect (WECC) and Texas (ERCOT).271
Both Clean Line Energy projects and the Tres Amigas project are in the planning stages. No Firm in‐service dates are known
for the Clean Line projects, but Tres Amigas expects Phase 1 (750 MW) of its project to be in service by March 2015. As
stated above, SPP has begun the technical evaluation of these projects. Should the proposed facilities be constructed and
placed in service, SPP may be faced with a large number of transmission requests. SPP may not be able to approve all of the
requests until additional transmission facilities are built. However, SPP’s current processes should prevent any reliability
impact to the BES.
270 http://www.plainsandeasterncleanline.com/site/home 271 http://tresamigasllc.com/index.php

WECC
NERC | 2012 Long‐Term Reliability Assessment | November 2012
Page 242 of 335
WECC Planning Reserve Margins The Planning Reserve Margins, or target margins, were derived using the 2013 load forecast and the same method as the
2011 Power Supply Assessment (PSA).272 The PSA uses a building block method for developing the Planning Reserve
Margins and has four elements:
Contingency reserves
Operating reserves
Reserves for forced outages
Reserves for one‐year‐in‐ten weather events
By the summer of 2022, the difference between WECC’s Anticipated Resources (194,401 MW) and WECC’s Net Internal
Demand (168,973 MW) is anticipated to be 25,429 MW (15.0 percent margin). This would be 759 MW above the target
margin. Since the expected capacity resources result in margins that exceed target margins, it is reasonable to assume that
only a portion of the reported resource additions will ultimately enter commercial service within the planning horizon.
WECC does not have an interconnection‐wide formal Planning Reserve Margin standard. As previously mentioned, the
WECC annual PSA summer and winter reserve target margins are developed using a building block method.
As depicted in the subregional tables, found at the end of the WECC section, the Anticipated, Prospective, and Adjusted
Potential Reserve Margins for the WECC Assessment Area remain above NERC Reference Margin Level throughout the
2013–2022 planning horizon. However, individual subregions do drop below the target in future years.
NERC’s assessment process treats Demand Response (DR) programs as sharable between Load‐Serving Entities (LSE),
Balancing Authorities (BA), and subregions. However, DR programs in WECC generally have limitations, such as having a
limited number of times they can be called. Some can only be called during a declared local emergency. Consequently,
Planning Reserve Margins may be overstated, as these margins do not consider the potential unavailability of DR for
external energy emergencies. Many LSEs within WECC largely treat DR as a safety net that is available if circumstances such
as unexpected generator‐forced outages or extreme temperature events result in unexpected low operating margins.
In the resource adequacy process, each BA is responsible for complying with the resource adequacy requirements of the
state or provincial areas in which they operate. Some BAs perform resource adequacy studies as part of their Integrated
Resource Plans, which usually provide a 20‐year outlook. Other BAs perform resource adequacy studies that focus on the
very short‐term (1‐2 years), but most projections provide at least a 10‐year outlook. WECC’s PSA uses a study period of 10
years and uses the same zonal reserve target margins throughout the entire period. These target margins are applied as the
NERC Reference Margin Level for each WECC subregion.
Similar to WECC’s PSA, resources that are energy‐only or energy‐limited resources (e.g., the portion of wind resources that
is not projected to provide generation at the time of peak) are not counted toward meeting resource adequacy in this
assessment. Also, resources such as distributed or behind‐the‐meter generation that are not monitored by the BA’s energy
management systems are excluded from the resource adequacy calculation.
Demand Total Internal Demand for the summer, the peak season for the entire WECC Assessment Area, decreased by 0.8 percent
from 2010 to 2011. Summer temperatures in both 2010 and 2011 were normal to slightly warmer than normal which
indicates actual demand reduction is associated with the continued slow economic recovery. The projected 2013 and 2022
Total Internal Demand forecasts and compound annual growth rates are presented in the following tables.
272WECC's Power Supply Assessment: http://www.wecc.biz/Planning/ResourceAdequacy/PSA/Documents/Forms/AllItems.aspx.

WECC
NERC | 2012 Long‐Term Reliability Assessment | November 2012
Page 243 of 335
Demand Outlook – WECC Total WECC‐Total‐Summer 2013 2022 10‐Year Change CAGR
NET INTERNAL DEMAND 144,936 168,973 24,036 16.6% 1.72%
Load‐Modifying Demand Response 5,041 5,583 542 10.8% 1.14%
TOTAL INTERNAL DEMAND 149,977 174,556 24,578 16.4% 1.70%
WECC‐Total‐Winter 2013/14 2022/23 10‐Year Change CAGR
NET INTERNAL DEMAND 132,006 150,429 18,423 14.0% 1.46%
Load‐Modifying Demand Response 2,018 2,385 367 18.2% 1.87%
TOTAL INTERNAL DEMAND 134,024 152,814 18,790 14.0% 1.47%
The Total Internal Demand for the summer season is projected to increase by 1.7 percent per year for the 2013–2022
timeframe, which is unchanged from the 1.7 percent projected last year for the 2012–2021 period. The annual energy load
is projected to increase by 1.6 percent per year for the 2013–2022 timeframe, which is unchanged from the 1.6 percent
projected last year for the 2012–2021 period.
Demand-Side Management The total WECC internal demand forecast includes summer DR that varies from 5,041 MW in 2013 to 5,583 MW in 2022.
The direct control DSM capability is located mostly in the CALN and CALS subregions, totaling 2,812 MW in 2013 and 3,131
MW in 2022, but DSM programs in other subregions are also increasing. The most prevalent DR programs in WECC involve
air conditioner cycling as well as interruptible load programs that focus on the demand of large water pumping operations
and large industrial operations such as mining. The most significant current DR development activity within WECC is
occurring in California where the California ISO (CISO) is actively engaged with stakeholders in developing viable wholesale
DR products with direct market participation capability. Also of note is the CISO’s new DR product implementation that
facilitates the participation of existing retail demand programs in the CISO market. Further information regarding these
initiatives is available at the CISO website.273
Projected Demand‐Side Management – WECC Total Short‐Term
2022 Share of Total Internal Demand
WECC‐Total‐Summer 2013 2014 2015 2022 10‐Year Change
Direct Control Load Management (DCLM) 2,023 2,103 2,125 2,144 121 1.12% Contractually Interruptible (Curtailable) 1,836 1,923 1,971 2,023 187 1.06% Critical Peak‐Pricing (CPP) with Control 7 12 13 16 9 0.01% Load as a Capacity Resource 1,175 1,099 1,115 1,400 225 0.73%
TOTAL LOAD‐MODIFYING DEMAND RESPONSE 5,041 5,137 5,224 5,583 542 2.92%
TOTAL ENERGY EFFICIENCY 1,150 1,749 2,418 6,859 5,709 3.59%
TOTAL DEMAND‐SIDE MANAGEMENT 6,191 6,886 7,642 12,442 6,251 6.51%
Generation The generation data for this assessment was provided by all of the BAs within the Western Interconnection and was
processed by WECC staff under the direction of the WECC Loads and Resources Subcommittee (LRS). The reported
generation additions generally reflect extractions from generation queues.
Distributed generation, including rooftop solar and behind‐the‐meter generation, represents an insignificant portion of
both the existing and planned resources. As noted previously, these resources are excluded from the resource adequacy
calculation (i.e., they are not included as resources). The current resource mix by fuel type includes natural gas, hydro‐
powered, and coal‐fired generation at 87,769 MW, 61,439 MW, and 35,069 MW, respectively.
Since last year’s assessment, expected available capacity increased by 363 MW. Thermal plant additions were largely gas‐
fired combined‐cycle plants, while renewable additions were largely wind farms.
273CAISO Demand Response Initiatives: http://www.caiso.com/1893/1893e350393b0.html.

WECC
NERC | 2012 Long‐Term Reliability Assessment | November 2012
Page 244 of 335
Capacity Outlook– WECC‐US274 Current 2022 Planned 2022 Planned & Conceptual
WECC‐US‐Summer Capacity Share Capacity Share Change Capacity Share Change
Coal 29,333 17.9% 28,188 16.1% ‐1,145 28,188 15.3% ‐1,145 Petroleum 1,084 0.7% 1,084 0.6% 0 1,004 0.5% ‐80 Gas 79,303 48.5% 85,055 48.4% 5,752 91,811 49.8% 12,508 Nuclear 9,553 5.8% 9,553 5.4% 0 9,553 5.2% 0 Other/Unknown 52 0.0% 52 0.0% 0 52 0.0% 0 Renewables 44,229 27.0% 51,655 29.4% 7,426 53,615 29.1% 9,386
TOTAL 163,553 100.0% 175,586 100.0% 12,033 184,222 100.0% 20,669
Capacity Outlook– WECC‐CAN275,276 Current 2022/23 Planned 2022/23 Planned & Conceptual
WECC‐CAN‐Winter Capacity
Mix Share of
Total Capacity
Mix Share of
Total Change Capacity
Mix Share of
Total Change
Coal 5,811 21.6% 6,655 19.4% 844 6,655 18.4% 844 Petroleum 0 0.0% 0 0.0% 0 0 0.0% 0 Gas 6,794 25.2% 8,904 26.0% 2,110 10,781 29.9% 3,988 Nuclear 0 0.0% 0 0.0% 0 0 0.0% 0 Other/Unknown 22 0.1% 26 0.1% 4 26 0.1% 4 Renewables 14,282 53.1% 18,653 54.5% 4,371 18,653 51.6% 4,371
TOTAL 26,909 100.0% 34,238 100.0% 7,329 36,115 100.0% 9,206
Gross Future‐Planned additions are 12,033 MW for the United States, and 7,329 MW for Canada. Conceptual additions
amount to 20,669 MW and 9,206 MW for the United States and Canada, respectively.
Three utilities attributed coal‐fired plant retirements totaling 1,050 MW and fuel conversions totaling 295 MW to existing
air emissions regulations. Based on information related to western coal‐fired plant environmental regulation cost
274 “Current” represents Existing‐Certain and Future‐Planned projections for the 2012 summer (for summer‐peaking assessment areas) or 2012/2013 winter (for winter‐peaking
assessment areas). “Share” represents the share (percent) of total Existing‐Certain and Future‐Planned capacity projected for the peak season. 275 Ibid. 276
Years represent initial year for each winter season. For example: 2013 represents the 2013/2014 winter season.
‐2,000
0
2,000
4,000
6,000
8,000
10,000
12,000
14,000
16,000
2013 2014 2015 2016 2017 2018 2019 2020 2021 2022
MW
0
1,500
3,000
4,500
6,000
7,500
9,000
10,500
2013 2014 2015 2016 2017 2018 2019 2020 2021 2022
MW

WECC
NERC | 2012 Long‐Term Reliability Assessment | November 2012
Page 245 of 335
exposure,277 it is expected that next year’s LTRA information will report additional retirements and fuel conversion as more
plant owners establish their preferred approaches to address the recent Maximum Achievable Control Technology
regulations. Due to the somewhat fluid situation in California regarding retirements associated with once‐through cooling
(OTC) regulations, potential associated capacity reductions have not been reported for this year’s LTRA. Current
information regarding the California OTC is available on the California Energy Commission’s website.278
It is expected that the WECC Region will not experience significant resource capability changes due to plant rating changes,
plants being temporarily removed from service, new “non‐traditional” resource acquisitions, or changes in behind‐the‐
meter generation.
The projected summer peak‐period Existing‐Certain and Future‐Other resources value 2013 of 182,873 MW reflects the
monthly shaping of variable generation and the seasonal ratings of conventional resources. The resources not counted
toward on‐peak capacity include 45,791 MW of variable generation derates and 10,264 MW of scheduled outages. Hydro
derates reflect an assumed adverse hydro condition and is dispatched economically limited to a specified annual energy
output. Wind derates are based on wind capability curves created using three years’ worth of one‐hour interval wind speed
data while solar production curves were created using two years of solar insolation data.
The individual BAs report the net Future‐Planned Capacity Resources projected to be placed into service by the end of this
assessment period as 19,361 MW.Greater wind generation has resulted in an increased fluctuation in instantaneous
generation and a need for increased operating reserves to compensate for the wind‐induced fluctuations. Improved wind
forecasting procedures and reduced scheduling intervals have only partially addressed the issue. Increased wind generation
has also exacerbated high generation issues in the Bonneville Power Administration (BPA) Area during light load and high
hydro‐electric generation conditions. BPA is working on long‐term solutions to this issue and makes current information
regarding the issue available on its website.279 Increased wind penetration is expected to exacerbate the operating reserve
situation.
277 Environmental Controls and the WECC Coal Fleet:
http://www.wecc.biz/committees/BOD/TEPPC/TAS/SWG/10March2011/Lists/Minutes/1/WGG_Coal_Plant_Database_Documentation_Final.pdf. 278 CEC Once‐Through Cooling: http://www.energy.ca.gov/siting/once_through_cooling.html. 279 BPA Wind Activities http://transmission.bpa.gov/wind/.
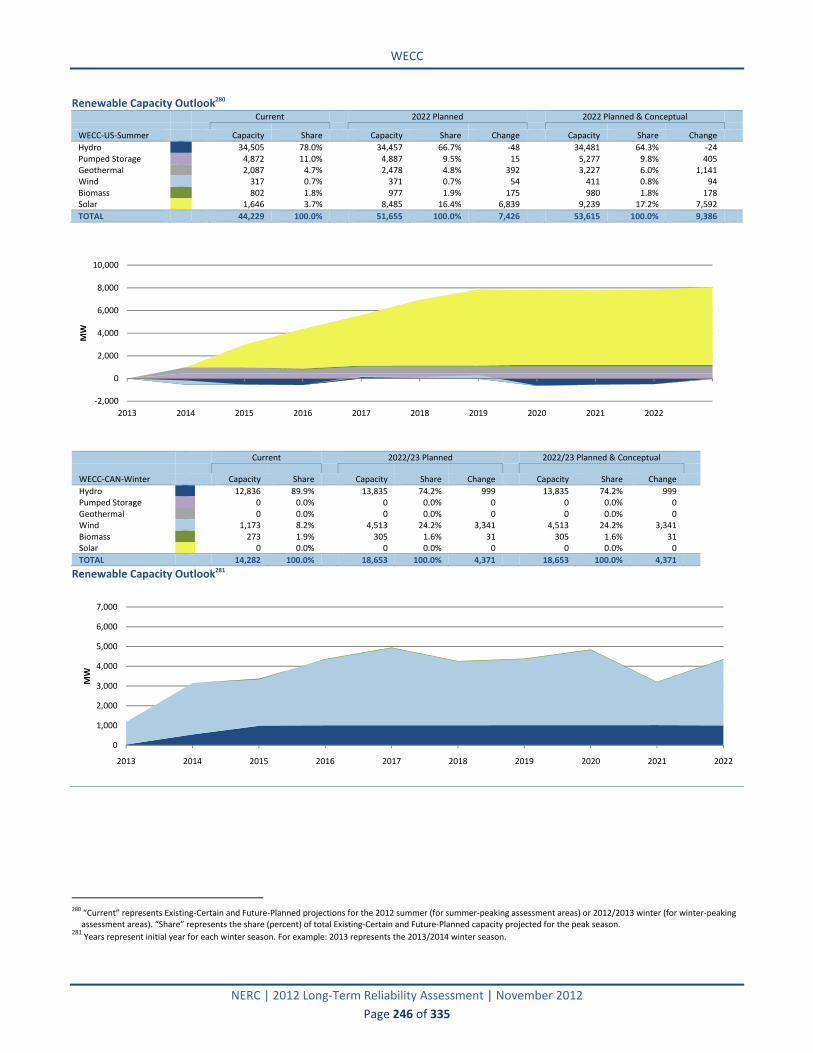
WECC
NERC | 2012 Long‐Term Reliability Assessment | November 2012
Page 246 of 335
Renewable Capacity Outlook280 Current 2022 Planned 2022 Planned & Conceptual
WECC‐US‐Summer Capacity Share Capacity Share Change Capacity Share Change
Hydro 34,505 78.0% 34,457 66.7% ‐48 34,481 64.3% ‐24 Pumped Storage 4,872 11.0% 4,887 9.5% 15 5,277 9.8% 405 Geothermal 2,087 4.7% 2,478 4.8% 392 3,227 6.0% 1,141 Wind 317 0.7% 371 0.7% 54 411 0.8% 94 Biomass 802 1.8% 977 1.9% 175 980 1.8% 178 Solar 1,646 3.7% 8,485 16.4% 6,839 9,239 17.2% 7,592
TOTAL 44,229 100.0% 51,655 100.0% 7,426 53,615 100.0% 9,386
Current 2022/23 Planned 2022/23 Planned & Conceptual
WECC‐CAN‐Winter Capacity Share Capacity Share Change Capacity Share Change
Hydro 12,836 89.9% 13,835 74.2% 999 13,835 74.2% 999 Pumped Storage 0 0.0% 0 0.0% 0 0 0.0% 0 Geothermal 0 0.0% 0 0.0% 0 0 0.0% 0 Wind 1,173 8.2% 4,513 24.2% 3,341 4,513 24.2% 3,341 Biomass 273 1.9% 305 1.6% 31 305 1.6% 31 Solar 0 0.0% 0 0.0% 0 0 0.0% 0
TOTAL 14,282 100.0% 18,653 100.0% 4,371 18,653 100.0% 4,371
Renewable Capacity Outlook281
280 “Current” represents Existing‐Certain and Future‐Planned projections for the 2012 summer (for summer‐peaking assessment areas) or 2012/2013 winter (for winter‐peaking
assessment areas). “Share” represents the share (percent) of total Existing‐Certain and Future‐Planned capacity projected for the peak season. 281
Years represent initial year for each winter season. For example: 2013 represents the 2013/2014 winter season.
‐2,000
0
2,000
4,000
6,000
8,000
10,000
2013 2014 2015 2016 2017 2018 2019 2020 2021 2022
MW
0
1,000
2,000
3,000
4,000
5,000
6,000
7,000
2013 2014 2015 2016 2017 2018 2019 2020 2021 2022
MW

WECC
NERC | 2012 Long‐Term Reliability Assessment | November 2012
Page 247 of 335
WECC‐Total‐Table 8: Renewable Capacity Outlook: On‐Peak Vs. Installed Current 2022 Planned
WECC‐TotalL‐Summer Wind Solar Hydro Biomass Wind Solar Hydro Biomass
Installed Capacity 17,249 2,725 66,984 1,944 30,649 15,738 69,032 3,287 On‐Peak Derate 16,893 1,079 19,969 872 29,511 6,144 20,574 2,029
EXPECTED ON‐PEAK OUTPUT 356 1,646 47,016 1,072 1,138 9,595 48,458 1,257
Capacity Transactions WECC does not rely on imports from outside the Assessment Area when calculating peak demand reliability margins. The
Assessment Area also does not model exports to areas outside of WECC. However, imports may be scheduled across three
back‐to‐back dc ties with the Southwest Power Pool, Inc. (SPP) and five back‐to‐back dc ties with the Midwest Reliability
Organization (MRO). One WECC entity reports a 101 MW diversity exchange credit with its counterpart in SPP, but this
exchange is not reflected in this assessment. WECC does not model “emergency generation” as being available to meet the
NERC Reference Margin Level.
Inter‐subregional transfers are derived from resource allocation computer simulations that incorporate transmission
constraints among various path‐constrained zones within WECC. The WECC resource allocation model places conservative
transmission limits on paths between 20 load groupings (bubbles) when calculating the transfers between these areas.
These load bubbles were developed for WECC’s PSA studies. The aggregation of PSA load bubbles into WECC subregions
may obscure differences in adequacy or deliverability between bubbles within the subregion. Hence, the resource data for
the individual subregions include transfers between subregions that are either plant‐contingent transfers or reflect
projected economic transfers with a high probability of occurrence. The plant‐contingent transfers represent both
joint‐plant ownership and plant‐specific transfers from one subregion to another.
The projected economic transfers reflect the potential use of seasonal demand diversity between the winter‐peaking
northwest and the summer‐peaking southwest, as well as other economy and short‐term Firm purchases that may occur
between subregions.
Despite the fact that these transactions may not be contracted, they reflect a reasonable modeling expectation given the
history and extensive activity of the western markets, as well as the otherwise underused transmission from the northwest
to the other subregions. When using the adjusted potential resource mixes, all of the subregions are able to maintain
adequate reserves.
A process similar to the one used to determine regional and subregional target margins was used to determine the
inter‐subregional transfers. The various area bubbles used were combined into the appropriate WECC subregions, and the
excess or deficit capacity was summed for each of the WECC subregions. The excess or deficit capacity was then used to
calculate the amount of projected purchases or projected sales transactions between the various subregions.
Western entities participate in shorter‐term power markets for which forecasts are not available. This is a primary reason
the WECC analysis uses the simulation process described above to determine the projected transfer values. The Western
Systems Power Pool contract, which contains liquidated damage provisions, is heavily relied upon as the template for such
transactions.
Transmission WECC is spread over a wide geographic area with significant distances between generation and load centers. In addition,
the northern portion of the Assessment Area is winter peaking, while the southern portion of the assessment area is
summer‐peaking. Consequently, entities within the Western Interconnection may seasonally exchange significant amounts
of surplus electric energy. These conditions result in periodic full loading on numerous transmission lines, but that full
loading is deemed not to adversely impact reliability. Due to the inter‐subregional transmission constraints, reliability in the
Western Interconnection is best examined at a subregional level.

WECC
NERC | 2012 Long‐Term Reliability Assessment | November 2012
Page 248 of 335
AC transmission line additions through 2022 have been reported at 15,841 circuit miles and 535 circuit miles of DC
transmission. The reported existing and projected transmission additions are compiled in the following table (WECC‐Total‐
Table 8).
WECC‐Total‐Table 8: Existing and Projected Transmission WECC‐Total AC (Circuit Miles) DC (Circuit Miles) Total (Circuit Miles)
EXISTING 127,019 1,744 128,763
Currently Under Construction 199 0 199 Planned ‐ Completed within First Five Years 5,784 535 6,319 Planned ‐ Completed within Second Five Years 4,501 0 4,501
2022 TOTAL (UNDER CONSTRUCTION & PLANNED) 137,503 2,279 139,782
Conceptual ‐ Completed within First Five Years 2,759 0 2,759 Conceptual ‐ Completed within Second Five Years 2,598 0 2,598
2022 TOTAL (UNDER CONSTRUCTION, PLANNED & CONCEPTUAL) 142,860 2,279 145,139
There are a large number of transmission projects that have been reported to WECC. Some of these projects are duplicative
in nature and may have a proposed path similar to another project. Since WECC does not vet the reported new projects and
does not identify minimum transmission addition needs, the above tabulation may not closely reflect transmission
additions that could occur during the assessment period. A delay of these projects could impact the timing and location of
resource additions but should not adversely impact system reliability. The subregion sections of this assessment may
identify some projects that could impact local area reliability. The WECC Transmission Project Information Portal282 provides
a single location where interested parties can find basic information about major transmission projects in the Western
Interconnection.
WECC’s Transmission Expansion Planning Policy Committee’s (TEPPC) Subregional Coordination Group has analyzed the
development status of reported major transmission projects and identified 30 projects that have a high probability of being
in service by 2022. Information regarding the projects is available in the group’s report 2022 Common Case Transmission
Assumptions (CCTA).283
To help monitor the impact of new generation resources on the transmission systems, individual entities within the
Western Interconnection have established generator interconnection requirements that include power flow and stability
studies to identify any adverse impact from proposed projects. In addition, WECC has established a review procedure that is
applied to larger transmission projects that may impact the interconnected system. The details of this review procedure are
located in WECC’s Policies and Procedures for Project Coordination Review, Project Rating Review, and Progress Reports.284
These processes identify potential deliverability issues that may result in actions such as the implementation of system
protection schemes designed to enhance deliverability and to mitigate possible adverse power system conditions.
WECC has signed an agreement with the U.S. Department of Energy to receive a $53.9 million grant for the Western
Interconnection Synchrophasor Program (WISP). The funding allows an accelerated installation of more than 250 new
Phasor Measurement Units (PMUs) in the Western Interconnection. The PMUs are designed to alert operators to existing
and potential problems on the grid and improve the ability to integrate and manage intermittent renewable resources in
the west. The synchrophasor infrastructure and associated software applications and tools are expected to improve
situational awareness, system‐wide modeling, performance analysis, and wide‐area monitoring and controls. Further
information regarding the WISP program is available on the WECC website.285
Growth in demand combined with increases in projected new generation has resulted in the need for significant
transmission system upgrades and expansion. Because of the longer lead time required for transmission permitting and
282WECC Transmission Project Information Portal: http://www.wecc.biz/PLANNING/TRANSMISSIONEXPANSION/MAP/Pages/. 2832022 Common Case Transmission Assumptions (CCTA): http://www.wecc.biz/committees/BOD/TEPPC/External/SCG_CCTA_Report.pdf. 284WECC’s Overview of Policies and Procedures for Project Coordination Review, Project Rating Review and Progress Reports:
http://www.wecc.biz/committees/StandingCommittees/PCC/Shared%20Documents/ProjectCoordination_ProjectRating_ProgressReports_approved%203‐11.aspx. 285WECC WISP web site: http://www.wecc.biz/awareness/Pages/WISP.aspx.

WECC
NERC | 2012 Long‐Term Reliability Assessment | November 2012
Page 249 of 335
construction, network planning focuses on establishing a flexible grid infrastructure. This is being done with the goal of
accommodating internal power movement from generation sources to load centers.
Planning efforts continue on a number of major system reinforcements, including supply into the Fort Saskatchewan and
Fort McMurray Areas of northeast Alberta. This reinforcement will likely be a combination of 500 kV and 240 kV
developments. Planning efforts are also continuing on reinforcing the main north‐south transmission grid in Alberta. The
Edmonton–Calgary Transmission Reinforcement project calls for two high‐capacity lines between the north and south of
the province to reinforce the backbone of the grid. It is anticipated that this project will be in‐service by the end of 2014.
Alberta Electric System Operator (AESO) has an Under‐Voltage Load Shedding (UVLS) scheme. There are approximately 300
MW of load currently connected to the UVLS. Activation of the scheme is not expected to adversely impact other load
within the AESO subregion.
A Calgary‐Area transmission must‐run procedure addresses 240 kV transmission grid‐loading issues and ensures voltage
stability margins are maintained. The transmission must‐run procedure is an ancillary service contract with generators that
is required to address contingencies in areas of inadequate transmission to help provide voltage support to the
transmission system in southern Alberta (near Calgary) and assist in maintaining overall system security.
Transmission owners in the subregion have started construction on significant grid reinforcements and enhancements to
support intra‐regional power transfers and exports of wind generation.
Power flow studies have been conducted by the transmission planning authorities, and in some cases where there have
been critical contingencies identified, mitigation measures (e.g., adding reactive sources) or new facilities (e.g., adding a
new transformer) have been proposed. Because some of these improvements are driven by future load growth or requests
not yet firmed up by the customers, some of these measures have not yet escalated to the project level, and no specific
date for their completion has been assigned.
Because of the longer time required for transmission permitting and construction, it is recognized that network planning
should focus on establishing a flexible grid infrastructure. This is being done with the goal of accommodating internal power
movement from generation sites to load centers.
Analysis of WECC’s 2011 PSA results indicates that economic diversity exchanges may result in full loading of the
transmission interconnections between the United States and Canadian portions of the NWPP during winter peak periods.
British Columbia (WECC‐BC) is traditionally a net exporter with projected exports expected to remain relatively constant
throughout the study period.
The WECC‐BC subregion relies on hydro‐electric generation for 90 percent of its energy production. British Columbia Hydro
and Power Authority (BCHA) is responsible for the planning, operation, and maintenance of British Columbia’s
publicly‐owned transmission system. BCHA is addressing constraints between remote hydro plants and the Lower Mainland
(LM) and Vancouver Island (VI) load centers.
A key transmission constraint in the WECC‐BC subregion is the Interior‐to‐Lower Mainline (IML) path. The ILM Transmission
Project286 is the province’s largest expansion project in 30 years. In August 2008, the British Columbia Utility Commission
approved the ILM Project, which is a new 500 kV line between the Nicola and Meridian substations, with a projected
in‐service date in 2014.
BCHA is planning to rely on the existing 905 MW conventional steam plant located in the major load center and the 1,250
MW Canadian entitlement from the Northwestern United States (WECC‐NWPP) to meet the Lower Mainland resource
requirements in the interim period.
286Interior to Lower Mainland (ILM) Transmission Project: http://www.bchydro.com/energy_in_bc/projects/ilm.html.
WECC
NERC | 2012 Long‐Term Reliability Assessment | November 2012
Page 250 of 335
BCHA has UVLS schemes installed for the LM and V I systems to prevent voltage collapse. These schemes monitor the
voltage at the key substations in LM and VI a and the Var reserves at VI transmission synchronous condensers and Burrard
Generation Station. If the voltages and the Var reserves are lower than the settings, the selected loads in LM and VI will be
removed from service. The maximum load‐shedding amount is about 1,690 MW. At this time, BCHA does not anticipate the
installation of any additional UVLS schemes.
The 500 kV bulk transmission systems in northern California consist of three parallel 500 kV lines that traverse the state
from the California–Oregon border in the north and continue south to the Vincent substation in southern California. This
system transfers power between California and other states in the northwest. The interconnection at the northern end is
identified as Path 66, or the California–Oregon Intertie. The system also interconnects with northern California hydro‐
electric generation for delivery to population centers in the San Francisco Bay Area and the Central Valley Area. Further
south, the 500 kV lines interconnect with a large number of generation resources in central California. At the Vincent
substation, the 500 kV lines interconnect with the Southern California Edison (SCE) 500 kV transmission system. That
interconnection point is identified as Path 26.
The Reliability Assessment section of the CISO’s 2011–2012 Transmission Plan287 examined power flow studies, transient
stability analysis, and voltage stability studies to identify facilities that indicate the potential of not meeting applicable
performance requirements. For the backbone system assessment (500 kV and select 230 kV facilities), conventional and
governor power flow studies and stability studies were performed to evaluate the system performance under normal
conditions and following the contingencies of power system equipment of voltage levels 230 kV and above. For the local
area non‐simultaneous assessments, conventional and governor power flow studies were performed under normal system
conditions and contingency system conditions of power system equipment of voltage levels 60 kV through 230 kV. These
assessments were performed for eight local Pacific Gas & Electric Company service territory areas.
The California‐South (CALS) subregion is connected to the California‐North subregion by three 500 kV transmission lines.
Additional California‐South interconnections include a 500 kV dc transmission line to north‐central Oregon, a 500 kV dc
transmission line to the Intermountain Power Plant in central Utah, a few 230 kV ties to Baja California, Mexico, and
numerous 500 kV and lower voltage ties to Arizona and southern Nevada. These numerous interconnections allow the
subregion to be a net importer of significant amounts of power. As discussed in the California‐North transmission
assessment narrative, the CISO prepares an annual transmission plan. That plan addresses San Diego Gas & Electric
Company’s (SDG&E) service territory and seven local SCE service territory areas. In June, SDG&E placed into service a new
500 kV transmission line linking San Diego and Imperial Valley. The line, initially rated at 800 MW, will help support the
CALS Area during the San Onofre nuclear plant outage. Ultimately, the line will support the transfer of up to 1,000 MW of
power from the renewable‐rich Imperial Valley Area.
Transmission providers from the Desert Southwest subregion, along with other stakeholders from southern California, are
actively engaged in the Southwest Transmission Expansion Planning (STEP) group. The goal of this group is to collaborate in
the planning, coordination, and implementation of a robust transmission system interconnecting Arizona, southern Nevada,
Mexico, and southern California that is capable of supporting a competitive, efficient, and seamless west‐wide wholesale
electricity market while meeting established reliability standards. The STEP group has developed three projects resulting
from the study efforts to upgrade the transmission path from Arizona to southern California and southern Nevada. The
three projects will increase the transmission path capability by about 3,000 MW. The first set of upgrades was completed in
2006 and increased the transfer capacity by 505 MW. The second set of upgrades will increase the transfer capacity by
1,245 MW, and many of the upgrades have been completed. The final set of upgrades is the Palo Verde–Devers #2 500 kV
transmission line (PVD2) addition. The final set of upgrades encountered complications in 2007 with the Arizona
Corporation Commission’s refusal to grant a permit for the construction of the PVD2 line. In May 2009, SCE dropped the
287 CISO 2011‐2012 Transmission Plan: http://www.caiso.com/Documents/Board‐approvedISO2011‐2012‐TransmissionPlan.pdf.
WECC
NERC | 2012 Long‐Term Reliability Assessment | November 2012
Page 251 of 335
Arizona portion of the proposed line and announced that it would proceed to construct the California portion. During the
years that the line has been proposed, the resource situation changed drastically, and SCE now believes that the California
portion of the line is useful for central station solar projects being planned for the eastern portion of the state.288
For the Northwest subregion, additional time required for transmission permitting and construction requires recognition
that network planners should focus on establishing a flexible interconnected transmission infrastructure. This is being
accomplished with the goals of accommodating anticipated transfers among systems, addressing several areas of constraint
within Washington, Oregon, Montana, northern Idaho, and other areas within the Assessment Area, and integrating new
generation. Projects at various stages of planning and implementation include approximately 758 miles of 500 kV
transmission lines.
Maintaining the capability to import power into the Northwest subregion during infrequent extreme cold weather periods
continues to be an important component of transmission planning and operations. Under certain transmission system
outage conditions, the Northwest subregion depends on an automatic Under‐Frequency Load Shedding (UFLS) scheme to
support maximum import transfer capabilities.
Some BAs have taken steps to help make the transmission queue assessment processes more efficient. For example, BPA
instituted a process called the Network Open Season (NOS) for allowing resources placement in its transmission queue.
Under the NOS, those seeking transmission capacity are asked to sign Precedent Transmission Service Agreements (PTSA)
that commit them to taking service at a specified time and under specified terms. At one time, BPA’s transmission queue
was over 18,000 MW. After the first phase of the 2008 NOS, there were 6,410 MW worth of transmission requests made
and PTSAs signed by customers. The PSTA contract is still contingent on BPA’s ability to offer new service at its embedded
cost rate and is subject to BPA’s completion of the required environmental work prior to construction of new facilities.
Tri‐State Generation and Transmission is proposing a project in southern Colorado called the San Luis Valley Electric System
Improvement project. The project would involve the construction of an 80‐mile 230 kV transmission line between the
Walsenburg substation and the San Luis Valley substation. The San Luis Valley’s existing electrical system has reached its
limit due to continued residential and irrigation growth. One major concern is that the radial nature of the existing 230 kV
transmission system does not provide the reliability benefits of redundant service. The other major problem currently
experienced on the transmission system is a drop in voltage that occurs when the load on the electric system in the valley is
above 65 MW. This line will provide the power delivery infrastructure to increase the reliability and capacity of the existing
transmission system and support proposed renewable energy development in the area.
The Western Area Power Administration (WAPA) is upgrading several 115 kV transmission lines to 230 kV over the next
several years to increase transfer capabilities and help maintain the operating transfer capability between southeastern
Wyoming and northeastern Colorado.
There were no significant transmission additions in the WECC‐Mexico subregion.
Vulnerability Assessment Hydro systems within the Western Interconnection are exposed to drought conditions that may adversely impact electric
power generation. The adverse impact includes both reduced energy generation and reduced operating flexibility in
maximizing generation during high‐peak demand periods. However, since the bulk of the river flows are driven by snowfall,
system operators have sufficient time to prepare operational plans consistent with seasonal river runoff forecasts.
Due to the strength of the interconnected power grid, WECC has not experienced significant reliability issues related to
long‐term generator outages, and possible future long‐term plant outages are not a concern relative to long‐term reliability
planning.
288Palo Verde‐Devers: http://www.cpuc.ca.gov/environment/info/aspen/dpv2/dpv2.htm.

WECC
NERC | 2012 Long‐Term Reliability Assessment | November 2012
Page 252 of 335
Renewable Portfolio Standards (RPS) have resulted in significant increases in installed wind‐powered generation and
planned wind and solar generation additions. WECC’s TEPPC is actively evaluating long‐term regional transmission needs
that factor in the expanding role of these variable generation resources. Further information regarding that work is
available on the WECC website.289
Due to limited size and program design, a lack of DR action during activation events has not been an issue and, due to the
limited growth in such programs, is generally not expected to be a significant issue during the assessment period. It should
be noted, however, that the CISO is actively engaging stakeholders in developing viable wholesale DR products with direct
market participation capability. The CISO’s website presents current information about its Demand Response initiative.290
Distributed generation has historically not been a significant resource in WECC. While the Assessment Area has experienced
an increase in distributed solar generation, any associated impact has been essentially limited to the local power
distribution facilities, and further expansion of solar‐distributed generation is not expected to significantly impact the
interconnected power system.
As noted in the preceding RPS discussion, entities within the Assessment Area are addressing long‐term transmission
effects related to increased variable generation. It is expected that processes to address other operational issues, such as
over‐generation during light load periods, will be addressed by affected entities on a when‐needed and where‐needed basis
(e.g., Bonneville Power Administration’s over‐generation issue).291
After the July 2 and August 10, 1996 disturbances that caused cascading outages of transmission and generation and a
widespread loss of customer load within WECC, the technical groups evaluating those events recommended a number of
action items to enhance interconnected system reliability. One of those action items was that WECC member systems
should evaluate the need for UVLS and report to WECC regarding the implementation of UVLS on their individual systems.
Other documents supporting the call for UVLS studies were the NERC report “Survey of Voltage Collapse Phenomenon
(August 1991),” the NERC Planning Standards (approved September 1997) and the WECC “Policy Regarding Extreme
Contingencies and Unplanned Events”.292 The WECC policy in particular places strong emphasis on the application of Safety
Nets to protect the system from unplanned events outside the performance levels defined under the WECC Reliability
Criteria. UVLS is one of the Safety Net schemes identified under the WECC policy.
To assist member systems on how to perform UVLS studies to comply with the WECC mandate, the Technical Studies
Subcommittee (TSS) formed an Under‐Voltage Load Shedding Task Force (UVLSTF) with a direction to:
Develop guidelines for the member systems to determine if they would benefit from UVLS either as a Remedial Action
Scheme or as a Safety Net
Prepare application guidelines to design UVLS systems
Develop methodologies to study and implement UVLS
WECC addressed the UVLS issue in the “Under‐Voltage Load Shedding Guidelines” document approved by WECC’s Technical
Studies Subcommittee April 28, 2010.293
The power transfer capabilities of most major subregion transmission interconnections within WECC are limited by system
stability constraints rather than by thermal limitations. These stability constraints are sensitive to system conditions and
may often be increased significantly at nominal cost by applying SPS or remedial action scheme. The future use of such
289WECC Regional Transmission Expansion Planning: http://www.wecc.biz/Planning/TransmissionExpansion/RTEP/Pages/default.aspx. 290California ISO ‐ Demand Response Initiative: http://www.caiso.com/1893/1893e350393b0.html. 291BPA Wind Activities: http://transmission.bpa.gov/wind/. 292Approved October 1997; see Appendix C. 293WECC Undervoltage Load Shedding Guidelines
http://www.wecc.biz/library/Documentation%20Categorization%20Files/Guidelines/Undervoltage%20Load%20Shedding%20Guidelies%20‐%20Guideline.pdf.

WECC
NERC | 2012 Long‐Term Reliability Assessment | November 2012
Page 253 of 335
relatively inexpensive schemes in lieu of costly transmission facility additions, and whether they will be permanent or
temporary additions, will depend on as‐yet‐undetermined system conditions.
WECC has not established a planning process that addresses high‐impact, low‐probability events. However, various entities
within WECC do take such possibilities into consideration, depending on conditions most pertinent to their respective
geographic areas. For example, transmission planners in northern areas consider loading on transmission lines under severe
ice storm conditions. High‐wind areas are also addressed in facility designs, as is earthquake potential, etc.
LSEs within WECC have been rapidly expanding the use of smart meters and the associated interface equipment. The
impact of such facilities relative to power system reliability has not yet been quantified. Area entities are also taking steps
to install and interface with equipment that may morph into full‐fledged smart grid installations. The pace and extent of
such changes is presently unknown. The CISO’s website presents its smart grid initiatives, which are typical of activities
within the assessment area.294
WECC’s in‐house power system disturbance investigations have identified relay protection misoperation as a factor in
reduced system reliability. On June 22, 2011, WECC’s Board of Directors approved PRC‐003‐WECC‐CRT‐1, Analysis,
Reporting, and Mitigation of Transmission and Generation Protection Systems and Remedial Action Schemes Misoperations
Procedure.295 The procedure was developed to meet NERC Reliability Standard PRC‐003‐1, R1. It is expected that the
mandatory compliance criteria will lead to a reduction in the adverse reliability effects related to relay protection
misoperations.
WECC has not assessed the possible interconnection‐wide effects of pending future environmental regulations. Several
coal‐fired plants have significant exposure to emissions limitations, and some have been or are scheduled to be shut down
during the assessment period, while others are in discussion or litigation regarding emissions issues. In addition, several
California power plants are subject to once‐through cooling (OTC) limitations that may result in plant closures. The resource
data used for this assessment reflect some capacity retirements due to existing clean air and once‐through cooling
initiatives but do not reflect possible retirements due to potential environmental regulations. California’s OTC initiative
includes provisions for stakeholder input regarding reliability issues associated with the plant shutdown scheduling, and it is
expected that the initiative will be implemented on a schedule that will avoid any adverse reliability impact. It is not
expected that long‐term maintenance outages associated with coal‐plant emissions equipment retrofits will affect
reliability, and it is not expected that retrofit time schedules will lead to off‐peak reliability issues. However, extended
retrofit shutdowns coupled with unexpected, unseasonable severe weather could result in somewhat localized capacity
issues.
Standing and Emerging Reliability Issues The WECC LRS has identified four emerging reliability issues that may impact entity activities in the Western
Interconnection. The Subcommittee has discussed the emerging issues in general terms but has not attempted to associate
likelihood or consequences to the four issues, which vary by subregion. Since none of these issues have currently identified
time frames associated with specific adverse consequences that cannot be mitigated in a reasonable manner, an impact on
adverse reliability resource adequacy is not expected to occur. Due to the fluid nature of entity responses to these issues,
the timing and locations of potential impact, if any, on transmission adequacy during the assessment period cannot be
ascertained with a high level of certainty.
Impact of Federal and State Environmental Regulations
WECC contains a significant number of coal‐fired power plants that may be affected by new emissions regulations. The
overall impact of environmental regulations has not been studied by the subcommittee, but some information regarding
294California ISO ‐ Smart Grid: http://www.caiso.com/green/greensmartgrid.html. 295WECC Relay Misoperation Criterion: http://www.wecc.biz/Standards/Development/WECC‐0059/Shared%20Documents/Final%20to%20SC%20for%
20Concurrent%20Posting/WECC‐0059%20Relay%20Misoperation%20Criterion%20Effective%2010‐1‐2011.pdf.

WECC
NERC | 2012 Long‐Term Reliability Assessment | November 2012
Page 254 of 335
the issue is available in the “Special Reliability Scenario Assessment: Resource Adequacy Impacts of Potential U.S.
Environmental Regulations” section of the 2011 LTRA296
In August 2011, the Canadian federal government published draft regulations that would require existing and new coal‐
fired units to reach CO2 emissions levels equivalent to natural gas‐fired combined‐cycle plants. For existing plants the
requirements would come into force once a plant reached the end of its useful life (approx. 45 years), and any new unit
built after 2015 would need to reach the set emissions levels by 2025.
The two Canadian provinces within WECC, Alberta and British Columbia, will be impacted differently by this regulation.
British Columbia has no coal‐fired generation and will not be affected, as it has no plans to build new coal‐fired facilities.
However, this regulation will affect the retirement of existing units in Alberta as well as the addition of coal‐fired capacity.
In Alberta, about 1,000 MW of existing coal‐fired capacity will reach the end of its useful life by 2020. The majority of this
capacity is expected to retire, as retrofitting to meet the required emissions levels is currently prohibitively expensive. The
Alberta market, however, is expected to manage the development of new generation to replace retired capacity over the
next decade, and resource adequacy is not expected to be significantly reduced.
The WECC‐Mexico subregion does not contain coal‐fired power plants.
California State Water Resources Control Board policy on OTC mitigation is intended to cause a substantial amount of
California capacity to retire or be re‐fitted to reduce environmental impact. Mechanisms are built into the OTC policy to
consider any reliability concerns of California state energy agencies or the CISO. The principal issues are associated with
local reliability concerns that are not addressed in this WECC‐wide assessment. In southern California, the air quality
mandates imposed on the South Coast Air Quality Management District by the federal Clean Air Act continue to place
constraints on new power plant development, and possibly on repowering of existing OTC facilities. The state energy
agencies and CISO are assisting the California Air Resources Board to assess minimum capacity requirements of southern
California and the need for offsets to facilitate permitting of these capacity additions. Such capacity additions are closely
related to OTC policy‐induced repowering or retirement of older OTC facilities. In summary, state environmental impact
reduction policies are being implemented with an awareness of reliability concerns, and all of the appropriate entities are
collaborating to conduct planning assessments aspiring to simultaneously achieve these goals.
Integration of Variable Resources
The WECC LRS discussed light load period minimum generation conflicts between northwest wind and hydro generation.
The unique northwest condition, which was essentially an economic issue rather than a reliability issue, could occur in other
WECC subregions if their wind resource penetration increases to a presently unidentified extent. Solar penetration is less
problematic relative to low nighttime and weekend load issues and is not expected to be a concern within a foreseeable
time period.
Delays in Transmission Siting
Transmission siting delay issues can relate to both new transmission lines and to reconstructions and/or upgrades to
existing lines, and both may be driven by either demand growth or by generation delivery needs. Regardless, siting delays
may have reliability implications that need to be addressed by the appropriate transmission planners and their associated
governmental authorities. The “not in my back yard” philosophy coupled with firmly entrenched environmental study
requirements essentially guarantees transmission development time frames that extend beyond those most desirable to
developers and are expected to recur through the LTRA time frame. While siting delays may ultimately adversely impact
resource development, evolving conditions relative to smart grid enhancements may significantly transform WECC’s
stability‐limited transmission system. Additional transforming events may include ongoing building of new gas‐fired
generation closer to load centers and increased rooftop solar power generation.
296Resource Adequacy Impacts of Potential U.S. Environmental Regulations: http://www.nerc.com/files/EPA_Scenario_Final_v2.pdf.

WECC
NERC | 2012 Long‐Term Reliability Assessment | November 2012
Page 255 of 335
WECC Subregional Tables Planning Reserve Margins – WECC‐AESO WECC‐AESO‐Summer 2013 2014 2015 2016 2017 2018 2019 2020 2021 2022
ANTICIPATED 19.18% 19.59% 21.38% 28.39% 21.77% 17.80% 12.43% 8.95% 6.07% 8.50% PROSPECTIVE 19.18% 19.59% 21.38% 28.39% 21.77% 17.80% 12.43% 8.95% 6.07% 8.50% ADJUSTED POTENTIAL 19.18% 19.59% 21.38% 28.39% 21.77% 17.80% 12.43% 8.95% 6.07% 8.50%
NERC REFERENCE ‐ 12.24% 12.24% 12.24% 12.24% 12.24% 12.24% 12.24% 12.24% 12.24% 12.24%
WECC‐AESO‐Winter 2013/14 2014/15 2015/16 2016/17 2017/18 2018/19 2019/20 2020/21 2021/22 2022/23
ANTICIPATED 18.58% 28.97% 37.24% 34.83% 35.36% 25.99% 22.91% 23.64% 15.47% 13.32% PROSPECTIVE 18.58% 28.97% 37.24% 34.83% 35.36% 25.99% 22.91% 23.64% 15.47% 13.32% ADJUSTED POTENTIAL 18.58% 28.97% 37.24% 34.83% 35.36% 25.99% 22.91% 23.64% 15.47% 13.32%
NERC REFERENCE ‐ 11.71% 11.71% 11.71% 11.71% 11.71% 11.71% 11.71% 11.71% 11.71% 11.71%
Planning Reserve Margins – WECC‐BASN WECC‐BASN‐Summer 2013 2014 2015 2016 2017 2018 2019 2020 2021 2022
ANTICIPATED 27.53% 22.14% 19.81% 18.08% 15.30% 13.35% 10.44% 7.46% 6.59% 7.17% PROSPECTIVE 27.53% 22.14% 19.81% 18.08% 15.30% 13.35% 10.44% 7.46% 6.59% 7.17% ADJUSTED POTENTIAL 27.53% 25.57% 23.15% 23.72% 20.82% 18.78% 15.80% 14.07% 13.10% 13.96%
NERC REFERENCE ‐ 12.60% 12.60% 12.60% 12.60% 12.60% 12.60% 12.60% 12.60% 12.60% 12.60%
WECC‐BASN‐Winter 2013/14 2014/15 2015/16 2016/17 2017/18 2018/19 2019/20 2020/21 2021/22 2022/23
ANTICIPATED 26.91% 23.82% 22.78% 15.67% 14.79% 17.58% 16.71% 16.15% 11.57% 11.96% PROSPECTIVE 26.91% 23.82% 22.78% 15.67% 14.79% 17.58% 16.71% 16.15% 11.57% 11.96% ADJUSTED POTENTIAL 26.91% 27.91% 27.07% 22.48% 21.47% 24.20% 24.94% 25.79% 21.67% 20.10%
NERC REFERENCE ‐ 13.49% 13.49% 13.49% 13.49% 13.49% 13.49% 13.49% 13.49% 13.49% 13.49%
Planning Reserve Margins – WECC‐BC WECC‐BC‐Summer 2013 2014 2015 2016 2017 2018 2019 2020 2021 2022
ANTICIPATED 41.74% 40.70% 35.36% 33.62% 31.81% 36.03% 33.16% 23.33% 14.97% 13.91% PROSPECTIVE 41.74% 40.70% 35.36% 33.62% 31.81% 36.03% 33.16% 23.33% 14.97% 13.91% ADJUSTED POTENTIAL 41.74% 40.70% 35.36% 33.62% 31.81% 36.03% 33.16% 23.33% 14.97% 13.91%
NERC REFERENCE ‐ 12.51% 12.51% 12.51% 12.51% 12.51% 12.51% 12.51% 12.51% 12.51% 12.51%
WECC‐BC‐Winter 2013/14 2014/15 2015/16 2016/17 2017/18 2018/19 2019/20 2020/21 2021/22 2022/23
ANTICIPATED 17.24% 18.15% 19.90% 20.05% 19.44% 17.88% 16.98% 14.43% 13.64% 12.82% PROSPECTIVE 17.24% 18.15% 19.90% 20.05% 19.44% 17.88% 16.98% 14.43% 13.64% 12.82% ADJUSTED POTENTIAL 17.24% 18.15% 19.90% 20.05% 19.44% 17.88% 16.98% 14.43% 13.64% 12.82%
NERC REFERENCE ‐ 16.16% 16.16% 16.16% 16.16% 16.16% 16.16% 16.16% 16.16% 16.16% 16.16%
Planning Reserve Margins – WECC‐CALN WECC‐CALN‐Summer 2013 2014 2015 2016 2017 2018 2019 2020 2021 2022
ANTICIPATED 15.16% 14.82% 18.29% 16.01% 14.71% 13.53% 9.06% 9.49% 9.22% 7.90% PROSPECTIVE 15.16% 14.82% 18.29% 16.01% 14.71% 13.53% 9.06% 9.49% 9.22% 7.90% ADJUSTED POTENTIAL 15.16% 14.82% 18.29% 16.02% 14.72% 13.54% 9.07% 9.49% 9.22% 7.91%
NERC REFERENCE ‐ 14.71% 14.71% 14.71% 14.71% 14.71% 14.71% 14.71% 14.71% 14.71% 14.71%
WECC‐CALN‐Winter 2013/14 2014/15 2015/16 2016/17 2017/18 2018/19 2019/20 2020/21 2021/22 2022/23
ANTICIPATED 22.55% 30.81% 28.82% 21.49% 24.46% 23.91% 23.18% 20.34% 18.82% 15.38% PROSPECTIVE 22.55% 30.81% 28.82% 21.49% 24.46% 23.91% 23.18% 20.34% 18.82% 15.38% ADJUSTED POTENTIAL 22.55% 30.81% 28.82% 21.50% 24.47% 24.91% 24.17% 21.32% 19.31% 16.23%
NERC REFERENCE ‐ 11.86% 11.86% 11.86% 11.86% 11.86% 11.86% 11.86% 11.86% 11.86% 11.86%
Planning Reserve Margins – WECC‐CALS WECC‐CALS‐Summer 2013 2014 2015 2016 2017 2018 2019 2020 2021 2022
ANTICIPATED 16.04% 20.94% 19.07% 18.63% 17.74% 15.22% 15.22% 15.44% 15.19% 15.31% PROSPECTIVE 16.04% 20.94% 19.07% 18.63% 17.74% 15.22% 15.22% 15.44% 15.19% 15.31% ADJUSTED POTENTIAL 16.29% 21.19% 19.31% 19.21% 18.40% 16.19% 16.22% 16.74% 16.48% 16.59%
NERC REFERENCE ‐ 15.14% 15.14% 15.14% 15.14% 15.14% 15.14% 15.14% 15.14% 15.14% 15.14%
WECC‐CALS‐Winter 2013/14 2014/15 2015/16 2016/17 2017/18 2018/19 2019/20 2020/21 2021/22 2022/23
ANTICIPATED 54.57% 49.51% 46.42% 39.95% 38.76% 40.21% 31.60% 21.18% 27.20% 20.62% PROSPECTIVE 54.57% 49.51% 46.42% 39.95% 38.76% 40.21% 31.60% 21.18% 27.20% 20.62% ADJUSTED POTENTIAL 54.90% 49.83% 46.74% 40.71% 39.64% 41.49% 32.87% 22.84% 28.84% 22.25%
NERC REFERENCE ‐ 11.03% 11.03% 11.03% 11.03% 11.03% 11.03% 11.03% 11.03% 11.03% 11.03%
Planning Reserve Margins – WECC‐DSW WECC‐DSW‐Summer 2013 2014 2015 2016 2017 2018 2019 2020 2021 2022
ANTICIPATED 46.57% 43.51% 45.69% 47.93% 47.03% 46.07% 41.56% 34.72% 29.52% 29.09% PROSPECTIVE 46.57% 43.51% 45.69% 47.93% 47.03% 46.07% 41.56% 34.72% 29.52% 29.09% ADJUSTED POTENTIAL 47.24% 45.13% 47.75% 50.17% 50.05% 48.86% 45.71% 39.93% 34.90% 34.40%
NERC REFERENCE ‐ 13.50% 13.50% 13.50% 13.50% 13.50% 13.50% 13.50% 13.50% 13.50% 13.50%
WECC‐DSW‐Winter 2013/14 2014/15 2015/16 2016/17 2017/18 2018/19 2019/20 2020/21 2021/22 2022/23
ANTICIPATED 91.01% 90.09% 89.45% 86.95% 83.98% 82.77% 76.41% 79.46% 78.49% 77.75%
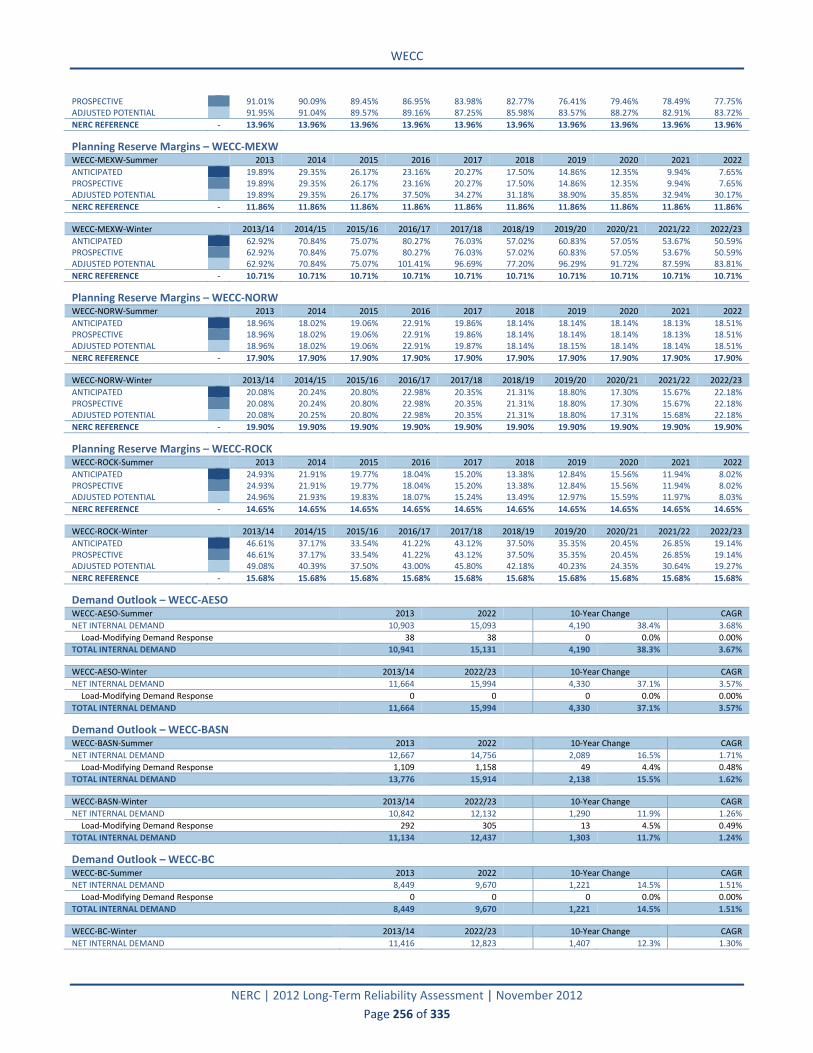
WECC
NERC | 2012 Long‐Term Reliability Assessment | November 2012
Page 256 of 335
PROSPECTIVE 91.01% 90.09% 89.45% 86.95% 83.98% 82.77% 76.41% 79.46% 78.49% 77.75% ADJUSTED POTENTIAL 91.95% 91.04% 89.57% 89.16% 87.25% 85.98% 83.57% 88.27% 82.91% 83.72%
NERC REFERENCE ‐ 13.96% 13.96% 13.96% 13.96% 13.96% 13.96% 13.96% 13.96% 13.96% 13.96%
Planning Reserve Margins – WECC‐MEXW WECC‐MEXW‐Summer 2013 2014 2015 2016 2017 2018 2019 2020 2021 2022
ANTICIPATED 19.89% 29.35% 26.17% 23.16% 20.27% 17.50% 14.86% 12.35% 9.94% 7.65% PROSPECTIVE 19.89% 29.35% 26.17% 23.16% 20.27% 17.50% 14.86% 12.35% 9.94% 7.65% ADJUSTED POTENTIAL 19.89% 29.35% 26.17% 37.50% 34.27% 31.18% 38.90% 35.85% 32.94% 30.17%
NERC REFERENCE ‐ 11.86% 11.86% 11.86% 11.86% 11.86% 11.86% 11.86% 11.86% 11.86% 11.86%
WECC‐MEXW‐Winter 2013/14 2014/15 2015/16 2016/17 2017/18 2018/19 2019/20 2020/21 2021/22 2022/23
ANTICIPATED 62.92% 70.84% 75.07% 80.27% 76.03% 57.02% 60.83% 57.05% 53.67% 50.59% PROSPECTIVE 62.92% 70.84% 75.07% 80.27% 76.03% 57.02% 60.83% 57.05% 53.67% 50.59% ADJUSTED POTENTIAL 62.92% 70.84% 75.07% 101.41% 96.69% 77.20% 96.29% 91.72% 87.59% 83.81%
NERC REFERENCE ‐ 10.71% 10.71% 10.71% 10.71% 10.71% 10.71% 10.71% 10.71% 10.71% 10.71%
Planning Reserve Margins – WECC‐NORW WECC‐NORW‐Summer 2013 2014 2015 2016 2017 2018 2019 2020 2021 2022
ANTICIPATED 18.96% 18.02% 19.06% 22.91% 19.86% 18.14% 18.14% 18.14% 18.13% 18.51% PROSPECTIVE 18.96% 18.02% 19.06% 22.91% 19.86% 18.14% 18.14% 18.14% 18.13% 18.51% ADJUSTED POTENTIAL 18.96% 18.02% 19.06% 22.91% 19.87% 18.14% 18.15% 18.14% 18.14% 18.51%
NERC REFERENCE ‐ 17.90% 17.90% 17.90% 17.90% 17.90% 17.90% 17.90% 17.90% 17.90% 17.90%
WECC‐NORW‐Winter 2013/14 2014/15 2015/16 2016/17 2017/18 2018/19 2019/20 2020/21 2021/22 2022/23
ANTICIPATED 20.08% 20.24% 20.80% 22.98% 20.35% 21.31% 18.80% 17.30% 15.67% 22.18% PROSPECTIVE 20.08% 20.24% 20.80% 22.98% 20.35% 21.31% 18.80% 17.30% 15.67% 22.18% ADJUSTED POTENTIAL 20.08% 20.25% 20.80% 22.98% 20.35% 21.31% 18.80% 17.31% 15.68% 22.18%
NERC REFERENCE ‐ 19.90% 19.90% 19.90% 19.90% 19.90% 19.90% 19.90% 19.90% 19.90% 19.90%
Planning Reserve Margins – WECC‐ROCK WECC‐ROCK‐Summer 2013 2014 2015 2016 2017 2018 2019 2020 2021 2022
ANTICIPATED 24.93% 21.91% 19.77% 18.04% 15.20% 13.38% 12.84% 15.56% 11.94% 8.02% PROSPECTIVE 24.93% 21.91% 19.77% 18.04% 15.20% 13.38% 12.84% 15.56% 11.94% 8.02% ADJUSTED POTENTIAL 24.96% 21.93% 19.83% 18.07% 15.24% 13.49% 12.97% 15.59% 11.97% 8.03%
NERC REFERENCE ‐ 14.65% 14.65% 14.65% 14.65% 14.65% 14.65% 14.65% 14.65% 14.65% 14.65%
WECC‐ROCK‐Winter 2013/14 2014/15 2015/16 2016/17 2017/18 2018/19 2019/20 2020/21 2021/22 2022/23
ANTICIPATED 46.61% 37.17% 33.54% 41.22% 43.12% 37.50% 35.35% 20.45% 26.85% 19.14% PROSPECTIVE 46.61% 37.17% 33.54% 41.22% 43.12% 37.50% 35.35% 20.45% 26.85% 19.14% ADJUSTED POTENTIAL 49.08% 40.39% 37.50% 43.00% 45.80% 42.18% 40.23% 24.35% 30.64% 19.27%
NERC REFERENCE ‐ 15.68% 15.68% 15.68% 15.68% 15.68% 15.68% 15.68% 15.68% 15.68% 15.68%
Demand Outlook – WECC‐AESO WECC‐AESO‐Summer 2013 2022 10‐Year Change CAGR
NET INTERNAL DEMAND 10,903 15,093 4,190 38.4% 3.68%
Load‐Modifying Demand Response 38 38 0 0.0% 0.00%
TOTAL INTERNAL DEMAND 10,941 15,131 4,190 38.3% 3.67%
WECC‐AESO‐Winter 2013/14 2022/23 10‐Year Change CAGR
NET INTERNAL DEMAND 11,664 15,994 4,330 37.1% 3.57%
Load‐Modifying Demand Response 0 0 0 0.0% 0.00%
TOTAL INTERNAL DEMAND 11,664 15,994 4,330 37.1% 3.57%
Demand Outlook – WECC‐BASN WECC‐BASN‐Summer 2013 2022 10‐Year Change CAGR
NET INTERNAL DEMAND 12,667 14,756 2,089 16.5% 1.71%
Load‐Modifying Demand Response 1,109 1,158 49 4.4% 0.48%
TOTAL INTERNAL DEMAND 13,776 15,914 2,138 15.5% 1.62%
WECC‐BASN‐Winter 2013/14 2022/23 10‐Year Change CAGR
NET INTERNAL DEMAND 10,842 12,132 1,290 11.9% 1.26%
Load‐Modifying Demand Response 292 305 13 4.5% 0.49%
TOTAL INTERNAL DEMAND 11,134 12,437 1,303 11.7% 1.24%
Demand Outlook – WECC‐BC WECC‐BC‐Summer 2013 2022 10‐Year Change CAGR
NET INTERNAL DEMAND 8,449 9,670 1,221 14.5% 1.51%
Load‐Modifying Demand Response 0 0 0 0.0% 0.00%
TOTAL INTERNAL DEMAND 8,449 9,670 1,221 14.5% 1.51%
WECC‐BC‐Winter 2013/14 2022/23 10‐Year Change CAGR
NET INTERNAL DEMAND 11,416 12,823 1,407 12.3% 1.30%

WECC
NERC | 2012 Long‐Term Reliability Assessment | November 2012
Page 257 of 335
Load‐Modifying Demand Response 0 0 0 0.0% 0.00%
TOTAL INTERNAL DEMAND 11,416 12,823 1,407 12.3% 1.30%
Demand Outlook – WECC‐CALN WECC‐CALN‐Summer 2013 2022 10‐Year Change CAGR
NET INTERNAL DEMAND 25,841 29,077 3,236 12.5% 1.32%
Load‐Modifying Demand Response 804 835 31 3.9% 0.42%
TOTAL INTERNAL DEMAND 26,645 29,912 3,267 12.3% 1.29%
WECC‐CALN‐Winter 2013/14 2022/23 10‐Year Change CAGR
NET INTERNAL DEMAND 18,407 20,220 1,813 9.9% 1.05%
Load‐Modifying Demand Response 257 278 21 8.2% 0.88%
TOTAL INTERNAL DEMAND 18,664 20,498 1,834 9.8% 1.05%
Demand Outlook – WECC‐CALS WECC‐CALS‐Summer 2013 2022 10‐Year Change CAGR
NET INTERNAL DEMAND 29,311 33,319 4,008 13.7% 1.43%
Load‐Modifying Demand Response 2,008 2,296 288 14.3% 1.50%
TOTAL INTERNAL DEMAND 31,319 35,615 4,296 13.7% 1.44%
WECC‐CALS‐Winter 2013/14 2022/23 10‐Year Change CAGR
NET INTERNAL DEMAND 22,360 25,454 3,094 13.8% 1.45%
Load‐Modifying Demand Response 869 1,153 284 32.7% 3.19%
TOTAL INTERNAL DEMAND 23,229 26,607 3,378 14.5% 1.52%
Demand Outlook – WECC‐DSW WECC‐DSW‐Summer 2013 2022 10‐Year Change CAGR
NET INTERNAL DEMAND 27,034 31,013 3,979 14.7% 1.54%
Load‐Modifying Demand Response 542 589 47 8.7% 0.93%
TOTAL INTERNAL DEMAND 27,576 31,602 4,026 14.6% 1.53%
WECC‐DSW‐Winter 2013/14 2022/23 10‐Year Change CAGR
NET INTERNAL DEMAND 17,845 20,775 2,930 16.4% 1.70%
Load‐Modifying Demand Response 279 290 11 3.9% 0.43%
TOTAL INTERNAL DEMAND 18,124 21,065 2,941 16.2% 1.69%
Demand Outlook – WECC‐MEXW WECC‐MEXW‐Summer 2013 2022 10‐Year Change CAGR
NET INTERNAL DEMAND 2,203 2,716 513 23.3% 2.35%
Load‐Modifying Demand Response 0 0 0 0.0% 0.00%
TOTAL INTERNAL DEMAND 2,203 2,716 513 23.3% 2.35%
WECC‐MEXW‐Winter 2013/14 2022/23 10‐Year Change CAGR
NET INTERNAL DEMAND 1,494 1,841 347 23.2% 2.35%
Load‐Modifying Demand Response 0 0 0 0.0% 0.00%
TOTAL INTERNAL DEMAND 1,494 1,841 347 23.2% 2.35%
Demand Outlook – WECC‐NORW WECC‐NORW‐Summer 2013 2022 10‐Year Change CAGR
NET INTERNAL DEMAND 24,310 26,711 2,401 9.9% 1.05%
Load‐Modifying Demand Response 70 147 77 110.0% 8.59%
TOTAL INTERNAL DEMAND 24,380 26,858 2,478 10.2% 1.08%
WECC‐NORW‐Winter 2013/14 2022/23 10‐Year Change CAGR
NET INTERNAL DEMAND 30,217 32,638 2,420 8.0% 0.86%
Load‐Modifying Demand Response 53 121 68 128.3% 9.61%
TOTAL INTERNAL DEMAND 30,270 32,759 2,488 8.2% 0.88%
Demand Outlook – WECC‐ROCK WECC‐ROCK‐Summer 2013 2022 10‐Year Change CAGR
NET INTERNAL DEMAND 11,434 13,251 1,817 15.9% 1.65%
Load‐Modifying Demand Response 470 520 50 10.6% 1.13%
TOTAL INTERNAL DEMAND 11,904 13,771 1,867 15.7% 1.63%
WECC‐ROCK‐Winter 2013/14 2022/23 10‐Year Change CAGR
NET INTERNAL DEMAND 9,565 11,283 1,718 18.0% 1.85%
Load‐Modifying Demand Response 268 238 ‐30 ‐11.2% ‐1.31%
TOTAL INTERNAL DEMAND 9,833 11,521 1,688 17.2% 1.78%
Net Transactions – WECC‐AESO WECC‐AESO 2013/14 2014/15 2015/16 2016/17 2017/18 2018/19 2019/20 2020/21 2021/22 2022/23
Expected Imports 0 0 0 0 0 0 0 0 0 0 Firm Imports 0 0 0 0 0 0 0 0 0 0
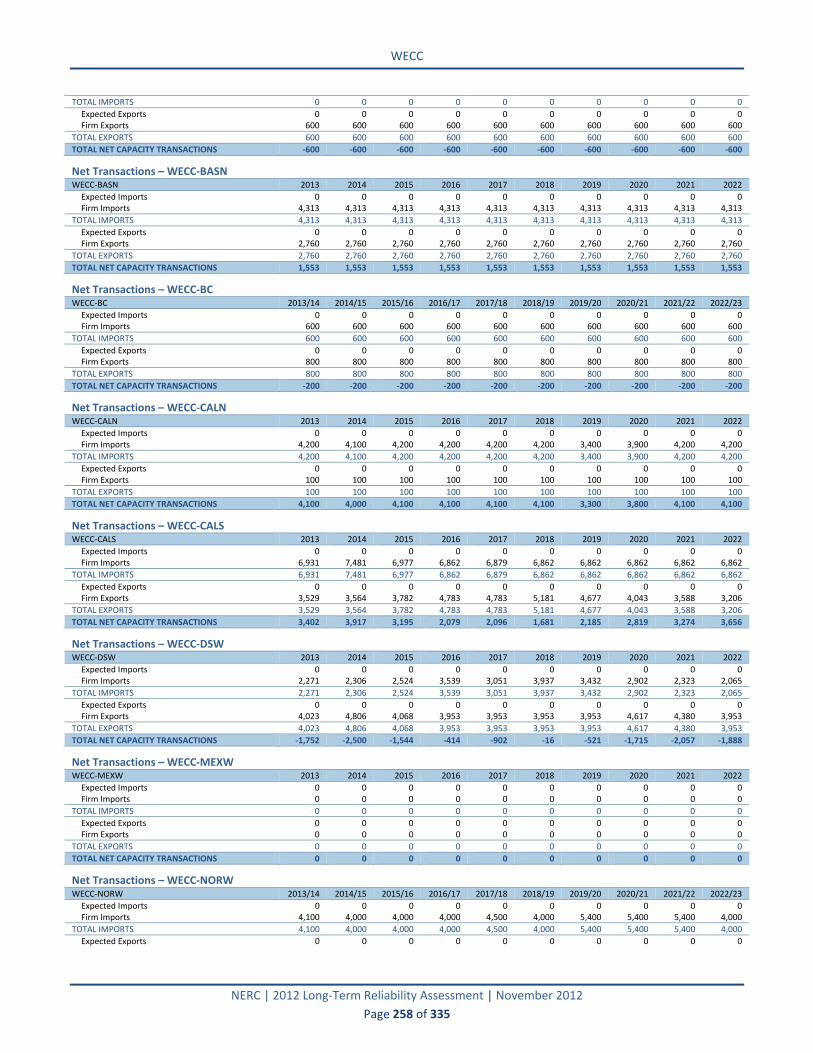
WECC
NERC | 2012 Long‐Term Reliability Assessment | November 2012
Page 258 of 335
TOTAL IMPORTS 0 0 0 0 0 0 0 0 0 0
Expected Exports 0 0 0 0 0 0 0 0 0 0 Firm Exports 600 600 600 600 600 600 600 600 600 600
TOTAL EXPORTS 600 600 600 600 600 600 600 600 600 600
TOTAL NET CAPACITY TRANSACTIONS ‐600 ‐600 ‐600 ‐600 ‐600 ‐600 ‐600 ‐600 ‐600 ‐600
Net Transactions – WECC‐BASN WECC‐BASN 2013 2014 2015 2016 2017 2018 2019 2020 2021 2022
Expected Imports 0 0 0 0 0 0 0 0 0 0 Firm Imports 4,313 4,313 4,313 4,313 4,313 4,313 4,313 4,313 4,313 4,313
TOTAL IMPORTS 4,313 4,313 4,313 4,313 4,313 4,313 4,313 4,313 4,313 4,313
Expected Exports 0 0 0 0 0 0 0 0 0 0 Firm Exports 2,760 2,760 2,760 2,760 2,760 2,760 2,760 2,760 2,760 2,760
TOTAL EXPORTS 2,760 2,760 2,760 2,760 2,760 2,760 2,760 2,760 2,760 2,760
TOTAL NET CAPACITY TRANSACTIONS 1,553 1,553 1,553 1,553 1,553 1,553 1,553 1,553 1,553 1,553
Net Transactions – WECC‐BC WECC‐BC 2013/14 2014/15 2015/16 2016/17 2017/18 2018/19 2019/20 2020/21 2021/22 2022/23
Expected Imports 0 0 0 0 0 0 0 0 0 0 Firm Imports 600 600 600 600 600 600 600 600 600 600
TOTAL IMPORTS 600 600 600 600 600 600 600 600 600 600
Expected Exports 0 0 0 0 0 0 0 0 0 0 Firm Exports 800 800 800 800 800 800 800 800 800 800
TOTAL EXPORTS 800 800 800 800 800 800 800 800 800 800
TOTAL NET CAPACITY TRANSACTIONS ‐200 ‐200 ‐200 ‐200 ‐200 ‐200 ‐200 ‐200 ‐200 ‐200
Net Transactions – WECC‐CALN WECC‐CALN 2013 2014 2015 2016 2017 2018 2019 2020 2021 2022
Expected Imports 0 0 0 0 0 0 0 0 0 0 Firm Imports 4,200 4,100 4,200 4,200 4,200 4,200 3,400 3,900 4,200 4,200
TOTAL IMPORTS 4,200 4,100 4,200 4,200 4,200 4,200 3,400 3,900 4,200 4,200
Expected Exports 0 0 0 0 0 0 0 0 0 0 Firm Exports 100 100 100 100 100 100 100 100 100 100
TOTAL EXPORTS 100 100 100 100 100 100 100 100 100 100
TOTAL NET CAPACITY TRANSACTIONS 4,100 4,000 4,100 4,100 4,100 4,100 3,300 3,800 4,100 4,100
Net Transactions – WECC‐CALS WECC‐CALS 2013 2014 2015 2016 2017 2018 2019 2020 2021 2022
Expected Imports 0 0 0 0 0 0 0 0 0 0 Firm Imports 6,931 7,481 6,977 6,862 6,879 6,862 6,862 6,862 6,862 6,862
TOTAL IMPORTS 6,931 7,481 6,977 6,862 6,879 6,862 6,862 6,862 6,862 6,862
Expected Exports 0 0 0 0 0 0 0 0 0 0 Firm Exports 3,529 3,564 3,782 4,783 4,783 5,181 4,677 4,043 3,588 3,206
TOTAL EXPORTS 3,529 3,564 3,782 4,783 4,783 5,181 4,677 4,043 3,588 3,206
TOTAL NET CAPACITY TRANSACTIONS 3,402 3,917 3,195 2,079 2,096 1,681 2,185 2,819 3,274 3,656
Net Transactions – WECC‐DSW WECC‐DSW 2013 2014 2015 2016 2017 2018 2019 2020 2021 2022
Expected Imports 0 0 0 0 0 0 0 0 0 0 Firm Imports 2,271 2,306 2,524 3,539 3,051 3,937 3,432 2,902 2,323 2,065
TOTAL IMPORTS 2,271 2,306 2,524 3,539 3,051 3,937 3,432 2,902 2,323 2,065
Expected Exports 0 0 0 0 0 0 0 0 0 0 Firm Exports 4,023 4,806 4,068 3,953 3,953 3,953 3,953 4,617 4,380 3,953
TOTAL EXPORTS 4,023 4,806 4,068 3,953 3,953 3,953 3,953 4,617 4,380 3,953
TOTAL NET CAPACITY TRANSACTIONS ‐1,752 ‐2,500 ‐1,544 ‐414 ‐902 ‐16 ‐521 ‐1,715 ‐2,057 ‐1,888
Net Transactions – WECC‐MEXW WECC‐MEXW 2013 2014 2015 2016 2017 2018 2019 2020 2021 2022
Expected Imports 0 0 0 0 0 0 0 0 0 0 Firm Imports 0 0 0 0 0 0 0 0 0 0
TOTAL IMPORTS 0 0 0 0 0 0 0 0 0 0
Expected Exports 0 0 0 0 0 0 0 0 0 0 Firm Exports 0 0 0 0 0 0 0 0 0 0
TOTAL EXPORTS 0 0 0 0 0 0 0 0 0 0
TOTAL NET CAPACITY TRANSACTIONS 0 0 0 0 0 0 0 0 0 0
Net Transactions – WECC‐NORW WECC‐NORW 2013/14 2014/15 2015/16 2016/17 2017/18 2018/19 2019/20 2020/21 2021/22 2022/23
Expected Imports 0 0 0 0 0 0 0 0 0 0 Firm Imports 4,100 4,000 4,000 4,000 4,500 4,000 5,400 5,400 5,400 4,000
TOTAL IMPORTS 4,100 4,000 4,000 4,000 4,500 4,000 5,400 5,400 5,400 4,000
Expected Exports 0 0 0 0 0 0 0 0 0 0

WECC
NERC | 2012 Long‐Term Reliability Assessment | November 2012
Page 259 of 335
Firm Exports 0 0 0 0 0 0 0 0 0 0
TOTAL EXPORTS 0 0 0 0 0 0 0 0 0 0
TOTAL NET CAPACITY TRANSACTIONS 4,100 4,000 4,000 4,000 4,500 4,000 5,400 5,400 5,400 4,000
Net Transactions – WECC‐ROCK WECC‐ROCK 2013 2014 2015 2016 2017 2018 2019 2020 2021 2022
Expected Imports 0 0 0 0 0 0 0 0 0 0 Firm Imports 400 634 400 400 400 400 400 1,064 827 400
TOTAL IMPORTS 400 634 400 400 400 400 400 1,064 827 400
Expected Exports 0 0 0 0 0 0 0 0 0 0 Firm Exports 274 531 531 531 531 531 531 531 531 531
TOTAL EXPORTS 274 531 531 531 531 531 531 531 531 531
TOTAL NET CAPACITY TRANSACTIONS 126 103 ‐131 ‐131 ‐131 ‐131 ‐131 533 296 ‐131

Appendix I: Projected Transmission Projects
NERC | 2012 Long‐Term Reliability Assessment | November 2012
Page 260 of 335
Appendix I: NERC Reference Case –Annual Demand Tables Annual Net Internal Demand ‐ Summer Assessment Area/Country 2013 2014 2015 2016 2017 2018 2019 2020 2021 2022 10‐Year Change CAGR
ERCOT 65,649 68,403 71,692 73,957 75,360 76,483 76,769 78,524 79,682 80,694 15,045 22.92% 2.32%
FRCC 43,041 43,618 44,459 45,242 45,802 46,152 46,803 47,581 48,273 48,923 5,882 13.67% 1.43%
MISO 89,318 90,707 91,096 91,556 92,022 92,447 92,932 93,419 93,957 94,875 5,557 6.22% 0.67%
MRO‐MAPP 4,904 5,024 5,135 5,406 5,461 5,543 5,643 5,735 5,821 5,906 1,002 20.44% 2.09%
NPCC‐New England 26,629 26,877 27,193 27,520 27,797 27,973 28,111 28,257 28,414 28,583 1,954 7.34% 0.79%
NPCC‐New York 33,696 33,914 34,151 34,345 34,550 34,868 35,204 35,526 35,913 36,230 2,534 7.52% 0.81%
PJM 145,254 146,642 149,968 152,491 154,233 155,832 157,660 159,593 161,438 163,220 17,966 12.37% 1.30%
SERC‐E 41,805 42,412 42,750 43,235 43,707 44,103 44,636 45,200 45,848 46,386 4,581 10.96% 1.16%
SERC‐N 43,808 44,387 44,952 45,537 45,987 46,504 47,044 47,653 48,167 48,778 4,970 11.35% 1.20%
SERC‐SE 47,900 48,738 49,227 49,823 50,551 51,023 51,707 52,396 53,343 54,249 6,349 13.25% 1.39%
SERC‐W 25,015 25,257 25,623 25,937 26,252 26,556 26,910 27,198 27,472 27,764 2,749 10.99% 1.17%
SPP 54,247 54,794 54,788 55,368 55,927 56,539 57,338 57,971 58,716 58,985 4,738 8.73% 0.93%
WECC‐BASN 12,667 13,025 13,354 13,607 13,923 14,148 14,392 14,628 14,836 14,756 2,089 16.49% 1.71%
WECC‐CALN 25,841 26,154 26,471 27,072 27,376 27,670 27,998 28,324 28,652 29,077 3,236 12.52% 1.32%
WECC‐CALS 29,311 29,901 30,467 30,796 31,191 31,577 31,948 32,472 32,997 33,319 4,008 13.67% 1.43%
WECC‐DSW 27,034 27,252 27,551 28,035 28,510 29,106 29,622 30,183 30,720 31,013 3,979 14.72% 1.54%
WECC‐NORW 24,310 24,609 24,872 25,155 25,445 25,675 25,901 26,151 26,414 26,711 2,401 9.88% 1.05%
WECC‐ROCK 11,434 11,619 11,827 12,048 12,235 12,431 12,626 12,840 13,093 13,251 1,817 15.89% 1.65%
TOTAL‐UNITED STATES 751,862 763,332 775,577 787,129 796,328 804,630 813,244 823,652 833,758 842,721 90,859 12.08% 1.28%
MRO‐Manitoba Hydro 3,210 3,238 3,207 3,244 3,286 3,221 3,271 3,348 3,428 3,474 264 8.24% 0.88%
MRO‐SaskPower 3,184 3,335 3,444 3,533 3,630 3,618 3,665 3,716 3,784 3,847 663 20.81% 2.12%
NPCC‐Maritimes 3,104 3,138 3,117 3,110 3,116 3,128 3,140 3,163 3,175 3,183 79 2.55% 0.28%
NPCC‐Ontario 23,301 23,080 22,859 22,638 22,471 22,583 22,891 23,010 23,390 23,442 142 0.61% 0.07%
NPCC‐Québec 21,115 21,550 21,642 21,883 22,008 22,125 22,307 22,503 22,662 22,818 1,704 8.07% 0.87%
WECC‐AESO 10,903 11,510 12,039 12,604 13,108 13,522 13,936 14,336 14,727 15,093 4,190 38.43% 3.68%
WECC‐BC 8,449 8,684 8,834 8,913 9,043 9,167 9,289 9,427 9,553 9,670 1,221 14.45% 1.51%
TOTAL‐CANADA 73,266 74,535 75,142 75,925 76,663 77,364 78,498 79,504 80,719 81,528 8,262 11.28% 1.19%
WECC‐MEXW 2,203 2,260 2,317 2,374 2,431 2,488 2,545 2,602 2,659 2,716 513 23.29% 2.35%
TOTAL‐MÉXICO 2,203 2,260 2,317 2,374 2,431 2,488 2,545 2,602 2,659 2,716 513 23.29% 2.35%
TOTAL‐NERC 827,330 840,127 853,036 865,428 875,421 884,482 894,287 905,758 917,136 926,965 99,635 12.04% 1.27%
Annual Net Internal Demand – Winter Assessment Area/Country 2013 2014 2015 2016 2017 2018 2019 2020 2021 2022 10‐Year Change CAGR
ERCOT 50,263 50,533 53,378 54,363 57,204 57,459 57,575 58,210 59,031 61,450 11,187 22.26% 2.26%
FRCC 43,049 44,228 44,790 45,297 45,752 46,305 46,910 47,509 48,169 48,656 5,607 13.02% 1.37%
MISO 69,663 74,965 75,354 75,854 76,172 76,692 77,174 77,498 78,022 78,789 9,126 13.10% 1.38%
MRO‐MAPP 4,858 4,999 5,074 5,335 5,412 5,522 5,623 5,718 5,814 5,904 1,047 21.55% 2.19%
NPCC‐New England 21,383 21,285 21,193 21,097 21,011 20,929 20,859 20,797 20,750 20,711 ‐672 ‐3.14% ‐0.35%
NPCC‐New York 24,929 24,999 25,053 25,149 25,153 25,265 25,422 25,627 25,794 25,908 979 3.93% 0.43%
PJM 121,160 121,571 123,711 125,367 126,462 127,644 128,818 130,219 131,636 132,916 11,756 9.70% 1.03%
SERC‐E 42,042 42,408 42,934 43,395 43,879 44,382 45,016 45,557 46,144 46,730 4,688 11.15% 1.18%
SERC‐N 43,734 44,212 44,685 45,226 45,723 46,176 46,697 47,211 47,891 48,256 4,522 10.34% 1.10%
SERC‐SE 44,652 45,103 45,615 46,266 46,743 47,434 48,097 48,943 49,770 50,627 5,975 13.38% 1.41%
SERC‐W 19,731 20,042 20,209 20,694 21,106 21,410 21,118 21,726 21,891 22,262 2,531 12.83% 1.35%
SPP 40,983 41,345 41,225 41,812 42,205 42,726 43,360 43,930 44,470 44,862 3,879 9.47% 1.01%
WECC‐BASN 10,842 10,913 11,167 11,416 11,640 11,818 11,940 12,026 12,158 12,132 1,290 11.90% 1.26%
WECC‐CALN 18,407 18,707 18,937 19,220 19,409 19,618 19,767 19,919 20,070 20,220 1,813 9.85% 1.05%
WECC‐CALS 22,360 22,893 23,235 23,441 23,770 24,099 24,438 24,941 25,300 25,454 3,094 13.84% 1.45%
WECC‐DSW 17,845 18,095 18,431 18,827 19,187 19,540 19,945 20,263 20,490 20,775 2,930 16.42% 1.70%
WECC‐NORW 30,217 30,507 30,763 31,053 31,355 31,607 31,862 32,075 32,391 32,638 2,420 8.01% 0.86%
WECC‐ROCK 9,565 9,709 9,918 10,214 10,398 10,602 10,796 10,922 11,165 11,283 1,718 17.96% 1.85%
TOTAL‐UNITED STATES 635,683 646,514 655,672 664,025 672,581 679,228 685,417 693,092 700,956 709,572 73,889 11.62% 1.23%
MRO‐Manitoba Hydro 4,661 4,712 4,723 4,781 4,845 4,801 4,878 4,981 5,089 5,162 501 10.76% 1.14%
MRO‐SaskPower 3,580 3,738 3,859 3,959 4,068 4,054 4,107 4,164 4,239 4,310 730 20.39% 2.08%
NPCC‐Maritimes 5,169 5,166 5,165 5,185 5,201 5,226 5,228 5,247 5,264 5,285 116 2.24% 0.25%
NPCC‐Ontario 22,192 21,890 21,500 21,153 20,719 20,700 21,063 21,234 21,441 21,529 ‐663 ‐2.99% ‐0.34%
NPCC‐Québec 37,810 38,062 38,527 38,845 39,189 39,487 39,812 40,079 40,317 40,575 2,766 7.31% 0.79%
WECC‐AESO 11,664 12,162 12,801 13,382 13,856 14,351 14,759 15,162 15,618 15,994 4,330 37.12% 3.57%
WECC‐BC 11,416 11,738 11,943 12,050 12,073 12,223 12,373 12,523 12,673 12,823 1,407 12.32% 1.30%
TOTAL‐CANADA 96,492 97,467 98,517 99,355 99,951 100,842 102,219 103,391 104,640 105,679 9,187 9.52% 1.02%
WECC‐MEXW 1,494 1,532 1,571 1,610 1,648 1,687 1,725 1,764 1,803 1,841 347 23.23% 2.35%
TOTAL‐MÉXICO 1,494 1,532 1,571 1,610 1,648 1,687 1,725 1,764 1,803 1,841 347 23.23% 2.35%
TOTAL‐NERC 733,669 745,513 755,760 764,990 774,180 781,757 789,361 798,246 807,399 817,092 83,423 11.37% 1.20%

Appendix I: NERC Reference Case – Annual Demand Tables
NERC | 2012 Long‐Term Reliability Assessment | November 2012
Page 261 of 335
Annual Total Internal Demand – Summer Assessment Area/Country 2013 2014 2015 2016 2017 2018 2019 2020 2021 2022 10‐Year Change CAGR
ERCOT 66,928 69,721 73,054 75,366 76,821 78,002 78,351 80,176 81,410 82,507 15,579 23.28% 2.35%
FRCC 46,270 46,857 47,758 48,594 49,244 49,643 50,356 51,191 51,933 52,583 6,313 13.64% 1.43%
MISO 94,279 96,129 96,929 97,811 98,729 99,611 100,565 101,530 102,559 103,584 9,305 9.87% 1.05%
MRO‐MAPP 4,995 5,117 5,230 5,503 5,560 5,643 5,746 5,840 5,928 6,015 1,020 20.42% 2.09%
NPCC‐New England 27,765 28,275 28,840 29,400 29,895 30,275 30,605 30,930 31,255 31,583 3,818 13.75% 1.44%
NPCC‐New York 33,696 33,914 34,151 34,345 34,550 34,868 35,204 35,526 35,913 36,230 2,534 7.52% 0.81%
PJM 156,254 159,842 163,168 165,691 167,433 169,032 170,860 172,793 174,638 176,420 20,166 12.91% 1.36%
SERC‐E 43,733 44,457 44,903 45,436 45,939 46,358 46,908 47,487 48,149 48,697 4,964 11.35% 1.20%
SERC‐N 45,750 46,542 47,303 47,974 48,660 49,288 50,090 50,868 51,345 52,038 6,288 13.74% 1.44%
SERC‐SE 49,799 50,838 51,431 52,045 52,789 53,256 53,948 54,645 55,600 56,512 6,713 13.48% 1.42%
SERC‐W 25,921 26,166 26,563 26,881 27,199 27,505 27,863 28,153 28,435 28,730 2,809 10.84% 1.15%
SPP 55,180 55,732 55,766 56,364 57,055 57,591 58,378 59,239 59,904 60,088 4,908 8.90% 0.95%
WECC‐BASN 13,776 14,144 14,482 14,765 15,081 15,306 15,550 15,786 15,994 15,914 2,138 15.52% 1.62%
WECC‐CALN 26,645 26,971 27,298 27,904 28,211 28,507 28,834 29,160 29,487 29,912 3,267 12.26% 1.29%
WECC‐CALS 31,319 31,896 32,472 32,821 33,254 33,666 34,090 34,666 35,243 35,615 4,296 13.72% 1.44%
WECC‐DSW 27,576 27,847 28,179 28,679 29,157 29,686 30,204 30,764 31,305 31,602 4,026 14.60% 1.53%
WECC‐NORW 24,380 24,694 24,967 25,270 25,560 25,797 26,034 26,295 26,561 26,858 2,478 10.16% 1.08%
WECC‐ROCK 11,904 12,107 12,330 12,563 12,763 12,970 13,176 13,404 13,615 13,771 1,867 15.68% 1.63%
TOTAL‐UNITED STATES 786,170 801,249 814,823 827,411 837,899 847,005 856,761 868,453 879,275 888,660 102,490 13.04% 1.37%
MRO‐Manitoba Hydro 3,210 3,238 3,207 3,244 3,286 3,221 3,271 3,348 3,428 3,474 264 8.24% 0.88%
MRO‐SaskPower 3,275 3,426 3,535 3,624 3,721 3,709 3,756 3,807 3,875 3,938 663 20.24% 2.07%
NPCC‐Maritimes 3,435 3,469 3,448 3,441 3,447 3,459 3,471 3,494 3,506 3,514 79 2.30% 0.25%
NPCC‐Ontario 23,301 23,080 22,859 22,638 22,471 22,583 22,891 23,010 23,390 23,442 142 0.61% 0.07%
NPCC‐Québec 21,115 21,550 21,642 21,883 22,008 22,125 22,307 22,503 22,662 22,818 1,704 8.07% 0.87%
WECC‐AESO 10,941 11,548 12,077 12,642 13,146 13,560 13,974 14,374 14,765 15,131 4,190 38.30% 3.67%
WECC‐BC 8,449 8,684 8,834 8,913 9,043 9,167 9,289 9,427 9,553 9,670 1,221 14.45% 1.51%
TOTAL‐CANADA 73,726 74,995 75,602 76,385 77,123 77,824 78,958 79,964 81,179 81,988 8,262 11.21% 1.19%
WECC‐MEXW 2,203 2,260 2,317 2,374 2,431 2,488 2,545 2,602 2,659 2,716 513 23.29% 2.35%
TOTAL‐MÉXICO 2,203 2,260 2,317 2,374 2,431 2,488 2,545 2,602 2,659 2,716 513 23.29% 2.35%
TOTAL‐NERC 862,098 878,504 892,742 906,170 917,453 927,317 938,265 951,019 963,113 973,364 111,266 12.91% 1.36%
Annual Total Internal Demand – Winter Assessment Area/Country 2013 2014 2015 2016 2017 2018 2019 2020 2021 2022 10‐Year Change CAGR
ERCOT 51,734 52,063 54,972 56,028 58,869 59,202 59,318 60,039 60,917 63,336 11,602 22.43% 2.27%
FRCC 46,367 47,568 48,172 48,797 49,298 49,908 50,570 51,218 51,921 52,408 6,041 13.03% 1.37%
MISO 72,572 78,143 78,773 79,521 80,104 80,891 81,649 82,252 83,064 83,894 11,322 15.60% 1.62%
MRO‐MAPP 4,858 4,999 5,074 5,335 5,412 5,522 5,623 5,718 5,814 5,904 1,047 21.55% 2.19%
NPCC‐New England 22,510 22,670 22,825 22,960 23,090 23,210 23,330 23,445 23,565 23,686 1,176 5.22% 0.57%
NPCC‐New York 24,929 24,999 25,053 25,149 25,153 25,265 25,422 25,627 25,794 25,908 979 3.93% 0.43%
PJM 132,160 134,771 136,911 138,567 139,662 140,844 142,018 143,419 144,836 146,116 13,956 10.56% 1.12%
SERC‐E 43,582 43,977 44,520 44,993 45,487 46,003 46,648 47,201 47,797 48,395 4,813 11.04% 1.17%
SERC‐N 45,713 46,433 47,166 47,967 48,659 49,266 49,932 50,584 51,397 51,914 6,201 13.56% 1.42%
SERC‐SE 46,534 47,197 47,814 48,485 48,978 49,665 50,338 51,193 52,029 52,894 6,360 13.67% 1.43%
SERC‐W 20,497 20,835 20,992 21,493 21,908 22,215 21,923 22,539 22,707 23,082 2,585 12.61% 1.33%
SPP 41,714 42,010 42,040 42,644 43,069 43,590 44,223 44,794 45,334 45,726 4,012 9.62% 1.03%
WECC‐BASN 11,134 11,215 11,472 11,721 11,945 12,123 12,245 12,331 12,463 12,437 1,303 11.70% 1.24%
WECC‐CALN 18,664 18,977 19,212 19,498 19,689 19,898 20,048 20,198 20,348 20,498 1,834 9.83% 1.05%
WECC‐CALS 23,229 23,753 24,106 24,332 24,697 25,051 25,440 25,994 26,403 26,607 3,378 14.54% 1.52%
WECC‐DSW 18,124 18,380 18,721 19,117 19,477 19,830 20,235 20,553 20,780 21,065 2,941 16.23% 1.69%
WECC‐NORW 30,270 30,577 30,843 31,148 31,450 31,705 31,971 32,195 32,512 32,759 2,488 8.22% 0.88%
WECC‐ROCK 9,833 9,978 10,189 10,486 10,672 10,877 11,072 11,200 11,401 11,521 1,688 17.17% 1.78%
TOTAL‐UNITED STATES 664,424 678,545 688,855 698,239 707,619 715,065 722,005 730,501 739,081 748,149 83,725 12.60% 1.33%
MRO‐Manitoba Hydro 4,661 4,712 4,723 4,781 4,845 4,801 4,878 4,981 5,089 5,162 501 10.76% 1.14%
MRO‐SaskPower 3,671 3,829 3,950 4,050 4,159 4,145 4,198 4,255 4,330 4,401 730 19.89% 2.04%
NPCC‐Maritimes 5,421 5,420 5,419 5,444 5,462 5,489 5,492 5,513 5,530 5,552 131 2.42% 0.27%
NPCC‐Ontario 22,192 21,890 21,500 21,153 20,719 20,700 21,063 21,234 21,441 21,529 ‐663 ‐2.99% ‐0.34%
NPCC‐Québec 37,810 38,062 38,527 38,845 39,189 39,487 39,812 40,079 40,317 40,575 2,766 7.31% 0.79%
WECC‐AESO 11,664 12,162 12,801 13,382 13,856 14,351 14,759 15,162 15,618 15,994 4,330 37.12% 3.57%
WECC‐BC 11,416 11,738 11,943 12,050 12,073 12,223 12,373 12,523 12,673 12,823 1,407 12.32% 1.30%
TOTAL‐CANADA 96,835 97,812 98,863 99,706 100,303 101,196 102,575 103,747 104,997 106,037 9,202 9.50% 1.01%
WECC‐MEXW 1,494 1,532 1,571 1,610 1,648 1,687 1,725 1,764 1,803 1,841 347 23.23% 2.35%
TOTAL‐MÉXICO 1,494 1,532 1,571 1,610 1,648 1,687 1,725 1,764 1,803 1,841 347 23.23% 2.35%
TOTAL‐NERC 762,753 777,889 789,289 799,555 809,570 817,948 826,305 836,012 845,882 856,027 93,274 12.23% 1.29%

Appendix II: NERC‐Wide Transmission Additions, Upgrades, and Retirements
NERC | 2012 Long‐Term Reliability Assessment | November 2012
Page 262 of 335
Appendix II: NERC-Wide Transmission Additions, Upgrades, and Retirements Table Notes
Includes 100 kV and above transmission additions, upgrades, and retirements with in‐service dates from 2012‐2022, as reported by each NERC Assessment Area.
Line length in circuit miles is presented in terms of net change; relining, rerating and other upgrades typically result in no change in line length, while retired lines result in negative circuit miles (unless otherwise noted).
Project status categories are defined below: o UC: Project Under Construction o P: New Planned Project o U: Planned Upgrade of Existing Line o C: New Conceptual Project o R: Retirement of Existing Line

Appendix II: NERC‐Wide Transmission Additions, Upgrades, and Retirements
NERC | 2012 Long‐Term Reliability Assessment | November 2012
Page 263 of 335
Assessment Area Transmission Project Name Status
Terminal Origin Locaction Terminal End Location
Length (Circuit Miles)
Operating Voltage
(kV) Current(AC/DC)
Capacity Rating(MVA)
In‐Service
Year
ERCOT 00TPIT0004 C DeCordova Benbrook 27.0 300‐399 AC Unknown 2018
ERCOT 00TPITno07 C Loma Alta Substation Rio Hondo Substation 35.0 300‐399 AC Unknown 2018
ERCOT 05TPIT0065 P Highway 32 Wimberley 4.0 121‐150 AC Unknown 2014
ERCOT 06TPIT0036 C Ennis Switch Ennis 6.3 121‐150 AC Unknown 2018
ERCOT 06TPIT0042 C Lake Wichita Switch Wichitia Falls Switch 6.3 121‐150 AC Unknown 2018
ERCOT 06TPIT0043 C Sherry Liggett 13.0 121‐150 AC Unknown 2014
ERCOT 06TPIT0047 C Elkton Tyler 5.0 121‐150 AC Unknown 2018
ERCOT 06TPIT0068 C Hamilton Road Picacho 8.7 121‐150 AC Unknown 2018
ERCOT 06TPIT0082 C Buena Vista Picacho 3.0 121‐150 AC Unknown 2018
ERCOT 06TPIT0083 C Del Rio Buena Vista 3.0 121‐150 AC Unknown 2018
ERCOT 06TPIT0084 C Hamilton Road Del Rio 3.0 121‐150 AC Unknown 2018
ERCOT 06TPIT0112 P Lakeway Substation Lakeway Substation 0.9 121‐150 AC Unknown 2012
ERCOT 06TPIT0143 C Temple Switch Temple SE 4.4 121‐150 AC Unknown 2014
ERCOT 07TPIT0001 C Liggett Trinity Switch 12.8 300‐399 AC Unknown 2018
ERCOT 07TPIT0012 C Trinity Switch Richland 0.5 121‐150 AC Unknown 2018
ERCOT 07TPIT0014 C Plano West Richardson Tap 1.9 121‐150 AC Unknown 2020
ERCOT 07TPIT0017 C Handley Hurst 18.7 121‐150 AC Unknown 2012
ERCOT 07TPIT0027 UC CPS Lytle ETT Lytle 4.0 121‐150 AC Unknown 2012
ERCOT 07TPIT0050 P Decker Switchyard Techridge Substation 4.5 121‐150 AC Unknown 2013
ERCOT 07TPIT0060 P Howard Lane Substation Techridge Substation 1.7 121‐150 AC Unknown 2015
ERCOT 07TPIT0069 C Sterrett Sardis 2.0 121‐150 AC Unknown 2022
ERCOT 07TPIT0073 C Venus Webb 11.3 300‐399 AC Unknown 2020
ERCOT 07TPIT0083 C Picacho CFE 8.8 121‐150 AC Unknown 2018
ERCOT 07TPIT0115 C Elgiin Switch Taylor 11.4 121‐150 AC Unknown 2018
ERCOT 07TPIT0119 C Lavon Switch Allen Switch 8.9 121‐150 AC Unknown 2018
ERCOT 07TPIT0122 C Royse Dalrock 6.8 121‐150 AC Unknown 2018
ERCOT 07TPIT0126 P Tricorner Seagoville 9.4 300‐399 AC Unknown 2014
ERCOT 07TPIT0138 C Oats (GPL) Garland Bobtown Tap 1.5 121‐150 AC Unknown 2018
ERCOT 07TPIT0140 C Trinidad Watermill 52.0 300‐399 AC Unknown 2014
ERCOT 07TPIT0234 C Collin Switch NW. Carrollton 19.3 300‐399 AC Unknown 2022
ERCOT 07TPIT0236 C N. Terrell Tap Rose Hill 8.7 121‐150 AC Unknown 2014
ERCOT 08TPIT0007 C Austin Ranch Hebron 0.7 121‐150 AC Unknown 2018
ERCOT 08TPIT0018 UC Uvalde Castroville 77.5 121‐150 AC Unknown 2012
ERCOT 08TPIT0033 P Gilleland Substation Techridge Substation 8.0 300‐399 AC Unknown 2015
ERCOT 08TPIT0034 P McNeil Substation Summit Substation 2.0 121‐150 AC Unknown 2012
ERCOT 08TPIT0069 C Lake Creek East Waco 10.5 121‐150 AC Unknown 2018
ERCOT 08TPIT0097 UC Rhome Roanoke 16.6 121‐150 AC Unknown 2013
ERCOT 08TPIT0104 C Elgin Switching Station Elgin 5.9 121‐150 AC Unknown 2014
ERCOT 08TPIT0107 C Leon Flat Creek 19.5 121‐150 AC Unknown 2012
ERCOT 08TPIT0109 C Payne Collin Switching Station 31.8 121‐150 AC Unknown 2020
ERCOT 08TPIT0111 C Lufkin Switching Station Texas Foundries Tap 0.7 121‐150 AC Unknown 2018
ERCOT 08TPIT0153 C Elkton Athens North Tap 29.1 121‐150 AC Unknown 2014
ERCOT 09TPIT0011 C Cagnon Hill Country 19.5 300‐399 AC Unknown 2020
ERCOT 09TPIT0012 C Hill Country Skyline 11.0 300‐399 AC Unknown 2016
ERCOT 09TPIT0037 P Blossom Harmony Hills/Skyline 0.1 121‐150 AC Unknown 2014
ERCOT 09TPIT0043 C Coppell North Lake 4.8 121‐150 AC Unknown 2018
ERCOT 09TPIT0044 C E. Richardson Apollo 2.3 121‐150 AC Unknown 2013
ERCOT 09TPIT0046 C N. Midlothian Midlothian TXI Tap 6.2 121‐150 AC Unknown 2018
ERCOT 09TPIT0047 C N. Waco NE. Waco 1.9 121‐150 AC Unknown 2020
ERCOT 09TPIT0050 C Rowlett Garland Bobtown Tap 4.1 121‐150 AC Unknown 2018
ERCOT 09TPIT0051 C Saldo Switch Cedar Valley Switch 7.0 121‐150 AC Unknown 2018
ERCOT 09TPIT0066 C Boggy Creek Boggy Creek 3.5 121‐150 AC Unknown 2018
ERCOT 09TPIT0073 P Switch 1377 at Jupiter Switch 6612 at Apollo 2.0 121‐150 AC Unknown 2012
ERCOT 09TPIT0074 P Switch 1378 at Jupiter Switch 931 at Lawler Tap 1.5 121‐150 AC Unknown 2012
ERCOT 09TPIT0076 P Switch 932atLawler Tap Switch 6832 at College 2.0 121‐150 AC Unknown 2012
ERCOT 09TPIT0117 C Stryker Creek Dialville 15.2 121‐150 AC Unknown 2014
ERCOT 09TPIT0118 C Fisher Road Wichita Falls 1.5 121‐150 AC Unknown 2020
ERCOT 09TPIT0120 C Sun Switch Sacroc 12.8 121‐150 AC Unknown 2012
ERCOT 09TPIT0121 C Sun Switch Sacroc 1.8 121‐150 AC Unknown 2012
ERCOT 09TPIT0122 C Shamburger Tyler NW 6.3 121‐150 AC Unknown 2020
ERCOT 10TPIT0001 C Trumbo Leon Creek/Pleasanton 0.1 121‐150 AC Unknown 2016
ERCOT 10TPIT0009 C Trinity Switch Hurst 4.0 121‐150 AC Unknown 2018
ERCOT 10TPIT0010 C Coppell Roanoke 17.0 121‐150 AC Unknown 2012
ERCOT 10TPIT0013 C Apollo East Richardson 1.4 121‐150 AC Unknown 2013

Appendix II: NERC‐Wide Transmission Additions, Upgrades, and Retirements
NERC | 2012 Long‐Term Reliability Assessment | November 2012
Page 264 of 335
Assessment Area Transmission Project Name Status
Terminal Origin Locaction Terminal End Location
Length (Circuit Miles)
Operating Voltage
(kV) Current(AC/DC)
Capacity Rating(MVA)
In‐Service
Year
ERCOT 10TPIT0017 C Allen Switch Collin Junction 9.0 121‐150 AC Unknown 2014
ERCOT 10TPIT0018 C Austin Ranch Colony 4.6 121‐150 AC Unknown 2012
ERCOT 10TPIT0019 C Everman Cleburne Switch 8.5 121‐150 AC Unknown 2020
ERCOT 10TPIT0020 P Anna Switch Krum W. Switch 140.0 300‐399 AC Unknown 2013
ERCOT 10TPIT0024 P Stoney Ridge Substation Stoney Ridge Substation 0.1 121‐150 AC Unknown 2012
ERCOT 10TPIT0025 P Rinard Creek substation Rinard Creek Substation 0.1 121‐150 AC Unknown 2015
ERCOT 10TPIT0028 C Escondido West Batesville 46.2 121‐150 AC Unknown 2018
ERCOT 10TPIT0032 C Arco (TMPA) Krugerville 5.6 121‐150 AC Unknown 2012
ERCOT 10TPIT0038 P Switch 8832 at College Switch 1364 at Brand 4.2 121‐150 AC Unknown 2013
ERCOT 10TPIT0041 P Temple Switch Salado Switch 15.2 300‐399 AC Unknown 2012
ERCOT 10TPIT0049 P Koppe Bridge Wellborn 5.8 121‐150 AC Unknown 2012
ERCOT 10TPIT0063 P Geronimo CMC 5.5 121‐150 AC Unknown 2014
ERCOT 10TPIT0086 P East Abilene Putnam 32.0 121‐150 AC Unknown 2012
ERCOT 10TPIT0091 C Elm Mott Waco Northcrest 3.6 121‐150 AC Unknown 2020
ERCOT 10TPIT0095 P VH Braunig Grandview 2.1 121‐150 AC Unknown 2012
ERCOT 11TPIT0001 P Lobo Rio Bravo 30.0 300‐399 AC Unknown 2016
ERCOT 11TPIT0002 P Lobo North Edinburg 163.0 300‐399 AC Unknown 2016
ERCOT 11TPIT0008 P Rainey St Substation Rainey St Substation 0.1 121‐150 AC Unknown 2017
ERCOT 11TPIT0009 P Dunlap Substation Dunlap Substation 0.1 121‐150 AC Unknown 2014
ERCOT 11TPIT0011 P Northeast Substation Northeast Substation 0.1 121‐150 AC Unknown 2017
ERCOT 11TPIT0012 C Euless Grapevine Ball Street 5.9 121‐150 AC Unknown 2020
ERCOT 11TPIT0015 C Sherry Grand Prairie 11.4 121‐150 AC Unknown 2015
ERCOT 11TPIT0024 C various various 5.8 121‐150 AC Unknown 2012
ERCOT 11TPIT0028 C Allen Switch West Plano Switch 3.5 121‐150 AC Unknown 2018
ERCOT 11TPIT0032 C NW Carrollton Collin 16.9 121‐150 AC Unknown 2014
ERCOT 11TPIT0033 C Saginaw American MFG Tap 1.4 121‐150 AC Unknown 2020
ERCOT 11TPIT0047 P Twin Buttes Brown 0.2 300‐399 AC Unknown 2012
ERCOT 11TPIT0050 C Roanoke Switch Elizabeth Creek 3.8 121‐150 AC Unknown 2015
ERCOT 11TPIT0050 C Hicks Switch Elizabeth Creek 10.0 121‐150 AC Unknown 2015
ERCOT 11TPIT0065 C Ector Co. North Switch Moss 20.5 121‐150 AC Unknown 2012
ERCOT 11TPIT0072a UC Garrott Midtown 1.5 121‐150 AC Unknown 2012
ERCOT 11TPIT0072b UC Midtown Polk 1.0 121‐150 AC Unknown 2012
ERCOT 11TPIT0076 P Cottonwood Dermott 74.2 300‐399 AC Unknown 2012
ERCOT 11TPIT0081 UC Switch 7512 at Plastipak Switch 8702 at Shiloh 1.5 121‐150 AC Unknown 2012
ERCOT 11TPIT0085 P Doedyns Sioux 5.5 121‐150 AC Unknown 2013
ERCOT 11TPIT0101 P Reno Rhome 13.9 121‐150 AC Unknown 2012
ERCOT 11TPIT0110b P Weslaco Switch Valverde 4.5 121‐150 AC Unknown 2012
ERCOT 11TPIT0111 P Thompson Creek Koppe Bridge 17.0 121‐150 AC Unknown 2012
ERCOT 11TPIT0114 P Alberta Switch Doedyns 3.1 121‐150 AC Unknown 2013
ERCOT 11TPIT0179 C Hicks Switch Elizabeth Creek 10.0 121‐150 AC Unknown 2015
ERCOT 12TPIT0004 C Sulpher Springs OW Sommers/Kirby 0.1 121‐150 AC Unknown 2018
ERCOT 12TPIT0009 P Masterson Rd. Cagnon/Valley/Howard 20.0 121‐150 AC Unknown 2018
ERCOT 12TPIT0015 P Barney Davis Laguna 4.2 121‐150 AC Unknown 2014
ERCOT 12TPIT0026 P Odessa North McCamey 59.6 300‐399 AC Unknown 2013
ERCOT 12TPIT0027 P Bakersfield North McCamey 15.9 300‐399 AC Unknown 2013
ERCOT 12TPIT0028 P Twin Buttes Big Hill 31.0 300‐399 AC Unknown 2012
ERCOT 12TPIT0029 P Big Hill Kendall 274.0 300‐399 AC Unknown 2013
ERCOT 12TPIT0036 P Brown Newton 98.6 300‐399 AC Unknown 2012
ERCOT 12TPIT0037 P Newton Killeen Switch 27.9 300‐399 AC Unknown 2012
ERCOT 12TPIT0038 P Brown Killeen Switch 126.5 300‐399 AC Unknown 2012
ERCOT 12TPIT0043 UC Bluff Creek Brown 86.6 300‐399 AC Unknown 2012
ERCOT 12TPIT0044 UC Central Bluff Brown 96.1 300‐399 AC Unknown 2012
ERCOT 12TPIT0046 UC ZENITH Gertie 10.0 300‐399 AC Unknown 2012
ERCOT 12TPIT0047 UC Kluge Addicks 6.1 121‐150 AC Unknown 2012
ERCOT 12TPIT0047b UC ZENITH ADDICKS 1.5 121‐150 AC Unknown 2012
ERCOT 12TPIT0047c UC CAMRON KLUGE 4.6 121‐150 AC Unknown 2012
ERCOT 12TPIT0049 P Cottonwood Silverton 64.5 300‐399 AC Unknown 2013
ERCOT 12TPIT0051 P Silverton Nazareth 46.0 300‐399 AC Unknown 2013
ERCOT 12TPIT0052 P Nazareth Hereford 25.5 300‐399 AC Unknown 2013
ERCOT 12TPIT0056 P Grelton Long Draw 55.4 300‐399 AC Unknown 2013
ERCOT 12TPIT0057 P Grelton Odessa 49.9 300‐399 AC Unknown 2013
ERCOT 12TPIT0058 P Long Draw Scurry 50.7 300‐399 AC Unknown 2013
ERCOT 12TPIT0059 P Sand Bluff Divide 37.0 300‐399 AC Unknown 2013
ERCOT 12TPIT0060 P Berkat Sandbluff 28.9 300‐399 AC Unknown 2013
ERCOT 12TPIT0061 P Sand Bluff Long Draw 77.4 300‐399 AC Unknown 2013
ERCOT 12TPIT0068 C South Bend Switch Morris Sheppard 18.2 121‐150 AC Unknown 2013
ERCOT 12TPIT0072 P Ferguson Wirtz 4.0 121‐150 AC Unknown 2012

Appendix II: NERC‐Wide Transmission Additions, Upgrades, and Retirements
NERC | 2012 Long‐Term Reliability Assessment | November 2012
Page 265 of 335
Assessment Area Transmission Project Name Status
Terminal Origin Locaction Terminal End Location
Length (Circuit Miles)
Operating Voltage
(kV) Current(AC/DC)
Capacity Rating(MVA)
In‐Service
Year
ERCOT 12TPIT0078 C Southeast Nacogdoches Lufkin Switch 13.0 300‐399 AC Unknown 2022
ERCOT 12TPIT0079 C Roanoke Switch Coppell 19.6 121‐150 AC Unknown 2013
ERCOT 12TPIT0081 P Merida Medina Base 0.1 121‐150 AC Unknown 2013
ERCOT 12TPIT0082 P Hotwells Ball Park/Deely 0.1 121‐150 AC Unknown 2012
ERCOT 12TPIT0083 P S 8512 at Firewheel Lookout 1.3 121‐150 AC Unknown 2012
ERCOT 12TPIT0085 P Switch 8622 at Apollo Lookout 2.8 121‐150 AC Unknown 2012
ERCOT 12TPIT0095b UC TXGULF West Columbia 27.5 121‐150 AC Unknown 2012
ERCOT 12TPIT0115 P Bullick Hollow Marshall Ford/Balcones 2.3 121‐150 AC Unknown 2012
ERCOT 12TPIT0116 P Scarscale El Dorado/S.Houston 0.9 121‐150 AC Unknown 2012
ERCOT 12TPIT0118 C Elkton S Tyler 2.8 121‐150 AC Unknown 2012
ERCOT 12TPIT0128 P WA Parish Sienna 4.2 121‐150 AC Unknown 2012
ERCOT 12TPIT0134 P St Jo Capps Corner 8.6 121‐150 AC Unknown 2012
ERCOT 12TPIT0135 P Spring Bridgeport Switch 33.3 121‐150 AC Unknown 2013
ERCOT 12TPIT0136 UC El Gato Sioux 5.4 121‐150 AC Unknown 2012
ERCOT 12TPIT0141 C Dinero Dinero 0.5 121‐150 AC Unknown 2012
ERCOT 12TPIT0165 P Fairbanks Deihl 3.6 121‐150 AC Unknown 2012
ERCOT 12TPIT0165a P Deihl White Oak 4.1 121‐150 AC Unknown 2012
ERCOT 12TPIT0167 P Crockett Northside 2.5 121‐150 AC Unknown 2012
ERCOT 12TPIT0169 P Bellaire Ulrich 3.4 121‐150 AC Unknown 2012
ERCOT 12TPIT0170 P Airline White Oak 3.0 121‐150 AC Unknown 2012
ERCOT 12TPIT0171 P HO Clarke Knight 3.9 121‐150 AC Unknown 2012
ERCOT 12TPIT0172 P Western Dawson Patricia 7.5 300‐399 AC Unknown 2012
ERCOT 12TPIT0173 P Austin Kirby 2.8 121‐150 AC Unknown 2012
ERCOT 12TPIT0178 P EXTER HASTINGS 0.1 121‐150 AC Unknown 2012
ERCOT 12TPIT0185 C Airline Cabaniss 5.5 121‐150 AC Unknown 2014
ERCOT 13TPIT0011 C Palo Alto Leon Creek/Chavaneaus 0.1 121‐150 AC Unknown 2013
ERCOT 13TPIT0016 P Greens Prairie Wellborn 4.0 121‐150 AC Unknown 2013
ERCOT 13TPIT0018 P Bakersfield Big Hill 112.0 300‐399 AC Unknown 2013
ERCOT 13TPIT0019 P Riley Edith Clarke 86.6 300‐399 AC Unknown 2013
ERCOT 13TPIT0020 P Tesla Edith Clarke 110.4 300‐399 AC Unknown 2013
ERCOT 13TPIT0021 P Cottonwood Edith Clarke 178.0 300‐399 AC Unknown 2013
ERCOT 13TPIT0022 P Tesla Riley 131.2 300‐399 AC Unknown 2013
ERCOT 13TPIT0030 P Dermott Clear Crossing 180.6 300‐399 AC Unknown 2013
ERCOT 13TPIT0032 P Edith Clarke Clear Crossing 158.4 300‐399 AC Unknown 2013
ERCOT 13TPIT0033 P Clear Crossing West Shackleford 67.6 300‐399 AC Unknown 2013
ERCOT 13TPIT0035 P Willow Creek Dermott Switch 220.0 300‐399 AC Unknown 2013
ERCOT 13TPIT0036 P Krum West Riley 322.8 300‐399 AC Unknown 2013
ERCOT 13TPIT0039 P Hicks Switch Willow Creek 80.4 300‐399 AC Unknown 2013
ERCOT 13TPIT0042 P White Deer Hereford 91.2 300‐399 AC Unknown 2013
ERCOT 13TPIT0045 P Blumenthal Kendall CTEC/Mt. Top 8.4 121‐150 AC Unknown 2017
ERCOT 13TPIT0046 P Flatonia Yoakum Gartner Road 27.7 121‐150 AC Unknown 2013
ERCOT 13TPIT0047 P Parkway EC Mornhinweg 8.0 121‐150 AC Unknown 2014
ERCOT 13TPIT0048 UC Scurry County South West Shackelford 204.0 300‐399 AC Unknown 2013
ERCOT 13TPIT0049 UC West Shackelford C1 ‐ Sam C2 Navarro 402.0 300‐399 AC Unknown 2013
ERCOT 13TPIT0050 P Silverton White Deer 68.2 300‐399 AC Unknown 2013
ERCOT 13TPIT0051 P Gray Tesla 218.0 300‐399 AC Unknown 2013
ERCOT 13TPIT0054 P Gray White Deer 80.0 300‐399 AC Unknown 2013
ERCOT 13TPIT0055 P Silverton Tesla 170.0 300‐399 AC Unknown 2013
ERCOT 13TPIT0058 P Summit Substation Williamson Substation 3.5 121‐150 AC Unknown 2014
ERCOT 13TPIT0059 C Cedar Crest Industrial 3.2 121‐150 AC Unknown 2020
ERCOT 13TPIT0060 C Cedar Hill Switch Mountain Creek 11.4 121‐150 AC Unknown 2014
ERCOT 13TPIT0061 C Terrell Switch North Terrell Tap 7.9 121‐150 AC Unknown 2015
ERCOT 13TPIT0066 P GPI EC Mornhinweg 2.7 121‐150 AC Unknown 2012
ERCOT 13TPIT0068 P Helotes Grissom 0.5 121‐150 AC Unknown 2012
ERCOT 13TPIT0069 P Panther Springs Hill Country/Stonegate 0.1 121‐150 AC Unknown 2013
ERCOT 13TPIT0077 P Kendall Paleface 56.9 121‐150 AC Unknown 2013
ERCOT 13TPIT0079 P Alvin North Alvin 2.1 121‐150 AC Unknown 2014
ERCOT 13TPIT0092 C Killeen Switch Harker Heights 15.0 121‐150 AC Unknown 2013
ERCOT 13TPIT0094 C Lamesa Ackerly 21.5 121‐150 AC Unknown 2013
ERCOT 13TPIT0099 P League City Magnolia 3.6 121‐150 AC Unknown 2013
ERCOT 13TPIT0106 P Killeen SS Ding Dong 23.8 121‐150 AC Unknown 2013
ERCOT 13TPIT0108 P Nelson Sharpe Ajo 37.0 300‐399 AC Unknown 2013
ERCOT 13TPIT0109 P Ajo Rio Hondo 66.7 300‐399 AC Unknown 2013
ERCOT 13TPIT0119 P Vanderbilt Ricebird 52.0 121‐150 AC Unknown 2013
ERCOT 13TPIT0121 C Tilden TBD 48.0 121‐150 AC Unknown 2013
ERCOT 13TPIT0129 P George West Tilden 20.6 121‐150 AC Unknown 2013
ERCOT 13TPIT0130 C San Miguel Fashing 20.6 121‐150 AC Unknown 2013

Appendix II: NERC‐Wide Transmission Additions, Upgrades, and Retirements
NERC | 2012 Long‐Term Reliability Assessment | November 2012
Page 266 of 335
Assessment Area Transmission Project Name Status
Terminal Origin Locaction Terminal End Location
Length (Circuit Miles)
Operating Voltage
(kV) Current(AC/DC)
Capacity Rating(MVA)
In‐Service
Year
ERCOT 13TPIT0131 C Oaks Fashing 38.0 121‐150 AC Unknown 2013
ERCOT 13TPIT0135 C Holt Switch Goldsmith Substation 5.0 121‐150 AC Unknown 2013
ERCOT 13TPIT0137 C Odessa North Switch Goldsmith Substation 17.3 121‐150 AC Unknown 2013
ERCOT 13TPIT0139 C Olinger Greenville Interchange 25.0 121‐150 AC Unknown 2013
ERCOT 13TPIT0141 P NORTON HACHER/ENPROD 2.0 121‐150 AC Unknown 2013
ERCOT 13TPIT0143 P El Campo Substation Nada Substation 17.5 121‐150 AC Unknown 2013
ERCOT 13TPIT0149 P Oaks TBD 5.7 121‐150 AC Unknown 2013
ERCOT 13TPIT0152 C Wink Switch Loving 16.6 121‐150 AC Unknown 2013
ERCOT 13TPIT0153 C Moss Odessa EHV 14.2 121‐150 AC Unknown 2013
ERCOT 13TPIT0158 P Bruni MEC Bruni 0.6 121‐150 AC Unknown 2013
ERCOT 13TPIT0162 P Colorado City Oncor Breaker Station 2.1 121‐150 AC Unknown 2013
ERCOT 13TPIT0163 C 0 Jan‐1900 0.3 121‐150 AC Unknown 2013
ERCOT 14TPIT0003 C Ranchtown Helotes/Menger Creek 0.1 121‐150 AC Unknown 2015
ERCOT 14TPIT0004 P Highway 123 Cushman/New Berlin 6.2 121‐150 AC Unknown 2014
ERCOT 14TPIT0010 C Handley Pantego 3.8 121‐150 AC Unknown 2017
ERCOT 14TPIT0011 C Midland East Windwood 1.7 121‐150 AC Unknown 2020
ERCOT 14TPIT0012 C Mountain Creek Norwood 7.2 121‐150 AC Unknown 2014
ERCOT 14TPIT0013 C Norwood East Levee 6.6 121‐150 AC Unknown 2012
ERCOT 14TPIT0014 C NW Carrollton Lakepointe (TNMP) 2.1 121‐150 AC Unknown 2014
ERCOT 14TPIT0015 C Troup Tyler Grande 13.3 121‐150 AC Unknown 2012
ERCOT 14TPIT0016 C West Mesquite Prairie Creek 2.8 121‐150 AC Unknown 2014
ERCOT 14TPIT0020 P SpencerInt.PSS/EBus982 Pockrus SubPSS/E Bus917 3.3 121‐150 AC Unknown 2015
ERCOT 14TPIT0021 P Buttercup Substation Whitestone Substation 2.3 121‐150 AC Unknown 2014
ERCOT 14TPIT0024 P Lon Hill Sand Dollar 11.5 300‐399 AC Unknown 2015
ERCOT 14TPIT0025 P Nopalito Sand Dollar 14.5 300‐399 AC Unknown 2016
ERCOT 14TPIT0026 P Sand Dollar Las Brisas 2.0 300‐399 AC Unknown 2015
ERCOT 14TPIT0029 C Lake Creek Robinson 8.3 121‐150 AC Unknown 2018
ERCOT 14TPIT0037 C Martin Lake Mount Enterprise 1.2 300‐399 AC Unknown 2012
ERCOT 14TPIT0038 P Northland Substation Mag Plant Substation 4.1 121‐150 AC Unknown 2014
ERCOT 14TPIT0040 P Springwoods Rayford/Louetta 3.1 121‐150 AC Unknown 2014
ERCOT 14TPIT0041 P Coliseum Kirby 4.2 121‐150 AC Unknown 2014
ERCOT 14TPIT0042 P Five Points Broadview 9.4 121‐150 AC Unknown 2014
ERCOT 14TPIT0043 C Skyline Tri_Conty/Wiederstein 0.1 121‐150 AC Unknown 2014
ERCOT 14TPIT0047 C W.Denton,N Denton Arco, Pockrus, Teasley 30.0 121‐150 AC Unknown 2014
ERCOT 14TPIT0050 P Lon Hill North Edinburg 122.9 300‐399 AC Unknown 2014
ERCOT 14TPIT0052 C Midland East Stanton East 18.6 121‐150 AC Unknown 2014
ERCOT 14TPIT0053 C Moss Westover 3.4 121‐150 AC Unknown 2014
ERCOT 14TPIT0054 C Odessa Odessa North 7.2 121‐150 AC Unknown 2020
ERCOT 14TPIT0055 C Seagoville Wilmer 10.9 121‐150 AC Unknown 2014
ERCOT 14TPIT0056 C Northaven Welch 6.0 121‐150 AC Unknown 2014
ERCOT 14TPIT0057 C Cedar Hill Switch Mayfield Tap North 4.3 121‐150 AC Unknown 2013
ERCOT 14TPIT0058c P JORDAN BARHIL 0.9 121‐150 AC Unknown 2014
ERCOT 14TPIT0058d P JORDAN NORTON 0.9 121‐150 AC Unknown 2014
ERCOT 14TPIT0058k P BENDER DUNCAN 1.9 121‐150 AC Unknown 2013
ERCOT 14TPIT0058l P CROSBY BENDER 7.9 121‐150 AC Unknown 2013
ERCOT 14TPIT0061 P Atkins Substation Briarcrest Substation 3.4 121‐150 AC Unknown 2014
ERCOT 14TPIT0070 P LaPalma Palo Alto 12.0 121‐150 AC Unknown 2014
ERCOT 15TPIT0003 P Sand Dollar Las Brisas 2.0 300‐399 AC Unknown 2016
ERCOT 15TPIT0004 C Converse Deely/Skyline 0.1 121‐150 AC Unknown 2015
ERCOT 15TPIT0007 C Green Mountain Stonegate 11.5 121‐150 AC Unknown 2015
ERCOT 15TPIT0015 P Hastings Friendswood 7.3 121‐150 AC Unknown 2014
ERCOT 15TPIT0018 P Kerrville Stadium Raymond F Barker 10.1 121‐150 AC Unknown 2015
ERCOT 15TPIT0021 P PHRobinson South Shore 5.6 121‐150 AC Unknown 2015
ERCOT 15TPIT0022 P Dobbin Highway 6 23.0 121‐150 AC Unknown 2015
ERCOT 15TPIT0024 P Lon Hill Nelson Sharpe 20.8 300‐399 AC Unknown 2015
ERCOT 15TPIT0025 C Monticello SES Monticello Tap 20.1 121‐150 AC Unknown 2015
ERCOT 15TPIT0026 P Wellborn Susbstation Millican Substation 3.6 121‐150 AC Unknown 2015
ERCOT 16TPIT0003 P Longneck Princeton 3.5 121‐150 AC Unknown 2016
ERCOT 16TPIT0005 P Farm West Princeton 7.5 121‐150 AC Unknown 2016
ERCOT 16TPIT0006 P Climax Longneck 7.5 121‐150 AC Unknown 2016
ERCOT 16TPIT0007 P McNeil Substation Mag Plant Substation 3.2 121‐150 AC Unknown 2016
ERCOT 16TPIT0009 P Five Points Westside 3.8 121‐150 AC Unknown 2016
ERCOT 16TPIT0010 C Hill Country Bulverde/Stonegate 0.1 121‐150 AC Unknown 2016
ERCOT 16TPIT0016 P Dobbin Fish Creek 15.5 121‐150 AC Unknown 2016
ERCOT 16TPIT0023 C South McAllen Stewart Road 9.8 121‐150 AC Unknown 2016
ERCOT 16TPIT0024 C Hamilton Road Uvalde 53.7 121‐150 AC Unknown 2016
ERCOT 16TPIT0030 P Loma Alta N Edinburgh 106.5 300‐399 AC Unknown 2016

Appendix II: NERC‐Wide Transmission Additions, Upgrades, and Retirements
NERC | 2012 Long‐Term Reliability Assessment | November 2012
Page 267 of 335
Assessment Area Transmission Project Name Status
Terminal Origin Locaction Terminal End Location
Length (Circuit Miles)
Operating Voltage
(kV) Current(AC/DC)
Capacity Rating(MVA)
In‐Service
Year
FRCC Manatee‐Bobwhite P Manatee Bob White 25.0 200‐299 AC 1,195.0 2014
FRCC Bunnell‐St. Johns P St. Johns Pellicer 21.5 200‐299 AC 759.0 2016
FRCC Myakka‐Englewood P Myakka Englewood 3.3 121‐150 AC 357.0 2012
FRCC Coconut Grove Injection P Galloway Coconut Grove 3.0 121‐150 AC 353.0 2020
FRCC Buckingham 230kV injection P Orange River Collier 1.0 200‐299 AC 759.0 2017
FRCC Garden‐Gratigny P Gratigny Country Club 4.5 121‐150 AC 287.0 2016
FRCC Line18Intercon GRECPlant‐GVL P GREC Plant Hague Switch Station 0.8 121‐150 AC 282/282 2012
FRCC Greenland Energy Center to Nocatee P Greenland Energy Nocatee 4.4 200‐299 AC 668/832 2017
FRCC LCEC Lake Trafford ‐ Lehigh South Tap P Lake Trafford Lehigh South Tap 13.0 121‐150 AC 277/326 2015
FRCC LCEC Immokalee West ‐ Immokalee P Immokalee West Immokalee 2.7 121‐150 AC 396/404 2016
FRCC LCEC Ave Maria ‐ Carnestown P Ave Maria Carnestown 5.7 121‐150 AC 396/404 2019
FRCC Kathleen to Zephyrhills North UC Kathleen Zephyrhills N 13.0 200‐299 AC 919/1000 2013
FRCC Intercession to Gifford UC Intercession City Gifford 12.0 200‐299 AC 1260/1370 2013
FRCC Central Plaza to 51st St UC Central Plaza 51st St 1.8 100‐120 AC 392/427 2012
FRCC Brooksville W.‐Brooksville (Rebuild) UC Brooksville West Tangerine 5.1 100‐120 AC 392/427 2012
FRCC 115 kV Line Rebuild P Havana Bradfordville West 10.5 100‐120 AC Unknown 2013
FRCC Atwater‐Quincy ‐ 115 kV Line Rebuild P Atwater Quincy 10.9 100‐120 AC Unknown 2014
FRCC Switch‐115 kV Line Rebuild P Brooksville West Weeki Wachee 3.3 100‐120 AC Unknown 2014
FRCC Jasper‐Wrights Chapel Rebuild P Jasper Wrights Chapel 9.6 100‐120 AC 460.0 2015
FRCC 115 kV Line Rebuilds UC Brooksville Tangerine 4.0 100‐120 AC 392/427 2016
FRCC Lecanto ‐ Inverness ‐ New 115 kV Line P Lecanto Inverness 11.0 100‐120 AC Unknown 2015
FRCC Brooksville West ‐ Brooksville ‐ New P Brooksville West Brooksville 0.0 200‐299 AC 919/1000 2019
FRCC Deltona to Orange City‐ New 115 kV UC DELTONA ORANGE CITY 6.2 100‐120 AC 392/427 2013
FRCC Liberty to Brickyard Tap ‐ new 115 kV P BRICKYARDTP1 LIBERTY 23.6 100‐120 AC 392/427 2014
FRCC 23_1485_MXA P CASSADAGA MONASTERY 3.3 100‐120 AC 203/248 2013
FRCC 24_1485_MXA P DELTONA MONASTERY 4.1 100‐120 AC 203/248 2013
FRCC 72_1016_MXA P DELEON SPRGS DELAND WEST 8.3 100‐120 AC 300/326 2013
FRCC 236_1123_MXA P ORANGE CTY W HIGHBANKS 3.0 100‐120 AC 392/427 2015
FRCC 237_1123_MXA P DELTONA HIGHBANKS 2.0 100‐120 AC 300/326 2015
FRCC 278_1662_MXA P ORANGE CITY ORANGE CTY W 1.5 100‐120 AC 392/427 2015
FRCC 279_1662_MXA P DELTONA ORANGE CTY W 5.0 100‐120 AC 300/326 2015
FRCC 171_1099_MXA P DELAND EAST LK WINNEMISS 3.6 100‐120 AC 159/214 2016
FRCC 172_1099_MXA P LK HELEN LK WINNEMISS 3.6 100‐120 AC 218/262 2016
FRCC 269_1801T2_MJP P HIGGINS 115.00 MORGAN RD SW 115.00 17.0 100‐120 AC 160/230 2017
FRCC 270_1801T2_MJP P GRIFFIN 115.00 MORGAN RD SW 115.00 27.8 100‐120 AC 160/230 2017
FRCC 314_1801T2_MJP P MORGAN RD 115.00 MORGAN RD SW 115.00 5.5 100‐120 AC 460.0 2015
FRCC New 230 kV & Disston 230/115 kV UC DISSTON NORTHEAST 4.2 200‐299 AC 919/1000 2013
FRCC 88_2154_MXA P CITRUS CENT INTERCESSION CITY 1.6 200‐299 AC 1260/1370 2015
FRCC 91_2154_MXA P CITRUS CENT DUNDEE 18.6 200‐299 AC 1260/1370 2015
FRCC Unnamed / Name Unknown C Gilchrist Gen Station Gilchrist E. Switch 10.0 200‐299 AC 1,195.0 2017
FRCC PRECO SR. 70 P S.R. 70 S.R. 70 Tap 3.0 121‐150 AC 115.0 2014
FRCC CEC Birley P Birley Branford 6.0 100‐120 AC Uknown 2018
FRCC CEC Brannan Field P Brannan Field Black Creek 0.3 100‐120 AC Uknown 2020
FRCC LCEC North Trail P North Trail Lee 5.8 121‐150 AC Uknown 2014
FRCC Unnamed P Sub 14 115 Sub 17 115 3.6 100‐120 AC 230.0 2012
FRCC Unnamed / Name Unknown P Sub 14 115 Sub 7 115 6.0 100‐120 AC 232.0 2013
FRCC Unnamed / Name Unknown P Hopkins‐Crawfordville Sub 5 230 8.0 200‐299 AC 458.0 2013
FRCC Unnamed / Name Unknown P Sub 21 115 Sub 17 115 6.0 100‐120 AC 232.0 2012
FRCC Polk 2‐5 CC C Aspen Polk 23.5 200‐299 AC 1,119.0 2017
FRCC Polk 2‐5 CC C Aspen Mines 15.0 200‐299 AC 1,119.0 2017
FRCC Polk 2‐5 CC C Aspen FishHawk (Circuit 1) 6.0 200‐299 AC 1,195.0 2017
FRCC Polk 2‐5 CC C Aspen FishHawk (Circuit 2) 6.0 200‐299 AC 1,195.0 2017
FRCC Polk 2‐5 CC C Polk Mines 12.0 200‐299 AC 1,119.0 2017
FRCC NO NAME OR NAME UNKNOWN C Bayside Power Station Bayside Biomass 0.7 200‐299 AC 729.0 2020
FRCC Clearview‐Himes 138kV circuit P Clearvw Himes 8.2 121‐150 AC 329.0 2018
FRCC Wheeler Road to Thonotosassa P WHEELER THONOTOSASSA 8.3 200‐299 AC 1,119.0 2022
FRCC Pebbledale to Willow Oak P PEBB WILLOW 11.0 200‐299 AC 1,119.0 2022
FRCC Willow Oak to Wheeler Road P WILLOW WHEELER 20.0 200‐299 AC 1,093.0 2022
FRCC Davis Rd‐Dale Mabry P Davis Rd Dlmbry 13.0 200‐299 AC 1,119.0 2019
FRCC Polk 2‐5 CC C Aspen FishHawk (Circuit 1) 6.0 200‐299 AC 1,195.0 2017
FRCC Polk 2‐5 CC C Aspen FishHawk (Circuit 2) 6.0 200‐299 AC 1,195.0 2017
FRCC Polk 2‐5 CC C Polk Mines 12.0 200‐299 AC 1,119.0 2017
FRCC Wheeler Road to Thonotosassa P WHEELER THONOTOSASSA 8.3 200‐299 AC 1,118.6 2016
FRCC Clearview‐Himes 138kV circuit P Clearvw Himes 8.2 121‐150 AC 329.0 2016
FRCC Pebbledale to Willow Oak P PEBB WILLOW 11.0 200‐299 AC 1,118.6 2018
FRCC Polk to FishHawk 230kV Ckt P POLKPLNT FISHHAWK 30.5 200‐299 AC 1,118.6 2018
FRCC Willow Oak to Wheeler Road P WILLOW WHEELER 20.0 200‐299 AC 1,093.5 2018
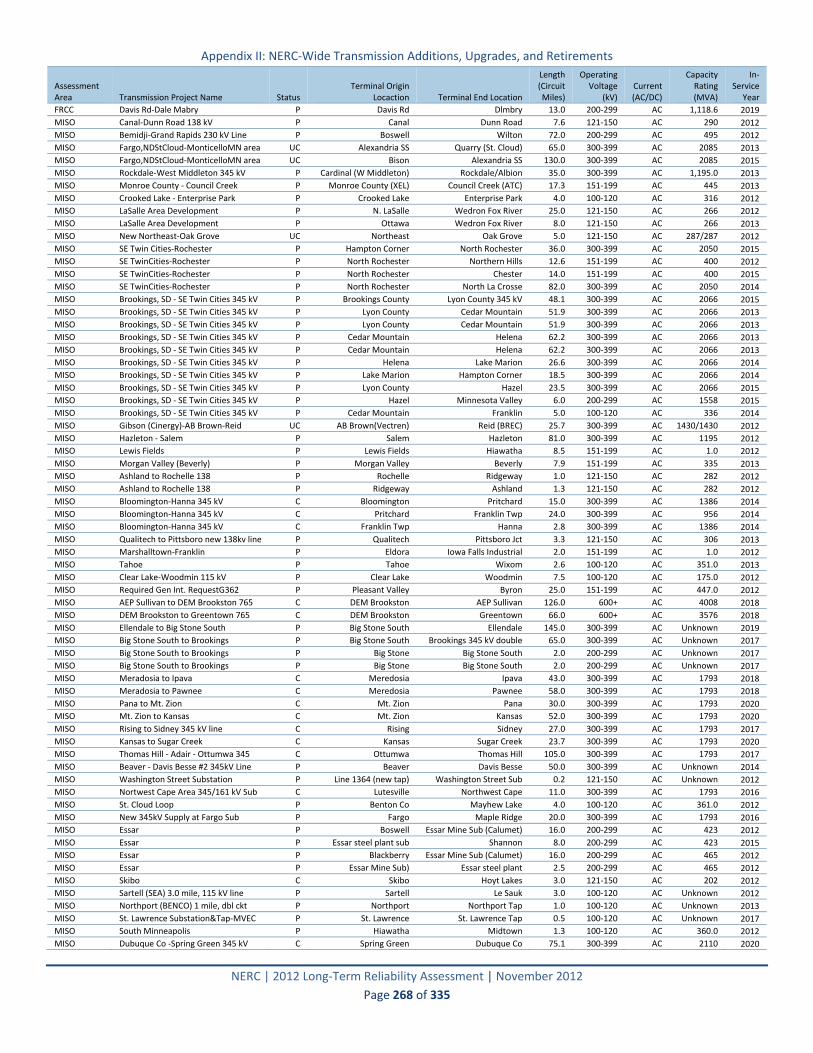
Appendix II: NERC‐Wide Transmission Additions, Upgrades, and Retirements
NERC | 2012 Long‐Term Reliability Assessment | November 2012
Page 268 of 335
Assessment Area Transmission Project Name Status
Terminal Origin Locaction Terminal End Location
Length (Circuit Miles)
Operating Voltage
(kV) Current(AC/DC)
Capacity Rating(MVA)
In‐Service
Year
FRCC Davis Rd‐Dale Mabry P Davis Rd Dlmbry 13.0 200‐299 AC 1,118.6 2019
MISO Canal‐Dunn Road 138 kV P Canal Dunn Road 7.6 121‐150 AC 290 2012
MISO Bemidji‐Grand Rapids 230 kV Line P Boswell Wilton 72.0 200‐299 AC 495 2012
MISO Fargo,NDStCloud‐MonticelloMN area UC Alexandria SS Quarry (St. Cloud) 65.0 300‐399 AC 2085 2013
MISO Fargo,NDStCloud‐MonticelloMN area UC Bison Alexandria SS 130.0 300‐399 AC 2085 2015
MISO Rockdale‐West Middleton 345 kV P Cardinal (W Middleton) Rockdale/Albion 35.0 300‐399 AC 1,195.0 2013
MISO Monroe County ‐ Council Creek P Monroe County (XEL) Council Creek (ATC) 17.3 151‐199 AC 445 2013
MISO Crooked Lake ‐ Enterprise Park P Crooked Lake Enterprise Park 4.0 100‐120 AC 316 2012
MISO LaSalle Area Development P N. LaSalle Wedron Fox River 25.0 121‐150 AC 266 2012
MISO LaSalle Area Development P Ottawa Wedron Fox River 8.0 121‐150 AC 266 2013
MISO New Northeast‐Oak Grove UC Northeast Oak Grove 5.0 121‐150 AC 287/287 2012
MISO SE Twin Cities‐Rochester P Hampton Corner North Rochester 36.0 300‐399 AC 2050 2015
MISO SE TwinCities‐Rochester P North Rochester Northern Hills 12.6 151‐199 AC 400 2012
MISO SE TwinCities‐Rochester P North Rochester Chester 14.0 151‐199 AC 400 2015
MISO SE TwinCities‐Rochester P North Rochester North La Crosse 82.0 300‐399 AC 2050 2014
MISO Brookings, SD ‐ SE Twin Cities 345 kV P Brookings County Lyon County 345 kV 48.1 300‐399 AC 2066 2015
MISO Brookings, SD ‐ SE Twin Cities 345 kV P Lyon County Cedar Mountain 51.9 300‐399 AC 2066 2013
MISO Brookings, SD ‐ SE Twin Cities 345 kV P Lyon County Cedar Mountain 51.9 300‐399 AC 2066 2013
MISO Brookings, SD ‐ SE Twin Cities 345 kV P Cedar Mountain Helena 62.2 300‐399 AC 2066 2013
MISO Brookings, SD ‐ SE Twin Cities 345 kV P Cedar Mountain Helena 62.2 300‐399 AC 2066 2013
MISO Brookings, SD ‐ SE Twin Cities 345 kV P Helena Lake Marion 26.6 300‐399 AC 2066 2014
MISO Brookings, SD ‐ SE Twin Cities 345 kV P Lake Marion Hampton Corner 18.5 300‐399 AC 2066 2014
MISO Brookings, SD ‐ SE Twin Cities 345 kV P Lyon County Hazel 23.5 300‐399 AC 2066 2015
MISO Brookings, SD ‐ SE Twin Cities 345 kV P Hazel Minnesota Valley 6.0 200‐299 AC 1558 2015
MISO Brookings, SD ‐ SE Twin Cities 345 kV P Cedar Mountain Franklin 5.0 100‐120 AC 336 2014
MISO Gibson (Cinergy)‐AB Brown‐Reid UC AB Brown(Vectren) Reid (BREC) 25.7 300‐399 AC 1430/1430 2012
MISO Hazleton ‐ Salem P Salem Hazleton 81.0 300‐399 AC 1195 2012
MISO Lewis Fields P Lewis Fields Hiawatha 8.5 151‐199 AC 1.0 2012
MISO Morgan Valley (Beverly) P Morgan Valley Beverly 7.9 151‐199 AC 335 2013
MISO Ashland to Rochelle 138 P Rochelle Ridgeway 1.0 121‐150 AC 282 2012
MISO Ashland to Rochelle 138 P Ridgeway Ashland 1.3 121‐150 AC 282 2012
MISO Bloomington‐Hanna 345 kV C Bloomington Pritchard 15.0 300‐399 AC 1386 2014
MISO Bloomington‐Hanna 345 kV C Pritchard Franklin Twp 24.0 300‐399 AC 956 2014
MISO Bloomington‐Hanna 345 kV C Franklin Twp Hanna 2.8 300‐399 AC 1386 2014
MISO Qualitech to Pittsboro new 138kv line P Qualitech Pittsboro Jct 3.3 121‐150 AC 306 2013
MISO Marshalltown‐Franklin P Eldora Iowa Falls Industrial 2.0 151‐199 AC 1.0 2012
MISO Tahoe P Tahoe Wixom 2.6 100‐120 AC 351.0 2013
MISO Clear Lake‐Woodmin 115 kV P Clear Lake Woodmin 7.5 100‐120 AC 175.0 2012
MISO Required Gen Int. RequestG362 P Pleasant Valley Byron 25.0 151‐199 AC 447.0 2012
MISO AEP Sullivan to DEM Brookston 765 C DEM Brookston AEP Sullivan 126.0 600+ AC 4008 2018
MISO DEM Brookston to Greentown 765 C DEM Brookston Greentown 66.0 600+ AC 3576 2018
MISO Ellendale to Big Stone South P Big Stone South Ellendale 145.0 300‐399 AC Unknown 2019
MISO Big Stone South to Brookings P Big Stone South Brookings 345 kV double 65.0 300‐399 AC Unknown 2017
MISO Big Stone South to Brookings P Big Stone Big Stone South 2.0 200‐299 AC Unknown 2017
MISO Big Stone South to Brookings P Big Stone Big Stone South 2.0 200‐299 AC Unknown 2017
MISO Meradosia to Ipava C Meredosia Ipava 43.0 300‐399 AC 1793 2018
MISO Meradosia to Pawnee C Meredosia Pawnee 58.0 300‐399 AC 1793 2018
MISO Pana to Mt. Zion C Mt. Zion Pana 30.0 300‐399 AC 1793 2020
MISO Mt. Zion to Kansas C Mt. Zion Kansas 52.0 300‐399 AC 1793 2020
MISO Rising to Sidney 345 kV line C Rising Sidney 27.0 300‐399 AC 1793 2017
MISO Kansas to Sugar Creek C Kansas Sugar Creek 23.7 300‐399 AC 1793 2020
MISO Thomas Hill ‐ Adair ‐ Ottumwa 345 C Ottumwa Thomas Hill 105.0 300‐399 AC 1793 2017
MISO Beaver ‐ Davis Besse #2 345kV Line P Beaver Davis Besse 50.0 300‐399 AC Unknown 2014
MISO Washington Street Substation P Line 1364 (new tap) Washington Street Sub 0.2 121‐150 AC Unknown 2012
MISO Nortwest Cape Area 345/161 kV Sub C Lutesville Northwest Cape 11.0 300‐399 AC 1793 2016
MISO St. Cloud Loop P Benton Co Mayhew Lake 4.0 100‐120 AC 361.0 2012
MISO New 345kV Supply at Fargo Sub P Fargo Maple Ridge 20.0 300‐399 AC 1793 2016
MISO Essar P Boswell Essar Mine Sub (Calumet) 16.0 200‐299 AC 423 2012
MISO Essar P Essar steel plant sub Shannon 8.0 200‐299 AC 423 2015
MISO Essar P Blackberry Essar Mine Sub (Calumet) 16.0 200‐299 AC 465 2012
MISO Essar P Essar Mine Sub) Essar steel plant 2.5 200‐299 AC 465 2012
MISO Skibo C Skibo Hoyt Lakes 3.0 121‐150 AC 202 2012
MISO Sartell (SEA) 3.0 mile, 115 kV line P Sartell Le Sauk 3.0 100‐120 AC Unknown 2012
MISO Northport (BENCO) 1 mile, dbl ckt P Northport Northport Tap 1.0 100‐120 AC Unknown 2013
MISO St. Lawrence Substation&Tap‐MVEC P St. Lawrence St. Lawrence Tap 0.5 100‐120 AC Unknown 2017
MISO South Minneapolis P Hiawatha Midtown 1.3 100‐120 AC 360.0 2012
MISO Dubuque Co ‐Spring Green 345 kV C Spring Green Dubuque Co 75.1 300‐399 AC 2110 2020

Appendix II: NERC‐Wide Transmission Additions, Upgrades, and Retirements
NERC | 2012 Long‐Term Reliability Assessment | November 2012
Page 269 of 335
Assessment Area Transmission Project Name Status
Terminal Origin Locaction Terminal End Location
Length (Circuit Miles)
Operating Voltage
(kV) Current(AC/DC)
Capacity Rating(MVA)
In‐Service
Year
MISO Dubuque Co ‐ Spring Green 345 kV C Spring Green Cardinal 28.0 300‐399 AC 2110 2020
MISO Ariel Substation (formerly Holland) P Ariel (formerly Holland) Wheeler 0.1 100‐120 AC Unknown 2012
MISO Ariel Substation (formerly Holland) P Ariel (formerly Holland) Troy 0.1 100‐120 AC Unknown 2012
MISO St Antoine‐Essex #2 120 kV C St Antoine Essex 5.1 100‐120 AC Unknown 2015
MISO Raun‐Sioux City 345 kV Line C Raun WAPA Sioux City 23.0 300‐399 AC Unknown 2016
MISO North Alton Substation Supply P Wood River‐N. Staunton Tap to Supply N.Alton 4.0 121‐150 AC 240 2015
MISO North Alton Substation Supply P Wood River‐Stallings Tap to Supply N. Alton 4.0 121‐150 AC 240 2014
MISO Warrenton‐Lincoln Bulk 161 kV Line C Warrenton Lincoln 138‐34.5 kV Bulk 10.0 151‐199 AC 280 2016
MISO Bondville‐S.W. Campus P Bondville S.W. Campus 8.0 121‐150 AC 411 2014
MISO Quincy Area 345/138 kV Substation C Palmyra Quincy 10.0 300‐399 AC 1793 2017
MISO Newton‐Hutsonville‐Merom 345 kV C Hutsonville Plant Merom 12.0 300‐399 AC 1793 2018
MISO Quincy‐Meredosia 345 kV Line C Quincy Area Meredosia 40.0 300‐399 AC 1793 2018
MISO Fargo‐Oak Grove 345 kV Line C Fargo Oak Grove 70.0 300‐399 AC Unknown 2018
MISO Dickinson 115 kV Loop P Dickinson Basin Dickinson West 5.0 100‐120 AC 120 2014
MISO Dickinson 115 kV Loop P North Dickinson Dickinson West 3.0 100‐120 AC 120 2014
MISO 28L reroute P Boswell Nashwaulk 7.5 100‐120 AC 144 2012
MISO N. Lake Geneva‐S. Lake Geneva C South Lake Geneva North Lake Geneva 5.0 121‐150 AC 293.0 2016
MISO N LaCrosse‐N Madison‐Cardinal 345 C North LaCrosse North Madison 136.3 300‐399 AC 2110 2018
MISO N LaCrosse‐N Madison‐Cardinal 345 P North Madison Cardinal 20.5 300‐399 AC 2110 2018
MISO Michigan Thumb Wind Zone P Rapson (formerly Wyatt) Baker (formerly Reese) 56.0 300‐399 AC Unknown 2013
MISO Michigan Thumb Wind Zone P Rapson (formerly Wyatt) Baker (formerly Reese) 56.0 300‐399 AC Unknown 2013
MISO Michigan Thumb Wind Zone P Rapson (formerly Wyatt) Greenwood 65.0 300‐399 AC Unknown 2015
MISO Michigan Thumb Wind Zone P Rapson (formerly Wyatt) Greenwood 65.0 300‐399 AC Unknown 2015
MISO Michigan Thumb Wind Zone P Greenwood Fitz (formerly Saratoga) 19.0 300‐399 AC Unknown 2015
MISO Michigan Thumb Wind Zone P Greenwood Fitz (formerly Saratoga) 19.0 300‐399 AC Unknown 2015
MISO West Adair‐Palmyra Tap 345 kV Line C Adair Palmyra Tap 63.4 300‐399 AC 1793 2018
MISO Sheldon ‐ Webster 345 kV line C Sheldon Webster 120.0 300‐399 AC 1739 2016
MISO Reqd. for Gen Interconnection C Barnhart Plymouth #4 5.9 121‐150 AC 348 2018
MISO Reqd. for Gen Interconnection C Plymouth #4 Howards Grove 3.1 121‐150 AC 348 2018
MISO Reqd. for Gen Interconnection C Howards Grove Erdman 6.6 121‐150 AC 348 2018
MISO Reqd. for Gen Interconnection C Barnhart Branch River 35.5 300‐399 AC 1096 2018
MISO Reqd. for Gen Interconnection C Branch River Forest Jct 12.9 300‐399 AC 883 2018
MISO Reqd. for Gen Interconnection C Branch River Point Beach 1.0 300‐399 AC 1096 2018
MISO Reqd. for Gen Interconnection C Branch River Sheboygan Energy Center 1.0 300‐399 AC 1096 2018
MISO Webster ‐ Hazleton 345 kV line C Black Hawk Webster 91.3 300‐399 AC 1739 2015
MISO Webster ‐ Hazleton 345 kV line C Black Hawk Hazleton 24.0 300‐399 AC 1200 2018
Manitoba Transcona 230‐66 Station P R32V tap Transcona 1.0 200‐299 AC 658.1 2012
Manitoba Canexus Upgrade P Brandon Maple Leaf 3.9 100‐120 AC 73.0 2012
Manitoba Transcona 230‐66 Station P R33V tap Transcona 1.0 200‐299 AC 658.1 2012
Manitoba Cornwallis Bank Addition P Brandon G.S. Cornwallis 0.2 100‐120 AC 189.3 2013
Manitoba Neepawa 230‐66 Station P D54C tap Neepawa 230/66 station 1.0 200‐299 AC 564.5 2013
Manitoba R1 Line Voltage Chng P Pointe du Bois Slave Falls 0.0 121‐150 AC 81.7 2014
Manitoba R2 Line Voltage Chng P Pointe du Bois Slave Falls 0.0 121‐150 AC 81.7 2014
Manitoba S1 Line Voltage Chng P Pointe du Bois Slave Falls 0.0 121‐150 AC 95.4 2014
Manitoba S2 Line Voltage Chng P Pointe du Bois Slave Falls 0.0 121‐150 AC 95.4 2014
Manitoba R1 Line Voltage Chng P Pointe du Bois Slave Falls 6.3 100‐120 AC 68.1 2014
Manitoba R2 Line Voltage Chng P Pointe du Bois Slave Falls 6.3 100‐120 AC 68.1 2014
Manitoba S1 Line Voltage Chng P Pointe du Bois Slave Falls 86.3 100‐120 AC 85.3 2014
Manitoba S2 Line Voltage Chng P Pointe du Bois Slave Falls 86.3 100‐120 AC 85.3 2014
Manitoba Dorsey‐Portage 2nd T/L P Dorsey Portage 43.5 200‐299 AC 564.5 2015
Manitoba Rockwood P Rockwood CP17 tap 1.1 100‐120 AC 170.3 2015
Manitoba Rockwood P Rockwood CP17 tap 1.1 100‐120 AC 170.3 2015
Manitoba Rockwood P Rockwood RP16 tap 1.6 100‐120 AC 170.3 2015
Manitoba Pointe du Bois P Pointe du Bois Whiteshell 34.0 100‐120 AC 257.3 2015
Manitoba Lett‐St. Vital T/L P Letellier St Vital 77.7 200‐299 AC 658.1 2015
Manitoba Manigotagan Station P Pine Falls Manigotagan 49.7 100‐120 AC 127.0 2015
Manitoba Lav‐St. Vital T/L P LaVerendrye St Vital 21.1 200‐299 AC 658.1 2015
Manitoba Bipole 3 / Conawapa P Henday Conawapa Constr Power 0.0 200‐299 AC 768.8 2017
Manitoba Bipole 3 / Conawapa P Keewatinoow Riel 833.3 400‐599 DC 2,000.0 2018
Manitoba Bipole 3 / Conawapa P Keewatinoow Henday 18.2 200‐299 AC 768.8 2018
Manitoba Bipole 3 / Conawapa P Keewatinoow Henday 18.2 200‐299 AC 768.8 2018
Manitoba Bipole 3 / Conawapa P Keewatinoow Henday 18.2 200‐299 AC 768.8 2018
Manitoba Bipole 3 / Conawapa P Keewatinoow Henday 18.2 200‐299 AC 768.8 2018
Manitoba Bipole 3 / Conawapa P Conawapa Long Spruce 34.7 200‐299 AC 1,029.2 2018
Manitoba Keeyask P Radisson Keeyask G.S. 23.6 121‐150 AC 461.3 2018
Manitoba Manitoba‐US tie P Dorsey Riel 30.9 400‐599 AC 3,746.4 2019
Manitoba Keeyask P Keeyask G.S. Keeyask S.S. 2.0 121‐150 AC 436.2 2019

Appendix II: NERC‐Wide Transmission Additions, Upgrades, and Retirements
NERC | 2012 Long‐Term Reliability Assessment | November 2012
Page 270 of 335
Assessment Area Transmission Project Name Status
Terminal Origin Locaction Terminal End Location
Length (Circuit Miles)
Operating Voltage
(kV) Current(AC/DC)
Capacity Rating(MVA)
In‐Service
Year
Manitoba Keeyask P Keeyask G.S. Keeyask S.S. 2.0 121‐150 AC 436.2 2019
Manitoba Keeyask P Keeyask G.S. Keeyask S.S. 2.0 121‐150 AC 436.2 2019
Manitoba Keeyask P Keeyask Radisson 23.6 121‐150 AC 461.3 2019
Manitoba Keeyask P Keeyask Radisson 23.6 121‐150 AC 461.3 2019
Manitoba St.Vital‐Steinbach P St. Vital Steinbach 27.8 200‐299 AC 420.0 2020
Manitoba Manitoba‐US tie C Riel Shannon 80.0 200‐299 AC 1,732.0 2022
MAPP AMES Plant ‐ NE Ankeny 161 kV Line C AMES Plant 161 kV Sub. NE Ankeny 161 kV Sub. 22.0 151‐199 AC 332.0 2013
MAPP AVS‐NESET 345 P AVS 345 NESET 345 190.0 300‐399 AC 1,200.0 2016
MAPP Snake Creek‐Neset 115 P Snake Creek 115 Neset 115 160.0 100‐120 AC 140.0 2014
MAPP Blaisdell‐Berhold 115 P Blaisdell 115 Berthold 115 15.0 100‐120 AC 140.0 2013
MAPP S.Gap‐Watford City 115 C S.Gap 115 Watford City 115 40.0 100‐120 AC 140.0 2013
MAPP Culbertson‐Grenora C Culbertson 115 Grenora 115 45.0 100‐120 AC 140.0 2014
MAPP CapX UC Brookings County, SD Hampton, MN 230.0 300‐399 AC 1,000.0 2015
MAPP CENTER‐GRAND FORKS 345 KV LINE P CENTER 345 KV SUB PRAIRIE 345 KV SUB 250.0 300‐399 AC 1,206.0 2013
MAPP BEMIDJI ‐ CASS LAKE 230 KV LINE P WILTON 230 KV SUB CASS LAKE 230 KV SUB 19.0 200‐299 AC 641.0 2012
MAPP CASS LAKE ‐ BOSWELL 230 KV LINE P CASS LAKE 230 KV SUB BOSWELL 230 KV SUB 51.0 200‐299 AC 641.0 2012
MAPP Big Bend‐Lower Brule P Lower Brule dbl ckt Big Bend 2.1 200‐299 AC Unknown 2016
MAPP Big Bend‐Lower Brule P Lower Brule Fort Thompson 9.3 200‐299 AC Unknown 2016
MAPP Big Bend‐Lower Brule P Lower Brule Reliance 19.5 200‐299 AC Unknown 2016
SaskPower Unnamed / Name Unknown P Aberdeen Switch St. Martinsville Switch St. 25.0 200‐299 AC 765.0 2013
SaskPower Unnamed / Name Unknown P Aberdeen Switch St. Wolverine Switch St. 68.0 200‐299 AC 765.0 2013
SaskPower Unnamed / Name Unknown P Elstow Switch St. Wolverine Switch St. 31.0 121‐150 AC 382.0 2013
SaskPower Unnamed / Name Unknown P Elstow Switch St. Wolverine Switch St. 0.0 121‐150 AC 166.0 2013
SaskPower Unnamed / Name Unknown P Pasqua Switch Station Swift Current Switch St. 140.0 200‐299 AC 765.0 2016
SaskPower Unnamed / Name Unknown P Pasqua Switch Station Swift Current Switch St. 0.0 121‐150 AC 134.0 2016
SaskPower Unnamed / Name Unknown P Pasqua Switch Station Swift Current Switch St. 140.0 121‐150 AC 382.0 2016
SaskPower Unnamed / Name Unknown P Peebles Switch St. Tantallon Switch St. 84.0 200‐299 AC 765.0 2013
SaskPower Unnamed / Name Unknown C Beatty Switching Station Wolverine Switch St. 99.0 200‐299 AC 765.0 2016
SaskPower Unnamed / Name Unknown C Condie Switching Station Pasqua Switching Station 43.0 200‐299 AC 765.0 2016
SaskPower Unnamed / Name Unknown C Brada Switching Station Martinsville Switch St. 80.0 200‐299 AC 765.0 2016
Maritimes Coleson Cove to Salisbury 345 kV C Coleson Cove Salisbury 103.0 300‐399 AC 1,076.0 2016
Maritimes New Minas Sub P Canaan Road Prospect Road 2.5 121‐150 AC 170.0 2012
Maritimes Harbour East P Dartmouth East Eastern Passage 10.6 121‐150 AC 170.0 2013
Maritimes NS/NB Tie C Onslow Salisbury 100.0 300‐399 AC 1,076.0 2016
Maritimes NS ‐ NL Tie C Newfoundland Nova Scotia 100.0 200‐299 DC Unknown 2018
Maritimes Y‐104 C West Royalty Church Road 50.0 121‐150 AC 189.0 2017
New England Rochester Area P Rochester Substation North Rochester Sub. 6.9 100‐120 AC 238.0 2015
New England MPRP P Orrington Coopers Mills 54.0 100‐120 AC 380.0 2014
New England MPRP P Larrabee Road Middle St 5.7 100‐120 AC 282.0 2014
New England MPRP P Middle St Lewiston Lower 1.2 100‐120 AC 282.0 2014
New England MPRP P Larrabee Road Livermore Falls 24.1 100‐120 AC 282.0 2013
New England MPRP P Livermore Falls Rumford IP 20.4 100‐120 AC 282.0 2013
New England Section 241 Somerset Co. Reinforce P Wyman Hydro Rice Rips Tap 39.0 100‐120 AC 282.0 2012
New England Greater Rhode Island Upgrades P Brayton Point Station Somerset 3.4 100‐120 AC Unknown 2014
New England Central/Western MA upgrades P Millbury Tower 6.9 100‐120 AC 259.0 2013
New England Merrimack Valley/North Shore P King St West Amesbury 7.2 100‐120 AC 232.0 2012
New England Central/Western MA upgrades P Otter River East Winchendon 5.7 100‐120 AC 262.0 2016
New England Worcester Area Upgrades P North Bloomingdale Vernon 3.6 100‐120 AC 179.0 2012
New England Greater Rhode Island Upgrades P Somerset Bell Rock 3.7 100‐120 AC Unknown 2014
New England Boston Area Enhancements P West Walpole Holbrook 0.0 100‐120 AC Unknown 2014
New England Mid Cape Reliability Project C Canal Barnstable 0.0 100‐120 AC Unknown 2013
New England Greater Boston ‐ North C Wakefield Everett 0.0 100‐120 AC Unknown 2015
New England Greater Boston ‐ Western Suburbs C Woburn Hartwell Ave 6.4 100‐120 AC Unknown 2015
New England Pittsfield/Greenfield Area P Northfield Mt. Sub. Erving Substation 1.2 100‐120 AC 696.0 2014
New England Stamford Area C Glenbrook Substation Southend S/S 0.0 100‐120 AC Unknown 2022
New England Lyman Substation C Holyoke Fairmont South Lyman Substation 0.0 100‐120 AC Unknown 2022
New England Granite/Middlesex C Granite S/S Middlesex S/S 16.0 200‐299 AC 496.0 2022
New England Long Term Lower SEMA P Carver Bourne 17.9 300‐399 AC 2,169.0 2014
New England NEEWs P West Farnum S/S CT/RI Border 17.7 300‐399 AC 2,172.0 2015
New England NEEWs P Millbury S/S West Farnum S/S 20.2 300‐399 AC 2,172.0 2015
New England NEEWs UC Kent County West Farnum S/S 21.4 300‐399 AC 1,353.0 2013
New England NEEWs P Card S/S Lake Road S/S 29.3 300‐399 AC 2,420.0 2015
New England NEEWs P Lake Road S/S CT/RI Border 7.6 300‐399 AC 2,420.0 2017
New England NEEWs P Frost Bridge S/S North Bloomfield S/S 35.4 300‐399 AC 2,420.0 2016
New England NEEWs P Manchester Meekville Jct. 2.7 300‐399 AC 2,420.0 2013
New England NEEWs P North Bloomfield S/S CT/MA Border 12.0 300‐399 AC 2,420.0 2013
New England NEEWs UC Agawam S/S Ludlow S/S 16.9 300‐399 AC 2,420.0 2013
New England MPRP UC Orrington S/S Albion Road S/S 59.0 300‐399 AC 2,151.0 2013

Appendix II: NERC‐Wide Transmission Additions, Upgrades, and Retirements
NERC | 2012 Long‐Term Reliability Assessment | November 2012
Page 271 of 335
Assessment Area Transmission Project Name Status
Terminal Origin Locaction Terminal End Location
Length (Circuit Miles)
Operating Voltage
(kV) Current(AC/DC)
Capacity Rating(MVA)
In‐Service
Year
New England MPRP UC Albion Road S/S Coopers Mills S/S 21.0 300‐399 AC 2,151.0 2014
New England MPRP UC Larrabee Road S/S Coopers Mills S/S 34.3 300‐399 AC 2,151.0 2014
New England MPRP UC Larrabee Road S/S Surowiec S/S 17.0 300‐399 AC 2,151.0 2012
New England MPRP UC Surowiec S/S Raven Farm S/S 12.4 300‐399 AC 2,151.0 2013
New England MPRP P Maguire Road S/S South Gorham S/S 21.0 300‐399 AC 2,151.0 2012
New England MPRP P Maguire Road S/S Three Rivers Switchyard 19.2 300‐399 AC 2,151.0 2013
New England Greater Boston N‐S. Central P Scobie S/S PSNH/NGRID Border 10.8 300‐399 AC 2,420.0 2016
New England Northern Pass Transmission Project C Quebec/NH Border Franklin 140.0 300‐399 DC Unknown 2016
New England Northern Pass Transmission Project C Franklin Deerfield 40.0 300‐399 AC Unknown 2016
New England 8300 Line Configuration P Grand Isle S/S Mill River 0.1 100‐120 AC 340.0 2013
New England Lakewood Reinforcement P Lake Road S/S Section 833B Tap 4.0 100‐120 AC 282.0 2013
New England Merrimack Valley/N.Shore Reliability P Mystic Everett 0.5 100‐120 AC 153.0 2012
New England Greater Boston ‐ South P Medway #65 Border with Milford 2.0 100‐120 AC 325.0 2013
New England Greater Boston ‐ South P Border with Bellingham Border with Milford 2.0 100‐120 AC 325.0 2013
New England NEEWs P ANP Blackstone NEA Bellingham Tap 1.2 100‐120 AC Unknown 2012
New England Greater Boston ‐ North C Woburn Tewsbury 0.0 300‐399 AC Unknown 2016
New England Greater Boston ‐ North C Woburn N. Cambridge 0.0 100‐120 AC Unknown 2016
New England Greater Boston ‐ Western Suburbs C Woburn Burlington 3.7 100‐120 AC Unknown 2013
New England Greater Boston ‐ Central C Mystic Chelsea 0.0 100‐120 AC Unknown 2016
New England Greater Boston ‐ Central C Mystic Woburn 0.0 100‐120 AC Unknown 2016
New England Greater Boston ‐ Central C Needham Baker Street 0.0 100‐120 AC Unknown 2016
New England Greater Boston ‐ Western Suburbs C Sudbury Hudson 0.0 100‐120 AC Unknown 2016
New England Mid Cape Reliability Project C Bourne Falmouth Tap 0.0 100‐120 AC Unknown 2015
New England Mid Cape Reliability Project C Bourne Oak Street 0.0 100‐120 AC Unknown 2015
New England Mid Cape Reliability Project C Oak Street Barnstable 0.0 100‐120 AC Unknown 2015
New England Long Term Lower SEMA P Carver Oak Street 30.7 300‐399 AC 2,169.0 2012
New England NEEWs P Agawam S/S CT/MA Border 6.0 300‐399 AC 2,420.0 2013
New England Western New Hampshire Solution C Fitzwilliam S/S Monadnock S/S 2.5 100‐120 AC Unknown 2016
New England Southern New Hampshire Solution C Scobie S/S Huse Rd. S/S 6.0 100‐120 AC Unknown 2016
New England Seacost New Hampshire Solution C Madbury S/S Portsmouth S/S 13.0 100‐120 AC Unknown 2016
New England Seacost New Hampshire Solution C Scobie S/S Chester S/S 6.0 100‐120 AC Unknown 2016
New England SWCT Advanced Solutions C Glenbrook S/S South End S/S 1.8 100‐120 AC Unknown 2022
New England Line Configuration P Coopers Mills Highland Substation 0.0 100‐120 AC Unknown 2013
New England Central Vermont Solution P West Rutland Coolidge 27.0 300‐399 AC Unknown 2016
New England Cental Vermont Soluton P Coolidge Ascutney 15.0 100‐120 AC Unknown 2016
New York Unnamed / Name Unknown P Quebec ‐ NY Astoria Annex 345kV 0.0 300‐399 DC Unknown 2016
New York Unnamed / Name Unknown P St. Pool High Falls 5.6 100‐120 AC 1,114.0 2020
New York Unnamed / Name Unknown P High Falls Kerhonkson 10.0 100‐120 AC 1,114.0 2020
New York Unnamed / Name Unknown P Kerhonkson Honk Falls 9.9 100‐120 AC 1,114.0 2020
New York Unnamed / Name Unknown P Modena Galeville 4.6 100‐120 AC 1,114.0 2020
New York Unnamed / Name Unknown P Galeville Kerhonkson 9.0 100‐120 AC 1,851.0 2013
New York Unnamed / Name Unknown P Shoreham Brookhaven 0.0 121‐150 AC 1,851.0 2013
New York Unnamed / Name Unknown P Shoreham Wildwood 1.0 121‐150 AC 1,851.0 2013
New York Unnamed / Name Unknown P Wildwood Brookhaven 6.3 121‐150 AC 3,124.0 2013
New York Unnamed / Name Unknown P Holbrook Holtsville GT 0.0 121‐150 AC 3,124.0 2013
New York Unnamed / Name Unknown P Holbrook West Bus 0.2 121‐150 AC 3,124.0 2013
New York Unnamed / Name Unknown P West Bus Holtsville GT 0.1 121‐150 AC 3,124.0 2013
New York Unnamed / Name Unknown P Sill Rd Holtsville GT 0.0 121‐150 AC 3,124.0 2013
New York Unnamed / Name Unknown P Sill Rd West Bus 9.4 121‐150 AC 3,124.0 2013
New York Unnamed / Name Unknown P West Bus Holtsville GT 0.1 121‐150 AC 3,124.0 2013
New York Unnamed / Name Unknown P Pilgrim Holtsville GT 0.0 121‐150 AC 2,087.0 2013
New York Unnamed / Name Unknown P Pilgrim West Bus 11.7 121‐150 AC 2,087.0 2013
New York Unnamed / Name Unknown P Riverhead Wildwood 10.6 121‐150 AC 1,399.0 2014
New York Unnamed / Name Unknown P Moses Willis 0.0 200‐299 AC 876.0 2013
New York Unnamed / Name Unknown P Moses Willis 37.1 200‐299 AC 876.0 2013
New York Unnamed / Name Unknown P Moses Willis 37.1 200‐299 AC 876.0 2013
New York Unnamed / Name Unknown P Oakdale Fraser 56.9 300‐399 AC 2,100.0 2012
New York Unnamed / Name Unknown P Oakdale Clarks Corners 21.2 300‐399 AC 2,020.0 2012
New York Unnamed / Name Unknown P Spier Rotterdam 32.7 100‐120 AC Unknown 2015
New York Unnamed / Name Unknown P Burns Corporate Drive 4.0 121‐150 AC Unknown 2014
New York Unnamed / Name Unknown P BPS Station Rochester 3.8 300‐399 AC 2,177.0 2016
New York Unnamed / Name Unknown UC Wood Street Carmel 1.3 100‐120 AC Unknown 2012
New York Unnamed / Name Unknown UC Wood Street Katonah 11.7 100‐120 AC Unknown 2012
New York Unnamed / Name Unknown UC Greenbush Hudson 0.0 100‐120 AC Unknown 2012
New York Unnamed / Name Unknown UC Greenbush Klinekill Tap 20.3 100‐120 AC Unknown 2012
New York Unnamed / Name Unknown UC Klinekill Tap Hudson 6.1 100‐120 AC Unknown 2012
Ontario Unnamed / Name Unknown UC Allanburg TS Middleport TS 93.0 200‐299 AC 964.0 2022