2012 Inmet Presentation
25
INMET MINING CORPORATION BMO Capital Markets 21 st Annual Global Metals & Mining Conference Hollywood, Florida | February 27, 2012
-
Upload
dogger2000 -
Category
Documents
-
view
887 -
download
1
Transcript of 2012 Inmet Presentation

INMET MINING CORPORATION
BMO Capital Markets
21st Annual Global Metals & Mining Conference
Hollywood, Florida | February 27, 2012

2
Forward looking information
Securities regulators encourage companies to disclose forward-looking information to help investors understand a company’s future prospects. This presentation contains statements about Inmet, and Inmet’s future financial condition, results of operations and business based on assumptions we make about factors that are not within our control but that affect the mining industry generally and our business in particular, such as metal prices, currency exchange rates, the cost of consumables used at our operations and changes in legal and regulatory requirements, among others.
These statements are “forward-looking” because we have used what we know and expect today to make a statement about the future. Forward-looking statements usually include words such as may, expect, anticipate, believe or other similar words. We believe the expectations or assumptions reflected in these forward looking statements are reasonable. However, actual events and results could be substantially different because of the risks and uncertainties associated with our business or events that happen after the date of this presentation. You should not place undue reliance on forward-looking statements. As a general policy, we do not update forward-looking statements, except as required by securities laws and regulations
NOTE SLIDES REFLECT PRODUCTION OBJECTIVES FOR 2012, AND FULL YEAR 2011 CASH COST AND COST PER TONNE OF ORE MILLED OR PER POUND OF CATHODE PRODUCED

3
Proven track record of developing, building
and closing mines responsibly for 20+ years
Mine Built/Acquired Operated Closed
Troilus Built 1994 –
1997
1997 – 2010 2010 – current
Çayeli Built 1992 –
1994
1994 – 2018 est.
Pyhäsalmi Acquired 2002 2002 – 2018
est.
Las Cruces Built 2006 –
2008
2009 – 2024
est.
Cobre Panama Acquired stake
1990
Expected 2016
– 2046+

4
Returns that significantly outperformed
the index over the past 10 years
4

5
Key Metrics 2011: 71% of gross sales from
copper
• Cash at year end $1.7 billion
• Operating cash flow $405 million
• 2012 capital expenditure $183 million
($105 mm Cobre Panama Q1 100%)
Copper production: 84,800 tonnes
Zinc production: 80,400 tonnes
Cobre Panama Las Cruces Çayeli Pyhäsalmi

Operations at a glance – low cost, stable operations with very low geo political risk
Pyhäsalmi (100%) tonnes
Copper 11,300 – 12,600
Zinc 22,800 – 25,200
Las Cruces (100%) tonnes
Cathode copper
61,700 – 68,600
Çayeli (100%) tonnes
Copper 27,000 – 30,000
Zinc 36,000 – 39,800
2012 Production Objectives + Cobre Panama
estimated average annual production
Cobre Panama (100%) 1
Copper 255,000 tonnes
Gold 90,000 ounces
Silver 1,508,000 ounces
Molybdenum 3,200 tonnes
1 Estimated average annual production based on Front End Engineering and Design (FEED) Study March 2010. Ownership
presented on 100% basis; KPMC consortium has given notice of its election to acquire 20% interest in the project . 6

7
Source: Brook Hunt (Q1 – Q3 actual, Q4 estimated); Inmet mid-point of cash cost 2012 objectives plotted on 2011 C1 cost curve.
Note: C1 cash costs are defined by Brook Hunt as the net direct cash cost, representing the cash cost incurred at each processing stage, from mining through to recoverable metal delivered to
market, less net by-product credits (if any).
By-product cash cost for Inmet Consolidated based on metal credits of US $0.88/lb Cu as per company filings.
2011 C1 Curve
Expected 2012 cost position is attractive…
Çayeli
$1.01/lb
Pyhäsalmi
($0.42)
Inmet consolidated
$0.95/lb
Cobre Las Cruces
$1.17/lb

8
Pyhäsalmi – Finland performing at or better than plan
Ownership 100%
2012 Production Guidance
11,300 – 12,600 t Cu 22,800 – 25,200 t Zn
Anticipated 2012 Cash Cost per Pound of Copper (US$)
$ (0.51) – $ (0.33)
Mine Life 2018
8
2011
14,000 tonnes copper
32,300 tonnes zinc

9
Ownership 100%
2012 Production Guidance
27,000 – 30,000 t Cu
36,000 – 39,800 t Zn
Anticipated 2012 Cash Cost per Pound of Copper (US$)
$0.93 – $1.08
Mine Life 2018
Çayeli – Turkey
continues to perform
9
2011
28,700 tonnes copper
48,100 tonnes zinc

10
Cobre Las Cruces
Ownership 100%
2012 Production Guidance
61,700 – 68,600 t Cu
Anticipated 2012 Cash Cost per Pound of Copper (US$)
$1.08 – $1.26
Mine Life 2024
10
2011
42,100 tonnes
copper cathode

11
Cobre Panama
Ownership 100% 2
Expected Life of Mine Average Annual Production1
255,000 tonnes Cu 90,000 ounces Au 1,508,000 ounces Ag 3,200 tonnes Mo
Life of Mine Average Operating Costs
$0.90/lb Cu
1 100% basis. 2 KPMC has given notice of its election to acquire 20% interest in the project
• One of the world’s largest undeveloped
copper porphyry deposits
• Open-pit project located in Panama
• ESIA approved December 2011
• Basic engineering expected Q2 2012
• Construction decision to follow basic
engineering
• First copper concentrate expected to be
shipped in 2016
11

12
Metal Production
projected
Annual
Average:
Yr 2-16
Annual
Average:
Life of Mine
Total
Life of Mine
Copper (kt) 289 255 7,641
Gold (koz) 108 90 2,690
Silver (koz) 1,544 1,508 45,228
Molybdenum (kt) 3.6 3.2 96.5
Substantial metal production and
a very long mine life 1
1 Based on Front End Engineering and Design (FEED) Study March 2010
Estimated 30 year+ mine life based on current mineral reserves,
with potential mine life extension if current mineral resources
are converted to mineral reserves

13
Costs in
US$ per pound*
Average
Yr 2-16
Average
Life of Mine
Cash costs 0.78 0.90
Breakeven cash costs 0.92 1.00
Financed breakeven cash
costs 1.00 1.06
Total costs 1.23 1.31
Low strip ratio and conventional
technology drive low cost operations
* Breakeven cash costs are after sustaining capital expenditures. Financed breakeven cash costs are breakeven cash costs plus debt service costs. ** Cash costs are net of by-product credits and metal prices used are copper at $2.00/lb, molybdenum at $12.00/lb and gold at $750/oz. *** All calculations based on Front End Engineering and Design (FEED) Study March 2010

14
Strong position to finance Cobre Panama
Inmet ownership 80% 40%
Illustrative financing requirements $6,000 $6,000
Partner contribution (1,350) (4,550)
Inmet funding requirements
(assuming no debt) $4,650 $1,450
Inmet cash balance and held to maturity
investments at December 31, 2011 $1,700 $1,700
Expected Inmet cash flows
from 2012 to 2015 2,000 2,000
Inmet cash sources $3,700 $3,700
Excess/(Required) funding $(950) $2,250
• Dollar values above in millions, assumes project value based on analyst consensus NAV, no inclusion for Balboa
• $4.3 billion capital as per FEED study plus coal-fired power plant, cost escalation,
working capital and capitalized financing costs
Advancing on debt and capital market alternatives to meet total
financing requirements at an 80% ownership level

15
Do we need Cobre Panama? We need 14 of
them
15
Brook Hunt forecast of required mine capacity expansions and additions
Where will 14 Cobre Panama’s come from by
2017?
2017
3.9 Mt (2.1 greenfield) 2021
6.9 Mt
15

16
Project deferrals and restatements will fail to
fill the forecasted deficit from current mines
Brook Hunt forecast of incentive prices required for greenfield projects to achieve
12% IRR and in production by 2017: Cobre Panama estimated at $2.81/lb
2.1 Mt of greenfield annual production required by 2017
• Not enough projects to meet greenfield requirements
→ scarcity value
• Cobre Panama well positioned on curve
Brook Hunt adjusted for recent
announcements and Inmet view
Brook Hunt Q1/2012

17
Activity Expected date
FEED study completed March 2010 (done)
ESIA submitted September 2010 (done)
Began basic engineering November 2010 (done)
ESIA approval December 2011 (done)
Basic engineering complete Q2 2012
Begin site capture, earthworks Q2 2012
Begin port/plant construction Q2 2013
First concentrate shipment 2016
Cobre Panama milestones

18
• Strong balance sheet
• Low cash costs for our existing operations, and projected
for Cobre Panama
• Long life asset in Las Cruces
• Unparalleled exposure to long term copper
growth through Cobre Panama
Our shareholder commitment is backed by …

Thank you
19

20
Appendix

21
Inmet – Reserves
1 Mineral reserves and resources estimated at December 31, 2010. 2 Mineral reserves and resources estimated at December 31, 2010. 3 A Korean consortium has the right to acquire 20% interest in Cobre Panama
Contained Metal (x 1000)
Category Cu Zn Au Ag S Mo Cu Zn Au Ag Mo Inmet’s
% % g/t g/t % % tonnes tonnes ounces ounces tonnes Interest
Çayeli1 Proven 5,226 3.1 4.3 0.5 35 - - 164 223 76 5,881 - 100%
Probable 3,555 3.3 4.3 0.4 40 - - 111 145 46 4,315 - 100%
Total 8,581 3.2 4.3 0.4 37 - - 275 368 122 10,196 - 100%
Las Cruces1 Proven 7,154 7.2 - - - - - 518 - - - - 100%
Probable 8,334 5.3 - - - - - 442 - - - - 100%
Total 15,488 6.2 - - - - - 960 - - - - 100%
Pyhäsalmi1 Proven 10,750 1.1 2.1 0.4 14 41 - 118 228 138 4,839 - 100%
Probable - - - - - - - - - - - - 100%
Total 10,750 1.1 2.1 0.4 14 41 - 118 228 138 4,839 - 100%
Cobre Panama2,3 Proven 245,000 0.59 - 0.14 1.61 - 0.01 1,453 - 1,108 12,697 24 80%
Probable 1,897,000 0.39 - 0.06 1.41 - 0.01 7,438 - 3,848 86,026 139 80%Total 2,143,000 0.41 - 0.07 1.43 - 0.01 8,891 - 4,956 98,723 164 80%
8,466 596 4,225 94,013 131 -
Tonnes
(x 1000)
Reserves
Inmet’s Share

22
Inmet – Resources
1 Mineral reserves and resources estimated at December 31, 2010, exclusive of reserves for Çayeli, Las Cruces and Pyhäsalmi; inclusive of reserves for Cobre Panama.
2 Mineral reserves and resources estimated at December 31, 2010. 3 A Korean consortium has the right to acquire 20% interest in Cobre Panama
Contained Metal (x 1000)
Category Cu Zn Au Ag S Mo Cu Zn Au Ag Mo Inmet’s
% % g/t g/t % % tonnes tonnes ounces ounces tonnes Interest
Çayeli1 Measured 1,764 3.1 2.1 0.4 16 - - 54 37 20 907 - 100%
Indicated 1,700 3.3 3 0.6 25 - - 56 51 31 1,366 - 100%
Inferred 466 3.3 10.9 - - - - 15 51 - - - 100%
Las Cruces1 Indicated 134 2.9 - - - - - 4 - - - - 100%
Inferred 98 7.2 - - - - - 7 - - - - 100%
Pyhäsalmi1 Measured 7,256 0.6 0.4 - - 44 - 44 30 - - - 100%
Cobre Panama2,3 Measured 261,000 0.56 - 0.13 1.5 - 0.01 1,469 - 1,112 12,923 24 80%
Indicated 3,010,000 0.34 - 0.06 1.2 - 0.01 10,221 - 5,420 120,275 191 80%
Inferred 3,194,000 0.24 - 0.04 1.0 - 0.01 7,509 - 4,003 103,105 148 80%
11,846 118 6,583 135,471 215 -
Tonnes
(x 1000)
Total Resources (100% ownership basis)
Resources

23
Notes on mineral reserves and resources tables
Inmet Mineral Reserves and Resources Mineral reserves and resources are shown on a 100 percent basis for each property. Except as stated, mineral resources are exclusive of mineral reserves. The mineral reserve and resource estimates are prepared in accordance with the CIM Definition Standards On Mineral Resources and Mineral Reserves, adopted by CIM Council on November 14, 2004, and the CIM Estimation of Mineral Resources and Mineral Reserves Best Practice Guidelines, adopted by CIM Council on November 23, 2003, using geostatistical and/or classical methods, plus economic and mining parameters appropriate to each project. You will find the definitions and guidelines at www.cim.org. Estimates for all operations are prepared by or under the supervision of a qualified person as defined in National Instrument 43-101 (usually an engineer or geologist). There are no known environmental, permitting, legal, taxation, political or other relevant issues that would materially affect the estimates of the mineral reserves. Mineral resources which do not form part of the mineral reserves do not have demonstrated economic viability.
Çayeli Reserve and resource estimates as at December 31, 2010 prepared under the supervision of Joseph Boaro, P. Eng. (Director, Mining, Inmet Mining). Reserve estimates are based on the following assumptions: • copper price: US $2.25 per pound • zinc price: US $0.85 per pound • net smelter return cut-off: US $65 per tonne. Resource estimates include only material in addition to those used to generate reserves and are based on the same metal prices and a lower net smelter return cut-off: US $59 per tonne.
Las Cruces Resource and reserve estimates as at December 31, 2010 prepared by independent consultant Alan C. Noble, P.E. Reserve estimates are based on the following assumptions: • copper price: US $2.25 per pound • exchange rate: €1.00 = US $1.15 • open pit cut-off: 1 percent copper (96.7 percent of copper in reserve) • underground cut-off: 3 percent copper (3.3 percent of copper in reserve).
Pyhäsalmi Reserve and resource estimates as at December 31, 2010 prepared under the supervision of Timo Maki, EurGeol., European Federation of Geologists (Chief Geologist, Pyhäsalmi) and Katja Sahala, P. Geo., (Geologist, Pyhäsalmi). Reserve estimates are based on the following assumptions: • copper price: US $2.25 per pound • zinc price: US $0.85 per pound • exchange rate: €1.00 = US $1.15 • net smelter return cut-off: €28.90 per tonne. Resource estimates are based on the geological limits of the massive sulphides.
Cobre Panama Mineral reserves as at December 31, 2010 were estimated by William Rose, P.E., of WLR Consulting, Inc., a qualified person under National Instrument 43-101. Reserve estimates are based on the following assumptions: • copper price: US $2.00 per pound • gold price: US $750 per ounce • silver price: US $12.50 per ounce • molybdenum price: US $12.00 per pound • Mining costs : US $1.33 per tonnes of material mined and • Milling and general and administration cost: US $5.37 per tonne of ore milled, average life of mine metallurgical recoveries: 86 percent for copper, 54 percent for gold, 46 percent for silver and 59 percent for
molybdenum.
Mineral resources as at December 31, 2010, were estimated by Robert Sim, P. Geo., of SIM Geological Inc. and Bruce Davis, Ph.D., Fellow of the AusIMM (FAusIMM), BD Resource Consulting Inc., both qualified persons under National Instrument 43-101. Mineral resources include mineral reserves. Resource grades are estimated using ordinary kriging with a nominal block size of 25 metres by 25 metres by 15 metres. Resources are limited inside a pit shell defined by a copper price of US $2.30 per pound, the same operating costs used for reserves, and are tabulated at a cut-off grade of 0.15 percent copper.

24
Long term copper demand growth assumptions are still conservative
SOURCE: WBMS; McKinsey analysis
0
2
4
6
8
10
12
14
16
18
20
1950
1954
1958
1962
1966
1970
1974
1978
1982
1986
1990
1994
1998
2002
2006
2010
Global refined Cu demand 1950-2009
Mt
Reconstruction
1950-1970
Stagnation
1970-1996
4.5% 2.1%
China
industrialization
causing strong
demand growth
Demand growth
driven by Asian
Tigers
Oil shock initiate
demand
weakening
Post-war
OECD
reconstruction
Industrialization of
Japan and Korea
and Vietnam War
China
1997-present
3.0%
U.S.
Government
stockpiling
Global recession
reduces global
demand
Long term CAGR1: 3.1%
1 CAGR between 1951 (average of 1950-53) and 2009 (average of 2008-10)
25
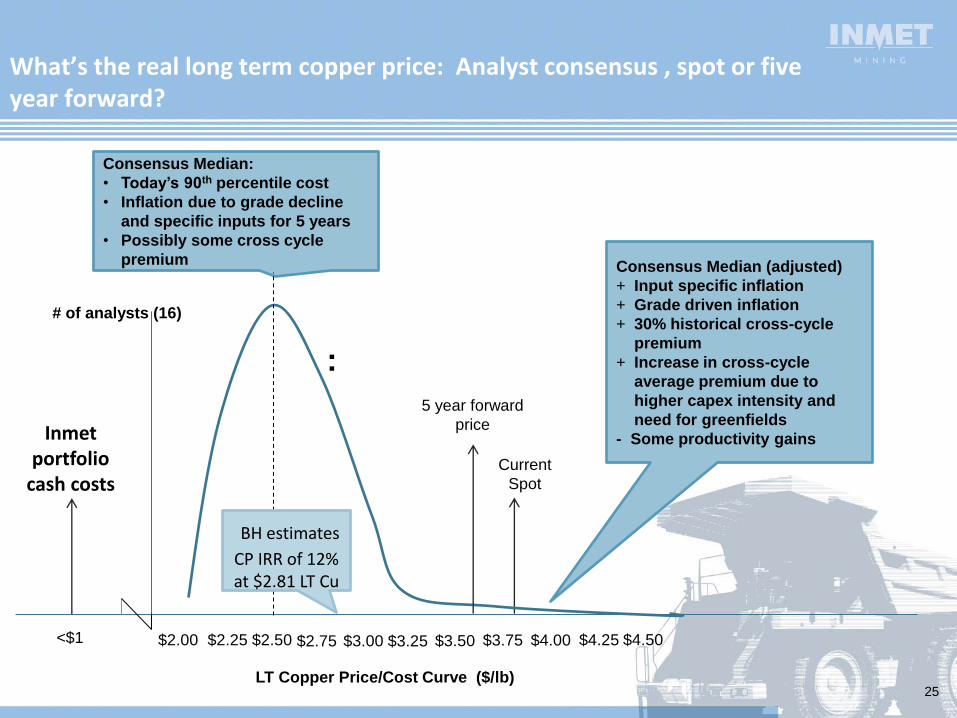
What’s the real long term copper price: Analyst consensus , spot or five year forward?
5 year forward
price
# of analysts (16)
LT Copper Price/Cost Curve ($/lb)
$2.00 $2.25 $2.50 $2.75 $3.00 $3.25 $3.50 $3.75 $4.00
Consensus Median:
• Today’s 90th percentile cost
• Inflation due to grade decline
and specific inputs for 5 years
• Possibly some cross cycle
premium Consensus Median (adjusted)
+ Input specific inflation
+ Grade driven inflation
+ 30% historical cross-cycle
premium
+ Increase in cross-cycle
average premium due to
higher capex intensity and
need for greenfields
- Some productivity gains
$4.25 $4.50
Inmet portfolio
cash costs
<$1
Current
Spot
BH estimates
CP IRR of 12% at $2.81 LT Cu
: