2012 Indiana Primary Care Clinician
158
Transcript of 2012 Indiana Primary Care Clinician

2012 Indiana Primary Care Clinician
Workforce Report
Produced by:
The Indiana Center for Health Workforce Studies
Bowen Research Center, Department of Family Medicine
Indiana University School of Medicine
In collaboration with
Indiana Area Health Education Centers Program
August 2012
Cynthia K. Lewis, MPH
Zachary T. Sheff, BS, BA
Terrell W. Zollinger, DrPH
Deborah I. Allen, MD
1
TableofContents
Acknowledgments........................................................................................................................... 5
Executive Summary ........................................................................................................................ 6
Introduction ................................................................................................................................. 6
Methods....................................................................................................................................... 6
Statewide Primary Care Clinicians ............................................................................................. 7
Primary Care Clinicians by AHEC Region ................................................................................ 7
Primary Care Clinicians by ISDH Public Health Region ........................................................... 7
Conclusion .................................................................................................................................. 7
Chapter 1: Introduction ................................................................................................................... 9
Chapter 2: Methods ....................................................................................................................... 11
Inclusion/Exclusion Criteria ..................................................................................................... 11
Deriving the Primary Care Physician Data Set ................................................................... 11
Deriving the Primary Care Physician Assistant Data Set .................................................... 13
Deriving the Primary Care Nurse Practitioner Data Set ..................................................... 15
County Level Data Analysis ..................................................................................................... 17
Calculation of FTE for Maps ................................................................................................ 18
County Weighting for Primary Care Physicians .................................................................. 18
County Weighting for Primary Care Physician Assistants ................................................... 19
County Weighting for Primary Care Nurse Practitioners .................................................... 19
Chapter 3: Proportion Nearing Retirement Age and Geographical Distributions of Primary Care Clinicians in Indiana ..................................................................................................................... 21
Statewide Data .......................................................................................................................... 21
Primary Care Clinician Workforce Age Characteristics ...................................................... 21
Maps of Statewide Primary Care Workforce ........................................................................ 22
Statewide County Data Tables .................................................................................................. 25
Primary Care Clinicians: Urban County Data .................................................................... 25
Primary Care Clinicians: Rural County Data ...................................................................... 27
Urban Counties Age Data ......................................................................................................... 29
Primary Care Workforce Characteristics ............................................................................. 29
Rural Counties Data .................................................................................................................. 29
2
Primary Care Workforce Characteristics ............................................................................. 29
HPSA and MUA Designations in Indiana ................................................................................ 30
Indiana Primary Care HPSA Designations .......................................................................... 31
Indiana MUA Designations .................................................................................................. 35
Chapter 4: Proportion Nearing Retirement Age and Geographic Distributions of Primary Care Clinicians in Indiana by AHEC Regions ...................................................................................... 39
East Indiana (EI) Region ........................................................................................................... 39
Primary Care Workforce Characteristics ............................................................................. 39
Maps of Primary Care Workforce in EI Region ................................................................... 40
Metropolitan Indianapolis/Central Indiana (MICI) Region ...................................................... 42
Primary Care Workforce Characteristics ............................................................................. 42
Maps of Primary Care Workforce in MICI Region .............................................................. 43
North Central Indiana (NCI) Region ........................................................................................ 45
Primary Care Workforce Characteristics ............................................................................. 45
Maps of Primary Care Workforce in NCI Region ................................................................ 46
Northeast Indiana (NEI) Region ............................................................................................... 48
Primary Care Workforce Characteristics ............................................................................. 48
Maps of Primary Care Workforce in NEI Region ................................................................ 49
Northwest Indiana (NWI) Region ............................................................................................. 51
Primary Care Workforce Characteristics ............................................................................. 51
Maps of Primary Care Workforce in NWI Region................................................................ 52
South Central Indiana (SCI) Region ......................................................................................... 54
Primary Care Workforce Characteristics ............................................................................. 54
Maps of Primary Care Workforce in SCI Region ................................................................. 55
Southwest Indiana (SWI) Region ............................................................................................. 57
Primary Care Workforce Characteristics ............................................................................. 57
Maps of Primary Care Workforce in SWI Region ................................................................ 58
West Central Indiana (WCI) Region ......................................................................................... 60
Primary Care Workforce Characteristics ............................................................................. 60
Maps of Primary Care Workforce in WCI Region................................................................ 61

3
Chapter 5: Proportion Nearing Retirement Age and Geographic Distributions of Primary Care Clinicians in Indiana by ISDH Public Health Regions ................................................................. 63
ISDH Public Health Region 1 ................................................................................................... 63
Primary Care Workforce Characteristics ............................................................................. 63
Maps of Primary Care Workforce in Public Health Region 1.............................................. 64
ISDH Public Health Region 2 ................................................................................................... 66
Primary Care Workforce Characteristics ............................................................................. 66
Maps of Primary Care Workforce in Public Health Region 2.............................................. 67
ISDH Public Health Region 3 ................................................................................................... 69
Primary Care Workforce Characteristics ............................................................................. 69
Maps of Primary Care Workforce in Public Health Region 3.............................................. 70
ISDH Public Health Region 4 ................................................................................................... 72
Primary Care Workforce Characteristics ............................................................................. 72
Maps of Primary Care Workforce in Public Health Region 4.............................................. 73
ISDH Public Health Region 5 ................................................................................................... 75
Primary Care Workforce Characteristics ............................................................................. 75
Maps of Primary Care Workforce in Public Health Region 5.............................................. 76
ISDH Public Health Region 6 ................................................................................................... 78
Primary Care Workforce Characteristics ............................................................................. 78
Maps of Primary Care Workforce in Public Health Region 6.............................................. 79
ISDH Public Health Region 7 ................................................................................................... 81
Primary Care Workforce Characteristics ............................................................................. 81
Maps of Primary Care Workforce in Public Health Region 7.............................................. 82
ISDH Public Health Region 8 ................................................................................................... 84
Primary Care Workforce Characteristics ............................................................................. 84
Maps of Primary Care Workforce in Public Health Region 8.............................................. 85
ISDH Public Health Region 9 ................................................................................................... 87
Primary Care Workforce Characteristics ............................................................................. 87
Maps of Primary Care Workforce in Public Health Region 9.............................................. 88
ISDH Public Health Region 10 ................................................................................................. 90
Primary Care Workforce Characteristics ............................................................................. 90

4
Maps of Primary Care Workforce in Public Health Region 10............................................ 91
Chapter 6: Conclusion................................................................................................................... 93
Appendix 1-A: 2011 Indiana Physician Re-Licensure Survey Instrument ................................... 95
Appendix 1-B: 2010 Indiana Physician Assistant Re-Licensure Survey Instrument ................. 108
Appendix 1-C: 2011 Indiana Nurse Re-Licensure Survey Instrument ....................................... 143

5
Acknowledgments
We would like to extend our gratitude to all the talented and dedicated individuals who provided
valuable and timely assistance to us during the project. Preparing this report required the assistance,
cooperation, and effort of many individuals and agency staff. The survey data and additional data
elements were provided by the Indiana Professional Licensing Agency through the Indiana State
Department of Health.
Many professionals with expertise in this area provided specific direction and insights regarding
the data analysis and report generation:
Jennifer Bruner, Staff Attorney, Indiana State Department of Health
Raymond Guest, MPH, PCO Manager, ISDH Office of Primary Care
Biff Williams, PhD., Professor and Dean, Indiana State University, College of Nursing, Health, and
Human Services
Marcia Plant Jackson, FNP, Director, Health Policy, Coalition of Advanced Practice Nurses of Indiana
J. Matthew Neal, MD, MBA, CPE, FACP, FACE, Governor, American College of Physicians, Indiana
Chapter
Sarah M. Stelzner, MD, Co-President, American College of Pediatrics – Indiana Chapter
Kimberly Harper, MS, RN, Executive Director, Indiana Center for Nursing
The cooperation and support of the Indiana State Department of Health was instrumental in
obtaining the survey data and interpreting it. The authors are grateful for the financial support received
from the Indiana Area Health Education Centers Program to produce this report.
Cynthia K. Lewis, MPH
Zach Sheff, BS BA
Terrell Zollinger, DrPH
Deborah I. Allen, MD

6
Executive Summary
Introduction
Primary care clinicians are a critical segment of the health care workforce in Indiana. The
Institute of Medicine defined primary care as “the provision of integrated, accessible health care services
by clinicians who are accountable for addressing a large majority of personal health care needs,
developing a sustained partnership with patients, and practicing in the context of family and
community.”1 For this report, a physician was considered a “primary care physician” if their specialty
was one of the following: family medicine, general internal medicine, general practice, internal medicine
– pediatrics, and general pediatrics. In addition to these physician specialties, physician assistants and
nurse practitioners who also provide primary care and are included in this report as part of the group
considered to be primary care clinicians. The purpose of this report is to describe the current state of the
primary care clinician workforce in Indiana, their demographic characteristics, practice setting, and
geographical locations. The geographical locations are presented in different ways for the various
stakeholders. The information presented in this report may be useful for projecting future needs given the
current number of providers and proportion nearing retirement as well as the geographical areas where
special attention may be needed to insure residents have adequate access to primary care clinicians in the
future.
Methods
Data for this report were assimilated from two sources: the Indiana Professional Licensing
Agency (IPLA) license files containing basic information about each licensed professional (physicians,
physician assistants, and nurse practitioners) and data from the re-licensure survey completed by health
professionals when renewing their state licenses. This report summarizes the physician, physician
assistant and nurse re-licensure data and responses to the 2011 Indiana Physician Re-Licensure Survey,
2010 Indiana Physician Assistant Re-licensure Survey, and 2011 Registered Nurse Re-Licensure Survey.
These data were filtered to remove all clinicians not actively practicing in Indiana and were then
further refined to include only primary care physicians, physician assistants, and nurse practitioners. Two
primary measures were used to evaluate the status of Indiana’s primary care workforce: the proportion of
primary care clinician full-time equivalents (FTEs) “nearing retirement” (age 55 and older) and the
(weighted) ratio of primary care provider FTEs per 100,000 population in each county.
1 National Research Council. "Front Matter." Primary Care: America's Health in a New Era. Washington, DC: The National Academies Press, 1996. 1. Retrieved from http://www.nap.edu/openbook.php?isbn=0309053994.

7
Clinicians were counted by full-time equivalents (FTEs) rather than headcount to more accurately
measure the amount of care provided by each. FTEs in each county were weighted by response rate to the
appropriate professional survey (physician, physician assistant, and nurses) to account for non-responders.
Statewide Primary Care Clinicians
There were 3,951 primary care clinician FTEs in Indiana (2,880 physician, 96 physician assistant,
and 975 nurse practitioner). Across the state, nearly one-third (31%) of all primary care clinician FTEs
were nearing retirement (age 55 or older). This rate remained consistent across urban and rural counties
(31% and 34%, respectively). Statewide, counties averaged 51 primary care clinician FTEs per 100,000
population. Urban counties contained a total of 3,239 primary care clinician FTEs (2,389 physician, 79
physician assistant, and 772 nurse practitioner). Urban counties averaged 83 primary care clinician FTEs
per 100,000 population. Rural counties contained a total of 711 primary care clinician FTEs (491
physician FTE, 18 physician assistant FTE, and 203 nurse practitioner FTE). Of all 92 Indiana counties,
56 contained a primary care Healthcare Professional Shortage Area (HPSA), and 71 contained a
Medically Underserved Area (MUA).
Primary Care Clinicians by AHEC Region
Indiana is divided into eight AHEC regions. Compared to the state as whole where 31 percent of
primary care clinician FTEs were nearing retirement, AHEC regions varied from a low of 25.7 percent of
primary care clinician FTEs nearing retirement (MICI region) to a high of 44.3 percent of primary care
clinician FTEs (WCI region). The ratio of primary care clinician FTEs to 100,000 population varied from
a low of 20 clinician FTEs per 100,000 population (EI and WCI regions) to a high of 174 clinician FTEs
per 100,000 population (MICI region).
Primary Care Clinicians by ISDH Public Health Region
The ISDH divided Indiana into 10 public health regions. ISDH regions varied from a low of 25.6
percent of primary care clinician FTEs nearing retirement (ISDH region 5) to a high of 42.7 percent of
primary care clinician FTEs (ISDH region 7). The ratio of primary care clinician FTEs to 100,000
population varied from a low of 18 clinician FTEs per 100,000 population (ISDH region 4) to a high of
183 clinician FTEs per 100,000 population (ISDH region 5).
Conclusion
Across the entire state, most of the primary care clinicians worked full-time (1.0 FTE) and one-
third were nearing retirement age. Overall, there were 51 primary care clinician FTEs per 100,000
population, far short of the recommended 100 per 100,000 to provide adequate access to primary care.
Comparing urban counties to rural counties, a majority of primary care providers practiced in urban
8
counties. However, a greater proportion of rural primary care providers were age 55 or older than those
working in urban counties. There was notable variation between AHEC and ISDH regions in terms of
both proportion of primary care clinician FTEs nearing retirement and ratio of primary care clinician
FTEs to population. The findings from this report may be used to identify primary care clinician shortage
areas, develop more effective recruitment and retention strategies, and plan additional locations for
training primary care clinicians within the state. In general, areas with the lowest ratio of primary care
clinician FTEs to population should be the first priorities for increasing the supply of primary care
clinicians.

9
Chapter 1: Introduction
Primary care clinicians are a critical segment of the health care workforce in Indiana. A large and
properly distributed primary care workforce can improve the entire health care system by increasing
access for the community while helping to reduce cost throughout the system.2 The Institute of Medicine
defined primary care as “the provision of integrated, accessible health care services by clinicians who are
accountable for addressing a large majority of personal health care needs, developing a sustained
partnership with patients, and practicing in the context of family and community.”3 This definition
emphasizes the primary care clinician’s role as an available, accountable advocate for the patient and the
patient’s family. The primary care clinician not only functions as a patient’s point of entry to the health
care system, but also coordinates care among any specialists that the patient may need to see. By
fulfilling these functions, primary care clinicians can mitigate the fragmentation of the health care system
in the United States; reduce cost caused by redundant or unnecessary procedures; and produce better
outcomes for patients and their families.
Though primary care is defined by the function of clinicians rather than by specialty, the
specialties that are generally included in primary care are: family physicians, general practitioners,
general internists, and general pediatricians. In addition to these physician specialties, physician
assistants and nurse practitioners also provide primary care and are included in this report as part of the
group considered to be primary care clinicians. Some organizations also include
obstetricians/gynecologists and/or geriatricians in their definitions of primary care clinicians. For this
report, a physician was considered a “primary care physician” if their specialty was one of the following:
family medicine, general internal medicine, general practice, internal medicine – pediatrics, and general
pediatrics. Though “general practice” is an antiquated term (replaced by Family Medicine after the
development of a board and board requirements) some physicians still identified themselves as general
practitioners and were included as primary care clinicians in this report. Physician assistants whose
supervising physicians’ specialties were one of the above were also included among the primary care
clinicians in this report. Nurse practitioners who spent the majority of their time in primary care were
also considered primary care clinicians in this report.
Having an accurate understanding of the personal and professional characteristics of primary care
clinicians licensed in Indiana is critical to develop and manage effective programs that recruit and retain
these professionals where they are most needed in the state. Quality data about the location of primary
2 Green, L., Dodoo, M., Ruddy, G., Fryer, G., Phillips, R., McCann, J., O'Neil, E., & Klein, L. The Robert Graham Center, (2004). The Physician Workforce of the United States a Family Medicine Perspective. Retrieved from http://www.graham-center.org/PreBuilt/physician_workforce.pdf. 3 National Research Council. "Front Matter." Primary Care: America's Health in a New Era. Washington, DC: The National Academies Press, 1996. 1. Retrieved from http://www.nap.edu/openbook.php?isbn=0309053994.

10
care clinicians in Indiana also will help policymakers and other stakeholders make better-informed
decisions in addressing health care professions shortages. The purpose of this report is to provide these
needed data. Thus, the findings from this report may be used to identify primary care clinician shortage
areas, develop more effective recruitment and retention strategies, and plan additional locations for
training primary care clinicians within the state.
This report uses findings from the Robert Graham Center as a benchmark for adequate primary
care in an area. The Robert Graham Center was founded in 1997 by the AAFP (American Academy of
Family Physicians) as a research center “focused on important policy questions related to family
physician services and the general domain of primary care.”4 Since 2000 the Robert Graham Center has
released annual reports (in addition to more frequent peer-reviewed articles and policy briefs) taking an
evidence-based approach to addressing policy issues surrounding family medicine and primary care. The
Robert Graham Center’s recommendation of 100 primary care clinician FTEs per 100,000 population as
the minimum amount of primary care needed to adequately provide care for a region was used as a
benchmark in this report because it is the most current evidence-based figure available.
Data for this report were assimilated from two sources: the Indiana Professional Licensing
Agency (IPLA) license files containing basic information about each licensed professional (physicians,
physician assistants, and nurse practitioners), and data from the re-licensure survey completed by health
professionals when renewing their state licenses. Two primary measures were used to evaluate the status
of Indiana’s primary care workforce: the proportion of primary care clinician full-time equivalents (FTEs)
“nearing retirement” (age 55 and older) and the (weighted) ratio of primary care provider FTEs per
100,000 population in each county. From the IPLA license dataset, each licensee’s date of birth was
extracted to calculate their age. This information was used to determine the proportion of primary care
clinician FTEs in Indiana who were nearing retirement age. The re-licensure survey responses were used
to determine the average number of hours worked per week to calculate primary care clinician FTEs.
Analyses of FTE, retirement age, and ratio of primary care clinician FTEs to population were carried out
at the state level (Chapter 3), by AHEC region (Chapter 4), and by ISDH public health region (Chapter 5)
in order to provide the most relevant organization of the data for various stakeholders.
4 Robert Graham Center website. http://www.graham‐center.org

11
Chapter 2: Methods
The Indiana State Department of Health (ISDH) and the Indiana Professional Licensing Agency
(IPLA) collaborated in implementing the 2011 Indiana Physician Re-Licensure Survey, 2010 Indiana
Physician Assistant Re-licensure Survey, and 2011 Registered Nurse Re-Licensure Survey. All
physicians, physician assistants, and nurses who renewed their licenses online were asked to complete a
voluntary questionnaire. The data used for this report were extracted from these three survey data files
provided by the Indiana State Department of Health along with information taken from IPLA licensing
datasets for 2011 physician re-licensure, 2010 physician assistant re-licensure, and 2011 registered nurse
re-licensure. Copies of each survey instrument are included in the Appendix. The survey instruments
included items to gather demographic and professional information, as well as the number of hours
worked per week for each respondent used to calculate FTE. The data provided by the IPLA licensure
file included date of birth for all licensed clinicians practicing in Indiana at the time of the survey used to
calculate the age of the professionals shown in this report. The IPLA licensure and survey datasets were
merged by matching the license number of each primary care provider using SAS 9.3.
Each respondent’s age was calculated using a reference date that fell in the middle of each
profession’s re-licensure period since the actual date of renewal was unknown. The reference date used
for physicians was May 30, 2011 since surveys were completed from April 30 through June 30, 2011.
The reference date used for physician assistants was May 30, 2010 since surveys were completed from
April 30 to June 30, 2010. The reference date used for nurse practitioners was September 30, 2011 since
surveys were completed from August 31 to October 31, 2011. The merged dataset was then filtered to
include only the respondents who met the inclusion criteria for specialty type and actively practicing in
Indiana. Also, the merged dataset included only those clinicians who renewed their license electronically.
However, estimates of the number of clinicians in geographic areas were weighted by the response rate to
account for these missing cases. Consequently, while the number of clinicians shown in the tables who
chose each response option is lower than the actual number of clinicians in the state, the percentages who
selected each response option is assumed to be representative of all primary care clinicians.
Inclusion/Exclusion Criteria
Deriving the Primary Care Physician Data Set
The total number of physicians who renewed their Indiana license in 2011 was 23,026. Of the
23,026 renewals, 21,400 were completed online and were asked to complete the 2011 Indiana physicians
re-licensure survey. Of the 21,400 physicians who were asked to complete the 2011 Indiana physicians
re-licensure survey, 19,326 (90.3%) responded to at least one question on the survey. Of the 19,326

12
respondents, 10,927 physicians indicated that they were currently practicing in Indiana. Of the 10,927
physicians currently practicing in Indiana 86.6% answered all non-optional questions in the survey.
Table 2.1 displays the license status of Indiana-based physicians who responded to the 2011 Indiana
physician re-licensure survey. Nearly all respondents (99.8%) held an active license.
Table 2.1 Current Physician License Status
Physician License Status Number Percent
Active 10,904 99.8 Probation 23 0.2
Total 10,927 100.0
Of the 10,927 Indiana-based physicians who responded to the 2011 Indiana physicians re-
licensure survey, 10,289 physicians met the initial inclusion criteria for this report (refer to Table 2.2).
Physicians who practiced outside of Indiana, were inactive in medicine, retired from active medical
practice, or currently in training to become a physician (residents/fellows) were excluded from the
dataset. These respondents were excluded because this report is meant to reflect the primary care
clinicians who are available to serve the population-at-large. Overall, 94.3 percent (10,289) of Indiana-
based respondents were included in the dataset.
Table 2.2 Current Physician Work Status*
Physician Work Status Number Percent
Excluded from Dataset
Inactive in medicine 40 0.4 Retired from active medical practice 168 1.5 Physician in training (medical resident/fellow) 413 3.8 Total Excluded from Dataset 621 5.7 Included in Dataset Physician active in medicine, locum tenens ONLY 69 0.6 Physician active in medicine, not seeing patients 372 3.4 Physician actively seeing patients - Full time 8,714 79.9 Physician actively seeing patients - Part time 1,134 10.4 Total Included in Dataset 10,289 94.3 Total Indiana-based Survey Respondents 10,910 100.0
No Response Given 17 *These numbers represent survey respondents only.
13
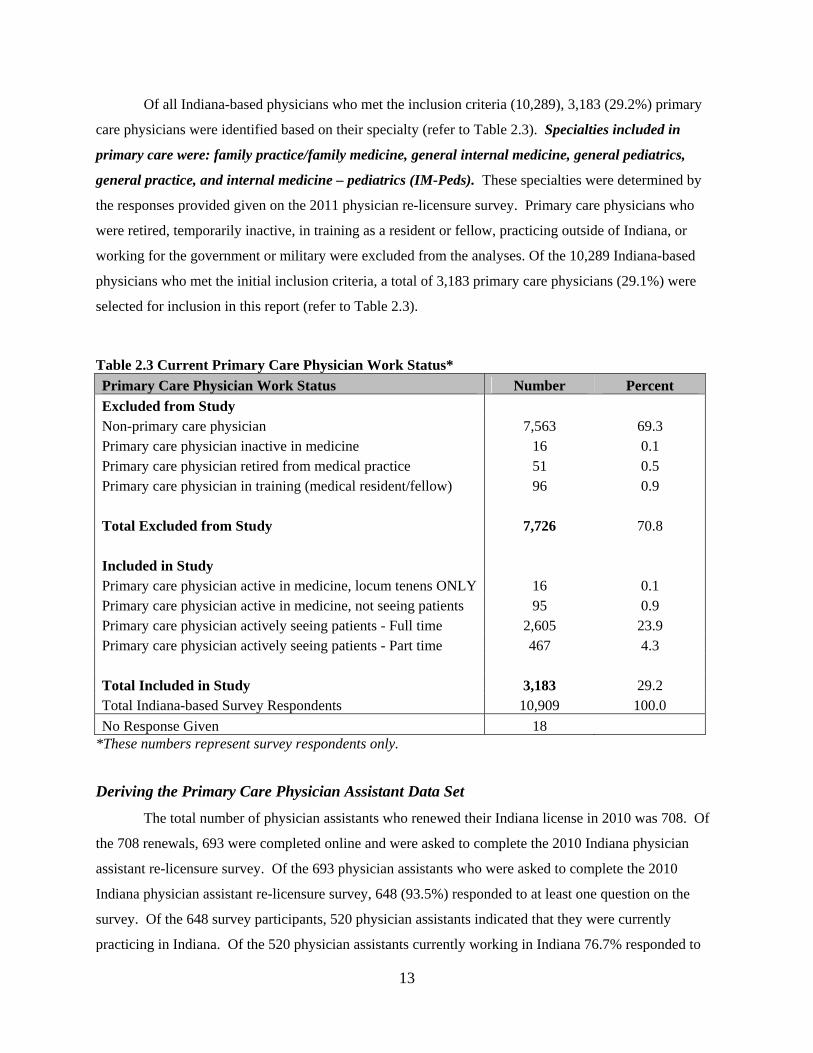
Of all Indiana-based physicians who met the inclusion criteria (10,289), 3,183 (29.2%) primary
care physicians were identified based on their specialty (refer to Table 2.3). Specialties included in
primary care were: family practice/family medicine, general internal medicine, general pediatrics,
general practice, and internal medicine – pediatrics (IM-Peds). These specialties were determined by
the responses provided given on the 2011 physician re-licensure survey. Primary care physicians who
were retired, temporarily inactive, in training as a resident or fellow, practicing outside of Indiana, or
working for the government or military were excluded from the analyses. Of the 10,289 Indiana-based
physicians who met the initial inclusion criteria, a total of 3,183 primary care physicians (29.1%) were
selected for inclusion in this report (refer to Table 2.3).
Table 2.3 Current Primary Care Physician Work Status*
Primary Care Physician Work Status Number Percent
Excluded from Study Non-primary care physician 7,563 69.3 Primary care physician inactive in medicine 16 0.1 Primary care physician retired from medical practice 51 0.5 Primary care physician in training (medical resident/fellow) 96 0.9 Total Excluded from Study 7,726 70.8 Included in Study Primary care physician active in medicine, locum tenens ONLY 16 0.1 Primary care physician active in medicine, not seeing patients 95 0.9 Primary care physician actively seeing patients - Full time 2,605 23.9 Primary care physician actively seeing patients - Part time 467 4.3 Total Included in Study 3,183 29.2 Total Indiana-based Survey Respondents 10,909 100.0
No Response Given 18 *These numbers represent survey respondents only.
Deriving the Primary Care Physician Assistant Data Set
The total number of physician assistants who renewed their Indiana license in 2010 was 708. Of
the 708 renewals, 693 were completed online and were asked to complete the 2010 Indiana physician
assistant re-licensure survey. Of the 693 physician assistants who were asked to complete the 2010
Indiana physician assistant re-licensure survey, 648 (93.5%) responded to at least one question on the
survey. Of the 648 survey participants, 520 physician assistants indicated that they were currently
practicing in Indiana. Of the 520 physician assistants currently working in Indiana 76.7% responded to

14
all non-optional questions in the survey. Table 2.4 displays the license status of Indiana-based physician
assistants who responded to the 2010 Indiana physician assistant re-licensure survey. Nearly all
respondents (97.7%) held an active license.
Table 2.4 Current Physician Assistant License Status Physician Assistant License Status Number Percent
Active 508 97.7 Expired 10 1.9 Probation 2 0.4
Total 520 100.0
Of the 520 Indiana-based physician assistants who responded to the 2010 Indiana physician
assistant re-licensure survey, 461 physician assistants met the initial inclusion criteria for this report (refer
to Table 2.5). Physician assistants who practiced outside of Indiana, were inactive in medicine, or worked
for a government employer were excluded from the analyses. These respondents were excluded because
this report is meant to reflect the primary care clinicians who are available to serve the Indiana
population-at-large. Overall, 91.8 percent (461) of Indiana-based respondents were included in the
dataset.
Table 2.5 Current Physician Assistant Work Status*
Physician Assistant Work Status Number Percent
Excluded from Dataset Temporarily inactive as a physician assistant 2 0.4 Actively working as a physician assistant in federal government 3 0.6 Actively working as a physician assistant in state government 7 1.4 Actively working as a physician assistant in local government 2 0.4 Actively working as a physician assistant in the military 4 0.8 Actively working as a physician assistant in “other” type of employment
23 4.6
Total Excluded from Dataset 41 8.2 Included in Dataset Actively working as a physician assistant 461 91.8 Total Included in Dataset 461 91.8 Total Indiana-based Survey Respondents 502 100.0
No Response Given 18 *These numbers represent survey respondents only.

15
After determining all Indiana-based physician assistants who met the inclusion criteria (461), the
respondents were filtered to identify all primary care physician assistants by the specialty of their
supervising physicians. Specialties included in primary care were: family practice/family medicine,
general internal medicine, general pediatrics, general practice, and pediatric internal medicine.
Primary care physician assistants who were working for the government or military were excluded from
the analyses. Of the 461 Indiana-based physician assistants who met the initial inclusion criteria, a total of
103 primary care physician assistants (20.6%) were selected for inclusion in this report (refer to Table
2.6).
Table 2.6 Current Primary Care Physician Work Status*
Primary Care Physician Assistant Work Status Number Percent
Excluded from Study Non-primary care physician assistant 383 76.4 Primary care physician assistants not meeting initial inclusion criteria
15 3.0
Total Excluded from Study 398 79.4 Included in Study Primary care physician assistant actively working in medicine 103 20.6 Total Included in Study 103 20.6 Total Indiana-based Survey Respondents 501 100.0
No Response Given 19 *These numbers represent survey respondents only.
Deriving the Primary Care Nurse Practitioner Data Set
The total number of nurses who renewed their Indiana licenses in 2011 was 98,235. Of the
98,235 renewals, 94,216 were completed online and were asked to complete the 2011 Indiana nurse re-
licensure survey. Of the 94,216 nurses who were asked to complete the 2011 Indiana nurse re-licensure
survey, 88,650 (94.1%) responded to at least one question on the survey. Of the 88,650 survey
participants, 54,826 nurses indicated that they were currently practicing in Indiana. Of the 54,826 nurses
currently practicing in Indiana 40.8% responded to all non-optional survey questions.
Of the 54,826 Indiana-based nurses who responded to the 2011 Indiana nurse re-licensure survey,
53,591 nurses met the initial inclusion criteria for this report (refer to Table 2.7). Nurses who practiced
outside of Indiana, were inactive in medicine, retired from medicine, worked only on a non-paid basis, or

16
worked in a position not related to nursing were excluded from the analyses. These respondents were
excluded because this report is meant to reflect the primary care clinicians who are available to serve the
community-at-large. Overall, 98.4 percent (53,591) of Indiana-based respondents were included in the
dataset.
Table 2.7 Current Registered Nurse Work Status*
Nurse Work Status Number Percent
Excluded from Dataset Actively working in a paid health care position, but not in nursing
498 0.9
Actively working, but not in nursing or health care 32 0.1 Working in nursing ONLY on a non-paid basis 84 0.2 Retired or permanently inactive as a nurse 42 0.1 Temporarily inactive as a nurse 67 0.1 Unemployed and seeking work as a nurse in Indiana 168 0.3 Total Excluded from Dataset 891 1.6 Included in Dataset Actively working in a paid position related to nursing 53,591 98.4 Total Included in Dataset 53,591 98.4 Total Indiana-based Survey Respondents 54,482 100.0
No Response Given 344 *These numbers represent survey respondents only.
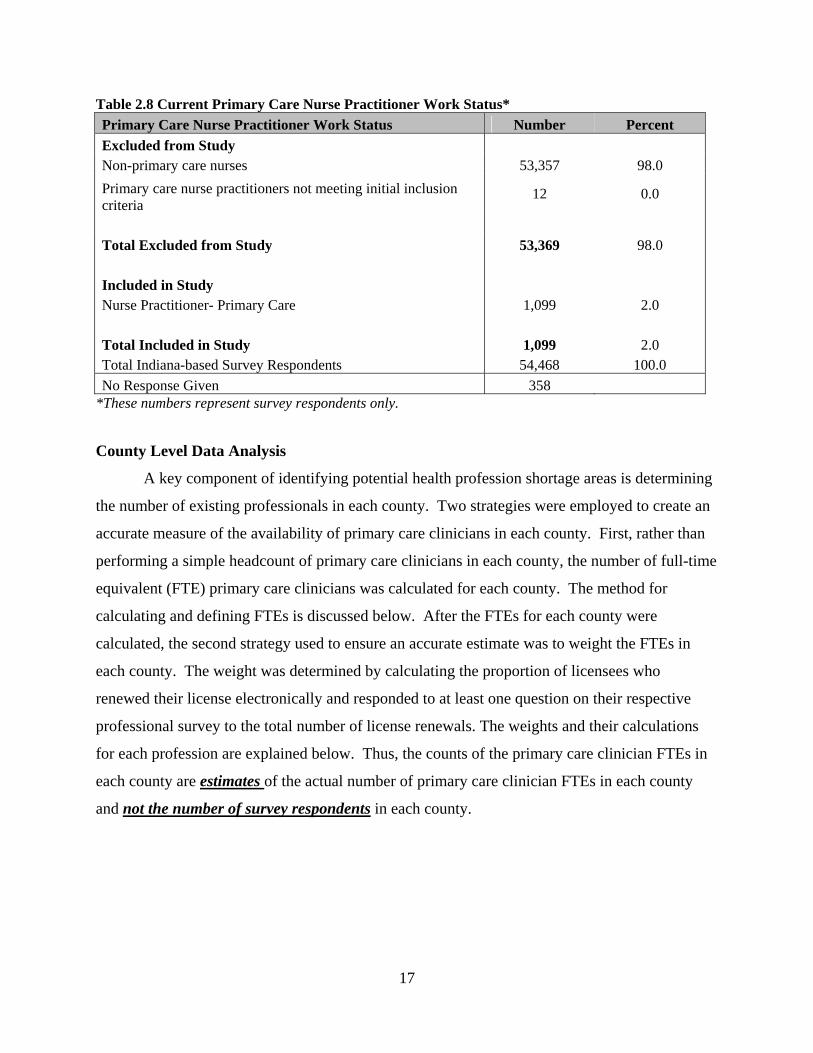
After determining all Indiana-based nurses who met the inclusion criteria (53,591), the
respondents were filtered to identify all primary care nurse practitioners. This was accomplished by
including all respondents who, when asked if they currently worked in an Advanced Practice Nursing
position, indicated that they were a Nurse Practitioner – Primary Care. Of the 53,591 Indiana-based
nurses who met the initial inclusion criteria, a total of 1,099 primary care nurse practitioners (2.0%) were
selected for inclusion in this report (refer to Table 2.8).
17
Table 2.8 Current Primary Care Nurse Practitioner Work Status*
Primary Care Nurse Practitioner Work Status Number Percent
Excluded from Study Non-primary care nurses 53,357 98.0
Primary care nurse practitioners not meeting initial inclusion criteria
12 0.0
Total Excluded from Study 53,369 98.0 Included in Study Nurse Practitioner- Primary Care 1,099 2.0 Total Included in Study 1,099 2.0 Total Indiana-based Survey Respondents 54,468 100.0
No Response Given 358 *These numbers represent survey respondents only.
County Level Data Analysis
A key component of identifying potential health profession shortage areas is determining
the number of existing professionals in each county. Two strategies were employed to create an
accurate measure of the availability of primary care clinicians in each county. First, rather than
performing a simple headcount of primary care clinicians in each county, the number of full-time
equivalent (FTE) primary care clinicians was calculated for each county. The method for
calculating and defining FTEs is discussed below. After the FTEs for each county were
calculated, the second strategy used to ensure an accurate estimate was to weight the FTEs in
each county. The weight was determined by calculating the proportion of licensees who
renewed their license electronically and responded to at least one question on their respective
professional survey to the total number of license renewals. The weights and their calculations
for each profession are explained below. Thus, the counts of the primary care clinician FTEs in
each county are estimates of the actual number of primary care clinician FTEs in each county
and not the number of survey respondents in each county.
18
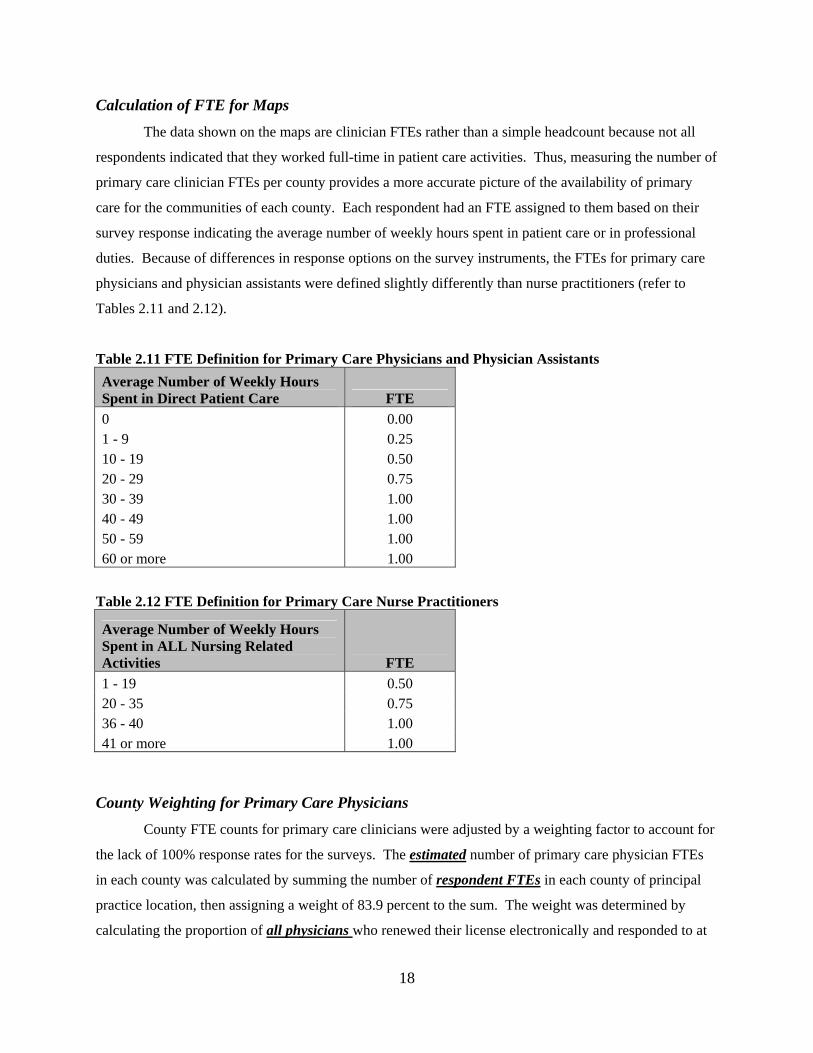
Calculation of FTE for Maps
The data shown on the maps are clinician FTEs rather than a simple headcount because not all
respondents indicated that they worked full-time in patient care activities. Thus, measuring the number of
primary care clinician FTEs per county provides a more accurate picture of the availability of primary
care for the communities of each county. Each respondent had an FTE assigned to them based on their
survey response indicating the average number of weekly hours spent in patient care or in professional
duties. Because of differences in response options on the survey instruments, the FTEs for primary care
physicians and physician assistants were defined slightly differently than nurse practitioners (refer to
Tables 2.11 and 2.12).
Table 2.11 FTE Definition for Primary Care Physicians and Physician Assistants
Average Number of Weekly Hours Spent in Direct Patient Care FTE
0 0.00 1 - 9 0.25 10 - 19 0.50 20 - 29 0.75 30 - 39 1.00 40 - 49 1.00 50 - 59 1.00 60 or more 1.00
Table 2.12 FTE Definition for Primary Care Nurse Practitioners
Average Number of Weekly Hours Spent in ALL Nursing Related Activities FTE
1 - 19 0.50 20 - 35 0.75 36 - 40 1.00 41 or more 1.00
County Weighting for Primary Care Physicians
County FTE counts for primary care clinicians were adjusted by a weighting factor to account for
the lack of 100% response rates for the surveys. The estimated number of primary care physician FTEs
in each county was calculated by summing the number of respondent FTEs in each county of principal
practice location, then assigning a weight of 83.9 percent to the sum. The weight was determined by
calculating the proportion of all physicians who renewed their license electronically and responded to at
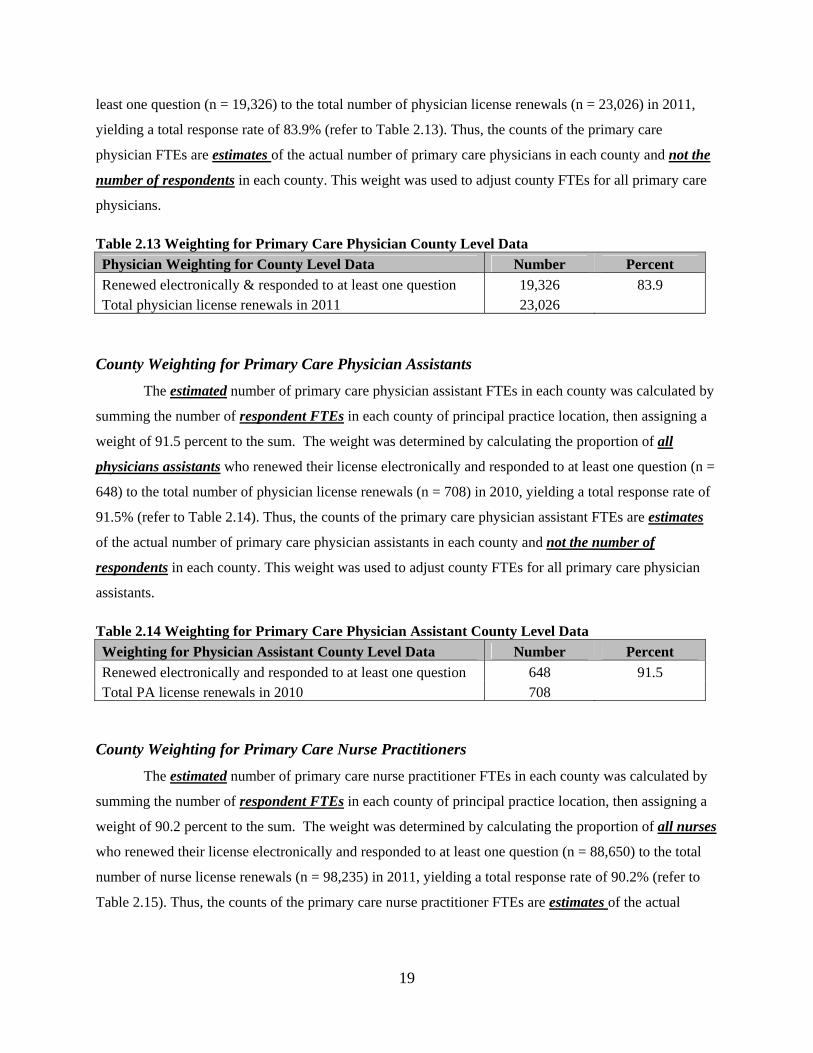
19
least one question (n = 19,326) to the total number of physician license renewals (n = 23,026) in 2011,
yielding a total response rate of 83.9% (refer to Table 2.13). Thus, the counts of the primary care
physician FTEs are estimates of the actual number of primary care physicians in each county and not the
number of respondents in each county. This weight was used to adjust county FTEs for all primary care
physicians.
Table 2.13 Weighting for Primary Care Physician County Level Data
Physician Weighting for County Level Data Number Percent
Renewed electronically & responded to at least one question 19,326 83.9 Total physician license renewals in 2011 23,026
County Weighting for Primary Care Physician Assistants
The estimated number of primary care physician assistant FTEs in each county was calculated by
summing the number of respondent FTEs in each county of principal practice location, then assigning a
weight of 91.5 percent to the sum. The weight was determined by calculating the proportion of all
physicians assistants who renewed their license electronically and responded to at least one question (n =
648) to the total number of physician license renewals (n = 708) in 2010, yielding a total response rate of
91.5% (refer to Table 2.14). Thus, the counts of the primary care physician assistant FTEs are estimates
of the actual number of primary care physician assistants in each county and not the number of
respondents in each county. This weight was used to adjust county FTEs for all primary care physician
assistants.
Table 2.14 Weighting for Primary Care Physician Assistant County Level Data
Weighting for Physician Assistant County Level Data Number Percent
Renewed electronically and responded to at least one question 648 91.5 Total PA license renewals in 2010 708
County Weighting for Primary Care Nurse Practitioners
The estimated number of primary care nurse practitioner FTEs in each county was calculated by
summing the number of respondent FTEs in each county of principal practice location, then assigning a
weight of 90.2 percent to the sum. The weight was determined by calculating the proportion of all nurses
who renewed their license electronically and responded to at least one question (n = 88,650) to the total
number of nurse license renewals (n = 98,235) in 2011, yielding a total response rate of 90.2% (refer to
Table 2.15). Thus, the counts of the primary care nurse practitioner FTEs are estimates of the actual

20
number of primary care nurse practitioners in each county and not the number of respondents in each
county. This weight was used to adjust county FTEs for all primary care nurse practitioners.
Table 2.15 Weighting for Primary Care Nurse Practitioner County Level Data
Weighting for Nurse County Level Data Number Percent
Renewed electronically and responded to at least one question 88,650 90.2 Total PA license renewals in 2010 98,235

21
Chapter 3: Proportion Nearing Retirement Age and Geographical
Distributions of Primary Care Clinicians in Indiana
This chapter presents the statewide proportion nearing retirement age (55 or older) and
geographical distributions of Indiana primary care clinician FTEs. The age data are presented for the
entire state (Table 3.1), urban counties only (Table 3.4), and rural counties only (Table 3.5).
Additionally, the geographic distribution of primary care clinicians (by FTEs per 100,000 population) is
presented as a state map of urban counties (Map 3.1) and rural counties (Map 3.2). These geographical
data are also presented in tabular form for urban counties (Table 3.2) and rural counties (Tables 3.3).
Clinicians age 55 and older were considered to be “nearing retirement” and may need to be replaced by
new recruits to the primary care workforce within the next decade to maintain similar levels of FTEs. It
should be noted that the FTEs reported in the state map and county tables are weighted estimates of FTEs
that are meant to estimate the actual accessible workforce of primary care providers to the communities
that they serve.
Statewide Data
Primary Care Clinician Workforce Age Characteristics
Table 3.1 displays the primary care physician, physician assistant, and nurse practitioner FTEs in
across the entire state by the age group of primary care clinicians. Overall, almost one-third (31.2%) of
all primary care clinician FTEs were nearing retirement age. A larger proportion of primary care
physicians are nearing retirement age than primary care physician assistants or nurse practitioners.
Table 3.1 State Primary Care Clinician Age by FTE*
Primary Care Clinician FTEs Statewide
Under 55 years old 55 years old and over Total
FTEs Percent FTEs Percent FTEs Percent
Primary Care Physicians 1,932 67 948 33 2,880 100.0 Primary Care PAs 75 78 21 22 96 100.0 Primary Care NPs 713 73 262 27 975 100.0 All Primary Care Providers 2,719 69 1,232 31 3,951 100.0
No Response Given 79 *These numbers represent survey respondents only.
22
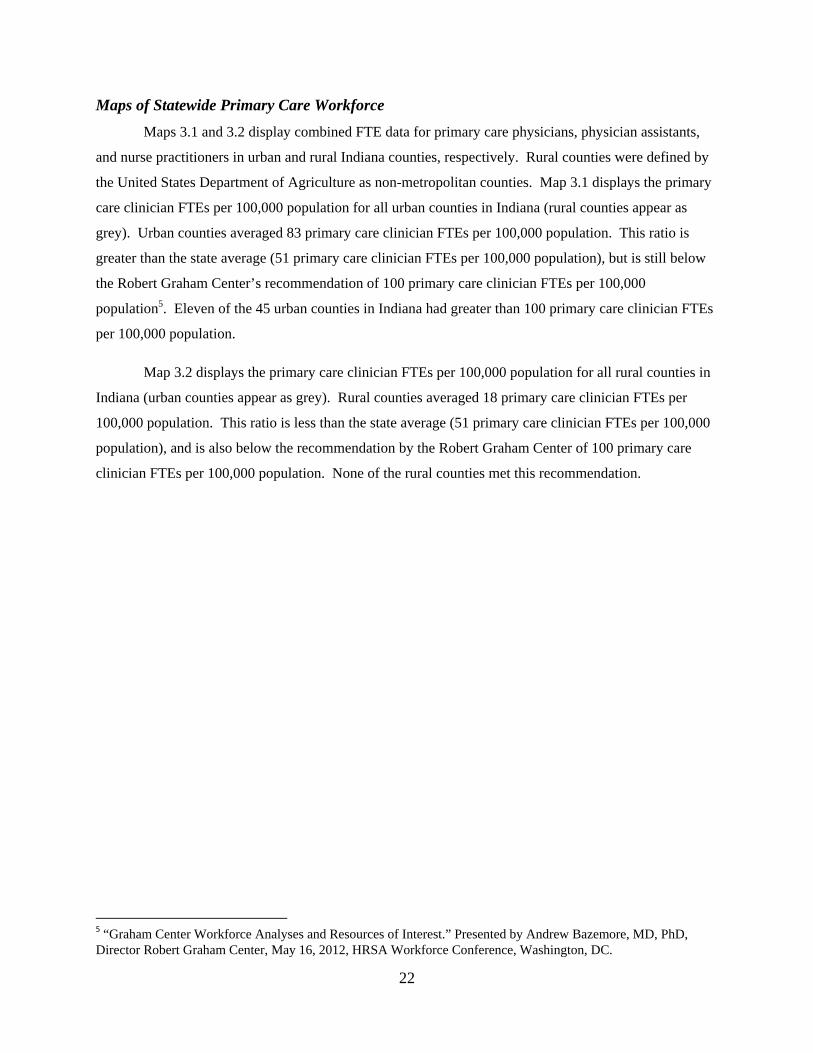
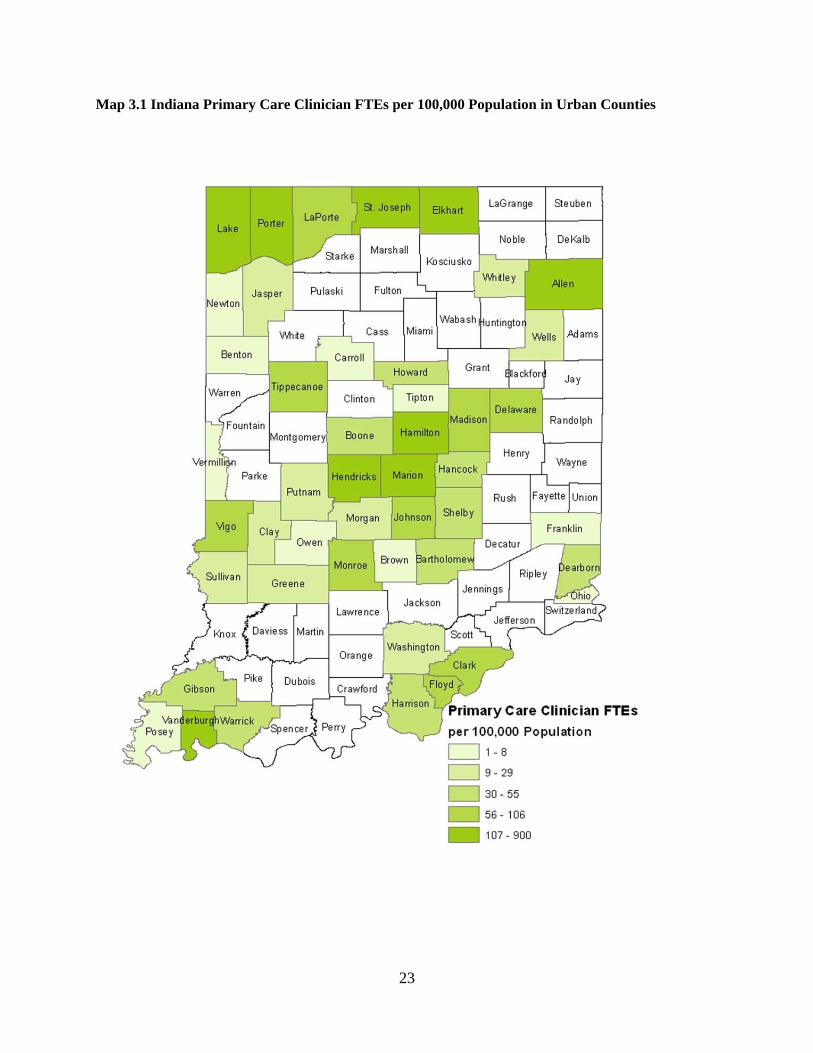
Maps of Statewide Primary Care Workforce
Maps 3.1 and 3.2 display combined FTE data for primary care physicians, physician assistants,
and nurse practitioners in urban and rural Indiana counties, respectively. Rural counties were defined by
the United States Department of Agriculture as non-metropolitan counties. Map 3.1 displays the primary
care clinician FTEs per 100,000 population for all urban counties in Indiana (rural counties appear as
grey). Urban counties averaged 83 primary care clinician FTEs per 100,000 population. This ratio is
greater than the state average (51 primary care clinician FTEs per 100,000 population), but is still below
the Robert Graham Center’s recommendation of 100 primary care clinician FTEs per 100,000
population5. Eleven of the 45 urban counties in Indiana had greater than 100 primary care clinician FTEs
per 100,000 population.
Map 3.2 displays the primary care clinician FTEs per 100,000 population for all rural counties in
Indiana (urban counties appear as grey). Rural counties averaged 18 primary care clinician FTEs per
100,000 population. This ratio is less than the state average (51 primary care clinician FTEs per 100,000
population), and is also below the recommendation by the Robert Graham Center of 100 primary care
clinician FTEs per 100,000 population. None of the rural counties met this recommendation.
5 “Graham Center Workforce Analyses and Resources of Interest.” Presented by Andrew Bazemore, MD, PhD, Director Robert Graham Center, May 16, 2012, HRSA Workforce Conference, Washington, DC.
23
Map 3.1 Indiana Primary Care Clinician FTEs per 100,000 Population in Urban Counties
24
Map 3.2 Indiana Primary Care Clinician FTEs per 100,000 Population in Rural Counties
25
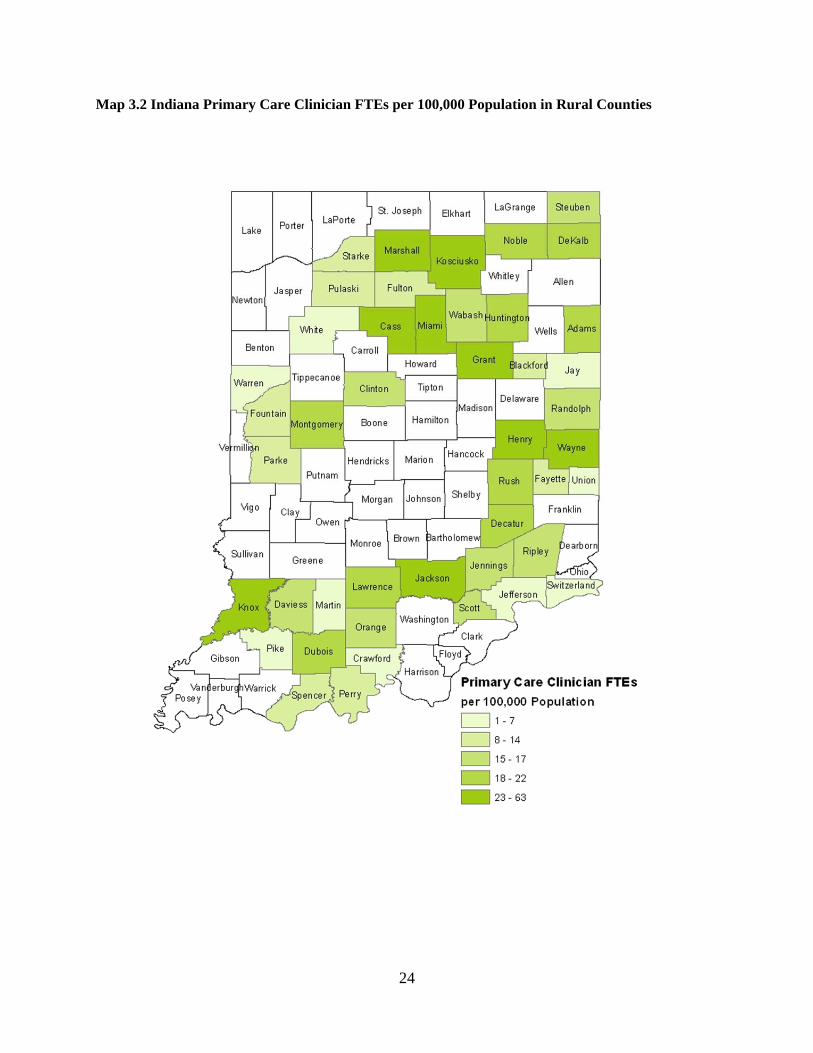
Statewide County Data Tables
Primary Care Clinicians: Urban County Data
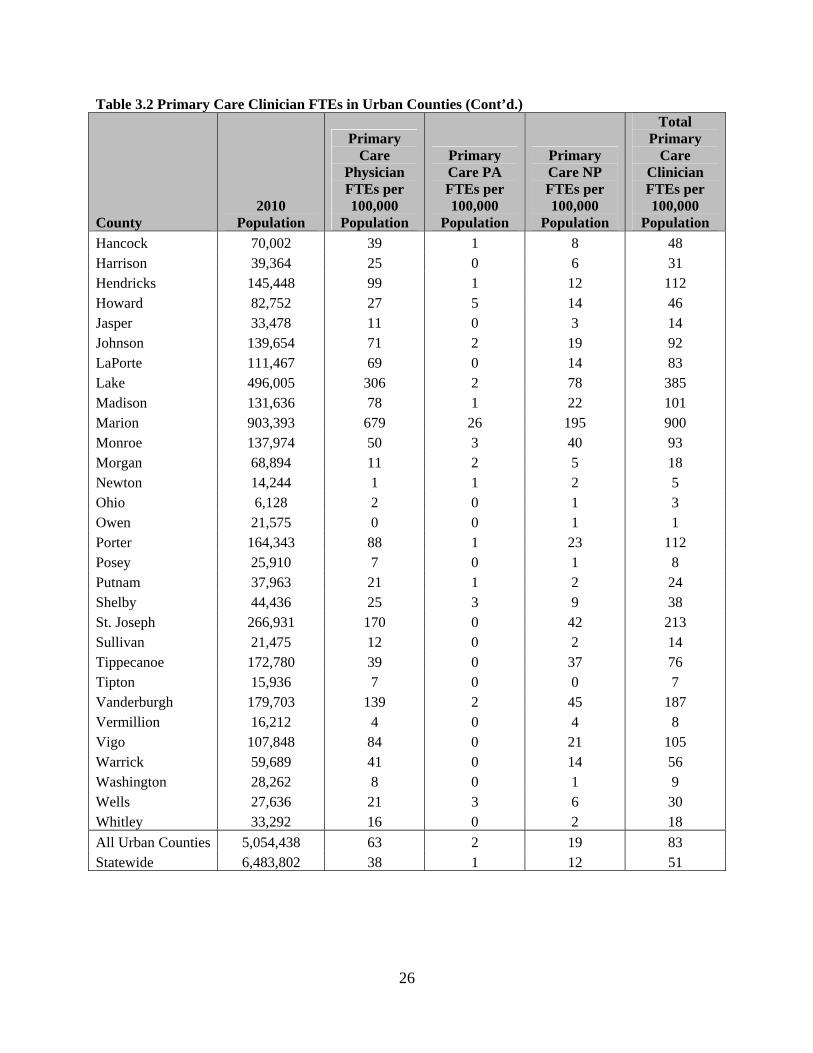
Table 3.2 shows the total number of primary care physicians, physician assistants, and nurse
practitioner FTEs by ratio per 100,000 population in each urban county in Indiana. These ratios are
weighted using the county weight for each profession discussed in the Methods section. Therefore, these
numbers represent an estimate of the total number of primary care clinician FTEs available to the
communities in each county. Overall, for the state of Indiana, there were 51 primary care clinician FTEs
per 100,000 population. Urban counties in Indiana averaged 83 primary care clinician FTEs per 100,000
population. The Robert Graham Center’s research found that, in general there should be 1 primary care
clinician FTE for every 1,000 population – or 100 per 100,000 to provide adequate health care in a service
area. Counties where the population is older, has more chronic conditions, or other special health care
needs would require more primary care clinicians to provide adequate health care. Since many residents
of surrounding counties may seek care in the central urban county, a logical service area may be larger or
smaller than a county.
Table 3.2 Primary Care Clinician FTEs in Urban Counties
County 2010 Population
Primary Care Physician FTEs per 100,000
Population
Primary Care PA FTEs per
100,000 Population
Primary Care NP FTEs per
100,000 Population
Total Primary Care
Clinician FTEs per 100,000
Population
Allen 355,329 151 8 66 225 Bartholomew 76,794 36 0 15 51 Benton 8,854 1 0 0 1 Boone 56,640 36 0 6 42 Brown 15,242 3 0 2 5 Carroll 20,155 1 1 4 6 Clark 110,232 61 2 24 88 Clay 26,890 12 2 2 16 Dearborn 25,740 32 1 2 35 Delaware 117,671 54 2 21 77 Elkhart 197,559 94 2 28 124 Floyd 74,578 47 3 9 60 Franklin 23,087 4 1 0 6 Gibson 33,503 24 0 7 32 Greene 33,165 5 1 6 12 Hamilton 274,569 171 8 34 213
26
Table 3.2 Primary Care Clinician FTEs in Urban Counties (Cont’d.)
County 2010
Population
Primary Care
Physician FTEs per 100,000
Population
Primary Care PA FTEs per 100,000
Population
Primary Care NP FTEs per 100,000
Population
Total Primary
Care Clinician FTEs per 100,000
Population
Hancock 70,002 39 1 8 48 Harrison 39,364 25 0 6 31 Hendricks 145,448 99 1 12 112 Howard 82,752 27 5 14 46 Jasper 33,478 11 0 3 14 Johnson 139,654 71 2 19 92 LaPorte 111,467 69 0 14 83 Lake 496,005 306 2 78 385 Madison 131,636 78 1 22 101 Marion 903,393 679 26 195 900 Monroe 137,974 50 3 40 93 Morgan 68,894 11 2 5 18 Newton 14,244 1 1 2 5 Ohio 6,128 2 0 1 3 Owen 21,575 0 0 1 1 Porter 164,343 88 1 23 112 Posey 25,910 7 0 1 8 Putnam 37,963 21 1 2 24 Shelby 44,436 25 3 9 38 St. Joseph 266,931 170 0 42 213 Sullivan 21,475 12 0 2 14 Tippecanoe 172,780 39 0 37 76 Tipton 15,936 7 0 0 7 Vanderburgh 179,703 139 2 45 187 Vermillion 16,212 4 0 4 8 Vigo 107,848 84 0 21 105 Warrick 59,689 41 0 14 56 Washington 28,262 8 0 1 9 Wells 27,636 21 3 6 30 Whitley 33,292 16 0 2 18
All Urban Counties 5,054,438 63 2 19 83 Statewide 6,483,802 38 1 12 51
27
Primary Care Clinicians: Rural County Data
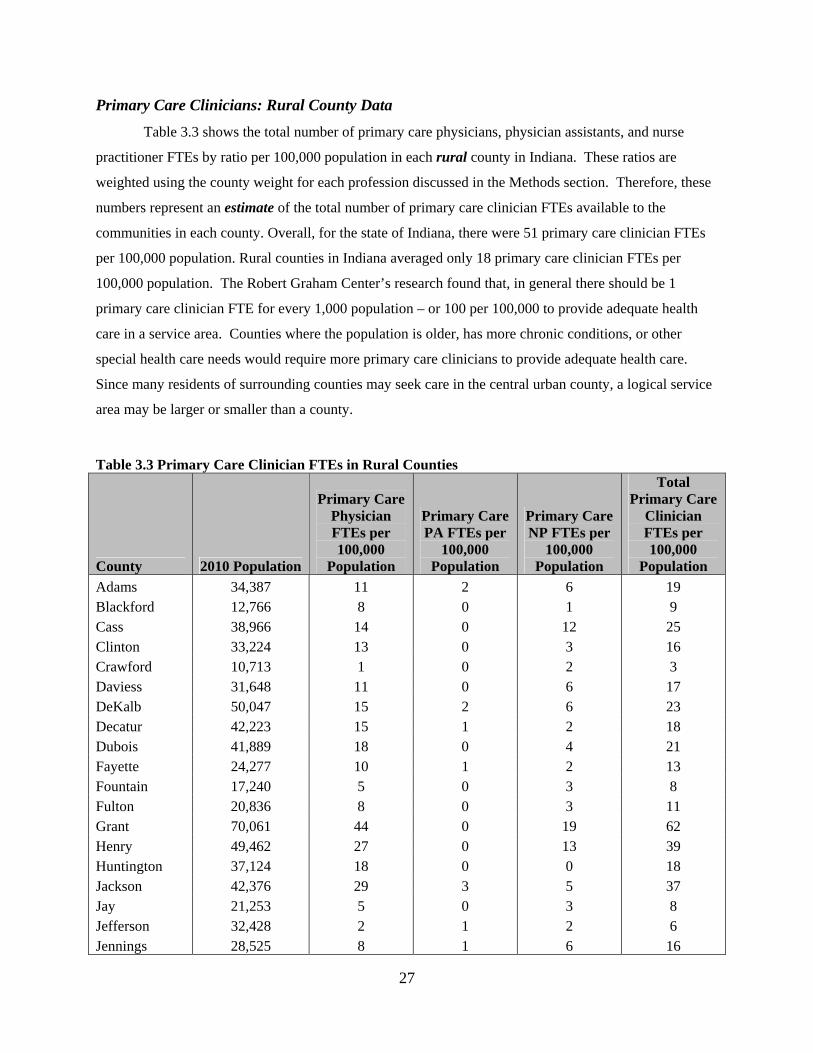
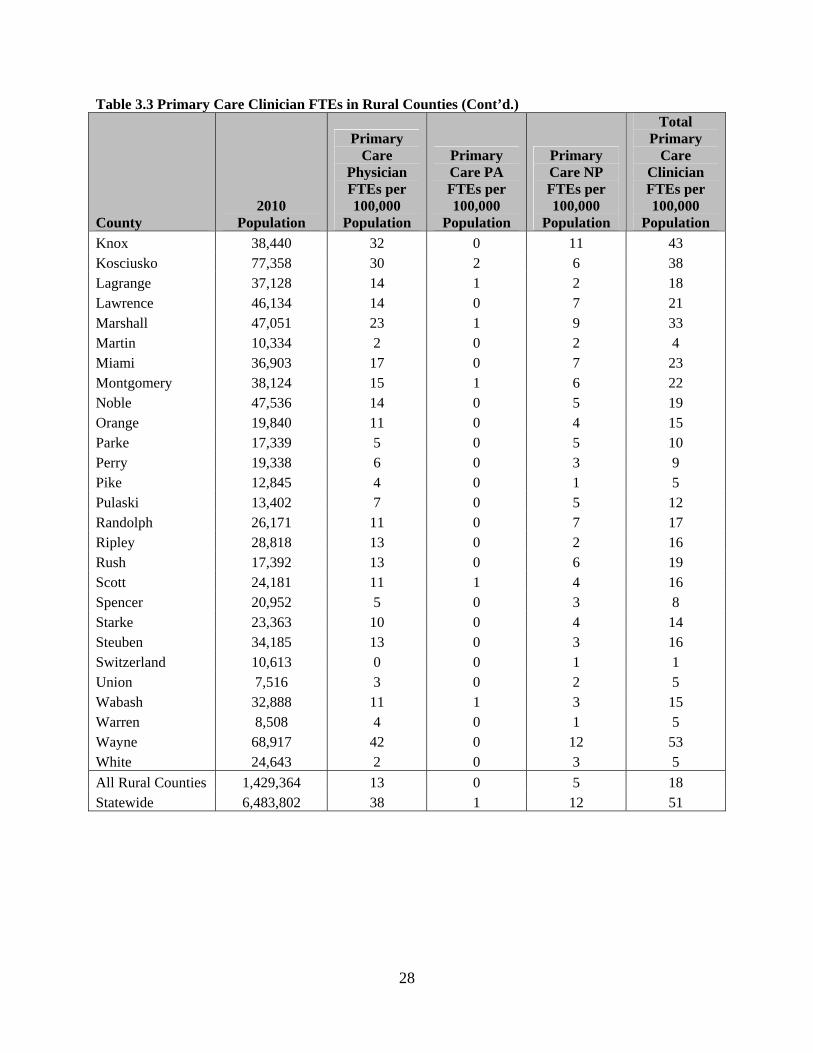
Table 3.3 shows the total number of primary care physicians, physician assistants, and nurse
practitioner FTEs by ratio per 100,000 population in each rural county in Indiana. These ratios are
weighted using the county weight for each profession discussed in the Methods section. Therefore, these
numbers represent an estimate of the total number of primary care clinician FTEs available to the
communities in each county. Overall, for the state of Indiana, there were 51 primary care clinician FTEs
per 100,000 population. Rural counties in Indiana averaged only 18 primary care clinician FTEs per
100,000 population. The Robert Graham Center’s research found that, in general there should be 1
primary care clinician FTE for every 1,000 population – or 100 per 100,000 to provide adequate health
care in a service area. Counties where the population is older, has more chronic conditions, or other
special health care needs would require more primary care clinicians to provide adequate health care.
Since many residents of surrounding counties may seek care in the central urban county, a logical service
area may be larger or smaller than a county.
Table 3.3 Primary Care Clinician FTEs in Rural Counties
County 2010 Population
Primary Care Physician FTEs per 100,000
Population
Primary Care PA FTEs per
100,000 Population
Primary Care NP FTEs per
100,000 Population
Total Primary Care
Clinician FTEs per 100,000
Population
Adams 34,387 11 2 6 19 Blackford 12,766 8 0 1 9 Cass 38,966 14 0 12 25 Clinton 33,224 13 0 3 16 Crawford 10,713 1 0 2 3 Daviess 31,648 11 0 6 17 DeKalb 50,047 15 2 6 23 Decatur 42,223 15 1 2 18 Dubois 41,889 18 0 4 21 Fayette 24,277 10 1 2 13 Fountain 17,240 5 0 3 8 Fulton 20,836 8 0 3 11 Grant 70,061 44 0 19 62 Henry 49,462 27 0 13 39 Huntington 37,124 18 0 0 18 Jackson 42,376 29 3 5 37 Jay 21,253 5 0 3 8 Jefferson 32,428 2 1 2 6 Jennings 28,525 8 1 6 16
28
Table 3.3 Primary Care Clinician FTEs in Rural Counties (Cont’d.)
County 2010
Population
Primary Care
Physician FTEs per 100,000
Population
Primary Care PA FTEs per 100,000
Population
Primary Care NP FTEs per 100,000
Population
Total Primary
Care Clinician FTEs per 100,000
Population
Knox 38,440 32 0 11 43 Kosciusko 77,358 30 2 6 38 Lagrange 37,128 14 1 2 18 Lawrence 46,134 14 0 7 21 Marshall 47,051 23 1 9 33 Martin 10,334 2 0 2 4 Miami 36,903 17 0 7 23 Montgomery 38,124 15 1 6 22 Noble 47,536 14 0 5 19 Orange 19,840 11 0 4 15 Parke 17,339 5 0 5 10 Perry 19,338 6 0 3 9 Pike 12,845 4 0 1 5 Pulaski 13,402 7 0 5 12 Randolph 26,171 11 0 7 17 Ripley 28,818 13 0 2 16 Rush 17,392 13 0 6 19 Scott 24,181 11 1 4 16 Spencer 20,952 5 0 3 8 Starke 23,363 10 0 4 14 Steuben 34,185 13 0 3 16 Switzerland 10,613 0 0 1 1 Union 7,516 3 0 2 5 Wabash 32,888 11 1 3 15 Warren 8,508 4 0 1 5 Wayne 68,917 42 0 12 53 White 24,643 2 0 3 5
All Rural Counties 1,429,364 13 0 5 18 Statewide 6,483,802 38 1 12 51
29
Urban Counties Age Data
Primary Care Workforce Characteristics
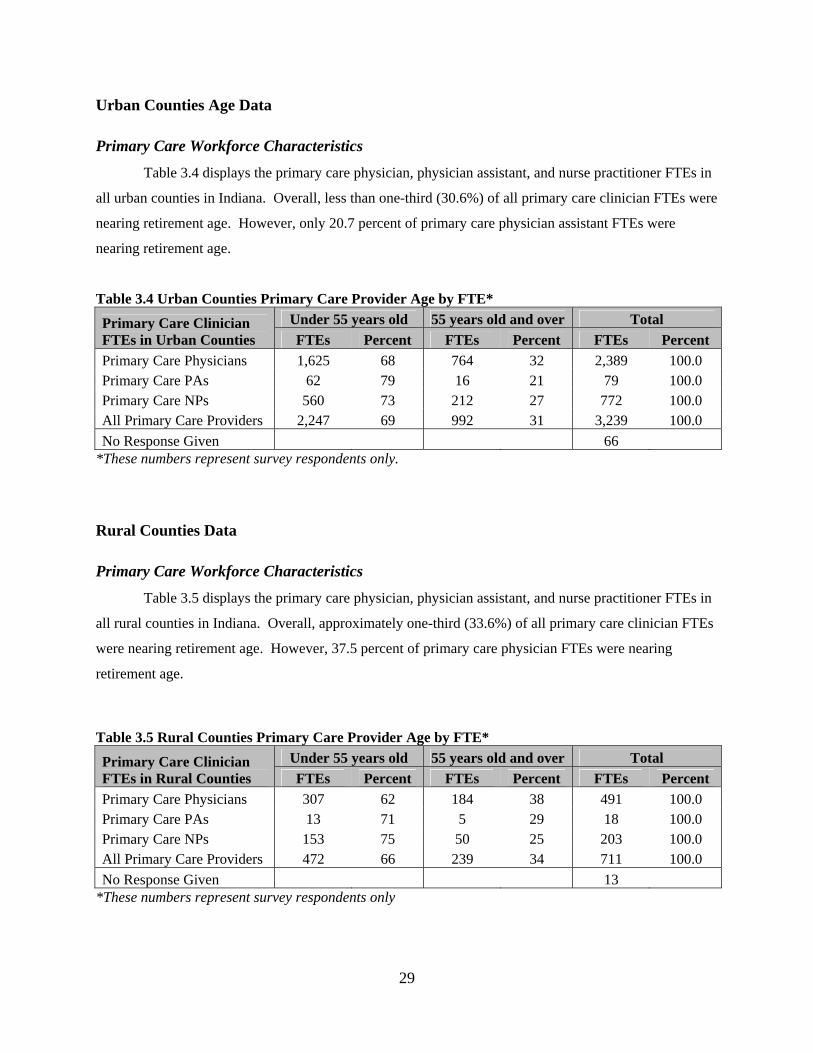
Table 3.4 displays the primary care physician, physician assistant, and nurse practitioner FTEs in
all urban counties in Indiana. Overall, less than one-third (30.6%) of all primary care clinician FTEs were
nearing retirement age. However, only 20.7 percent of primary care physician assistant FTEs were
nearing retirement age.
Table 3.4 Urban Counties Primary Care Provider Age by FTE*
Primary Care Clinician FTEs in Urban Counties
Under 55 years old 55 years old and over Total
FTEs Percent FTEs Percent FTEs Percent
Primary Care Physicians 1,625 68 764 32 2,389 100.0 Primary Care PAs 62 79 16 21 79 100.0 Primary Care NPs 560 73 212 27 772 100.0 All Primary Care Providers 2,247 69 992 31 3,239 100.0
No Response Given 66 *These numbers represent survey respondents only.
Rural Counties Data
Primary Care Workforce Characteristics
Table 3.5 displays the primary care physician, physician assistant, and nurse practitioner FTEs in
all rural counties in Indiana. Overall, approximately one-third (33.6%) of all primary care clinician FTEs
were nearing retirement age. However, 37.5 percent of primary care physician FTEs were nearing
retirement age.
Table 3.5 Rural Counties Primary Care Provider Age by FTE*
Primary Care Clinician FTEs in Rural Counties
Under 55 years old 55 years old and over Total
FTEs Percent FTEs Percent FTEs Percent
Primary Care Physicians 307 62 184 38 491 100.0 Primary Care PAs 13 71 5 29 18 100.0 Primary Care NPs 153 75 50 25 203 100.0 All Primary Care Providers 472 66 239 34 711 100.0
No Response Given 13 *These numbers represent survey respondents only

30
HPSA and MUA Designations in Indiana
Health Resources and Service Administration (HRSA) designated Health Professional Shortage
Areas (HPSAs) and Medically Underserved Areas (MUAs) are entitled to federal programs that help
address the lack of adequate medical service in the area (or population). HPSA and MUA designations
are meant to identify areas where the lack of adequate care exists so that programs can be initiated to
increase the number of health professionals in the area through monetary incentives and training
programs.
Three types of HPSAs exist: primary medical care, dental health care, and mental health care.
Because the focus of this report is primary care, only the primary care HPSAs will be reviewed. Primary
care HPSAs may encompass a geographic region, a specific population, or a specific facility. It should be
noted that the HRSA primary care shortage criteria use physician data only, not the range of clinicians
used in this report. A geographic region may be considered a HPSA if there is a ratio greater than or equal
to 3,500:1 (population to primary care physician FTE) or if there is a ratio greater than or equal to 3,000:1
(population to primary care physician FTE) and the population exhibits an unusually high need for
primary care services. Additionally, it must be shown that contiguous areas cannot compensate for the
lack of adequate medical care. A population can be considered for HPSA designation if the following
criteria are met: (1) the population resides in “an area that is rational for the delivery of primary medical
care services;” (2) barriers to access exist that prevent the group from seeing local primary care clinicians;
and (3) the population resides in an area with a ratio greater than or equal to 3,000:1 (population to
primary care physician FTE). Specific facilities may also be designated as HPSAs. These facilities must
be “[f]ederal and/or [s]tate correctional institutions or public and/or non-profit medical facilities.” Further
guidelines exist for these facilities, but these are not the focus of this report.6
MUA designation is based on the Index of Medical Underservice (IMU). The IMU is calculated
on several factors and ranges from 0 (completely underserved) to 100 (best served). An IMU less than or
equal to 62.0 qualifies an area for MUA designation. There are four factors which are assigned a
weighted score to determine an area’s IMU: (1) percentage of population below the poverty level; (2)
percentage of population age 65 and older; (3) infant mortality rate; and (4) ratio of primary care
physicians per 1,000 population.7
6 Primary Medical Care HPSA Designation Overview. Health Resources and Services Administration. http://bhpr.hrsa.gov/shortage/hpsas/designationcriteria/primarycarehpsaoverview.html 7 Medically Underserved Areas & Populations (MUA/Ps). Health Resources and Services Administration. http://bhpr.hrsa.gov/shortage/muaps/index.html

31
Indiana Primary Care HPSA Designations
Fifty-six (60.9%) of Indiana’s counties contain at least one primary care HPSA. Of these 56
counties, there are 44 counties that are county-wide primary care HPSAs and 12 counties in which a
subset of the county is considered a primary care HPSA. When a HPSA occupies only a small subset of
the county the designation is based on either townships or census tracts within that county. The following
maps compare the ratio of primary care clinician FTEs to population in HPSAs (Map 3.3) and the ratio of
primary care clinician FTEs to population in non-HPSAs (Map 3.4).
Map 3.3 displays the ratio of primary care clinician FTEs per 100,000 population in Indiana
primary care HPSAs. The majority of counties containing primary care HPSAs have less than 53 primary
care clinician FTEs per 100,000 population. Not surprisingly, primary care HPSAs in larger cities such as
Crawfordsville (Montgomery County), Fort Wayne (Allen County), Indianapolis (Marion County), and
South Bend (St. Joseph County) had the highest ratios of primary care clinician FTEs to population.
However, the HPSA in Evansville (Vanderburgh County) did not follow this trend.

32
Map 3.3 Primary Care Clinician FTEs per 100,000 Population in Indiana Primary Care HPSAs

33
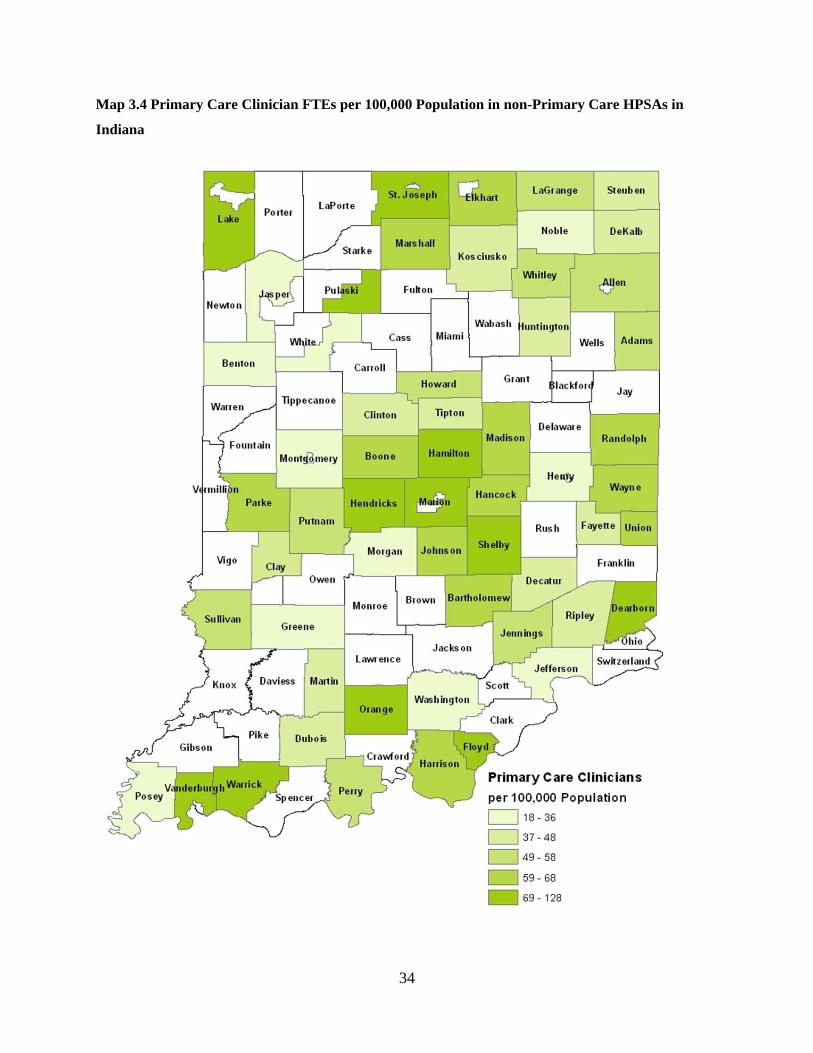
Map 3.4 displays the ratio of primary care clinician FTEs per 100,000 population in non-primary
care HPSAs around Indiana (the inverse of Map 3.3). Generally, more populous counties had the highest
ratios of primary care clinician FTEs to population. Counties that contained smaller primary care HPSAs
located within major cities (such as Allen, Marion, Montgomery, and St. Joseph Counties) were still in
the highest tier of clinician to population ratios with the exception of Allen County.
34
Map 3.4 Primary Care Clinician FTEs per 100,000 Population in non-Primary Care HPSAs in
Indiana

35
Indiana MUA Designations
There are currently 71 counties (77.2%) in Indiana that contain a MUA. Of these 71 counties, 33
contain MUAs that include only a subregion of that county. When a MUA occupies only a small subset
of the county the designation is based on either townships or census tracts within that county. The
following maps compare the ratio of primary care clinician FTEs to population in MUAs (Map 3.5) and
the ratio of primary care clinician FTEs to population in non-MUAs (Map 3.6).
Map 3.5 shows the ratio of primary care clinician FTEs per 100,000 population in Indiana MUAs.
The majority of MUAs had less than 56 primary care clinicians per 100,000 population. There is notable
variation in the geographic location, population, and rurality of MUAs with a high ratio of clinicians to
population. Low ratios of clinicians to population in MUAs located in large cities such as Indianapolis
(Marion County), Evansville (Vanderburgh County), and Fort Wayne (Allen County) were unexpected
since these areas generally display the highest ratios of clinicians to population.

36
Map 3.5 Primary Care Clinician FTEs per 100,000 Population in Indiana MUAs

37
Map 3.6 presents the ratio of primary care clinician FTEs per 100,000 population for areas in
Indiana that are not MUA designated (the inverse of Map 3.5). In general, the most populous counties
had the highest ratio of clinicians to population. Counties containing regions designated as MUAs also
showed high ratios of clinicians to population (such as Lake, Marion, and Wayne Counties). This
indicates that in some cases the primary care clinicians needed in these MUAs could exist in nearby
locations, but barriers such as cost or adequate transportation keep disadvantaged populations from
accessing these clinicians.

38
Map 3.6 Primary Care Clinician FTEs per 100,000 Population in non-MUAs in Indiana

39
Chapter 4: Proportion Nearing Retirement Age and Geographic Distributions
of Primary Care Clinicians in Indiana by AHEC Regions
This chapter presents the statewide proportion nearing retirement age (55 or older) and
geographical distributions of Indiana primary care clinician FTEs by Indiana AHEC region. Clinicians
age 55 and older were considered to be “nearing retirement” and may need to be replaced by new recruits
to the primary care workforce within the next decade. The age data are presented region by region.
Additionally, the geographic distribution of primary care clinicians (by FTEs per 100,000 population) is
presented as regional maps. These data are also presented in tabular format for each region. It should be
noted that the numbers reported in the maps and county tables are weighted estimates of FTEs that are
meant to estimate the actual accessible workforce of primary care clinicians to the communities that they
serve.
East Indiana (EI) Region
Primary Care Workforce Characteristics
Table 4.1 displays the primary care physician, physician assistant, and nurse practitioner FTEs in
counties in the EI region of Indiana. Over one-quarter (28.9%) of all primary care clinician FTEs were
nearing retirement age. The primary care physician workforce had the highest proportion of clinician
FTEs nearing retirement (31.3%) and primary care physician assistants had the lowest proportion
(16.7%), but there were only 6 primary care physician assistant FTEs in the entire region.
Table 4.1 EI Region Primary Care Clinician Age by FTE*
Primary Care Clinician FTEs in EI Region
Under 55 years old 55 years old and over Total
FTEs Percent FTEs Percent FTEs Percent
Primary Care Physicians 120 69 55 31 175 100.0 Primary Care PAs 5 83 1 17 6 100.0 Primary Care NPs 46 77 14 23 60 100.0 All Primary Care Providers 171 71 70 29 240 100.0
No Response Given 5 *These numbers represent survey respondents only.

40
Maps of Primary Care Workforce in EI Region
Map 4.1 displays combined FTEs for primary care physician, physician assistant and nurse
practitioners in the EI region. The EI region consists of Bartholomew, Dearborn, Decatur, Fayette,
Franklin, Henry, Jefferson, Jennings, Ohio, Ripley, Rush, Switzerland, Union and Wayne Counties, out of
which only Dearborn, Franklin and Ohio are not rural. The total population of the EI region is 441,920
making it the second least populous AHEC region.
Map 4.1 EI Region Primary Care Clinician FTEs

41
Table 4.2 Primary Care Clinician FTEs per 100,000 Population in EI Counties
County 2010
Population
Primary Care Physician FTEs per 100,000
Population
Primary Care PA FTEs per
100,000 Population
Primary Care NP FTEs per
100,000 Population
Total Primary Care Clinician
FTEs per 100,000
Population
Bartholomew 76,794 36 0 15 51 Dearborn 25,740 32 1 2 35 Decatur 42,223 15 1 2 18 Fayette 24,277 10 1 2 13 Franklin 23,087 4 1 0 6 Henry 49,462 27 0 13 39 Jefferson 32,428 2 1 2 6 Jennings 28,525 8 1 6 16 Ohio 6,128 2 0 1 3 Ripley 28,818 13 0 2 16 Rush 17,392 13 0 6 19 Switzerland 10,613 0 0 1 1 Union 7,516 3 0 2 5 Wayne 68,917 42 0 12 53
All EI Counties 441,920 15 0 5 20

42
Metropolitan Indianapolis/Central Indiana (MICI) Region
Primary Care Workforce Characteristics
Table 4.3 displays the primary care physician, physician assistant, and nurse practitioner FTEs in
counties in the MICI region. Approximately one-quarter (25.7%) of all primary care clinician FTEs were
nearing retirement age. The primary care nurse practitioner workforce had the highest proportion of
clinician FTEs nearing retirement (27.7%) and primary care physician assistants had the lowest
proportion (13.1%).
Table 4.3 MICI Region Primary Care Provider Age by FTE*
Primary Care Clinician FTEs in MICI Region
Under 55 years old 55 years old and over Total
FTEs Percent FTEs Percent FTEs Percent
Primary Care Physicians 749 74 259 26 1,008 100.0 Primary Care PAs 35 87 5 13 40 100.0 Primary Care NPs 202 72 77 28 279 100.0 All Primary Care Providers 986 74 341 26 1,327 100.0
No Response Given 22 *These numbers represent survey respondents only.

43
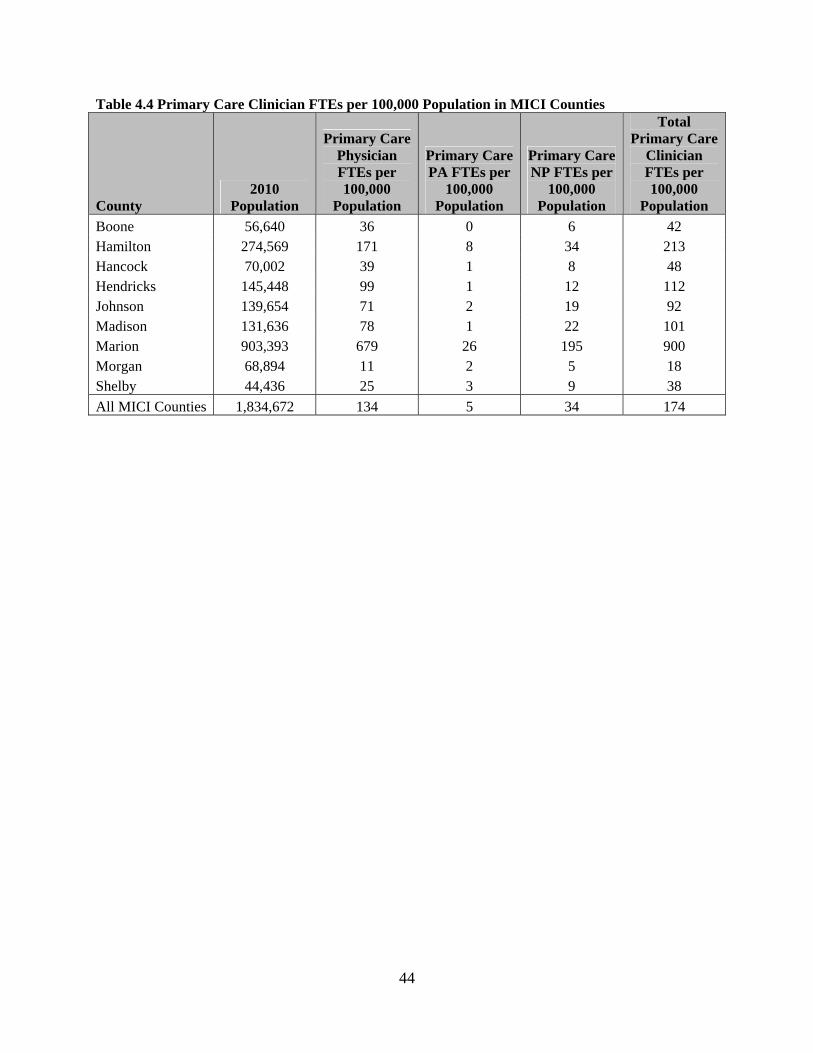
Maps of Primary Care Workforce in MICI Region
Map 4.2 displays combined FTEs for primary care physician, physician assistant and nurse
practitioners in the MICI region. The MICI region consists of Boone, Hamilton, Hancock, Hendricks,
Johnson, Madison, Marion, Morgan and Shelby Counties. None of these counties are considered to be
rural. The total population of the MICI region is 1,834,672 making it the most populous among the
AHEC regions.
Map 4.2 MICI Region Primary Care Clinician FTEs
44
Table 4.4 Primary Care Clinician FTEs per 100,000 Population in MICI Counties
County 2010
Population
Primary Care Physician FTEs per 100,000
Population
Primary Care PA FTEs per
100,000 Population
Primary Care NP FTEs per
100,000 Population
Total Primary Care
Clinician FTEs per 100,000
Population
Boone 56,640 36 0 6 42 Hamilton 274,569 171 8 34 213 Hancock 70,002 39 1 8 48 Hendricks 145,448 99 1 12 112 Johnson 139,654 71 2 19 92 Madison 131,636 78 1 22 101 Marion 903,393 679 26 195 900 Morgan 68,894 11 2 5 18 Shelby 44,436 25 3 9 38
All MICI Counties 1,834,672 134 5 34 174

45
North Central Indiana (NCI) Region
Primary Care Workforce Characteristics
Table 4.5 displays the primary care physician, physician assistant, and nurse practitioner FTEs in
counties in the NCI region. The primary care physician assistant workforce had the highest proportion of
clinician FTEs nearing retirement (72.7%) and primary care nurse practitioners had the lowest proportion
(30.9%). However, there were only 5.5 primary care physician assistant FTEs in the entire region.
Table 4.5 NCI Region Primary Care Clinician Age by FTE*
Primary Care Clinician FTEs in NCI Region
Under 55 years old 55 years old and over Total
FTEs Percent FTEs Percent FTEs Percent
Primary Care Physicians 68 60 45 40 113 100.0 Primary Care PAs 2 27 4 73 6 100.0 Primary Care NPs 54 69 24 31 79 100.0 All Primary Care Providers 123 63 73 37 197 100.0
No Response Given 5 *These numbers represent survey respondents only.

46
Maps of Primary Care Workforce in NCI Region
Map 4.3 displays combined FTEs for primary care physician, physician assistant and nurse
practitioners in the NCI region. The NCI region consists of Benton, Carroll, Cass, Clinton, Fulton,
Howard, Miami, Pulaski, Tipton, Tippecanoe, and White Counties, out of which Benton, Cass, Clinton,
Fulton, Miami, Pulaski, and White are considered to rural. The total population of the NCI region is
468,451 making it the fifth most populous among the AHEC regions.
Map 4.3 NCI Region Primary Care Clinician FTEs

47
Table 4.6 Primary Care Clinician FTEs per 100,000 Population in NCI Counties
County 2010
Population
Primary Care Physician FTEs per 100,000
Population
Primary Care PA FTEs per
100,000 Population
Primary Care NP FTEs per
100,000 Population
Total Primary Care
Clinician FTEs per 100,000
Population
Benton 8,854 1 0 0 1 Carroll 20,155 1 1 4 6 Cass 38,966 14 0 12 25 Clinton 33,224 13 0 3 16 Fulton 20,836 8 0 3 11 Howard 82,752 27 5 14 46 Miami 36,903 17 0 7 23 Pulaski 13,402 7 0 5 12 Tippecanoe 172,780 39 0 37 76 Tipton 15,936 7 0 0 7 White 24,643 2 0 3 5
All NCI Counties 468,451 12 1 8 21
48
Northeast Indiana (NEI) Region
Primary Care Workforce Characteristics
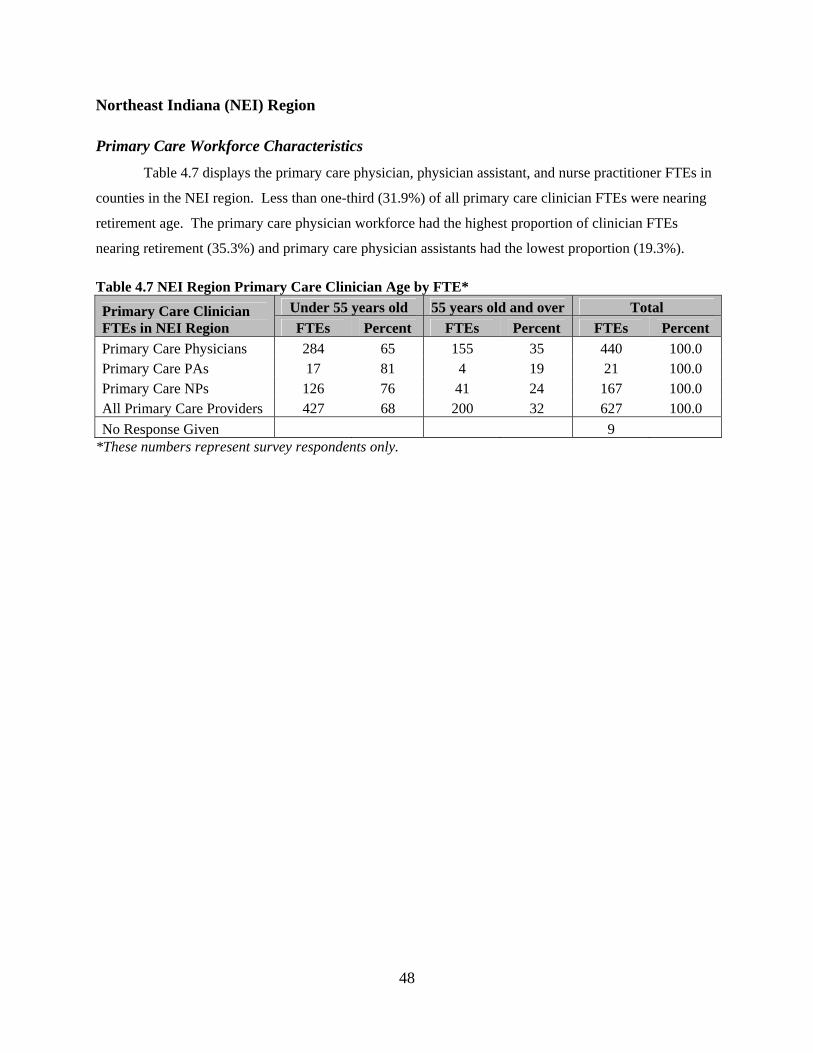
Table 4.7 displays the primary care physician, physician assistant, and nurse practitioner FTEs in
counties in the NEI region. Less than one-third (31.9%) of all primary care clinician FTEs were nearing
retirement age. The primary care physician workforce had the highest proportion of clinician FTEs
nearing retirement (35.3%) and primary care physician assistants had the lowest proportion (19.3%).
Table 4.7 NEI Region Primary Care Clinician Age by FTE*
Primary Care Clinician FTEs in NEI Region
Under 55 years old 55 years old and over Total
FTEs Percent FTEs Percent FTEs Percent
Primary Care Physicians 284 65 155 35 440 100.0 Primary Care PAs 17 81 4 19 21 100.0 Primary Care NPs 126 76 41 24 167 100.0 All Primary Care Providers 427 68 200 32 627 100.0
No Response Given 9 *These numbers represent survey respondents only.

49
Maps of Primary Care Workforce in NEI Region
Map 4.4 displays the combined FTEs for primary care physicians, physician assistants, and nurse
practitioners in the NEI region. The NEI region includes Adams, Allen, Blackford, DeKalb, Delaware,
Elkhart, Grant, Huntington, Jay, Kosciusko, LaGrange, Noble, Randolph, Steuben, Wabash, Wells, and
Whitley Counties. Only Allen, Delaware, Elkhart, Wells, and Whitley Counties are not considered rural.
The total population of the NEI region is 1,212,391making it the second most populous AHEC region in
Indiana.
Map 4.4 NEI Region Primary Care Clinician FTEs

50
Table 4.8 Primary Care Clinician FTEs per 100,000 Population in NEI Counties
County 2010
Population
Primary Care
Physician FTEs per 100,000
Population
Primary Care PA FTEs per 100,000
Population
Primary Care NP FTEs per 100,000
Population
Total Primary
Care Clinician FTEs per 100,000
Population
Adams 34,387 11 2 6 19 Allen 355,329 151 8 66 225 Blackford 12,766 8 0 1 9 DeKalb 50,047 15 2 6 23 Delaware 117,671 54 2 21 77 Elkhart 197,559 94 2 28 124 Grant 70,061 44 0 19 62 Huntington 37,124 18 0 0 18 Jay 21,253 5 0 3 8 Kosciusko 77,358 30 2 6 38 Lagrange 37,128 14 1 2 18 Noble 47,536 14 0 5 19 Randolph 26,171 11 0 7 17 Steuben 34,185 13 0 3 16 Wabash 32,888 11 1 3 15 Wells 27,636 21 3 6 30 Whitley 33,292 16 0 2 18
All NEI Counties 1,212,391 31 1 11 43

51
Northwest Indiana (NWI) Region
Primary Care Workforce Characteristics
Table 4.9 displays the primary care physician, physician assistant, and nurse practitioner FTEs in
counties in the NWI region. Over one-third (34.9%) of all primary care clinician FTEs were nearing
retirement age. The primary care physician workforce had the highest proportion of clinician FTEs
nearing retirement (36.9%) and primary care physician assistants had the lowest proportion (21.1%).
However, there were only 4.75 primary care physician assistant FTEs in the entire region.
Table 4.9 NWI Region Primary Care Clinician Age by FTE*
Primary Care Clinician FTEs in NWI Region
Under 55 years old 55 years old and over Total
FTEs Percent FTEs Percent FTEs Percent
Primary Care Physicians 351 63 206 37 557 100.0 Primary Care PAs 4 79 1 21 5 100.0 Primary Care NPs 114 72 44 28 158 100.0 All Primary Care Providers 469 65 251 35 719 100.0
No Response Given 20 *These numbers represent survey respondents only.

52
Maps of Primary Care Workforce in NWI Region
Map 4.5 shows the combined FTEs of primary care physicians, physician assistants, and nurse
practitioners in the NWI region. The NWI region includes Jasper, Lake, LaPorte, Marshall, Newton,
Porter, St. Joseph, and Starke Counties. Marshall and Starke Counties are considered rural. The total
population of the NWI region is 1,156,882 making it the third most populous AHEC region.
Map 4.5 NWI Region Primary Care Clinician FTEs

53
Table 4.10 Primary Care Clinician FTEs per 100,000 Population in NWI Counties
County 2010
Population
Primary Care
Physician FTEs per 100,000
Population
Primary Care PA FTEs per 100,000
Population
Primary Care NP FTEs per 100,000
Population
Total Primary
Care Clinician FTEs per 100,000
Population
Jasper 33,478 11 0 3 14 Lake 496,005 306 2 78 385 LaPorte 111,467 69 0 14 83 Marshall 47,051 23 1 9 33 Newton 14,244 1 1 2 5 Porter 164,343 88 1 23 112 St. Joseph 266,931 170 0 42 213 Starke 23,363 10 0 4 14
All NWI Counties 1,156,882 85 1 22 107
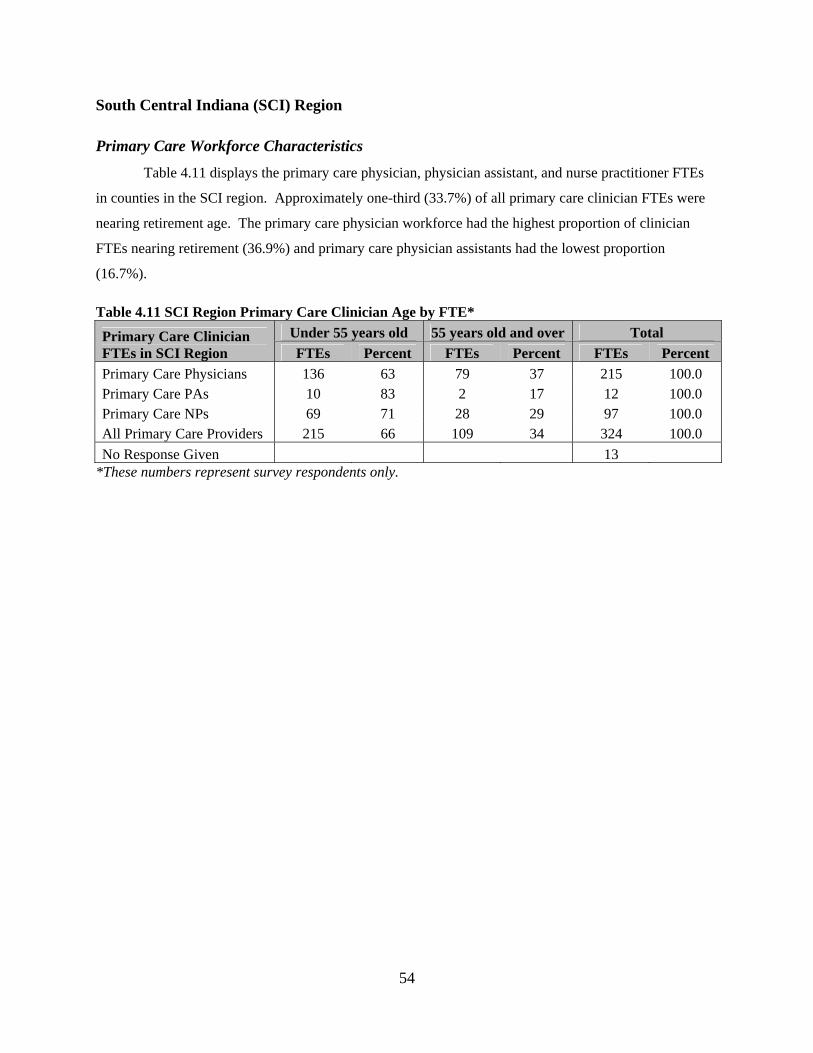
54
South Central Indiana (SCI) Region
Primary Care Workforce Characteristics
Table 4.11 displays the primary care physician, physician assistant, and nurse practitioner FTEs
in counties in the SCI region. Approximately one-third (33.7%) of all primary care clinician FTEs were
nearing retirement age. The primary care physician workforce had the highest proportion of clinician
FTEs nearing retirement (36.9%) and primary care physician assistants had the lowest proportion
(16.7%).
Table 4.11 SCI Region Primary Care Clinician Age by FTE*
Primary Care Clinician FTEs in SCI Region
Under 55 years old 55 years old and over Total
FTEs Percent FTEs Percent FTEs Percent
Primary Care Physicians 136 63 79 37 215 100.0 Primary Care PAs 10 83 2 17 12 100.0 Primary Care NPs 69 71 28 29 97 100.0 All Primary Care Providers 215 66 109 34 324 100.0
No Response Given 13 *These numbers represent survey respondents only.

55
Maps of Primary Care Workforce in SCI Region
Map 4.6 displays the combined FTE data of primary care physicians, physician assistants, and
nurse practitioners in the SCI region. The SCI region consists of Brown, Clark, Crawford, Floyd,
Harrison, Jackson, Lawrence, Martin, Monroe, Orange, Scott, and Washington Counties. Crawford,
Jackson, Lawrence, Martin, Orange, and Scott Counties are considered rural. The SCI region is the fourth
most populous AHEC region with a total population of 559,230.
Map 4.6 SCI Region Primary Care Clinician FTEs

56
Table 4.12 Primary Care Clinician FTEs per 100,000 Population in SCI Counties
County 2010
Population
Primary Care Physician FTEs per 100,000
Population
Primary Care PA FTEs per
100,000 Population
Primary Care NP FTEs per
100,000 Population
Total Primary Care
Clinician FTEs per 100,000
Population
Brown 15,242 3 0 2 5 Clark 110,232 61 2 24 88 Crawford 10,713 1 0 2 3 Floyd 74,578 47 3 9 60 Harrison 39,364 25 0 6 31 Jackson 42,376 29 3 5 37 Lawrence 46,134 14 0 7 21 Martin 10,334 2 0 2 4 Monroe 137,974 50 3 40 93 Orange 19,840 11 0 4 15 Scott 24,181 11 1 4 16 Washington 28,262 8 0 1 9
All SCI Counties 559,230 22 1 9 32

57
Southwest Indiana (SWI) Region
Primary Care Workforce Characteristics
Table 4.13 displays the primary care physician, physician assistant, and nurse practitioner FTEs
in counties in the SWI region. Less than one-third (31.4%) of all primary care clinician FTEs were
nearing retirement age. The primary care physician workforce had the highest proportion of clinician
FTEs nearing retirement (36.5%) and primary care physician assistants had the lowest proportion (0.0%).
However, there were only 2 primary care physician assistant FTEs in the entire region.
Table 4.13 SWI Region Primary Care Clinician Age by FTE*
Primary Care Clinician FTEs in SWI Region
Under 55 years old 55 years old and over Total
FTEs Percent FTEs Percent FTEs Percent
Primary Care Physicians 152 64 88 36 240 100.0 Primary Care PAs 2 100 0 0 2 100.0 Primary Care NPs 72 82 16 18 88 100.0 All Primary Care Providers 226 69 103 31 329 100.0
No Response Given 1 *These numbers represent survey respondents only.

58
Maps of Primary Care Workforce in SWI Region
Map 4.7 shows the combined FTE data of primary care physicians, physician assistants, and
nurse practitioners in the SWI region. The SWI region includes Daviess, Dubois, Gibson, Knox, Perry,
Pike, Posey, Spencer, Vanderburgh, and Warrick Counties, out of which Gibson, Posey, Vanderburgh and
Warrick are the only ones that are not considered rural. The SWI region is the third least populous AHEC
region with a total population of 463,917.
Map 4.7 SWI Region Primary Care Clinician FTEs

59
Table 4.14 Primary Care Clinician FTEs per 100,000 Population in SWI Counties
County 2010
Population
Primary Care
Physician FTEs per 100,000
Population
Primary Care PA FTEs per 100,000
Population
Primary Care NP FTEs per 100,000
Population
Total Primary
Care Clinician FTEs per 100,000
Population
Daviess 31,648 11 0 6 17 Dubois 41,889 18 0 4 21 Gibson 33,503 24 0 7 32 Knox 38,440 32 0 11 43 Perry 19,338 6 0 3 9 Pike 12,845 4 0 1 5 Posey 25,910 7 0 1 8 Spencer 20,952 5 0 3 8 Vanderburgh 179,703 139 2 45 187 Warrick 59,689 41 0 14 56
All SWI Counties 463,917 29 0 10 39
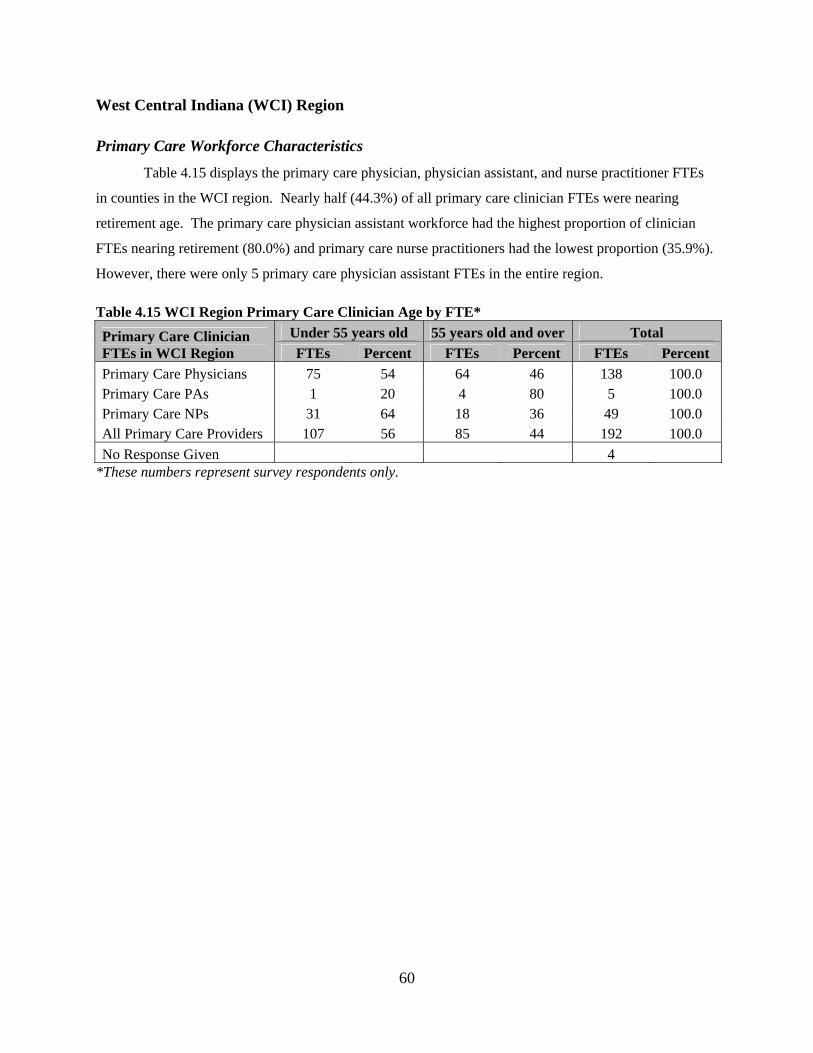
60
West Central Indiana (WCI) Region
Primary Care Workforce Characteristics
Table 4.15 displays the primary care physician, physician assistant, and nurse practitioner FTEs
in counties in the WCI region. Nearly half (44.3%) of all primary care clinician FTEs were nearing
retirement age. The primary care physician assistant workforce had the highest proportion of clinician
FTEs nearing retirement (80.0%) and primary care nurse practitioners had the lowest proportion (35.9%).
However, there were only 5 primary care physician assistant FTEs in the entire region.
Table 4.15 WCI Region Primary Care Clinician Age by FTE*
Primary Care Clinician FTEs in WCI Region
Under 55 years old 55 years old and over Total
FTEs Percent FTEs Percent FTEs Percent
Primary Care Physicians 75 54 64 46 138 100.0 Primary Care PAs 1 20 4 80 5 100.0 Primary Care NPs 31 64 18 36 49 100.0 All Primary Care Providers 107 56 85 44 192 100.0
No Response Given 4 *These numbers represent survey respondents only.

61
Maps of Primary Care Workforce in WCI Region
Map 4.8 displays the combined FTE data of primary care physicians, physician assistants, and
nurse practitioners in the WCI region. The WCI region consists of Clay, Fountain, Greene, Montgomery,
Owen, Parke, Putnam, Sullivan, Vermillion, Vigo, and Warren Counties. Fountain, Montgomery, Parke,
and Warren Counties are considered rural. The WCI region has a total population of 346,339 making it
the least populous AHEC region in Indiana.
Map 4.8 WCI Region Primary Care Clinician FTEs
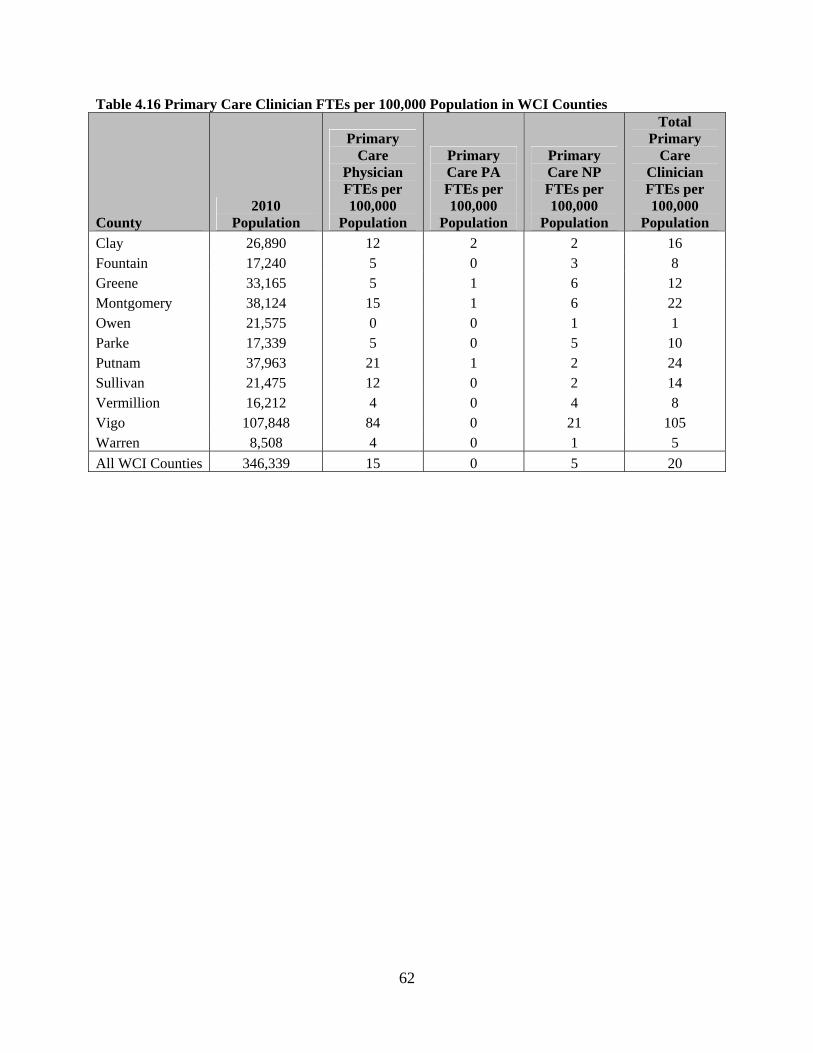
62
Table 4.16 Primary Care Clinician FTEs per 100,000 Population in WCI Counties
County 2010
Population
Primary Care
Physician FTEs per 100,000
Population
Primary Care PA FTEs per 100,000
Population
Primary Care NP FTEs per 100,000
Population
Total Primary
Care Clinician FTEs per 100,000
Population
Clay 26,890 12 2 2 16 Fountain 17,240 5 0 3 8 Greene 33,165 5 1 6 12 Montgomery 38,124 15 1 6 22 Owen 21,575 0 0 1 1 Parke 17,339 5 0 5 10 Putnam 37,963 21 1 2 24 Sullivan 21,475 12 0 2 14 Vermillion 16,212 4 0 4 8 Vigo 107,848 84 0 21 105 Warren 8,508 4 0 1 5
All WCI Counties 346,339 15 0 5 20

63
Chapter 5: Proportion Nearing Retirement Age and Geographic Distributions
of Primary Care Clinicians in Indiana by ISDH Public Health Regions
This chapter presents the statewide proportion nearing retirement age (55 or older) and
geographical distributions of Indiana primary care clinician FTEs by ISDH public health region.
Clinicians age 55 and older were considered to be “nearing retirement” and may need to be replaced by
new recruits to the primary care workforce within the next decade. The age data are presented region by
region. Additionally, the geographic distribution of primary care clinicians (by FTEs per 100,000
population) is presented as regional maps. These data are also presented in tabular format for each
region. It should be noted that the numbers reported in the maps and county tables are weighted estimates
of FTEs that are meant to estimate the actual accessible workforce of primary care clinicians to the
communities that they serve.
ISDH Public Health Region 1
Primary Care Workforce Characteristics
Table 5.1 displays the primary care physician, physician assistant, and nurse practitioner FTEs in
counties in ISDH region 1. Nearly two-fifths (38.4%) of all primary care clinician FTEs were nearing
retirement age. The primary care physician workforce had the highest proportion of clinician FTEs
nearing retirement (40.4%) and primary care physician assistants had the lowest proportion (26.7%).
However, there were only 3.75 primary care physician assistant FTEs in the entire region.
Table 5.1 ISDH Public Health Region 1 Primary Care Clinician Age by FTE*
Primary Care Clinician FTEs in ISDH Region 1
Under 55 years old 55 years old and over Total
FTEs Percent FTEs Percent FTEs Percent
Primary Care Physicians 232 60 158 40 390 100.0 Primary Care PAs 3 73 1 27 4 100.0 Primary Care NPs 74 69 34 31 108 100.0 All Primary Care Providers 309 62 193 38 502 100.0
No Response Given 13 *These numbers represent survey respondents only.

64
Maps of Primary Care Workforce in Public Health Region 1
Map 5.1 displays the combined FTE data for primary care physicians, physician assistants, and
nurse practitioners in ISDH public health region 1. Region 1 consists of Jasper, Lake, LaPorte, Newton,
and Porter Counties, none of which are considered rural. The total regional population is 819,537 making
it the second most populous ISDH region in Indiana.
Map 5.1 ISDH Region 1 Primary Care Clinician FTEs
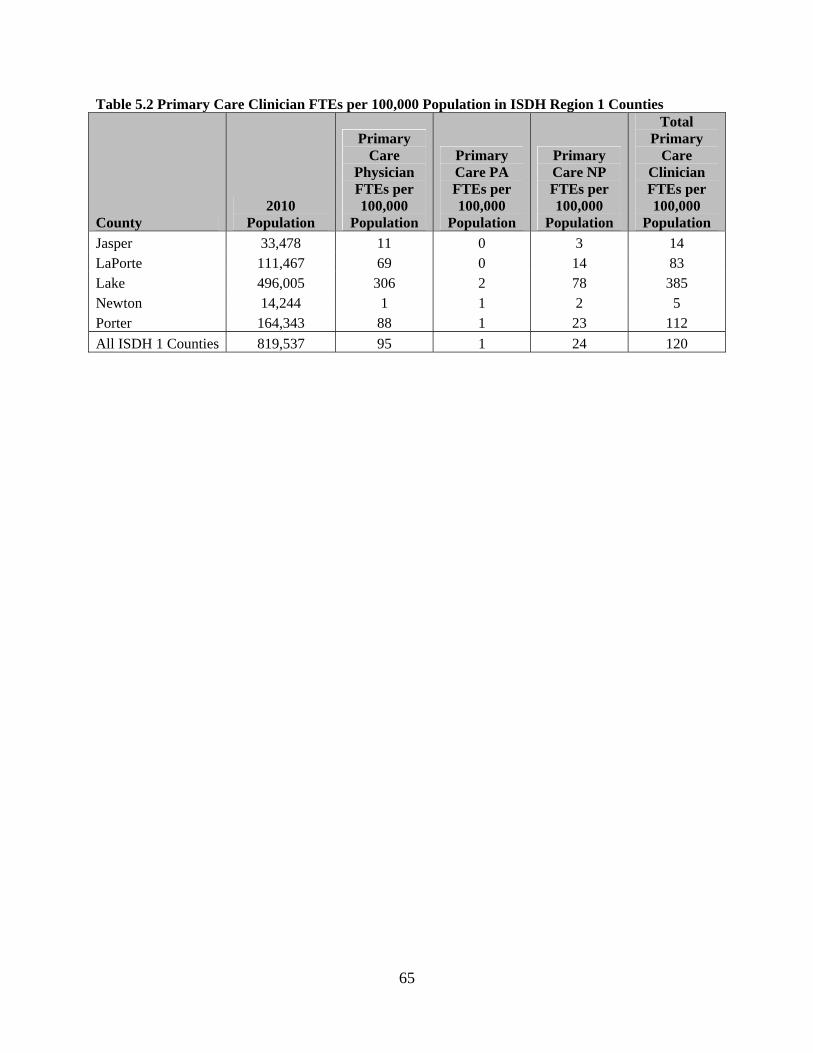
65
Table 5.2 Primary Care Clinician FTEs per 100,000 Population in ISDH Region 1 Counties
County 2010
Population
Primary Care
Physician FTEs per 100,000
Population
Primary Care PA FTEs per 100,000
Population
Primary Care NP FTEs per 100,000
Population
Total Primary
Care Clinician FTEs per 100,000
Population
Jasper 33,478 11 0 3 14 LaPorte 111,467 69 0 14 83 Lake 496,005 306 2 78 385 Newton 14,244 1 1 2 5 Porter 164,343 88 1 23 112
All ISDH 1 Counties 819,537 95 1 24 120

66
ISDH Public Health Region 2
Primary Care Workforce Characteristics
Table 5.3 displays the primary care physician, physician assistant, and nurse practitioner FTEs in
counties in ISDH region 2. Less than one-third (29.5%) of all primary care clinician FTEs were nearing
retirement age. The primary care physician workforce had the highest proportion of clinician FTEs
nearing retirement (32.2%) and primary care physician assistants had the lowest proportion (0.0%).
However, there were only 4.5 primary care physician assistant FTEs in the entire region.
Table 5.3 ISDH Public Health Region 2 Primary Care Clinician Age by FTE*
Primary Care Clinician FTEs in ISDH Region 2
Under 55 years old 55 years old and over Total
FTEs Percent FTEs Percent FTEs Percent
Primary Care Physicians 192 68 91 32 283 100.0 Primary Care PAs 5 100 0 0 5 100.0 Primary Care NPs 68 78 20 22 88 100.0 All Primary Care Providers 264 71 111 29 375 100.0
No Response Given 8 *These numbers represent survey respondents only.
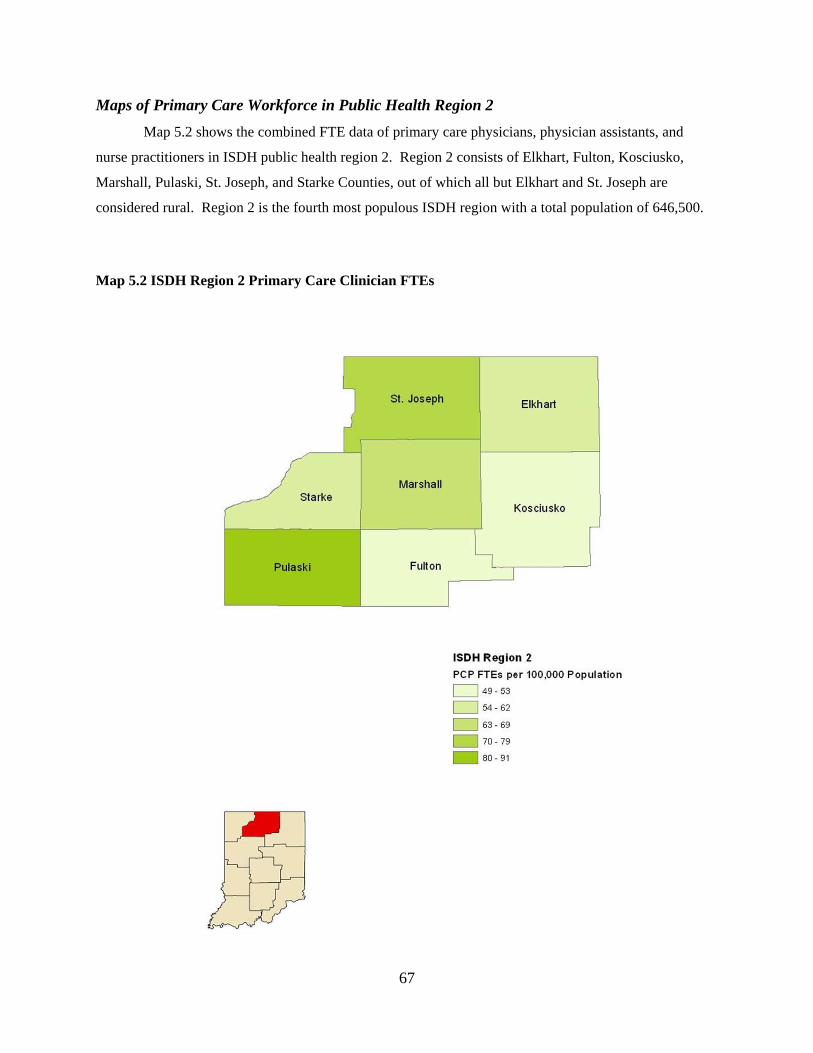
67
Maps of Primary Care Workforce in Public Health Region 2
Map 5.2 shows the combined FTE data of primary care physicians, physician assistants, and
nurse practitioners in ISDH public health region 2. Region 2 consists of Elkhart, Fulton, Kosciusko,
Marshall, Pulaski, St. Joseph, and Starke Counties, out of which all but Elkhart and St. Joseph are
considered rural. Region 2 is the fourth most populous ISDH region with a total population of 646,500.
Map 5.2 ISDH Region 2 Primary Care Clinician FTEs

68
Table 5.4 Primary Care Clinician FTEs per 100,000 Population in ISDH Region 2 Counties
County 2010
Population
Primary Care
Physician FTEs per 100,000
Population
Primary Care PA FTEs per 100,000
Population
Primary Care NP FTEs per 100,000
Population
Total Primary
Care Clinician FTEs per 100,000
Population
Elkhart 197,559 94 2 28 124 Fulton 20,836 8 0 3 11 Kosciusko 77,358 30 2 6 38 Marshall 47,051 23 1 9 33 Pulaski 13,402 7 0 5 12 St. Joseph 266,931 170 0 42 213 Starke 23,363 10 0 4 14
All ISDH 2 Counties 646,500 49 1 14 64

69
ISDH Public Health Region 3
Primary Care Workforce Characteristics
Table 5.5 displays the primary care physician, physician assistant, and nurse practitioner FTEs in
counties in ISDH region 3. Over one-third (34.4%) of all primary care clinician FTEs were nearing
retirement age. The primary care physician workforce had the highest proportion of clinician FTEs
nearing retirement (38.8%) and primary care nurse practitioners had the lowest proportion (24.4%).
Table 5.5 ISDH Public Health Region 3 Primary Care Clinician Age by FTE*
Primary Care Clinician FTEs in ISDH Region 3
Under 55 years old 55 years old and over Total
FTEs Percent FTEs Percent FTEs Percent
Primary Care Physicians 154 61 98 39 251 100.0 Primary Care PAs 11 74 4 26 15 100.0 Primary Care NPs 73 76 24 24 97 100.0 All Primary Care Providers 238 66 125 34 363 100.0
No Response Given 4 *These numbers represent survey respondents only.

70
Maps of Primary Care Workforce in Public Health Region 3
Map 5.3 displays the combined FTE data of primary care physicians, physician assistants, and
nurse practitioners in ISDH public health region 3. Region 3 consists of Adams, Allen, DeKalb,
Huntington, LaGrange, Miami, Noble, Steuben, Wabash, Wells, and Whitley Counties, out of which only
Allen, Wells and Whitley Counties are not considered rural. The region has a total population of 726,455
making it the third most populous ISDH region in Indiana.
Map 5.3 ISDH Region 3 Primary Care Clinician FTEs

71
Table 5.6 Primary Care Clinician FTEs per 100,000 Population in ISDH Region 3 Counties
County 2010
Population
Primary Care
Physician FTEs per 100,000
Population
Primary Care PA FTEs per 100,000
Population
Primary Care NP FTEs per 100,000
Population
Total Primary
Care Clinician FTEs per 100,000
Population
Adams 34,387 11 2 6 19 Allen 355,329 151 8 66 225 DeKalb 50,047 15 2 6 23 Huntington 37,124 18 0 0 18 Lagrange 37,128 14 1 2 18 Miami 36,903 17 0 7 23 Noble 47,536 14 0 5 19 Steuben 34,185 13 0 3 16 Wabash 32,888 11 1 3 15 Wells 27,636 21 3 6 30 Whitley 33,292 16 0 2 18
All ISDH 3 Counties 726,455 27 2 10 39

72
ISDH Public Health Region 4
Primary Care Workforce Characteristics
Table 5.7 displays the primary care physician, physician assistant, and nurse practitioner FTEs in
counties in ISDH region 4. Nearly two-fifths (39.0%) of all primary care clinician FTEs were nearing
retirement age. The primary care physician assistant workforce had the highest proportion of clinician
FTEs nearing retirement (100.0%) and primary care nurse practitioners had the lowest proportion
(30.8%). However, there were only 2 primary care physician assistant FTEs in the entire region.
Table 5.7 ISDH Public Health Region 4 Primary Care Clinician Age by FTE*
Primary Care Clinician FTEs in ISDH Region 4
Under 55 years old 55 years old and over Total
FTEs Percent FTEs Percent FTEs Percent
Primary Care Physicians 43 56 34 44 77 100.0 Primary Care PAs 0 0 2 100 2 100.0 Primary Care NPs 44 69 20 31 63 100.0 All Primary Care Providers 87 61 56 39 142 100.0
No Response Given 3 *These numbers represent survey respondents only.

73
Maps of Primary Care Workforce in Public Health Region 4
Map 5.4 displays the combined FTE data of primary care physicians, physician assistants, and
nurse practitioners in ISDH public health region 4. Region 4 includes Benton, Carroll, Cass, Clinton,
Fountain, Montgomery, Tippecanoe, Warren, and White Counties, out of which only Benton, Carroll and
Tippecanoe are not considered rural. The region has a total population of 362,494 making it the second
least populous ISDH region in Indiana.
Map 5.4 ISDH Region 4 Primary Care Clinician FTEs
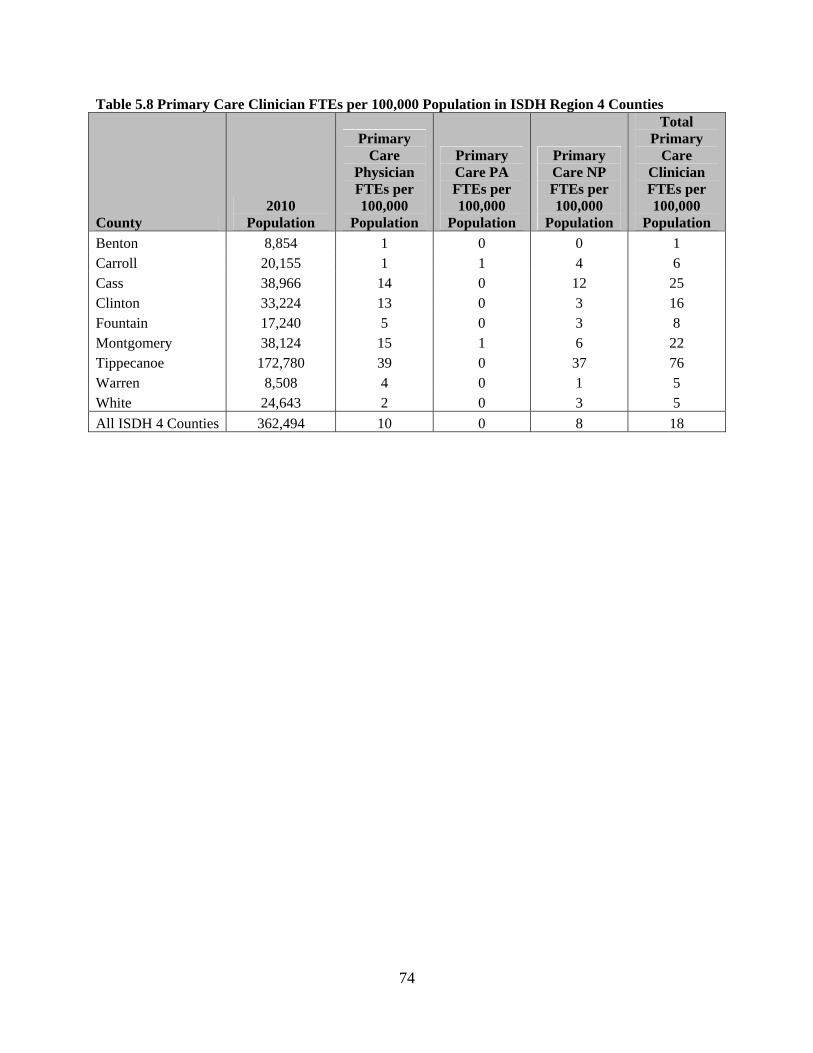
74
Table 5.8 Primary Care Clinician FTEs per 100,000 Population in ISDH Region 4 Counties
County 2010
Population
Primary Care
Physician FTEs per 100,000
Population
Primary Care PA FTEs per 100,000
Population
Primary Care NP FTEs per 100,000
Population
Total Primary
Care Clinician FTEs per 100,000
Population
Benton 8,854 1 0 0 1 Carroll 20,155 1 1 4 6 Cass 38,966 14 0 12 25 Clinton 33,224 13 0 3 16 Fountain 17,240 5 0 3 8 Montgomery 38,124 15 1 6 22 Tippecanoe 172,780 39 0 37 76 Warren 8,508 4 0 1 5 White 24,643 2 0 3 5
All ISDH 4 Counties 362,494 10 0 8 18
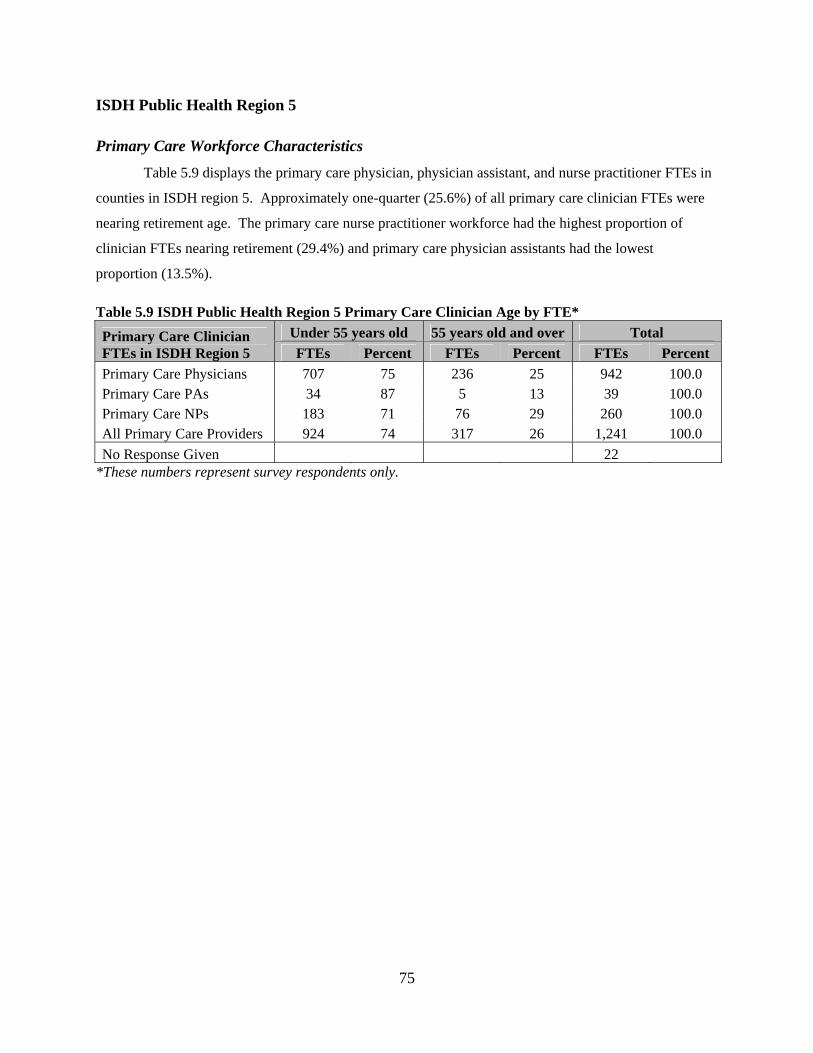
75
ISDH Public Health Region 5
Primary Care Workforce Characteristics
Table 5.9 displays the primary care physician, physician assistant, and nurse practitioner FTEs in
counties in ISDH region 5. Approximately one-quarter (25.6%) of all primary care clinician FTEs were
nearing retirement age. The primary care nurse practitioner workforce had the highest proportion of
clinician FTEs nearing retirement (29.4%) and primary care physician assistants had the lowest
proportion (13.5%).
Table 5.9 ISDH Public Health Region 5 Primary Care Clinician Age by FTE*
Primary Care Clinician FTEs in ISDH Region 5
Under 55 years old 55 years old and over Total
FTEs Percent FTEs Percent FTEs Percent
Primary Care Physicians 707 75 236 25 942 100.0 Primary Care PAs 34 87 5 13 39 100.0 Primary Care NPs 183 71 76 29 260 100.0 All Primary Care Providers 924 74 317 26 1,241 100.0
No Response Given 22 *These numbers represent survey respondents only.
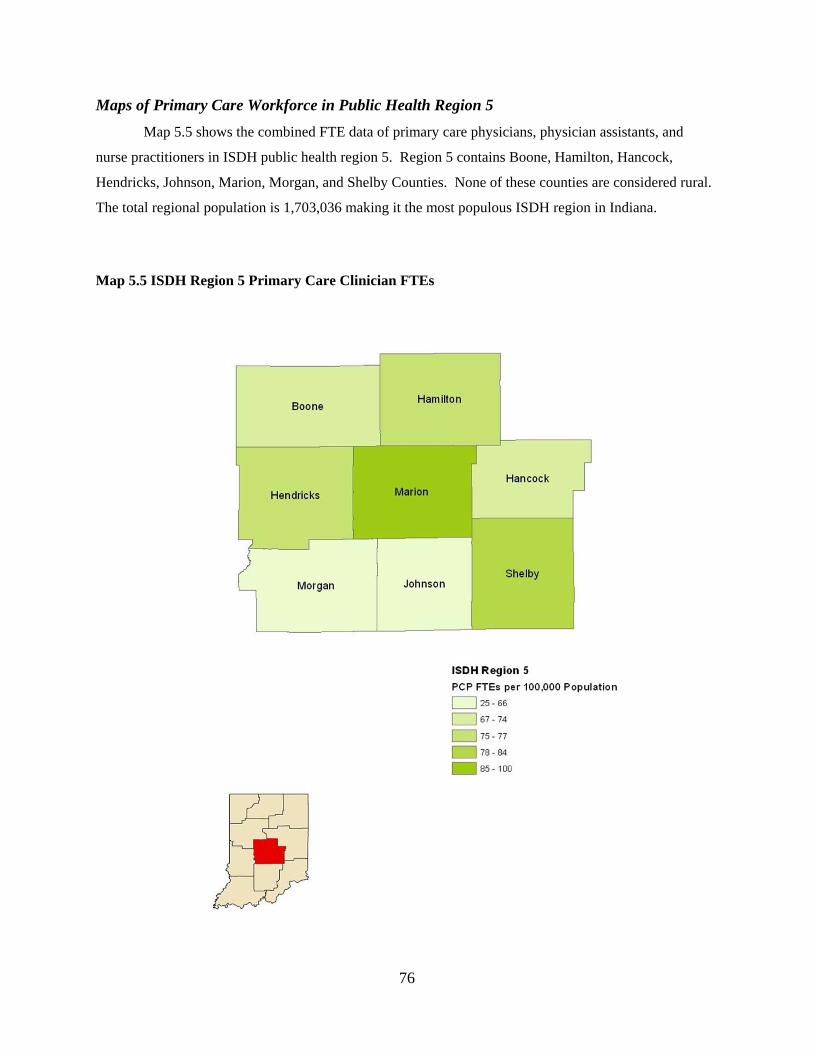
76
Maps of Primary Care Workforce in Public Health Region 5
Map 5.5 shows the combined FTE data of primary care physicians, physician assistants, and
nurse practitioners in ISDH public health region 5. Region 5 contains Boone, Hamilton, Hancock,
Hendricks, Johnson, Marion, Morgan, and Shelby Counties. None of these counties are considered rural.
The total regional population is 1,703,036 making it the most populous ISDH region in Indiana.
Map 5.5 ISDH Region 5 Primary Care Clinician FTEs
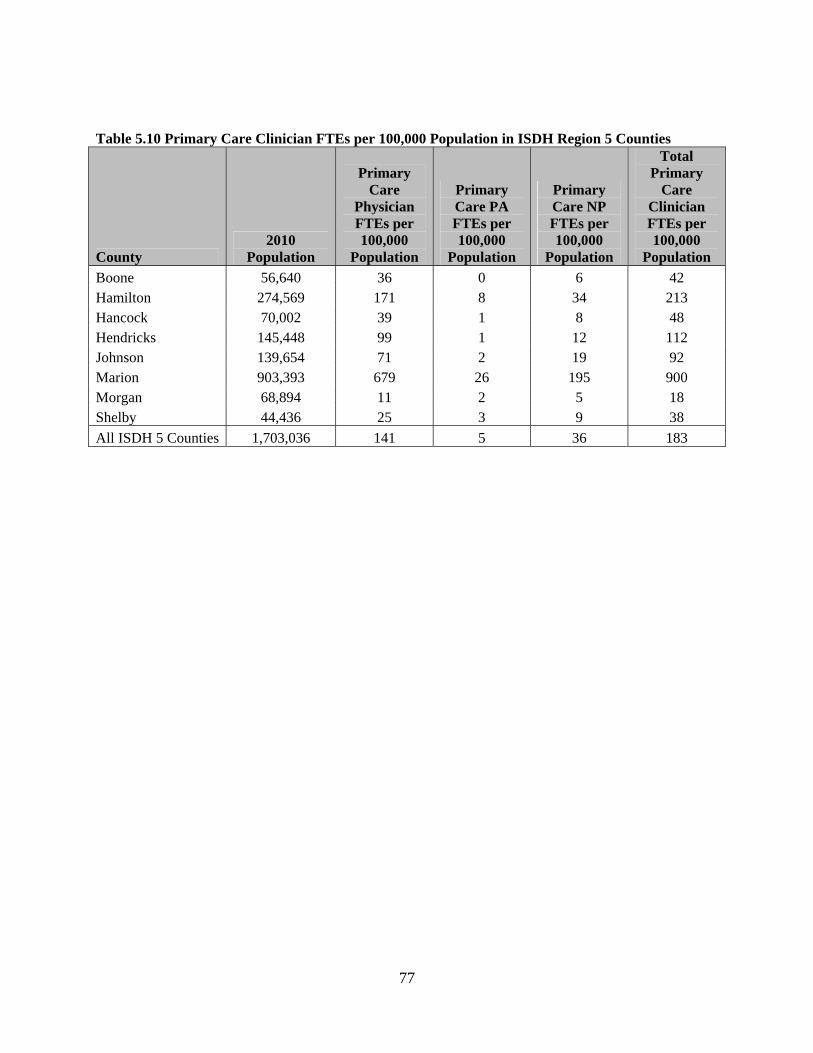
77
Table 5.10 Primary Care Clinician FTEs per 100,000 Population in ISDH Region 5 Counties
County 2010
Population
Primary Care
Physician FTEs per 100,000
Population
Primary Care PA FTEs per 100,000
Population
Primary Care NP FTEs per 100,000
Population
Total Primary
Care Clinician FTEs per 100,000
Population
Boone 56,640 36 0 6 42 Hamilton 274,569 171 8 34 213 Hancock 70,002 39 1 8 48 Hendricks 145,448 99 1 12 112 Johnson 139,654 71 2 19 92 Marion 903,393 679 26 195 900 Morgan 68,894 11 2 5 18 Shelby 44,436 25 3 9 38
All ISDH 5 Counties 1,703,036 141 5 36 183

78
ISDH Public Health Region 6
Primary Care Workforce Characteristics
Table 5.11 displays the primary care physician, physician assistant, and nurse practitioner FTEs
in counties in ISDH region 6. Less than one-third (31.2%) of all primary care clinician FTEs were
nearing retirement age. The primary care physician assistant workforce had the highest proportion of
clinician FTEs nearing retirement (35.3%) and primary care nurse practitioners had the lowest proportion
(25.9%).
Table 5.11 ISDH Public Health Region 6 Primary Care Clinician Age by FTE*
Primary Care Clinician FTEs in ISDH Region 6
Under 55 years old 55 years old and over Total
FTEs Percent FTEs Percent FTEs Percent
Primary Care Physicians 182 67 90 33 272 100.0 Primary Care PAs 6 65 3 35 9 100.0 Primary Care NPs 80 74 28 26 108 100.0 All Primary Care Providers 267 69 121 31 388 100.0
No Response Given 7 *These numbers represent survey respondents only.

79
Maps of Primary Care Workforce in Public Health Region 6
Map 5.6 shows the combined FTE data of primary care physicians, physician assistants, and
nurse practitioners in ISDH public health region 6. Region 6 includes Blackford, Delaware, Fayette,
Grant, Henry, Howard, Jay, Madison, Randolph, Rush, Tipton, Union, and Wayne Counties, out of which
all except Delaware, Howard, Madison, and Tipton are considered rural. The total population of region 6
is 645,810 making it the fifth most populous ISDH region in Indiana.
Map 5.6 ISDH Region 6 Primary Care Clinician FTEs

80
Table 5.12 Primary Care Clinician FTEs per 100,000 Population in ISDH Region 6 Counties
County 2010
Population
Primary Care
Physician FTEs per 100,000
Population
Primary Care PA FTEs per 100,000
Population
Primary Care NP FTEs per 100,000
Population
Total Primary
Care Clinician FTEs per 100,000
Population
Blackford 12,766 8 0 1 9 Delaware 117,671 54 2 21 77 Fayette 24,277 10 1 2 13 Grant 70,061 44 0 19 62 Henry 49,462 27 0 13 39 Howard 82,752 27 5 14 46 Jay 21,253 5 0 3 8 Madison 131,636 78 1 22 101 Randolph 26,171 11 0 7 17 Rush 17,392 13 0 6 19 Tipton 15,936 7 0 0 7 Union 7,516 3 0 2 5 Wayne 68,917 42 0 12 53
All ISDH 6 Counties 645,810 25 1 9 35

81
ISDH Public Health Region 7
Primary Care Workforce Characteristics
Table 5.13 displays the primary care physician, physician assistant, and nurse practitioner FTEs
in counties in ISDH region 7. Over two-fifths (42.7%) of all primary care clinician FTEs were nearing
retirement age. The primary care physician assistant workforce had the highest proportion of clinician
FTEs nearing retirement (75.0%) and primary care nurse practitioners had the lowest proportion (34.6%).
However, there were only 4 primary care physician assistant FTEs in the entire region.
Table 5.13 ISDH Public Health Region 7 Primary Care Clinician Age by FTE*
Primary Care Clinician FTEs in ISDH Region 7
Under 55 years old 55 years old and over Total
FTEs Percent FTEs Percent FTEs Percent
Primary Care Physicians 66 56 53 44 119 100.0 Primary Care PAs 1 25 3 75 4 100.0 Primary Care NPs 26 65 14 35 39 100.0 All Primary Care Providers 93 57 69 43 162 100.0
No Response Given 4 *These numbers represent survey respondents only.

82
Maps of Primary Care Workforce in Public Health Region 7
Map 5.7 shows the combined FTE data of primary care physicians, physician assistants, and
nurse practitioners in ISDH public health region 7. Region 7 consists of Clay, Greene, Owen, Parke,
Putnam, Sullivan, Vermillion, and Vigo Counties. Parke County is the only rural county in the region.
The total population is 282,467 making it the least populous ISDH region in Indiana.
Map 5.7 ISDH Region 7 Primary Care Clinician FTEs

83
Table 5.14 Primary Care Clinician FTEs per 100,000 Population in ISDH Region 7 Counties
County 2010
Population
Primary Care
Physician FTEs per 100,000
Population
Primary Care PA FTEs per 100,000
Population
Primary Care NP FTEs per 100,000
Population
Total Primary
Care Clinician FTEs per 100,000
Population
Clay 26,890 12 2 2 16 Greene 33,165 5 1 6 12 Owen 21,575 0 0 1 1 Parke 17,339 5 0 5 10 Putnam 37,963 21 1 2 24 Sullivan 21,475 12 0 2 14 Vermillion 16,212 4 0 4 8 Vigo 107,848 84 0 21 105
All ISDH 7 Counties 282,467 18 1 5 24
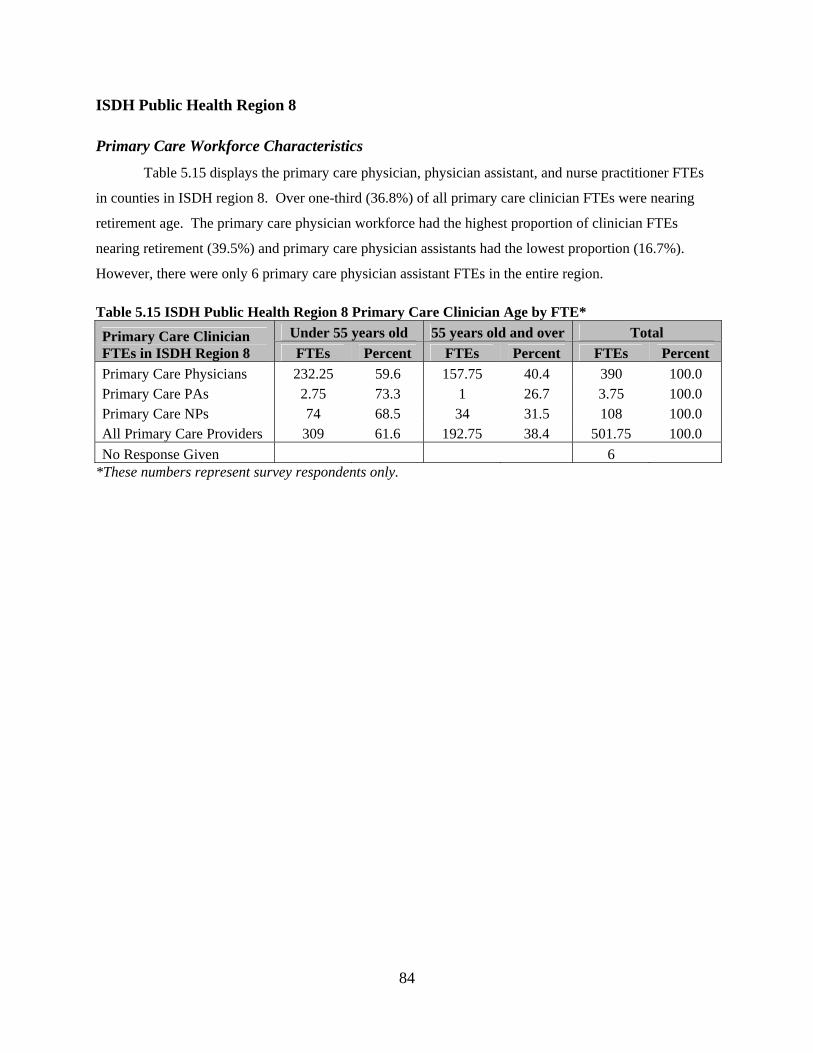
84
ISDH Public Health Region 8
Primary Care Workforce Characteristics
Table 5.15 displays the primary care physician, physician assistant, and nurse practitioner FTEs
in counties in ISDH region 8. Over one-third (36.8%) of all primary care clinician FTEs were nearing
retirement age. The primary care physician workforce had the highest proportion of clinician FTEs
nearing retirement (39.5%) and primary care physician assistants had the lowest proportion (16.7%).
However, there were only 6 primary care physician assistant FTEs in the entire region.
Table 5.15 ISDH Public Health Region 8 Primary Care Clinician Age by FTE*
Primary Care Clinician FTEs in ISDH Region 8
Under 55 years old 55 years old and over Total
FTEs Percent FTEs Percent FTEs Percent
Primary Care Physicians 232.25 59.6 157.75 40.4 390 100.0 Primary Care PAs 2.75 73.3 1 26.7 3.75 100.0 Primary Care NPs 74 68.5 34 31.5 108 100.0 All Primary Care Providers 309 61.6 192.75 38.4 501.75 100.0
No Response Given 6 *These numbers represent survey respondents only.

85
Maps of Primary Care Workforce in Public Health Region 8
Map 5.8 displays combined FTE data of primary care physicians, physician assistants, and nurse
practitioners in ISDH public health region 8. Region 8 includes Bartholomew, Brown, Jackson,
Lawrence, Monroe, Orange, and Washington Counties, out of which Lawrence and Orange Counties are
considered rural. The total population of region 8 is 366,622 making it the third least populous ISDH
region in Indiana.
Map 5.8 ISDH Region 8 Primary Care Clinician FTEs

86
Table 5.16 Primary Care Clinician FTEs per 100,000 Population in ISDH Region 8 Counties
County 2010
Population
Primary Care
Physician FTEs per 100,000
Population
Primary Care PA FTEs per 100,000
Population
Primary Care NP FTEs per 100,000
Population
Total Primary
Care Clinician FTEs per 100,000
Population
Bartholomew 76,794 36 0 15 51 Brown 15,242 3 0 2 5 Jackson 42,376 29 3 5 37 Lawrence 46,134 14 0 7 21 Monroe 137,974 50 3 40 93 Orange 19,840 11 0 4 15 Washington 28,262 8 0 1 9
All ISDH 8 Counties 366,622 22 1 11 33
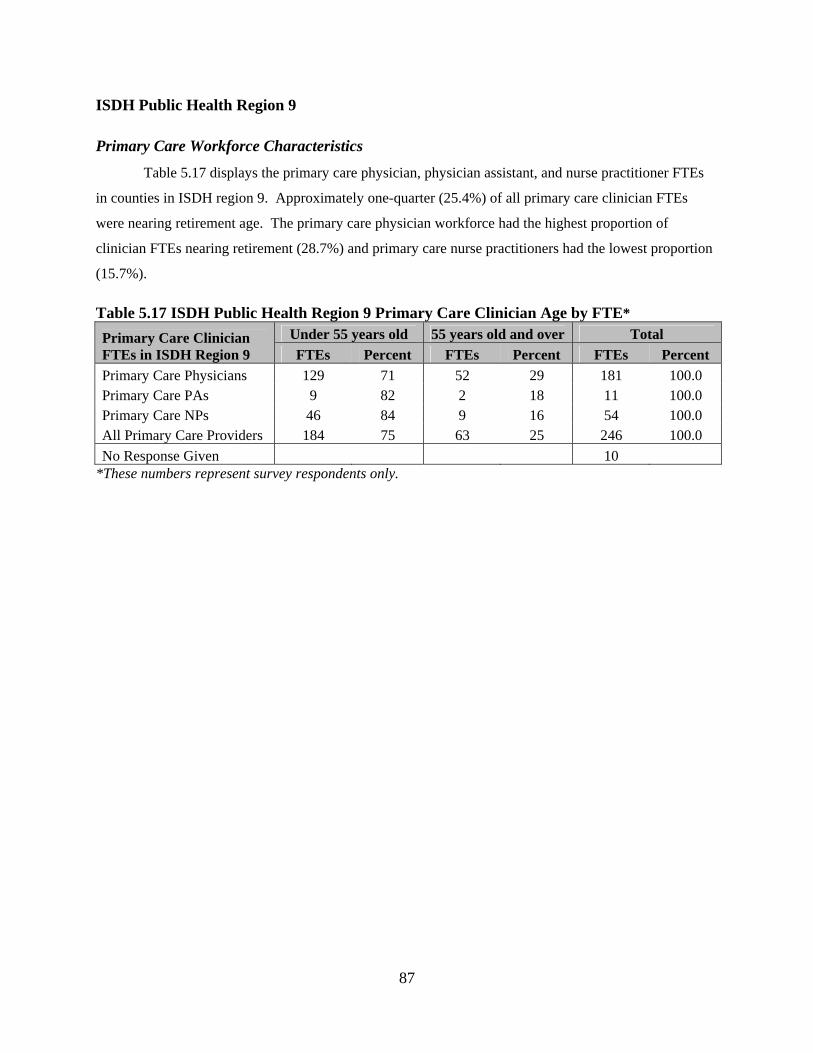
87
ISDH Public Health Region 9
Primary Care Workforce Characteristics
Table 5.17 displays the primary care physician, physician assistant, and nurse practitioner FTEs
in counties in ISDH region 9. Approximately one-quarter (25.4%) of all primary care clinician FTEs
were nearing retirement age. The primary care physician workforce had the highest proportion of
clinician FTEs nearing retirement (28.7%) and primary care nurse practitioners had the lowest proportion
(15.7%).
Table 5.17 ISDH Public Health Region 9 Primary Care Clinician Age by FTE*
Primary Care Clinician FTEs in ISDH Region 9
Under 55 years old 55 years old and over Total
FTEs Percent FTEs Percent FTEs Percent
Primary Care Physicians 129 71 52 29 181 100.0 Primary Care PAs 9 82 2 18 11 100.0 Primary Care NPs 46 84 9 16 54 100.0 All Primary Care Providers 184 75 63 25 246 100.0
No Response Given 10 *These numbers represent survey respondents only.

88
Maps of Primary Care Workforce in Public Health Region 9
Map 5.9 shows the combined FTE data of primary care physicians, physician assistants, and
nurse practitioners in ISDH public health region 9. Region 9 contains Clark, Dearborn, Decatur, Floyd,
Franklin, Harrison, Jefferson, Jennings, Ohio, Ripley, Scott, and Switzerland Counties, out of which
Decatur, Jefferson, Jennings, Ripley, Scott, and Switzerland Counties are considered rural. The total
population of the region is 445,917 making it the fourth least populous ISDH region in Indiana.
Map 5.9 ISDH Region 9 Primary Care Clinician FTEs

89
Table 5.18 Primary Care Clinician FTEs per 100,000 Population in ISDH Region 9 Counties
County 2010
Population
Primary Care
Physician FTEs per 100,000
Population
Primary Care PA FTEs per 100,000
Population
Primary Care NP FTEs per 100,000
Population
Total Primary
Care Clinician FTEs per 100,000
Population
Clark 110,232 61 2 24 88 Dearborn 25,740 32 1 2 35 Decatur 42,223 15 1 2 18 Floyd 74,578 47 3 9 60 Franklin 23,087 4 1 0 6 Harrison 39,364 25 0 6 31 Jefferson 32,428 2 1 2 6 Jennings 28,525 8 1 6 16 Ohio 6,128 2 0 1 3 Ripley 28,818 13 0 2 16 Scott 24,181 11 1 4 16 Switzerland 10,613 0 0 1 1
All ISDH 9 Counties 445,917 19 1 5 25

90
ISDH Public Health Region 10
Primary Care Workforce Characteristics
Table 5.19 displays the primary care physician, physician assistant, and nurse practitioner FTEs
in counties in ISDH region 10. Less than one-third (31.6%) of all primary care clinician FTEs were
nearing retirement age. The primary care physician workforce had the highest proportion of clinician
FTEs nearing retirement (36.8%) and primary care physician assistants had the lowest proportion (0.0%).
However, there were only 2 primary care physician assistant FTEs in the entire region.
Table 5.19 ISDH Public Health Region 10 Primary Care Clinician Age by FTE*
Primary Care Clinician FTEs in ISDH Region 10
Under 55 years old 55 years old and over Total
FTEs Percent FTEs Percent FTEs Percent
Primary Care Physicians 153 63 89 37 243 100.0 Primary Care PAs 2 100 0 0 2 100.0 Primary Care NPs 75 82 17 18 91 100.0 All Primary Care Providers 230 68 106 32 336 100.0
No Response Given 2 *These numbers represent survey respondents only.

91
Maps of Primary Care Workforce in Public Health Region 10
Map 5.10 displays the combined FTE data of primary care physicians, physician assistants, and
nurse practitioners in ISDH public health region 10. Region 10 consists of Crawford, Daviess, Dubois,
Gibson, Knox, Martin, Perry, Pike, Posey, Spencer, Vanderburgh, and Warrick Counties. All of these
counties except Gibson, Posey, Vanderburgh, and Warrick are considered rural. The total population of
Region 10 is the fifth least populous ISDH region in Indiana.
Map 5.10 ISDH Region 10 Primary Care Clinician FTEs

92
Table 5.20 Primary Care Clinician FTEs per 100,000 Population in ISDH Region 10 Counties
County 2010
Population
Primary Care
Physician FTEs per 100,000
Population
Primary Care PA FTEs per 100,000
Population
Primary Care NP FTEs per 100,000
Population
Total Primary
Care Clinician FTEs per 100,000
Population
Crawford 10,713 1 0 2 3 Daviess 31,648 11 0 6 17 Dubois 41,889 18 0 4 21 Gibson 33,503 24 0 7 32 Knox 38,440 32 0 11 43 Martin 10,334 2 0 2 4 Perry 19,338 6 0 3 9 Pike 12,845 4 0 1 5 Posey 25,910 7 0 1 8 Spencer 20,952 5 0 3 8 Vanderburgh 179,703 139 2 45 187 Warrick 59,689 41 0 14 56
All ISDH 10 Counties 484,964 24 0 8 33
93
Chapter 6: Conclusion
This report describes the primary care workforce (physicians, physician assistants, and nurse
practitioners) in Indiana. A total of 3,183 primary care physicians, 103 primary care physician assistants,
and 1,099 primary care nurse practitioners were identified from the respective datasets giving a total of
4,385 primary care clinicians included in the report.
Two primary measures were used to evaluate the status of Indiana’s primary care workforce: the
proportion of primary care clinician FTEs “nearing retirement” (age 55 and older) and the (weighted)
ratio of primary care clinician FTEs per 100,000 population in each county. Analyses of FTE, retirement
age, and ratio of primary care clinician FTEs to population were carried out at the state level (and urban
versus rural counties), by AHEC region, and by ISDH public health region. Across the entire state, most
of the primary care clinicians worked full-time (1.0 FTE), one-third were nearing retirement age, and
there were 51 primary care clinician FTEs per 100,000 population. A greater proportion of primary care
physicians and physician assistants worked full-time than primary care nurse practitioners. A smaller
proportion of primary care physician assistants and nurse practitioners were age 55 or older than primary
care physicians. Comparing urban counties to rural counties, a majority of primary care providers
practiced in urban counties. A smaller proportion of primary care providers working urban counties
reported working full-time than those working in rural counties. Each primary care profession (physician,
physician assistant, and nurse practitioner) had a greater proportion of rural practitioners who worked
full-time than their urban counterparts. However, a greater proportion of rural primary care providers
were age 55 or older than those working in urban counties. This may indicate that rural practitioners are
working longer hours than urban practitioners and are practicing later in life. One explanation for this is
that urban counties had a higher ratio of primary care clinician FTEs per population than rural counties. It
should be noted that the Robert Graham Center recommended at least 100 primary care clinician FTEs
per 100,000 population to adequately serve the needs of the community. However, only 11 counties in
the entire state met this criterion and all of them were urban counties.
Indiana is divided into eight AHEC regions. There was notable variation between regions in
terms of both proportion of primary care clinician FTEs nearing retirement and ratio of primary care
clinician FTEs to population. AHEC regions varied from a low of one-quarter of primary care clinician
FTEs nearing retirement (MICI region) to a high of nearly half of primary care clinician FTEs (WCI
region) compared to the state average of one-third of primary care clinician FTEs nearing retirement. . In
most regions primary care physicians had the highest proportion of FTEs nearing retirement and primary
care physician assistant and nurse practitioner workforces had lower proportions of clinicians nearing
retirement. In some cases, regions had too few primary care physician assistants to produce comparable

94
proportions. These numbers may be indicative of a lack of primary care physician assistants in the state
who could help ease the burden on primary care physicians who are nearly all overextended according to
ratios of primary care clinician FTEs to population. The EI and WCI regions of Indiana had the lowest
ratios of primary care clinician FTEs to population while the MICI region had the highest ratio. Only two
regions (MICI and NWI) met the Robert Graham Center’s recommendation of 100 primary care physician
FTEs per 100,000 population.
The ISDH divided Indiana into 10 public health regions. Like the AHEC regions, there was
considerable variation in the proportion of primary care clinician FTEs nearing retirement and ratio of
primary care clinician FTEs to population. ISDH region 5 had the lowest proportion of primary care
clinician FTEs nearing retirement while ISDH region 7 had the highest proportion. The ratio of primary
care clinician FTEs to 100,000 population was lowest in ISDH region 4 and highest in ISDH region 5.
Quality data about primary care clinicians in Indiana can be used to help policymakers and other
stakeholders make better-informed decisions in addressing health care professions shortages. The purpose
of this report is to provide these needed data. Thus, the findings from this report may be used to identify
primary care clinician shortage areas, develop more effective recruitment and retention strategies, and
plan additional locations for training primary care clinicians within the state. It should be noted that this
report is meant to be descriptive in nature and does not draw any specific policy recommendations.
However, in general, areas with the lowest ratio of primary care clinician FTEs to population should be
the first priorities for increasing the supply of primary care clinicians. A policy brief will be released
following this report that will provide specific policy recommendations based off of the data generated in
this report.

95
Appendix 1-A: 2011 Indiana Physician Re-Licensure Survey Instrument
Your answers to these questions will help the Indiana State Department of Health to respond to emergencies and to identify health professional shortages and geographic shortage areas. The survey is voluntary and will not affect the status of your license.
Thank you very much for your help.
1. What is your current work status in medicine? Consider yourself active in medicine if you are engaged in direct patient care, administration, teaching, or research. Please select only one.
DROP-DOWN LIST
Physician actively seeing patients Full Time
Physician actively seeing patients Part Time
Physician in training (medical resident/fellow)
Physician active in medicine, locum tenens ONLY
Physician active in medicine, not seeing patients
Retired from active medical practice
Inactive in medicine
2. Please type the street address of your principal practice location (the location at which you spend the most practice time) and the secondary practice locations and the number of half days per month you spend at each of those locations in the space provided below. If you are retired or inactive, please put the zip code of your residence.
Location #1: ______________________________________________________
(Name) (Street) (City) (State) (Zip) (# of half days/month)
Location #2: ______________________________________________________

96
(Name) (Street) (City) (State) (Zip) (# of half days/month)
Location #3: ______________________________________________________
(Name) (Street) (City) (State) (Zip) (# of half days/month)
Location #4: ______________________________________________________
(Name) (Street) (City) (State) (Zip) (# of half days/month)
Location #5: ______________________________________________________
(Name) (Street) (City) (State) (Zip) (# of half days/month)
3. What is your major specialty? Please select only one. If you are retired or temporarily inactive, please select the specialty in which you are most experienced.
DROP-DOWN LIST—PLEASE SEE ATTACHED LIST
4. Do you currently see (or accept) Medicaid patients? DROP-DOWN LIST
Yes
No
5. How many hours per week on average do you spend in direct patient care related activities in medicine (including the paperwork associated with providing care)? Please select only one.
DROP-DOWN LIST

97
0
1-9
10-19
20-29
30-39
40-49
50-59
60 or more
6. Do you currently provide prenatal care but do not deliver babies? DROP-DOWN LIST
Yes
No
7. Do you provide both, prenatal care and deliver babies? DROP-DOWN LIST
Yes
No
8. Do you practice with an advanced practice nurse? DROP-DOWN LIST
Yes
No
8a. If yes, how many advanced practice nurses do you practice with?
DROP DOWN LIST
Nurse practitioners _______
Clinical nurse specialist _______

98
Certified nurse midwife ________
9. Do you supervise physician assistants? DROP-DOWN LIST
Yes
No
9a. If yes, how many physician assistants do you supervise? ________
10. Would you be willing to provide services in case of a bio-terrorism event or other public health emergency? If you answer “Yes,” we may contact you using your PLA contact information.
DROP-DOWN LIST
Yes
No
11. Where did you do your residency and/or fellowship training? Please select ALL that apply.
DROP-DOWN LIST
Indiana
Other U.S. state
Canada
Other country (not U.S. or Canada)
12. What is your racial background? DROP-DOWN LIST
White
Black/African American

99
Asian
American Indian/Alaskan Native
Native Hawaiian/Pacific Islander
Multiracial
13. What is your ethnic background? DROP-DOWN LIST
Hispanic or Latino
Not Hispanic or Latino
14. What is your gender? DROP-DOWN LIST
Male
Female

100
2011 SPECIALTY LIST
Specialty Name
Addiction Medicine (ADM)
Adolescent Medicine (AMI)
Aerospace Medicine (AM)
Allergy (A)
Allergy & Immunology (AI)
Allergy & Immunology-Diagnostic Laboratory Immunology (ALI)
Alternative Medicine (ALTM)
Anesthesiology (AN)
Anesthesiology-Critical Care (CCA)
Anesthesiology-Pain Management (APM)
Anesthesiology-Pediatric (PAN)
Cardiology-Cardiovascular Disease (CD)
Cardiology-Cardiac Electrophysiology (ICE)
Cardiology-Interventional Cardiology (IC)
Cardiology-Nuclear Cardiology (NC)
Critical Care Medicine (CCM)
Dermatology (D)
Dermatology-Clinical and Laboratory Dermatological Immunology (DDL)
Dermatology-Dermatological Immunology/Diagnostic and Laboratory Immunology (DLAB)
Dermatology-Dermatopathology (DMP)
Dermatology-Pediatric Dermatology (PDD)
Dermatology-Procedural Dermatology (PRD)
Diabetes (DIA)
Emergency Medicine (EM)
Emergency Medicine-Medical Toxicology (ETX)
101
Emergency Medicine-Pediatric Emergency Medicine (PE)
Emergency Medicine-Sports Medicine (ESM)
Endocrinology, Diabetes and Metabolism (END)
Epidemiology (EP)
Family Practice/Family Medicine (FM)
Family Practice-Adolescent Medicine (AMF)
Family Practice-Geriatric Medicine (FPG)
Family Practice-Sports Medicine (FSM)
Gastroenterology (GE)
General Internal Medicine (IM)
General Practice (GP)
General Preventive Medicine (GPM)
Genetics-Clinical Biochemical Genetics (CBG)
Genetics-Clinical Cytogenetics (CCG)
Genetics-Clinical Genetics (CG)
Genetics-Clinical Molecular Genetics (CMG)
Genetics-Medical Genetics (MG)
Genetics-Molecular Genetic Pathology (MGG)
Geriatrics (GERI)
Gynecological Oncology (GO)
Gynecology (GYN)
Hematology (HEM)
Hematology/Oncology (HO)
Hepatology (HEP)
Hospitalist (HOS)
Immunology (IG)
Infectious Diseases (ID)

102
Internal Medicine-General Internal Medicine (IM)
Internal Medicine-Cardiac Electrophysiology (ICE)
Internal Medicine-Diagnostic Laboratory Immunology (ILI)
Internal Medicine-Geriatrics (IMG)
Internal Medicine-Pediatrics (MPD)
Internal Medicine-Sports Medicine (ISM)
Legal Medicine (LM)
Maternal & Fetal Medicine (MFM)
Medical Informatics
Medical Management (MDM)
Medical Microbiology (MM)
Neonatal-Perinatal Medicine (NPM)
Nephrology (NEP)
Nephrology-Pediatric Nephrology (PN)
Neurology (N)
Neurology-Child Neurology (CHN)
Neurology-Clinical Neurophysiology (CN)
Neurology-Neurodevelopmental Disabilities (NDN)
Neurology-Neurology/Diagnostic Radiology/Neuroradiology (NRN)
Neurology-Neuromuscular Medicine
Neurology-Neuropsychiatry (NUP)
Neurology-Neuroradiology (RNR)
Neurology-Vascular Neurology (VN)
Neuroradiology-Endovascular Surgical (ESN)
Nuclear Medicine (NM)
Nuclear Radiology (NR)
Nutrition (NTR)

103
Obstetrics & Gynecology (OBG)
Obstetrics & Gynecology-Critical Care (OCC)
Obstetrics (OBS)
Occupational Medicine (OM)
Oncology (ON)
Ophthalmology (OPH)
Ophthalmology-Pediatric Ophthalmology (PO)
Orthopedic Surgery (ORS)
Orthopedic Surgery-Foot and Ankle (OFA)
Orthopedic Surgery-Hand Surgery (HSO)
Orthopedic Surgery-Orthopedic Musculoskeletal Oncology (OMO)
Orthopedic Surgery-Orthopedic Adult Reconstructive Surgery (OAR)
Orthopedic Surgery-Pediatric Orthopedic Surgery (OP)
Orthopedic Surgery-Sports Medicine (OSM)
Orthopedic Surgery-Surgery of the Spine (OSS)
Orthopedic Surgery-Trauma (OTR)
Osteopathic Manipulative Medicine (OMM)
Otolaryngology (OTO)
Otolaryngology-Pediatric Otolaryngology (PDO)
Otology-Neurotology (NO)
Pain Medicine (PMD)
Palliative Medicine (PLM)
Pathology-Anatomic Pathology (ATP)
Pathology-Anatomic/Clinical Pathology (PTH)
Pathology-Bloodbanking (BBK)
Pathology-Chemical Pathology (PCH)
Pathology-Clinical Pathology (CLP)

104
Pathology-Cytopathology (PCP)
Pathology-Forensic Pathology (FOP)
Pathology-Hematology (HMP)
Pathology-Medical Microbiology
Pathology-Molecular Genetic Pathology (MGP)
Pathology-Neuropathology (NP)
Pathology-Pediatric Pathology (PP)
Pathology-Selective Pathology (SP)
Pediatrics-General Pediatrics (PD)
Pediatrics-Adolescent Medicine (ADL)
Pediatrics-Critical Care (CCP)
Pediatrics-Developmental Behavioral Pediatrics (DBP)
Pediatrics-Neonatal-Perinatal Medicine (NPM)
Pediatrics-Neurodevelopmental Disabilities (NDP)
Pediatrics-Pediatric Allergy (PDA)
Pediatrics-Pediatric Cardiology (PDC)
Pediatrics-Pediatric Cardiothoracic Surgery (PCS)
Pediatrics-Pediatric Dermatology (PDD)
Pediatrics-Pediatric Diagnostic Laboratory Immunology (PLI)
Pediatrics-Pediatric Emergency Medicine (PEM)
Pediatrics-Pediatric Endocrinology (PDE)
Pediatrics-Pediatric Gastroenterology (PG)
Pediatrics-Pediatric Hematology/Oncology (PHO)
Pediatrics-Pediatric Infectious Diseases (PDI)
Pediatrics-Pediatric Medical Toxicology (PDT)
Pediatrics-Pediatric Otolaryngology (PDO)
Pediatrics-Pediatric Pathology (PP)

105
Pediatrics-Pediatric Pulmonology (PDP)
Pediatrics-Pediatric Radiology (PDR)
Pediatrics-Pediatric Rehabilitation Medicine (RPM)
Pediatrics-Pediatric Rheumatology (PPR)
Pediatrics-Pediatric Sports Medicine (PSM)
Pediatrics-Pediatric Surgery (PDS)
Pharmaceutical Medicine (PHM)
Pharmacology-Clinical Pharmacology (PA)
Phlebology (PHL)
Physical Medicine & Rehabilitation (PM)
Physical Medicine and Rehabilitation-Spinal Cord Injury (SCI)
Physical Medicine and Rehabilitation-Sports Medicine (PMM)
Plastic Surgery (PS)
Plastic Surgery-Facial Plastic Surgery (FPS)
Plastic Surgery-Head & Neck (PSH)
Preventive Medical Toxicology (PTX)
Proctology (PRO)
Psychiatry (P)
Psychiatry-Addiction (ADP)
Psychiatry-Child Psychiatry (CHP)
Psychiatry-Forensic Psychiatry (PFP)
Psychiatry-Geriatric Psychiatry (PYG)
Psychiatry-Pain Medicine (PPN)
Psychiatry-Psychoanalysis (PYA)
Psychiatry-Psychosomatic Medicine (PYM)
Public Health/General Preventive Medicine (PHP)
Pulmonary Critical Care Medicine (PCC)

106
Pulmonary Disease (PUD)
Radiation Oncology (RO)
Radiology (R)
Radiology-Abdominal Radiology (AR)
Radiology-Cardiothoracic Radiology (CTR)
Radiology-Diagnostic Radiology (DR)
Radiology-Musculoskeletal Radiology(MSR)
Radiology-Neuroradiology (RNR)
Radiology-Neuroradiology-Endovascular Surgical (ESN)
Radiology-Nuclear Radiology (NR)
Radiology-Pediatric Radiology (PDR)
Radiology-Radiological Physics (RP)
Radiology-Vascular & Interventional Radiology (VIR)
Reproductive Endocrinology (REN)
Rheumatology (RHU)
Sclerotherapeutic Pain Management (SPMO)
Sleep Medicine (SME)
Spinal Cord Injury Medicine (SCI)
Surgery-Abdominal (AS)
Surgery-Colon & Rectal (CRS)
Surgery-Cosmetic (CS)
Surgery-Craniofacial Surgery (CFS)
Surgery-Critical Care (CCS)
Surgery-Dermatologic Surgery (DS)
Surgery-General Surgery (GS)
Surgery-Hand Surgery (HS)
Surgery-Head & Neck Surgery (HNS)

107
Surgery-Neurological Surgery (NS)
Surgery-Neuroradiology-Endovascular Surgical (ESN)
Surgery-Oral And Maxillofacial Surgery (OMF)
Surgery-Pediatric Cardiothoracic Surgery (PCS)
Surgery-Pediatric Neurological Surgery (NSP)
Surgery-Pediatric Orthopedic Surgery (OP)
Surgery-Pediatric Surgery (PDS)
Surgery-Plastic Surgery (PS)
Surgery-Surgical Oncology (SO)
Surgery-Thoracic Surgery (TS)
Surgery-Transplant Surgery (TTS)
Surgery-Traumatic Surgery (TRS)
Surgery-Urological Surgery (U)
Surgery-Vascular Surgery (VS)
Undersea Medicine and Hyperbaric Medicine (UM)
Undersea and Hyperbaric Medicine-Emergency Medicine (UME)
Urgent Care Medicine (UCM)
Urology (U)
Urology-Pediatric Urology (UP)
Vascular Medicine (VM)
Vascular Neurology (VN)
Other Specialty (OS)
108
Appendix 1-B: 2010 Indiana Physician Assistant Re-Licensure Survey
Instrument
Your answers to these questions will help the Indiana State Department of Health to respond to emergencies and to identify health professional shortages and geographic shortage areas. The survey is voluntary and will not affect the status of your license or your renewal.
Thank you very much for your help.
1. What is your current work status as physician assistant (PA)? Please choose only one.
DROP-DOWN LIST
Actively working as a PA (patient care activities, teaching, administration, or research)
Retired as a PA
Temporarily inactive as a PA
2. In which activity do you spend most of your professional time? Please choose only one.
DROP-DOWN LIST
Direct patient care/patient care activities
Administration
Physician assistant education
Research
Other
3a. What is the major specialty of your primary supervising physician at your principal PA position (the position in which you spend the most time)? Please choose only one. If you are not actively working as a PA, please skip to Question 7.
DROP-DOWN LIST
Addiction Medicine (ADM)
109
Adolescent Medicine (AMI)
Aerospace Medicine (AM)
Allergy (A)
Allergy & Immunology (AI)
Allergy & Immunology-Diagnostic Laboratory Immunology (ALI)
Alternative Medicine (ALTM)
Anesthesiology (AN)
Anesthesiology-Critical Care (CCA)
Anesthesiology-Pain Management (APM)
Anesthesiology-Pediatric (PAN)
Cardiology-Cardiovascular Disease (CD)
Cardiology-Cardiac Electrophysiology (ICE)
Cardiology-Interventional Cardiology (IC)
Cardiology-Nuclear Cardiology (NC)
Critical Care Medicine (CCM)
Dermatology (D)
Dermatology-Clinical and Laboratory Dermatological Immunology (DDL)
Dermatology-Dermatological Immunology/Diagnostic and Laboratory Immunology (DLAB)
Dermatology-Dermatopathology (DMP)
Dermatology-Pediatric Dermatology (PDD)
Dermatology-Procedural Dermatology (PRD)
Diabetes (DIA)
Emergency Medicine (EM)
Emergency Medicine-Medical Toxicology (ETX)
Emergency Medicine-Pediatric Emergency Medicine (PE)
Emergency Medicine-Sports Medicine (ESM)

110
Endocrinology, Diabetes and Metabolism (END)
Epidemiology (EP)
Family Practice/Family Medicine (FM)
Family Practice-Adolescent Medicine (AMF)
Family Practice-Geriatric Medicine (FPG)
Family Practice-Sports Medicine (FSM)
Gastroenterology (GE)
General Internal Medicine (IM)
General Practice (GP)
General Preventive Medicine (GPM)
Genetics-Clinical Biochemical Genetics (CBG)
Genetics-Clinical Cytogenetics (CCG)
Genetics-Clinical Genetics (CG)
Genetics-Clinical Molecular Genetics (CMG)
Genetics-Medical Genetics (MG)
Genetics-Molecular Genetic Pathology (MGG)
Geriatrics (GERI)
Gynecological Oncology (GO)
Gynecology (GYN)
Hematology (HEM)
Hematology/Oncology (HO)
Hepatology (HEP)
Hospitalist (HOS)
Immunology (IG)
Infectious Diseases (ID)
Internal Medicine-General Internal Medicine (IM)
Internal Medicine-Cardiac Electrophysiology (ICE)

111
Internal Medicine-Diagnostic Laboratory Immunology (ILI)
Internal Medicine-Geriatrics (IMG)
Internal Medicine-Pediatrics (MPD)
Internal Medicine-Sports Medicine (ISM)
Legal Medicine (LM)
Maternal & Fetal Medicine (MFM)
Medical Informatics
Medical Management (MDM)
Medical Microbiology (MM)
Neonatal-Perinatal Medicine (NPM)
Nephrology (NEP)
Nephrology-Pediatric Nephrology (PN)
Neurology (N)
Neurology-Child Neurology (CHN)
Neurology-Clinical Neurophysiology (CN)
Neurology-Neurodevelopmental Disabilities (NDN)
Neurology-Neurology/Diagnostic Radiology/Neuroradiology (NRN)
Neurology-Neuromuscular Medicine
Neurology-Neuropsychiatry (NUP)
Neurology-Neuroradiology (RNR)
Neurology-Vascular Neurology (VN)
Neuroradiology-Endovascular Surgical (ESN)
Nuclear Medicine (NM)
Nuclear Radiology (NR)
Nutrition (NTR)
Obstetrics & Gynecology (OBG)
Obstetrics & Gynecology-Critical Care (OCC)

112
Obstetrics (OBS)
Occupational Medicine (OM)
Oncology (ON)
Ophthalmology (OPH)
Ophthalmology-Pediatric Ophthalmology (PO)
Orthopedic Surgery (ORS)
Orthopedic Surgery-Foot and Ankle (OFA)
Orthopedic Surgery-Hand Surgery (HSO)
Orthopedic Surgery-Orthopedic Musculoskeletal Oncology (OMO)
Orthopedic Surgery-Orthopedic Adult Reconstructive Surgery (OAR)
Orthopedic Surgery-Pediatric Orthopedic Surgery (OP)
Orthopedic Surgery-Sports Medicine (OSM)
Orthopedic Surgery-Surgery of the Spine (OSS)
Orthopedic Surgery-Trauma (OTR)
Osteopathic Manipulative Medicine (OMM)
Otolaryngology (OTO)
Otolaryngology-Pediatric Otolaryngology (PDO)
Otology-Neurotology (NO)
Pain Medicine (PMD)
Palliative Medicine (PLM)
Pathology-Anatomic Pathology (ATP)
Pathology-Anatomic/Clinical Pathology (PTH)
Pathology-Bloodbanking (BBK)
Pathology-Chemical Pathology (PCH)
Pathology-Clinical Pathology (CLP)
Pathology-Cytopathology (PCP)
Pathology-Forensic Pathology (FOP)

113
Pathology-Hematology (HMP)
Pathology-Medical Microbiology
Pathology-Molecular Genetic Pathology (MGP)
Pathology-Neuropathology (NP)
Pathology-Pediatric Pathology (PP)
Pathology-Selective Pathology (SP)
Pediatrics-General Pediatrics (PD)
Pediatrics-Adolescent Medicine (ADL)
Pediatrics-Critical Care (CCP)
Pediatrics-Developmental Behavioral Pediatrics (DBP)
Pediatrics-Neonatal-Perinatal Medicine (NPM)
Pediatrics-Neurodevelopmental Disabilities (NDP)
Pediatrics-Pediatric Allergy (PDA)
Pediatrics-Pediatric Cardiology (PDC)
Pediatrics-Pediatric Cardiothoracic Surgery (PCS)
Pediatrics-Pediatric Dermatology (PDD)
Pediatrics-Pediatric Diagnostic Laboratory Immunology (PLI)
Pediatrics-Pediatric Emergency Medicine (PEM)
Pediatrics-Pediatric Endocrinology (PDE)
Pediatrics-Pediatric Gastroenterology (PG)
Pediatrics-Pediatric Hematology/Oncology (PHO)
Pediatrics-Pediatric Infectious Diseases (PDI)
Pediatrics-Pediatric Medical Toxicology (PDT)
Pediatrics-Pediatric Otolaryngology (PDO)
Pediatrics-Pediatric Pathology (PP)
Pediatrics-Pediatric Pulmonology (PDP)
Pediatrics-Pediatric Radiology (PDR)

114
Pediatrics-Pediatric Rehabilitation Medicine (RPM)
Pediatrics-Pediatric Rheumatology (PPR)
Pediatrics-Pediatric Sports Medicine (PSM)
Pediatrics-Pediatric Surgery (PDS)
Pharmaceutical Medicine (PHM)
Pharmacology-Clinical Pharmacology (PA)
Phlebology (PHL)
Physical Medicine & Rehabilitation (PM)
Physical Medicine & Rehabilitation-Spinal Cord Injury (SCI)
Physical Medicine & Rehabilitation-Sports Medicine (PMM)
Plastic Surgery (PS)
Plastic Surgery-Facial Plastic Surgery (FPS)
Plastic Surgery-Head & Neck (PSH)
Preventive Medical Toxicology (PTX)
Proctology (PRO)
Psychiatry (P)
Psychiatry-Addiction (ADP)
Psychiatry-Child Psychiatry (CHP)
Psychiatry-Forensic Psychiatry (PFP)
Psychiatry-Geriatric Psychiatry (PYG)
Psychiatry-Pain Medicine (PPN)
Psychiatry-Psychoanalysis (PYA)
Psychiatry-Psychosomatic Medicine (PYM)
Public Health/General Preventive Medicine (PHP)
Pulmonary Critical Care Medicine (PCC)
Pulmonary Disease (PUD)
Radiation Oncology (RO)

115
Radiology (R)
Radiology-Abdominal Radiology (AR)
Radiology-Cardiothoracic Radiology (CTR)
Radiology-Diagnostic Radiology (DR)
Radiology-Musculoskeletal Radiology(MSR)
Radiology-Neuroradiology (RNR)
Radiology-Neuroradiology-Endovascular Surgical (ESN)
Radiology-Nuclear Radiology (NR)
Radiology-Pediatric Radiology (PDR)
Radiology-Radiological Physics (RP)
Radiology-Vascular & Interventional Radiology (VIR)
Reproductive Endocrinology (REN)
Rheumatology (RHU)
Sclerotherapeutic Pain Management (SPMO)
Sleep Medicine (SME)
Spinal Cord Injury Medicine (SCI)
Surgery-Abdominal (AS)
Surgery-Cardiothoracic
Surgery-Cardiovascular
Surgery-Colon & Rectal (CRS)
Surgery-Cosmetic (CS)
Surgery-Craniofacial Surgery (CFS)
Surgery-Critical Care (CCS)
Surgery-Dermatologic Surgery (DS)
Surgery-General Surgery (GS)
Surgery-Hand Surgery (HS)
Surgery-Head & Neck Surgery (HNS)
116
Surgery-Neurological Surgery (NS)
Surgery-Neuroradiology-Endovascular Surgical (ESN)
Surgery-Oral And Maxillofacial Surgery (OMF)
Surgery-Pediatric Cardiothoracic Surgery (PCS)
Surgery-Pediatric Neurological Surgery (NSP)
Surgery-Pediatric Surgery (PDS)
Surgery-Plastic Surgery (PS)
Surgery-Surgical Oncology (SO)
Surgery-Thoracic Surgery (TS)
Surgery-Transplant Surgery (TTS)
Surgery-Traumatic Surgery (TRS)
Surgery-Urological Surgery (U)
Surgery-Vascular Surgery (VS)
Undersea Medicine and Hyperbaric Medicine (UM)
Undersea and Hyperbaric Medicine-Emergency Medicine (UME)
Urgent Care Medicine (UCM)
Urology (U)
Urology-Pediatric Urology (UP)
Vascular Medicine (VM)
Vascular Neurology (VN)
Other Specialty (OS)
3b. If you hold more than one position as a physician assistant, what is the major specialty of your primary supervising physician at your secondary PA position? Please choose only one.
DROP-DOWN LIST
I do not hold more than one position as a PA
Addiction Medicine (ADM)

117
Adolescent Medicine (AMI)
Aerospace Medicine (AM)
Allergy (A)
Allergy & Immunology (AI)
Allergy & Immunology-Diagnostic Laboratory Immunology (ALI)
Alternative Medicine (ALTM)
Anesthesiology (AN)
Anesthesiology-Critical Care (CCA)
Anesthesiology-Pain Management (APM)
Anesthesiology-Pediatric (PAN)
Cardiology-Cardiovascular Disease (CD)
Cardiology-Cardiac Electrophysiology (ICE)
Cardiology-Interventional Cardiology (IC)
Cardiology-Nuclear Cardiology (NC)
Critical Care Medicine (CCM)
Dermatology (D)
Dermatology-Clinical and Laboratory Dermatological Immunology (DDL)
Dermatology-Dermatological Immunology/Diagnostic and Laboratory Immunology (DLAB)
Dermatology-Dermatopathology (DMP)
Dermatology-Pediatric Dermatology (PDD)
Dermatology-Procedural Dermatology (PRD)
Diabetes (DIA)
Emergency Medicine (EM)
Emergency Medicine-Medical Toxicology (ETX)
Emergency Medicine-Pediatric Emergency Medicine (PE)
Emergency Medicine-Sports Medicine (ESM)
118
Endocrinology, Diabetes and Metabolism (END)
Epidemiology (EP)
Family Practice/Family Medicine (FM)
Family Practice-Adolescent Medicine (AMF)
Family Practice-Geriatric Medicine (FPG)
Family Practice-Sports Medicine (FSM)
Gastroenterology (GE)
General Internal Medicine (IM)
General Practice (GP)
General Preventive Medicine (GPM)
Genetics-Clinical Biochemical Genetics (CBG)
Genetics-Clinical Cytogenetics (CCG)
Genetics-Clinical Genetics (CG)
Genetics-Clinical Molecular Genetics (CMG)
Genetics-Medical Genetics (MG)
Genetics-Molecular Genetic Pathology (MGG)
Geriatrics (GERI)
Gynecological Oncology (GO)
Gynecology (GYN)
Hematology (HEM)
Hematology/Oncology (HO)
Hepatology (HEP)
Hospitalist (HOS)
Immunology (IG)
Infectious Diseases (ID)
Internal Medicine-General Internal Medicine (IM)
Internal Medicine-Cardiac Electrophysiology (ICE)

119
Internal Medicine-Diagnostic Laboratory Immunology (ILI)
Internal Medicine-Geriatrics (IMG)
Internal Medicine-Pediatrics (MPD)
Internal Medicine-Sports Medicine (ISM)
Legal Medicine (LM)
Maternal & Fetal Medicine (MFM)
Medical Informatics
Medical Management (MDM)
Medical Microbiology (MM)
Neonatal-Perinatal Medicine (NPM)
Nephrology (NEP)
Nephrology-Pediatric Nephrology (PN)
Neurology (N)
Neurology-Child Neurology (CHN)
Neurology-Clinical Neurophysiology (CN)
Neurology-Neurodevelopmental Disabilities (NDN)
Neurology-Neurology/Diagnostic Radiology/Neuroradiology (NRN)
Neurology-Neuromuscular Medicine
Neurology-Neuropsychiatry (NUP)
Neurology-Neuroradiology (RNR)
Neurology-Vascular Neurology (VN)
Neuroradiology-Endovascular Surgical (ESN)
Nuclear Medicine (NM)
Nuclear Radiology (NR)
Nutrition (NTR)
Obstetrics & Gynecology (OBG)
Obstetrics & Gynecology-Critical Care (OCC)

120
Obstetrics (OBS)
Occupational Medicine (OM)
Oncology (ON)
Ophthalmology (OPH)
Ophthalmology-Pediatric Ophthalmology (PO)
Orthopedic Surgery (ORS)
Orthopedic Surgery-Foot and Ankle (OFA)
Orthopedic Surgery-Hand Surgery (HSO)
Orthopedic Surgery-Orthopedic Musculoskeletal Oncology (OMO)
Orthopedic Surgery-Orthopedic Adult Reconstructive Surgery (OAR)
Orthopedic Surgery-Pediatric Orthopedic Surgery (OP)
Orthopedic Surgery-Sports Medicine (OSM)
Orthopedic Surgery-Surgery of the Spine (OSS)
Orthopedic Surgery-Trauma (OTR)
Osteopathic Manipulative Medicine (OMM)
Otolaryngology (OTO)
Otolaryngology-Pediatric Otolaryngology (PDO)
Otology-Neurotology (NO)
Pain Medicine (PMD)
Palliative Medicine (PLM)
Pathology-Anatomic Pathology (ATP)
Pathology-Anatomic/Clinical Pathology (PTH)
Pathology-Bloodbanking (BBK)
Pathology-Chemical Pathology (PCH)
Pathology-Clinical Pathology (CLP)
Pathology-Cytopathology (PCP)
Pathology-Forensic Pathology (FOP)

121
Pathology-Hematology (HMP)
Pathology-Medical Microbiology
Pathology-Molecular Genetic Pathology (MGP)
Pathology-Neuropathology (NP)
Pathology-Pediatric Pathology (PP)
Pathology-Selective Pathology (SP)
Pediatrics-General Pediatrics (PD)
Pediatrics-Adolescent Medicine (ADL)
Pediatrics-Critical Care (CCP)
Pediatrics-Developmental Behavioral Pediatrics (DBP)
Pediatrics-Neonatal-Perinatal Medicine (NPM)
Pediatrics-Neurodevelopmental Disabilities (NDP)
Pediatrics-Pediatric Allergy (PDA)
Pediatrics-Pediatric Cardiology (PDC)
Pediatrics-Pediatric Cardiothoracic Surgery (PCS)
Pediatrics-Pediatric Dermatology (PDD)
Pediatrics-Pediatric Diagnostic Laboratory Immunology (PLI)
Pediatrics-Pediatric Emergency Medicine (PEM)
Pediatrics-Pediatric Endocrinology (PDE)
Pediatrics-Pediatric Gastroenterology (PG)
Pediatrics-Pediatric Hematology/Oncology (PHO)
Pediatrics-Pediatric Infectious Diseases (PDI)
Pediatrics-Pediatric Medical Toxicology (PDT)
Pediatrics-Pediatric Otolaryngology (PDO)
Pediatrics-Pediatric Pathology (PP)
Pediatrics-Pediatric Pulmonology (PDP)
Pediatrics-Pediatric Radiology (PDR)

122
Pediatrics-Pediatric Rehabilitation Medicine (RPM)
Pediatrics-Pediatric Rheumatology (PPR)
Pediatrics-Pediatric Sports Medicine (PSM)
Pediatrics-Pediatric Surgery (PDS)
Pharmaceutical Medicine (PHM)
Pharmacology-Clinical Pharmacology (PA)
Phlebology (PHL)
Physical Medicine & Rehabilitation (PM)
Physical Medicine & Rehabilitation-Spinal Cord Injury (SCI)
Physical Medicine & Rehabilitation-Sports Medicine (PMM)
Plastic Surgery (PS)
Plastic Surgery-Facial Plastic Surgery (FPS)
Plastic Surgery-Head & Neck (PSH)
Preventive Medical Toxicology (PTX)
Proctology (PRO)
Psychiatry (P)
Psychiatry-Addiction (ADP)
Psychiatry-Child Psychiatry (CHP)
Psychiatry-Forensic Psychiatry (PFP)
Psychiatry-Geriatric Psychiatry (PYG)
Psychiatry-Pain Medicine (PPN)
Psychiatry-Psychoanalysis (PYA)
Psychiatry-Psychosomatic Medicine (PYM)
Public Health/General Preventive Medicine (PHP)
Pulmonary Critical Care Medicine (PCC)
Pulmonary Disease (PUD)
Radiation Oncology (RO)

123
Radiology (R)
Radiology-Abdominal Radiology (AR)
Radiology-Cardiothoracic Radiology (CTR)
Radiology-Diagnostic Radiology (DR)
Radiology-Musculoskeletal Radiology(MSR)
Radiology-Neuroradiology (RNR)
Radiology-Neuroradiology-Endovascular Surgical (ESN)
Radiology-Nuclear Radiology (NR)
Radiology-Pediatric Radiology (PDR)
Radiology-Radiological Physics (RP)
Radiology-Vascular & Interventional Radiology (VIR)
Reproductive Endocrinology (REN)
Rheumatology (RHU)
Sclerotherapeutic Pain Management (SPMO)
Sleep Medicine (SME)
Spinal Cord Injury Medicine (SCI)
Surgery-Abdominal (AS)
Surgery-Cardiothoracic
Surgery-Cardiovascular
Surgery-Colon & Rectal (CRS)
Surgery-Cosmetic (CS)
Surgery-Craniofacial Surgery (CFS)
Surgery-Critical Care (CCS)
Surgery-Dermatologic Surgery (DS)
Surgery-General Surgery (GS)
Surgery-Hand Surgery (HS)
Surgery-Head & Neck Surgery (HNS)

124
Surgery-Neurological Surgery (NS)
Surgery-Neuroradiology-Endovascular Surgical (ESN)
Surgery-Oral And Maxillofacial Surgery (OMF)
Surgery-Pediatric Cardiothoracic Surgery (PCS)
Surgery-Pediatric Neurological Surgery (NSP)
Surgery-Pediatric Surgery (PDS)
Surgery-Plastic Surgery (PS)
Surgery-Surgical Oncology (SO)
Surgery-Thoracic Surgery (TS)
Surgery-Transplant Surgery (TTS)
Surgery-Traumatic Surgery (TRS)
Surgery-Urological Surgery (U)
Surgery-Vascular Surgery (VS)
Undersea Medicine and Hyperbaric Medicine (UM)
Undersea and Hyperbaric Medicine-Emergency Medicine (UME)
Urgent Care Medicine (UCM)
Urology (U)
Urology-Pediatric Urology (UP)
Vascular Medicine (VM)
Vascular Neurology (VN)
Other Specialty (OS)
3c. If you hold more than two positions as a physician assistant, what is the major specialty of your primary supervising physician at your tertiary PA position? Please choose only one.
DROP-DOWN LIST
I do not hold more than one or two PA positions.
Addiction Medicine (ADM)

125
Adolescent Medicine (AMI)
Aerospace Medicine (AM)
Allergy (A)
Allergy & Immunology (AI)
Allergy & Immunology-Diagnostic Laboratory Immunology (ALI)
Alternative Medicine (ALTM)
Anesthesiology (AN)
Anesthesiology-Critical Care (CCA)
Anesthesiology-Pain Management (APM)
Anesthesiology-Pediatric (PAN)
Cardiology-Cardiovascular Disease (CD)
Cardiology-Cardiac Electrophysiology (ICE)
Cardiology-Interventional Cardiology (IC)
Cardiology-Nuclear Cardiology (NC)
Critical Care Medicine (CCM)
Dermatology (D)
Dermatology-Clinical and Laboratory Dermatological Immunology (DDL)
Dermatology-Dermatological Immunology/Diagnostic and Laboratory Immunology (DLAB)
Dermatology-Dermatopathology (DMP)
Dermatology-Pediatric Dermatology (PDD)
Dermatology-Procedural Dermatology (PRD)
Diabetes (DIA)
Emergency Medicine (EM)
Emergency Medicine-Medical Toxicology (ETX)
Emergency Medicine-Pediatric Emergency Medicine (PE)
Emergency Medicine-Sports Medicine (ESM)

126
Endocrinology, Diabetes and Metabolism (END)
Epidemiology (EP)
Family Practice/Family Medicine (FM)
Family Practice-Adolescent Medicine (AMF)
Family Practice-Geriatric Medicine (FPG)
Family Practice-Sports Medicine (FSM)
Gastroenterology (GE)
General Internal Medicine (IM)
General Practice (GP)
General Preventive Medicine (GPM)
Genetics-Clinical Biochemical Genetics (CBG)
Genetics-Clinical Cytogenetics (CCG)
Genetics-Clinical Genetics (CG)
Genetics-Clinical Molecular Genetics (CMG)
Genetics-Medical Genetics (MG)
Genetics-Molecular Genetic Pathology (MGG)
Geriatrics (GERI)
Gynecological Oncology (GO)
Gynecology (GYN)
Hematology (HEM)
Hematology/Oncology (HO)
Hepatology (HEP)
Hospitalist (HOS)
Immunology (IG)
Infectious Diseases (ID)
Internal Medicine-General Internal Medicine (IM)
Internal Medicine-Cardiac Electrophysiology (ICE)

127
Internal Medicine-Diagnostic Laboratory Immunology (ILI)
Internal Medicine-Geriatrics (IMG)
Internal Medicine-Pediatrics (MPD)
Internal Medicine-Sports Medicine (ISM)
Legal Medicine (LM)
Maternal & Fetal Medicine (MFM)
Medical Informatics
Medical Management (MDM)
Medical Microbiology (MM)
Neonatal-Perinatal Medicine (NPM)
Nephrology (NEP)
Nephrology-Pediatric Nephrology (PN)
Neurology (N)
Neurology-Child Neurology (CHN)
Neurology-Clinical Neurophysiology (CN)
Neurology-Neurodevelopmental Disabilities (NDN)
Neurology-Neurology/Diagnostic Radiology/Neuroradiology (NRN)
Neurology-Neuromuscular Medicine
Neurology-Neuropsychiatry (NUP)
Neurology-Neuroradiology (RNR)
Neurology-Vascular Neurology (VN)
Neuroradiology-Endovascular Surgical (ESN)
Nuclear Medicine (NM)
Nuclear Radiology (NR)
Nutrition (NTR)
Obstetrics & Gynecology (OBG)
Obstetrics & Gynecology-Critical Care (OCC)

128
Obstetrics (OBS)
Occupational Medicine (OM)
Oncology (ON)
Ophthalmology (OPH)
Ophthalmology-Pediatric Ophthalmology (PO)
Orthopedic Surgery (ORS)
Orthopedic Surgery-Foot and Ankle (OFA)
Orthopedic Surgery-Hand Surgery (HSO)
Orthopedic Surgery-Orthopedic Musculoskeletal Oncology (OMO)
Orthopedic Surgery-Orthopedic Adult Reconstructive Surgery (OAR)
Orthopedic Surgery-Pediatric Orthopedic Surgery (OP)
Orthopedic Surgery-Sports Medicine (OSM)
Orthopedic Surgery-Surgery of the Spine (OSS)
Orthopedic Surgery-Trauma (OTR)
Osteopathic Manipulative Medicine (OMM)
Otolaryngology (OTO)
Otolaryngology-Pediatric Otolaryngology (PDO)
Otology-Neurotology (NO)
Pain Medicine (PMD)
Palliative Medicine (PLM)
Pathology-Anatomic Pathology (ATP)
Pathology-Anatomic/Clinical Pathology (PTH)
Pathology-Bloodbanking (BBK)
Pathology-Chemical Pathology (PCH)
Pathology-Clinical Pathology (CLP)
Pathology-Cytopathology (PCP)
Pathology-Forensic Pathology (FOP)

129
Pathology-Hematology (HMP)
Pathology-Medical Microbiology
Pathology-Molecular Genetic Pathology (MGP)
Pathology-Neuropathology (NP)
Pathology-Pediatric Pathology (PP)
Pathology-Selective Pathology (SP)
Pediatrics-General Pediatrics (PD)
Pediatrics-Adolescent Medicine (ADL)
Pediatrics-Critical Care (CCP)
Pediatrics-Developmental Behavioral Pediatrics (DBP)
Pediatrics-Neonatal-Perinatal Medicine (NPM)
Pediatrics-Neurodevelopmental Disabilities (NDP)
Pediatrics-Pediatric Allergy (PDA)
Pediatrics-Pediatric Cardiology (PDC)
Pediatrics-Pediatric Cardiothoracic Surgery (PCS)
Pediatrics-Pediatric Dermatology (PDD)
Pediatrics-Pediatric Diagnostic Laboratory Immunology (PLI)
Pediatrics-Pediatric Emergency Medicine (PEM)
Pediatrics-Pediatric Endocrinology (PDE)
Pediatrics-Pediatric Gastroenterology (PG)
Pediatrics-Pediatric Hematology/Oncology (PHO)
Pediatrics-Pediatric Infectious Diseases (PDI)
Pediatrics-Pediatric Medical Toxicology (PDT)
Pediatrics-Pediatric Otolaryngology (PDO)
Pediatrics-Pediatric Pathology (PP)
Pediatrics-Pediatric Pulmonology (PDP)
Pediatrics-Pediatric Radiology (PDR)
130
Pediatrics-Pediatric Rehabilitation Medicine (RPM)
Pediatrics-Pediatric Rheumatology (PPR)
Pediatrics-Pediatric Sports Medicine (PSM)
Pediatrics-Pediatric Surgery (PDS)
Pharmaceutical Medicine (PHM)
Pharmacology-Clinical Pharmacology (PA)
Phlebology (PHL)
Physical Medicine & Rehabilitation (PM)
Physical Medicine & Rehabilitation-Spinal Cord Injury (SCI)
Physical Medicine & Rehabilitation-Sports Medicine (PMM)
Plastic Surgery (PS)
Plastic Surgery-Facial Plastic Surgery (FPS)
Plastic Surgery-Head & Neck (PSH)
Preventive Medical Toxicology (PTX)
Proctology (PRO)
Psychiatry (P)
Psychiatry-Addiction (ADP)
Psychiatry-Child Psychiatry (CHP)
Psychiatry-Forensic Psychiatry (PFP)
Psychiatry-Geriatric Psychiatry (PYG)
Psychiatry-Pain Medicine (PPN)
Psychiatry-Psychoanalysis (PYA)
Psychiatry-Psychosomatic Medicine (PYM)
Public Health/General Preventive Medicine (PHP)
Pulmonary Critical Care Medicine (PCC)
Pulmonary Disease (PUD)
Radiation Oncology (RO)

131
Radiology (R)
Radiology-Abdominal Radiology (AR)
Radiology-Cardiothoracic Radiology (CTR)
Radiology-Diagnostic Radiology (DR)
Radiology-Musculoskeletal Radiology(MSR)
Radiology-Neuroradiology (RNR)
Radiology-Neuroradiology-Endovascular Surgical (ESN)
Radiology-Nuclear Radiology (NR)
Radiology-Pediatric Radiology (PDR)
Radiology-Radiological Physics (RP)
Radiology-Vascular & Interventional Radiology (VIR)
Reproductive Endocrinology (REN)
Rheumatology (RHU)
Sclerotherapeutic Pain Management (SPMO)
Sleep Medicine (SME)
Spinal Cord Injury Medicine (SCI)
Surgery-Abdominal (AS)
Surgery-Cardiothoracic
Surgery-Cardiovascular
Surgery-Colon & Rectal (CRS)
Surgery-Cosmetic (CS)
Surgery-Craniofacial Surgery (CFS)
Surgery-Critical Care (CCS)
Surgery-Dermatologic Surgery (DS)
Surgery-General Surgery (GS)
Surgery-Hand Surgery (HS)
Surgery-Head & Neck Surgery (HNS)

132
Surgery-Neurological Surgery (NS)
Surgery-Neuroradiology-Endovascular Surgical (ESN)
Surgery-Oral And Maxillofacial Surgery (OMF)
Surgery-Pediatric Cardiothoracic Surgery (PCS)
Surgery-Pediatric Neurological Surgery (NSP)
Surgery-Pediatric Surgery (PDS)
Surgery-Plastic Surgery (PS)
Surgery-Surgical Oncology (SO)
Surgery-Thoracic Surgery (TS)
Surgery-Transplant Surgery (TTS)
Surgery-Traumatic Surgery (TRS)
Surgery-Urological Surgery (U)
Surgery-Vascular Surgery (VS)
Undersea Medicine and Hyperbaric Medicine (UM)
Undersea and Hyperbaric Medicine-Emergency Medicine (UME)
Urgent Care Medicine (UCM)
Urology (U)
Urology-Pediatric Urology (UP)
Vascular Medicine (VM)
Vascular Neurology (VN)
Other Specialty (OS)
4. What type of employer do you work for in your principal PA position? Please choose only one.
DROP-DOWN LIST
Private sector employer
A branch of the military (Army, Navy, etc.)
Federal government

133
State government
Local government
Other type of employer
5. In what type of setting do you spend most of your time at your principal PA position? Please choose only one.
DROP-DOWN LIST
Adult day care
Ambulatory care setting (surg./other)
Assisted living facility/unit
College health facility
Community health center/clinic
Community mental health center
Community substance abuse agency
Continuing education/staff development
Drug company
Home health care agency
Hospice
Hospital (in- & out-patient)
Hospital (in-patient only)
Hospital (out-patient only)
Hospital ER/ED
Hospital intensive care/critical care unit
Hospital operating room
Industrial facility
Insurance company
Law firm
Long term acute care facility/unit

134
Long term/extended care facility/unit
Mental retardation facility/unit
Non-residential care facility/unit (e.g. elder day care)
Occupational health setting
Physician assistant educational program
Physician private practice-solo physician
Physician private practice-single specialty group
Physician private practice-multi-specialty group
Primary care center/clinic
Prison/correctional facility
Psychiatric inpatient facility/unit
Public health department (city, county or state)
Research setting
State agency (other than state public health department)
School-based health facility
Supplemental staffing agency
Surgical center, freestanding
Urgent care center/clinic, free-standing
Other
6. How many hours per week on average do you spend in ALL activities as a physician assistant? Please choose only one.
DROP-DOWN LIST
1-9
10-19
20-29
30-39
40-49

135
50-59
60 or more
7. Would you be willing to provide services in case of a bio-terrorism event or other public health emergency? If you answer “Yes,” we may contact you using your PLA contact information.
DROP-DOWN LIST
Yes
No
8. Are you fluent in any of the following languages? Please select all that apply.
DROP-DOWN LIST
African languages
Arabic
Burmese
Cambodian
Chinese
Filipino
French
German
Greek
Hindi
Italian
Japanese
Korean
Pennsylvania Dutch
Polish
Portuguese

136
Russian
Sign language
Spanish
Tagalog
Thai
Turkish
Vietnamese
9. What is the name of the institution or the state that provided your entry level PA training? Please choose only one.
DROP-DOWN LIST
Butler University
University of Saint Francis
Lutheran College of Health Professions
Indiana University-Fort Wayne
Alabama
Alaska
Arizona
Arkansas
California
Colorado
Connecticut
Delaware
Florida
Georgia
Hawaii
Idaho

137
Illinois
Iowa
Kansas
Kentucky
Louisiana
Maine
Maryland
Massachusetts
Michigan
Minnesota
Mississippi
Missouri
Montana
Nebraska
Nevada
New Hampshire
New Jersey
New Mexico
New York
North Carolina
North Dakota
Ohio
Oklahoma
Oregon
Pennsylvania
Rhode Island
South Carolina

138
South Dakota
Tennessee
Texas
Utah
Vermont
Virginia
Washington
West Virginia
Wisconsin
Wyoming
Non-U.S. PA educational program
10. What is your highest PA credential/degree? Please choose only one.
DROP-DOWN LIST
Certificate of completion
Associate
Bachelors
Masters
Doctorate
11. What is the name of the institution or the state in which you earned your highest PA credential? Please choose only one.
DROP-DOWN LIST
Butler University
University of Saint Francis
Lutheran College of Health Professions
Indiana University-Fort Wayne

139
Alabama
Alaska
Arizona
Arkansas
California
Colorado
Connecticut
Delaware
Florida
Georgia
Hawaii
Idaho
Illinois
Iowa
Kansas
Kentucky
Louisiana
Maine
Maryland
Massachusetts
Michigan
Minnesota
Mississippi
Missouri
Montana
Nebraska
Nevada

140
New Hampshire
New Jersey
New Mexico
New York
North Carolina
North Dakota
Ohio
Oklahoma
Oregon
Pennsylvania
Rhode Island
South Carolina
South Dakota
Tennessee
Texas
Utah
Vermont
Virginia
Washington
West Virginia
Wisconsin
Wyoming
Non-U.S. PA educational program
12. What is your highest degree in any field?
DROP-DOWN LIST
Diploma

141
Associate
Bachelors
Masters
Doctorate
13. Which of the following best describes your race? Please select only one.
DROP-DOWN LIST
American Indian/Native Alaskan
Asian/Pacific Islander
Black/African American
White
Multi-racial
Other
14. Are you of Hispanic origin?
DROP-DOWN LIST
Yes
No
15. What is your gender?
DROP-DOWN LIST
Female
Male

142
16a. Please enter the STREET ADDRESS of your principal practice location (where you work the most hours as a physician assistant). [TEXT BOX]
16b. Please enter the CITY of your principal practice location. [TEXT BOX]
16c. Please enter the 2-character STATE CODE (example: IN) for your principal practice location. [TEXT BOX]
16d. Please enter the 5-character ZIP CODE for your principal practice location.
[TEXT BOX]
17a. Please enter the STREET ADDRESS of a secondary practice location. [TEXT BOX]
17b. Please enter the CITY of the secondary practice location. [TEXT BOX]
17c. Please enter the 2-character STATE CODE (example: IN) for the secondary practice location. [TEXT BOX]
17d. Please enter the 5-character ZIP CODE for the secondary practice location.
[TEXT BOX]
18a. Please enter the STREET ADDRESS of a third practice location. [TEXT BOX]
18b. Please enter the CITY of the third practice location. [TEXT BOX]
18c. Please enter the 2-character STATE CODE (example: IN) for the third practice location.[TEXT BOX]
18d. Please enter the 5-character ZIP CODE for the third practice location.
[TEXT BOX]

143
Appendix 1-C: 2011 Indiana Nurse Re-Licensure Survey Instrument
Your answers to these questions are vital to help the Indiana State Department of Health respond to emergencies and identify health professional shortage areas. The survey is voluntary and will not affect the status of your license. Please complete the survey whether you are currently working as a nurse or not.
Thank you very much for your help.
1. What is your current work status in nursing? Please select only one response.
DROP-DOWN LIST
a. Actively working in a paid position related to nursing (Consider yourself actively working in nursing if you are involved in a position where RN licensure is required)
b. Actively working in a paid position in health care but not in nursing
c. Actively working, but not as a nurse or in health care
d. Working in nursing, but ONLY on a non-paid basis (volunteer or religious order)
e. Unemployed and seeking work as a nurse in Indiana
f. Temporarily inactive as a nurse
g. Retired or permanently inactive as a nurse
If you checked responses b through g in Question 1, please SKIP to Q13.
2. Please type the street address of your principal practice location. “Principal practice location” is the
location in which you work for the most hours as a nurse.
TEXT BOX.
3. What is your gender?

144
Male
Female
4. What is your racial background?
DROP-DOWN LIST
American Indian or Alaska Native
Asian
Black or African American
Native Hawaiian or Other Pacific Islander
White
Multiracial
5. What is your ethnic background?
DROP-DOWN LIST
Hispanic or Latino
Not Hispanic or Latino

145
6. Would you be willing to provide services in case of a bio-terrorism event or other public health emergency? If you answer “Yes,” we may use your PLA contact information to contact you.
DROP-DOWN LIST
Yes
No
7. Do you hold more than one paid position as a nurse (more than one employer)?
DROP-DOWN LIST
Yes, 2 paid positions
Yes, 3 paid positions
Yes, 4 or more paid positions
No
8. Please choose the term that best describes your job title for the principal position as a nurse (the position in which you work the most hours). Please select only one response.
DROP-DOWN LIST
Advice/triage nurse
Certified Nurse-Midwife (CNM)
Certified Registered Nurse Anesthetist (CRNA)
Charge nurse or team leader
Clinical Nurse Specialist (CNS)
Community health nurse
Consultant
Faculty
First-line management (head nurse, floor supervisor)

146
Infection control
Informatics nurse
Instructor/lecturer
Legal nurse
Middle management/administration (assistant director, house supervisor, associate dean, department head)
Nurse Practitioner (NP)
Patient care coordinator, case manager, discharge planner
Patient educator
Public health nurse
Quality improvement nurse, utilization review nurse
Researcher
School nurse
Senior management/administration (CEO, vice president, nursing executive, dean)
Staff development director
Staff educator or instructor in clinical setting
Staff nurse or direct care nurse
Surveyor/ auditor/regulator
No position title
Other
9. In your principal position, in what type of clinical specialty did you spend most of your time in? Please select only one response.
DROP-DOWN LIST
No patient care
Ambulatory care (including primary care, outpatient settings, except surgical)
Cardiac or cardiovascular care

147
Chronic care
Community health
Critical care
Dermatology
Education
Emergency or trauma care
Gastrointestinal
General medical surgical
Gynecology (women's health)
Home health
Hospice
Infectious/ communicable disease
Labor and delivery
Long-term care/ nursing home
Neurological
Obstetrics
Occupational health
Oncology
Pediatrics/ neonatal
Primary care
Psychiatric or mental health (substance abuse and counseling)
Public health
Pulmonary/ respiratory
Radiology (diagnostic or therapeutic)
Renal/ dialysis

148
Surgery (including ambulatory, pre-operative, post-operative, post-anesthesia)
No specific area
Other specialty for a majority of my time
10. Which of the following best describes the setting where you work at your principal position? Please select only one response.
DROP-DOWN LIST
Hospital (Exclude nursing home units and all off-site units of hospitals, but include all on-site clinics and other services of the hospitals.)
Non- Federal, short-term hospital, except psychiatric (for example, acute care hospital)
Non-Federal long-term hospital, except psychiatric
Non-Federal psychiatric hospital
Federal Government hospital
Other type of hospital
Nursing Home/Extended Care Facility
Nursing home unit in hospital
Free standing nursing home/extended care facility
Facility for mentally challenged
Other types of extended care facility
Nursing Education Program
LPN/LVN program
Diploma program (RN)
Associate degree program
Bachelor’s degree

149
Higher degree nursing program
Other program
Public or Community Health Setting
Official State Health Department
Official State Mental Health Agency
Official City or County Health Department
Combination (official/voluntary) nursing service
Visiting nurse service (VNS/NA)
Home health service unit (hospital-based)
Home health agency (non-hospital based)
Community mental-health organization or facility (including freestanding psychiatric outpatient clinics)
Substance abuse center/clinic
Community/neighborhood health center
Planned Parenthood/family planning center
Day care center
Rural health care center
Retirement community center
Hospice
Other
School Health Service
Public school system
Private or parochial elementary or secondary school

150
College or university
Other
Occupational Health (Employee Health Service)
Private industry
Government
Other
Ambulatory Care Setting
Solo practice (physician)
Solo practice (nurse)
Partnerships (physicians)
Partnerships (nurses)
Group practice (physicians)
Group practice (nurses)
Partnership or group practice (mixed group of professionals)
Freestanding clinic (physicians)
Freestanding clinic (nurses)
Ambulatory surgical center
Dialysis center/clinic
Dental practice
Hospital owned off-site clinics
Health Maintenance Organization (HMO)
Other

151
Other
Correctional facility
Private duty in a home setting
Home-based self-employment
Other
11. What type of work setting best describes where you work for your other nursing position(s)? Please select only one response. (Refer to categories in Question 10 for further clarification.)
DROP-DOWN LIST
Hospital
Nursing Home/Extended Care Facility
Nursing Education Program
Public or Community Health Setting
School Health Service
Occupational Health (Employee Health Service)
Ambulatory Care Setting
Insurance Claims/Benefits
Policy, Planning, Regulatory, or Licensing Agency
Other
12. How many hours per week on average do you spend in ALL related nursing activities? Please select only one response.
DROP-DOWN LIST
1- 19
20-35

152
36-40
41 or more

153
13. Have you ever worked as any of the following? Please select all that apply.
DROP-DOWN LIST
Licensed Practice Nurse (LPN/LVN)
CNA (Certified Nurse Aide)
Nursing assistant
Paramedic
Emergency Medical Technician (EMT)
14. What is your highest degree in nursing? Please select only one response.
DROP-DOWN LIST
Diploma
Associate
Bachelor’s
Master’s
Doctorate
15. Since graduating from your initial nursing program, have you completed one of the following formal education programs preparing you for advanced practice nursing?
Yes
No
If you answered “yes,” please select any one response.
DROP-DOWN LIST
Clinical Nurse Specialist
Nurse Practitioner
Nurse Anesthetist

154
Nurse-midwife
16a. Are you currently certified in any of the following Advanced Practice Nursing roles?
Yes
No
If you answered “yes,” please select all that apply.
DROP-DOWN LIST
Clinical nurse specialist
Nurse anesthetist
Nurse-midwife
Nurse practitioner
16b. Are you currently working in any of the following Advanced Practice Nursing roles? Please select any one response.
DROP-DOWN LIST
Clinical nurse specialist
Nurse anesthetist
Nurse-midwife
Nurse practitioner- Primary care (for e.g., school based clinics, community health clinics)
Nurse practitioner- Other (for e.g., orthopedics, neurology, acute care, ER, cardiology)
17. What other nursing degrees do you plan to pursue in the next 2 years? Please select all that apply.
DROP-DOWN LIST
Bachelor’s
Master’s

155
Doctor of Nursing Practice (DNP)
PhD
I do not intend to pursue further nursing education in the next 2 years
18. Would you be interested in teaching in a nursing program? If you answer “Yes,” we may share your name with Indiana Nursing Workforce Development Coalition?
DROP-DOWN LIST
Yes
No
19. How soon do you anticipate retirement?
DROP-DOWN LIST
Less than 1 year
2-3 years
4-9 years
10 or more years
20. If you are currently not working for pay in nursing, HOW LONG has it been since you stopped working in a paid position as a registered nurse? Please select only one response.
DROP-DOWN LIST
Never worked in a paid RN position
Less than 1 year
2-3 years
4-9 years
10 or more years

156
21. If you are currently not working for pay in nursing, what is the PRIMARY REASON(s) you do not actively working as a nurse? Please select all that apply.
DROP-DOWN LIST
I have never worked in a paid position as a registered nurse.
Burnout/stressful environment
Career advancement/promotion to a non-nursing position
Disability/illness
Family obligations
Pursuing a career in a different field
Laid off/downsizing of staff
Inadequate pay/benefits
Relocated
Retired
Other