2012 FBR Fall Investor Conference
22
2012 FBR Fall Investor Conference November 27 2012 November 27, 2012
-
Upload
cnoservices -
Category
Documents
-
view
394 -
download
1
description
2012 FBR Fall Investor Conference
Transcript of 2012 FBR Fall Investor Conference
2012 FBR Fall Investor ConferenceNovember 27 2012November 27, 2012

CNO Financial Group 2

Forward-Looking StatementsCertain statements made in this presentation should be considered forward-looking statements as defined in the Private Securities Litigation Reform Act of 1995. These include statements about future results of operations and capital plans. We caution investors that these forward-looking statements are not guarantees of future performance, and actual results may differ materially. Investors should consider the important risks and uncertainties that may cause actual results to differ, including those included in our Quarterly Reports on Form 10-Q, our 2011 Annual Report on Form 10-K and other filings we make with the Securities and E h C i i W bli ti t d t thiExchange Commission. We assume no obligation to update this presentation, which speaks as of today’s date.
CNO Financial Group 3
Non-GAAP Measures
This presentation contains financial measures that differ from the comparable measures under Generally Accepted Accounting Principles (GAAP). Reconciliations between those
GAAP d th bl GAAP i l d d i th A dinon-GAAP measures and the comparable GAAP measures are included in the Appendix.
While management believes these measures are useful to enhance understanding and comparability of our financial results, these non-GAAP measures should not be
id d b tit t f th t di tl bl GAAPconsidered substitutes for the most directly comparable GAAP measures.
Additional information concerning non-GAAP measures is included in our periodic filings with the Securities and Exchange Commission that are available in the “Investors – SEC Fili ” ti f CNO’ b it CNOiFilings” section of CNO’s website, www.CNOinc.com.
CNO Financial Group 4

CNO Fundamentals
Well positioned in the growing and underserved senior and iddl i k tmiddle income market
Strong risk management
Track record of strong execution
Building core value drivers
Well capitalized and generating significant excess capitalWell capitalized and generating significant excess capital
CNO Financial Group 5
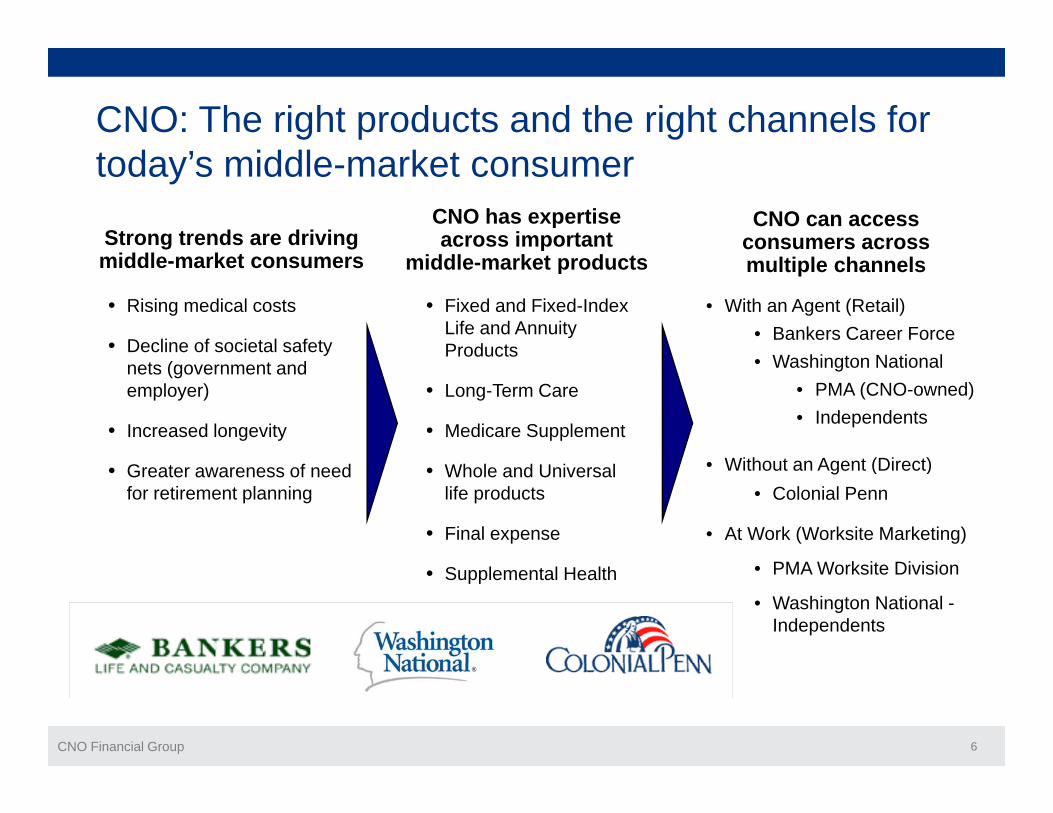
CNO: The right products and the right channels for d ’ iddl k
CNO can access consumers across
CNO has expertise across important Strong trends are driving
iddl k
today’s middle-market consumer
• Fixed and Fixed-Index Life and Annuity Products
multiple channels
• With an Agent (Retail)• Bankers Career Force
W hi t N ti l
• Rising medical costs
• Decline of societal safety
middle-market productsmiddle-market consumers
Products
• Long-Term Care
• Medicare Supplement
• Washington National• PMA (CNO-owned)• Independents
With t A t (Di t)
ynets (government and employer)
• Increased longevity
• Whole and Universal life products
• Final expense
• Without an Agent (Direct)• Colonial Penn
• At Work (Worksite Marketing)
• Greater awareness of need for retirement planning
• Supplemental Health • PMA Worksite Division
• Washington National -Independents
CNO Financial Group 6

Relative company size based on total admitted assets as of 12/31/11We have few competitors and a defensible position
LNCMass Mutual
NMPNX
SFG
More Affluent
Relative company size based on total admitted assets as of 12/31/11
AIGGAFRI
HIGManuLife
KCLI
MET
NYL
S G
AEL Aviva USA
DFG
GNW
Guardian
Mut. Of Omaha
NYL
PFGPL
PLFE
PRU
UNM SYA
Cus
tom
ers
AEL
AFL
Aviva USA
Gerber Life
WNIC BLC
CNO
C
TMK
CPL
PRI
Less Affluent
CNO Financial Group 7
ProductsProtection
ProductAsset
Accumulation
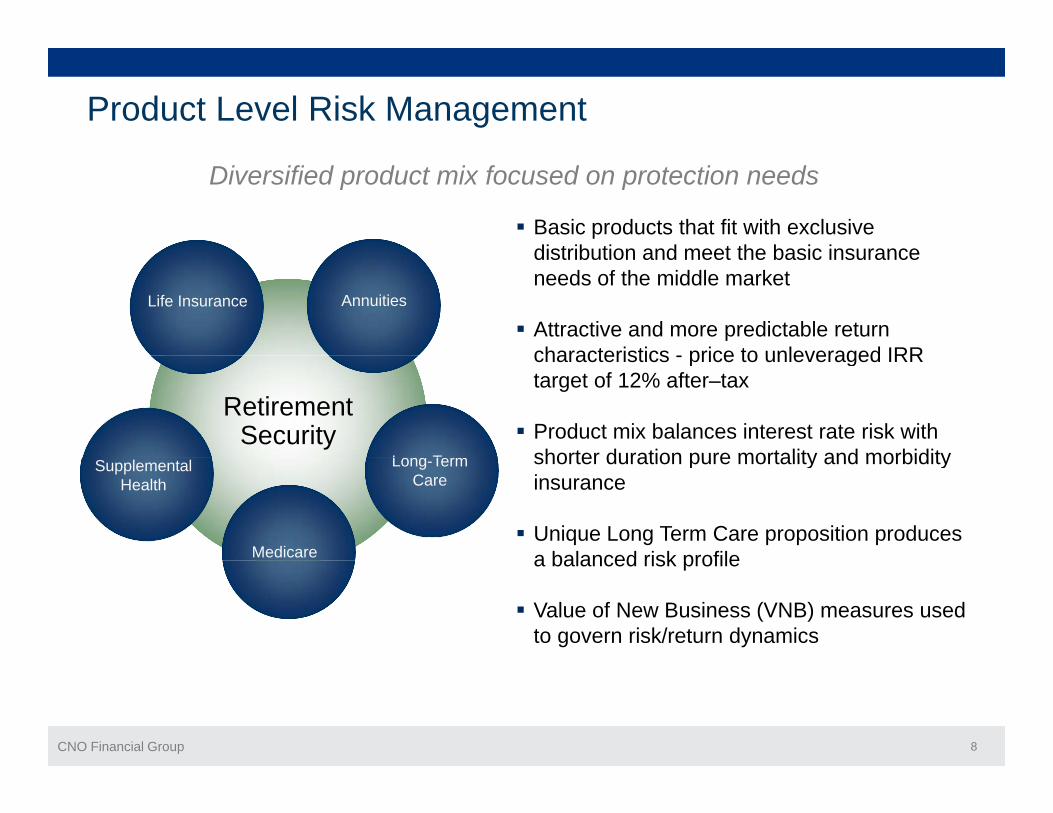
Product Level Risk Management
Basic products that fit with exclusive distribution and meet the basic insurance
Diversified product mix focused on protection needs
AnnuitiesLife Insurance
distribution and meet the basic insurance needs of the middle market
Attractive and more predictable return characteristics price to unleveraged IRR
RetirementSecurity
RetirementSecurity
Long Term
characteristics - price to unleveraged IRR target of 12% after–tax
Product mix balances interest rate risk with shorter duration pure mortality and morbidity
Medicare
Supplemental Health
Long-Term Care
shorter duration pure mortality and morbidity insurance
Unique Long Term Care proposition produces a balanced risk profilea balanced risk profile
Value of New Business (VNB) measures used to govern risk/return dynamics
CNO Financial Group 8
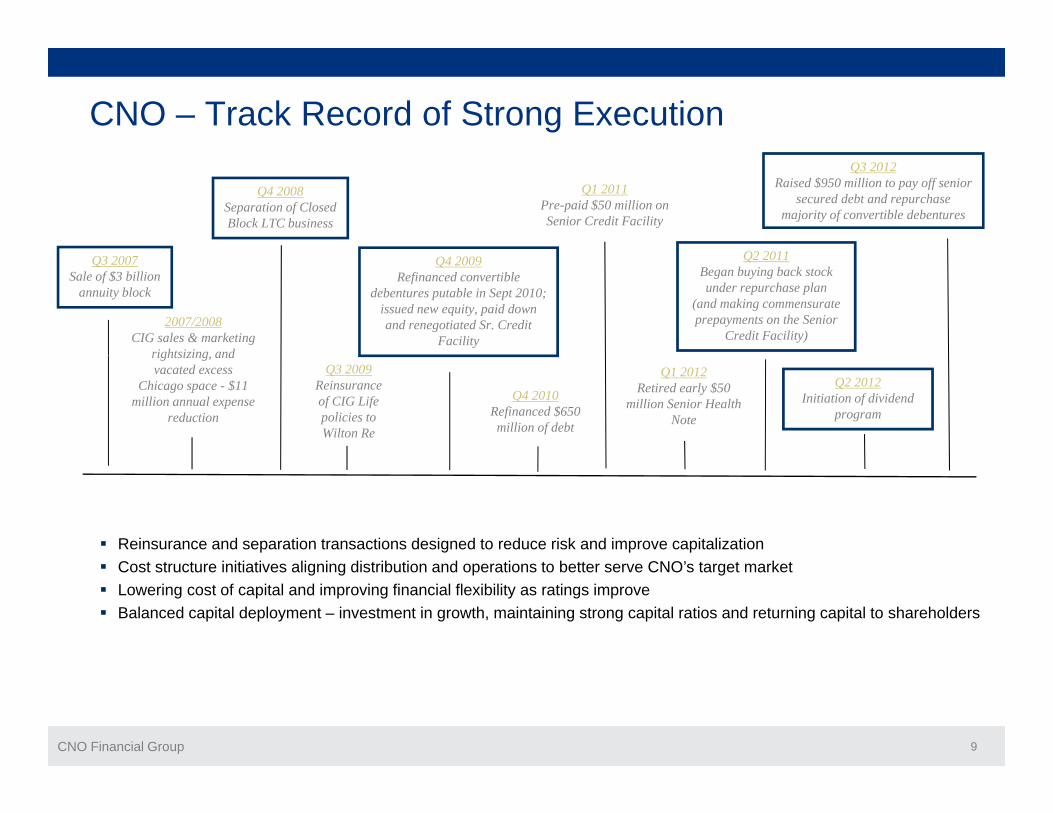
CNO – Track Record of Strong Execution
Q4 2008Separation of Closed Block LTC business
Q1 2011Pre-paid $50 million on Senior Credit Facility
Q2 2011
Q3 2012Raised $950 million to pay off senior
secured debt and repurchase majority of convertible debentures
2007/2008CIG sales & marketing
rightsizing and
Q3 2007Sale of $3 billion
annuity block
Q4 2009Refinanced convertible
debentures putable in Sept 2010; issued new equity, paid down and renegotiated Sr. Credit
Facility
Q2 2011Began buying back stock under repurchase plan
(and making commensurate prepayments on the Senior
Credit Facility)
Q2 2012Initiation of dividend
program
rightsizing, and vacated excess
Chicago space - $11 million annual expense
reduction
Q3 2009Reinsurance of CIG Life policies to Wilton Re
Q4 2010Refinanced $650 million of debt
Q1 2012Retired early $50
million Senior Health Note
Reinsurance and separation transactions designed to reduce risk and improve capitalization Cost structure initiatives aligning distribution and operations to better serve CNO’s target market Lowering cost of capital and improving financial flexibility as ratings improve Balanced capital deployment – investment in growth, maintaining strong capital ratios and returning capital to shareholders
CNO Financial Group 9

Growth in the CNO Franchise($ millions)
$16,556.3
Average liabilities on core business segments are increasing, while Other CNO Business (“OCB”) is shrinking
$16,106.8
$2,676.8$2,637.6
$2,620.9
$704.0$712.9
$698.0
$15,481.7
$12,106.9 $12,765.2 $13,222.5
$5,511.5 $5,286.1 $5,030.3
CNO Financial Group 10
2010 2011 3Q12

($ millions)Segment EBIT - Excluding Significant Items*
$10.4$3.3
$125.6
$88 6 42%
CNO’s Earnings Engine
$27.2
$33.9$15.8
$88.6 42% Bankers premium growth, favorable
Medicare supplement benefit ratios and annuity persistency
$80 6
$ Washington National favorable
supplemental health benefit ratios
Colonial Penn new business investment; $65.4
$80.6
$(2.6)$(1.3)
;anticipate modest profits in 4Q
Corporate results reflect favorable investment results
$(18.5)
( )
3Q11 3Q12
Headwind – low interest rates
CNO Financial Group 11
CP BLC WN OCB Corporate
* A non-GAAP measure. See the Appendix for a reconciliation to the corresponding GAAP measure.

Recent RecapitalizationRaised $950 million to pay off senior secured debt and
repurchase majority of the convertible debentures
Recapitalization Summary New debt structure reflects strong
performance and improved credit ratings
Impact on Credit Profile Maintained strong capital position Uninterrupted free cash flow
ratings Lower weighted average cost of
capital Improved financial flexibility and
generation Capital deployment strategy and
guidance remain intactImproved financial flexibility and debt maturity profile Significantly reduced convertible
overhang
3Q12 capital ratios remain strong after deploying $455mm, reducing
the diluted share count by 15% YTD
Meaningful stair step in go forward EPS and ROE
y
RBC Liquidity Debt to Capital
361% >$300mm 21.3%*
CNO Financial Group 12
$
* Debt to capital ratio, excluding accumulated other comprehensive income, a non-GAAP measure. See appendix for a reconciliation to the corresponding GAAP measure.

Free Cash Flow Sources Building While Recurring Uses ModeratingSources Building While Recurring Uses Moderating($ in millions)
$358
9 - Month 2012: Capital Generation & Free Cash Flow$358
($52)
$45$313
Observations RBC $50mm above 350% RBC target Deployable holdco capital of $150mm Modest capital required to support business
($15)
$198
p q ppgrowth
Anticipate statutory dividends to the holding company of $250mm - $275mm in 2012
Recapitalization
$246
Recapitalization Modest reduction in interest expense Scheduled debt amortization of $55mm Greater sweep flexibility
Fees and Interest to Holdco
Net statutory dividends to Holdco
Retained capital for growth and C
Capital Upstreamed Interest Holdco Free Generated to Holdco Paid Expenses Cash Flow (1)
$115
CNO Financial Group 13
RBC build(net)
(1) Cash flow available for capital management and scheduled amortization

CNO: Value Proposition
Uniquely Positioned
Reinvesting in Business
Business Model
Business Growth
Opportunities Capital Management Run-Off Engineering Operational Efficiencies
Stabilized Earnings &
Capital
Generating Significant
Excess C it l Operational Efficiencies
Rapidly Growing Target Market
Capital Capital
Management team focused onadvancing returns
CNO Financial Group 14
g
Q&A
CNO Financial Group 15

Appendix
CNO Financial Group 16

Information Related to Certain Non-GAAP Financial Measures
The following provides additional information regarding certain non-GAAP measures used in this presentation. A non-GAAP measure is a numerical measure of a company’s performance, financial position, or cash flows that excludes or includes amounts that are normally excluded or included in the most directly comparable measure calculated and presented in accordance with GAAP Whilemost directly comparable measure calculated and presented in accordance with GAAP. While management believes these measures are useful to enhance understanding and comparability of our financial results, these non-GAAP measures should not be considered as substitutes for the most directly comparable GAAP measures. Additional information concerning non-GAAP measures is included in our periodic filings with the Securities and Exchange Commission that are available in the “Investor – SEC Filings” section of our website, www.CNOinc.com.
CNO Financial Group 17

3Q12 Significant Items CNO($ millions)( )The table below summarizes the financial impact of significant items on our 3Q12 net operating income. Management believes that identifying the impact of these items enhances the understanding of our operating results during 3Q12.
Three months endedSeptember 30, 2012
Excluding
Net Operating Income:
Bankers Life $ 80.6 $ - $ 80.6
Actual resultsSignificant
items
gsignificant
items
Washington National
Colonial Penn
Other CNO Business
EBIT from business segments 58 3 64 0 122 3
(2.6) - (2.6)
(53.6) 64.0 10.4
33.9 - 33.9
EBIT from business segments
Corporate Operations, excluding corporate interest expense
EBIT
Corporate interest expense
51.6 74.0 125.6
(16.3) - (16.3)
58.3 64.0 122.3
(6.7) 10.0 3.3
Operating earnings before tax
Tax expense on operating income
Net operating income * $ 25.6 $ 44.3 $ 69.9
$ $ $
35.3 74.0 109.3
9.7 29.7 39.4
**
CNO Financial Group 18
Net operating income per diluted share * $ 0.11 $ 0.15 $ 0.26
* A non-GAAP measure. See page 21 and 22 for reconciliations to the corresponding GAAP measures.
** Operating earnings per share, excluding significant items is calculated based on the weighted average diluted shares outstanding, including the dilutive effect of all common stock equivalents. Such common stock equivalents are dilutive in this calculation.
**

3Q11 Significant Items CNO($ millions)($ )
The table below summarizes the financial impact of significant items on our 3Q11 net operating income. Management believes that identifying the impact of these items enhances the understanding of our operating results during 3Q11.
Three months endedSeptember 30, 2011
Excluding
Net Operating Income:
Bankers Life $ 79.4 $ (14.0) $ 65.4
Actual resultsSignificant
items
Excluding significant
items
Washington National
Colonial Penn
Other CNO Business
EBIT from business segments 102 1 5 0 107 1
(1.3) - (1.3)
2.8 13.0 15.8
21.2 6.0 27.2
EBIT from business segments
Corporate Operations, excluding corporate interest expense
EBIT
Corporate interest expense
74.6 14.0 88.6
(18.7) - (18.7)
102.1 5.0 107.1
(27.5) 9.0 (18.5)
Operating earnings before tax
Tax expense on operating income
Net operating income * $ 32.8 $ 12.0 $ 44.8
55.9 14.0 69.9
23.1 2.0 25.1
CNO Financial Group 19
Net operating income per diluted share * $ 0.12 $ 0.04 $ 0.16
* A non-GAAP measure. See pages 21 and 22 for reconciliations to the corresponding GAAP measures.

Quarterly Earnings CNOy g3Q11 3Q12
Bankers Life 79.4$ 80.6$ Washington National 21.2 33.9 Colonial Penn (1 3) (2 6)
($ millions)
Colonial Penn (1.3) (2.6) Other CNO Business 2.8 (53.6)
EBIT* from business segments 102.1 58.3 Corporate operations, excluding interest expense (27.5) (6.7) Total EBIT 74.6 51.6 Corporate interest e pense (18 7) (16 3)Corporate interest expense (18.7) (16.3)
55.9 35.3 Tax expense on period income 23.1 9.7 Net operating income 32.8 25.6 N t li d i t t i 17 3 4 8
Income before net realized investment gains, fair value changes in embedded derivative liabilities and taxes
Net realized investment gains 17.3 4.8 Fair value changes in embedded derivative liabilities (12.9) (2.0) Loss on extinguishment of debt, net of income taxes (0.7) (176.4) Net income (loss) before valuation allowance for deferred tax assets 36.5 (148.0) Decrease in valuation allowance for deferred tax assets 143.0 143.0
$ $
*Management believes that an analysis of earnings before net realized investment gains (losses), corporate interest, loss on extinguishment of debt, fair value changes due to fluctuations in the interest rates used to discount embedded derivative liabilities related to our fixed index annuities and taxes (“EBIT,” a non-GAAP financial measure) provides
Net income (loss) 179.5$ (5.0)$
Net income (loss) per diluted share 0.61$ (0.02)$
CNO Financial Group 20
fluctuations in the interest rates used to discount embedded derivative liabilities related to our fixed index annuities and taxes ( EBIT, a non GAAP financial measure) provides a clearer comparison of the operating results of the company quarter-over-quarter because it excludes: (1) corporate interest expense; (2) loss on extinguishment of debt; (3) net realized investment gains (losses); and (4) fair value changes due to fluctuations in the interest rates used to discount embedded derivative liabilities related to our fixed index annuities that are unrelated to the company’s underlying fundamentals. The table above provides a reconciliation of EBIT to net income.

Information Related to Certain Non-GAAP Financial MeasuresA reconciliation of net income (loss) applicable to common stock to net operating income (and related per-share amounts) is as follows (dollars in millions, except per-share amounts):
3Q11 3Q12
Net income (loss) applicable to common stock 179.5$ (5.0)$ Net realized investment (gains) losses, net of related amortization and taxes (17.3) (4.8) Fair value changes in embedded derivative liabilities, net of related amortization and taxes 12.9 2.0 Valuation allowance for deferred tax assets (143.0) (143.0) Loss on extinguishment of debt 0.7 176.4 Net operating income (a non-GAAP financial measure) 32.8$ 25.6$
Per diluted share:Net income (loss) 0.61$ (0.02)$ Net realized investment (gains) losses, net of related amortization and taxes (0.06) (0.02) Fair value changes in embedded derivative liabilities, net of related amortization and taxes 0.04 0.01 Valuation allowance for deferred tax assets (0.47) (0.62) Loss on extinguishment of debt - 0.76 Net operating income (a non-GAAP financial measure) 0.12$ 0.11$
CNO Financial Group 21

Information Related to Certain Non-GAAP Financial MeasuresDebt to capital ratio, excluding accumulated other comprehensive income (loss)The debt to capital ratio excluding accumulated other comprehensive income (loss) differs from the debt to capital ratioThe debt to capital ratio, excluding accumulated other comprehensive income (loss), differs from the debt to capital ratio because accumulated other comprehensive income (loss) has been excluded from the value of capital used to determine this measure. Management believes this non-GAAP financial measure is useful because it removes the volatility that arises from changes in accumulated other comprehensive income (loss). Such volatility is often caused by changes in the estimated fair value of our investment portfolio resulting from changes in general market interest rates rather than the business decisions made by management. A reconciliation of these ratios is as follows ($ in millions):
3Q12
Corporate notes payable 1,035.1$
y g ( )
Total shareholders' equity 5,252.9
Total capital 6,288.0$
Corporate debt to capital 16.5%
Corporate notes payable 1,035.1$
Total shareholders' equity 5,252.9 Less accumulated other comprehensive income (1,421.1)
Total capital 4,866.9$
Debt to total capital ratio, excluding AOCI (anon-GAAP financial measure) 21.3%
CNO Financial Group 22